Article

Mapping Submerged Habitats and Mangroves of Lampi Island Marine National Park (Myanmar) from in Situ and Satellite Observations

1
CNR-IREA, Optical Remote Sensing Group, Via Bassini 15, Milano 20133, Italy
2
Remote Sensing of Environmental Dynamics Lab., University of Milano-Bicocca, DISAT, Pzza Della Scienza 1, Milano 20126, Italy
*
Author to whom correspondence should be addressed.
These authors contributed equally to this work.
Remote Sens. 2016, 8(1), 2; https://doi.org/10.3390/rs8010002
Submission received: 15 September 2015 / Revised: 1 December 2015 / Accepted: 8 December 2015 / Published: 22 December 2015
(This article belongs to the Special Issue Remote Sensing for Coral Reef Monitoring)

Abstract

:
In this study we produced the first thematic maps of submerged and coastal habitats of Lampi Island (Myanmar) from in situ and satellite data. To focus on key elements of bio-diversity typically existing in tropical islands the detection of corals, seagrass, and mangrove forests was addressed. Satellite data were acquired from Landsat-8; for the purpose of validation Rapid-Eye data were also used. In situ data supporting image processing were collected in a field campaign performed from 28 February to 4 March 2015 at the time of sensors overpasses. A hybrid approach based on bio-optical modeling and supervised classification techniques was applied to atmospherically-corrected Landsat-8 data. Bottom depth estimations, to be used in the classification process of shallow waters, were in good agreement with depth soundings (R2 = 0.87). Corals were classified with producer and user accuracies of 58% and 77%, while a lower accuracy (producer and user accuracies of 50%) was found for the seagrass due to the patchy distribution of meadows; accuracies more than 88% were obtained for mangrove forests. The classification indicated the presence of 18 mangroves sites with extension larger than 5 km2; for 15 of those the coexistence of corals and seagrass were also found in the fronting bays, suggesting a significant rate of biodiversity for the study area.

Graphical Abstract

1. Introduction

In tropical marine systems, corals, seagrass, and mangrove forest habitats provide important ecosystem services, both individually and through their functional linkages; e.g., coral reefs protect the coastline from erosion and prevent damage to and/or loss of seagrass beds and mangrove forests [1,2].
Coral reefs play a significant role in the supply of sediments or sands to beaches. They also support subsistence and commercial fisheries and are provider of local medicines; e.g., Moberg et al. [3]. Moreover, corals represent a relevant source of recreation and tourism. Mangrove forests are extremely productive ecosystems that are home to a large variety of fish, crab, shrimp, and mollusk species. The dense root systems of mangrove forests trap sediments flowing down rivers and off the land. By filtering out sediments, the forests also protect coral reefs and seagrass meadows from being smothered in sediment; e.g., Field et al. [4]. Finally, seagrass fulfil numerous functions which stabilize the sea bottom, providing food and habitat for other marine organisms, maintaining water quality, and supporting local economies [5] and may form a continuous ecosystem with mangroves and corals.
A large amount of fish species uses multiple habitats highlighting the importance of including different habitat types within marine protected areas to achieve efficient and effective resource management [6]. Wide ranges of anthropogenic factors are threatening the ecological and economic importance of coral reef, seagrass, and mangrove habitats [7], and these habitats should be preserved to maintain the sustainability of the region. Mangrove deforestation has, in fact, significant deleterious consequences for the functioning, fisheries, biodiversity, and resilience of coral reefs habitats [2]. Traditional fishing has severely undermined major components of the biodegrading group and compromised ecosystem function [8]. Bellwood et al. [9] show that “healthy” resilient coral dominated reefs become progressively more vulnerable owing to fishing pressure, pollution, disease, and coral bleaching. The spatial and temporal dynamics of these processes may be different from site to site, as different threatening occurs, and marine protected areas (MPAs) have been highlighted as a means toward effective conservation of coral reefs, seagrass meadows, and associated biodiversity [1].
In this context, remote sensing is a powerful tool to obtain unique spatial and temporal information about the components that characterize marine and terrestrial ecosystems. The Landsat program has been providing images for investigating coastal and terrestrial ecosystems for over 40 years. Landsat imagery supported a shallow-tropical benthic habitat mapping both at the local scale of Marsa Shagra in the central Egyptian Red Sea [10] and at the wider Caribbean region scale [11]. The effectiveness of classification techniques to discriminate mangroves from other vegetation types using Landsat, as well as other medium spatial resolution satellite imagery was assessed by Kuenzer et al. [12].
Lampi Island Marine National Park (LIMNP) is one of more than 800 islands sited in the Mergui Archipelago off the coast of Southern Myanmar and constitutes the only marine national park of the country [13]. LIMNP was designed in 1996 and it has been selected because of its vulnerability to the loss of biodiversity due to the human pressure. Lampi Island forested areas are only marginally affected by development pressure, while overexploitation of marine resources is rather diffuse in the coastal zones [14]. Currently, efforts in defining ecosystem management strategies at LIMNP are pursued by the Ministry of Environmental Conservation and Forestry in combination with non-profit organisations.
In this study, we generate a first habitat map of Lampi Island to provide essential information of natural resources for management purposes. By using in situ and Landsat-8 data, we exploited a hybrid approach combining classification techniques and bio-optical modelling for mapping corals, seagrass and mangrove forests in the entire LIMNP. This allowed identifying bays where these ecosystems are interconnected and hence to select priority areas to be preserved in future management strategies. Field data are used to validate the thematic and the bathymetric maps. In few bays, higher spatial resolution RapidEye data provides a further validation for the substrates classification in shallow waters.

2. Materials and Methods
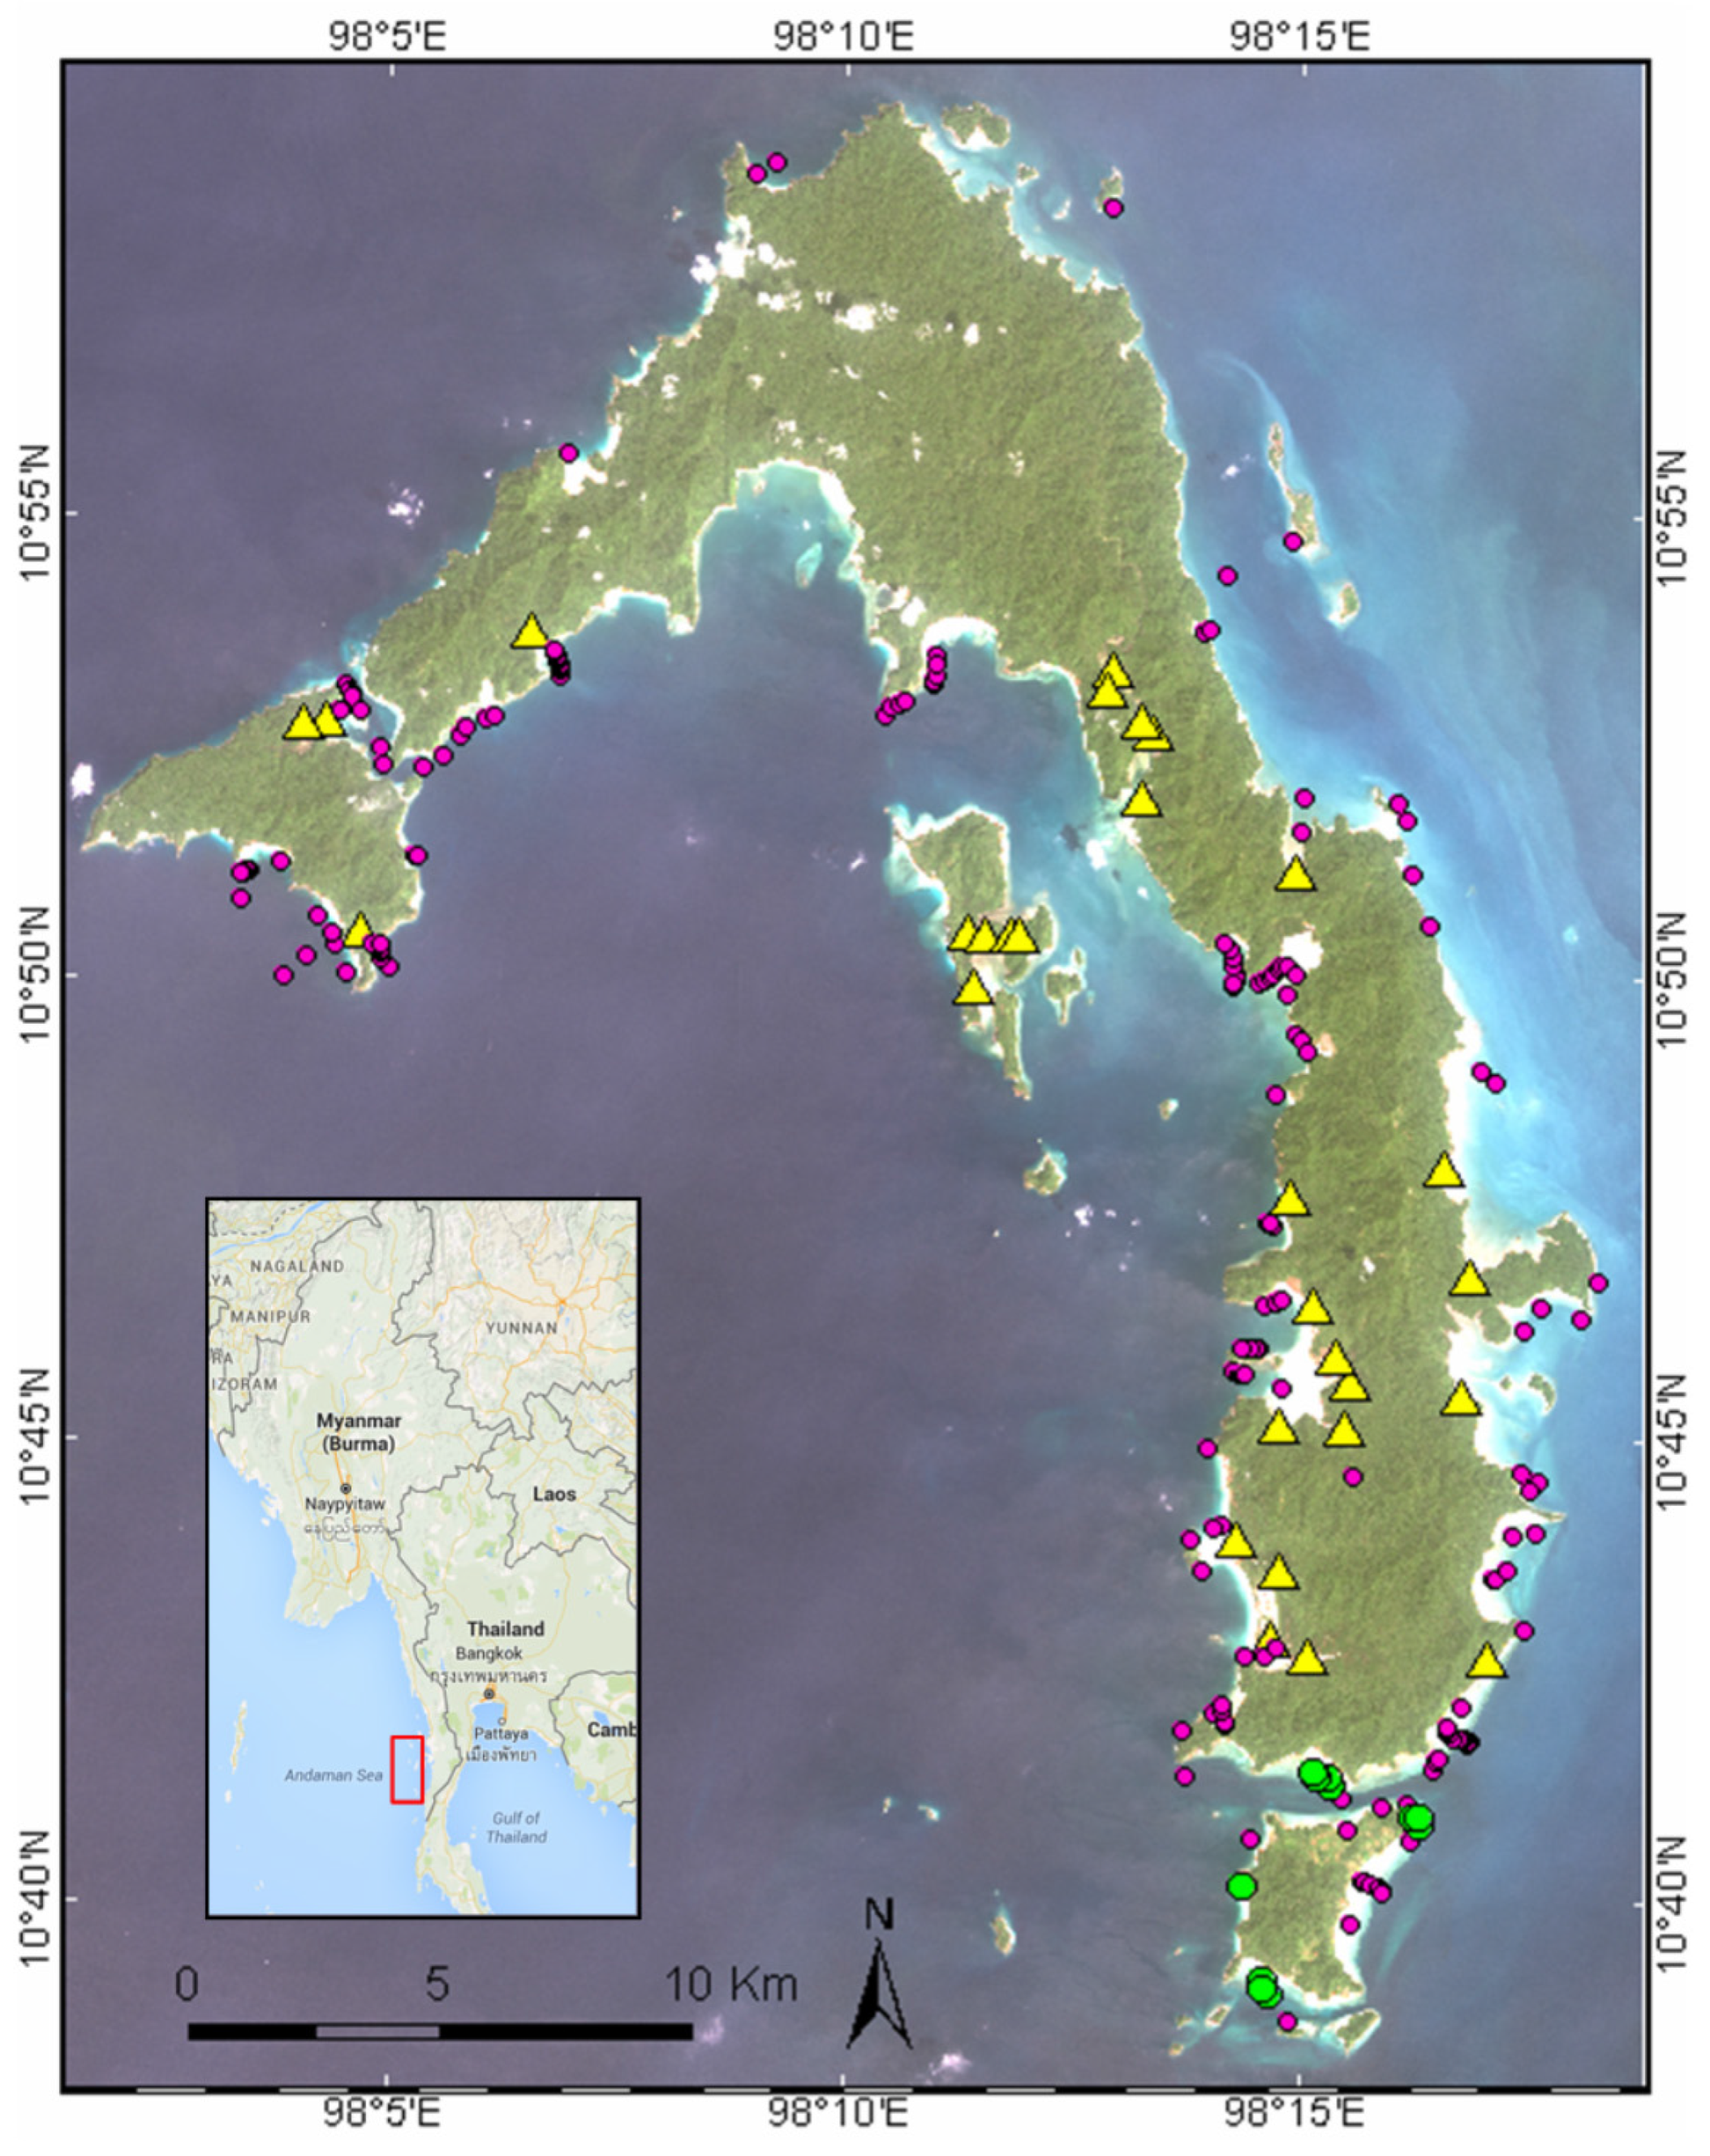
2.1. Field Campaign

A field survey was conducted in Lampi Island (Myanmar) from 28 February to 4 March 2015 to gather reference data supporting the satellite image processing (Figure 1). The fieldwork was aimed at collecting radiometry data to validate the atmospheric correction, as well as to characterize coral, seagrass, and mangrove forests to assess the accuracy of habitat classification.
On 28 February, during the Landsat-8 overpass, fieldwork activities in the southern part of Lampi Island (Figure 1, green dots) were dedicated to the acquisition of surface reflectance data for evaluating the atmospheric correction to be applied to satellite data. To this aim Spectral Evolution SM 3500 (SE) and WISP-3 spectroradiometers were used over land and water targets, respectively. SE reflectance values (dimensionless units) from 350 nm to 2500 nm were obtained from the ratio of radiances from a stony beach and Spectralon panel. Within 20 minutes of the image acquisition the downwelling irradiance with a remote cosine receptor mounted on SE was also measured to capture the solar light field at the time of image acquisition. Remote sensing reflectances (Rrs in sr-1) from 400 nm to 800 nm were collected with WISP-3 based on simultaneous above-water measurements of downwelling irradiance, water radiance, and sky radiance [15] in stations located in the southern part of the island.
Figure 1. Study area with location of fieldwork activities performed from 28 February to 4 March 2015. Pink dots show the 152 stations investigated in the marine survey. Yellow triangles show positions where mangroves forests have been identified. Green dots indicate the sites sampled on 28 February in the southern part of the island at the time of Landsat-8 data acquisition (used as background).
Remotesensing 08 00002 g001
In the remaining four days GPS positioning, field notes and photographs, spectroradiometric measurements, and bathymetric data were collected for almost the entire Lampi Island perimeter. In particular, for the terrestrial survey, land cover types with a description of main forest typologies observed from the boat were annotated and field transects in accessible locations were performed. Dune forest, grasslands, mangroves, evergreen forests, semi-evergreen forests, and plantations were the main cover/forest types observed in the study area. Given their key relevance for the conservation of coastal wetlands [16], this research focused on mangroves. In particular, a total of 30 mangrove forests sites were recorded (Figure 1, yellow triangles). These forests are dominated by Rhizophora apiculata/Rhizophora mucronata and Bruguiera cylindrical communities and they are mostly located in the western part of the island, in swamp areas of river estuaries.
In the marine survey a total of 152 locations were investigated (Figure 1, pink dots). At each station bottom depth was measured with a Scubapro Personal Dive Sonar (PDS-2). Of the 152 stations, 46 were classified as deep waters, with bottom depth ranging from 10 m to 22 m. For the optically-shallow water stations (101 over 152) notes about the type of substrates were taken based on visual inspection of an area of 30–40 m2. In those 101 spot-checks [17], 45 locations characterized by the presence of corals were found. The principal coral community structures present in Lampi Island were knob-like, arborescent-elkhom, columnar, and corymbose. Overall, the observed corals appear patchy, small, and both mixed with other substrate types as occur in other similar coral environments in the coastal region of the Southeast Asia [18,19]. Substrates colonized by seagrass were found in five stations only, with a rather patchy distribution. The bed size occupied by seagrass was generally small as previously observed by Novak et al. [20]. Sandy substrates and/or a mixture of coral rubbles and ephytes were finally observed in the remaining 56 shallow water stations.
In 21 stations, reflectance measurements were also performed with SE and WISP-3 spectroradiometers to collect the reflectance of both deep and shallow waters, the latter characterized by different substrates. To validate the bathymetric retrievals, the PDS-2 depth soundings were corrected for tides (Langkawi site at www.ioc-sealevelmonitoring.org) to the time of the satellite image acquisition.

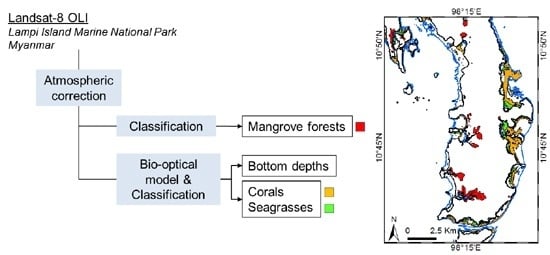
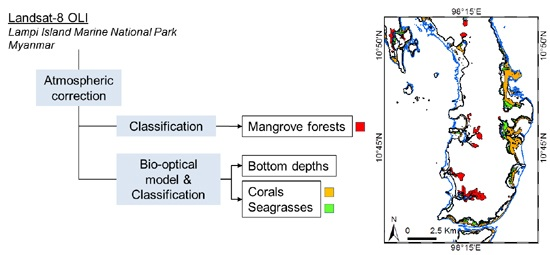
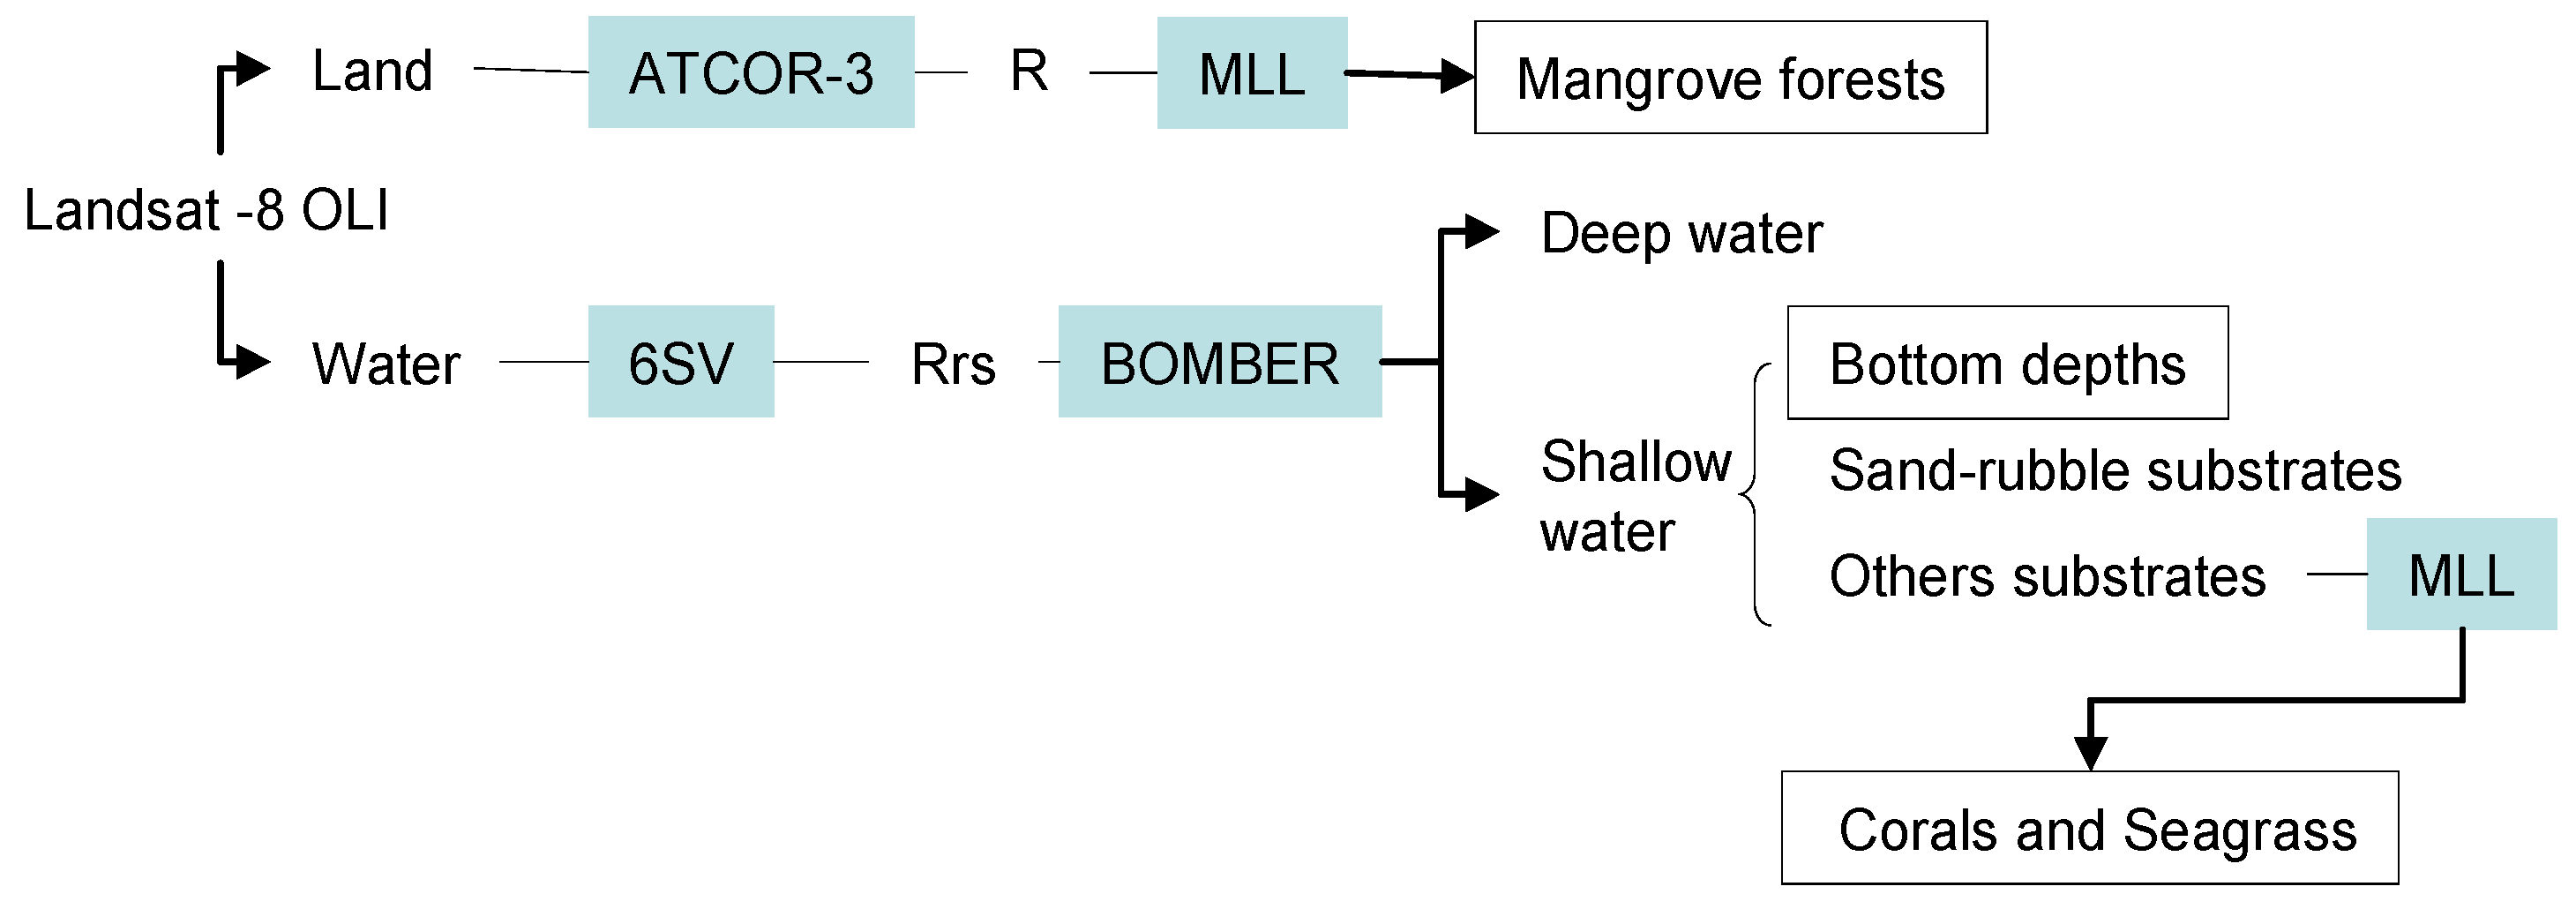
2.2. Image Pre-Processing and Classification Strategy

A Landsat-8 Operational Land Imager (OLI) image of 28 February 2015 matching the first day of the field survey in Lampi Island was used in this study. To map mangroves, corals, and seagrass habitats in the imagery a hierarchical processing scheme based on different image processing pathways for terrestrial and aquatic habitats was devized (Figure 2). For this aim, a mask delimiting land from water was firstly built using the short-wave infrared OLI band 6 (1.57 μm–1.65 μm) due to different image processing schemes adopted.
Figure 2. Satellite image processing scheme adopted in this study for mapping mangroves, corals, and seagrass habitats.
Remotesensing 08 00002 g002
Over land, OLI data were corrected for atmospheric and topographic effects with the ATCOR-3 code (Atmospheric/Topographic Correction for Mountainous Terrain) [21], which have been used successfully in rugged terrains; e.g., Di Mauro et al. [22]. In this study, ATCOR-3 was run with a tropical-maritime atmospheric profile and an image-based estimation of visibility based on the dark dense vegetation approach [23]. The Advanced Spaceborne Thermal Emission and Reflection (ASTER) global digital elevation model (GDEM) at 30 m spatial resolution was used for removing topographic effects. These corrections allowed removal of the atmospheric contribution by retrieving surface reflectance (R) and avoidance of the effect of shadow, which is substantial in rugged areas such as the Lampi. These data were compared to in situ spectra. The supervised classification approach based on the Maximum likelihood (MLL) classifier was then used to generate the mangrove forest map of Lampi Island from OLI reflectances. The MLL training set was generated by on-screen digitalization of land cover class polygons in different locations of the study area, based on field notes, as well as Landsat and RapidEye image interpretation. GPS ground truths were then used as a MLL testing set for accuracy assessment.
The atmospheric effect over water was corrected with the vector version of Second Simulation of the Satellite Signal in the Solar Spectrum (6SV, [24]), a radiative transfer code successfully used in both optically-deep and shallow waters images [25,26]. Before applying 6SV, the at-the-sensor OLI radiances were adjusted using spectral gains for aquatic applications [27]. Then, 6SV was run with tropical climate conditions, a maritime aerosol model and the horizontal visibility provided by ATCOR-3. The 6SV-derived atmospherically-corrected reflectances were converted into Rrs (in sr−1 units) above water dividing by π and then compared to WISP-3 spectra.
Substrate types and depth in shallow water tropical habitats have been estimated with a variety of techniques, which includes classification techniques [28], spectral inversion of bio-optical modelling [29], and an assemblage of those methods [10]. Theoretically, spectral inversion techniques allow water constituents, bottom depth and fractional cover of up to three substrates types to be simultaneously retrieved. Practically, a combination of sensor characteristics (e.g., multi-spectral or hyper-spectral resolutions), water column properties (e.g., turbid or clear waters) and substrate types (e.g., clear sand or brown macroalgae) reduce the possibilities to obtain accurate estimates [30,31]. In particular, Dekker et al. [29] showed that inversion methods applied to airborne hyperspectral data provided moderately accurate retrievals of bathymetry, water column inherent optical properties and benthic reflectance in waters less than 13 m deep with homogeneous to heterogeneous benthic/substrate covers. Phinn et al. [32] and reference herein suggested that multi-spectral image bands only provided discrimination between seagrass species and broad cover classes to a depth of 3 m. Kutser et al. [33] also noted a limitation mapping coral reef benthos and substrates in water depths greater than 8 m.
According to these studies, we assumed that spectral inversion techniques applied to OLI images was only reliable for estimating bottom depths and two classes of substrates. One characterized by moderate to high reflectances monotonically increasing with wavelengths; i.e., a spectral reflectance curve that in the study area was common to sandy substrates and rubble. The other substrate was depicted by reflectances with lower values in the visible and higher in the near-infrared, with peaks and shoulders due to pigments typically found in living organisms, such as the corals and sea grasses observed in the study area. The spectral inversion techniques applied in this study was accomplished with BOMBER (Bio-Optical Model Based tool for Estimating water quality and bottom properties from Remote sensing images) [34]. BOMBER is a code which implements a spectral inversion procedure of bio-optical models for both optically-deep and optically-shallow waters based on Lee et al. [35,36].
To distinguish between optically-deep and -shallow waters (Figure 2) a threshold of 10% [37] of the optimization error associated to spectral inversion procedure of optically-deep model was used. Then, in shallow waters pixels, BOMBER was run for estimating bottom depth and a linear unmixing of two-benthic classes: one for sand-rubble substrate, the other assembling seagrass and corals, whilst the water optical properties were held constant across the imagery consistently with previous studies [38,39]. The parameterisation of the water column and bottom properties in the bio-optical model implemented in BOMBER was based on literature and validated against in situ data acquired during the survey. In particular, the published data are those from Lee Stocking Island as described in Dekker et al. [29] and reference herein. In their study, tools similar to BOMBER (e.g., SAMBUCA and HOPE) are used for shallow water mapping in the Caribbean Lee Stocking Island. Similar to Lampi, the Lee Stocking Island benthos is also characterized by clean sands, seagrass beds, and patch reefs containing a variety of hard and soft corals [39].
BOMBER provided bottom depth as well fractional cover of the two-benthic classes for all the shallow water pixels in the image. From this output, the sand-rubble substrates (i.e., 100% of fractional cover) were identified and then in the remaining pixels the seagrass meadows and corals were mapped with supervised classification techniques on the above-water Rrs spectra. In particular, or the submersed mapping, a MLL classifier was used since it has been successfully applied to map a shallow-tropical benthic habitat in the Red Sea from Landsat imagery [10]. To train the classifier the same approach used for the mangroves was adopted.
In addition to OLI data, RapidEye imagery were acquired on the 25 and 27 of February 2015. Most of the water surfaces in RapidEye images were strongly affected by sun- and wave-glint effects, which hampered the application of classification techniques for an higher spatial resolution mapping of bottom substrates. Nevertheless, for few bays imagery data was adequate, allowing their use to further validate the OLI-derived classification product in shallow water areas. A visual inspection of RapidEye imagery in these clear shallow waters was performed to increase ground truths information to be compared with classification results achieved with the 30 m resolution OLI data.

3. Results and Discussion

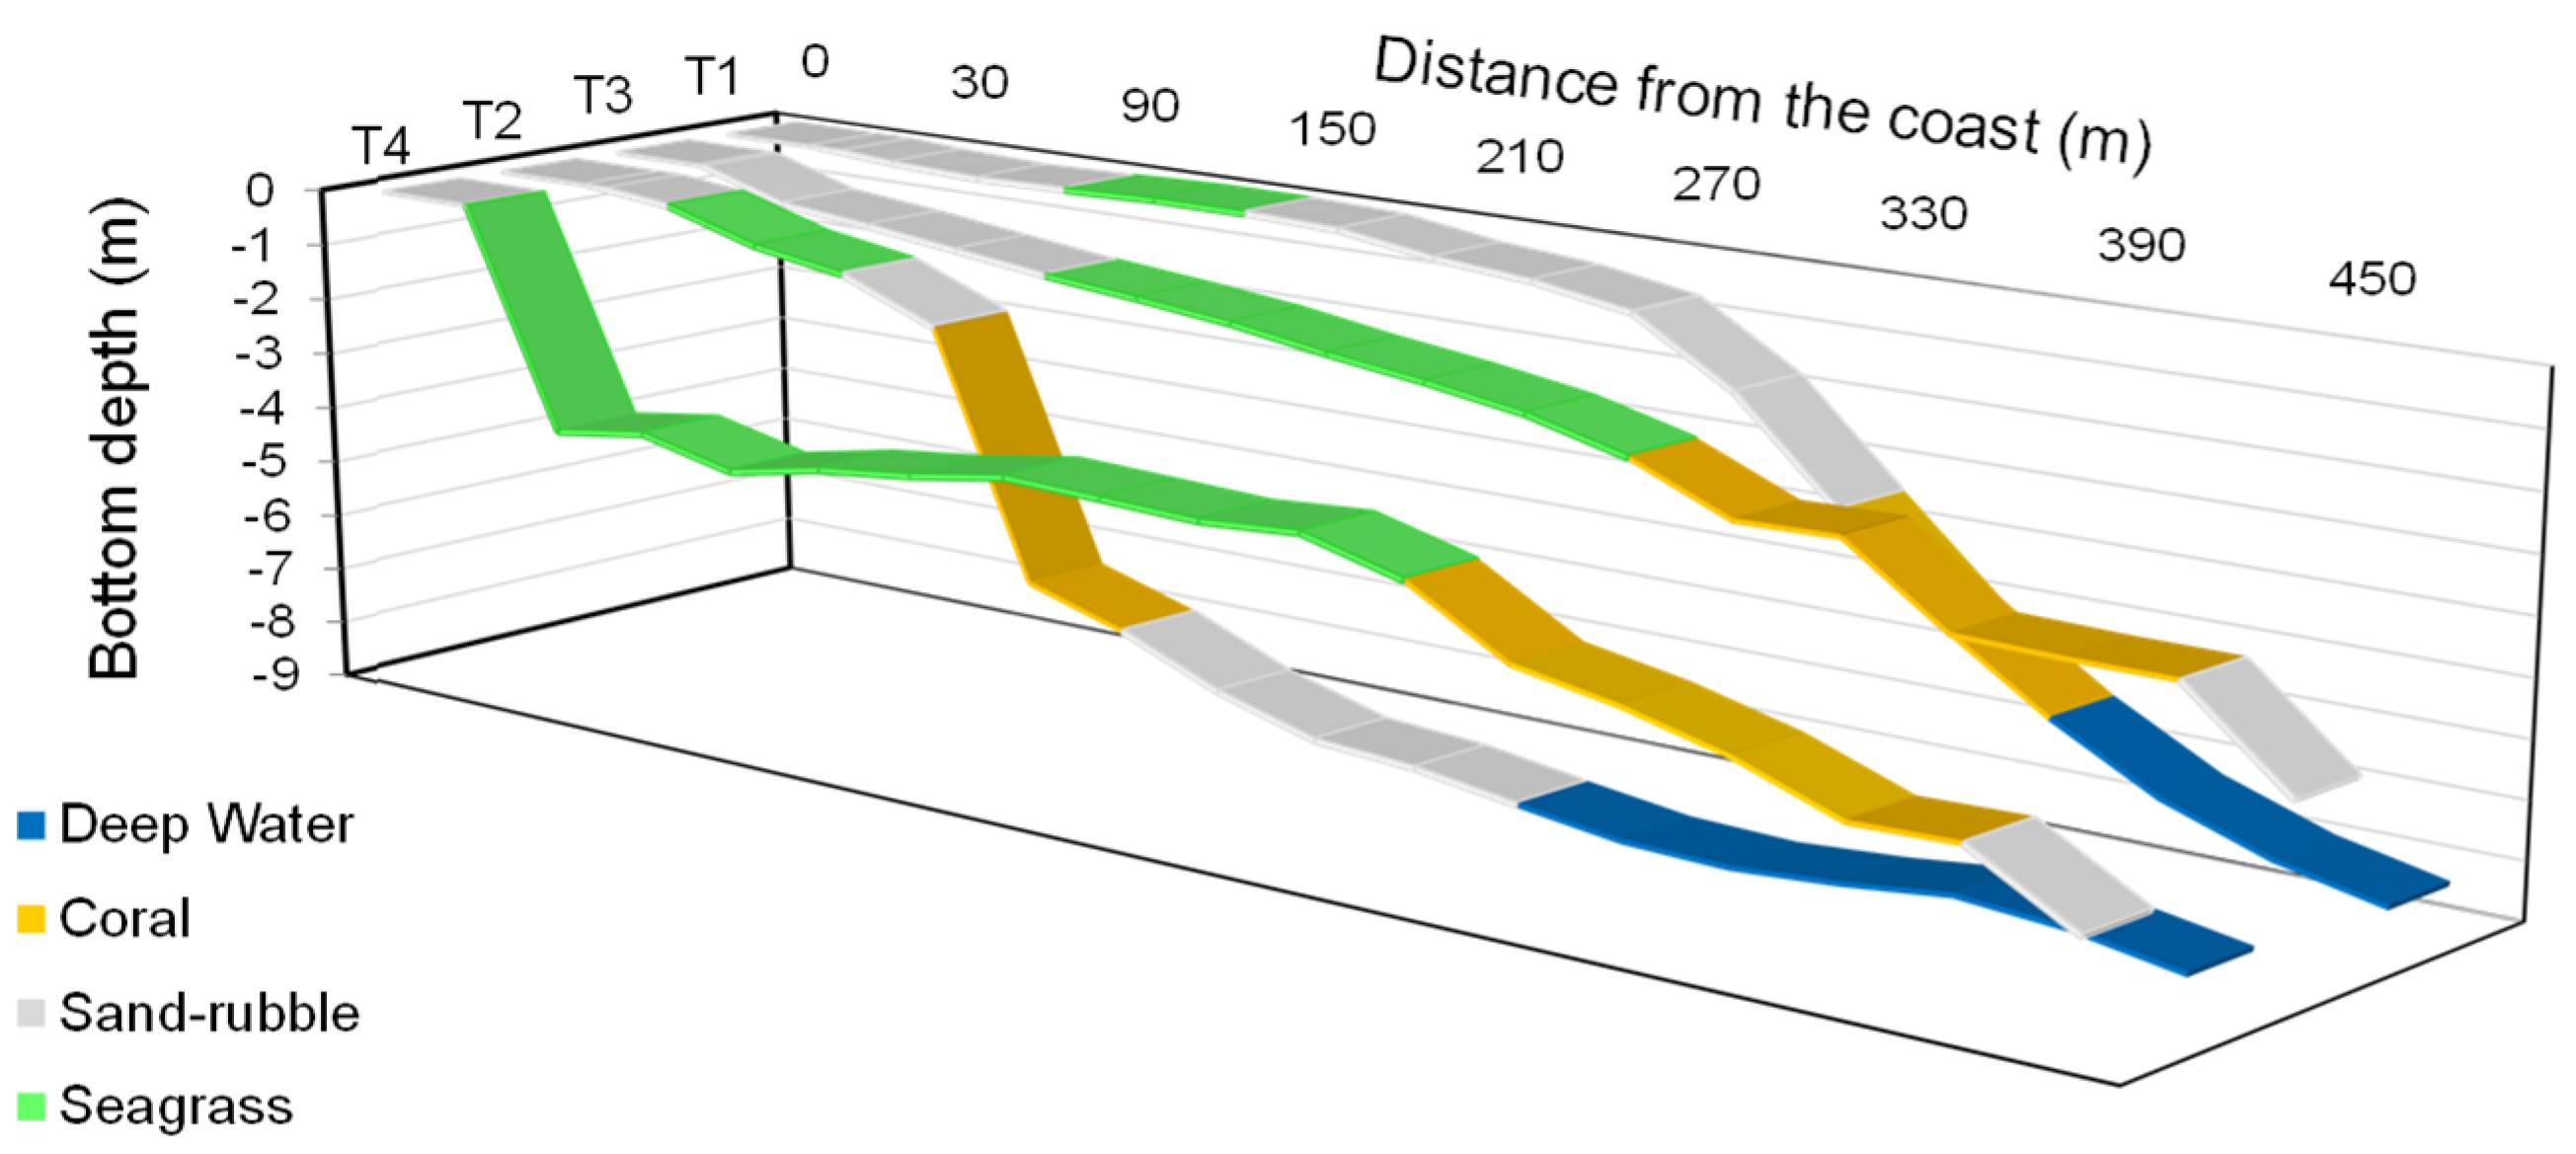
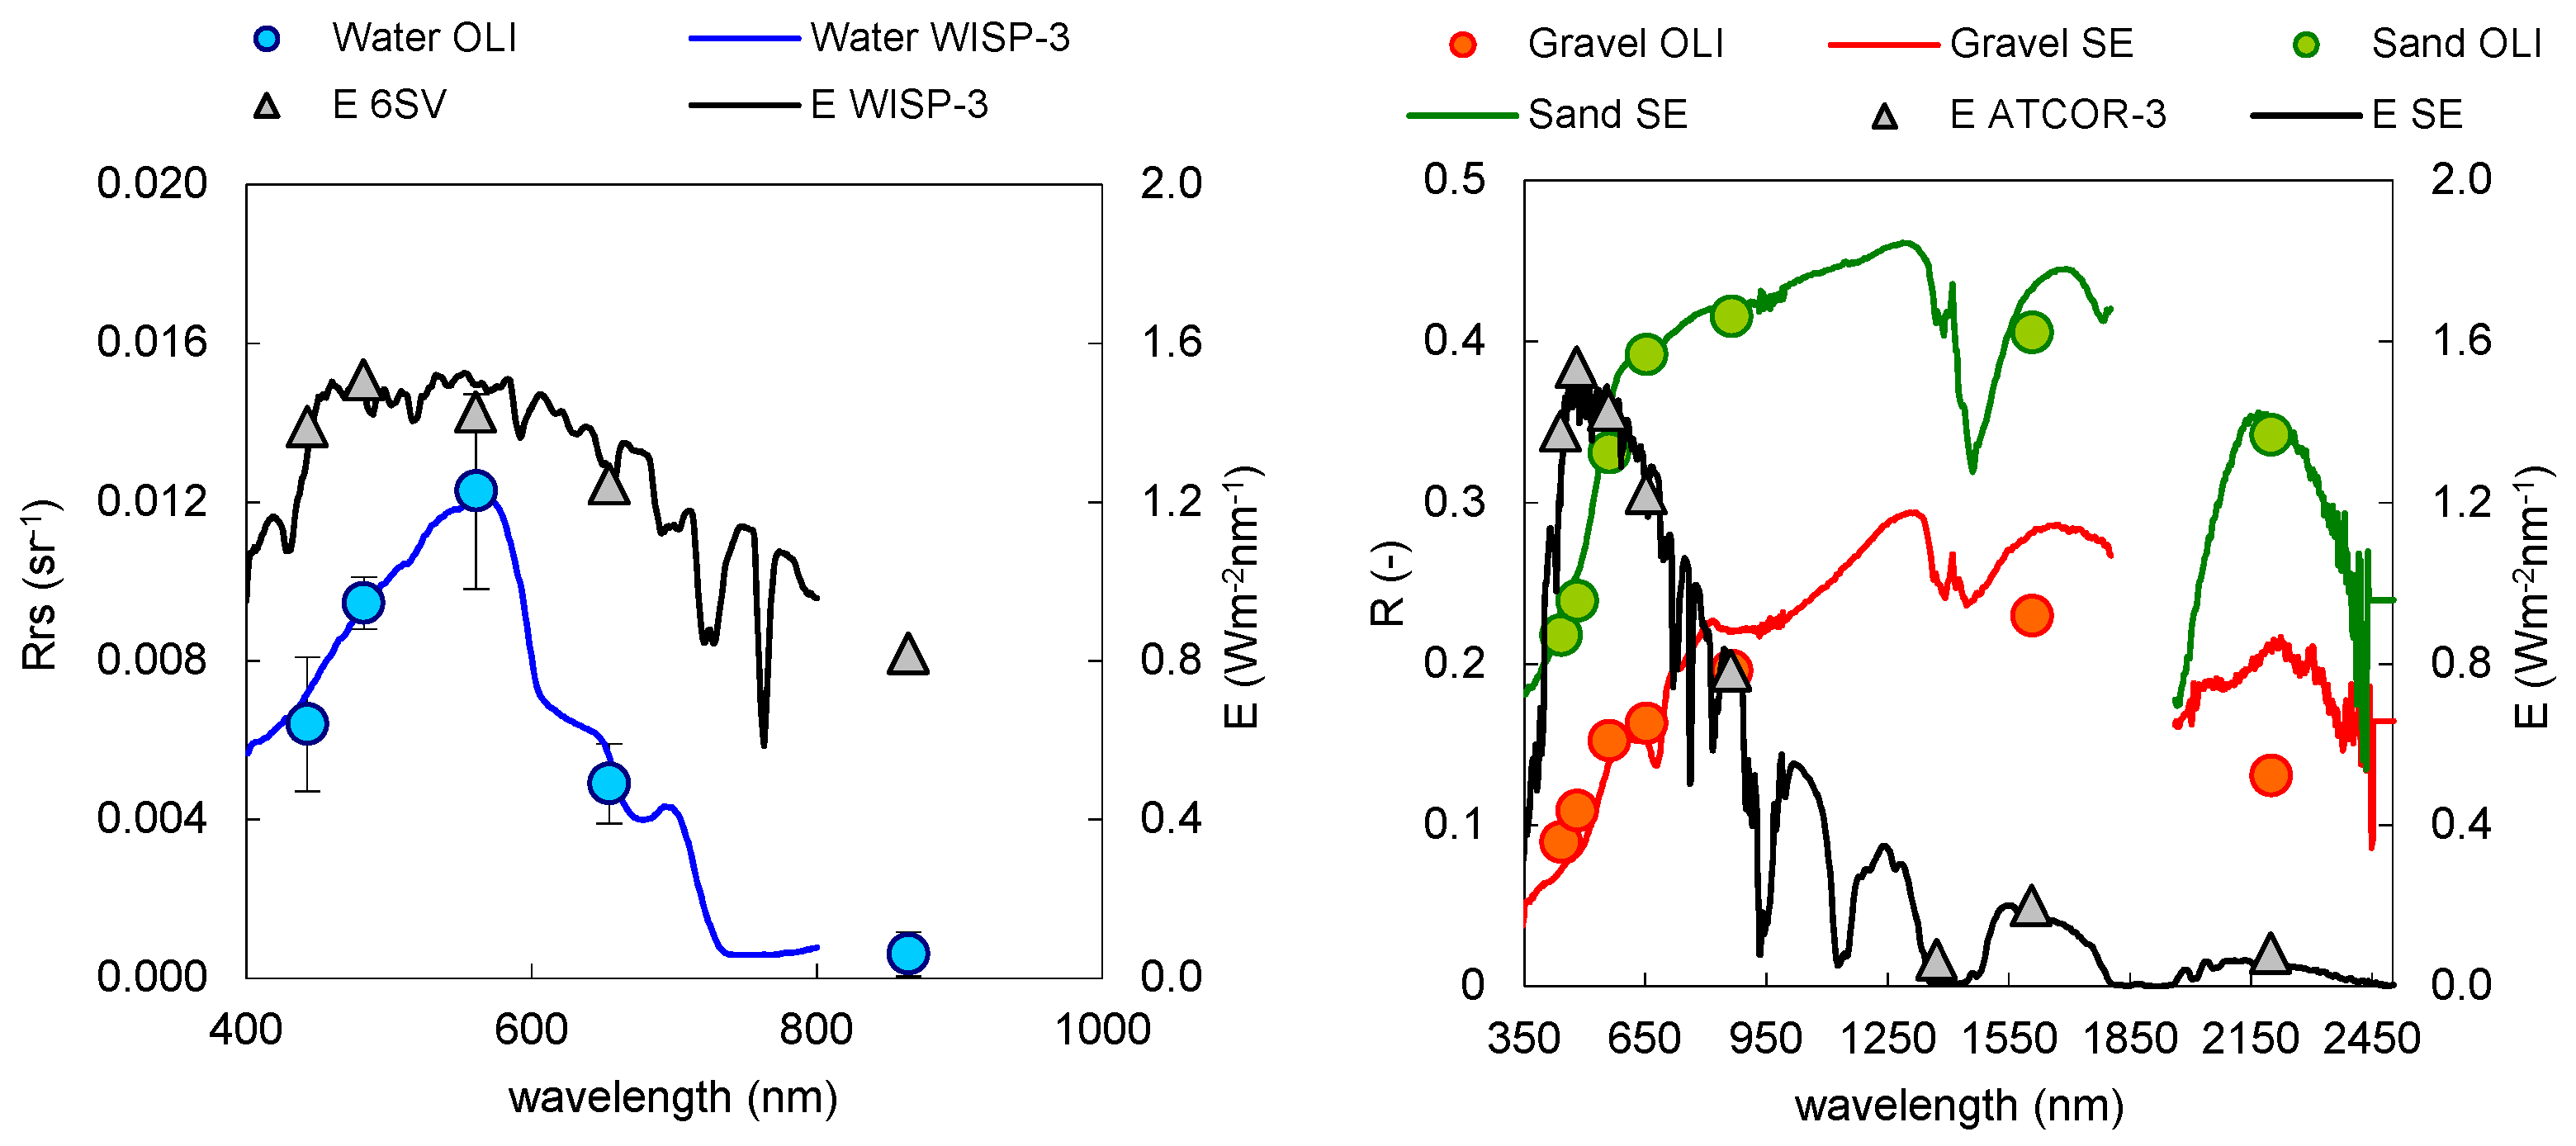
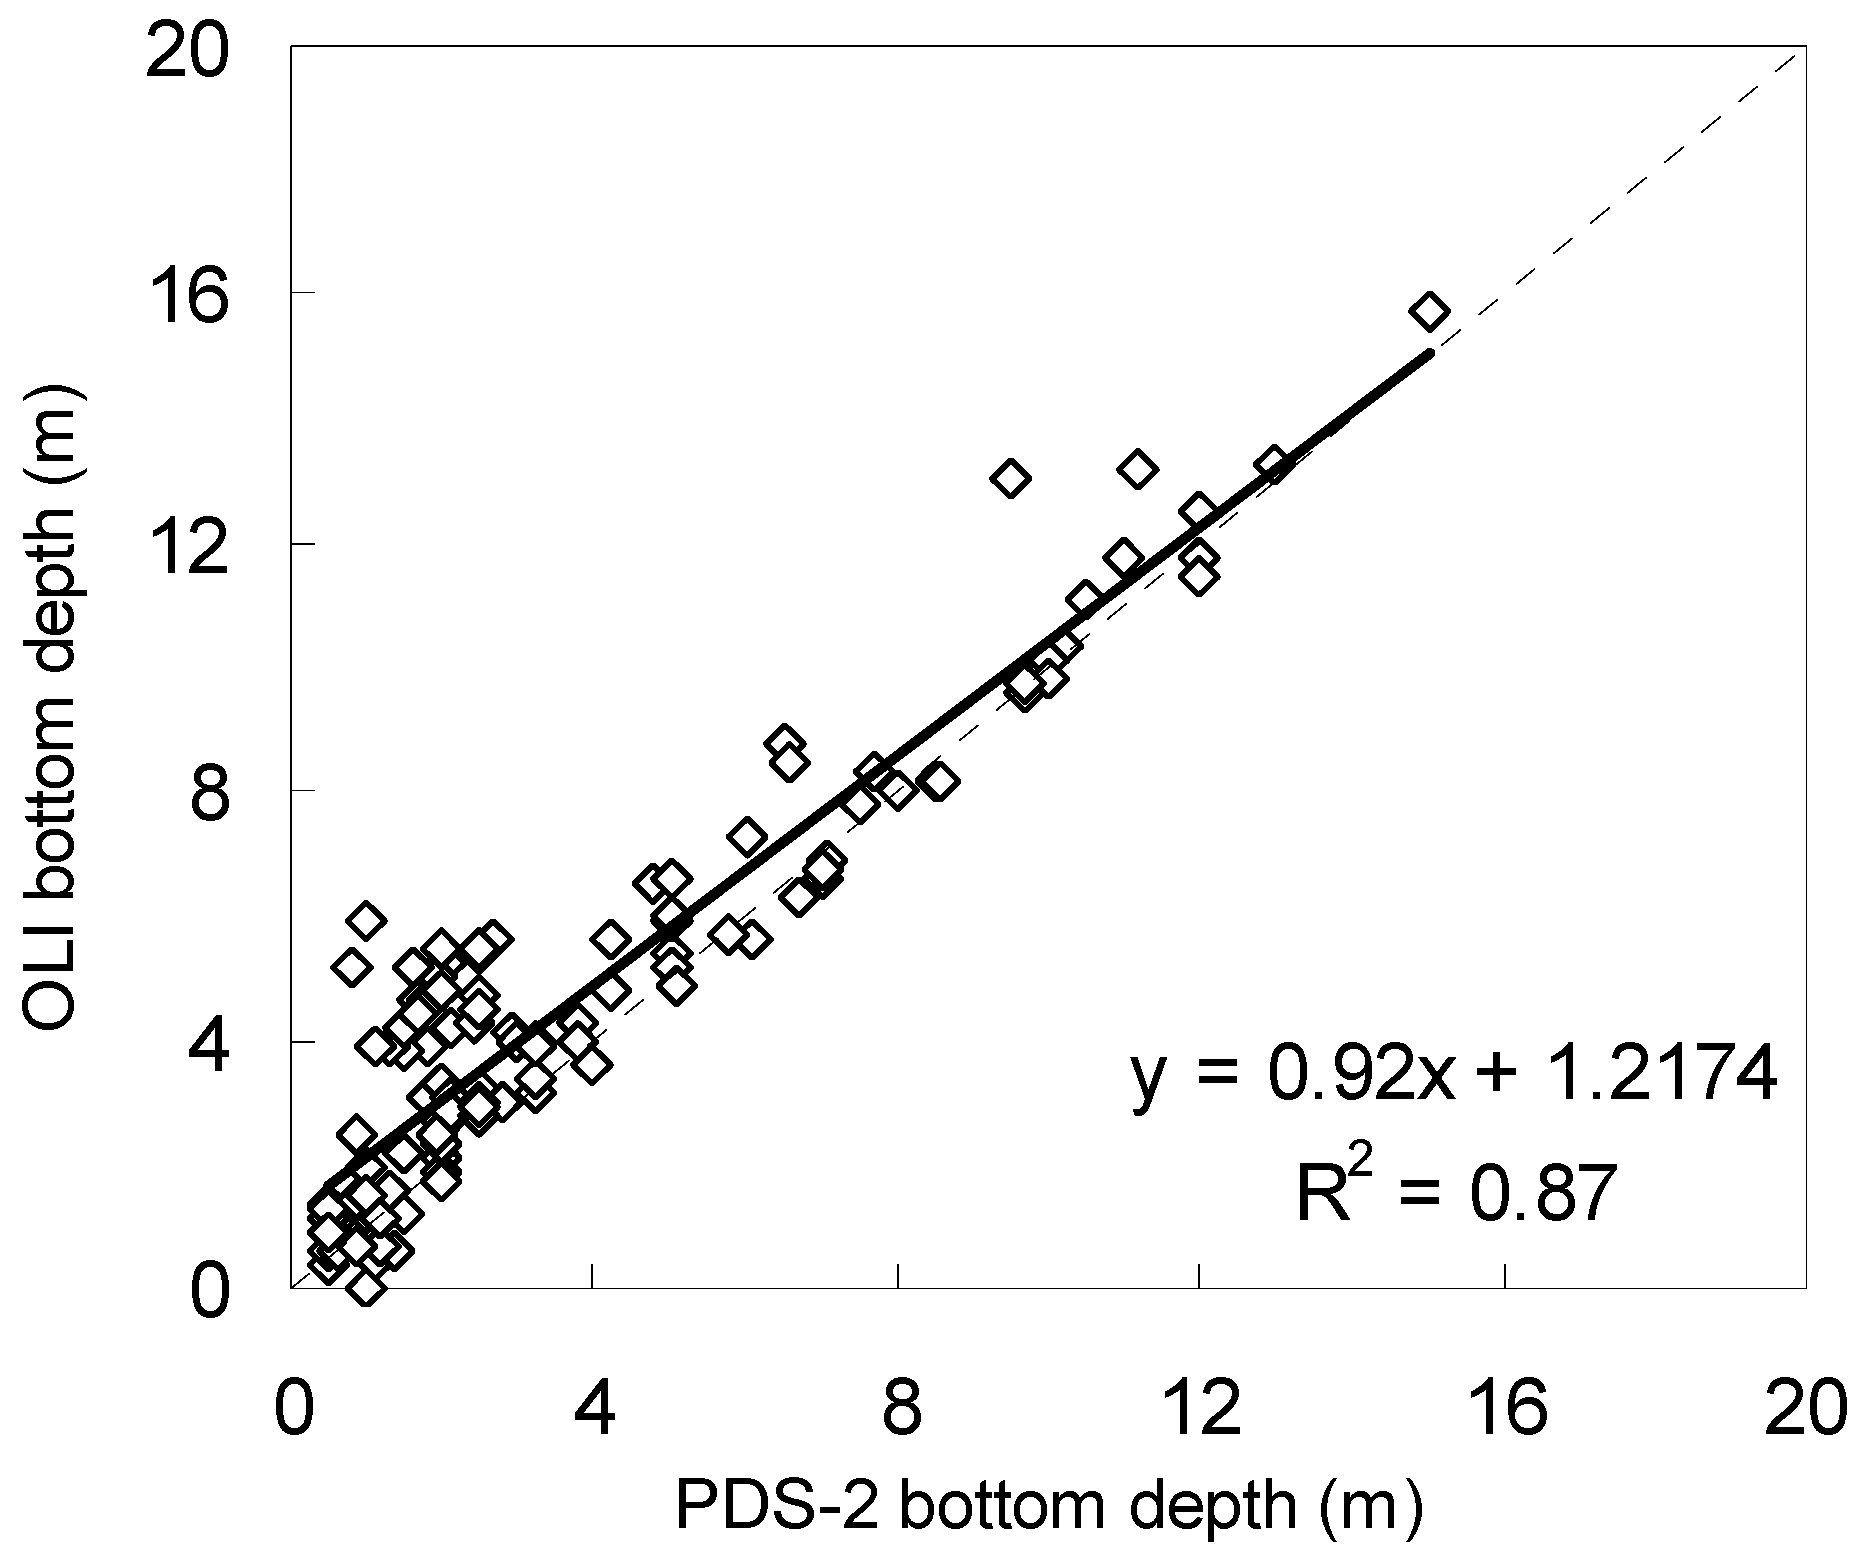
3.1. Atmospheric Correction and Bottom Depth Retrieval

The procedures adopted to map mangrove forests, corals, seagrass and water depth (cf. Figure 2) were applied to atmospherically -corrected OLI images whose reliability was measured with in situ data.
Figure 3 shows a comparison of in situ spectra and imagery data over land and water targets. A good closure between in situ measured and OLI derived spectra has been achieved both with 6SV over water and with ATCOR-3 over land. A higher discrepancy between OLI and in situ data was observed at longer wavelengths for the gravel due the difference of humidity rate between satellite and field observations. The plots also show a comparison between in situ measured downwelling irradiance (E, in Wm−2nm−1) and values computed by the atmospheric correction codes starting from climatic and atmospheric conditions. In the case of land, the comparison is between SE irradiance spectra and ATCOR-3 computation; in the case of water, the comparison is between WISP-3 irradiance spectra and the 6SV output. The good agreement between irradiance values measured in situ and those computed by the two codes indicate that both 6SV and ATCOR-3 were properly parameterized with respect to atmospheric conditions.
Figure 3. Comparison of in situ (continuous lines) and OLI derived spectra (dots) for water and terrestrial targets. On left, WISP-3 Rrs values (sr−1 units) are plotted with the 6SV-derived reflectances divided by π. On right, SE reflectances R (dimensionless) of sandy and gravel beaches are compared with those provided by ATCOR-3. On the secondary y-axis, both plots show the irradiance values E at the time of image acquisition measured in situ (continuous line) and estimated running the atmospheric correction codes (triangles).
Remotesensing 08 00002 g003
BOMBER was applied twice to the atmospherically-corrected OLI data over water (Figure 2). Firstly to distinguish deep waters from shallow waters, then, for the shallow waters pixels, BOMBER produced bottom depth and the fractional cover for two types of substrate. To assess the accuracy of the bottom depth retrievals, Figure 4 shows the scatterplot of OLI derived bottom depths and the tide corrected in situ depth soundings. Overall, the image-based depths were in good agreement with the in situ measurements over the 0–16 m range, although the existence of more scattered data at OLI depths of 4–6 m and PDS-2 depths of 1–3 m. This cluster is typical of stations with significant heterogeneous substrates where the 30 m resolution of OLI data do not match survey observations from spot-checks in smaller area. The regression coefficient R2 of 0.87 and root mean square error of 1.6 m were obtained between OLI and in situ data.
Figure 4. Scatterplot of OLI derived bottom depths and in situ PSD-2 bathymetric data measured in 133 sites of Lampi Island coastal zones. The regression line between data is plotted with equation and linear regression coefficient (R2). Dotted line shows the 1:1 line.
Remotesensing 08 00002 g004

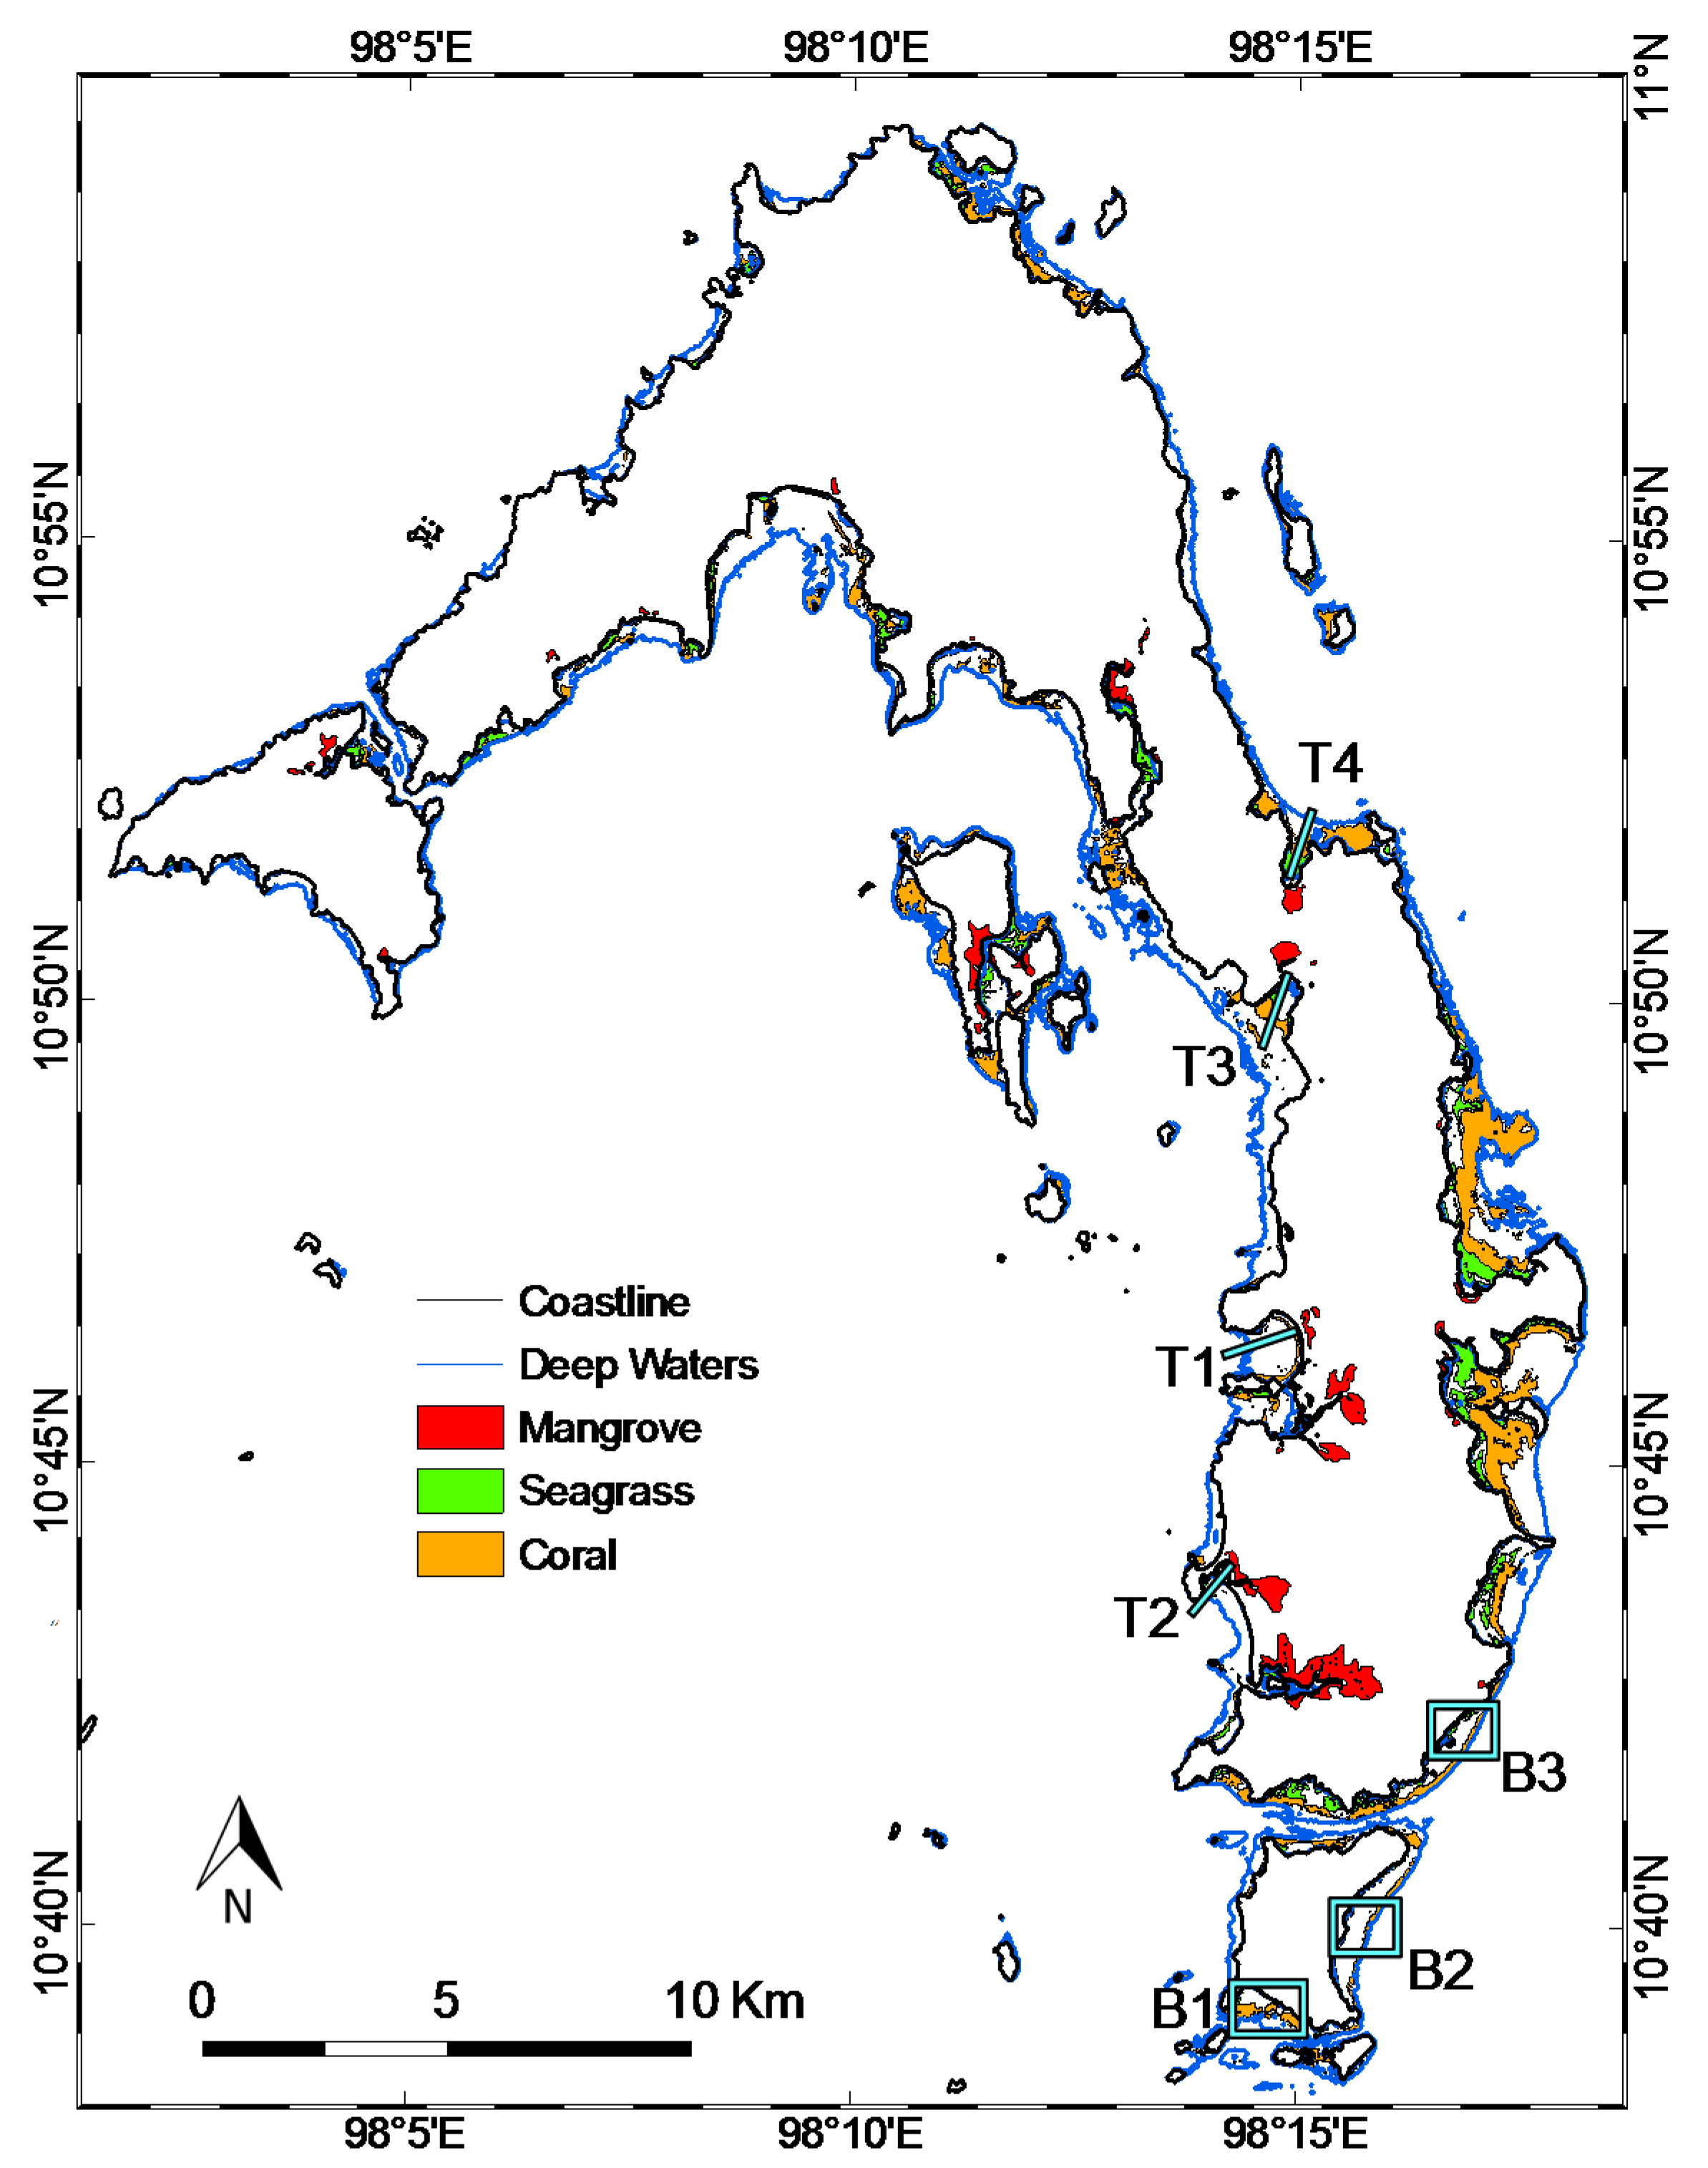
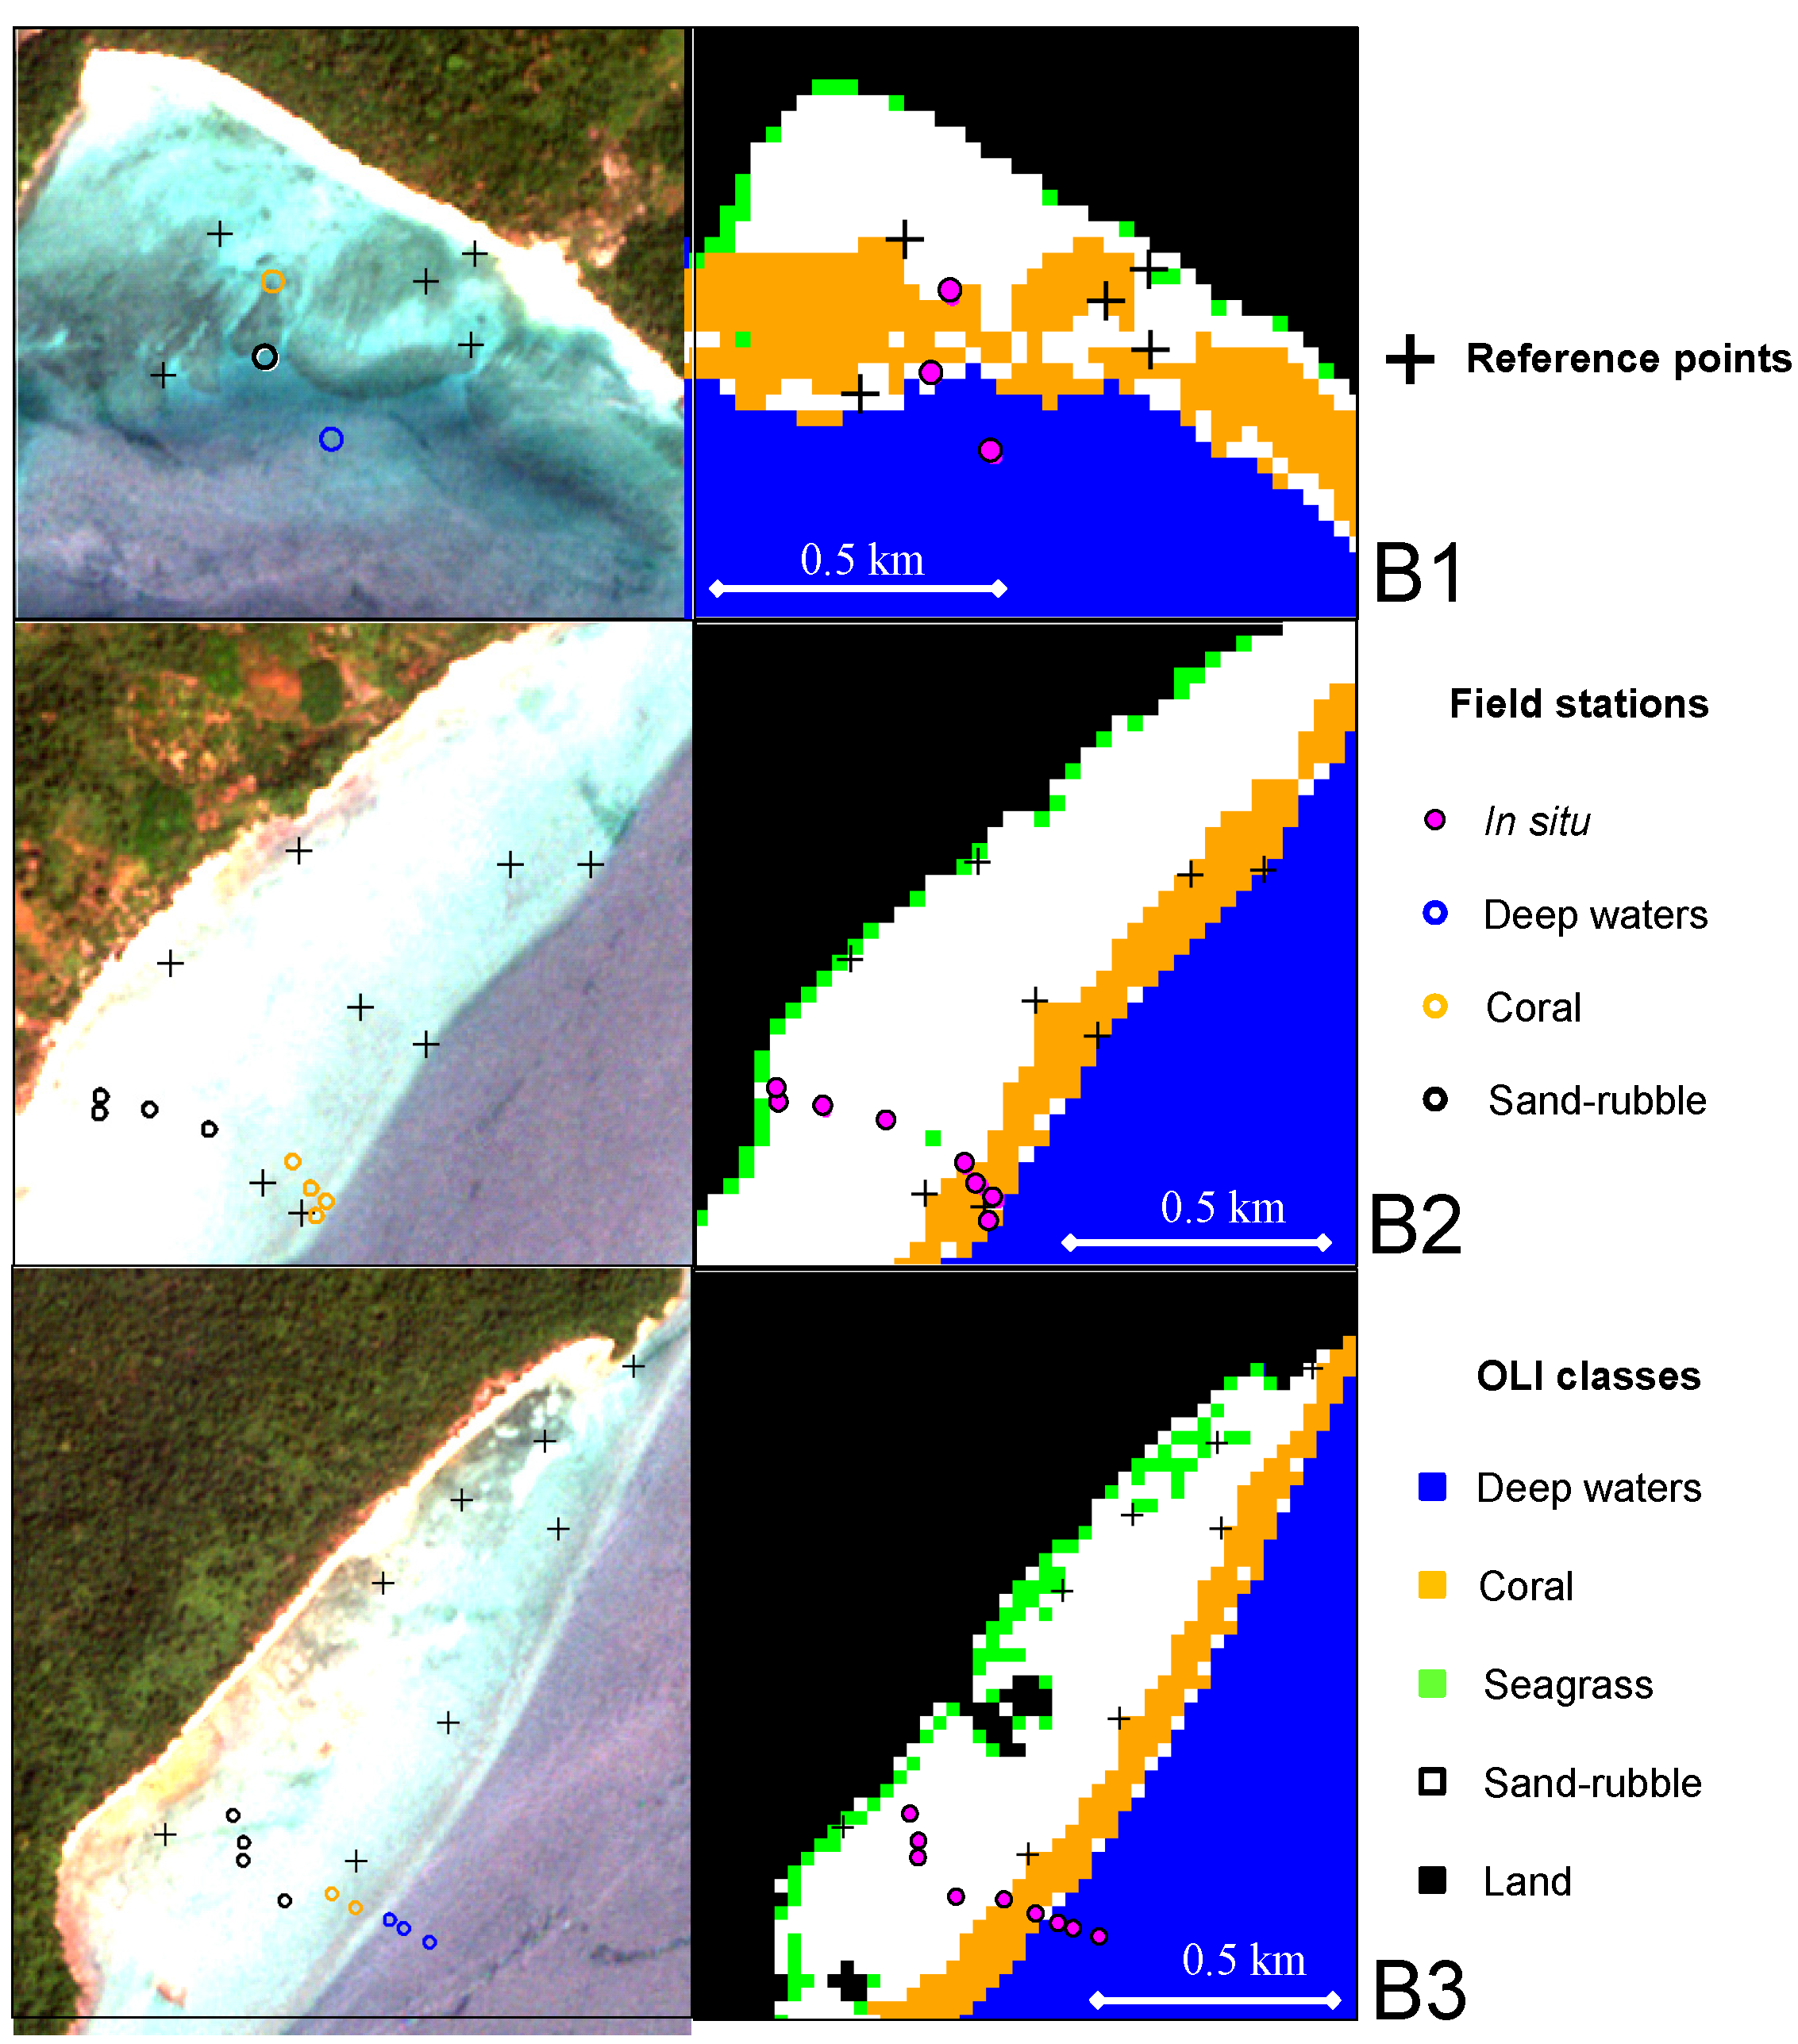
3.2. Coastal Habitat Mapping

The distribution of habitats along the Lampi Island as detected from OLI data is shown in Figure 5. Seagrass (mainly represented by Zostera spp.) have been found with a discontinuous distribution for a total surface of 5.22 km2. The 48% of seagrass cover has been observed at a depth between 0 m and 2 m (average 1.13 m ± 0.51 m), the 22% between 2 m and 4 m (average 2.81 m ± 0.58 m) and less than 10% at depths more than 6 m. Corals (massive knob-like, arborescent-elkhom, columnar and corymbose) grow at a mean depth of 5.9 m (±1.8 m), with two different patterns: corals forming the reef crest have characteristic depth of 5–10 m, while corals near the rocky coasts lay at 2–6 m of depth. Totally, coral substrate occupies about 10 km2 and the reef crest is long about 53 km.
The eastern and southern part of the island host the wider coral and seagrass covers, while to the north coral reefs and seagrass meadows are few. In the west side of the Lampi Island coral and seagrass substrates are placed near mangrove forests. Seagrass meadows are particularly extended inside the bays and intrude deeper in the land, where sea waves are weaker and where bottoms (mainly sandy) are less steep. Corals also reduce wave and current strength, making the colonization of seagrass easier [40].
The combined presence of mangroves, seagrass and corals constitutes hotspots of biodiversity and support key ecosystem services of coastal habitats trough functional linkages [7], including sustaining several fish species of commercial and local consumption relevance [6]. Thus, the identification and protection of these areas is a priority for sustainable management of Lampi Island resources. 18 sites colonized by mangrove forests larger than 5 km2 have been identified in Lampi Island coasts. All of them have open access to the coastal zone unless one situated along a river inside the Island. For 15 of those sites (i.e., the 83%), the substrates of shallow waters areas in front of mangroves are colonized by both seagrass and corals. The 15 hotspot areas have been identified, located within protected bays or estuarine areas, mostly on the west side of the Island (Figure 5). Seagrass meadows inside the biodiversity hotspots have a minimum distance of around 210 m (±120 m) from mangrove forests, while coral bottom have higher distances (360 m ± 180 m).
Four transects of biodiversity hotspots (cf. Figure 5) located in front of mangrove forests were selected to describe bottom depth gradients and substrates distribution (Figure 6). Seagrass were found on gently sloping bottoms at different depths (from lower than 1 m to 4–5 m of depth) and they are usually preceding coral substrates, as protecting them from terrestrial inputs carried by rivers flowing on the Island. Corals were found independently on slopes but usually deeper than seagrass (generally more than 4 m).
Figure 5. Map showing mangrove, seagrass, and coral distribution obtained from the classification of OLI image. T1-T4 identify transects of biodiversity hot-spots, B1–B3 identify bays where the OLI classification results were compared with finer spatial resolution RapidEye imagery.
Remotesensing 08 00002 g005
Figure 6. Depth profiles of four transects (cf. Figure 5) with relative bottom cover classes. Transects start from the coastline and extend for about 400 m. All transects have been selected in correspondence of bays where also mangrove forests have been detected.
Remotesensing 08 00002 g006

3.3. Classification Accuracy

To provide an accuracy of the results depicting the spatial distribution of mangrove forests, corals, and sea grasses confusion matrixes where computed based on both field observations and higher spatial resolution RapidEye data (Figure 7). Thanks to the good spectral separability of mangroves from other terrestrial land cover types, a very high accuracy for mangrove forests classification was obtained (producer and user accuracies of 88% and 92%). Misclassification is mostly associated to borders with other land cover types, were mixed-pixels effects may be present.
Figure 7. Comparison between RapidEye true-colour images (on the left) and classification results (on the right, from OLI data) obtained in three bays in the southern part of Lampi Island. Location of the bays is shown in Figure 5. Crosses identify the same coordinates in both images; circles and dots correspond to in situ stations.
Remotesensing 08 00002 g007
Classification results for the water element are instead shown in Table 1: an overall accuracy of 76% and a Kappa coefficient of 0.65 were obtained. Lower accuracies were found for the classification of corals (producer and user accuracies of 58% and 77%) and seagrass (producer and user accuracies of 50% and 50%). As observed in the field and qualitatively showed in true-colour RapidEye imagery (Figure 7), corals and seagrass has a patchy distribution, often alternated with sand, rocks, and epiphytes, which might difficult the comparison between a 30 m pixel product and survey point observations [41]. Furthermore, signs of bleached corals could be observed during the survey. Dead or bleached corals can respond differently to the incident light with respect to healthy corals [42]. This can explain the not perfect performance of the classification procedure in distinguishing corals and sand-rubble classes. Corals also constitute a barrier reef, appearing as dense healthy populations along the submersed ridge, where they can form a clear line that separates optically-shallow and deep waters. The 30 m pixel resolution sometime does not catch this border, giving rise to errors in the differentiation between corals and deep waters classes. The lower accuracy of seagrass mapping was due to the difficulty of capturing the patchy seagrass beds [20] with the 30 m spatial resolution of OLI data. Moreover, the spectral bands of OLI sensor makes challenging to distinguish different living organisms containing photosynthetic pigments.
Table 1. Confusion matrix and accuracies for water targets (deep waters and three substrate types: corals, seagrass and sand-rubble).
in Situ DataTotalUser Accuracy
Deep WatersCoralsSeagrassSand-Rubble
Image dataDeep waters40 10275968%
Corals124063177%
Seagrass0132650%
Sand-rubble061465387%
Total4141661Overall accuracy76%
Producer accuracy98%58%50%75%

4. Conclusions

In this study, we combined field survey data and satellite imagery to map coral reef habitats, seagrass beds, and mangroves in the Lampi Island, the unique Marine National Park of Myanmar. These coastal habitats indeed compose a multiple ecosystem where high richness of biodiversity occurs.
A hybrid approach based on traditional supervised classification techniques and bio-optical modelling was applied to validated atmospherically-corrected data. A MLL classifier was trained based on field data producing a mangrove forests mapping with accuracies higher than 88%. The bio-optical model implemented in BOMBER and a subsequent MLL classification in shallow waters allowed a classification of submersed habitats with an overall accuracy of 76%. In particular, the corals were recognized with a producer and user accuracies of 58% and 77%, while seagrass was often misclassified (50% of producer and user accuracies), probably due to its patchy distribution in the study area.
The produced map indicates 18 sites colonized by mangrove forests larger than 5 km2. In 15 of these sites, the coexistence of corals and seagrass was found suggesting a significant rate of biodiversity in the study area. The analysis along four transects from the coast indicated that seagrass beds were always closer to the land and reached more extension in case of more gentle bottom slopes as also observed in other tropical islands [43,44,45].
This study provides a first synoptic assessment of coastal habitats for the LIMNP but further work is needed to better characterise these multiple ecosystems and firstly to improve the accuracy of seagrass mapping. To this last aim, the use of Sentinel-2 data, as suggested by Hedley et al. [31], combined with a multi-temporal analysis is foreseen. Moreover, the inclusion of higher spatial resolution imagery, as those qualitatively used in this study, may help to improve the detection of patchy heterogeneous structures of this area.
In summary, this study demonstrates the successful use of satellite sensors for mapping coastal ecosystems in remote areas and the generated data represent an important thematic layer to use for pursuing strategies in the context of sustainable development of (quasi)uncontaminated remote islands. We believe that a remote sensing-based monitoring of coastal habitats may produce a compilation of thematic layers (bathymetry and multiple ecosystems) that can help and facilitate the functioning of the LIMNP.

Acknowledgments

This study was funded by COAST Project (Rafforzare le capacità locali per la COnservazione Ambientale e lo Sviluppo del Turismo nell’arcipelago di Myeik”, Myanmar) lead by Lara Beffasti from Istituto Oikos and funded by the Ministero degli Affari Esteri, Cooperazione Internazionale (MAECI, Italian Ministry of Foreign Affairs and International Cooperation). We are extremely grateful to Istituto Oikos people in Myanmar and in particular to Tania Miorin, Anna Giovannini, Aung Kyaw Ohn and Myint Sein for their support during field survey. We thank Martina Anelli for supporting satellite images processing. The contribution of Vittorio E. Brando was funded by the CNR RITMARE Flagship Project and the European Union (FP7- People Co-funding of Regional, National and International Programmes, GA No. 600407). We are grateful to the anonymous reviewers who contributed to the improvement of this manuscript. We also thank guest editors, Stuart Phinn and Chris Roelfsema for their contributions to this special issue.

Author Contributions

The general conceptions of the study and most of data processing and analyses have been developed by Claudia Giardino, Mariano Bresciani, Francesco Fava and Roberto Colombo. These authors also participated to fieldwork activities. Erica Matta worked on image processing and provided image layouts. Vittorio E. Brando contributed to experimental design and guaranteed both the essential discussion and a critical reading throughout the whole manuscript.

Conflicts of Interest

The authors declare no conflict of interest.

References

  1. Dalleau, M.; Andréfouët, S.; Wabnitz, C.C.; Payri, C.; Wantiez, L.; Pichon, M.; Friedman, K.; Vigliola, L.; Benzoni, F. Use of habitats as surrogates of biodiversity for efficient coral reef conservation planning in Pacific Ocean islands. Conserv. Biol. 2010, 24, 541–552. [Google Scholar] [CrossRef]
  2. Mumby, P.J.; Edwards, A.J.; Arias-González, J.E.; Lindeman, K.C.; Blackwell, P.G.; Gall, A.; Gorczynska, M.I.; Harborne, A.R.; Pescod, C.L.; Renken, H.; et al. Mangroves enhance the biomass of coral reef fish communities in the Caribbean. Nature 2004, 427, 533–536. [Google Scholar] [CrossRef]
  3. Moberg, F.; Folke, C. Ecological goods and services of coral reef ecosystems. Ecol. Econ. 1999, 29, 215–233. [Google Scholar] [CrossRef]
  4. Field, C.B.; Osborn, J.G.; Hoffman, L.L.; Polsenberg, J.F.; Ackerly, D.D.; Berry, J.A.; Bjorkman, O.; Held, A.; Matson, P.A.; Mooney, H.A. Mangrove biodiversity and ecosystem function. Glob. Ecol. Biogeogr. 1998, 7, 3–14. [Google Scholar] [CrossRef]
  5. Duarte, C.M. The future of seagrass meadows. Environ. Cons. 2002, 29, 192–206. [Google Scholar] [CrossRef]
  6. Honda, K.; Nakamura, Y.; Nakaoka, M.; Uy, W.H.; Fortes, M.D. Habitat use by fishes in coral reefs, seagrass beds and mangrove habitats in the Philippines. PLoS ONE 2013, 8. [Google Scholar] [CrossRef] [PubMed]
  7. Harborne, A.R.; Mumby, P.J.; Micheli, F.; Perry, C.T.; Dahlgren, C.P.; Holmes, K.E.; Brumbaugh, D.R. The functional value of Caribbean coral reef, seagrass and mangrove habitats to ecosystem processes. Adv. Mar. Biol. 2006, 50, 57–189. [Google Scholar] [PubMed]
  8. Bellwood, D.R.; Hoey, A.S.; Choat, J.H. Limited functional redundancy in high diversity systems: Resilience and ecosystem function on coral reefs. Ecol. Lett. 2003, 6, 281–285. [Google Scholar] [CrossRef]
  9. Bellwood, D.R.; Hughes, T.P.; Folke, C.; Nyström, M. Confronting the coral reef crisis. Nature 2004, 429, 827–833. [Google Scholar] [CrossRef] [PubMed]
  10. Purkis, S.J.; Pasterkamp, R. Integrating in situ reef-top reflectance spectra with Landsat TM imagery to aid shallow-tropical benthic habitat mapping. Coral Reefs 2004, 23, 5–20. [Google Scholar] [CrossRef]
  11. Wabnitz, C.C.; Andréfouët, S.; Torres-Pulliza, D.; Müller-Karger, F.E.; Kramer, P.A. Regional-scale seagrass habitat mapping in the Wider Caribbean region using Landsat sensors: applications to conservation and ecology. Remote Sens. Environ. 2008, 112, 3455–3467. [Google Scholar] [CrossRef]
  12. Kuenzer, C.; Bluemel, A.; Gebhardt, S.; Vo Quoc, T.; Dech, S. Remote sensing of mangrove ecosystems: A review. Remote Sens. 2011, 3, 878–928. [Google Scholar] [CrossRef]
  13. Benbow, S. Coral diversity and reef resilience in the Northern Myeik Archipelago, Myanmar. In Proceedings of the Reef Conservation UK 2014, London, UK, 28 November 2015.
  14. Howard, R.; Lunn, Z.A.; Maung, S.; Mon Nyi Nyi Len, S.; Thiha, S.T. Aung. Assessment of the Myeik Archipelago Coral Reef Ecosystem; Fauna and Flora International: Cambridge, UK, 2014. [Google Scholar]
  15. Hommersom, A.; Kratzer, S.; Laanen, M.; Ansko, I.; Ligi, M.; Bresciani, M.; Giardino, C.; Beltrán-Abaunza, J.M.; Moore, G.; Wernand, M.; Peters, S. Intercomparison in the field between the new WISP-3 and other radiometers (TriOS Ramses, ASD FieldSpec, and TACCS). J. Appl. Remote Sens. 2012, 6. [Google Scholar] [CrossRef]
  16. Valiela, I.; Bowen, J.L.; York, J.K. Mangrove forests: One of the world’s threatened major tropical environments. BioScience 2001, 51, 807–815. [Google Scholar]
  17. Roelfsema, C.M.; Phinn, S.R. Integrating field data with high spatial resolution multispectral satellite imagery for calibration and validation of coral reef benthic community maps. J. Appl. Remote Sens. 2010, 4. [Google Scholar] [CrossRef] [Green Version]
  18. Yeemin, T.; Sutthacheep, M.; Pettongma, R. Coral reef restoration projects in Thailand. Ocean Coast. Manag. 2006, 49, 562–575. [Google Scholar] [CrossRef]
  19. Dam Roy, S.; Grinson-George; Soundararajan, R.; Krishnan, P.; Murugesan, S.; Kaliyamoorthy, M. Status of coral reefs in Andaman after two major catastrophic events—Tsunami of December 2004 and bleaching of May 2005. Ecol. Environ. Conserv. 2014, 20, 539–544. [Google Scholar]
  20. Novak, A.B.; Hines, E.; Kwan, D.; Parr, L.; Tun, M.T.; Win, H.; Short, F.T. Revised ranges of seagrass species in the Myeik Archipelago, Myanmar. Aquat. Bot. 2009, 91, 250–252. [Google Scholar] [CrossRef]
  21. Richter, R. Atmospheric/Topographic Correction for Satellite Imagery. Available online: http://www.dlr.de/eoc/Portaldata/60/Resources/dokumente/5_tech_mod/atcor3_manual_2012.pdf (accessed on 2 December 2015).
  22. Di Mauro, B.; Fava, F.; Ferrero, L.; Garzonio, R.; Baccolo, G.; Delmonte, B.; Colombo, R. Mineral dust impact on snow radiative properties in the European Alps combining ground, UAV and satellite observations. Geophys. Res. Atmos. 2015, 120, 6080–6097. [Google Scholar] [CrossRef]
  23. Kaufman, Y.J.; Sendra, C. Algorithm for automatic atmospheric corrections to visible and near-IR satellite imagery. Int. J. Remote Sens. 1988, 9, 1357–1381. [Google Scholar] [CrossRef]
  24. Vermote, E.F.; Tanré, D.; Deuzé, J.L.; Herman, M.; Morcrette, J.-J. Second simulation of the satellite signal in the solar spectrum, 6S: An overview. IEEE Trans. Geosci. Remote Sens. 1997, 35, 675–686. [Google Scholar] [CrossRef]
  25. Giardino, C.; Bresciani, M.; Cazzaniga, I.; Schenk, K.; Rieger, P.; Braga, F.; Matta, E.; Brando, V.E. Evaluation of multi-resolution satellite sensors for assessing water quality and bottom depth of Lake Garda. Sensors 2014, 14, 24116–24131. [Google Scholar] [CrossRef]
  26. Nazeer, M.; Nichol, J.E.; Yung, Y.K. Evaluation of atmospheric correction models and Landsat surface reflectance product in an urban coastal environment. Int. J. Remote Sens. 2014, 35, 6271–6291. [Google Scholar] [CrossRef]
  27. Pahlevan, N.; Lee, Z.; Wei, J.; Schaaf, C.B.; Schott, J.R.; Berk, A. On-orbit radiometric characterization of OLI (Landsat-8) for applications in aquatic remote sensing. Remote Sens. Environ. 2014, 154, 272–284. [Google Scholar] [CrossRef]
  28. Leiper, I.A.; Phinn, S.R.; Roelfsema, C.M.; Joyce, K.E.; Dekker, A.G. Mapping coral reef benthos, substrates, and bathymetry, using compact airborne spectrographic imager (CASI) data. Remote Sens. 2014, 6, 6423–6445. [Google Scholar] [CrossRef]
  29. Dekker, A.G.; Phinn, S.R.; Anstee, J.; Bisset, P.; Brando, V.E.; Casey, B.; Fearns, P.; Hedley, J.; Klonowski, W.; Lee, Z.P.; et al. Intercomparison of shallow water bathymetry, hydro-optics, and benthos mapping techniques in Australian and Caribbean coastal environments. Limnol. Oceanogr. Methods 2011, 9, 396–425. [Google Scholar] [CrossRef]
  30. Botha, E.J.; Brando, V.E.; Anstee, J.M.; Dekker, A.G.; Sagar, S. Increased spectral resolution enhances coral detection under varying water conditions. Remote Sens. Environ. 2013, 44, 145–163. [Google Scholar] [CrossRef]
  31. Hedley, J.; Roelfsema, C.; Koetz, B.; Phinn, S. Capability of the Sentinel 2 mission for tropical coral reef mapping and coral bleaching detection. Remote Sens. Environ. 2012, 120, 145–155. [Google Scholar] [CrossRef]
  32. Phinn, S.; Roelfsema, C.; Dekker, A.; Brando, V.; Anstee, J. Mapping seagrass species, cover and biomass in shallow waters: An assessment of satellite multi-spectral and airborne hyper-spectral imaging systems in Moreton Bay (Australia). Remote Sens. Environ. 2008, 112, 3413–3425. [Google Scholar] [CrossRef]
  33. Kutser, T.; Miller, I.; Jupp, D.L.B. Mapping coral reef benthic substrates using hyperspectral space-borne images and spectral libraries. Estuar. Coast. Shelf Sci. 2006, 70, 449–460. [Google Scholar] [CrossRef]
  34. Giardino, C.; Candiani, G.; Bresciani, M.; Lee, Z.; Gagliano, S.; Pepe, M. BOMBER: A tool for estimating water quality and bottom properties from remote sensing images. Comput. Geosci. 2012, 45, 313–318. [Google Scholar] [CrossRef]
  35. Lee, Z.; Carder, K.L.; Mobley, C.D.; Steward, R.G.; Patch, J.S. Hyperspectral remote sensing for shallow waters. 1. A semi analytical model. Appl. Opt. 1998, 37, 6329–6338. [Google Scholar] [CrossRef] [PubMed]
  36. Lee, Z.; Carder, K.L.; Mobley, C.D.; Steward, R.G.; Patch, J.S. Hyperspectral remote sensing for shallow waters. 2. Deriving bottom depths and water properties by optimization. Appl. Opt. 1999, 38, 3831–3843. [Google Scholar] [CrossRef] [PubMed]
  37. Giardino, C.; Bresciani, M.; Valentini, E.; Gasperini, L.; Bolpagni, R.; Brando, V.E. Airborne hyperspectral data to assess suspended particulate matter and aquatic vegetation in a shallow and turbid lake. Remote Sens. Environ. 2015, 157, 48–57. [Google Scholar] [CrossRef]
  38. Adler-Golden, S.M.; Acharya, P.K.; Berk, A.; Matthew, M.W.; Gorodetzky, D. Remote bathymetry of the littoral zone from AVIRIS, LASH, and QuickBird Imagery. IEEE Trans. Geosci. Remote Sens. 2005, 43, 337–347. [Google Scholar] [CrossRef]
  39. Dierssen, H.M.; Zimmerman, R.C.; Leathers, R.A.; Downes, T.V.; Davis, C.O. Ocean color remote sensing of seagrass and bathymetry in the Bahamas Banks by high-resolution airborne imagery. Limnol. Oceanogr. 2003, 48, 444–455. [Google Scholar] [CrossRef]
  40. Moberg, F.; Ronnback, P. Ecosystem services of the tropical seascape: interactions, substitutions and restoration. Ocean Coast. Manage. 2003, 46, 27–46. [Google Scholar] [CrossRef]
  41. Roelfsema, C.M.; Phinn, S.R. Validation. In Coral Reef Remote Sensing; Goodman, J.A., Purkis, S.J., Phinn, S.R., Eds.; Springer: Dordrecht, The Netherlands, 2013; pp. 375–401. [Google Scholar]
  42. Qidong, C.; Ruru, D.; Yan, Q.; Longhai, X.; Yingquing, H. Analysis of spectral characteristics of coral under different growth patterns. Acta Ecol. Sin. 2015, 35, 3394–3402. [Google Scholar] [CrossRef]
  43. Andréfouët, S.; Guzmán, H.M. Coral reef distribution, status and geomorphology-biodiversity relationship in Kuna Yala (San Blas) archipelago, Caribbean Panama. Coral Reefs 2005, 24, 31–42. [Google Scholar] [CrossRef]
  44. Dorenbosch, M.; Grol, M.G.G.; Nagelkerken, I.; van der Velde, G. Distribution of coral reef fishes along a coral reef – seagrass gradient: edge effects and habitat segregation. Mar. Ecol. Prog. Ser. 2005, 299, 277–288. [Google Scholar] [CrossRef] [Green Version]
  45. Nagelkerken, I.; van der Velde, G.; Gorissen, M.W.; Meijer, G.J.; van’t Hof, T.; den Hartog, C. Importance of mangroves, seagrass beds and the shallow coral reef as a nursery for important coral reef fishes, using a visual census technique. Estuar. Coast Shelf Sci. 2000, 51, 31–44. [Google Scholar] [CrossRef]

