
Performance Evaluation of CRW Reef-Scale and Broad-Scale SST-Based Coral Monitoring Products in Fringing Reef Systems of Tobago


Abstract
:
1. Introduction
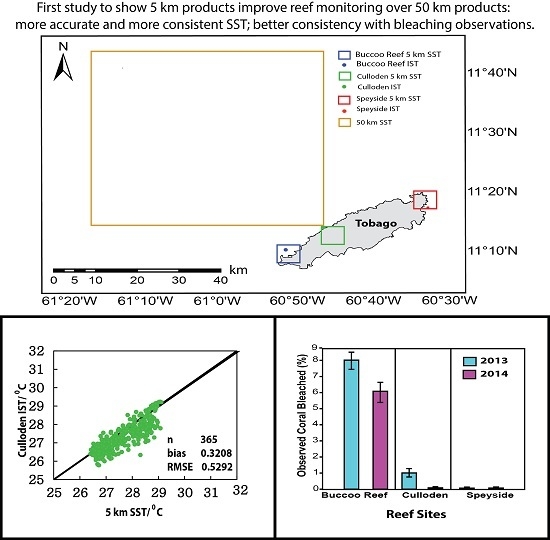
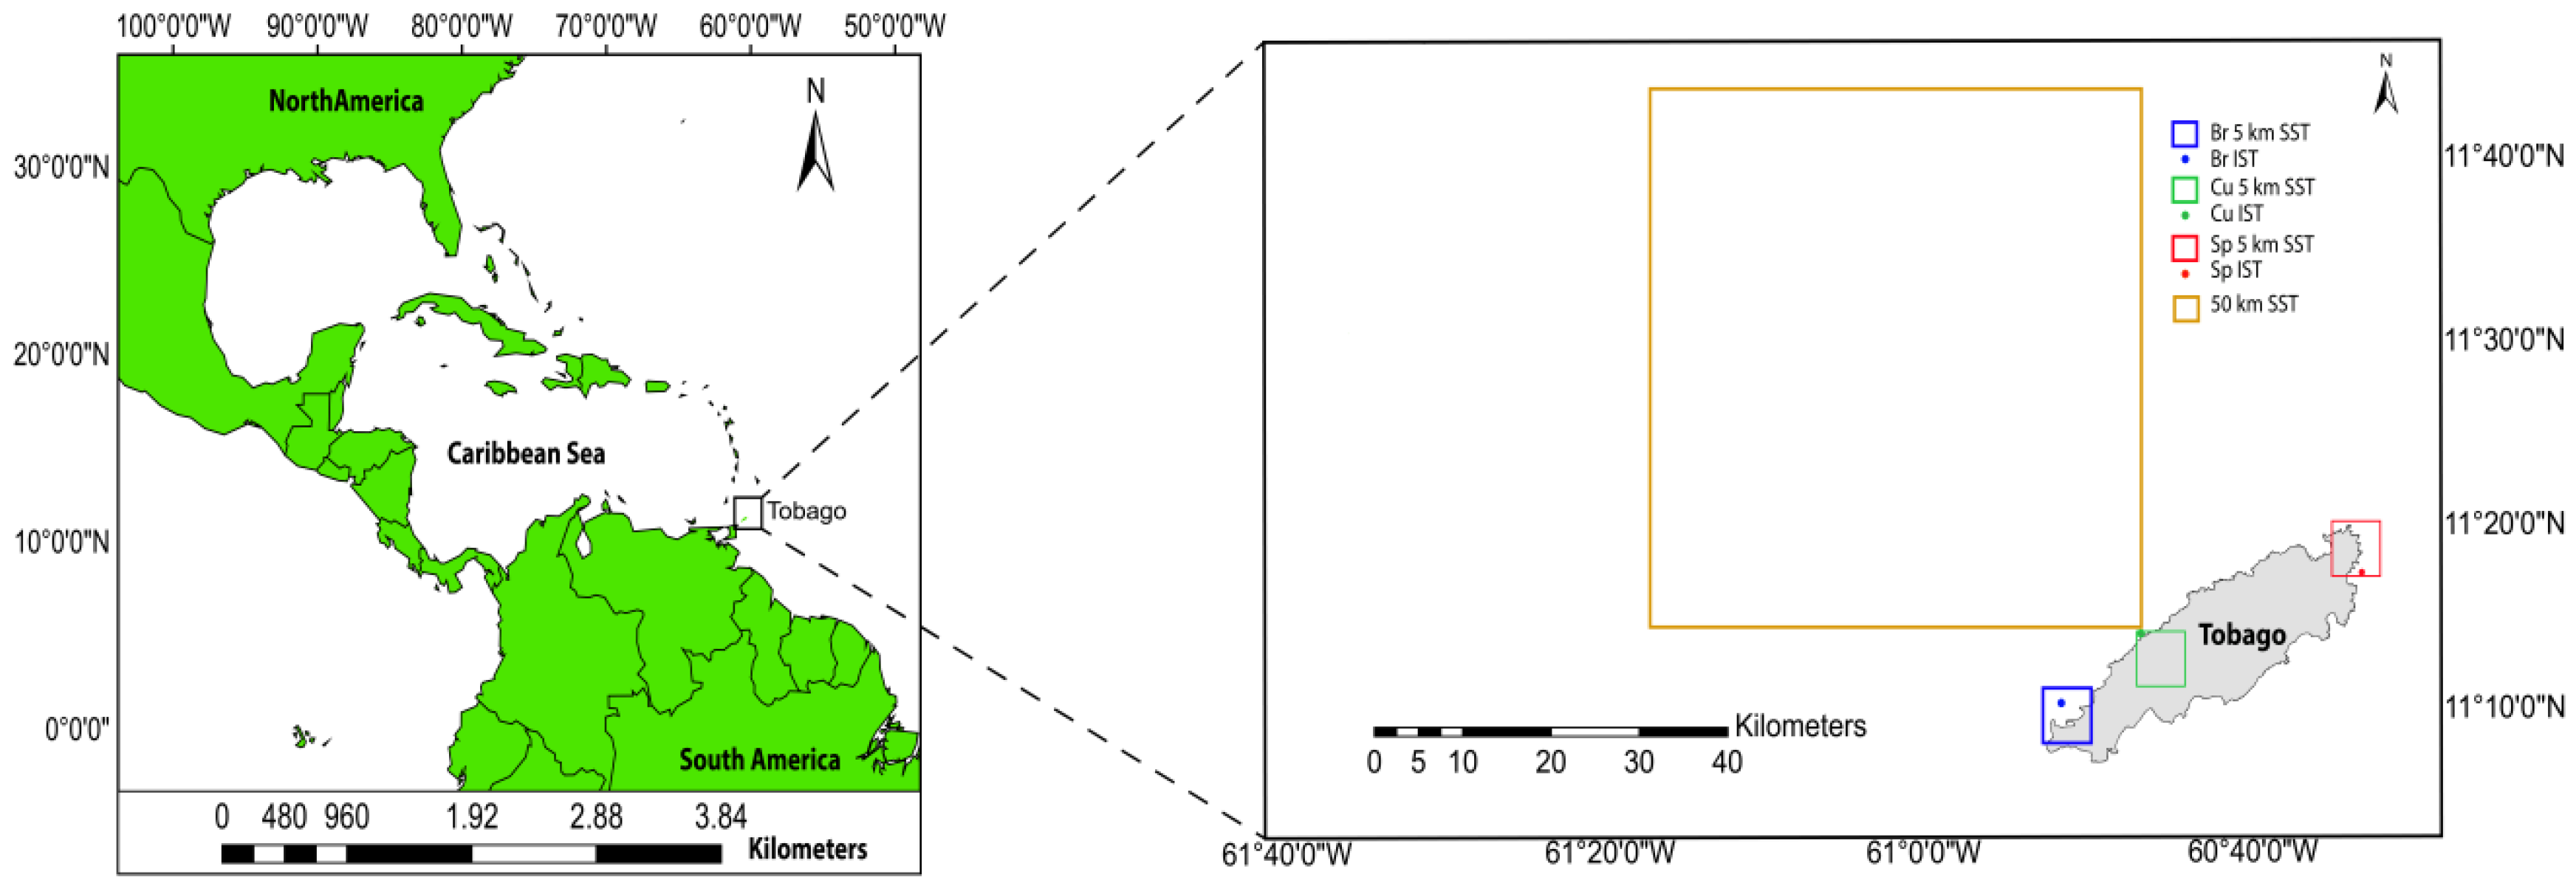
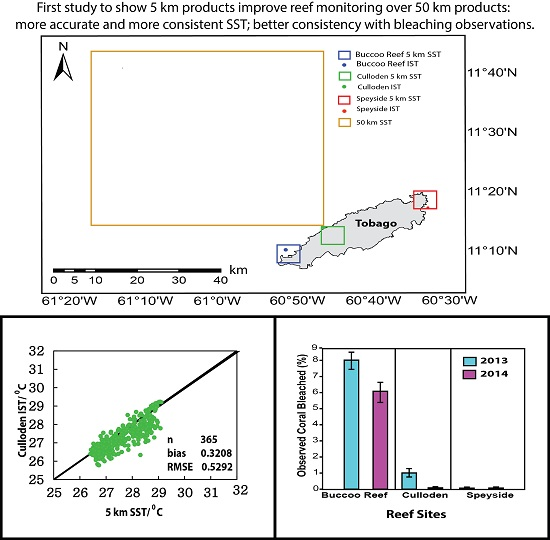
Study Area
2. Experimental Section
2.1. Satellite Data
2.2. In Situ Data

| Buccoo Reef | Culloden | Speyside | |
|---|---|---|---|
| 50 km SST | 11.5° N | 11.5° N | 11.5° N |
| 61.0° W | 61.0° W | 61.0° W | |
| 5 km SST | 11.175° N | 11.225° N | 11.325° N |
| 60.825° W | 60.725° W | 60.525° W | |
| IST at 5 m depth | 11.18689° N | 11.24894° N | 11.30225° N |
| 60.83178° W | 60.74867° W | 60.51944° W |
2.3. In Situ and Satellite Data Comparison
2.4. Calculated Thermal Stress Variations Using 50 km and 5 km SST Datasets
2.5. Bleaching Surveys
| Buccoo Reef | Culloden | Speyside |
|---|---|---|
| Diploria strigosa (1) | Diplora strigosa (5) | Agaricia lamarcki (1) |
| Millepora alcicornis (1) | Montastraea cavernosa (2) | Diploria strigosa (3) |
| Montastraea annularis (6) | Montastraea faveolata (2) | Millepora alcicornis (1) |
| Porites porites (1) | Porites astreoides (1) | Millepora complanata (1) |
| Siderastrea radians (1) | Porites porites (2) | |
| Siderastrea radians (2) |
3. Results and Discussion
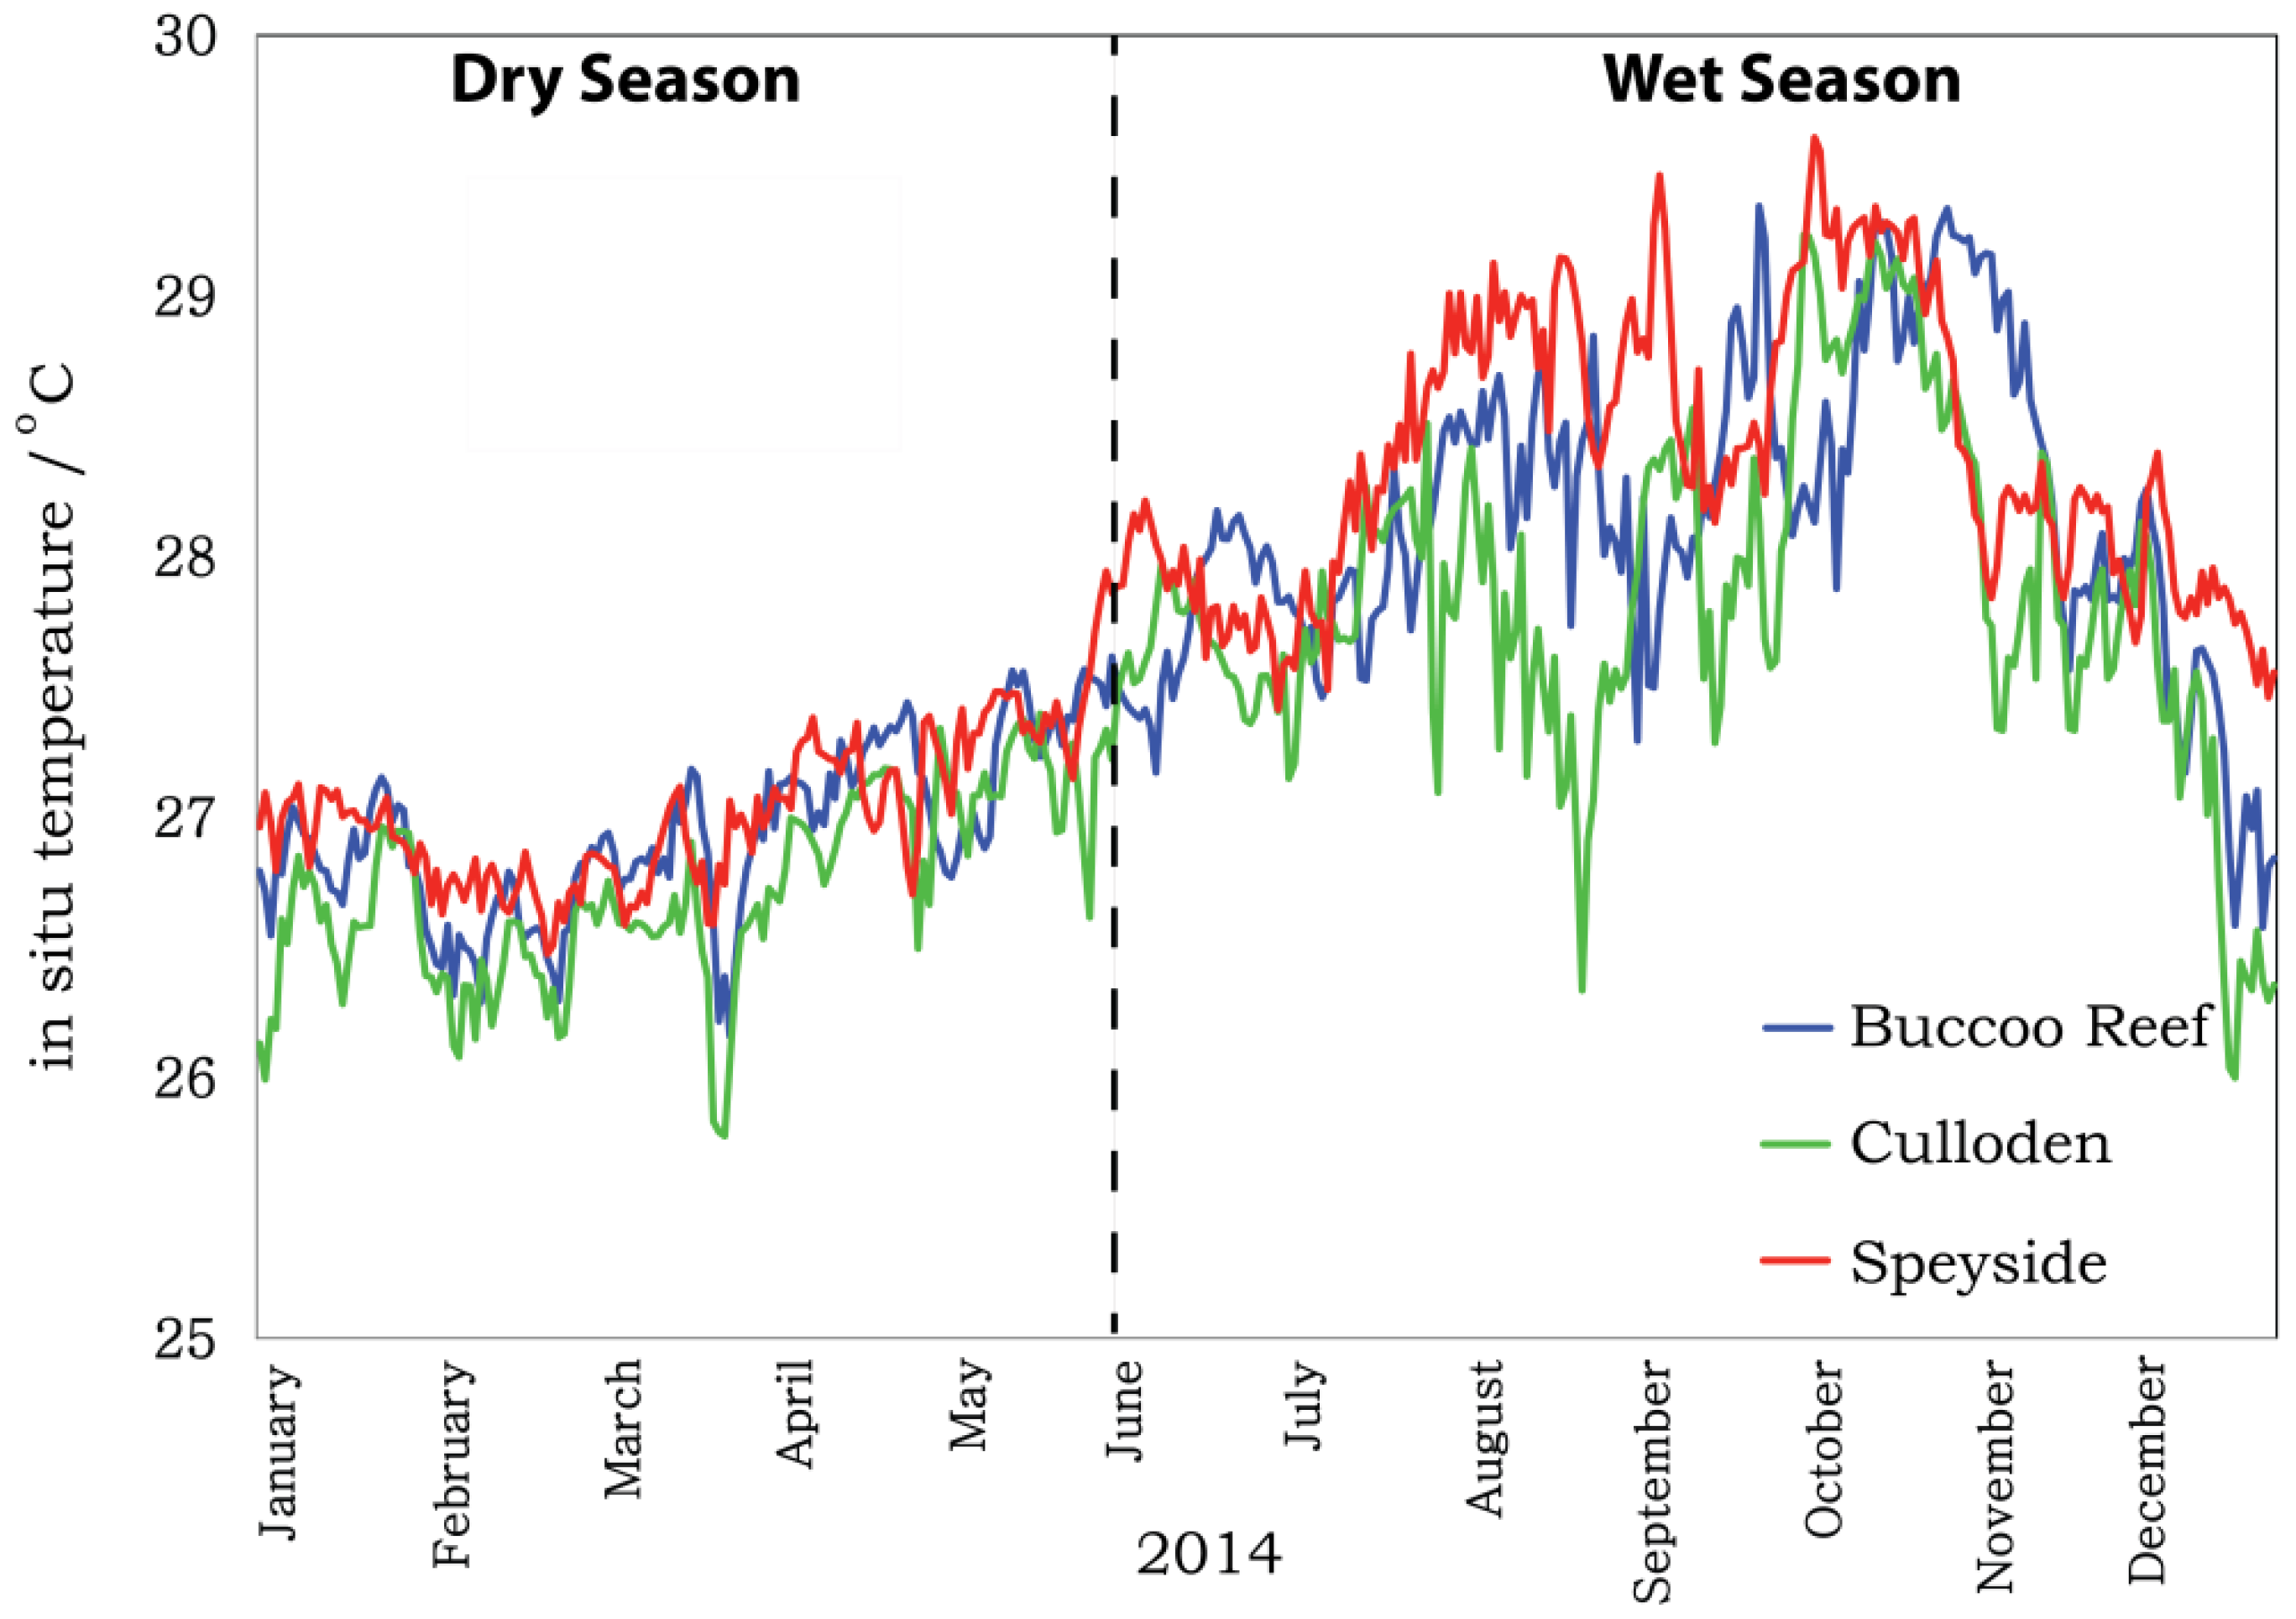
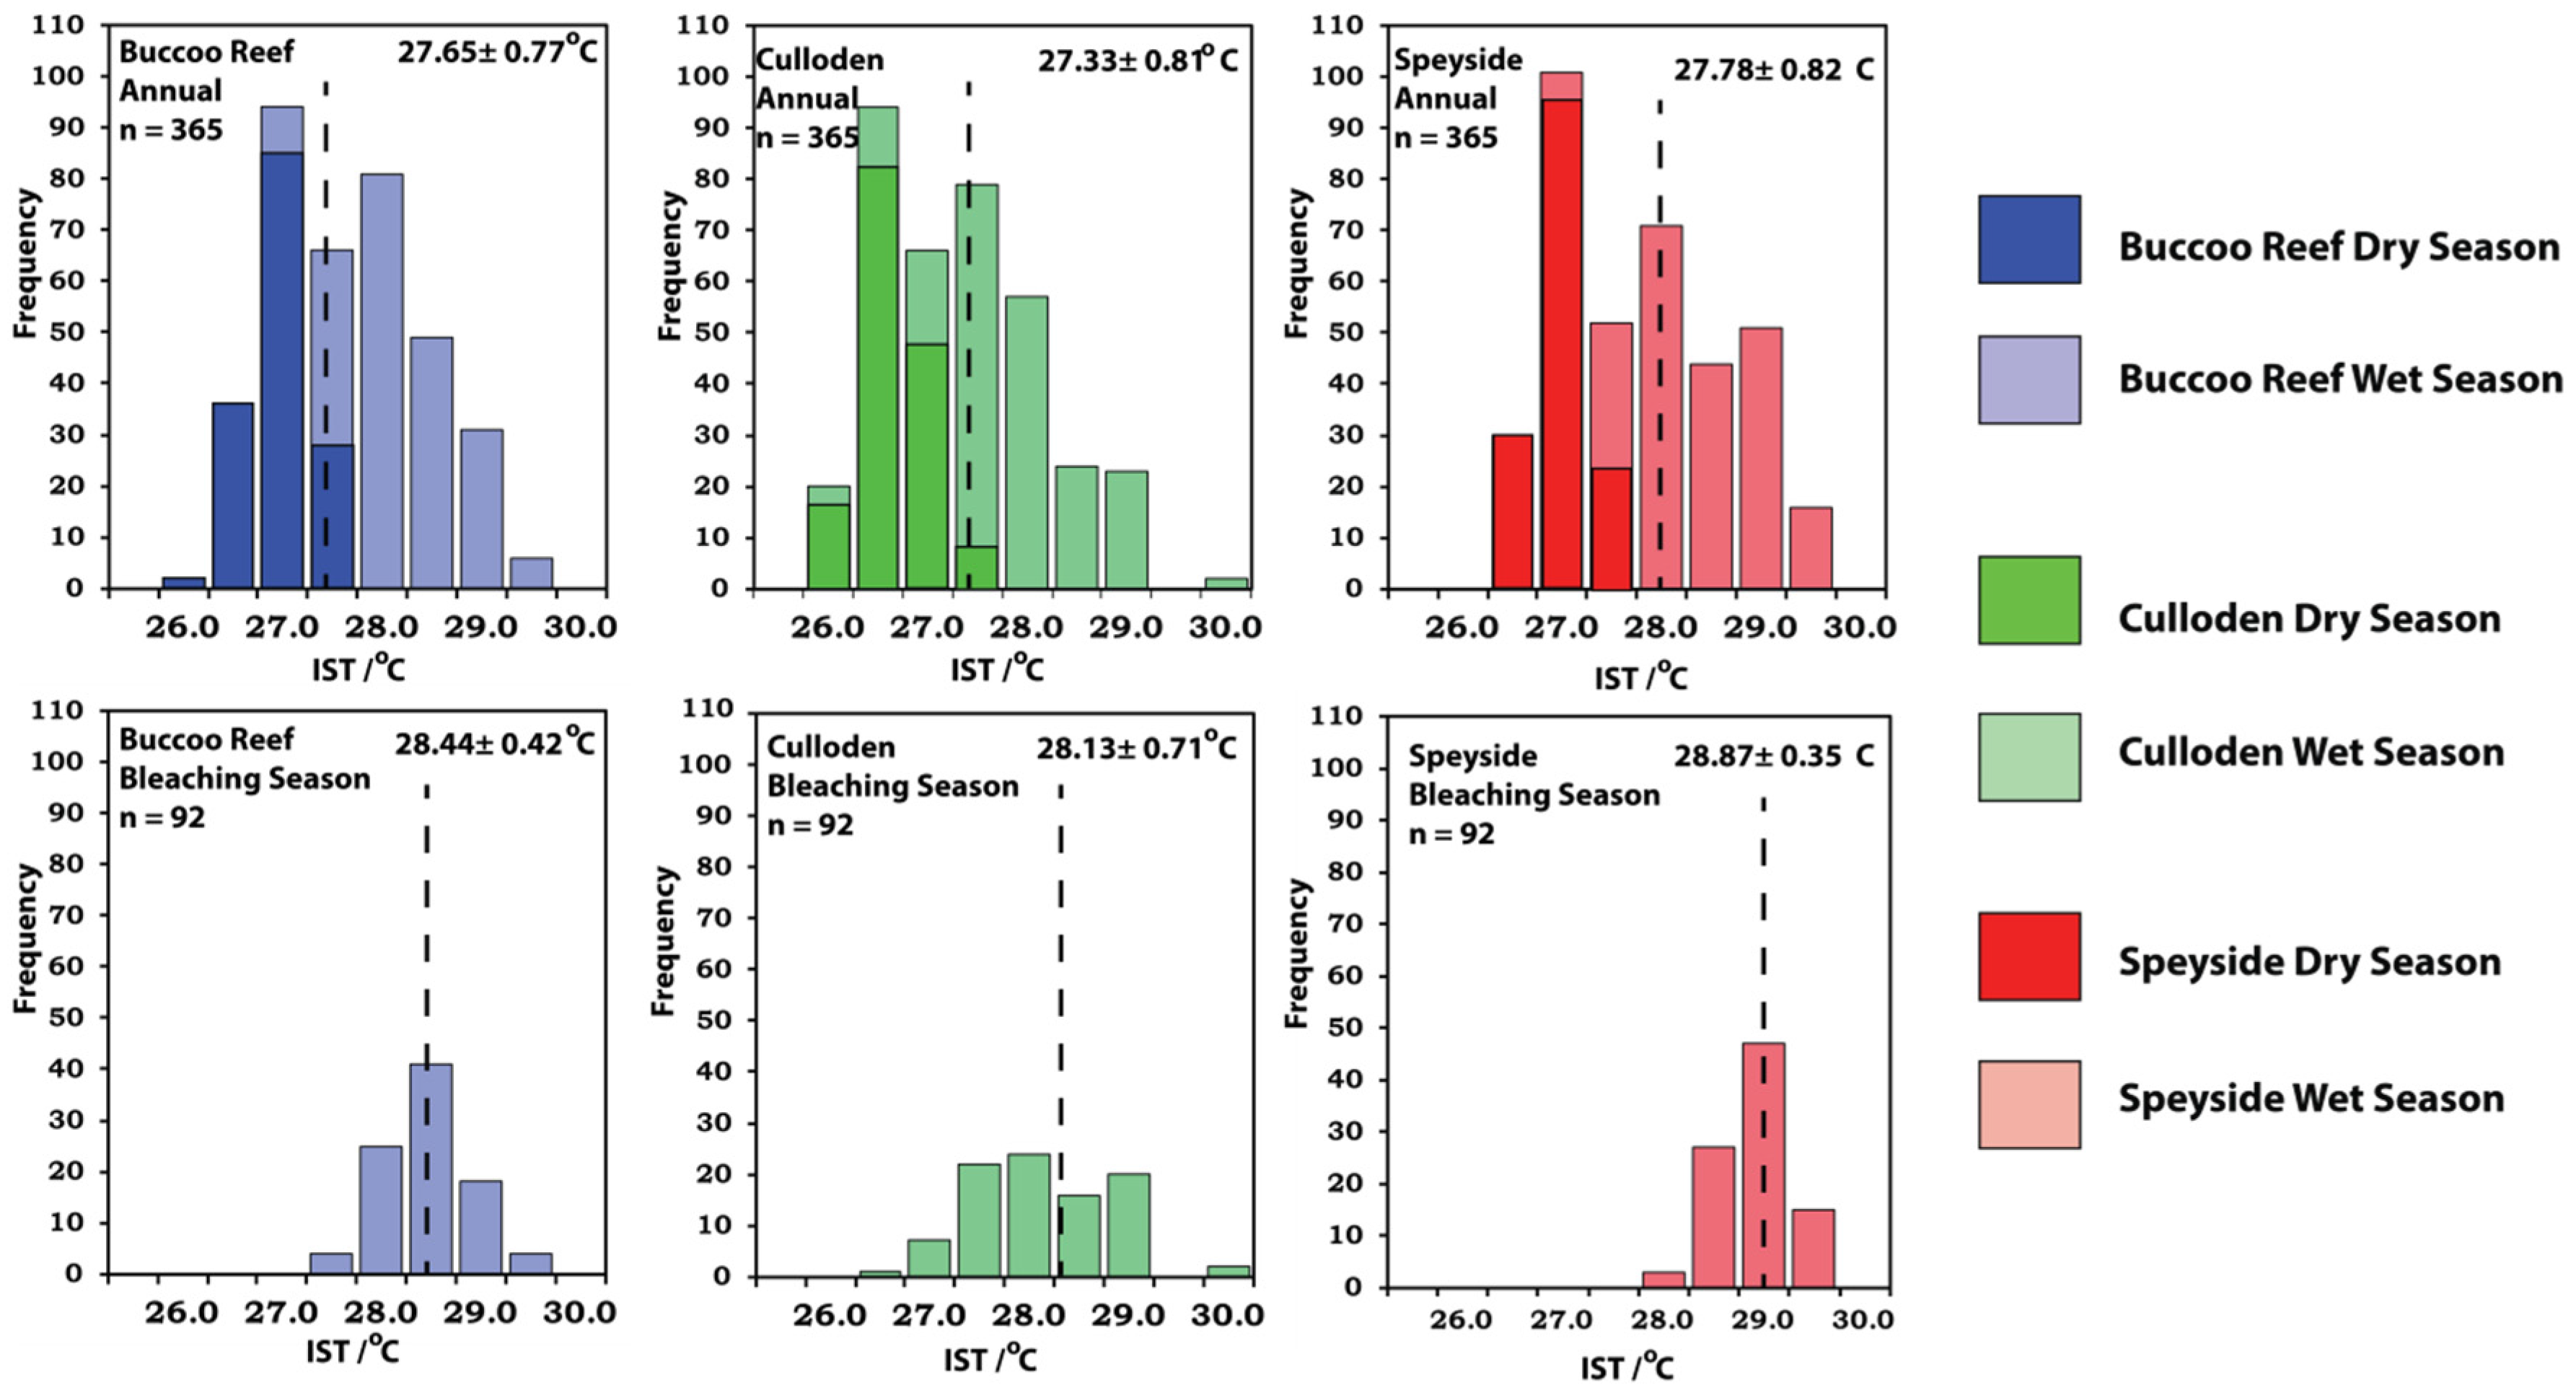
3.1. In Situ Water Temperature during 2014 for Buccoo Reef, Culloden and Speyside, Tobago

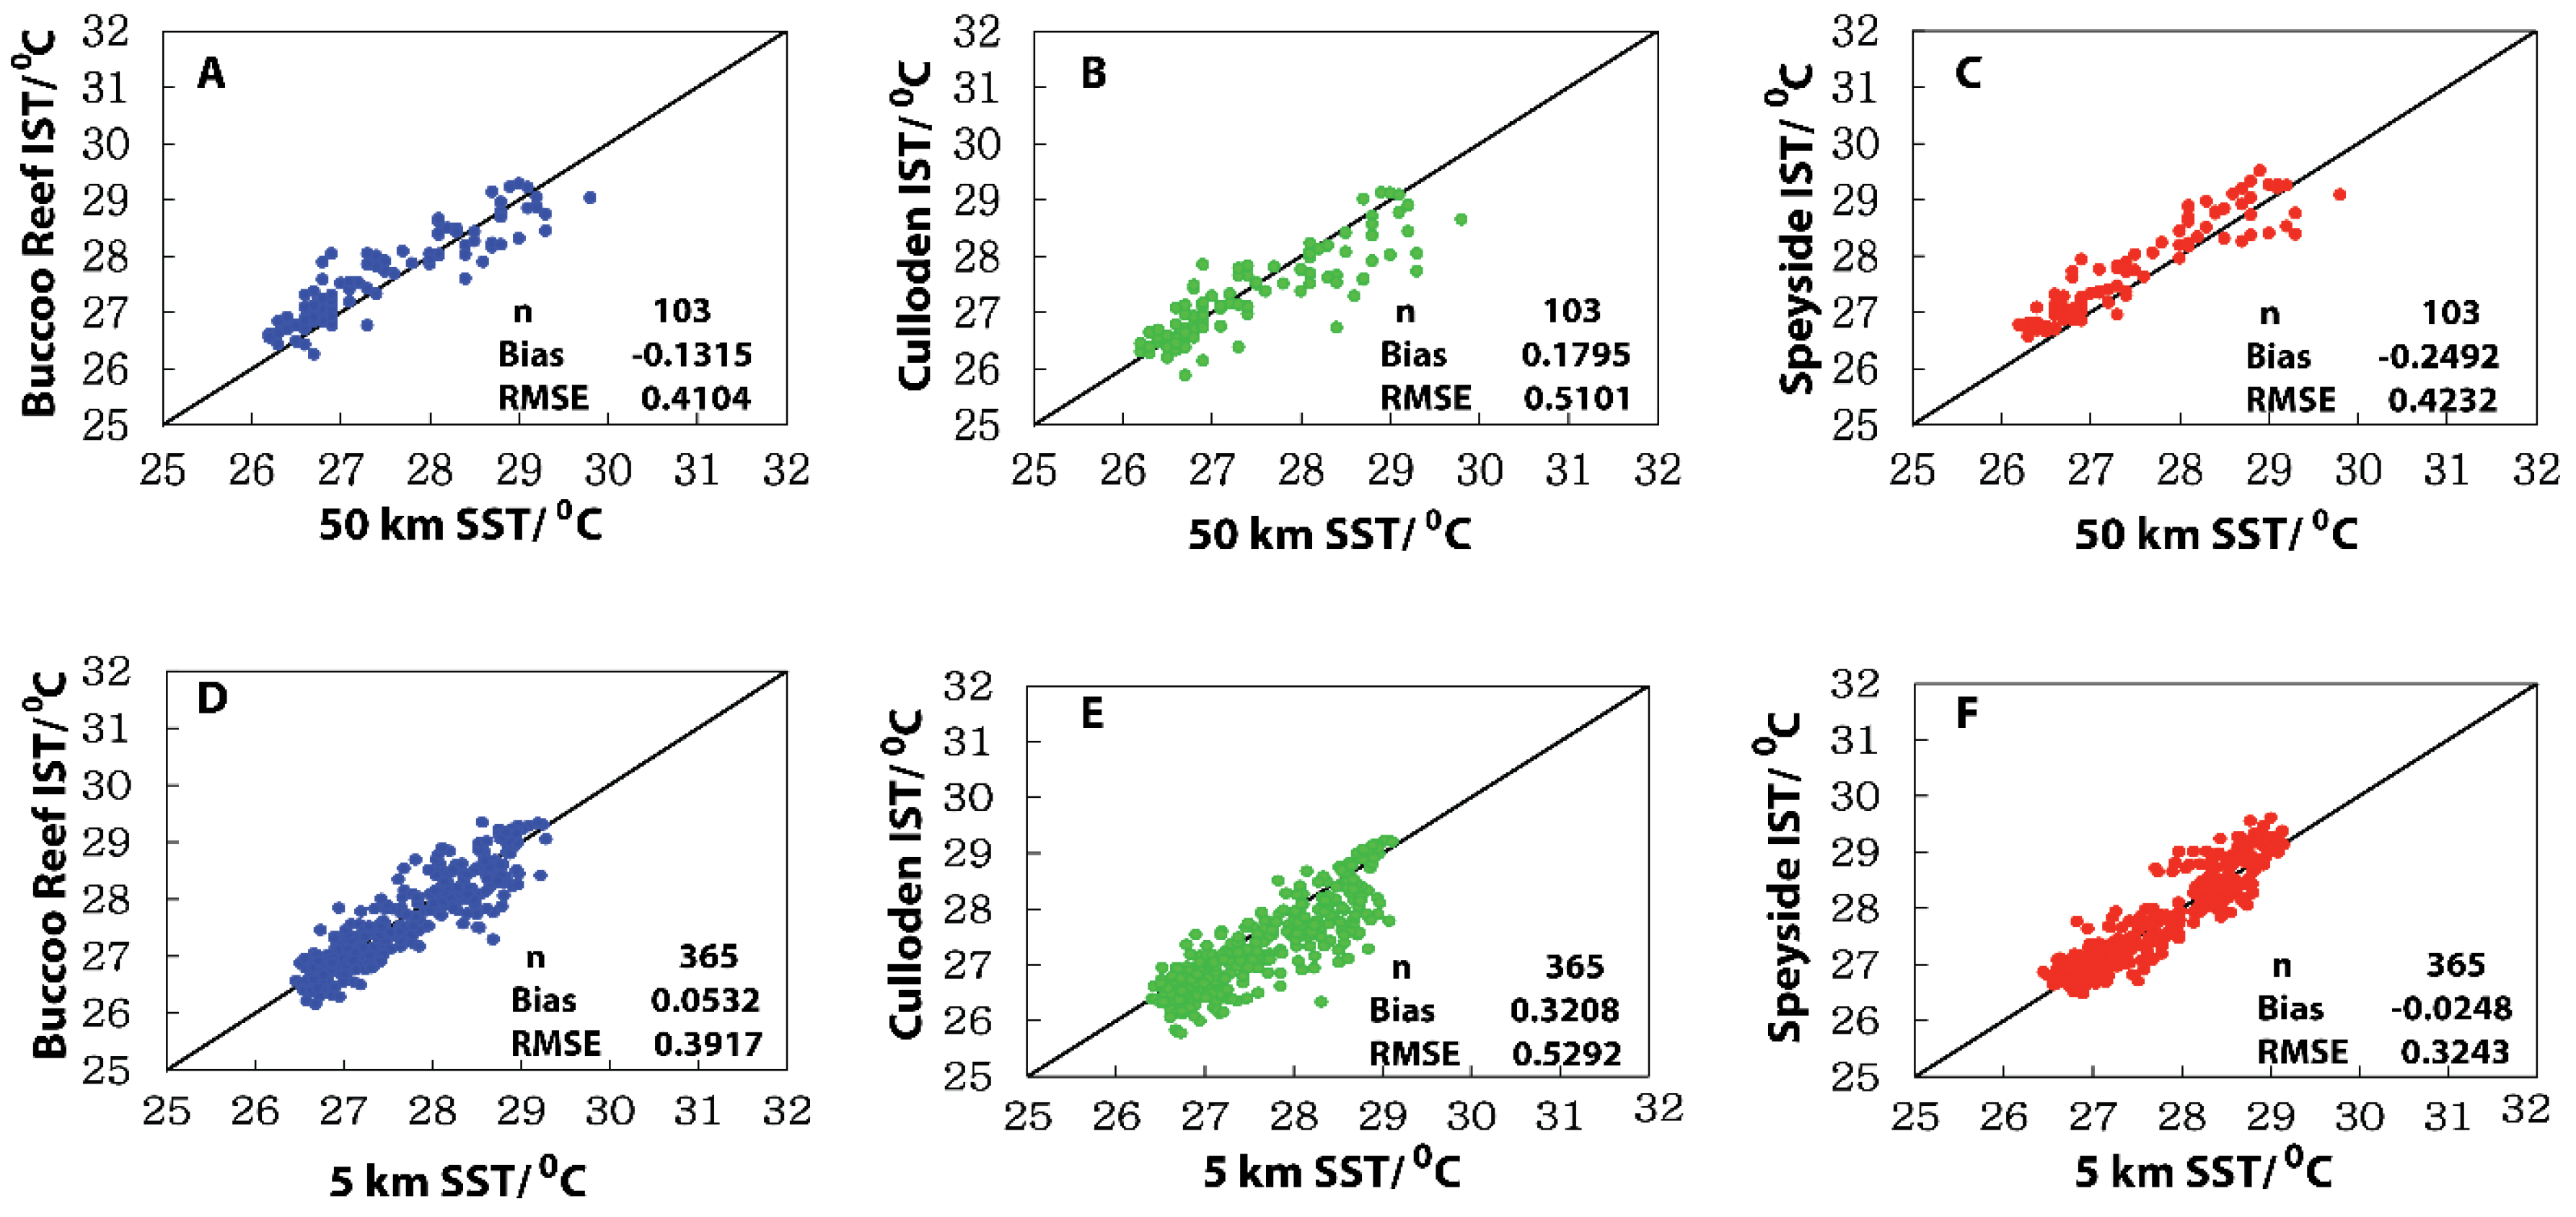
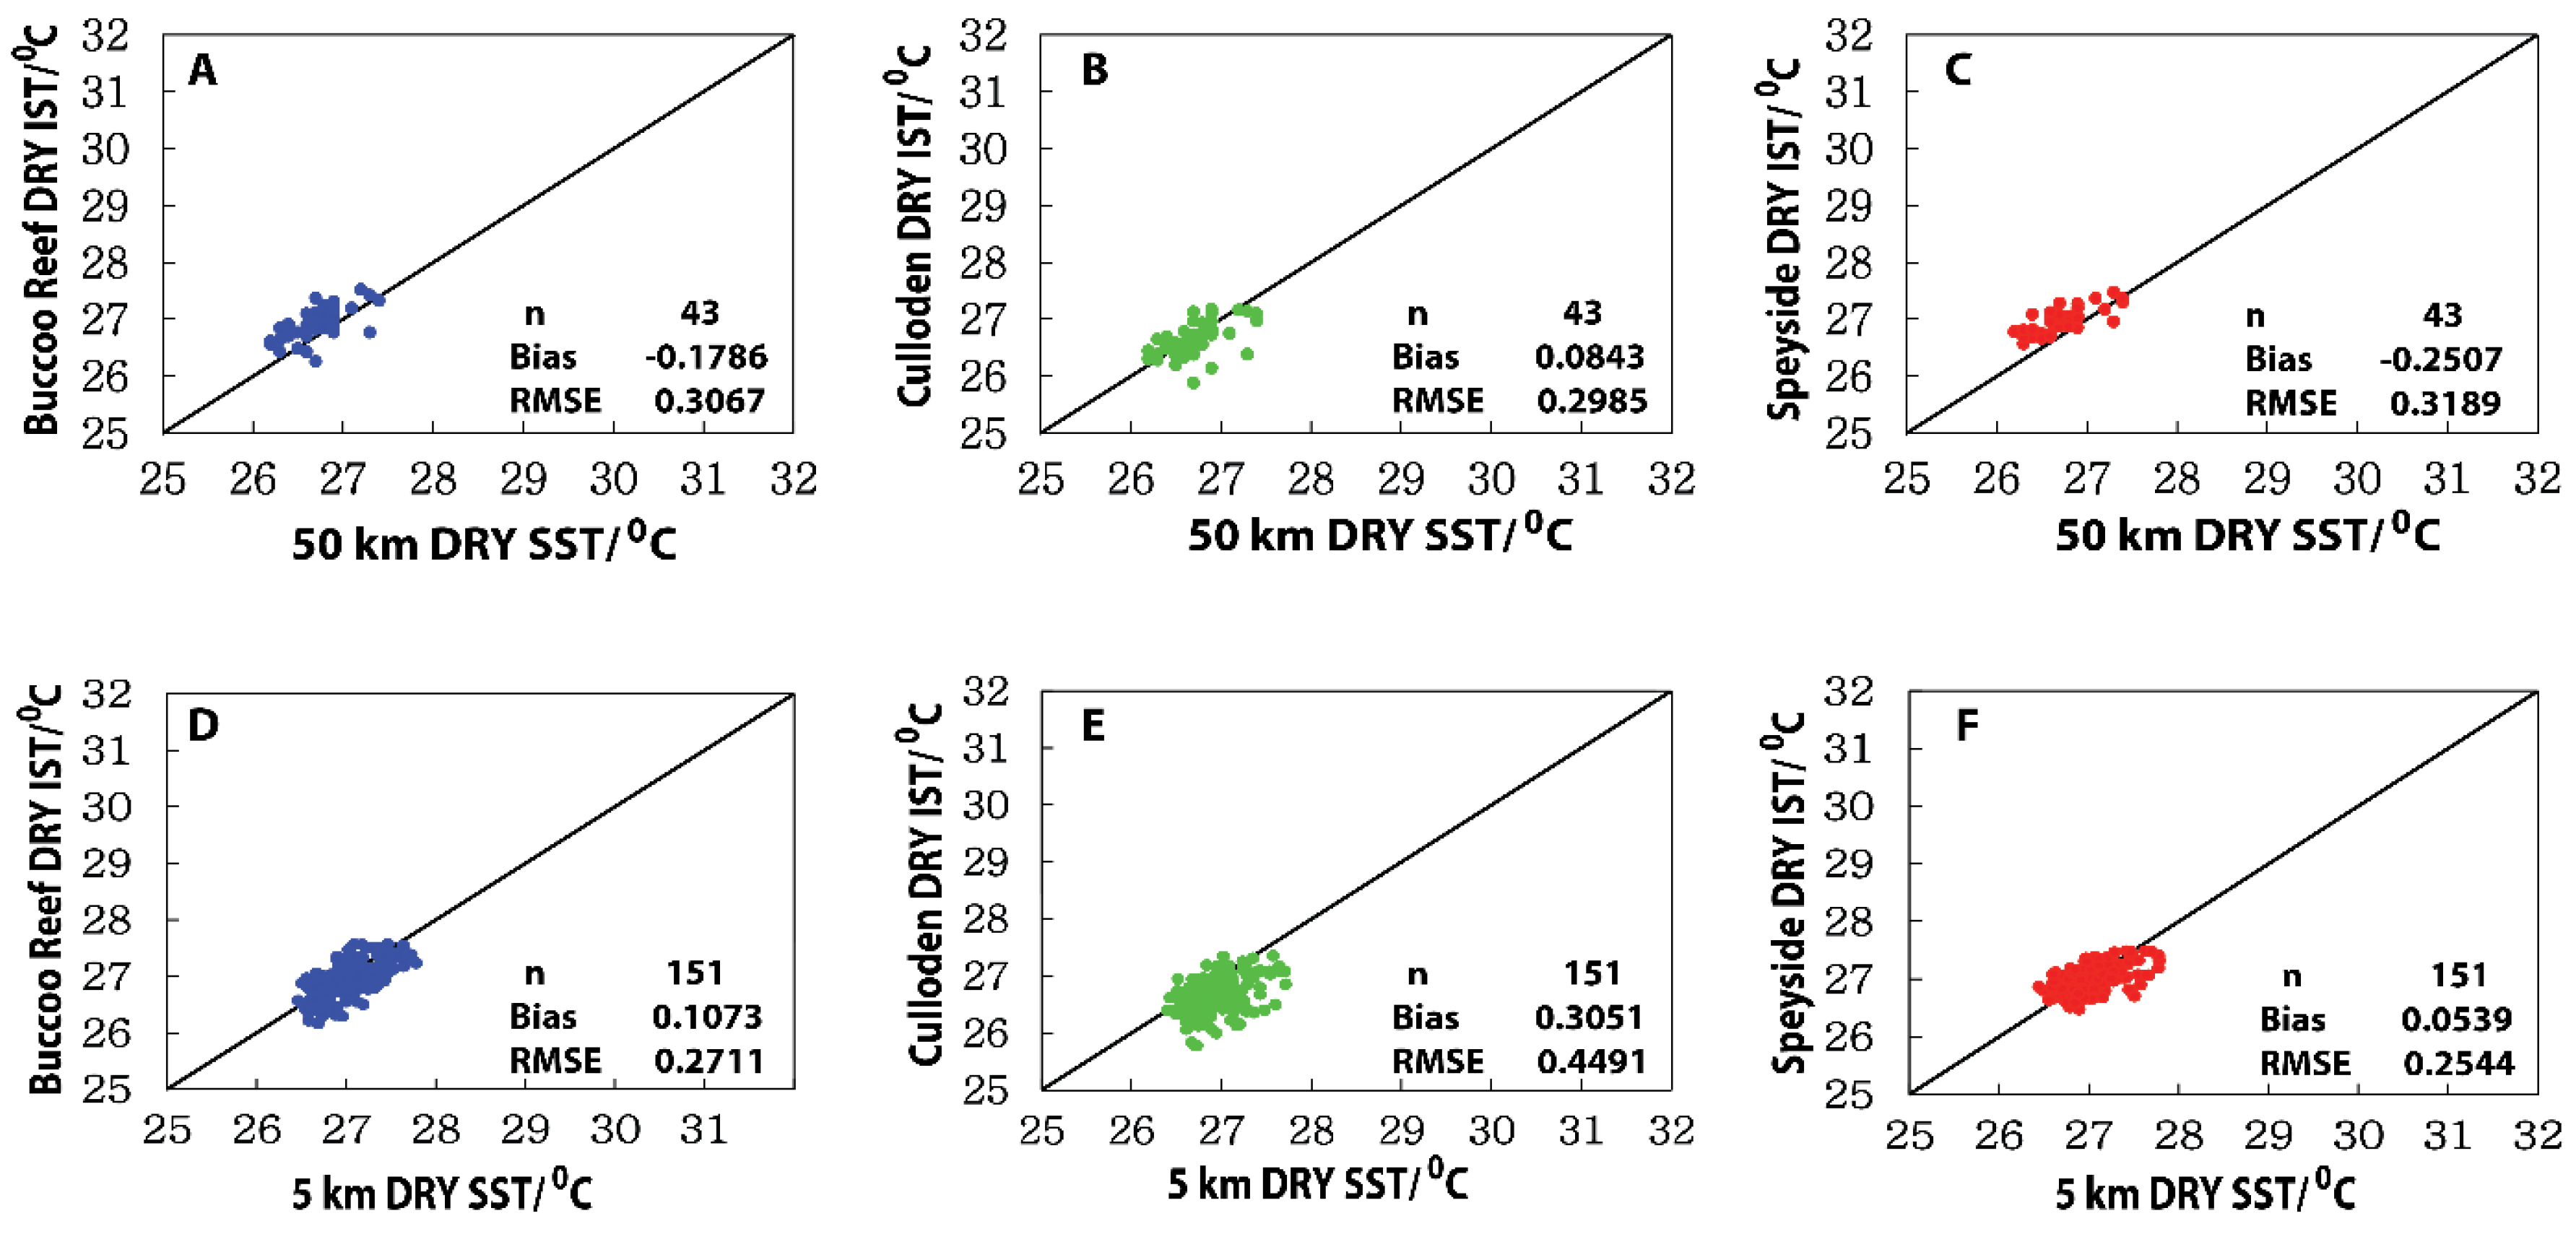
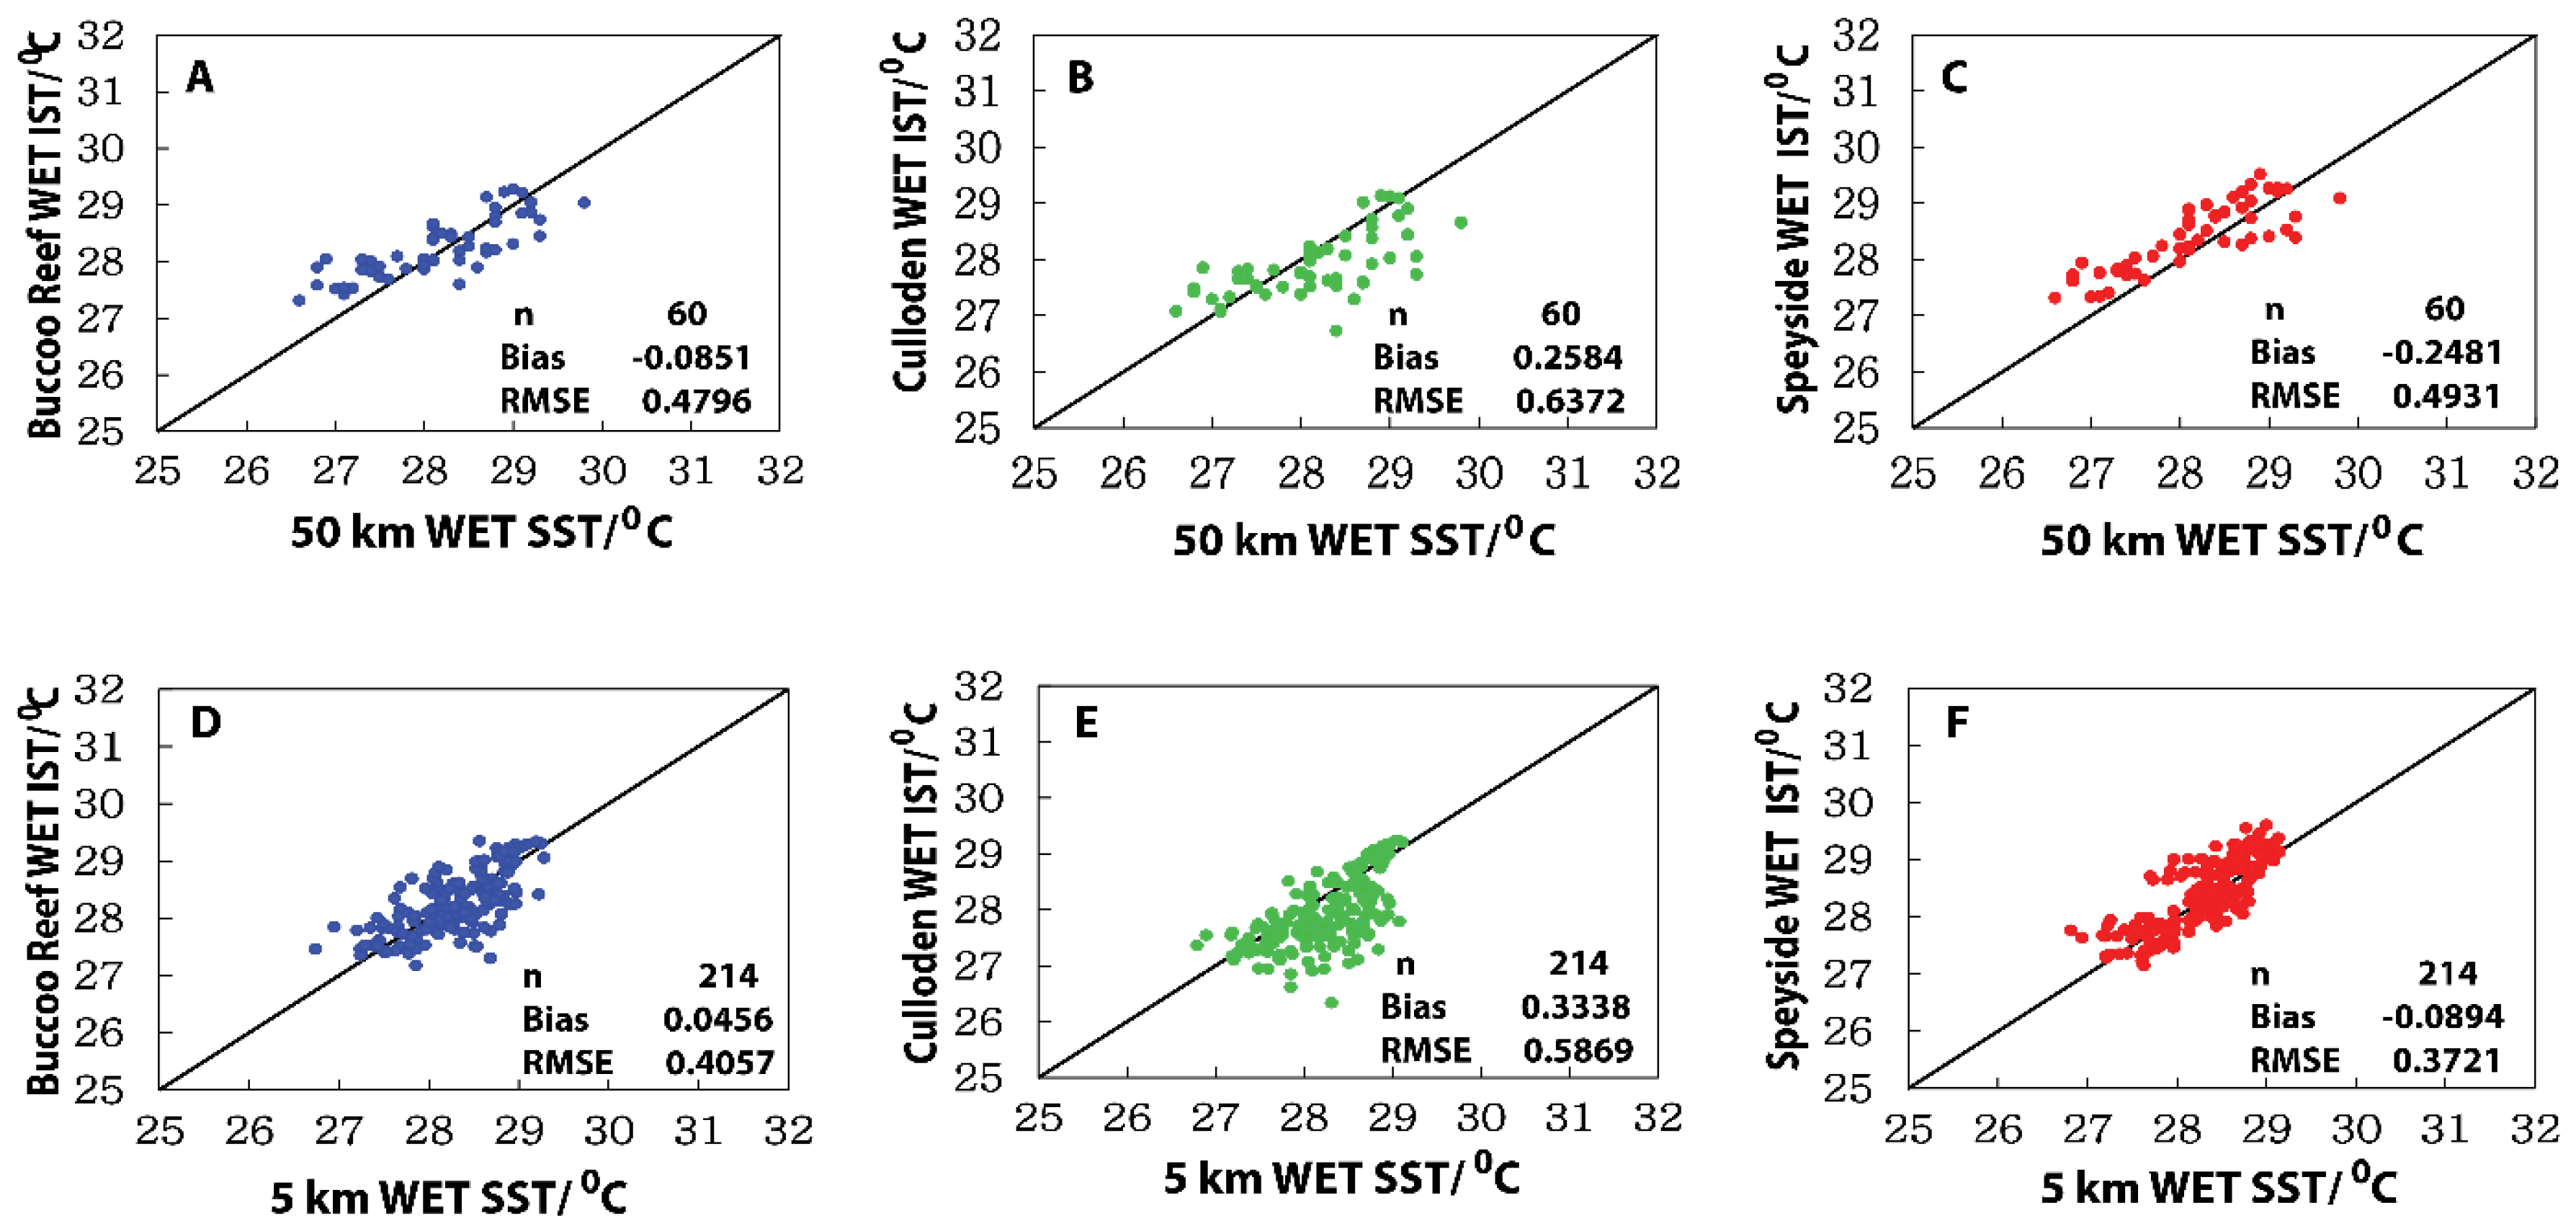
3.2. Comparison of in Situ Temperature with CRW 50 km and 5 km SST Data
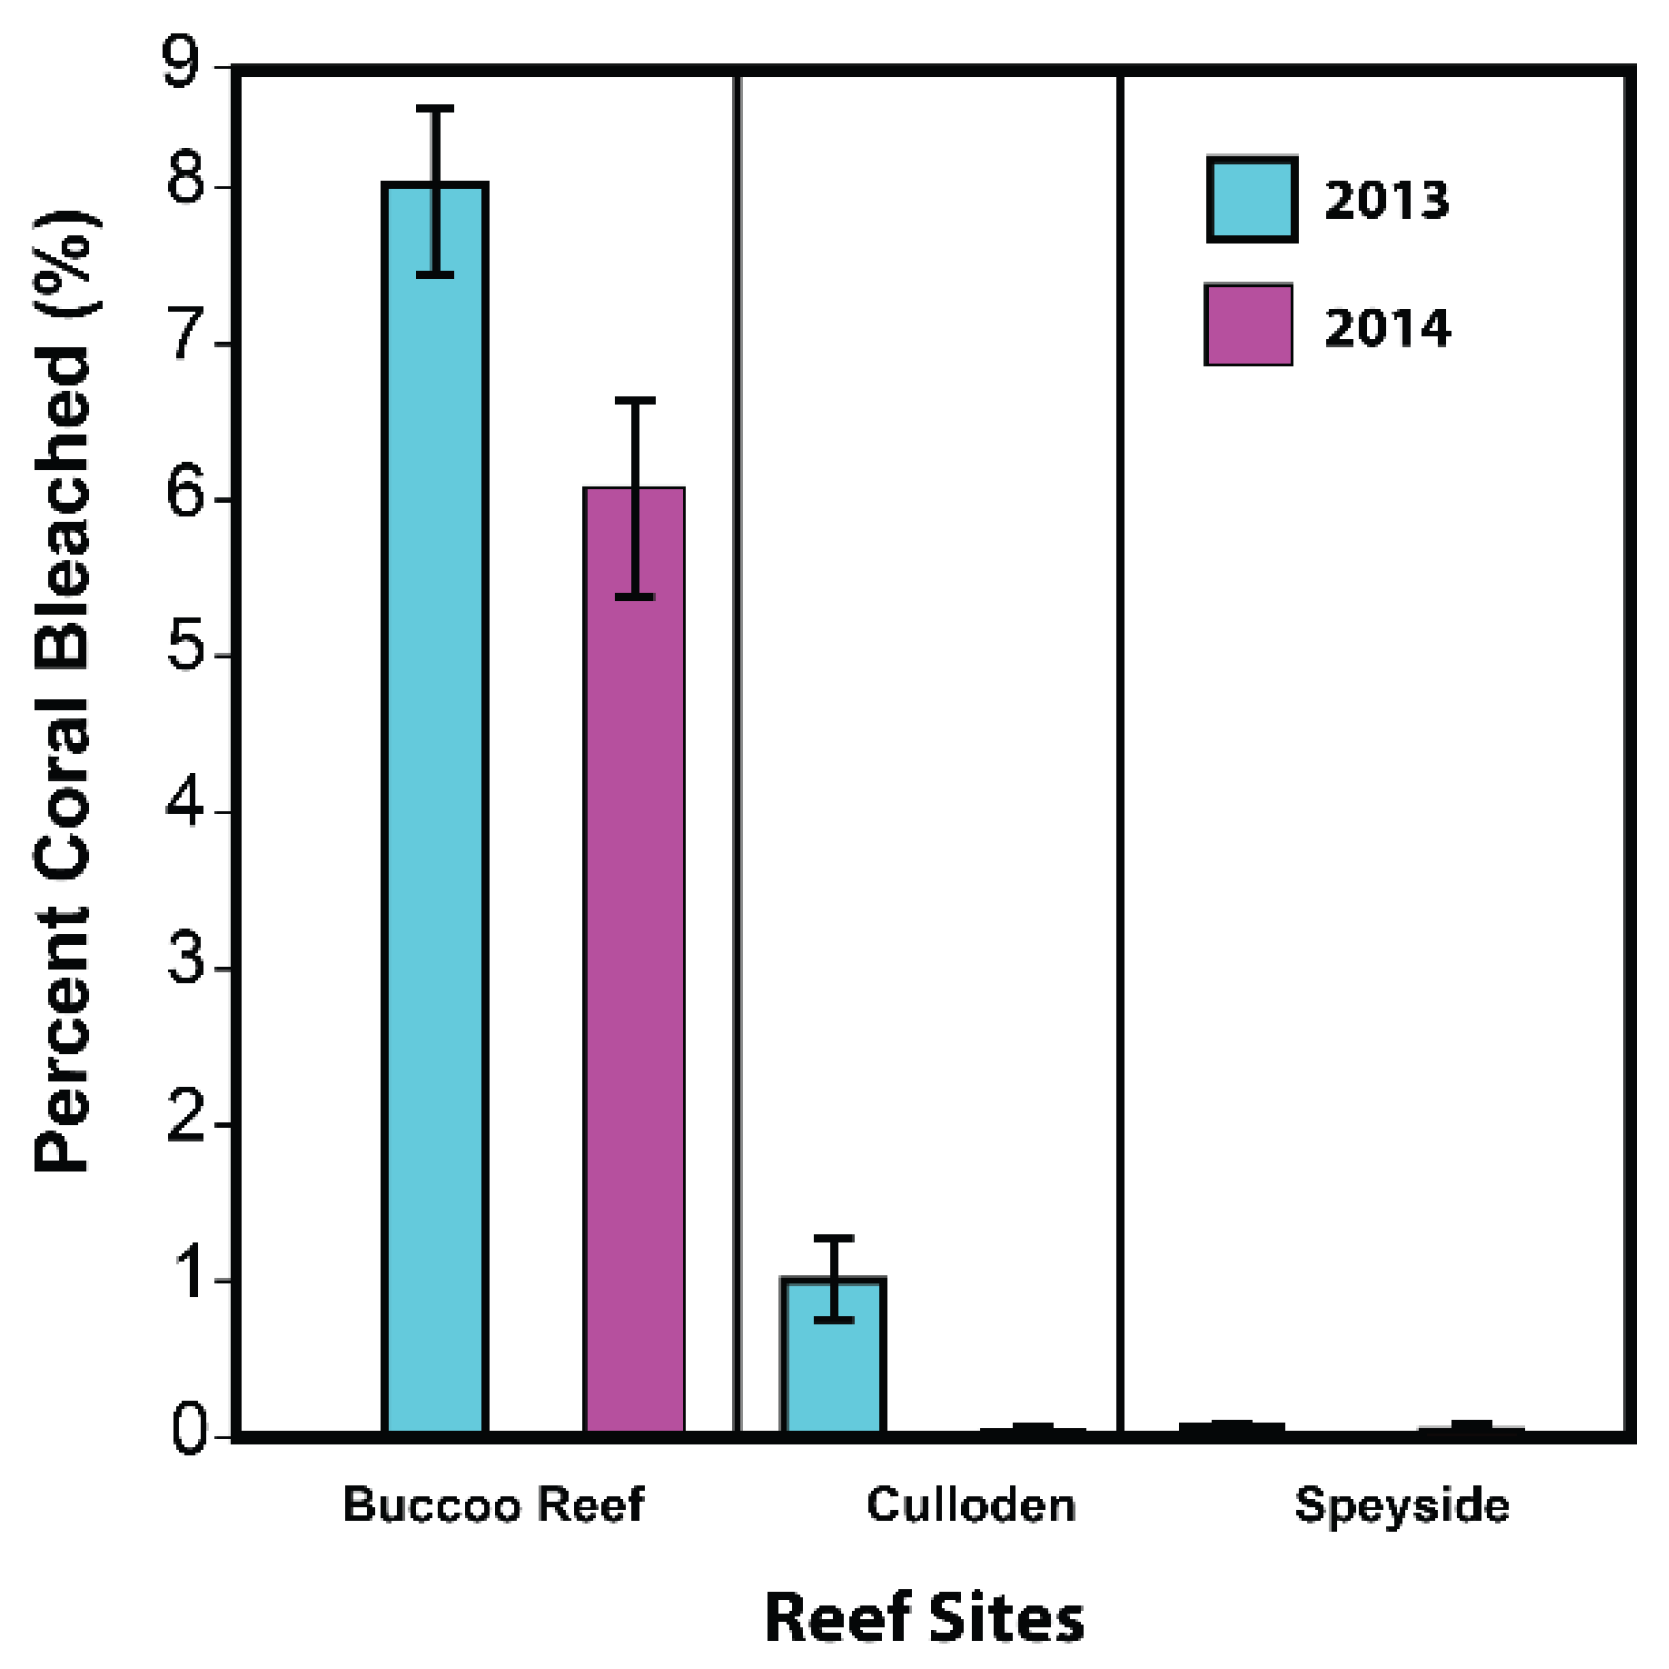
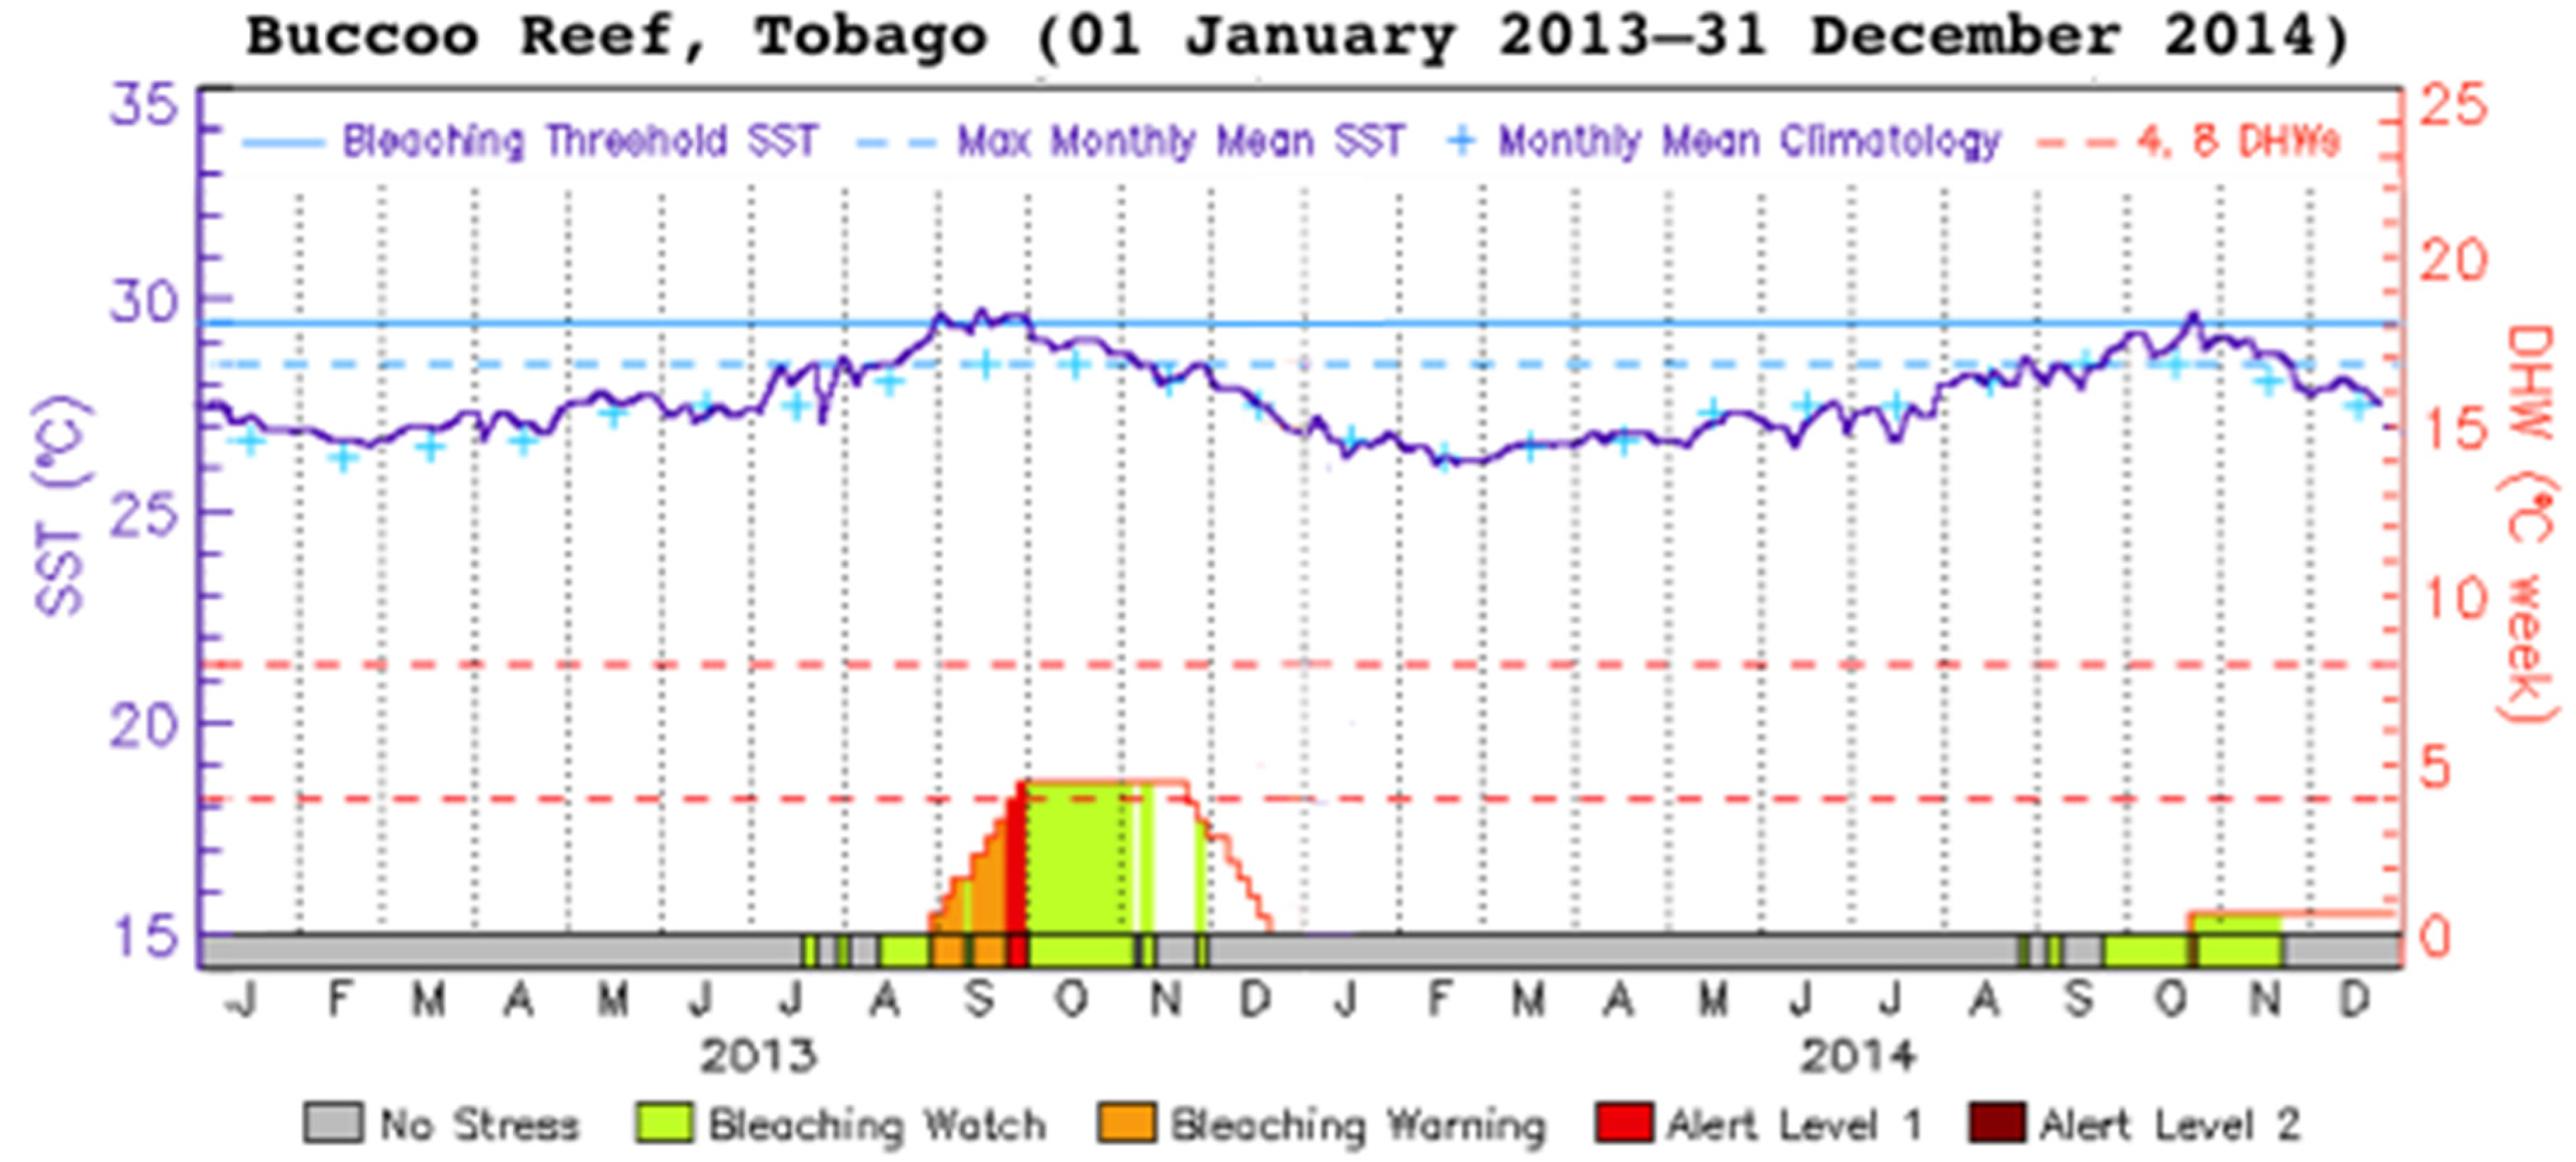
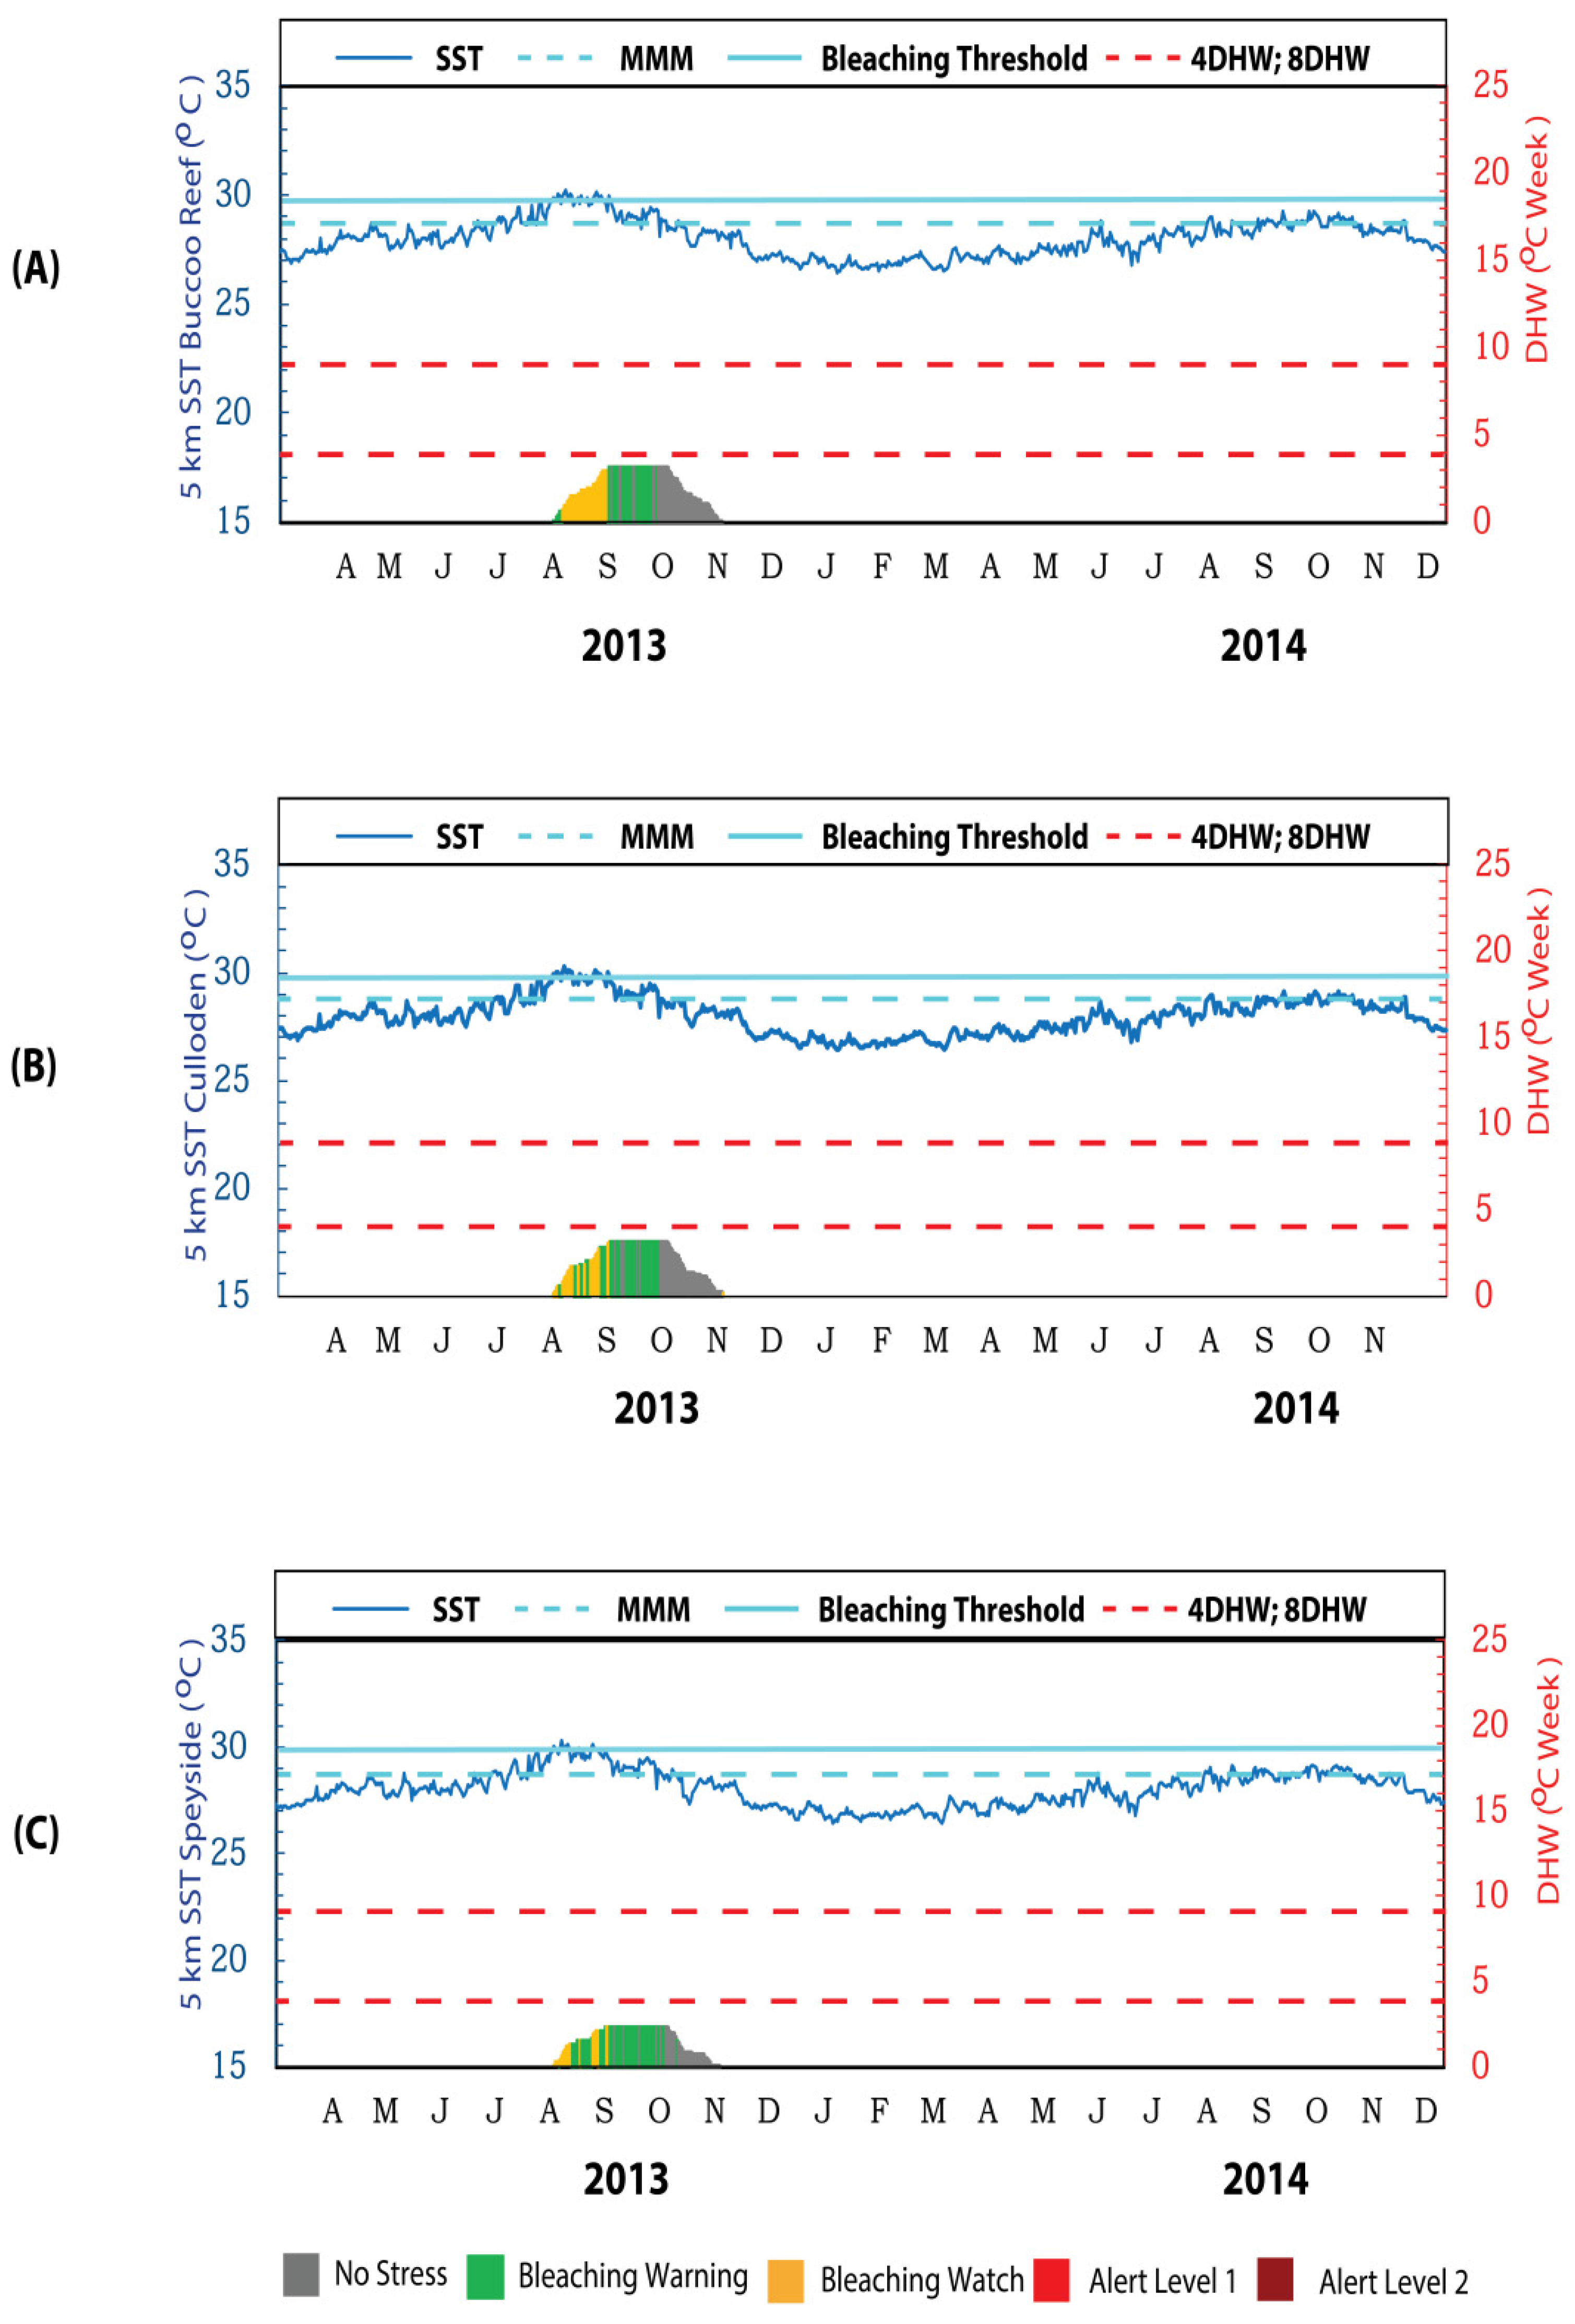
3.3. Coral Bleaching Surveys and Thermal Stress Products for the Southern Caribbean

4. Conclusions
Acknowledgments
Author Contributions
Conflicts of Interest
References
- Fitt, W.K.; Brown, B.E.; Warner, M.E.; Dunne, R.P. Coral bleaching: Interpretation of thermal tolerance limits and thermal thresholds in tropical corals. Coral Reefs 2001, 20, 51–65. [Google Scholar] [CrossRef]
- Guest, J.R.; Baird, A.H.; Maynard, J.A.; Muttaquin, E.; Edwards, J.A.; Campbell, J.A.; Yewdall, K.; Affendi, Y.A.; Chou, L.M. Contrasting patterns of coral bleaching susceptibility in 2010 suggest an adaptive response to thermal stress. PLoS ONE 2010, 7, 1–8. [Google Scholar] [CrossRef] [PubMed]
- Graham, N.A.J.; Wilson, K.A.; Jennings, S.; Polunin, N.V.C.; Robinson, J.; Bijoux, J.P.; Daw, T.M. Lag effects in the impacts of mass coral bleaching on coral reef fish, fisheries and ecosystems. Conserv. Biol. 2006. [Google Scholar] [CrossRef] [PubMed]
- Pratchett, M.S.; Hoey, A.S.; Wilson, S.K.; Messmer, V.; Grahan, N.A.J. Changes in biodiversity and functioning of reef fish assemblages following coral bleaching and coral loss. Diversity 2011, 3, 424–452. [Google Scholar] [CrossRef]
- Mallela, J.; Parkinson, R.; Day, O. An Assessment of Coral Reefs in Tobago. Caribb. J. Sci. 2010, 46, 83–87. Available online: https://scholar.google.com/scholar?q=An+assessment+of+coral+reefs+in+Tobago (accessed on 3 June 2015). [Google Scholar]
- Doshi, A.; Pascoe, S.; Thébaud, O.; Thomas, C.R.; Setiashi, N.; Hong, J.T.C.; True, J.; Schuttenberg, H.Z.; Heron, S.F. Lost of economic value for coral bleaching in S.E. Asia. In Proceedings of the 12th International Coral Reef Symposium, Cairns, QLD, Australia, 9–13 July 2012.
- Liu, G.; Eakin, M.C.; Rauenzahn, J.L.; Christensen, T.R.L.; Heron, S.F.; Li, J.; Skirving, W.; Strong, A.E.; Burgess, T. NOAA coral reef watch’s decision support system for coral reef management. In Proceedings of the 12th International Coral Reef Symposium, Cairns, QLD, Australia, 9–13 July 2012.
- McClanahan, T.R.; Ateweberhan, M.; Muhando, C.A.; Maina, J.; Mohammed, S. Effects of climate and seawater temperature variation on coral bleaching and mortality. Ecol. Monogr. 2007, 77, 503–525. [Google Scholar] [CrossRef]
- McClanahan, T.R.; Ateweberhan, M.; Sebastián, C.R.; Graham, N.A.J.; Wilson, S.K.; Bruggeman, J.H.; Guillaume, M.M.M. Predictability of coral bleaching from a synoptic satellite and in situ temperature observations. Coral Reefs 2007, 26, 695–701. [Google Scholar] [CrossRef]
- Andréfouët, S.; Riegl, B. Remote sensing: A key tool for interdisciplinary assessment of coral reef processes. Coral Reefs 2004, 23, 1–4. [Google Scholar] [CrossRef]
- Smale, D.A.; Wernberg, T. Satellite-derived SST data as a proxy for water temperature in nearshore benthic ecology. Mar. Ecol. Prog. Ser. 2009, 387, 27–39. [Google Scholar] [CrossRef]
- Berkelmans, R.; Déath, G.; Kininmonth, S.; Skirving, W.J. A comparison of the 1998 and 2002 coral bleaching events on the Great Barrier Reef: Spatial correlation, patterns and predictions. Coral Reefs 2004, 23, 78–83. [Google Scholar] [CrossRef]
- Donner, S.D.; Skirving, W.J.; Little, C.M.; Oppenheimer, M.; Hoegh-Guldberg, O. Global assessment of coral bleaching and required rates of adaptation under climate change. Glob. Chang. Biol. 2005, 11, 2251–2265. [Google Scholar] [CrossRef]
- Wilkinson, C. Executive summary. In Status of Coral Reefs of the World: 2008; Global Coral Reef Monitoring Network: Townsville, QLD, Austalia, 2008; pp. 5–19. [Google Scholar]
- Strong, A.E.; Liu, G.; Meyer, J.; Hendee, J.C.; Sasko, D. Coral Reef Watch 2002. Bull. Mar. Sci. 2004, 75, 259–268. [Google Scholar]
- Skirving, W.J.; String, A.E.; Liu, G.; Liu, C.; Arzayus, F.; Sapper, J.; Bayler, E. Extreme events and perturbations of coastal ecosystems. In Remote Sensing of Aquatic Coastal Ecosystem Processes, 1st ed.; Richardson, L.L., LeDrew, E.F., Eds.; Springer: Dordrecht, The Netherlands, 2006; pp. 11–23. [Google Scholar]
- Heron, S.F.; Heron, M.L.; Pichel, W.G. Thermal and radar. In Coral Reef Remote Sensing: A Guide for Mapping, Monitoring and Management, 1st ed.; Goodman, J.A., Purkis, S.J., Phinn, S.R., Eds.; Springer: New York, NY, USA, 2013; pp. 285–312. [Google Scholar]
- Liu, G.; Strong, A.E.; Skirving, W. Remote sensing of sea surface temperature during 2002 Barrier Reef Coral Bleaching. Eos Trans. Am. Geophys. Union 2003, 84, 137–144. Available online: http://onlinelibrary.wiley.com/doi/10.1029/2003EO150001/pdf (accessed on 25 June 2015). [Google Scholar] [CrossRef]
- Eakin, C.M.; Lough, J.M.; Heron, S.F. Climate variability and change: Monitoring data and evidence for increased coral bleaching stress. In Coral Bleaching, 1st ed.; van Oppen, M.J.H., Lough, J.M., Eds.; Springer: Berlin, Germany, 2005; pp. 41–67. [Google Scholar]
- Strong, A.E.; Liu, G.; Kimura, T.; Yamano, H.; Tschuiya, M.; Kakuma, S.; vanWoesik, R. Detecting and monitoring 2001 coral reef bleaching events in Ryuku Islands, Japan using satellite bleaching hotspot remote sensing technique. In Proceedings of the Geoscience and Remote Sensing Symposium, Toronto, ON, Canada, 24–28 June 2002.
- Eakin, M.C.; Morgan, J.A.; Heron, S.F.; Smith, T.B.; Liu, G.; Alverez-Filip, L.; Baca, B.; Bartels, E.; Bastida, C.; Bouchon, C.; et al. Caribbean Corals in Crisis: Record Thermal Stress, Bleaching, and Mortality in 2005. PLoS ONE 2010, 5, 1–9. [Google Scholar] [CrossRef] [PubMed]
- Mumby, P.J.; Skirving, W.; Strong, A.E.; Hardy, J.T.; LeDrew, E.F.; Hochberg, E.J.; Stumpf, R.P.; David, L.T. Remote Sensing of coral reefs and their physical environment. Mar. Pollut. Bull. 2004, 48, 219–228. [Google Scholar] [CrossRef] [PubMed]
- Liu, G.; Eakin, M.C.; Muller-Karger, F.E.; Vega-Rodrigues, M.; Guild, L.S.; de La Cour, J.L.; Geiger, E.F.; Skriving, W.J.; Burgess, T.F.R.; et al. Reef-Scale thermal stress monitoring of coral ecosystems: New 5-km global products from NOAA coral reef watch. Remote Sens. 2014, 6, 11579–11606. [Google Scholar] [CrossRef]
- Liu, G.; Heron, S.F.; Eakin, M.C.; Rauenzahn, J.L.; Geiger, E.F.; Skirving, W.J.; Burgess, T.F.R.; Strong, A.E. NOAA coral reef watch next-generation 5 km satellite coral bleaching thermal stress monitoring. News Int. Soc. Reef Stud. 2014, 29, 27–29. [Google Scholar]
- NOAA Coral Reef Watch Product Description of Daily Global 5 km Satellite Coral Bleaching Thermal Stress Monitoring Products (Version 1). Available online: http://coralreefwatch.noaa.gov/satellite/bleaching5km/description5km_v1.php (accessed on 25 June 2015).
- Laydoo, R.S. The Fore-Reef Slopes of the Buccoo Reef Complex, Tobago, 1st ed.Institute of Marine Affairs: Chaguaramas, Trinidad and Tobago, 1985; pp. 2–4.
- Peterson, L.C.; Haug, G.H. Variability in the mean latitude of the Atlantic Intertropical Convergence Zone as recorded by riverine input of sediment to the Cariaco Basin. Paleogeogr. Paleoclimatol. Paleoecol. 2006, 243, 97–113. [Google Scholar] [CrossRef]
- Warne, A.G.; Meade, R.H.; White, W.A.; Guevara, E.H.; Gibeaut, J.; Smyth, R.C.; Aslan, A.; Tremblay, T. Regional controls on geomorphology, hydrology, and ecosystem integrity in the Orinoco Delta, Venezuela. Geomorphology 2002, 44, 273–307. [Google Scholar] [CrossRef]
- Muller-Karger, F.E.; Castro, R.A. Mesoscale processes affecting phytoplankton abundance in the southern Caribbean Sea. Cont. Shelf Res. 1994, 14, 199–221. [Google Scholar] [CrossRef]
- Beharry, S.L.; Clarke, R.M.; Kumarsingh, K. Precipitation trends using in-situ gridded datasets. Theor. Appl. Climatol. 2014, 115, 599–607. [Google Scholar] [CrossRef]
- Burke, L.; Maidens, J. Reefs at Risk in the Caribbean, 1st ed.; World Resource Institute: Washington, DC, USA, 2004; pp. 5–8. [Google Scholar]
- Alemu I, J.B.; Clement, Y. Mass coral bleaching in 2010 in the southern Caribbean. PLoS ONE 2014, 9, 1–8. [Google Scholar] [CrossRef]
- McWilliams, J.P.; Côte, I.M.; Gill, J.A.; Sutherland, W.J.; Watkinson, A.R. Accelerating impacts of temperature-induced coral bleaching in the Caribbean. Ecology 2005, 86, 2055–2060. [Google Scholar] [CrossRef]
- Liu, G.; Rauenzahn, J.L.; Heron, S.F.; Eakin, C.M.; Skirving, W.; Christensen, T.R.L.; Strong, A.E.; Li, J. NOAA Coral Reef Watch 50 km Satellite Sea Surface Temperature-Based Decision Support System for Coral Bleaching Management; NOAA: Washington, DC, USA, 2013; p. 27. [Google Scholar]
- Liu, G.; Heron, S.F.; Eakin, C.M.; Rauenzahn, J.L.; Geiger, E.F.; Skirving, W.J.; Burgess, T.F.R.; Strong, A.E. NOAA coral reef watch’s next-generation 5 km satellite coral bleaching thermal stress monitoring. Reef Encount. 2004, 2, 27–29. [Google Scholar]
- HOBO Water Temperature Pro v2 Data Logger—U22-001. Available online: http://www.onsetcomp.com/products/data-loggers/u22-001?qt-product-tabs=1#qt-product-tabs (accessed on 13 July 2015).
- Weeks, S.J.; Berkelmans, R.; Heron, S.F. Thermal applications. In Coral Reef Remote Sensing: A Guide for Mapping, Monitoring and Management, 1st ed.; Goodman, J.A., Purkis, S.J., Phinn, S.R., Eds.; Springer: London, UK, 2013; pp. 313–339. [Google Scholar]
- Parker, B.A.; Christensen, T.R.; Heron, S.F.; Morgan, J.A.; Eakin, C.M. A Classroom activity using satellite sea surface temperatures to predict coral bleaching. Oceanography 2009, 2, 252–257. [Google Scholar] [CrossRef]
- Guo, P.; Bo, Y. Validation of AVHRR/MODIS/AMSR-E satellite SST products in the West Tropical Pacific. In Proceedings of the Geoscience and Remote Sensing Symposium, Boston, MA, USA, 6–11 July 2008.
- Heron, S.F.; Liu, G.; Eakin, M.C.; Skirving, W.J.; Muller-Karger, F.E.; Vega-Rodriguez, M.; de La Cour, J.L.; Burgess, T.F.R.; Strong, A.E.; Geiger, E.F. Climatology Development for NOAA Coral Reef Watch’s 5-km Product Suite; NOAA: Washington, DC, USA, 2014; pp. 1–14. [Google Scholar]
- Heron, S.F.; Johnston, L.; Liu, G.; Geiger, E.F.; Maynard, J.A.; de La Cour, J.L.; Johnson, S.; Okano, R.; Benavente, D.; Burgess, T.F.R.; et al. Monitoring coral bleaching using high-resolution thermal stress satellite products. Remote Sens. 2015, in press. [Google Scholar]
- Hill, J.; Wilkinson, C. Methods for Ecological Monitoring of Coral Reefs, Version 1, A Resource for Managers; Australian Institute of Marine Science: Townsville, QLD, Australia, 2004; p. 117. Available online: www.icriforum.org/sites/default/files/GCRMN_Ecological_monitoring.pdf (accessed on 1 July 2013).
- Laydoo, R.S. Introduction. In The Reefs at Culloden Bay, Tobago, 1st ed.Institute of Marine Affairs: Chaguaramas, Trinidad and Tobago, 1985; pp. 1–3. [Google Scholar]
- Ricciardulli, L.; Wentz, L.J. Uncertainties in sea surface temperature retrievals from space: Comparison of microwave and infrared observations from TRMM. J. Geophys. Res. 2004, 109, 1–16. [Google Scholar] [CrossRef]
- Wick, G.A.; Bates, J.J.; Scott, D.J. Satellite and skin layer effects on the accuracy of sea surface temperature measurements from the GOES satellite. J. Atmos. Ocean. Technol. 2002, 19, 1834–1848. [Google Scholar] [CrossRef]
- Laydoo, R.S. Introduction. In The Coral Reefs at Speyside, Tobago, 1st ed.Institute of Marine Affairs: Chaguaramas, Trinidad and Tobago, 1985; pp. 2–4. [Google Scholar]
- Heron, S.F.; Liu, G.; Rauenzahn, J.L.; Christensen, T.R.L.; Skirving, W.J.; Burgess, T.F.R.; Eakin, C.M.; Morgan, J.A. Improvements to the continuity of operational global thermal stress monitoring for coral bleaching. J. Oper. Oceanogr. 2014, 7, 3–11. [Google Scholar] [CrossRef]
- Lapointe, B.E.; Langton, R.; Bedford, B.J.; Potts, A.C.; Day, O.; Hu, C. Land-Based nutrient enrichment of the Buccoo Reef complex and fringing coral reefs of Tobago, West Indies. Mar. Pollut. Bull. 2010. [Google Scholar] [CrossRef] [PubMed]
- Mallela, J.; Crabbe, M.J.C. Hurricanes and coral bleaching linked to changes in coral recruitment in Tobago. Mar. Environ. Res. 2009, 68, 158–162. [Google Scholar] [CrossRef] [PubMed]
© 2015 by the authors; licensee MDPI, Basel, Switzerland. This article is an open access article distributed under the terms and conditions of the Creative Commons by Attribution (CC-BY) license (http://creativecommons.org/licenses/by/4.0/).
Share and Cite
Mohammed, S.S.; Heron, S.F.; Mahabir, R.; Clarke, R.M. Performance Evaluation of CRW Reef-Scale and Broad-Scale SST-Based Coral Monitoring Products in Fringing Reef Systems of Tobago. Remote Sens. 2016, 8, 12. https://doi.org/10.3390/rs8010012
Mohammed SS, Heron SF, Mahabir R, Clarke RM. Performance Evaluation of CRW Reef-Scale and Broad-Scale SST-Based Coral Monitoring Products in Fringing Reef Systems of Tobago. Remote Sensing. 2016; 8(1):12. https://doi.org/10.3390/rs8010012
Chicago/Turabian StyleMohammed, Shaazia S., Scott F. Heron, Rajindra Mahabir, and Ricardo M. Clarke. 2016. "Performance Evaluation of CRW Reef-Scale and Broad-Scale SST-Based Coral Monitoring Products in Fringing Reef Systems of Tobago" Remote Sensing 8, no. 1: 12. https://doi.org/10.3390/rs8010012
APA StyleMohammed, S. S., Heron, S. F., Mahabir, R., & Clarke, R. M. (2016). Performance Evaluation of CRW Reef-Scale and Broad-Scale SST-Based Coral Monitoring Products in Fringing Reef Systems of Tobago. Remote Sensing, 8(1), 12. https://doi.org/10.3390/rs8010012