Article

Tracking Ecosystem Water Use Efficiency of Cropland by Exclusive Use of MODIS EVI Data

1
Key Laboratory of Watershed Geographic Sciences, Nanjing Institute of Geography and Limnology, Chinese Academy of Sciences, Nanjing 210008, China
2
State Key Laboratory of Remote Sensing Science, Institute of Remote Sensing and Digital Earth, Chinese Academy of Sciences, Beijing 100101, China
3
Department of Soil, Water and Climate, University of Minnesota, St. Paul, MN 55108, USA
4
Institute of Geographic Sciences and Natural Resources Research, Chinese Academy of Sciences, Beijing 100101, China
5
Key Laboratory of Poyang Lake Wetland and Watershed Research (Jiangxi Normal University), Ministry of Education, Nanchang 330022, China
*
Authors to whom correspondence should be addressed.
Remote Sens. 2015, 7(9), 11016-11035; https://doi.org/10.3390/rs70911016
Submission received: 28 July 2015 / Revised: 13 August 2015 / Accepted: 20 August 2015 / Published: 26 August 2015

Abstract

:
One of the most important linkages that couple terrestrial carbon and water cycles is ecosystem water use efficiency (WUE), which is relevant to the reasonable utilization of water resources and farming practices. Eddy covariance techniques provide an opportunity to monitor the variability in WUE and can be integrated with Moderate Resolution Imaging Spectroradiometer (MODIS) observations. Scaling up in situ observations from flux tower sites to large areas remains challenging and few studies have been reported on direct estimation of WUE from remotely-sensed data. This study examined the main environmental factors driving the variability in WUE of corn/soybean croplands, and revealed the prominent role of solar radiation and temperature. Time-series of MODIS-derived enhanced vegetation indices (EVI), which are proxies for the plant responses to environmental controls, were also strongly correlated with ecosystem WUE, thereby implying great potential for remote quantification. Further, both performance of the indirect MODIS-derived WUE from gross primary productivity (GPP) and evapotranspiration (ET), and the direct estimates by exclusive use of MODIS EVI data were evaluated using tower-based measurements. The results showed that ecosystem WUE were overpredicted at the beginning and ending of crop-growth periods and severely underestimated during the peak periods by the indirect estimates from MODIS products, which was mainly attributed to the error source from MODIS GPP. However, a simple empirical model that is solely based on MODIS EVI data performed rather well to capture the seasonal variations in WUE, especially for the growing periods of croplands. Independent validation at different sites indicates the method has potential for broad application.

Graphical Abstract

1. Introduction

Water use efficiency (WUE) is defined as the ratio of photosynthetic carbon uptake over transpiration, and has been widely recognized as an important link between global carbon and water cycles in terrestrial ecosystems [1,2]. Plants assimilate CO2 through photosynthetic activity, which is always accompanied by the water loss that regulates the land surface exchanges between the biosphere and the atmosphere [3]. The exchanges of both CO2 and water vapor are controlled by stomatal aperture for leaf-level WUE [4]. However, ecosystem-level WUE changes with vegetation types and the surrounding environmental conditions [5]. The variability in WUE is closely related to the reasonable utilization of water resources and survival strategies, as well as responses to the changing hydrological environment [6,7]. Especially for agriculture, WUE is important for agronomy and making optimal irrigation management decisions.
Increasing atmospheric CO2 concentration has increased global mean temperature in the 20th and early 21st centuries [8]. In response to the higher temperature, plant transpiration and soil evaporation can enhance water consumption, which has the potential to increase the severity, frequency, and duration of soil moisture stress. Conversely, higher CO2 concentration can trigger stomatal closure that may limit the extent of water loss by plant transpiration [9]. Further, in some systems, the higher temperatures will extend the plant’s phenological period with an earlier spring and a later fall, which can cause more water to be consumed by terrestrial ecosystems [10]. In addition, land use/land cover changes, primarily the expansion of cropland from forest, grassland, and wetland, are deemed responsible for 20%–25% of the increase in atmospheric CO2 over the past 150 years [11]. Given the rapid expansion of urbanization and industrialization, the demands on water are continuously increasing which further ramp up the pressure to decrease agricultural water consumption [12]. Technologies for improving crop WUE are critical for sustainable yield and food security. Therefore, quantifying large-scale ecosystem WUE is vital for diagnosing how current farming practices influence WUE and identifying opportunities for improvement without yield penalty.
At the ecosystem level, the eddy covariance (EC) technique has become one of the powerful tools used to characterize the dynamics of WUE as the ratio of gross primary production (GPP) over evapotranspiration (ET) [13,14,15]. By combining EC fluxes with remote sensing information, it is possible to extrapolate these site-level measurements of plant functional characteristics to a much larger area with ecosystem models [16,17,18,19]. As an important proxy of terrestrial carbon and water coupling, both processes of CO2 sequestration through photosynthesis and loss of water by evapotranspiration are closely related to the biophysical properties (e.g., biomass, leaf area, and growth stage) and environmental factors [20,21,22,23]. With the development of MODIS GPP and ET algorithms, currently large-scale ecosystem WUE can be calculated as the ratio of GPP to ET in accordance to its definition. Although Tang et al. [24] evaluated how global WUE of terrestrial ecosystems distributed and changed in the past decade using remotely-sensed products on an annual time scale, the correspondence between MODIS WUE estimates and tower-based WUE measurements at short time scales remains unclear. In fact, precise information on seasonal variations in WUE is more significant for agricultural water management [25,26,27]. There is an important need to examine the capacity of applying MODIS GPP and ET products to monitor the variability in crop WUE. Meanwhile, alternative approaches involving direct estimation of WUE from satellite data need to be explored.
Therefore, this study aims to answer:
(1)
How do environmental factors control the changes in WUE from flux measurements in corn/soybean rotation systems?
(2)
How well do the MODIS-derived WUE estimates from GPP and ET perform in capturing the seasonal dynamics in WUE of croplands? What are the possible sources of error?
(3)
Can we develop an alternative method that is based directly on the remotely-sensed data to improve the accuracy in WUE estimates of corn and soybean?

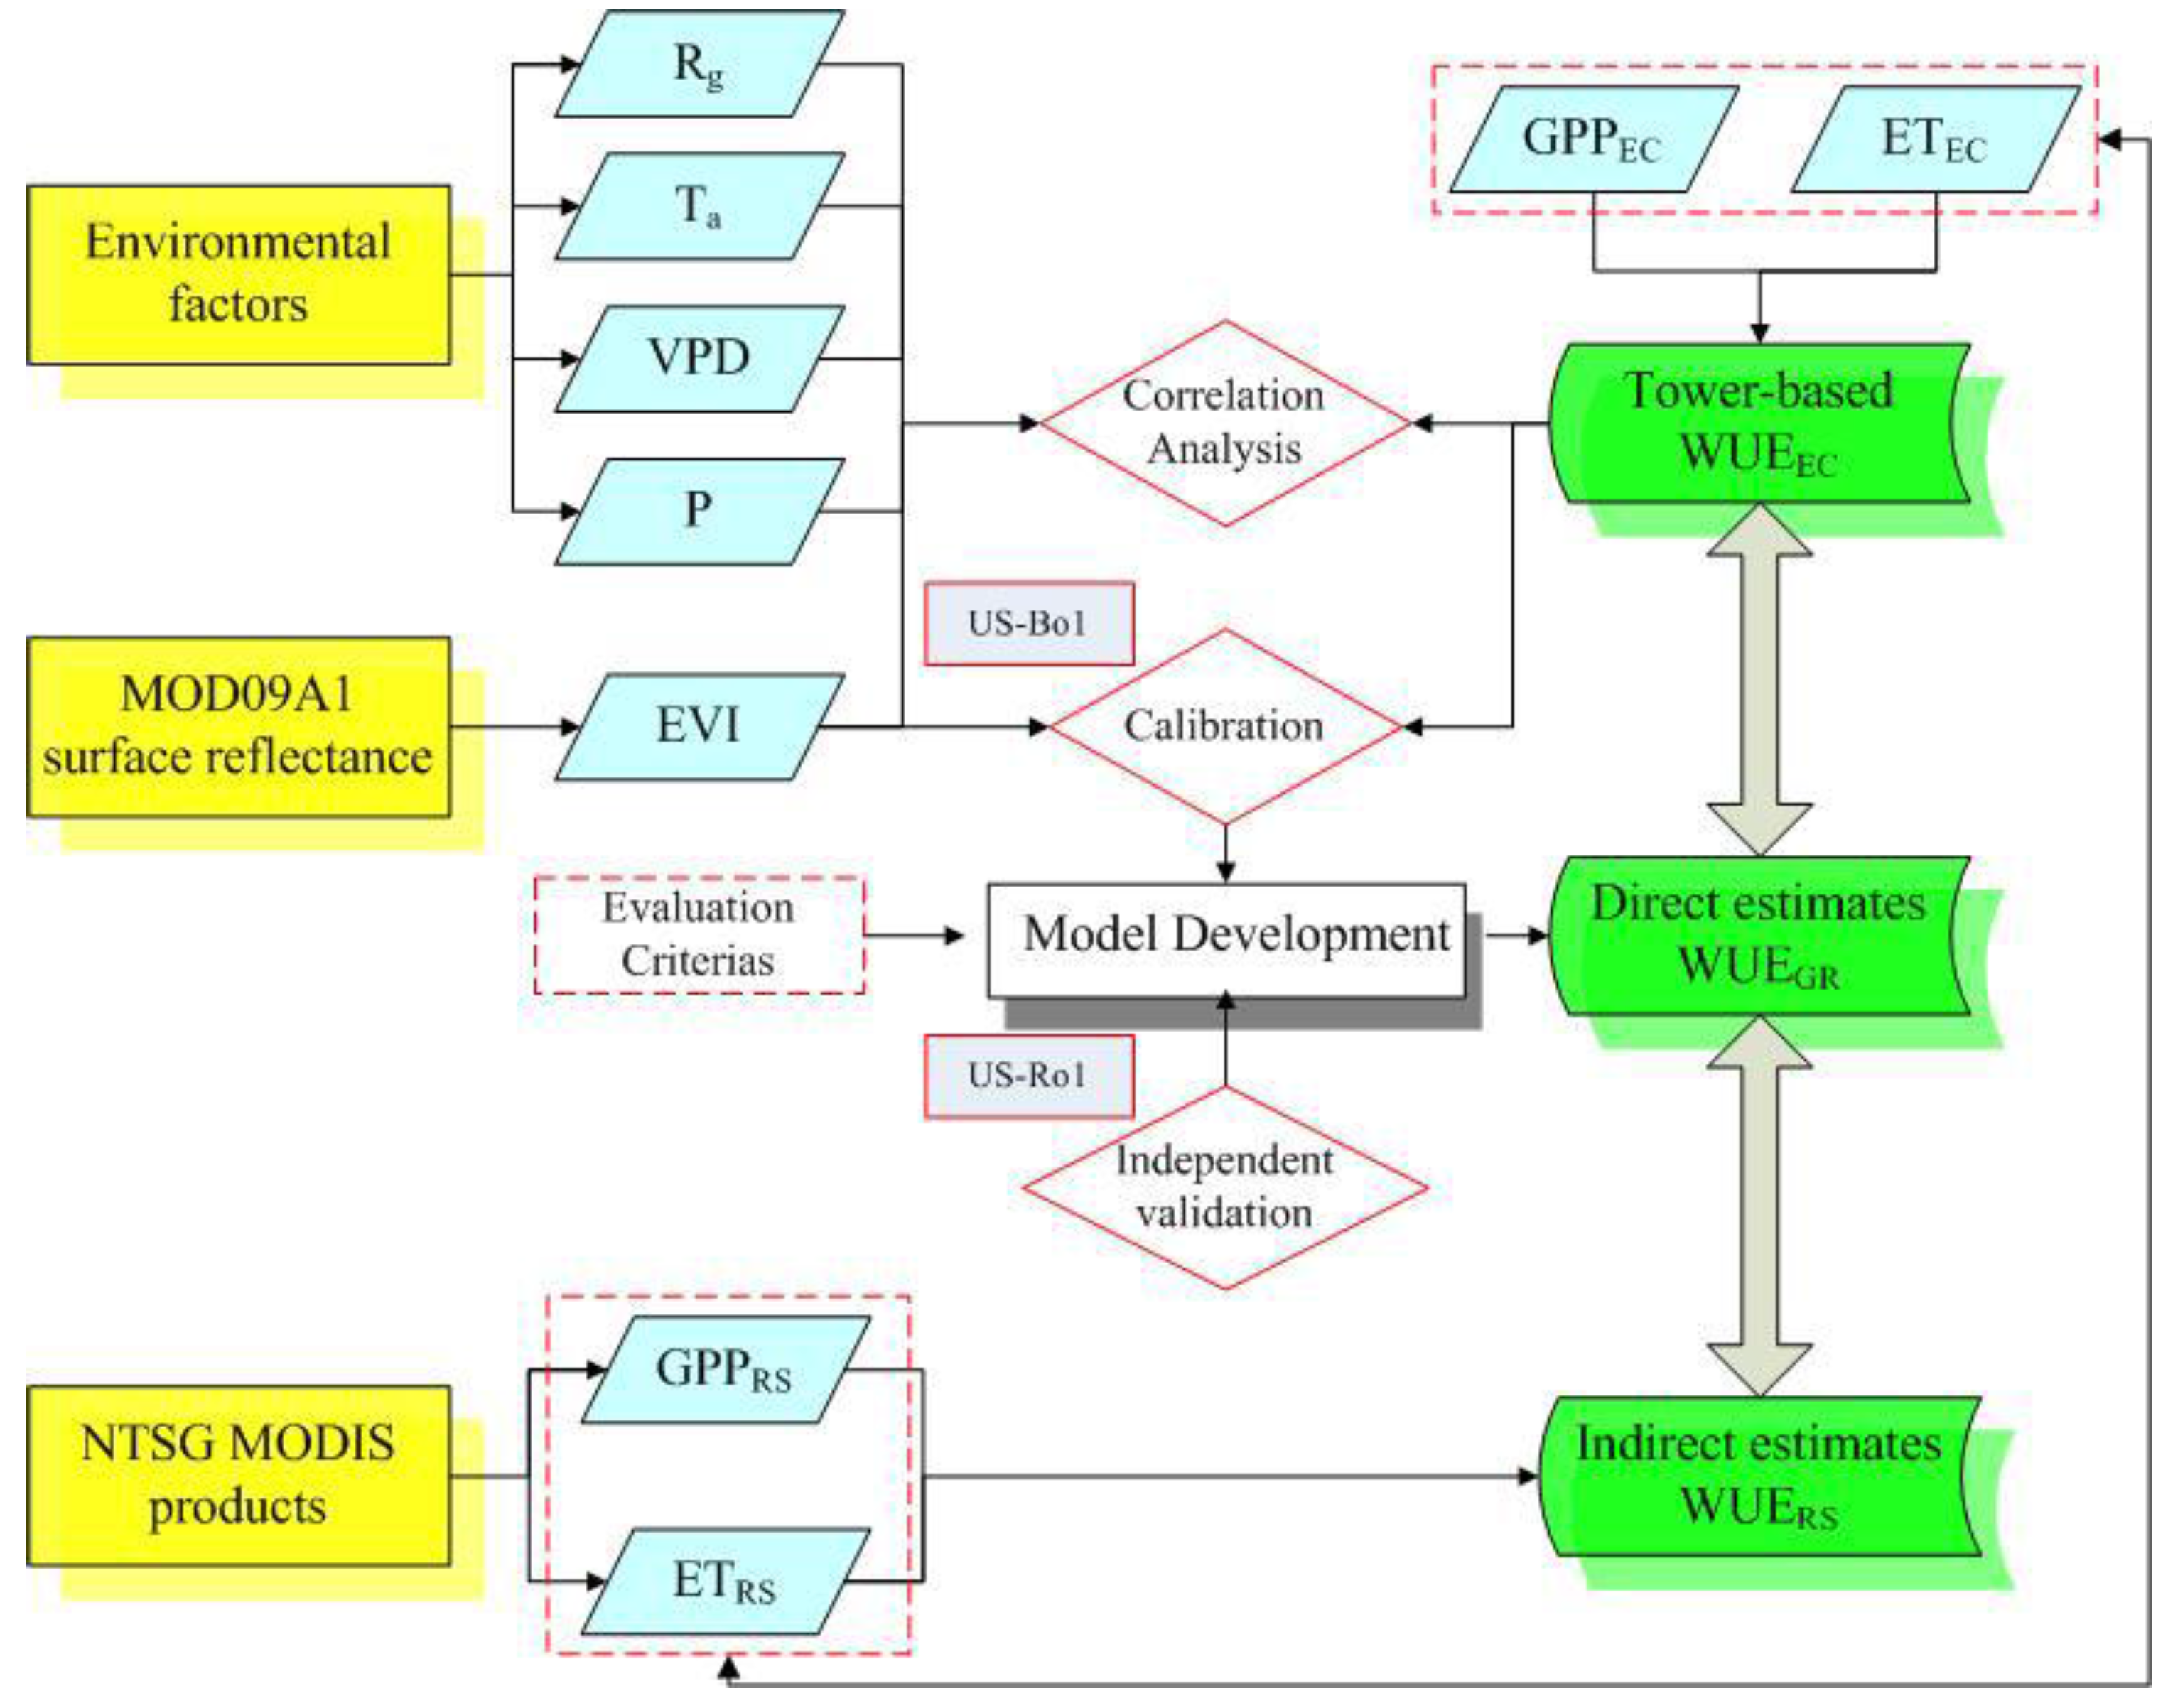
2. Materials and Methods

2.1. Site Descriptions

This study was conducted using EC flux data from an agricultural site in the midwestern part of the United States, near Champaign, Illinois (40.0062°N, 88.2904°W). The site (US-Bo1) is part of the research network in the global energy and water cycle experiment described by Lawford [28] as well as the international network for terrestrial carbon fluxes described by Baldocchi et al. [13]. This site has been operational since 1996, which aims to obtain long-term information about energy, water, and CO2 fluxes and their environmental controls for improving soil-vegetative-atmosphere transfer models. The field was managed as continuous no-till with alternating years of corn and soybean crops (corn in the odd years and soybean in the even years). Soil type is silt loam consisting of three soil series (Dana, Flanagan, and Drummer). The micrometeorological tower placement in the field provides a fetch over a continuous crop with 300 m to the west, 700 m to the east, 500 m to the south, and 200 m to the north. For the corn and soybean crops, plant heights are typically 3.0 m and 0.9 m with the peak leaf area index (LAI) of 5.5 and 5, respectively. Climate of the region is temperate continental with the prevailing winds during the summertime from the south. A detailed description of the site can be found in Meyers and Hollinger [29] and Bernacchi et al. [30].
To independently evaluate the transferability of the developed model, the crop site (US-Ro1; 44.7143°N, 93.0898°W) located at the University of Minnesota’s Rosemount Research and Outreach Center, approximately 25 km south of St. Paul, Minnesota, was also used. Waukegan silt loam is the main soil type with high organic carbon content (about 2.6%) on the surface layer and varying thickness between 0.3 m and 2.0 m with coarse outwash sand and gravel. This field has the same temperate continental climate with a regional growing season that usually starts in late May and ends in October. In contrast to US-Bo1, this site was a conventional-till management corn/soybean annual rotation field (corn in the odd years and soybean in the even years). Apart from this, both sites are rain-fed farming systems. Further information can be obtained from Baker and Griffis [10] and Kalfas et al. [31].

2.2. Satellite-Derived MODIS Products and Processing

Currently, satellite-based products of terrestrial GPP and ET from NASA MODIS have been developed and experienced ongoing improvement during the past decade [17,24]. Zhao et al. [16] identified important errors in the old GPP product (Collection 4) owing to the problems in the upstream inputs. Then, these GPP estimates were amended through improving the algorithms and perfecting the necessary parameters, which generated the enhanced Collection 5 MOD17 products. The 8-day composites of MODIS LAI/FPAR (fraction of photosynthetically active radiation) data with the resolution of 1-km were introduced into the processing methods of GPP as remote sensing-based vegetation properties. The information in the QA (quality-assessment) flags were used to gap-fill the missing data in the time-series MODIS LAI/FPAR product resulting from clouds. Near real-time meteorological data are obtained from the National Center for Environmental Prediction (NCEP) to drive the algorithm. The continuous 8-day MODIS GPP values are summed up to generate monthly and annual GPP estimates. Further, the global evapotranspiration data can be used to quantitatively evaluate the regional soil water status and energy balance, which is key for agricultural water management. The potential effects of changes in global climate, land use/land cover, as well as natural disturbances such as wildfires on regional surface energy change and water cycles can also be examined with long-term ET products. Mu et al. [32] developed the global satellite remote sensing-based ET product (MOD16A2) with an improved algorithm using MODIS and ground-based meteorological observations. These improvements included: (1) separating dry canopy surface from the wet that caused water consumption by evaporation from the intercepted water and the plant transpiration; (2) treating land surface evaporation as the sum of the saturated and moist soil surface; (3) inclusion of daytime and nighttime components; (4) estimation of the soil heat flux value as radiation partitioned from the land surface; and (5) improving the estimates of canopy and aerodynamic resistances, as well as the vegetation cover fraction. Both NTSG (Numerical Terradynamic Simulation Group of the University of Montana) MODIS GPP and ET products with an 8-day time scale can be obtained freely from the web site [33].
In addition, the 8-day composite land surface reflectance (MOD09A1, with resolution of 500 m) data from one MODIS pixel where the US-Bo1 and US-Ro1 lie were downloaded from the Oak Ridge National Laboratory’s Distributed Active Archive Center web site [34]. The version of MODIS data is collection 5. The enhanced vegetation index (EVI) derived from blue, red, and near-infrared (NIR) bands has proved to be sensitive to vegetation production, plant transpiration and growth stages [35,36,37]. Huete et al. [38] defined EVI as:
E V I = 2 . 5 ρ n i r ρ r e d ρ n i r + ( 6 ρ r e d 7 . 5 ρ b l u e ) + 1
where ρnir, ρred, and ρblue are the spectral reflectances in MODIS bands 2, 1, and 3, respectively. Time-series EVI data are used to analyze the correlation with variations in ecosystem WUE, and to develop an alternative method for quantifying crop WUE.

2.3. Site-Specific Climate and Flux Data

In this study, our analysis is based on continuous observations of land-surface exchanges during 2001–2006 at US-Bo1 site and during 2005–2006 at US-Ro1 site [39]. The product provides measurements of ecosystem-scale water flux (LE), CO2 flux, meteorological variables including solar radiation (Rg), air temperature (Ta), soil temperature/moisture, vapor pressure deficit (VPD), precipitation (P), and the estimates of GPP derived from the measured NEE using the methodology proposed by Reichstein et al. [40] at half-hour, daily, weekly (8-day), and monthly time scales [17]. Both the marginal distribution sampling (MDS) approach and the artificial neural network (ANN) method are used to gap-fill the original CO2 flux data. Generally, the ANN method is slightly superior to the MDS method [40,41]. Thus, the gap-filled results of NEE and GPP data based on the ANN method are used. The 8-day period, level-4 data are analyzed in this study. Therefore, flux tower and MODIS observation periods are consistent for comparison. In addition, the missing data resulting from system failures, stable atmospheric conditions or rejection of poor data were gap-filled using standardized approaches to provide complete data sets [40,42].
Crop WUE can be characterized in many different ways in terms of scientific disciplines as well as the temporal and spatial scope of interest [43]. The ecosystem-level definition is used in this study, which is also closely related to ecosystem models. It is defined as:
WUE = GPP / ET
The seasonal variations in WUE can be described using 8-day WUE (gCkg−1H2O). ET (mm/day) was inferred from the observed latent heat fluxes (LE, W/m2) as:
ET = LE / λ
where λ is the amount of energy required to evaporate 1 kg liquid water to vapor (about 2,454,000 J).

2.4. Statistical Analysis

Pearson correlation analysis was conducted to assess the relationship between ecosystem WUE and the controlling environmental factors at the annual corn/soybean rotation field using SPSS 19.0 (Chicago, IL, USA). Performance of MODIS-derived WUE from GPP and ET was evaluated with tower-based measurements using the EC technique, and the main error sources were also explored through comparison of both processes. We also developed an alternative method to help capture the seasonal variations in WUE of croplands. Both fields (US-Bo1 and US-Ro1) were planted with corn in the odd years, and with soybean in the even years. Considering the differences in photosynthetic pathways between C3 plant (soybean) and C4 plant (corn), the site-level data at US-Bo1 were split into a training set (Corn year—2001 and 2003; soybean year—2002 and 2004) and a validation set (2005 for corn and 2006 for soybean), respectively. To evaluate the model’s performance, coefficient of determination (R2), root mean squared error (RMSE), scatterplots, and seasonal variations in predicted WUE versus tower-based WUE were compared. A well-calibrated model should have a small RMSE compared to the total variances as well as the R2 value close to 1. Finally, the transferability of the calibrated model was further tested at the independent US-Ro1 site. An overview of our research approach is shown in Figure 1.
Figure 1. Overview of the research approach. Rg, Ta, VPD and P are observed at the flux tower sites. EVI are derived from the MODIS data. WUEEC, WUERS, and WUEGR refer to ecosystem water use efficiency from flux tower measurements, the indirect estimates from NTSG MODIS products and the direct estimates based on MODIS EVI data, respectively. In addition, the data from US-Bo1 are used for calibration and another US-Ro1 site is used for independent validation of the developed model.
Remotesensing 07 11016 g001

3. Results and discussion

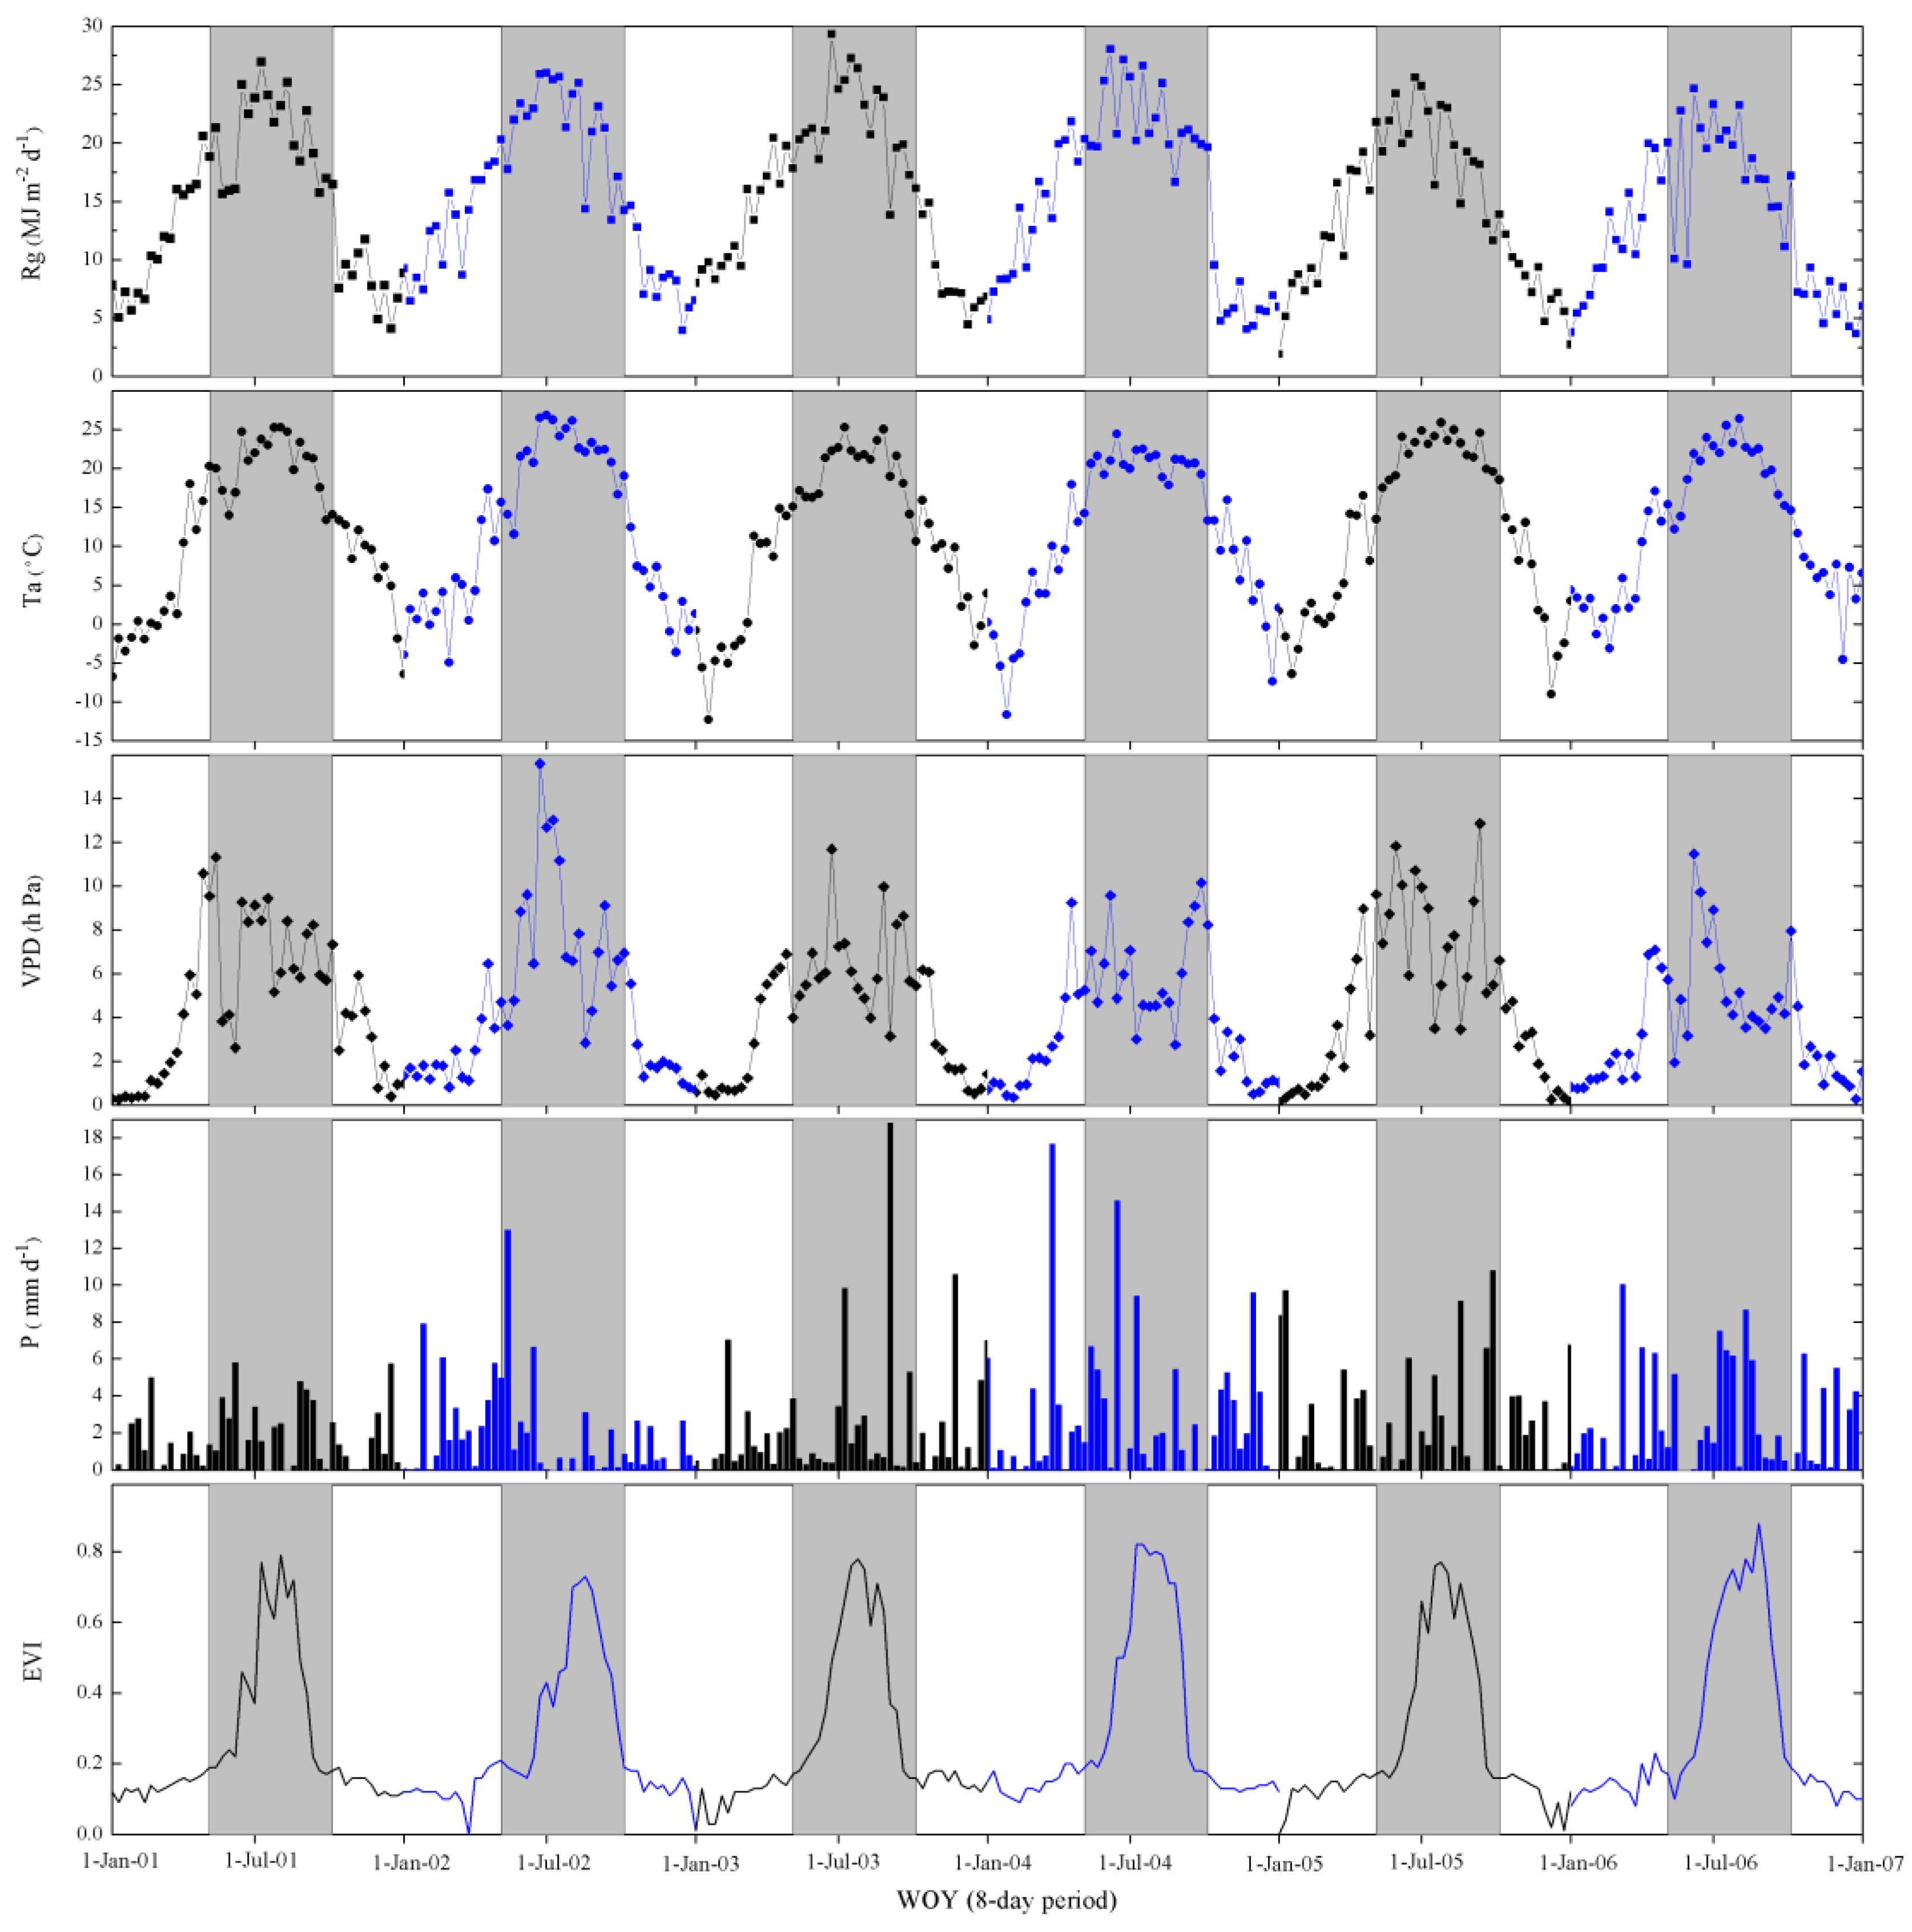
3.1. Seasonal Variations in Crop WUE with Environmental and Biological Controls

Climate of the region is northern continental, with short, moist growing periods in summer and cold, relatively dry winters, which has a profound effect on crop growth and the functional properties related to carbon and water budgets [23,44,45]. Crop growing season, including corn and soybean, in this region generally starts in late May to the end of October. The relationships between averaged 8-day tower-based WUE and the environmental conditions including Rg, Ta, VPD, P and MODIS-derived EVI data observed at US-Bo1 site during 2001 to 2006 are showed in Figure 2 and Figure 3. Figure 2 shows the time-series of meteorological data and Figure 3 exhibits the variations in tower-based WUE. The statistical significance is examined using Pearson’s correlation analysis (Table 1). We find that time-series of WUE data have distinct seasonal cycles that strongly covary with Rg and Ta. During winter months, because low temperature and frozen soils inhibit the plant growth and photosynthetic activities, WUE values are nearly zero. As temperature rises in the spring planting season, crops begin to grow and ecosystem photosynthetic capacity gradually increases accompanied by plant transpiration. Ecosystem WUE of both corn and soybean reached its peak value during about late July and early August, and then declined until the harvest in October. The C4 plant-corn showed greater sensitivity to solar radiation than temperature in contrast to the C3 plant-soybean (Table 1). In addition, despite the prominent role that Rg and Ta play as the main drivers of crop WUE, peak periods show a minor hysteresis effect. Except during the winter months, VPD remains at a suitable value over most of the growing period. The VPD around 10 hPa appear to be near optimal for stomatal aperture. Thus, VPD values are at best moderate, but not excessively high during these measurement periods. Moreover, VPD was more closely correlated to corn WUE than soybean WUE. Both of the two flux sites depend on precipitation during cultivation and no irrigation was applied. Approximately 63% of the annual precipitation occurred during the cultivation-period. Although it was not significantly correlated to WUE on 8-day periods, natural rainfall is vital to crop growth as the only water supply.
Figure 2. Seasonal and interannual variations of solar radiation (Rg), air temperature (Ta), vapor pressure deficit (VPD), precipitation (P) and enhanced vegetation index (EVI) observed at the annual corn/soybean rotation field (US-Bo1) during 2001–2006, with the growing season highlighted.
Remotesensing 07 11016 g002
Figure 3. Seasonal variations of ecosystem water use efficiency from flux tower measurements (WUEEC) and estimates from MODIS products (WUERS) at the flux tower site US-Bo1 during 2001–2006 (corn in the odd years and soybean in the even years).
Remotesensing 07 11016 g003
Table 1. Correlations between 8-day tower-based WUE and satellite-driven EVI data with the controlling environmental factors at the annual corn/soybean rotation field.
Crop Type-GPP (g·C·m−2·d−1)ET (mm·d−1)Rg (MJ·m−2·d−1)Ta (°C)VPD (h·Pa)P (mm·d−1)EVI
CornWUE0.982 **0.818 **0.740 **0.673 **0.503 **0.1470.906 **
EVI0.906 **0.911 **0.857 **0.738 **0.545 **0.094
SoybeanWUE0.978 **0.732 **0.533 **0.577 **0.248 **−0.0290.950 **
EVI0.931 **0.784 **0.604 **0.686 **0.385 **−0.021
Note: ** Correlation is significant at the 0.01 level. * Correlation is significant at the 0.05 level. Rg, Ta, VPD and P are observed at the flux tower sites. Time series of EVI data are derived from the MODIS data.
As a proxy of the biological properties that reflected the response of vegetation to environmental controls, time series MODIS-derived EVI data also showed a strong consistency with seasonal and interannual variations in ecosystem WUE. 8-day EVI data presented fairly similar patterns as WUE during the growth period of crops. Moreover, the vegetation index captured well the beginning and ending of the crop growing season in 2001–2006. EVI started to increase in late May, reached peak values during peak growth (July–August), and declined after crop senescence or harvest (October). Correlation coefficients between EVI and WUE reached 0.906 for corn and 0.950 for soybean, respectively. As illustrated in Table 1, it again demonstrated its significant relationship with processes of both GPP and ET that were consistent with previous findings in forests [44,46], crops [6,37], and grasslands [2,47].

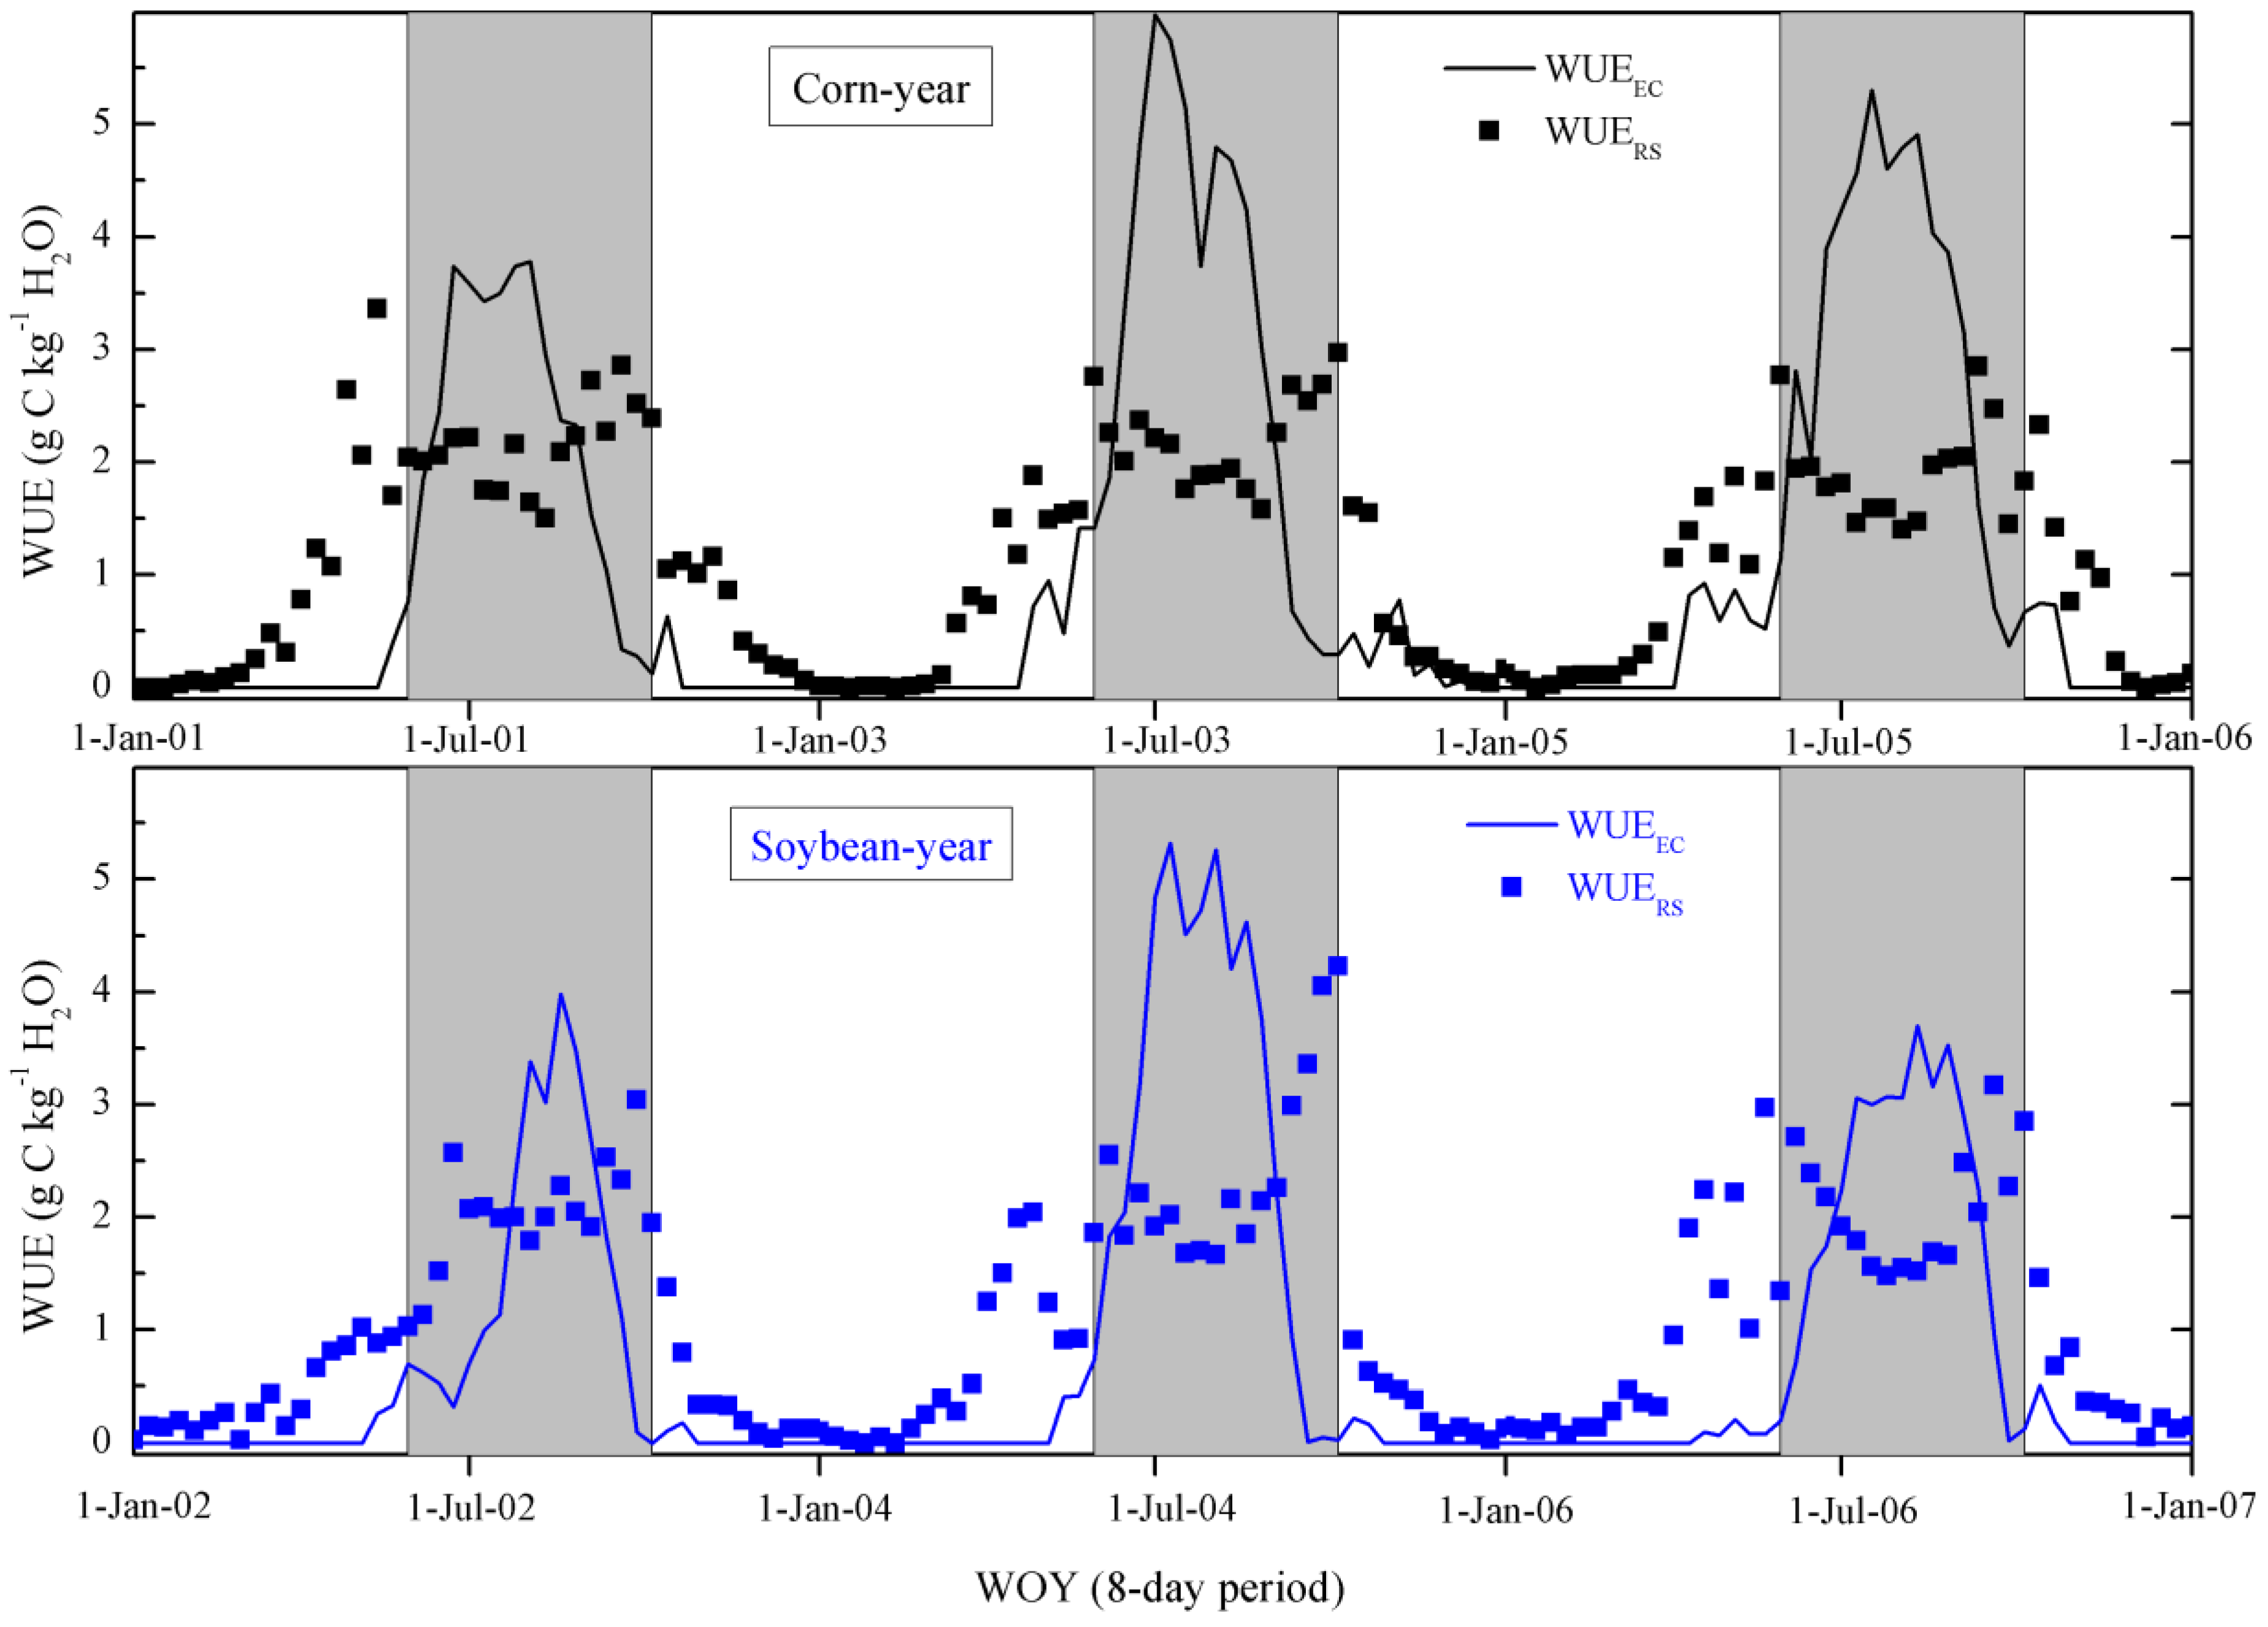
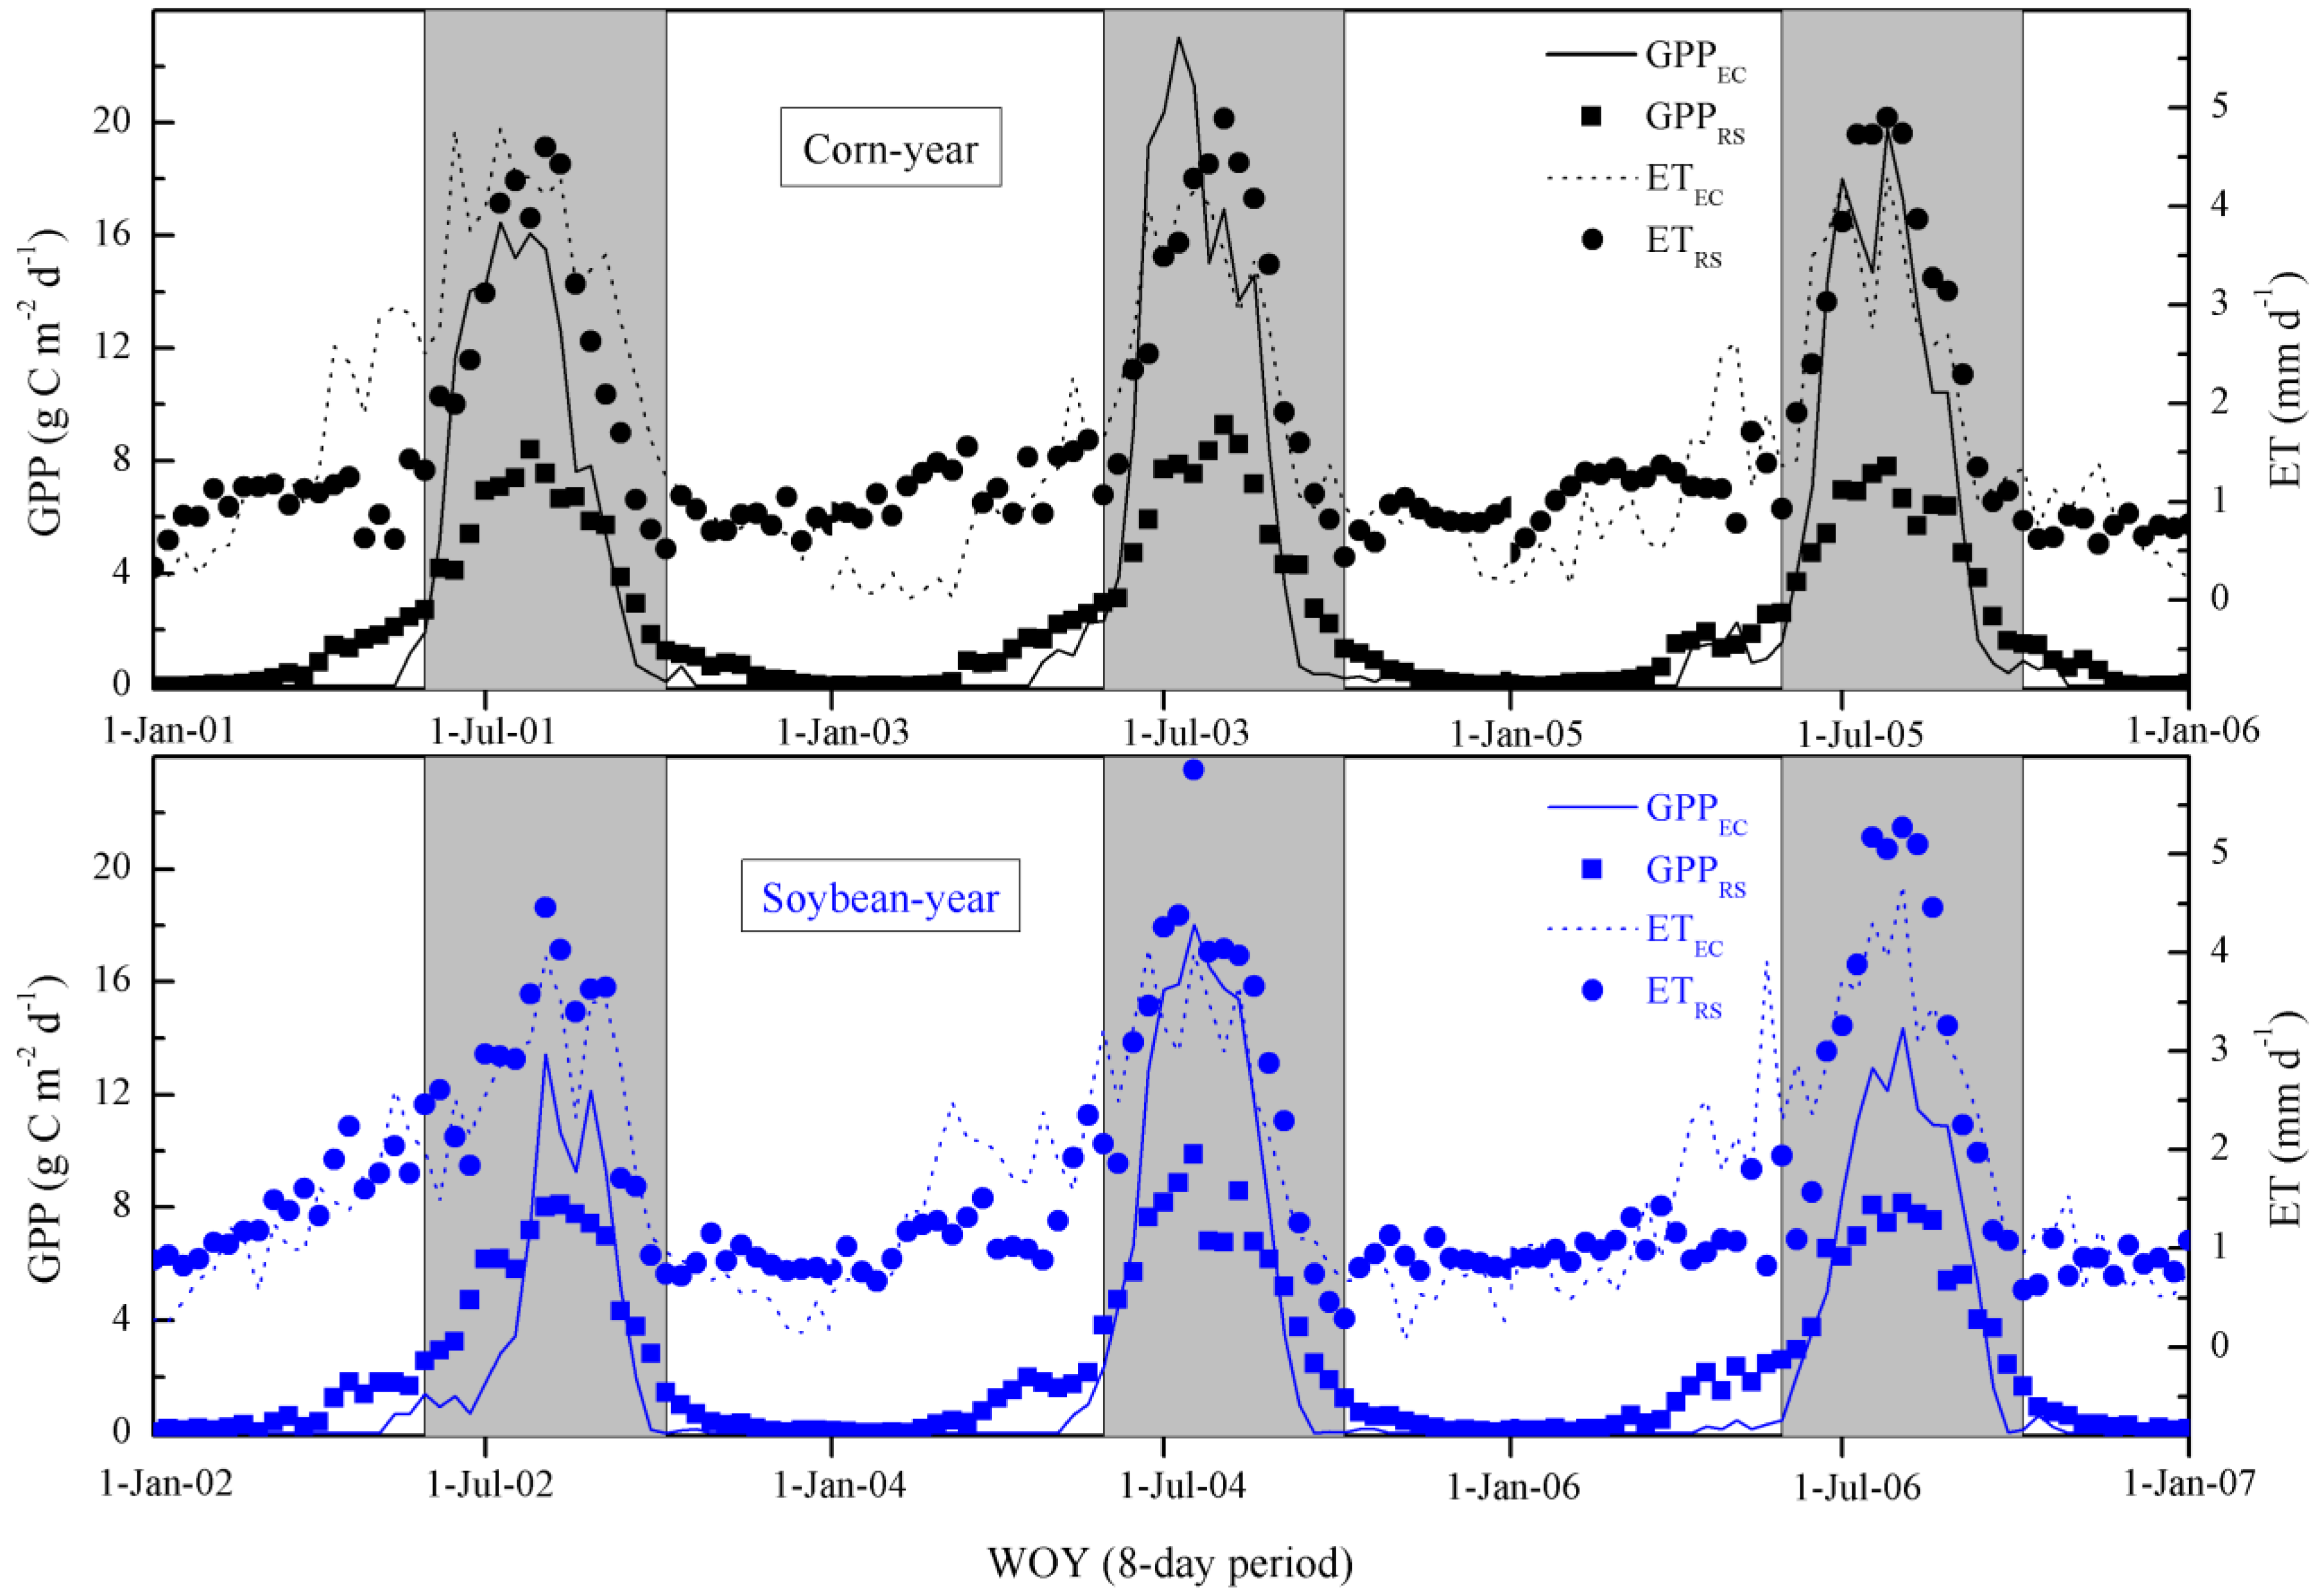
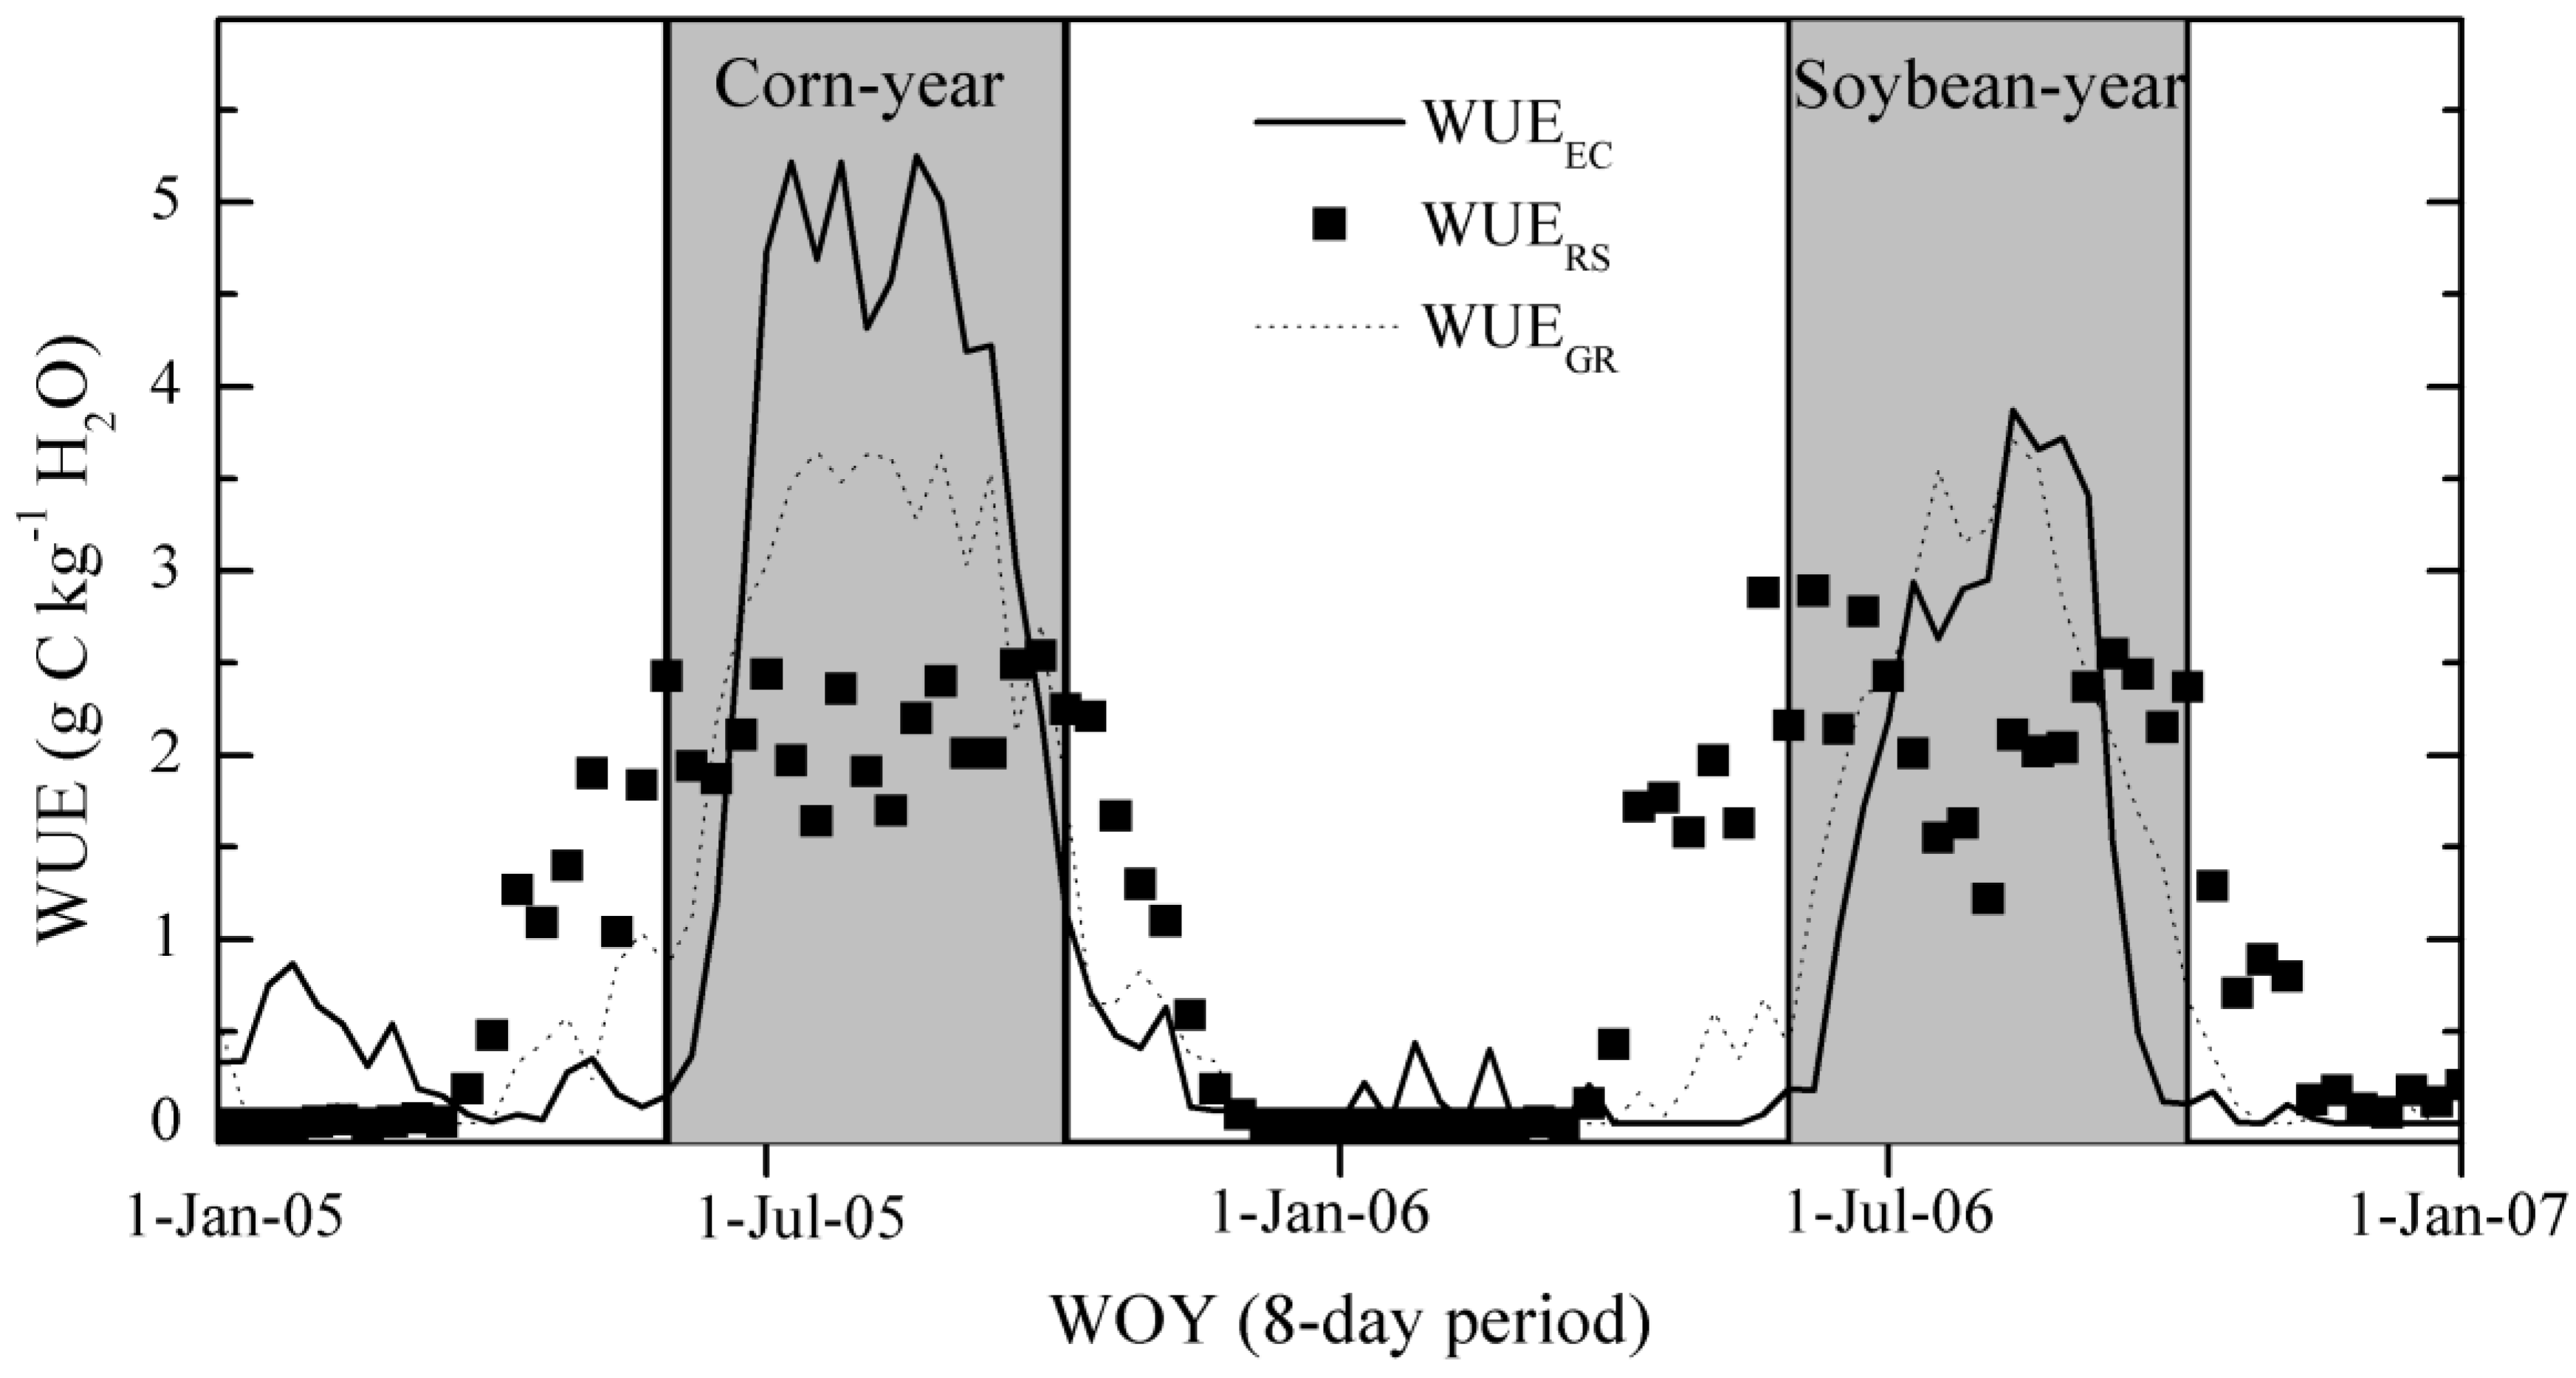
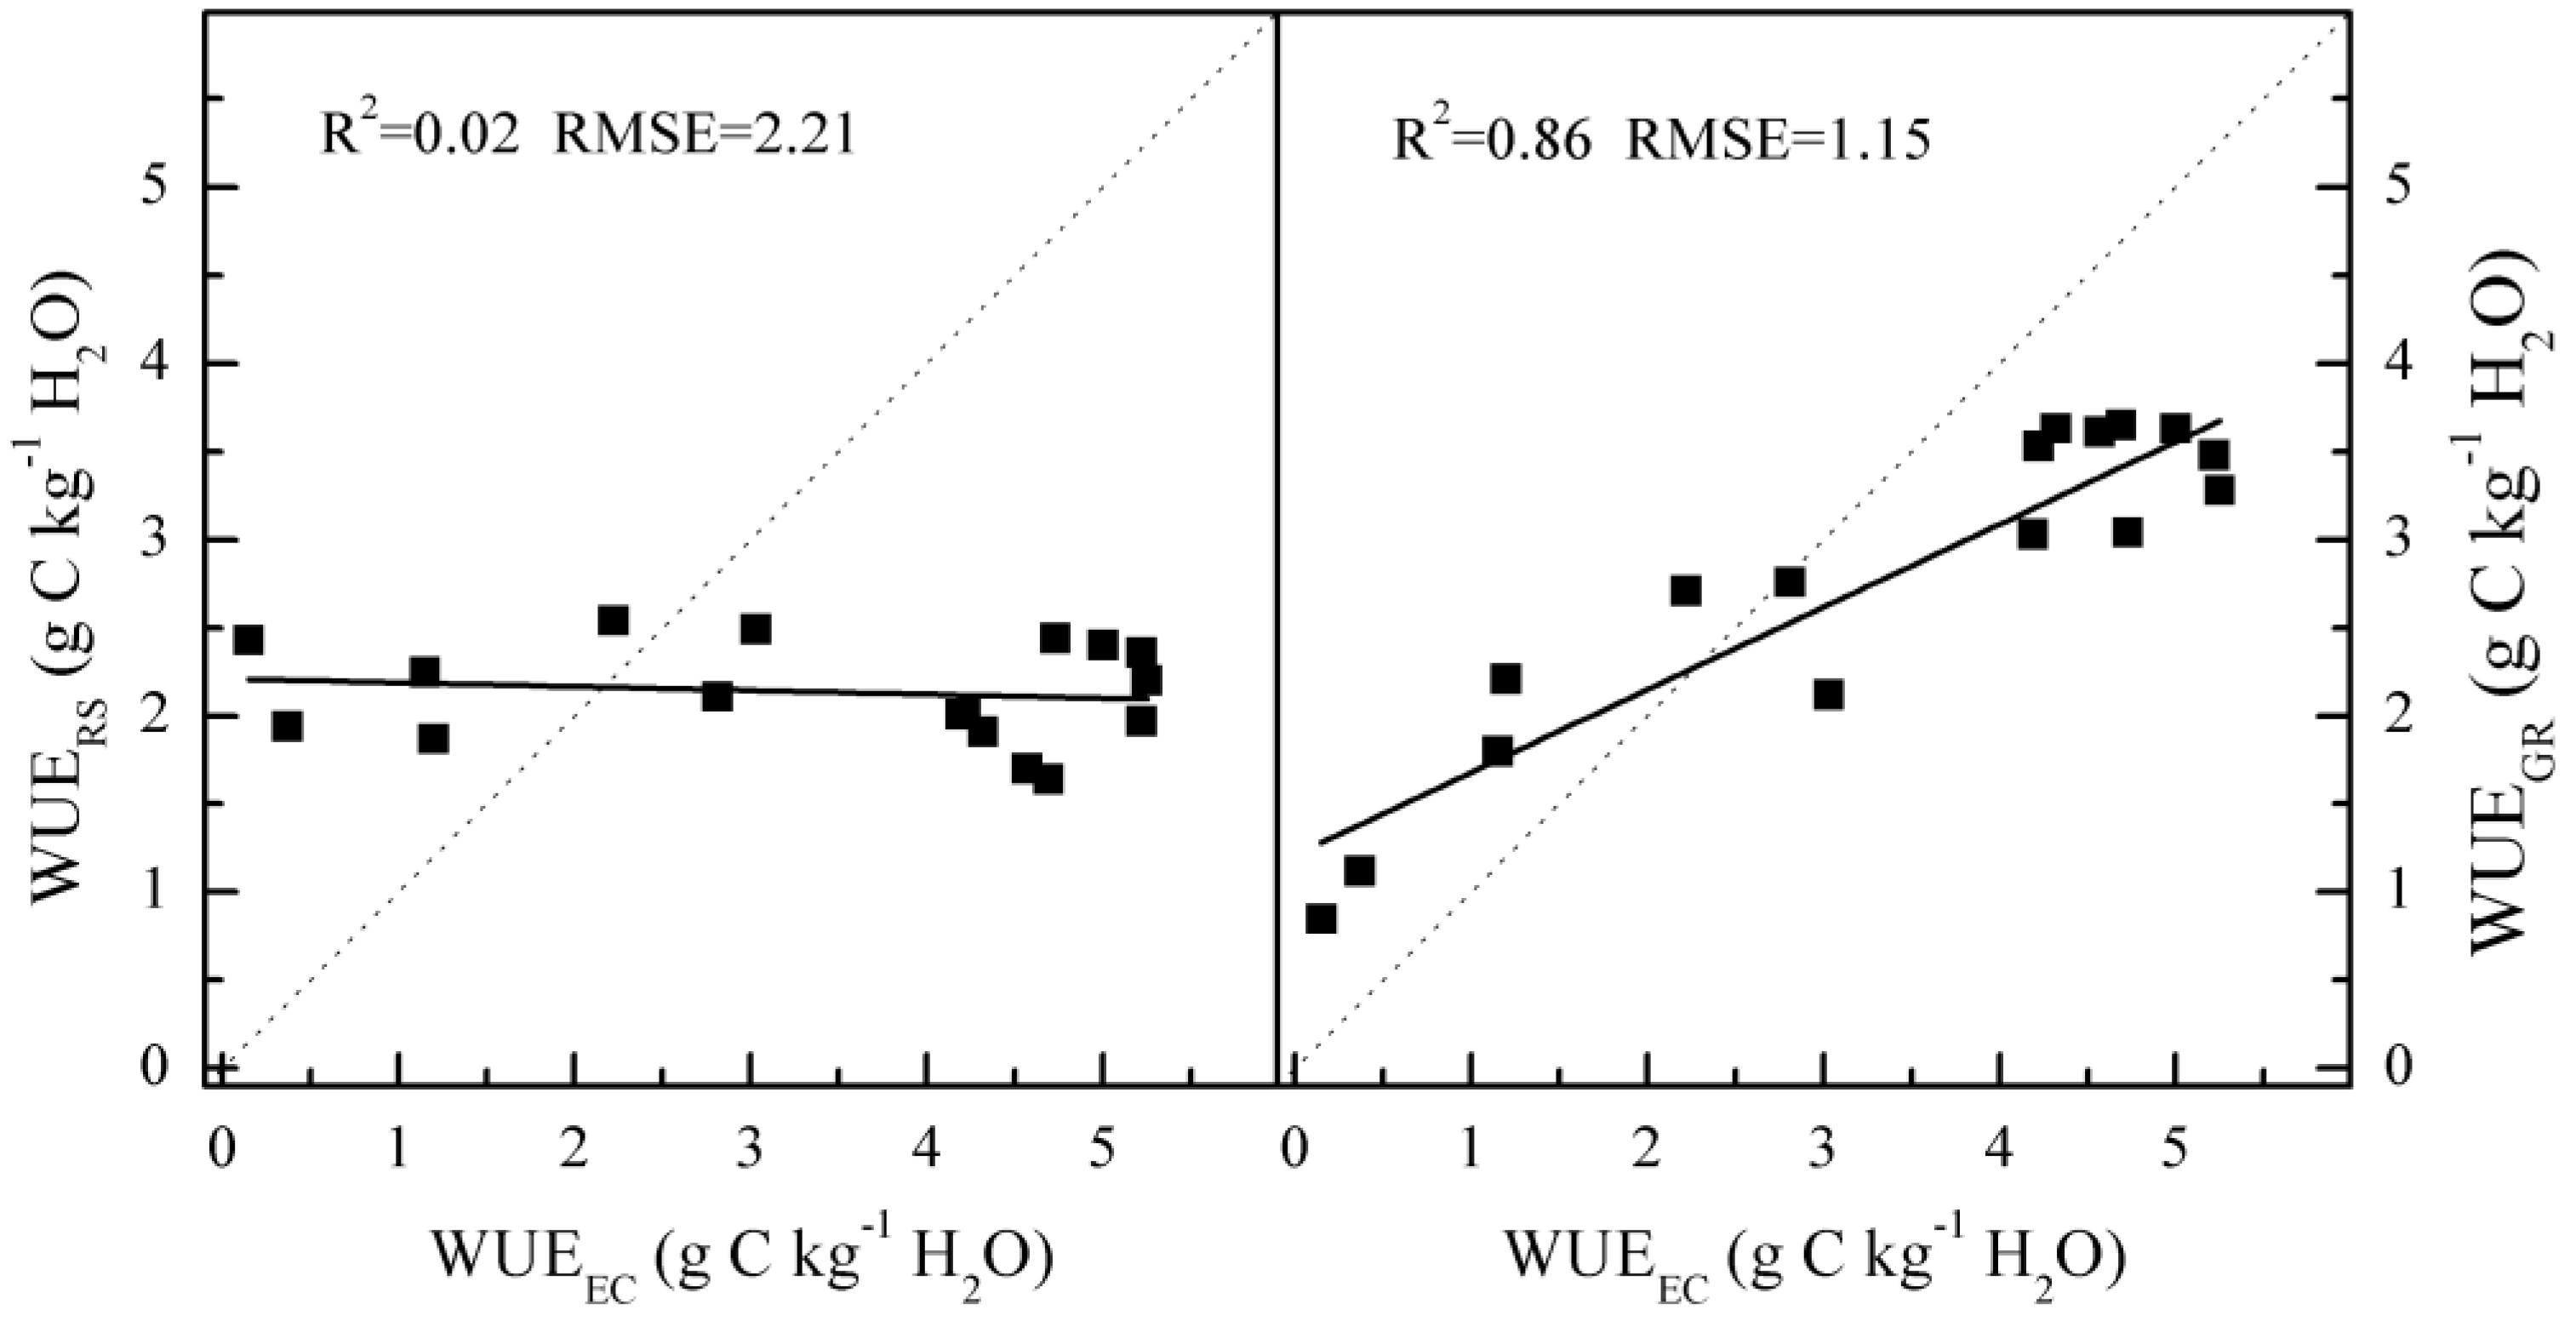
3.2. Comparisons of Tower-Based WUE and the MODIS Estimates from GPP and ET

Figure 3 shows the performance of MODIS-derived WUE estimates (WUERS) from GPP and ET in explaining the variability in EC measurements (WUEEC) at the crop flux site. Changes in WUEEC were tracked by WUERS with reasonable consistency for both corn and soybean. However, there existed two pronounced discrepancies. MODIS WUE estimates greatly overpredicted tower-based WUE at the beginning and ending of crop-growth periods whereas ecosystem WUE during the peak periods were severely underestimated, especially for the C4 plant-corn. This comparison reveals large uncertainties in the coupling processes between carbon and water cycles as represented in the MODIS GPP and ET products. These uncertainties may stem from the algorithm, various upstream inputs, as well as the specific parameters stored in a Biome Properties Look-Up Table (BPLUT). A single value for agricultural lands without considering the differences between C3 and C4 must be problematic. Thus, further analysis is needed to diagnose the errors.
Seasonal patterns of GPP and ET from flux observations and the corresponding MODIS estimates are compared to explore the potential reasons for differences between WUEEC and WUERS. As shown in Figure 4, the MODIS ET product performed reasonably well with measured ET during both corn years and soybean years except several 8-day periods. Overall, the percentage deviation of multiyear mean annual ETEC and ETRS was less than 5%. However, large discrepancies existed in the seasonal dynamics between GPPEC and GPPRS. Similar to the variability in ecosystem WUE, crop GPP was overestimated at the emergence stage and after harvest, and was severely underestimated during the peak growth periods. The percentage difference during the corn planting years was up to 30% in contrast to less than 10% for the soybean years. In addition, we also found that 8-day patterns of MODIS GPP product during 2001 to 2006 were nearly identical without considering the differences between C3 and C4 photosynthetic pathways for corn and soybean crops. It suggests that improvement of the MODIS GPP product needs to consider this point for the purpose of monitoring crop WUE accurately.
Ecosystem WUE of corn is generally higher than that of soybean. Statistical analyses for the flux tower site US-Bo1 during 2001–2006 found that tower-based WUE of corn during the crop-growth period ranged from 2.22 g·C·kg−1 H2O to 3.10 g·C·kg−1 H2O with the mean value of 2.81 g·C·kg−1 H2O, while soybean WUEEC spanned between 1.58 g·C·kg−1 H2O and 2.83 g·C·kg−1 H2O with the average value of 2.16 g·C·kg−1 H2O. These differences are related to the plant physiological pathways, as well as the leaf structure and architecture that differ between corn (C4 plant) and soybean (C3 plant) [48,49]. C4 crops are generally found to have high phosphoenolpyruvate carboxylase activity [50,51]. Theoretically, water use efficiency of plants is affected by the leaf-to-air CO2 concentration difference and VPD [52]. Recent studies [53,54] have shown the existence of further internal resistances into the leaf (called mesophyll conductance) that may constrain as much as stomata the CO2 diffusion pathway and are also key actors in controlling and determining plant WUE. Under the same background and environmental conditions, WUE of a C3 crop is apparently lower than C4 crop because CO2 concentration is still higher in C4 leaves than in C3 leaves [51,55]. Therefore, the characteristics of species determine a larger WUE for C4 plant than for C3 plant. In addition, many studies have found that C4 vegetation exhibited increasing WUE in response to rising atmospheric CO2 concentration by reducing the stomatal aperture as well as the transpiration rate compared with C3 species [6,56,57]. We hypothesize that that the lack of this C3/C4 distinction in the biome-specific parameters in BPLUT causes substantial uncertainty in the MODIS GPP product and the estimation of WUE.
Figure 4. Comparison of seasonal dynamics in gross primary production and evapotranspiration between flux tower measurements (GPPEC, ETEC) and MODIS estimates (GPPRS, ETRS) at the flux tower site US-Bo1 during 2001–2006.
Remotesensing 07 11016 g004

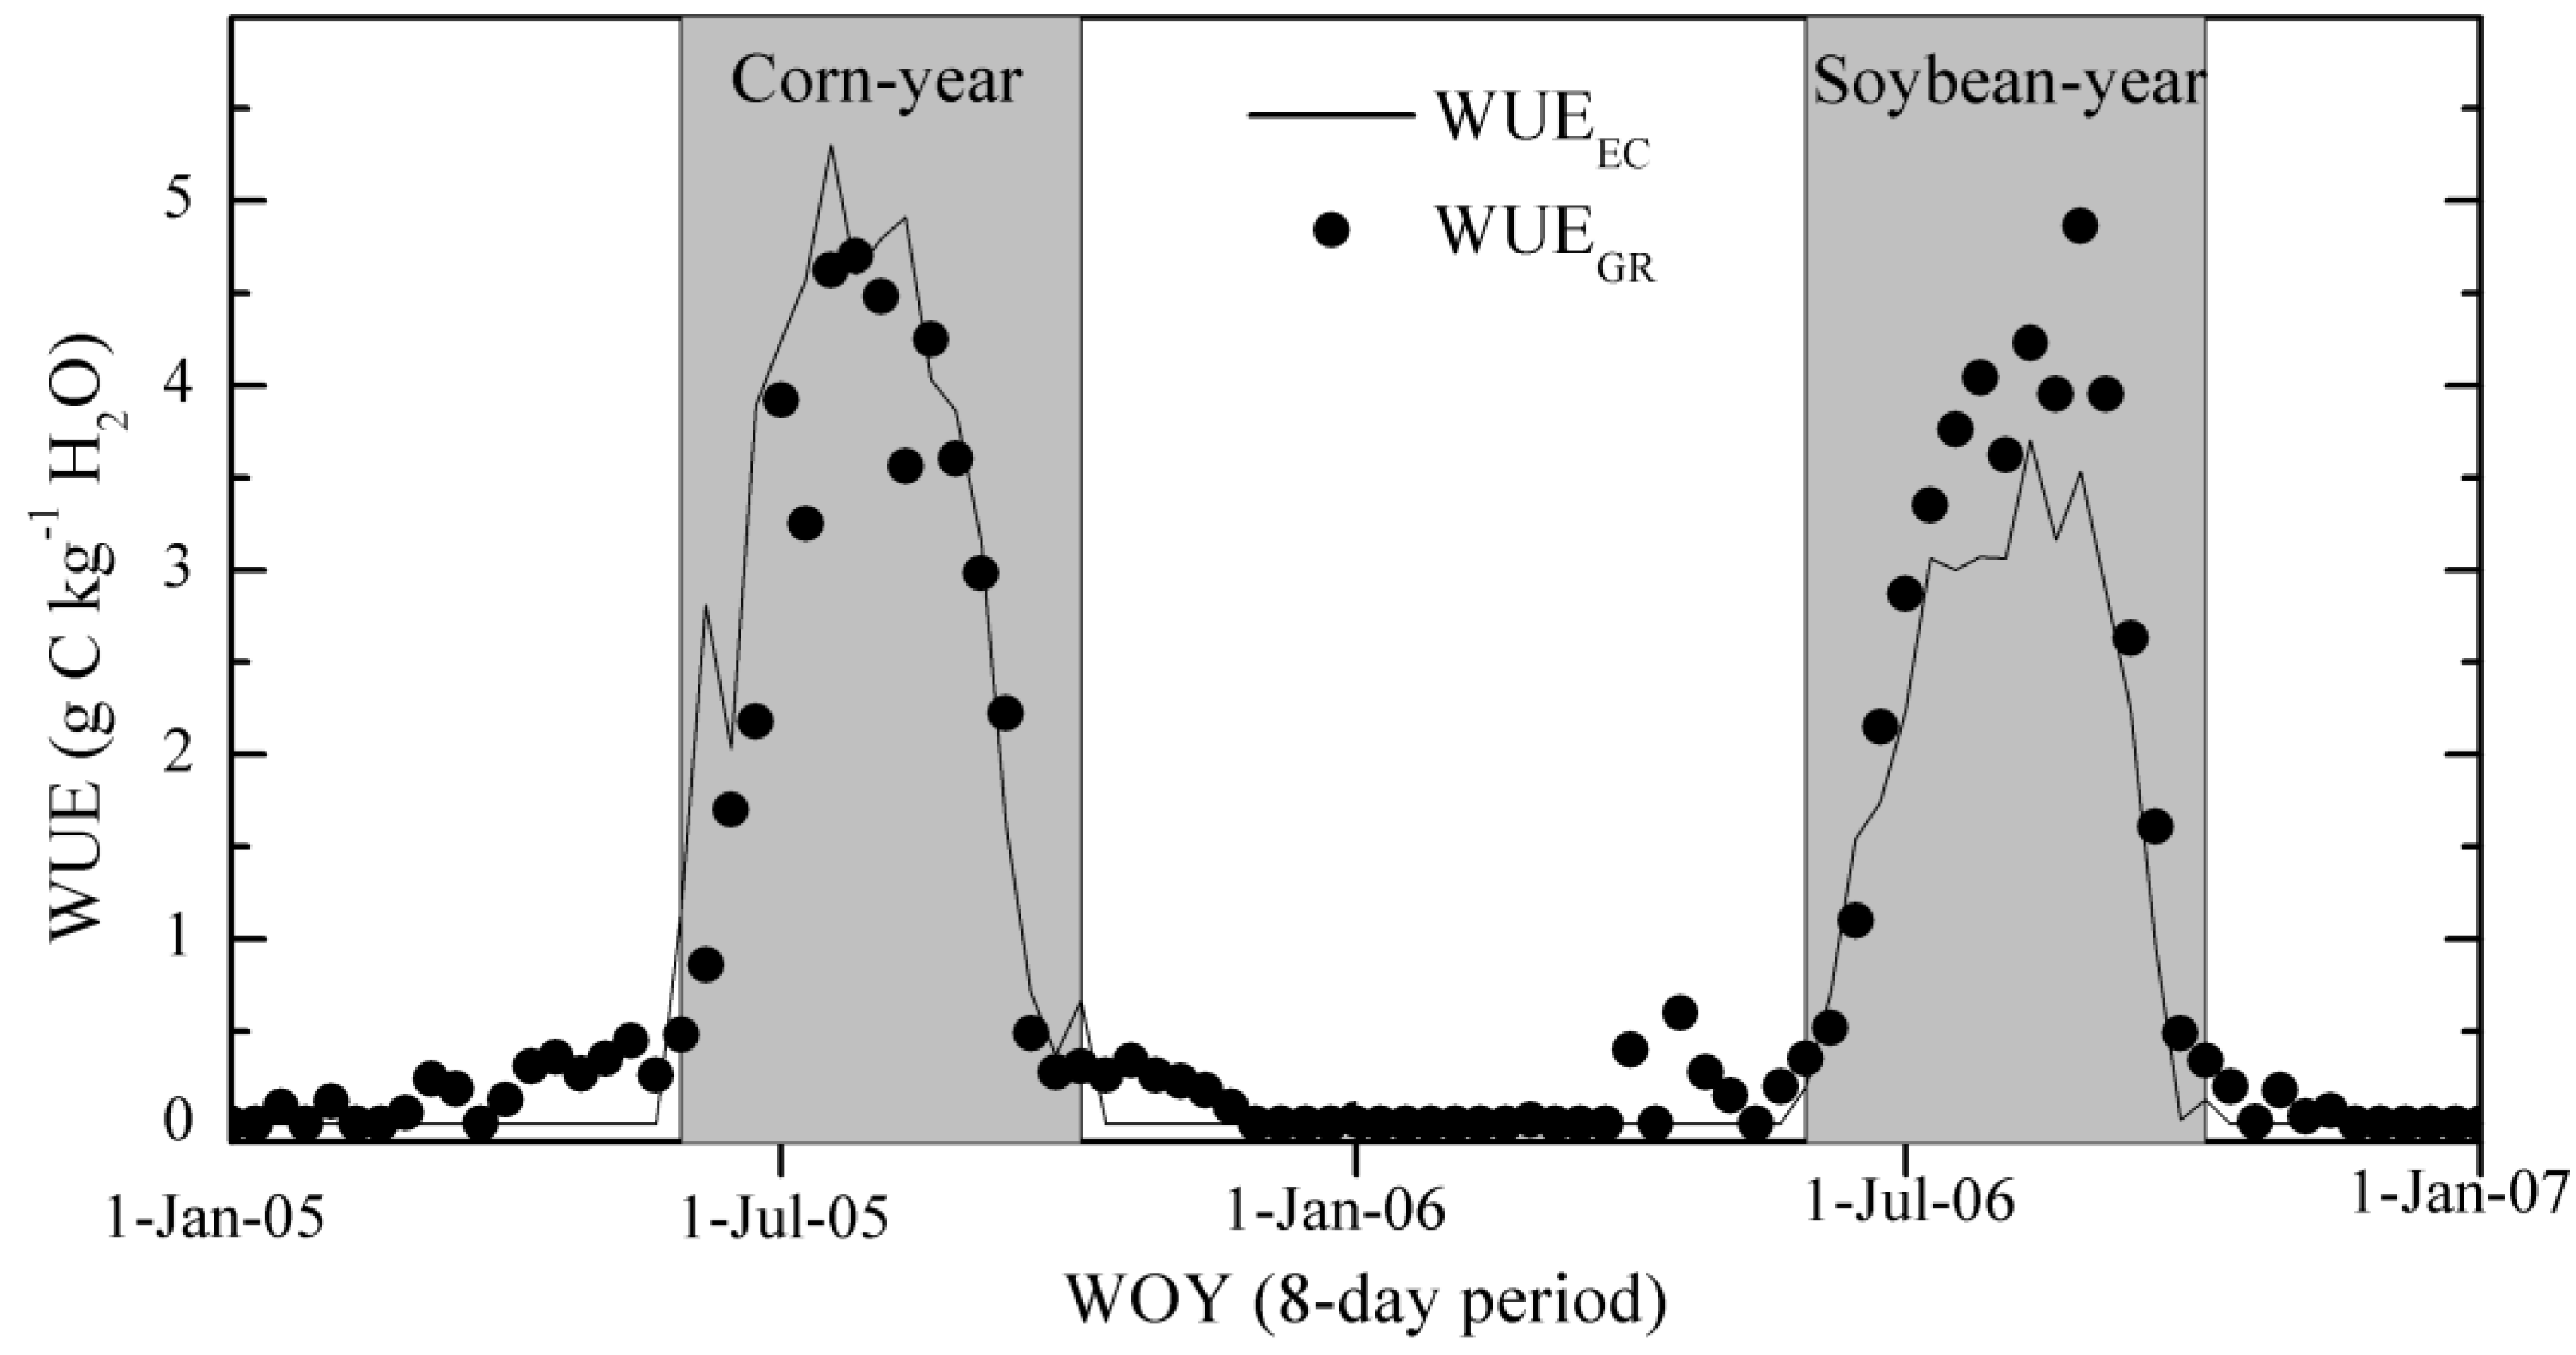
3.3. An Alternative Method to Estimate WUE Using MODIS EVI Data

Considering that large uncertainties exist in the MODIS WUE estimates from GPP and ET, an alternative method needs to be developed in order to extrapolate tower-based WUE measurements to different time and space scales. The strong relationship between time series of MODIS EVI data and ecosystem WUE also indicated this potential. Here, we established a regression model that was solely based on the 8-day EVI data. For the corn-planting year and soybean-planting year, crop WUE can be calculated using the following Equations (4) and (5), respectively:
WUEGR = 7.245 × EVI − 0.871 (R2 = 0.82; RMSE = 1.07)
WUEGR = 6.601 × EVI − 0.938 (R2 = 0.90; RMSE = 0.69)
Figure 5. Seasonal dynamics in ecosystem water use efficiency from flux tower measurements (WUEEC) and estimates based on MODIS EVI data (WUEGR) at the flux tower site US-Bo1 during 2005 (corn) and 2006 (soybean), with the growing seasons displayed in gray.
Remotesensing 07 11016 g005
Figure 6. A scatterplot comparison between ecosystem WUE from flux tower measurements (WUEEC) and estimates based on MODIS EVI data (WUEGR) at the flux tower site US-Bo1 during the growing season of 2005 (corn) and 2006 (soybean).
Remotesensing 07 11016 g006
The performances of these empirical models (GR) was evaluated using scatter plots between the predicted (WUEGR) vs. measured WUE (WUEEC) and the seasonal variations between them in 2005 (corn-year) and 2006 (soybean-year). As shown in Figure 5 and Figure 6, the seasonal patterns of WUE simulated by the GR model agreed reasonably well with the tower-based observations for both corn and soybean in 2005–2006, which also exhibited a nearly linear relationship. Compared with the indirect MODIS WUE estimates (WUERS) from GPP and ET in Figure 3, large discrepancies in ecosystem WUE at the beginning and ending of crop growing season and peak periods were generally reduced. This result may be explained by the underlying phenological information in the time-series of MODIS EVI data. A large number of researchers have used time series of EVI data to extract phenology characteristics [36,58,59]. Chen et al. [60] also indicated that in order to precisely evaluate the land-surface mass (water and carbon fluxes) and energy budgets, we need to account for crop phenology in ecosystem models. RMSE of WUERS and WUEGR with WUEEC over the growing season were 2.24 g·C·kg−1 H2O vs 0.79 g·C·kg−1 H2O in 2005 for corn, and 1.58 g·C·kg−1 H2O vs 0.66 g·C·kg−1 H2O in 2006 for soybean. Therefore, this simple empirical model provides a very reasonable estimate of ecosystem-level WUE.

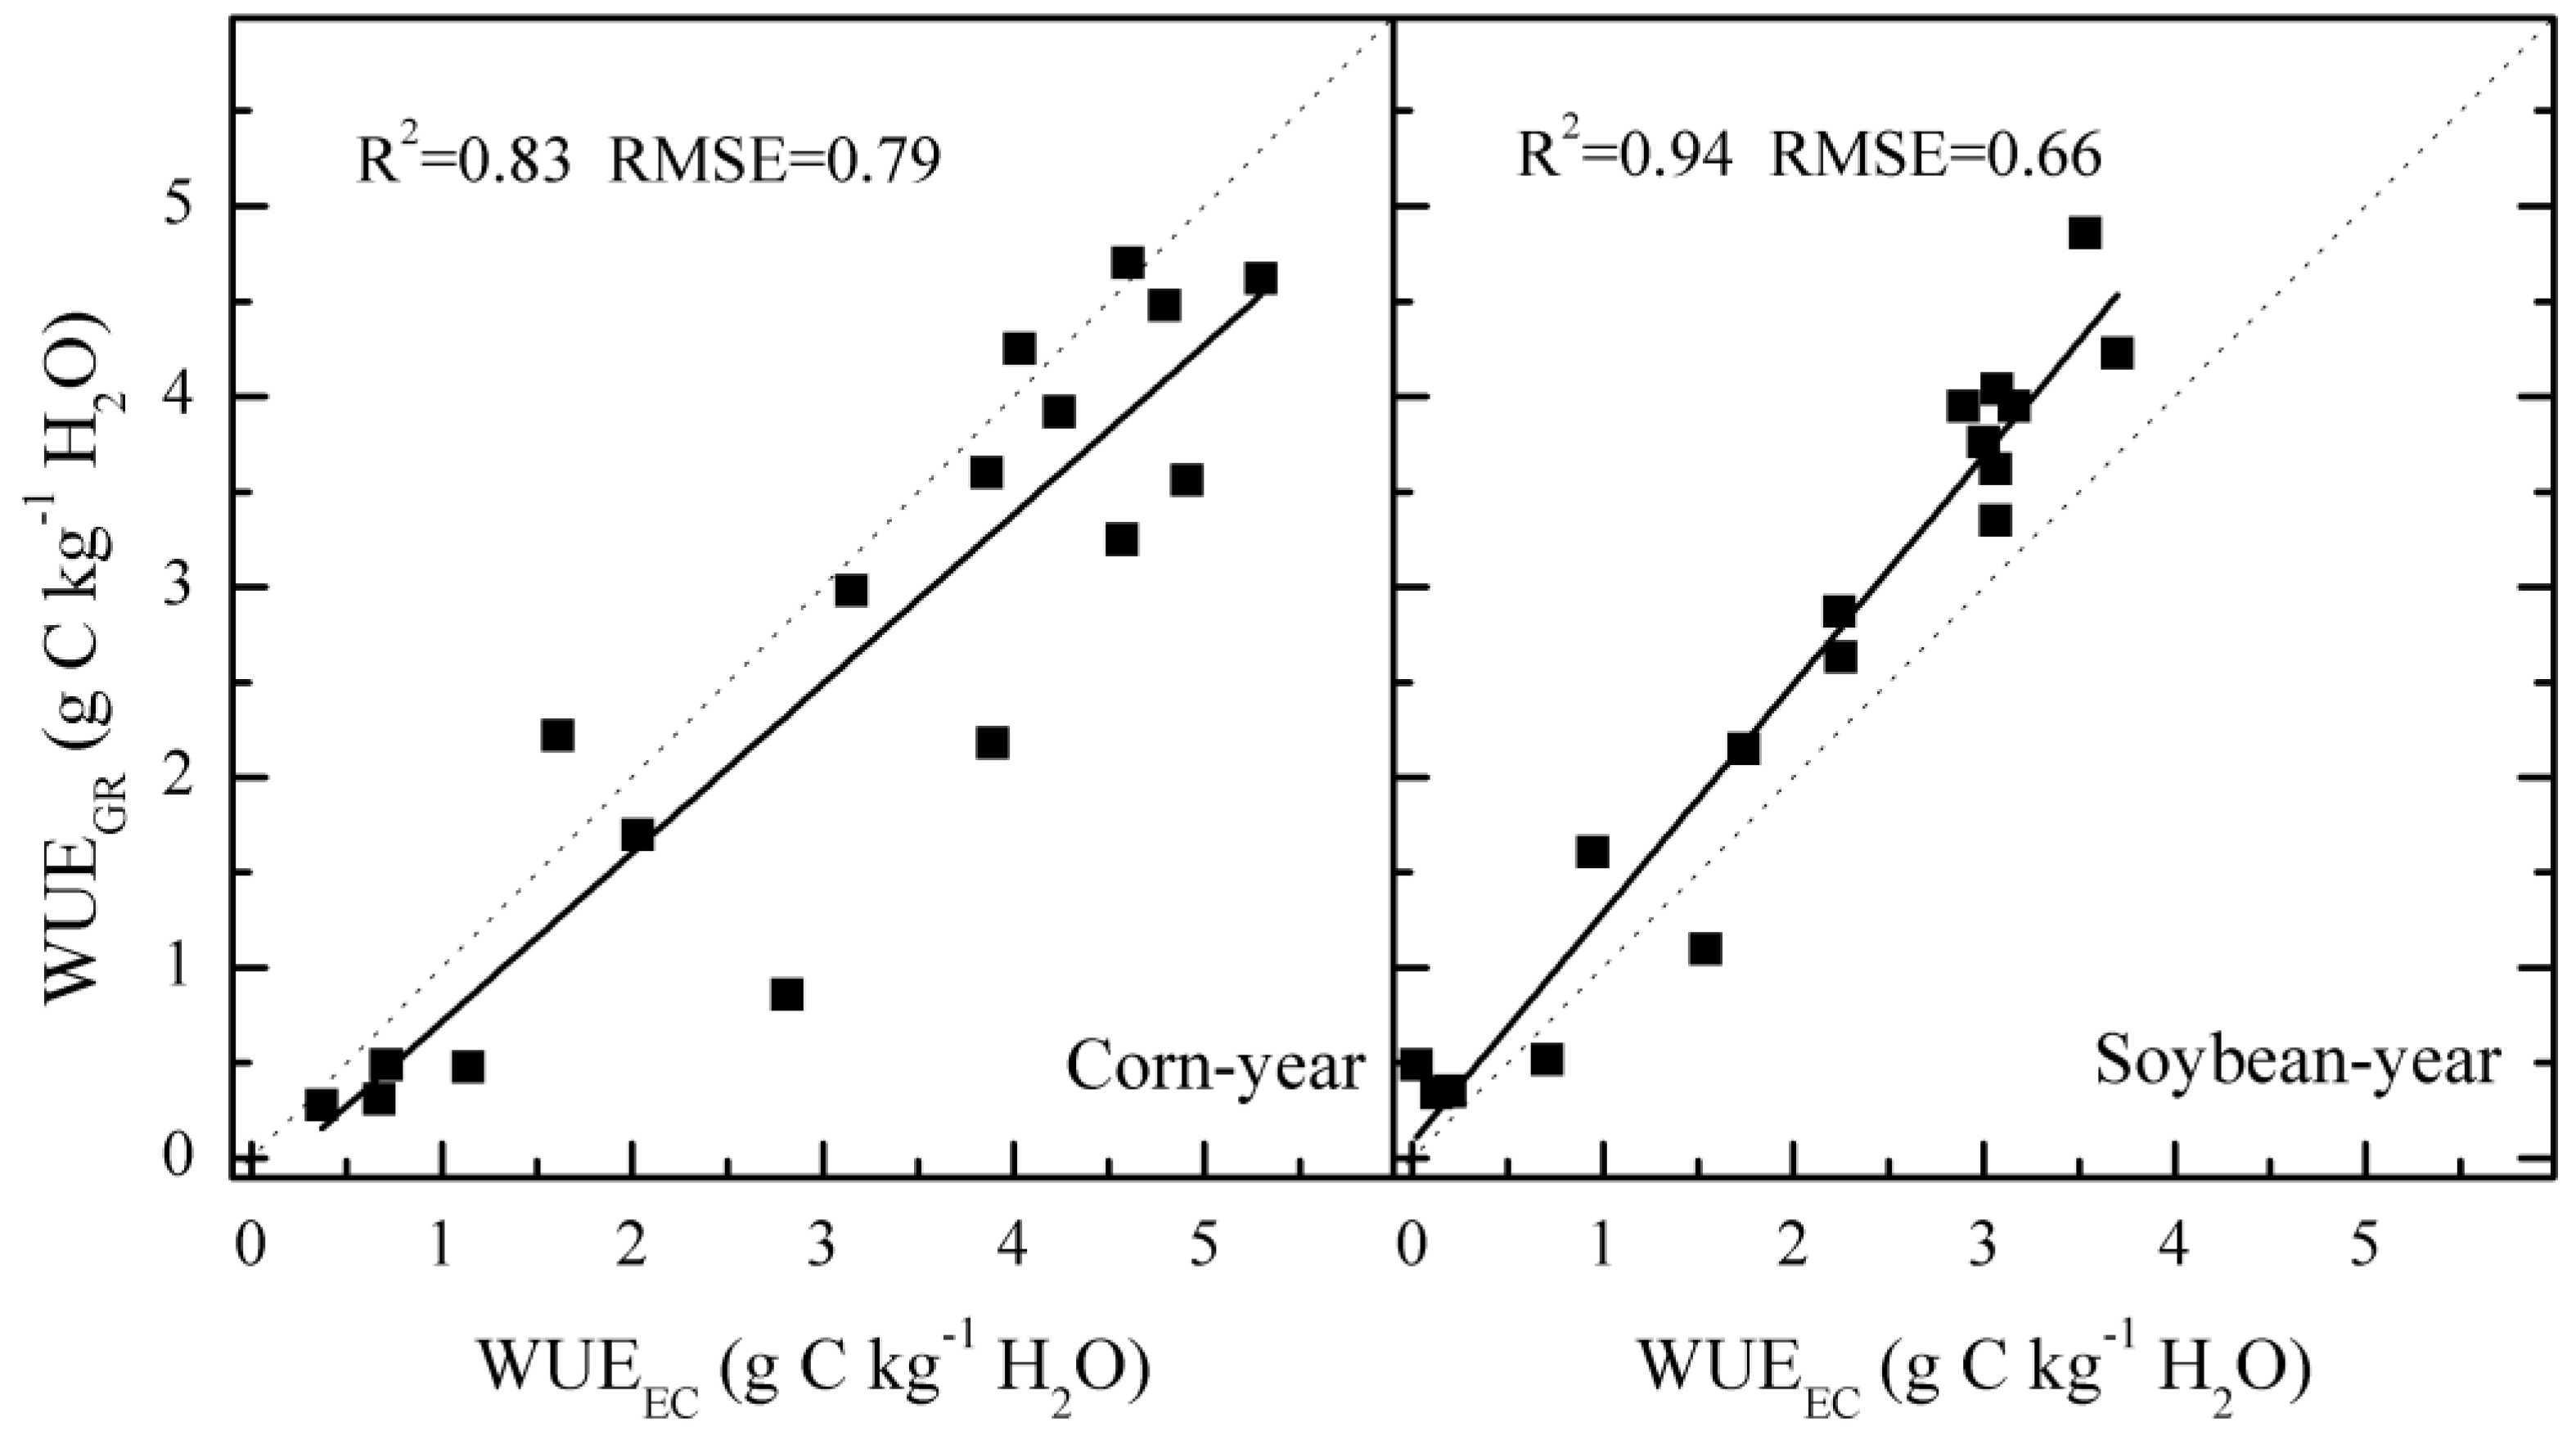
3.4. Independent Validation of the Proposed Models

Although the calibrated model developed at the US-Bo1 site provided fairly good estimates of crop WUE directly from MODIS EVI data, its applicability to other crop sites needs to be evaluated before spatial up-scaling of site-level observations to regional scale. Therefore, flux measurements at additional US-Ro1 crop site were used for independent validation.
Comparisons between both WUERS and WUEGR with 8-day tower-based WUEEC are shown in Figure 7, Figure 8 and Figure 9. Validation of the empirical model at the independent US-Ro1 site also exhibited a significant improvement in ecosystem WUE simulation, especially for the soybean-planting year. The WUE estimates by exclusive use of MODIS EVI data captured the seasonal variations in ecosystem WUE in spite of a slight underestimation during the peak-growth period of the corn year, which may be ascribed to the effects of different farming practices on the vegetation index. Although both US-Bo1 and US-Ro1 sites are annual corn/soybean rotation fields, US-Bo1 is under continuous no-till treatment whereas US-Ro1 adopts conventional tillage management [10,29]. The scatter plots showed that R2 and RMSE between WUERS with WUEEC were 0.02 and 2.21 g·C·kg−1 H2O vs the values of 0.86 and 1.15 g·C·kg−1 H2O between WUEGR and WUEEC, respectively in 2005. During the soybean-planting year—2006, R2 and RMSE between WUERS with WUEEC were 0.23 and 1.61 g·C·kg−1 H2O vs 0.82 and 0.72 g·C·kg−1 H2O between WUEGR and WUEEC, respectively. Therefore, all crop WUE estimates have been improved substantially with the use of EVI.
However, owing to the diversity in climate conditions, crop types, and management practices [37,45,61,62], it is still challenging to develop a general a robust model for WUE estimation. For agriculture, monitoring ecosystem WUE of croplands in view of C3 and C4 photosynthetic pathways needs to be considered. Nevertheless, although our calibrated model for estimating 8-day WUE of corn and soybean captured the general tendencies, there still existed large discrepancies for individual periods such as the peak growing season of the corn-year at US-Ro1 (Figure 7). Normally, tower-based WUE of corn is generally higher than that of soybean. But the proposed models resulted in almost the same WUE values for both corn and soybean, which was notobserved in the flux tower measurements. On one hand, the flux sites and dataset used for calibration remained rather limited, whereas diverse farming practices are implemented across the globe. This challenges the general application of such models. On the other hand, our analyses and simple model for typical cropping systems in the United States indicate there is good potential for upscaling WUE especially when water is not severely limited. Medrano et al. [63] showed that under water stress, plant WUE usually increased and GPP decreased. Therefore, it is necessary to examine the EVI-based models' sensitivities to drought during drought and non-drought years. Dong et al. [64] also compared four EVI-based models including the Vegetation Photosynthesis Model (VPM), Temperature and Greenness (TG) model, Greenness and Radiation (GR) model and Vegetation Index (VI) model to estimate GPP of corn and soybean croplands and grasslands under drought conditions. They found that these four models had reasonably good agreement with the GPP estimated from EC-based observations in non-drought years, while the VPM model performed best, followed by the VI, GR and TG model in drought years that may be ascribed to the VPM model incorporating a satellite-based water index.
Figure 7. Seasonal dynamics in ecosystem WUE from flux tower measurements (WUEEC), predicted from MODIS products (WUERS), and estimates based on MODIS EVI data (WUEGR) at the flux tower site US-Ro1 during 2005 (corn) and 2006 (soybean).
Remotesensing 07 11016 g007
In addition to this, ecosystem WUE ultimately reflected the photosynthetic productivity per amount of water consumption; therefore, how to explain and quantify the variability of crop WUE from the environmental mechanisms remains essential. This study found that the WUE estimates from MODIS GPP and ET products performed poorly in capturing the seasonal dynamics of tower-based observations, which were mainly attributed to the uncertainties in the GPP estimates. A number of studies have indicated this deficiency [65,66]. Various efforts are ongoing to improve the GPP performance including the algorithm and data inputs. Xiao et al. [67,68] developed the satellite-based VPM model using MODIS EVI, land surface water index (LSWI) and climate data, and the predicted GPP values agreed reasonably well with observed GPP for both deciduous broadleaf forest and evergreen needleleaf forest. Wu et al. [69] calibrated the GR model for estimating monthly GPP at a wide range of ecosystems and provided better GPP estimates than the TG model and the standard MODIS GPP product. Peng et al. [70] also developed a simple model using a chlorophyll-related vegetation index to estimate crop GPP and accurately detected GPP variations in both irrigated and rainfed croplands in three Nebraska AmeriFlux sites. Based on these studies and our own work, there remains a need to improve the current MODIS GPP product and then re-evaluate our ability to estimate WUE.
Figure 8. A linear comparison between ecosystem WUE from flux tower measurements (WUEEC) with predictions from MODIS products (WUERS) and estimates based on MODIS EVI data (WUEGR), respectively at the flux tower site US-Ro1 during the growing season of 2005 (corn).
Remotesensing 07 11016 g008
Figure 9. A linear comparison between ecosystem WUE from tower measurements (WUEEC) with predictions from MODIS products (WUERS) and estimates based on MODIS EVI data (WUEGR), respectively at the flux tower site US-Ro1 during the growing season of 2006 (soybean).
Remotesensing 07 11016 g009

4. Conclusions

Quantitatively evaluating the spatiotemporal patterns of ecosystem WUE and the underlying mechanisms are of great significance for understanding the effect of hydrological change on the ecosystem carbon budget. In this study, we assessed the driving environmental controls on crop WUE at corn/soybean rotation fields. As a proxy of vegetation responses to environmental conditions, time-series MODIS EVI data showed a strong correlation with the variability in crop WUE. Regional and global WUE have been estimated by integrating MOD17 GPP and MOD16 ET products. However, we observed large discrepancies between WUERS and WUEEC for a few 8-day periods. The overall RMSE for corn and soybean were 2.24 g·C·kg−1 H2O and 1.58 g·C·kg−1 H2O, which was mainly attributed to the great uncertainties in the MODIS GPP product. Fortunately, an alternative approach that is solely based time-series EVI data performed reasonably well in capturing the seasonal variations in crop WUE from EC flux sites. RMSE during the growing season of corn and soybean improved to 0.79 g·C·kg−1 H2O and 0.66 g·C·kg−1 H2O. Independent validation also showed the model’s potential for broad application. During the corn-planting year and soybean-planting year, the RMSE between WUEEC with WUERS and WUEGR were 2.21 g·C·kg−1 H2O vs 1.15 g·C·kg−1 H2O, and 1.61 g·C·kg−1 H2O vs 0.72 g·C·kg−1 H2O, respectively. This study also revealed that MODIS WUE estimates from the perspective of C3 and C4 may be a reasonable method to predict the seasonal patterns in WUE of farmland systems. Such analyses will be helpful for agricultural policy makers and managers to plan and implement strategic goals of water resource management and food supply.

Acknowledgments

This study was jointly supported by the National Natural Science Foundation of China (41401221, 41271500, 41201496), the Natural Science Foundation of Jiangsu Province, China (BK20141058), the Key Research Program of the Chinese Academy of Sciences (KZZD-EW-10-04), and the Opening Funds of State Key Laboratory of Remote Sensing Science (OFSLRSS201502) and Key Laboratory of Poyang Lake Wetland and Watershed Research (Jiangxi Normal University), Ministry of Education (PK2014002). This work used eddy covariance data acquired by the AmeriFlux. A large number of technicians, graduate and doctoral students are acknowledged for help in site management, data collection and elaboration. We thank the principal investigators and contributors of the MODIS products, the Distributed Active Archive Center of the Oak Ridge National Laboratory, and the Earth Observing System Data for making these MODIS data available. We also thank the group of Qiaozhen Mu at the University of Montana to provide satellite-derived global record of land surface evapotranspiration product.

Author Contributions

Xuguang Tang and Hengpeng Li. contributed equally to design this study and write this manuscript including the figures and tables. Tim J. Griffis, Xibao Xu, Zhi Ding and Guihua Liu contributed significantly to the discussion of results and manuscript refinement.

Conflicts of Interest

The authors declare no conflict of interest.

References

  1. Sinclair, T.R.; Tanner, C.B.; Bennett, J.M. Water-use efficiency in crop production. Bioscience 1984, 34, 36–40. [Google Scholar] [CrossRef]
  2. Niu, S.L.; Xing, X.R.; Zhang, Z.; Xia, J.Y.; Zhou, X.H.; Song, B.; Li, L.H.; Wan, S.Q. Water-use efficiency in response to climate change: From leaf to ecosystem in a temperate steppe. Glob. Chang. Biol. 2011, 17, 1073–1082. [Google Scholar] [CrossRef]
  3. Berry, J.A.; Beerling, D.J.; Franks, P.J. Stomata: Key players in the earth system, past and present. Curr. Opin. Plant Biol. 2010, 13, 233–240. [Google Scholar] [CrossRef] [PubMed]
  4. Farquhar, G.D.; Sharkey, T.D. Stomatal conductance and photosynthesis. Annu. Rev. Plant Phys. 1982, 33, 317–345. [Google Scholar] [CrossRef]
  5. Zhou, S.; Yu, B.F.; Huang, Y.F.; Wang, G.Q. The effect of vapor pressure deficit on water use efficiency at the subdaily time scale. Geophys. Res. Lett. 2014, 41, 5005–5013. [Google Scholar] [CrossRef]
  6. Tong, X.J.; Li, J.; Yu, Q.; Qin, Z. Ecosystem water use efficiency in an irrigated cropland in the North China Plain. J. Hydrol. 2009, 374, 329–337. [Google Scholar] [CrossRef]
  7. Ito, A.; Inatomi, M. Water-use efficiency of the terrestrial biosphere: A model analysis focusing on interactions between the global carbon and water cycles. J. Hydrometeorol. 2012, 13, 681–694. [Google Scholar] [CrossRef]
  8. Solomon, S.; Plattner, G.K.; Knutti, R.; Friedlingstein, P. Irreversible climate change due to carbon dioxide emissions. Proc. Natl. Acad. Sci. USA 2009, 106, 1704–1709. [Google Scholar] [CrossRef] [PubMed]
  9. Ainsworth, E.A.; Long, S.P. What have we learned from 15 years of free-air CO2 enrichment (face)? A meta-analytic review of the responses of photosynthesis, canopy. New Phytol. 2005, 165, 351–371. [Google Scholar] [CrossRef] [PubMed]
  10. Baker, J.M.; Griffis, T.J. Examining strategies to improve the carbon balance of corn/soybean agriculture using eddy covariance and mass balance techniques. Agr. Forest Meteorol. 2005, 128, 163–177. [Google Scholar] [CrossRef]
  11. Lal, R. Soil carbon sequestration impacts on global climate change and food security. Science 2004, 304, 1623–1627. [Google Scholar] [CrossRef] [PubMed]
  12. Thenkabail, P.S.; Hanjra, M.A.; Dheeravath, V.; Gumma, M. A holistic view of global croplands and their water use for ensuring global food security in the 21st century through advanced remote sensing and non-remote sensing approaches. Remote Sens. 2010, 2, 211–261. [Google Scholar] [CrossRef] [Green Version]
  13. Baldocchi, D.; Falge, E.; Gu, L.H.; Olson, R.; Hollinger, D.; Running, S.; Anthoni, P.; Bernhofer, C.; Davis, K.; Evans, R.; et al. Fluxnet: A new tool to study the temporal and spatial variability of ecosystem-scale carbon dioxide, water vapor, and energy flux densities. Bull. Am. Meteorol. Soc. 2001, 82, 2415–2434. [Google Scholar] [CrossRef]
  14. Reichstein, M.; Papale, D.; Valentini, R.; Aubinet, M.; Bernhofer, C.; Knohl, A.; Laurila, T.; Lindroth, A.; Moors, E.; Pilegaard, K.; et al. Determinants of terrestrial ecosystem carbon balance inferred from European eddy covariance flux sites. Geophys. Res. Lett. 2007. [Google Scholar] [CrossRef]
  15. Williams, C.A.; Reichstein, M.; Buchmann, N.; Baldocchi, D.; Beer, C.; Schwalm, C.; Wohlfahrt, G.; Hasler, N.; Bernhofer, C.; Foken, T.; et al. Climate and vegetation controls on the surface water balance: Synthesis of evapotranspiration measured across a global network of flux towers. Water Resour. Res. 2012. [Google Scholar] [CrossRef]
  16. Zhao, M.S.; Heinsch, F.A.; Nemani, R.R.; Running, S.W. Improvements of the MODIS terrestrial gross and net primary production global data set. Remote Sens. Environ. 2005, 95, 164–176. [Google Scholar] [CrossRef]
  17. Lu, X.L.; Zhuang, Q.L. Evaluating evapotranspiration and water-use efficiency of terrestrial ecosystems in the conterminous United States using MODIS and AmeriFlux data. Remote Sens. Environ. 2010, 114, 1924–1939. [Google Scholar] [CrossRef]
  18. Jung, M.; Reichstein, M.; Ciais, P.; Seneviratne, S.I.; Sheffield, J.; Goulden, M.L.; Bonan, G.; Cescatti, A.; Chen, J.Q.; de Jeu, R.; et al. Recent decline in the global land evapotranspiration trend due to limited moisture supply. Nature 2010, 467, 951–954. [Google Scholar] [CrossRef] [PubMed]
  19. Sjostrom, M.; Ardo, J.; Arneth, A.; Boulain, N.; Cappelaere, B.; Eklundh, L.; de Grandcourt, A.; Kutsch, W.L.; Merbold, L.; Nouvellon, Y.; et al. Exploring the potential of MODIS EVI for modeling gross primary production across African ecosystems. Remote Sens. Environ. 2011, 115, 1081–1089. [Google Scholar] [CrossRef]
  20. Jarvis, P.G. Scaling processes and problems. Plant Cell Environ. 1995, 18, 1079–1089. [Google Scholar] [CrossRef]
  21. Zhang, J.H.; Hu, Y.L.; Xiao, X.M.; Chen, P.S.; Han, S.J.; Song, G.Z.; Yu, G.R. Satellite-based estimation of evapotranspiration of an old-growth temperate mixed forest. Agr. Forest Meteorol. 2009, 149, 976–984. [Google Scholar] [CrossRef]
  22. Yang, Y.T.; Long, D.; Shang, S.H. Remote estimation of terrestrial evapotranspiration without using meteorological data. Geophys. Res. Lett. 2013, 40, 3026–3030. [Google Scholar] [CrossRef]
  23. Reichstein, M.; Bahn, M.; Mahecha, M.D.; Kattge, J.; Baldocchi, D.D. Linking plant and ecosystem functional biogeography. Proc. Natl. Acad. Sci. USA 2014, 111, 13697–13702. [Google Scholar] [CrossRef] [PubMed]
  24. Tang, X.G.; Li, H.P.; Desai, A.R.; Nagy, Z.; Luo, J.H.; Kolb, T.E.; Olioso, A.; Xu, X.B.; Yao, L.; Kutsch, W.; et al. How is water-use efficiency of terrestrial ecosystems distributed and changing on earth? Sci. Rep-UK 2014. [Google Scholar] [CrossRef] [PubMed] [Green Version]
  25. Lindroth, A.; Verwijst, T.; Halldin, S. Water-use efficiency of willow: Variation with season, humidity and biomass allocation. J. Hydrol. 1994, 156, 1–19. [Google Scholar] [CrossRef]
  26. Hatfield, J.L.; Sauer, T.J.; Prueger, J.H. Managing soils to achieve greater water use efficiency: A review. Agron. J. 2001, 93, 271–280. [Google Scholar] [CrossRef]
  27. Monzon, J.P.; Sadras, V.O.; Andrade, F.H. Modelled yield and water use efficiency of maize in response to crop management and southern oscillation index in a soil-climate transect in Argentina. Field Crop Res. 2012, 130, 8–18. [Google Scholar] [CrossRef]
  28. Lawford, R.G. A midterm report on the GEWEX Continental-Scale International Project (GCIP). J. Geophys. Res. Atmos. 1999, 104, 19279–19292. [Google Scholar] [CrossRef]
  29. Meyers, T.P.; Hollinger, S.E. An assessment of storage terms in the surface energy balance of maize and soybean. Agr. Forest Meteorol. 2004, 125, 105–115. [Google Scholar] [CrossRef]
  30. Bernacchi, C.J.; Hollinger, S.E.; Meyers, T. The conversion of the corn/soybean ecosystem to no-till agriculture may result in a carbon sink. Global Chang. Biol. 2005, 11, 1867–1872. [Google Scholar] [CrossRef]
  31. Kalfas, J.L.; Xiao, X.M.; Vanegas, D.X.; Verma, S.B.; Suyker, A.E. Modeling gross primary production of irrigated and rain-fed maize using MODIS imagery and CO2 flux tower data. Agr. Forest Meteorol. 2011, 151, 1514–1528. [Google Scholar] [CrossRef]
  32. Mu, Q.Z.; Zhao, M.S.; Running, S.W. Improvements to a MODIS global terrestrial evapotranspiration algorithm. Remote Sens. Environ. 2011, 115, 1781–1800. [Google Scholar] [CrossRef]
  33. Numerical terradynamic simulation group. Available online: http://www.ntsg.umt.edu/project (accessed on 28 July 2015).
  34. MODIS land product subsets. Available online: http://daac.ornl.gov/MODIS/ (accessed on 28 July 2015).
  35. Sims, D.A.; Rahman, A.F.; Cordova, V.D.; El-Masri, B.Z.; Baldocchi, D.D.; Bolstad, P.V.; Flanagan, L.B.; Goldstein, A.H.; Hollinger, D.Y.; Misson, L.; et al. A new model of gross primary productivity for North American ecosystems based solely on the enhanced vegetation index and land surface temperature from MODIS. Remote Sens. Environ. 2008, 112, 1633–1646. [Google Scholar] [CrossRef]
  36. Tang, X.G.; Wang, X.; Wang, Z.M.; Liu, D.W.; Jia, M.M.; Dong, Z.Y.; Xie, J.; Ding, Z.; Wang, H.R.; Liu, X.P. Influence of vegetation phenology on modelling carbon fluxes in temperate deciduous forest by exclusive use of MODIS time-series data. Int. J. Remote Sens. 2013, 34, 8373–8392. [Google Scholar] [CrossRef]
  37. Wagle, P.; Xiao, X.M.; Suyker, A.E. Estimation and analysis of gross primary production of soybean under various management practices and drought conditions. ISPRS J. Photogramm. Remote Sens. 2015, 99, 70–83. [Google Scholar] [CrossRef]
  38. Huete, A.; Didan, K.; Miura, T.; Rodriguez, E.P.; Gao, X.; Ferreira, L.G. Overview of the radiometric and biophysical performance of the MODIS vegetation indices. Remote Sens. Environ. 2002, 83, 195–213. [Google Scholar] [CrossRef]
  39. AmeriFlux site and data exploration system. Available online: http://ameriflux.ornl.gov/ (accessed on 28 July 2015).
  40. Reichstein, M.; Falge, E.; Baldocchi, D.; Papale, D.; Aubinet, M.; Berbigier, P.; Bernhofer, C.; Buchmann, N.; Gilmanov, T.; Granier, A.; et al. On the separation of net ecosystem exchange into assimilation and ecosystem respiration: Review and improved algorithm. Glob. Chang. Biol. 2005, 11, 1424–1439. [Google Scholar] [CrossRef]
  41. Papale, D.; Valentini, A. A new assessment of European forests carbon exchanges by eddy fluxes and artificial neural network spatialization. Glob. Chang. Biol. 2003, 9, 525–535. [Google Scholar] [CrossRef]
  42. Moffat, A.M.; Papale, D.; Reichstein, M.; Hollinger, D.Y.; Richardson, A.D.; Barr, A.G.; Beckstein, C.; Braswell, B.H.; Churkina, G.; Desai, A.R.; et al. Comprehensive comparison of gap-filling techniques for eddy covariance net carbon fluxes. Agr. Forest Meteorol. 2007, 147, 209–232. [Google Scholar] [CrossRef]
  43. Beer, C.; Ciais, P.; Reichstein, M.; Baldocchi, D.; Law, B.E.; Papale, D.; Soussana, J.F.; Ammann, C.; Buchmann, N.; Frank, D.; et al. Temporal and among-site variability of inherent water use efficiency at the ecosystem level. Glob. Biogeochem. Cycles 2009. [Google Scholar] [CrossRef]
  44. Desai, A.R.; Noormets, A.; Bolstad, P.V.; Chen, J.Q.; Cook, B.D.; Davis, K.J.; Euskirchen, E.S.; Gough, C.M.; Martin, J.G.; Ricciuto, D.M.; et al. Influence of vegetation and seasonal forcing on carbon dioxide fluxes across the Upper Midwest, USA: Implications for regional scaling. Agr. Forest Meteorol. 2008, 148, 288–308. [Google Scholar] [CrossRef]
  45. Hu, Z.M.; Yu, G.R.; Fu, Y.L.; Sun, X.M.; Li, Y.N.; Shi, P.L.; Wangw, Y.F.; Zheng, Z.M. Effects of vegetation control on ecosystem water use efficiency within and among four grassland ecosystems in China. Glob. Chang. Biol. 2008, 14, 1609–1619. [Google Scholar] [CrossRef]
  46. Pita, G.; Gielen, B.; Zona, D.; Rodrigues, A.; Rambal, S.; Janssens, I.A.; Ceulemans, R. Carbon and water vapor fluxes over four forests in two contrasting climatic zones. Agr. Forest Meteorol. 2013, 180, 211–224. [Google Scholar] [CrossRef]
  47. Zhu, X.J.; Yu, G.R.; Wang, Q.F.; Hu, Z.M.; Han, S.J.; Yan, J.H.; Wang, Y.F.; Zhao, L. Seasonal dynamics of water use efficiency of typical forest and grassland ecosystems in China. J. Forest Res. 2014, 19, 70–76. [Google Scholar] [CrossRef]
  48. Shu, G.P.; Pontieri, V.; Dengler, N.G.; Mets, L.J. Light induction of cell type differentiation and cell-type-specific gene expression in cotyledons of a C-4 plant, Flaveria trinervia. Plant Physiol. 1999, 121, 731–741. [Google Scholar] [CrossRef] [PubMed]
  49. Gitelson, A.A.; Vina, A.; Verma, S.B.; Rundquist, D.C.; Arkebauer, T.J.; Keydan, G.; Leavitt, B.; Ciganda, V.; Burba, G.G.; Suyker, A.E. Relationship between gross primary production and chlorophyll content in crops: Implications for the synoptic monitoring of vegetation productivity. J. Geophys. Res. Atmos. 2006. [Google Scholar] [CrossRef]
  50. Uedan, K.; Sugiyama, T. Purification and characterization of phosphoenolpyruvate carboxylase from maize leaves. Plant Physiol. 1976, 57, 906–910. [Google Scholar] [CrossRef] [PubMed]
  51. Still, C.J.; Berry, J.A.; Collatz, G.J.; DeFries, R.S. Global distribution of C-3 and C-4 vegetation: Carbon cycle implications. Glob. Biogeochem. Cycles 2003. [Google Scholar] [CrossRef]
  52. Morison, J.I.L.; Gifford, R.M. Stomatal sensitivity to carbon-dioxide and humidity: A comparison of 2 C-3 and 2 C-4 grass species. Plant Physiol. 1983, 71, 789–796. [Google Scholar] [CrossRef] [PubMed]
  53. Flexas, J.; Niinemets, U.; Galle, A.; Barbour, M.M.; Centritto, M.; Diaz-Espejo, A.; Douthe, C.; Galmes, J.; Ribas-Carbo, M.; Rodriguez, P.; et al. Diffusional conductances to CO2 as a target for increasing photosynthesis and photosynthetic water-use efficiency. Photosynth. Res. 2013, 117, 45–59. [Google Scholar] [CrossRef] [PubMed]
  54. Cano, F.J.; Lopez, R.; Warren, C.R. Implications of the mesophyll conductance to CO2 for photosynthesis and water-use efficiency during long-term water stress and recovery in two contrasting eucalyptus species. Plant Cell Environ. 2014, 37, 2470–2490. [Google Scholar] [CrossRef] [PubMed]
  55. Peng, Y.; Gitelson, A.A. Remote estimation of gross primary productivity in soybean and maize based on total crop chlorophyll content. Remote Sens. Environ. 2012, 117, 440–448. [Google Scholar] [CrossRef]
  56. Manzoni, S.; Vico, G.; Katul, G.; Fay, P.A.; Polley, W.; Palmroth, S.; Porporato, A. Optimizing stomatal conductance for maximum carbon gain under water stress: A meta-analysis across plant functional types and climates. Funct. Ecol. 2011, 25, 456–467. [Google Scholar] [CrossRef]
  57. Traore, A.K.; Ciais, P.; Vuichard, N.; MacBean, N.; Dardel, C.; Poulter, B.; Piao, S.L.; Fisher, J.B.; Viovy, N.; Jung, M.; et al. 1982–2010 trends of light use efficiency and inherent water use efficiency in African vegetation: Sensitivity to climate and atmospheric CO2 concentrations. Remote Sens. 2014, 6, 8923–8944. [Google Scholar] [CrossRef]
  58. Pan, Y.Z.; Li, L.; Zhang, J.S.; Liang, S.L.; Zhu, X.F.; Sulla-Menashe, D. Winter wheat area estimation from MODIS-EVI time series data using the crop proportion phenology index. Remote Sens. Environ. 2012, 119, 232–242. [Google Scholar] [CrossRef]
  59. Walker, J.J.; de Beurs, K.M.; Wynne, R.H. Dryland vegetation phenology across an elevation gradient in Arizona, USA, investigated with fused MODIS and Landsat data. Remote Sens. Environ. 2014, 144, 85–97. [Google Scholar] [CrossRef]
  60. Chen, M.; Griffis, T.J.; Baker, J.; Wood, J.D.; Xiao, K. Simulating crop phenology in the community land model and its impact on energy and carbon fluxes. J. Geophys. Res. Biogeosci. 2015, 120, 310–325. [Google Scholar] [CrossRef]
  61. Buchmann, N.; Schulze, E.D. Net CO2 and H2O fluxes of terrestrial ecosystems. Glob. Biogeochem. Cycles 1999, 13, 751–760. [Google Scholar] [CrossRef]
  62. Sur, C.; Choi, M. Evaluating ecohydrological impacts of vegetation activities on climatological perspectives using MODIS gross primary productivity and evapotranspiration products at Korean regional flux network site. Remote Sens. 2013, 5, 2534–2553. [Google Scholar] [CrossRef]
  63. Medrano, H.; Escalona, J.M.; Bota, J.; Gulias, J.; Flexas, J. Regulation of photosynthesis of C-3 plants in response to progressive drought: Stomatal conductance as a reference parameter. Ann. Bot-Lond. 2002, 89, 895–905. [Google Scholar] [CrossRef]
  64. Dong, J.W.; Xiao, X.M.; Wagle, P.; Zhang, G.L.; Zhou, Y.T.; Jin, C.; Torn, M.S.; Meyers, T.P.; Suyker, A.E.; Wang, J.B.; et al. Comparison of four EVI-based models for estimating gross primary production of maize and soybean croplands and tallgrass prairie under severe drought. Remote Sens. Environ. 2015, 162, 154–168. [Google Scholar] [CrossRef]
  65. Yuan, W.P.; Cai, W.W.; Nguy-Robertson, A.L.; Fang, H.J.; Suyker, A.E.; Chen, Y.; Dong, W.J.; Liu, S.G.; Zhang, H.C. Uncertainty in simulating gross primary production of cropland ecosystem from satellite-based models. Agr. Forest Meteorol. 2015, 207, 48–57. [Google Scholar] [CrossRef]
  66. Wu, C.Y.; Gonsamo, A.; Zhang, F.M.; Chen, J.M. The potential of the greenness and radiation (GR) model to interpret 8-day gross primary production of vegetation. ISPRS J. Photogramm. Remote Sens. 2014, 88, 69–79. [Google Scholar] [CrossRef]
  67. Xiao, X.M.; Zhang, Q.Y.; Braswell, B.; Urbanski, S.; Boles, S.; Wofsy, S.; Berrien, M.; Ojima, D. Modeling gross primary production of temperate deciduous broadleaf forest using satellite images and climate data. Remote Sens. Environ. 2004, 91, 256–270. [Google Scholar] [CrossRef]
  68. Xiao, X.M.; Hollinger, D.; Aber, J.; Goltz, M.; Davidson, E.A.; Zhang, Q.Y.; Moore, B. Satellite-based modeling of gross primary production in an evergreen needleleaf forest. Remote Sens. Environ. 2004, 89, 519–534. [Google Scholar] [CrossRef]
  69. Wu, C.Y.; Chen, J.M.; Huang, N. Predicting gross primary production from the enhanced vegetation index and photosynthetically active radiation: Evaluation and calibration. Remote Sens. Environ. 2011, 115, 3424–3435. [Google Scholar] [CrossRef]
  70. Peng, Y.; Gitelson, A.A.; Sakamoto, T. Remote estimation of gross primary productivity in crops using MODIS 250 m data. Remote Sens. Environ. 2013, 128, 186–196. [Google Scholar] [CrossRef]

