
Remote Sensing for Characterisation and Kinematic Analysis of Large Slope Failures: Debre Sina Landslide, Main Ethiopian Rift Escarpment

 , ,
, , 
Abstract
:
1. Introduction
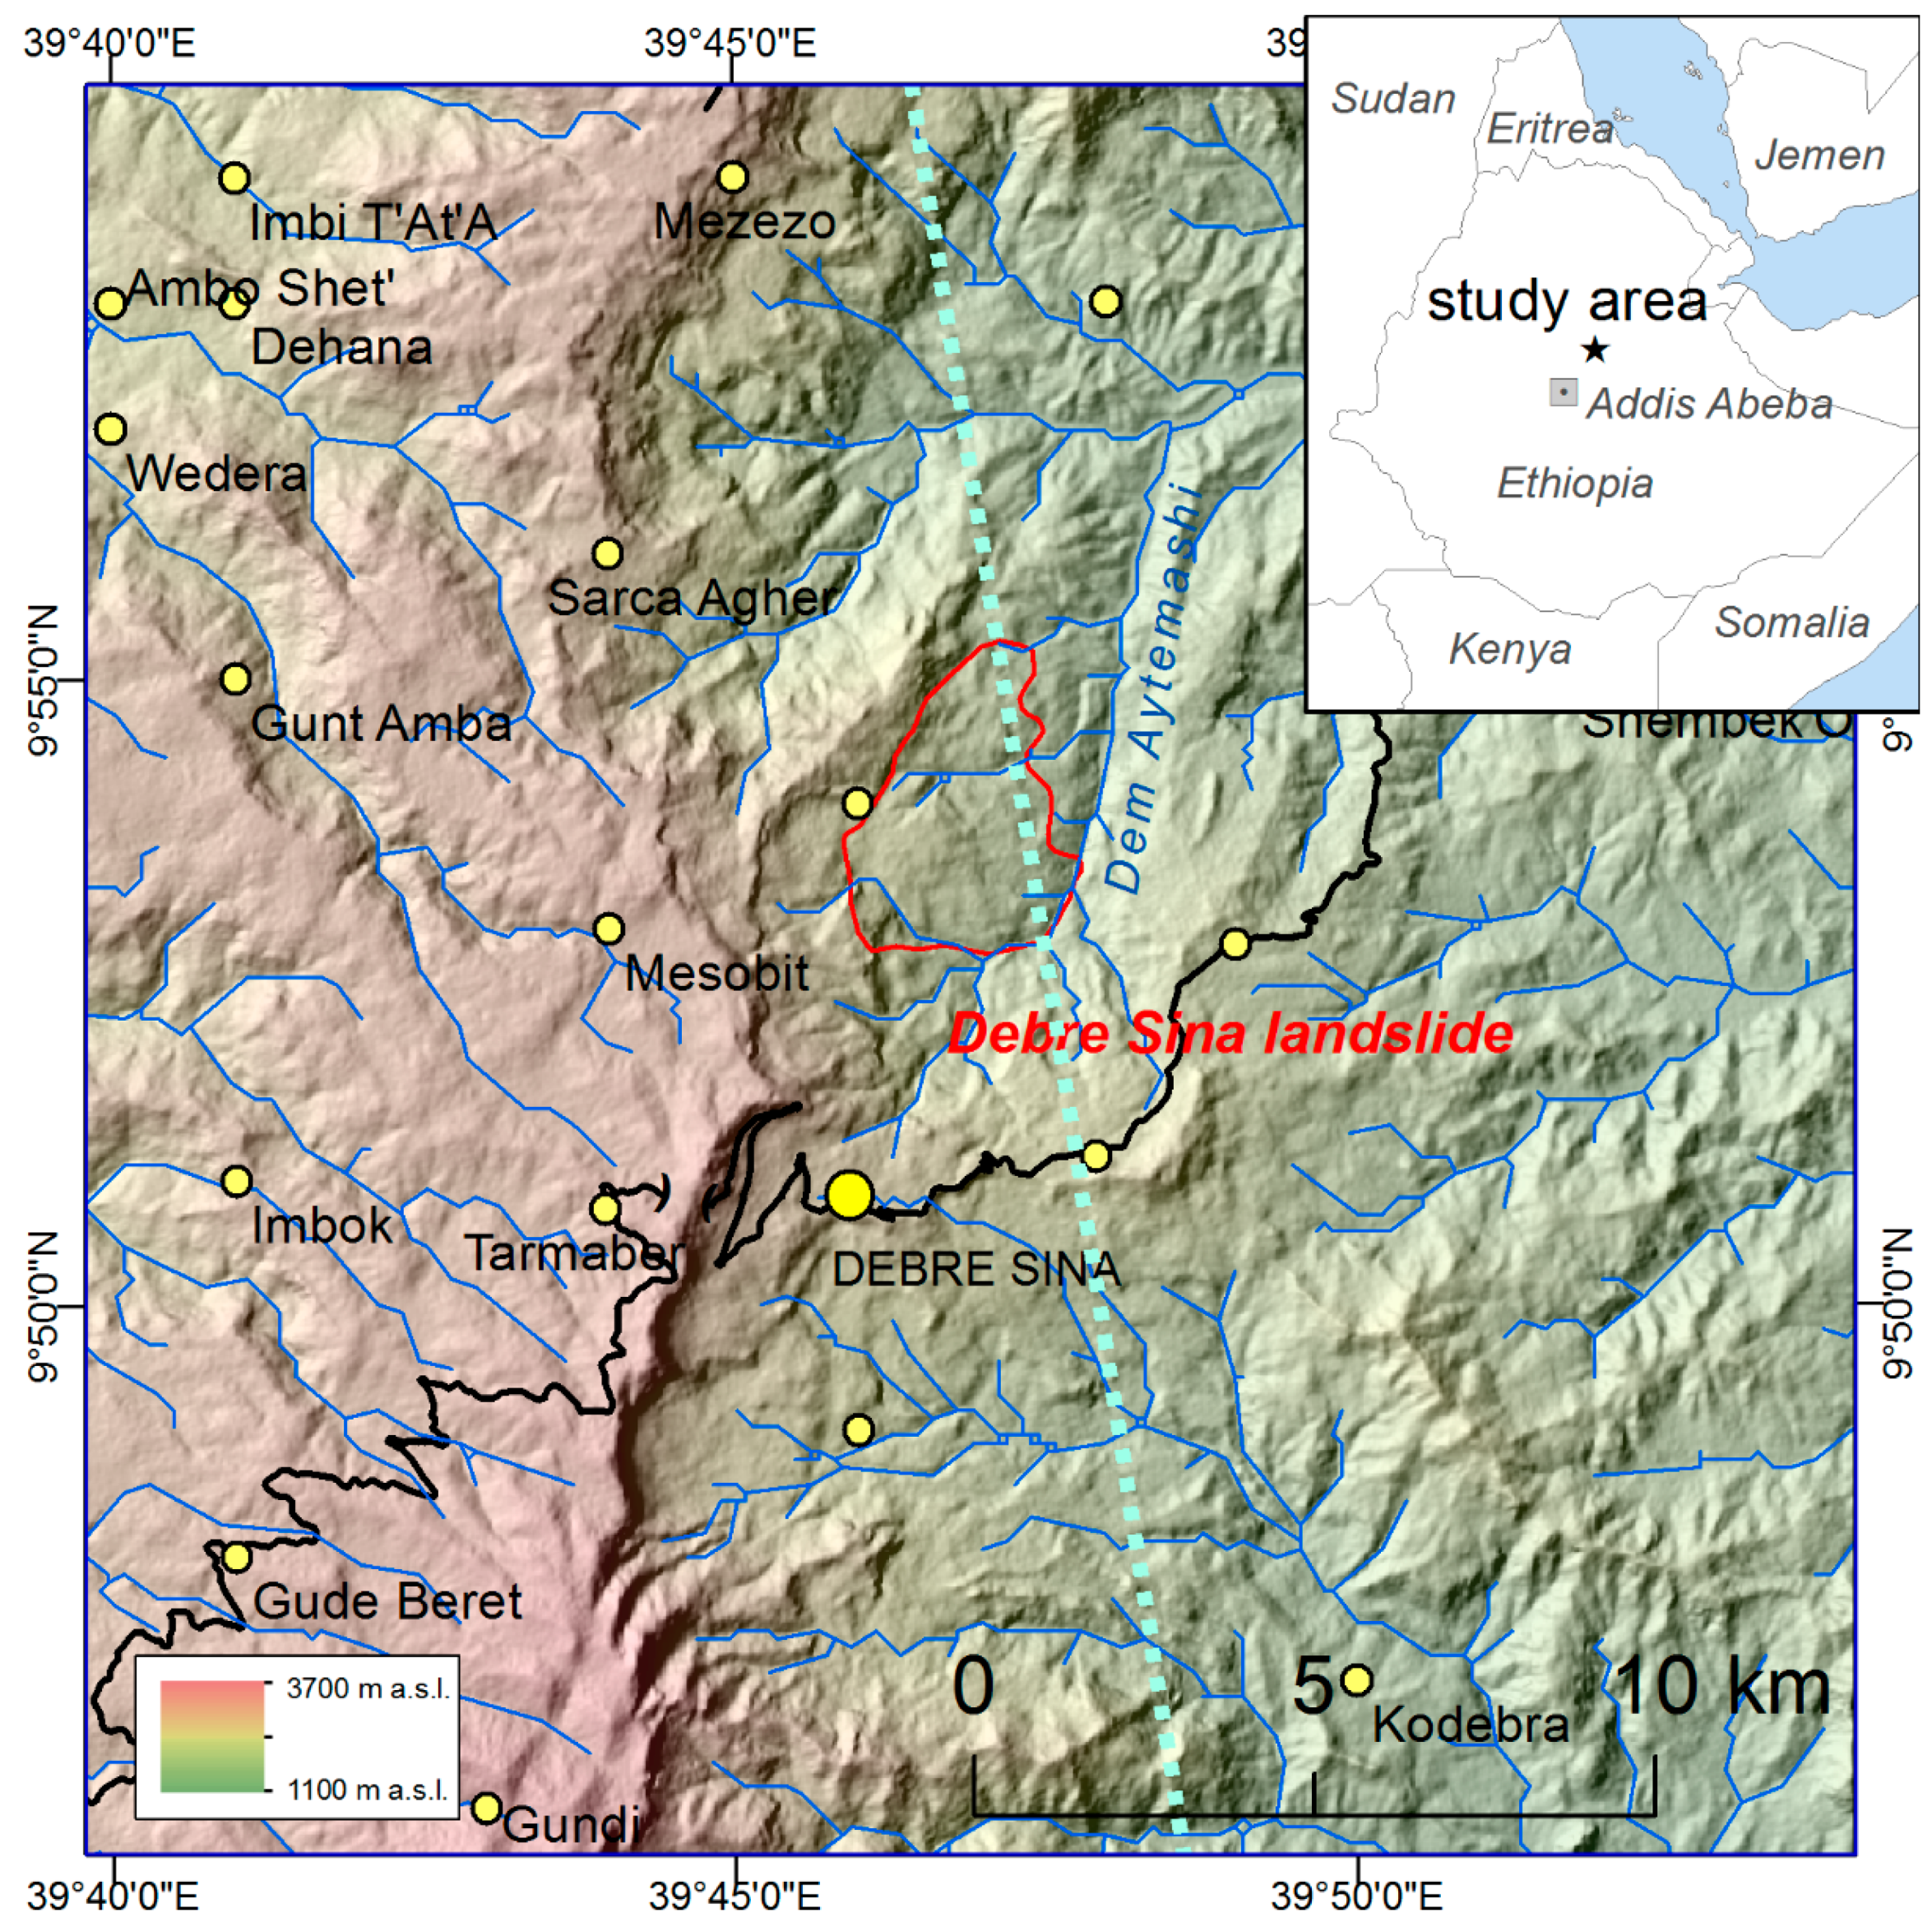
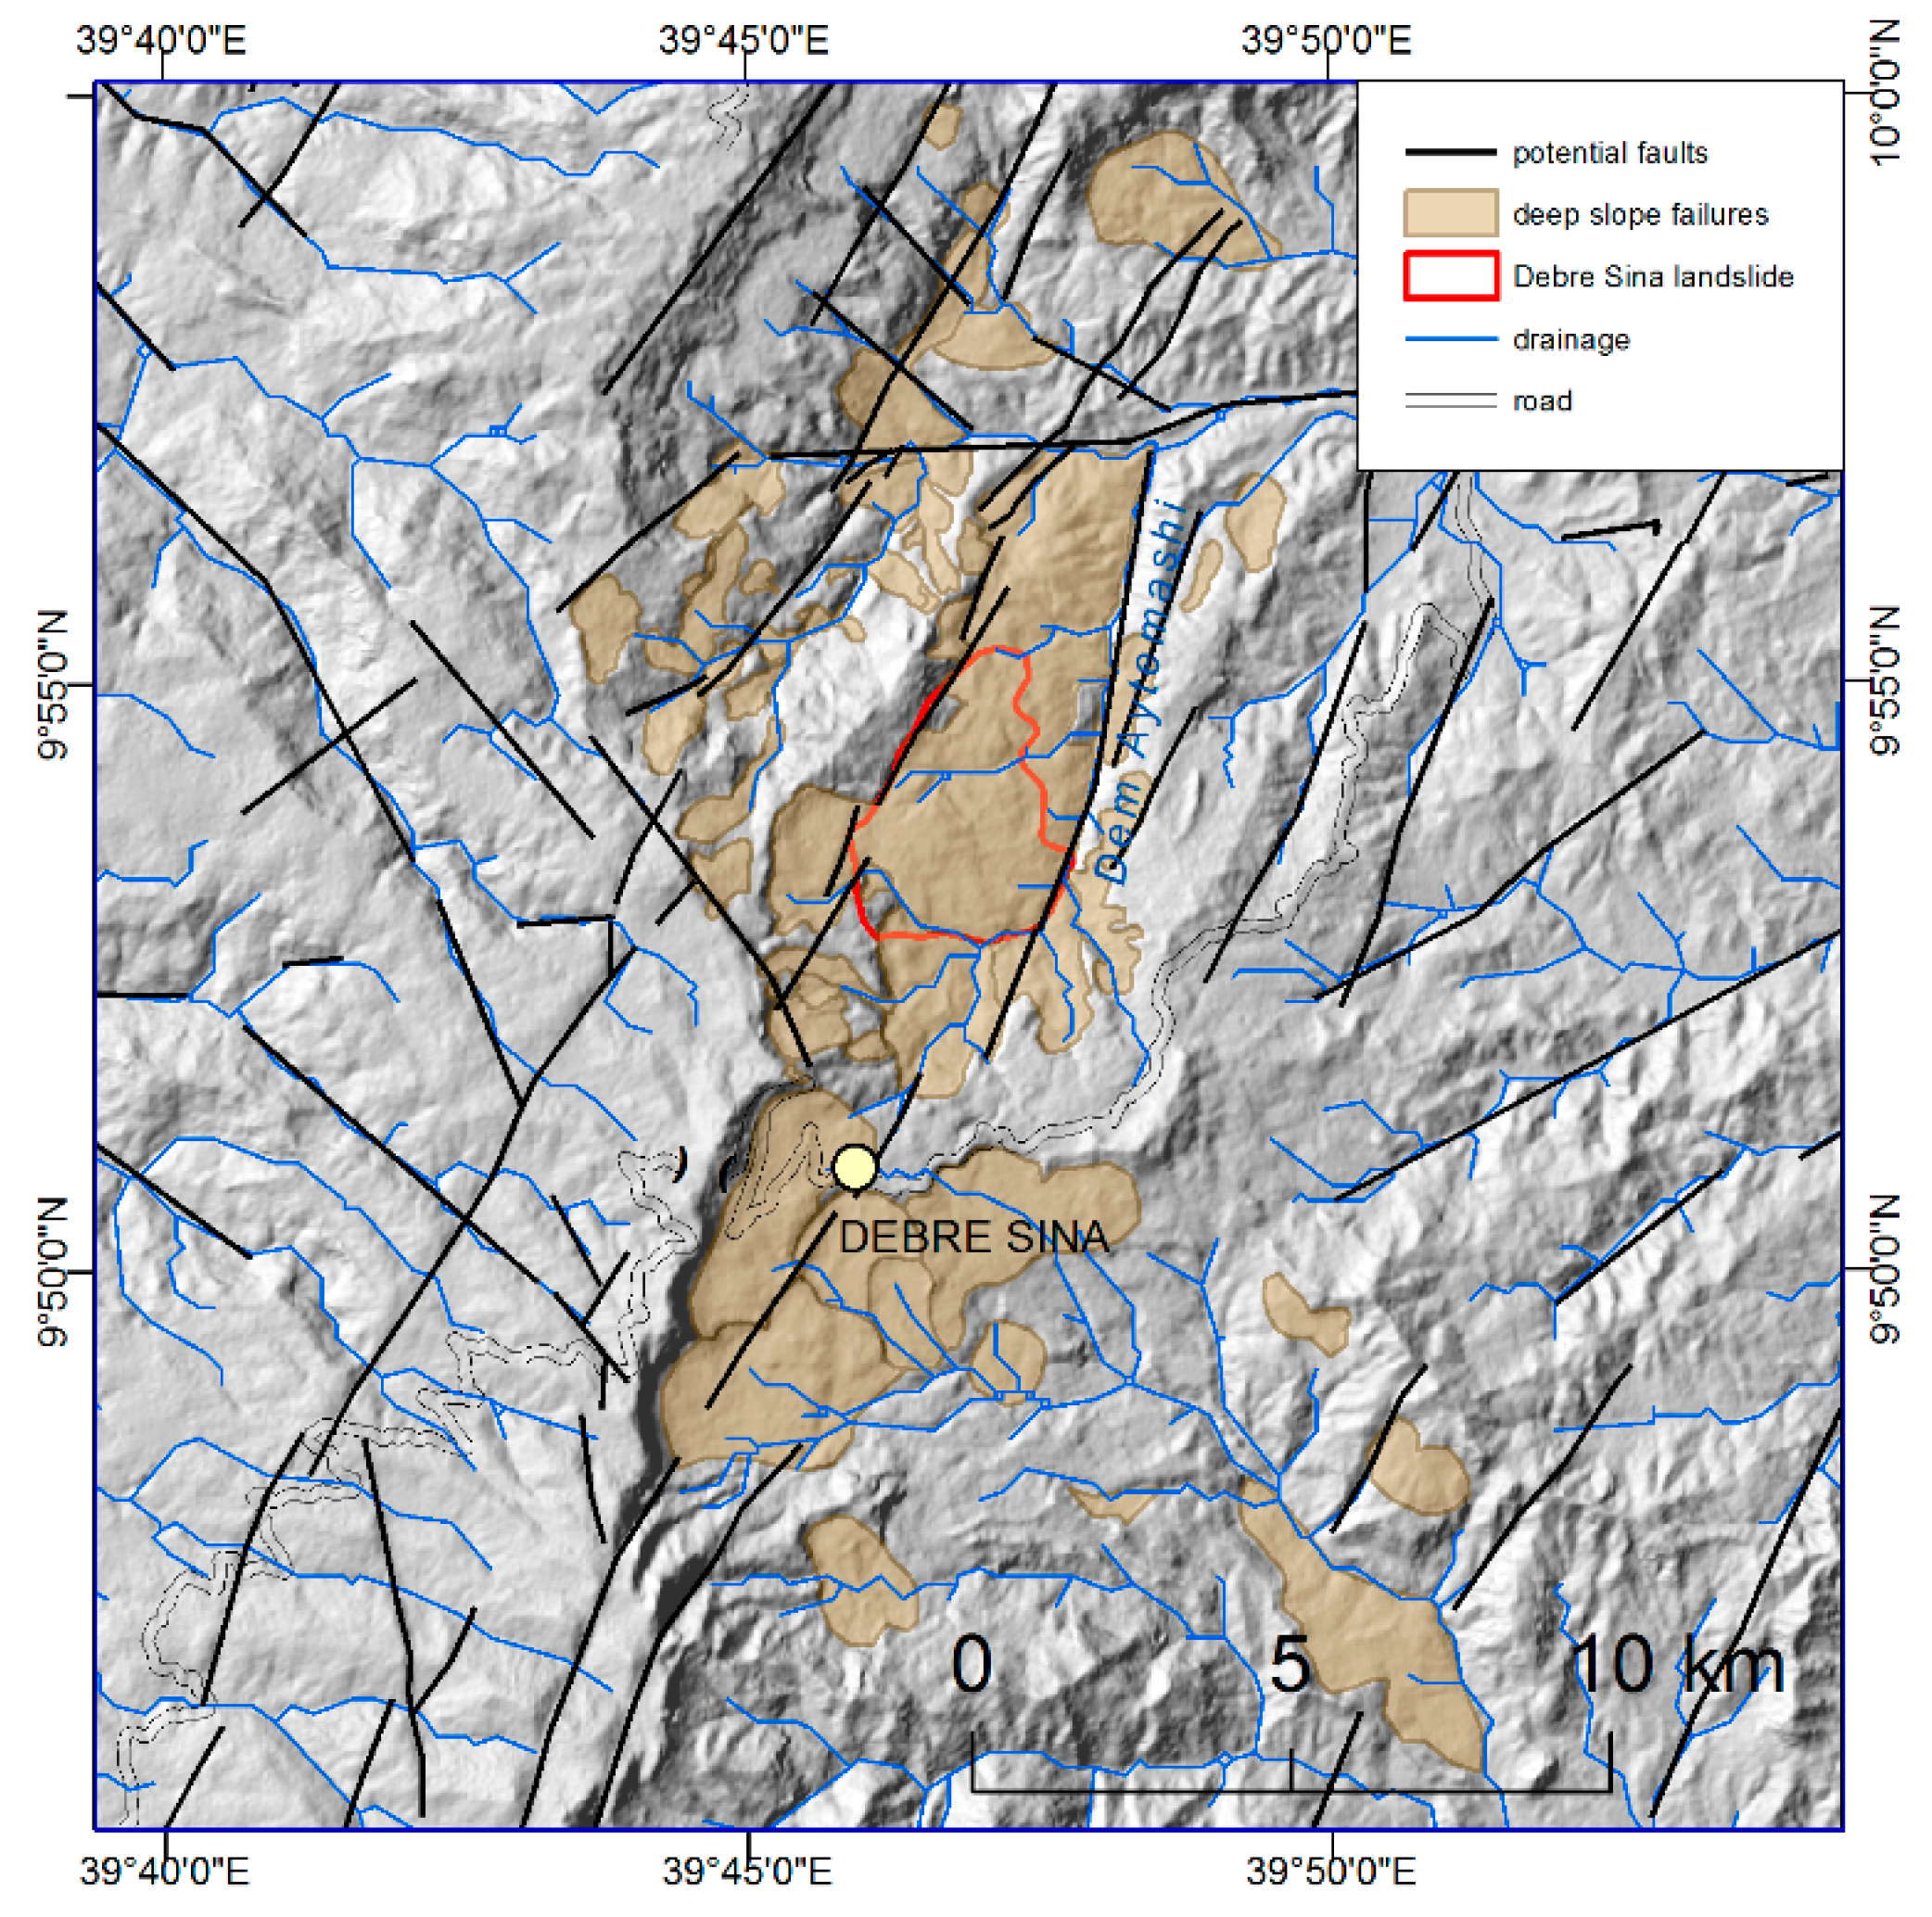
2. Study Area

3. Methods
3.1. Estimation of Vertical Changes by Subtraction of Two DEMs

| Satellite/Sensor | Acquisition Date | Corresponding Rainy Season | Resolution PAN/MS (m) | Off-Nadir Angle (Degrees) | Sun Elevation. (Degrees) | RMSE of Co-Registration (m); (No. Points) |
|---|---|---|---|---|---|---|
| Air photos | 27 November 1986 | 1986 | 1.0 | - | - | 6.3; (16 points) |
| Ikonos-2 | 14 December 2005 | 2005 | 0.8/4.0 | 17.5 | 52.0 | - |
| Ikonos-2 | 05 June 2007 | 2006 | 0.8/4.0 | 10.6 | 65.9 | 0.88; (12 points) |
| Kompsat-2 | 27 January 2008 | 2007 | 1.0/4.0 | 0.0 | 0.67; (88 points) | |
| WorldView-1 | 22 December 2008 | 2008 | 0.5 | 19.5 | 51.7 | 1.60; (123 points) |
| QuickBird-2 | 18 May 2010 | 2009 | 0.6 | 10.2 | 66.7 | 1.90; (62 points) |
| GeoEye | 25 November 2012 | 2012 | 0.46 | 20.4 | 54.9 | 1.94; (143 points) |
| WorldView-2 | 27 May 2014 | 2013 | 0.46/1.84 | 9.6 | 69.5 | 1.75; (31 points) |

3.2. Vertical Elevation Differences Derived by ICESat
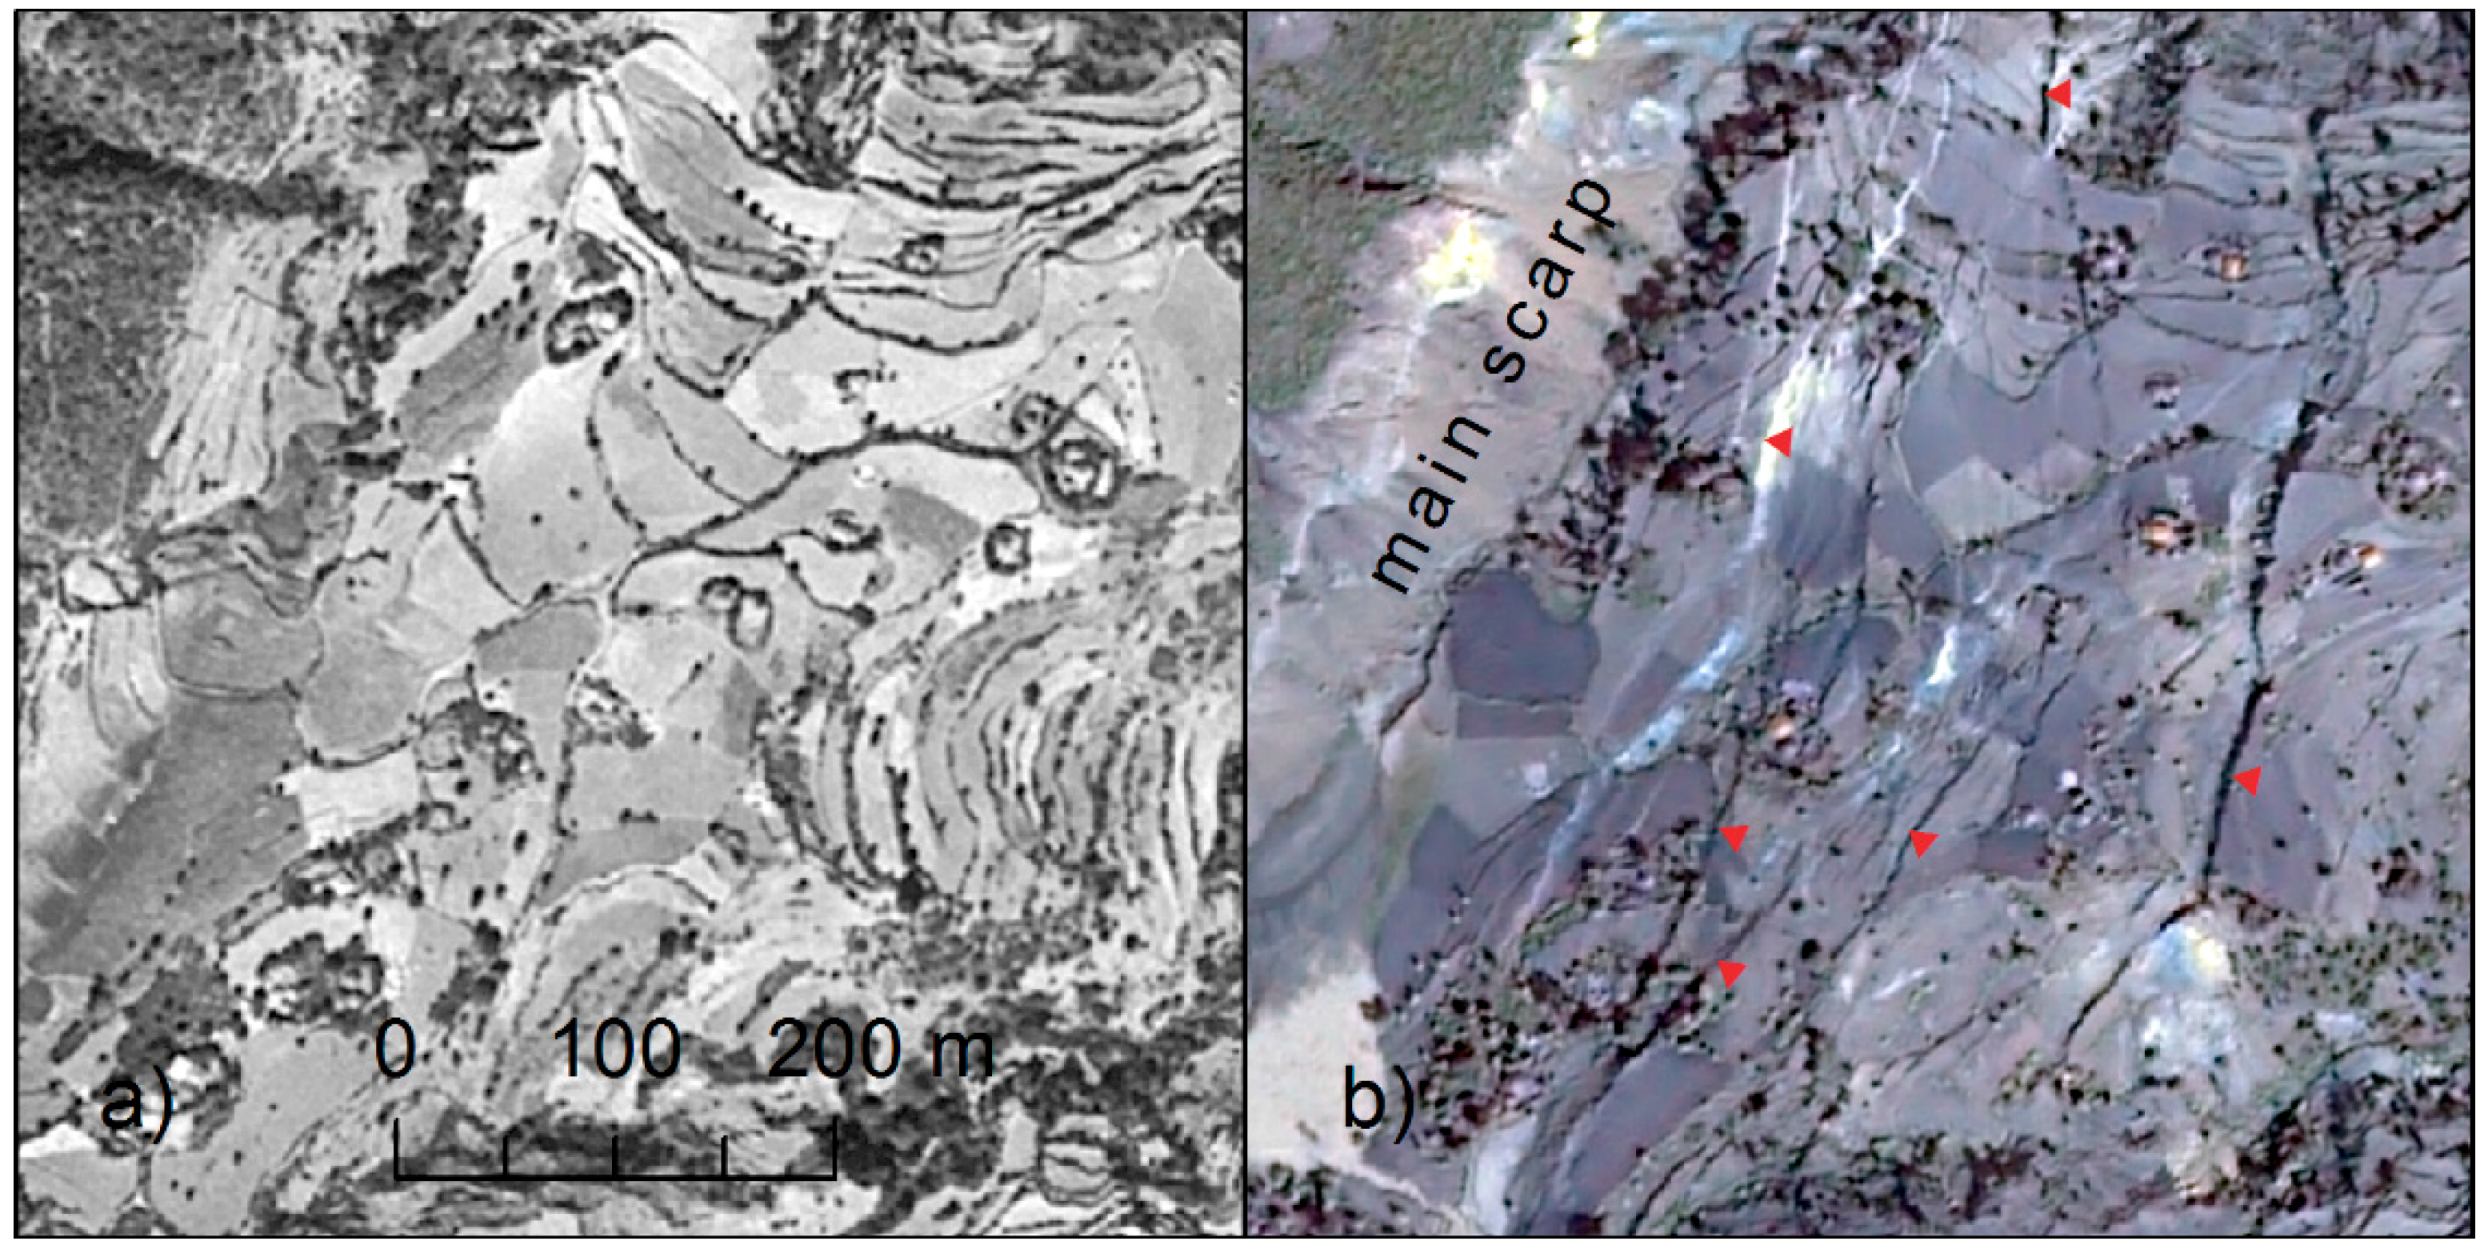
3.3. Mapping of Surface Features from the Time Series of Optical Satellite Data


3.4. Estimation of Horizontal Displacement by Feature Tracking in Optical Satellite Data
3.5. Estimation of Horizontal Displacement by Amplitude Tracking in Microwave Domain
4. Results
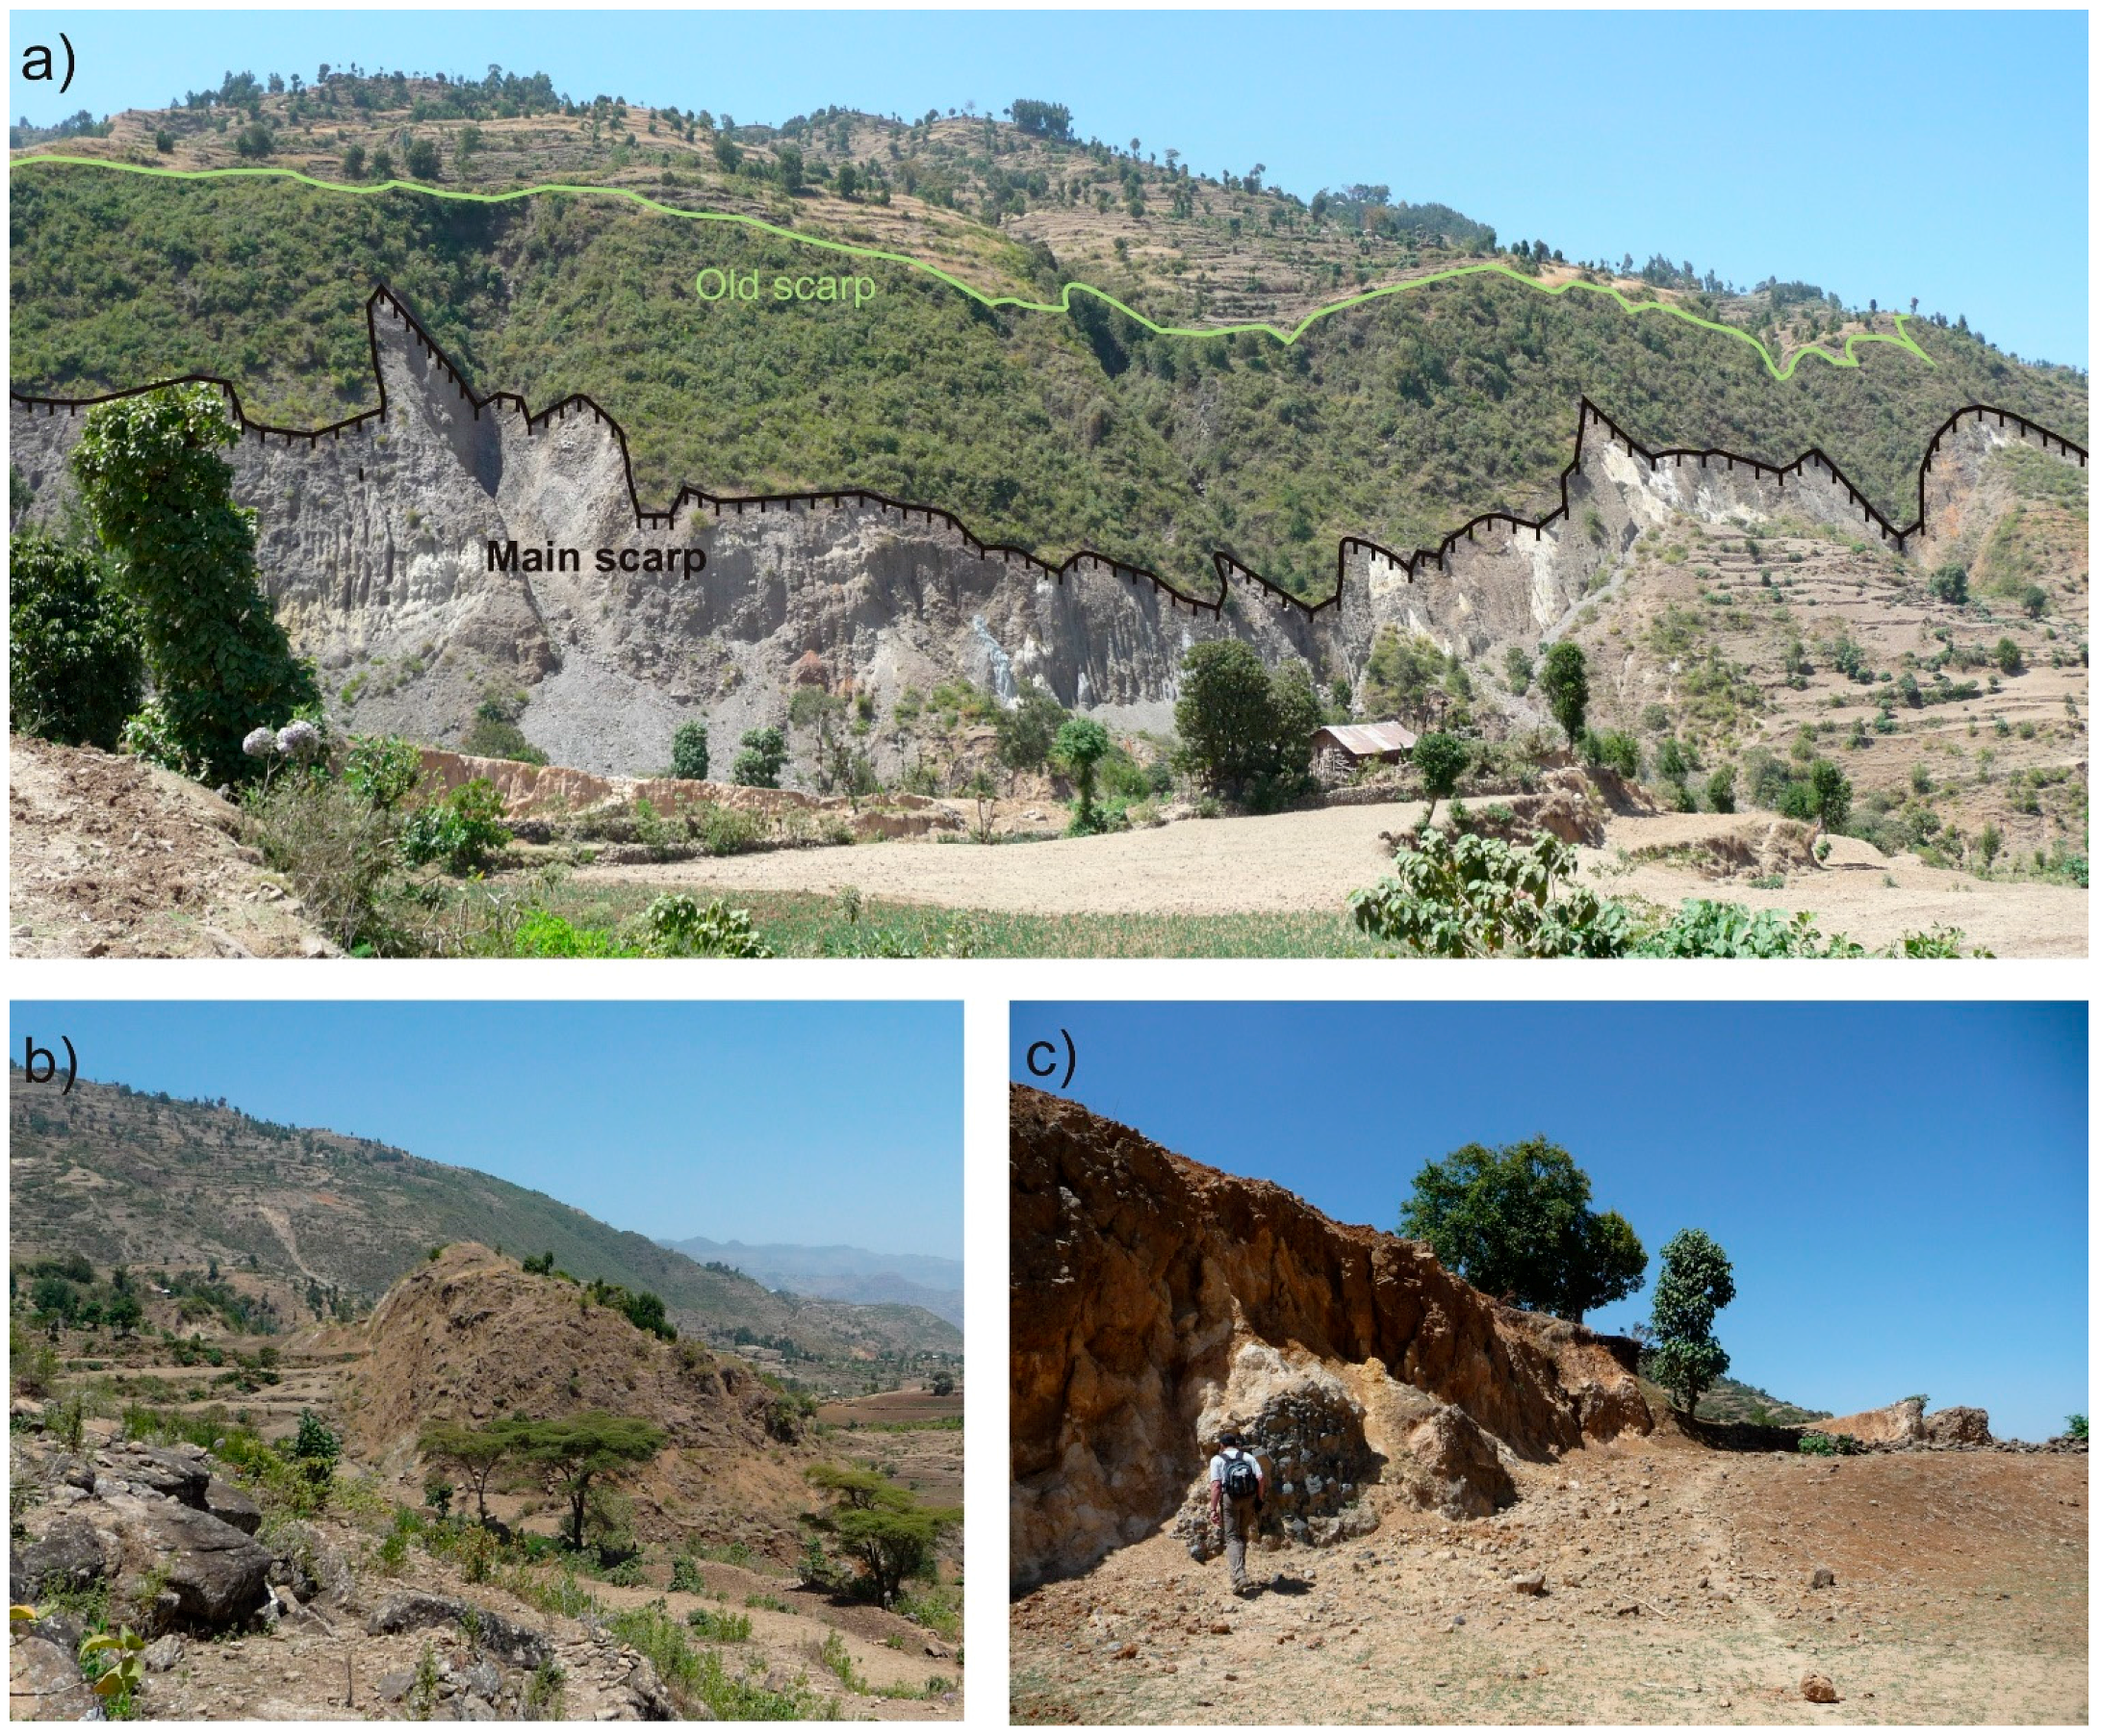
4.1. Structural Predispositions for the Mass Movements in the Area

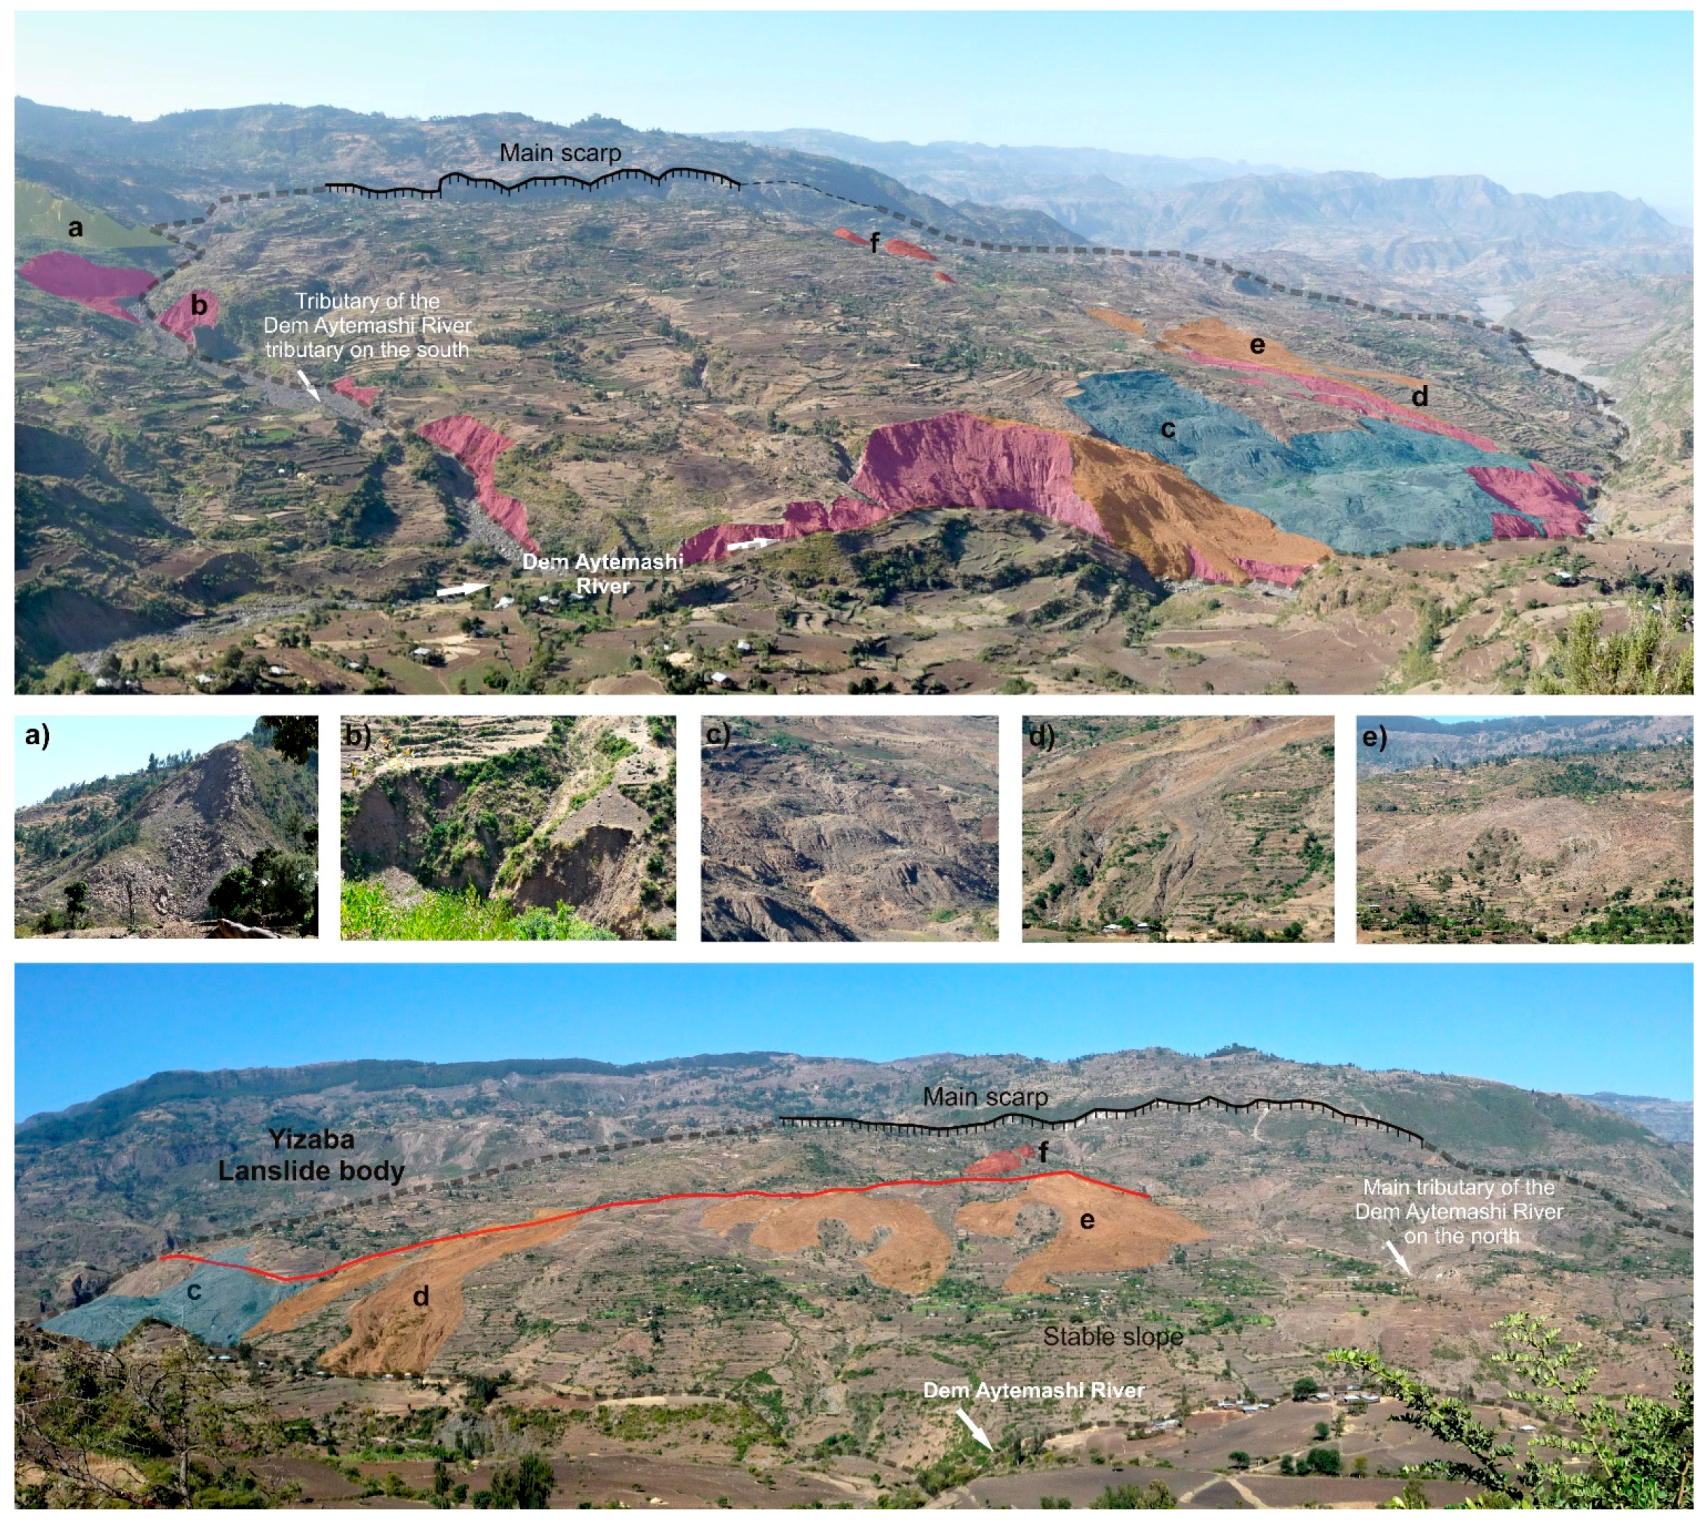
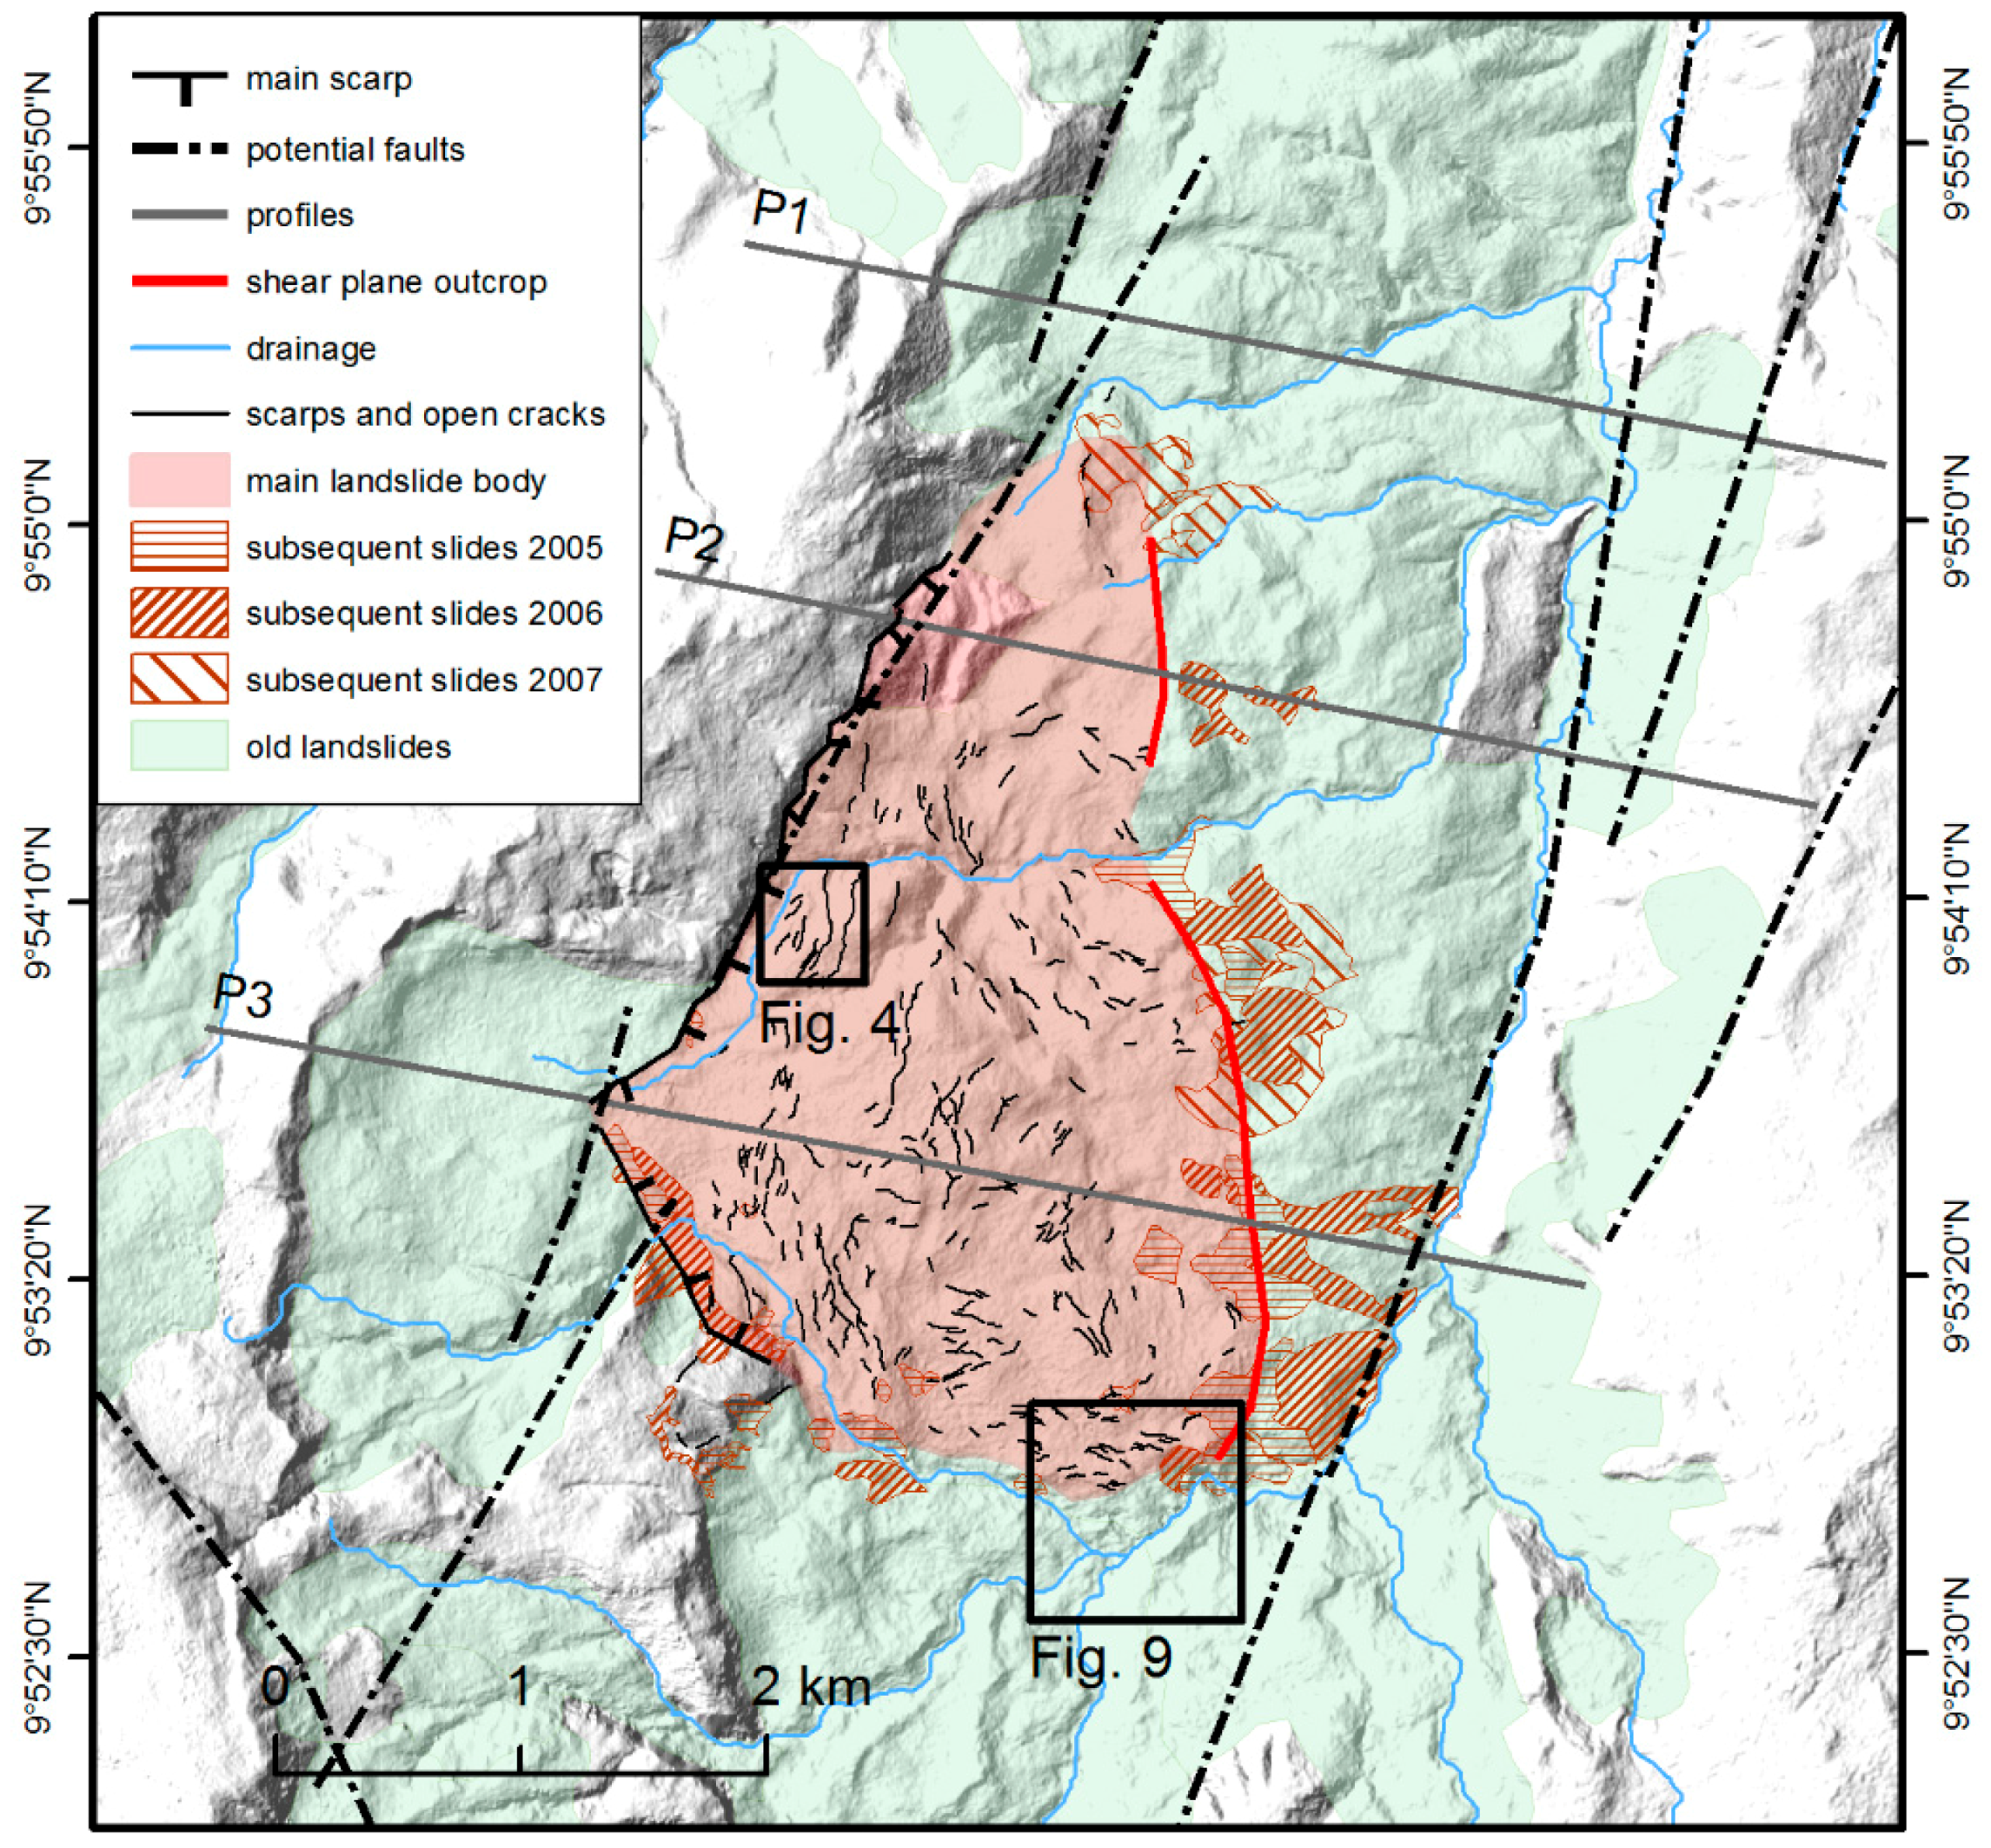
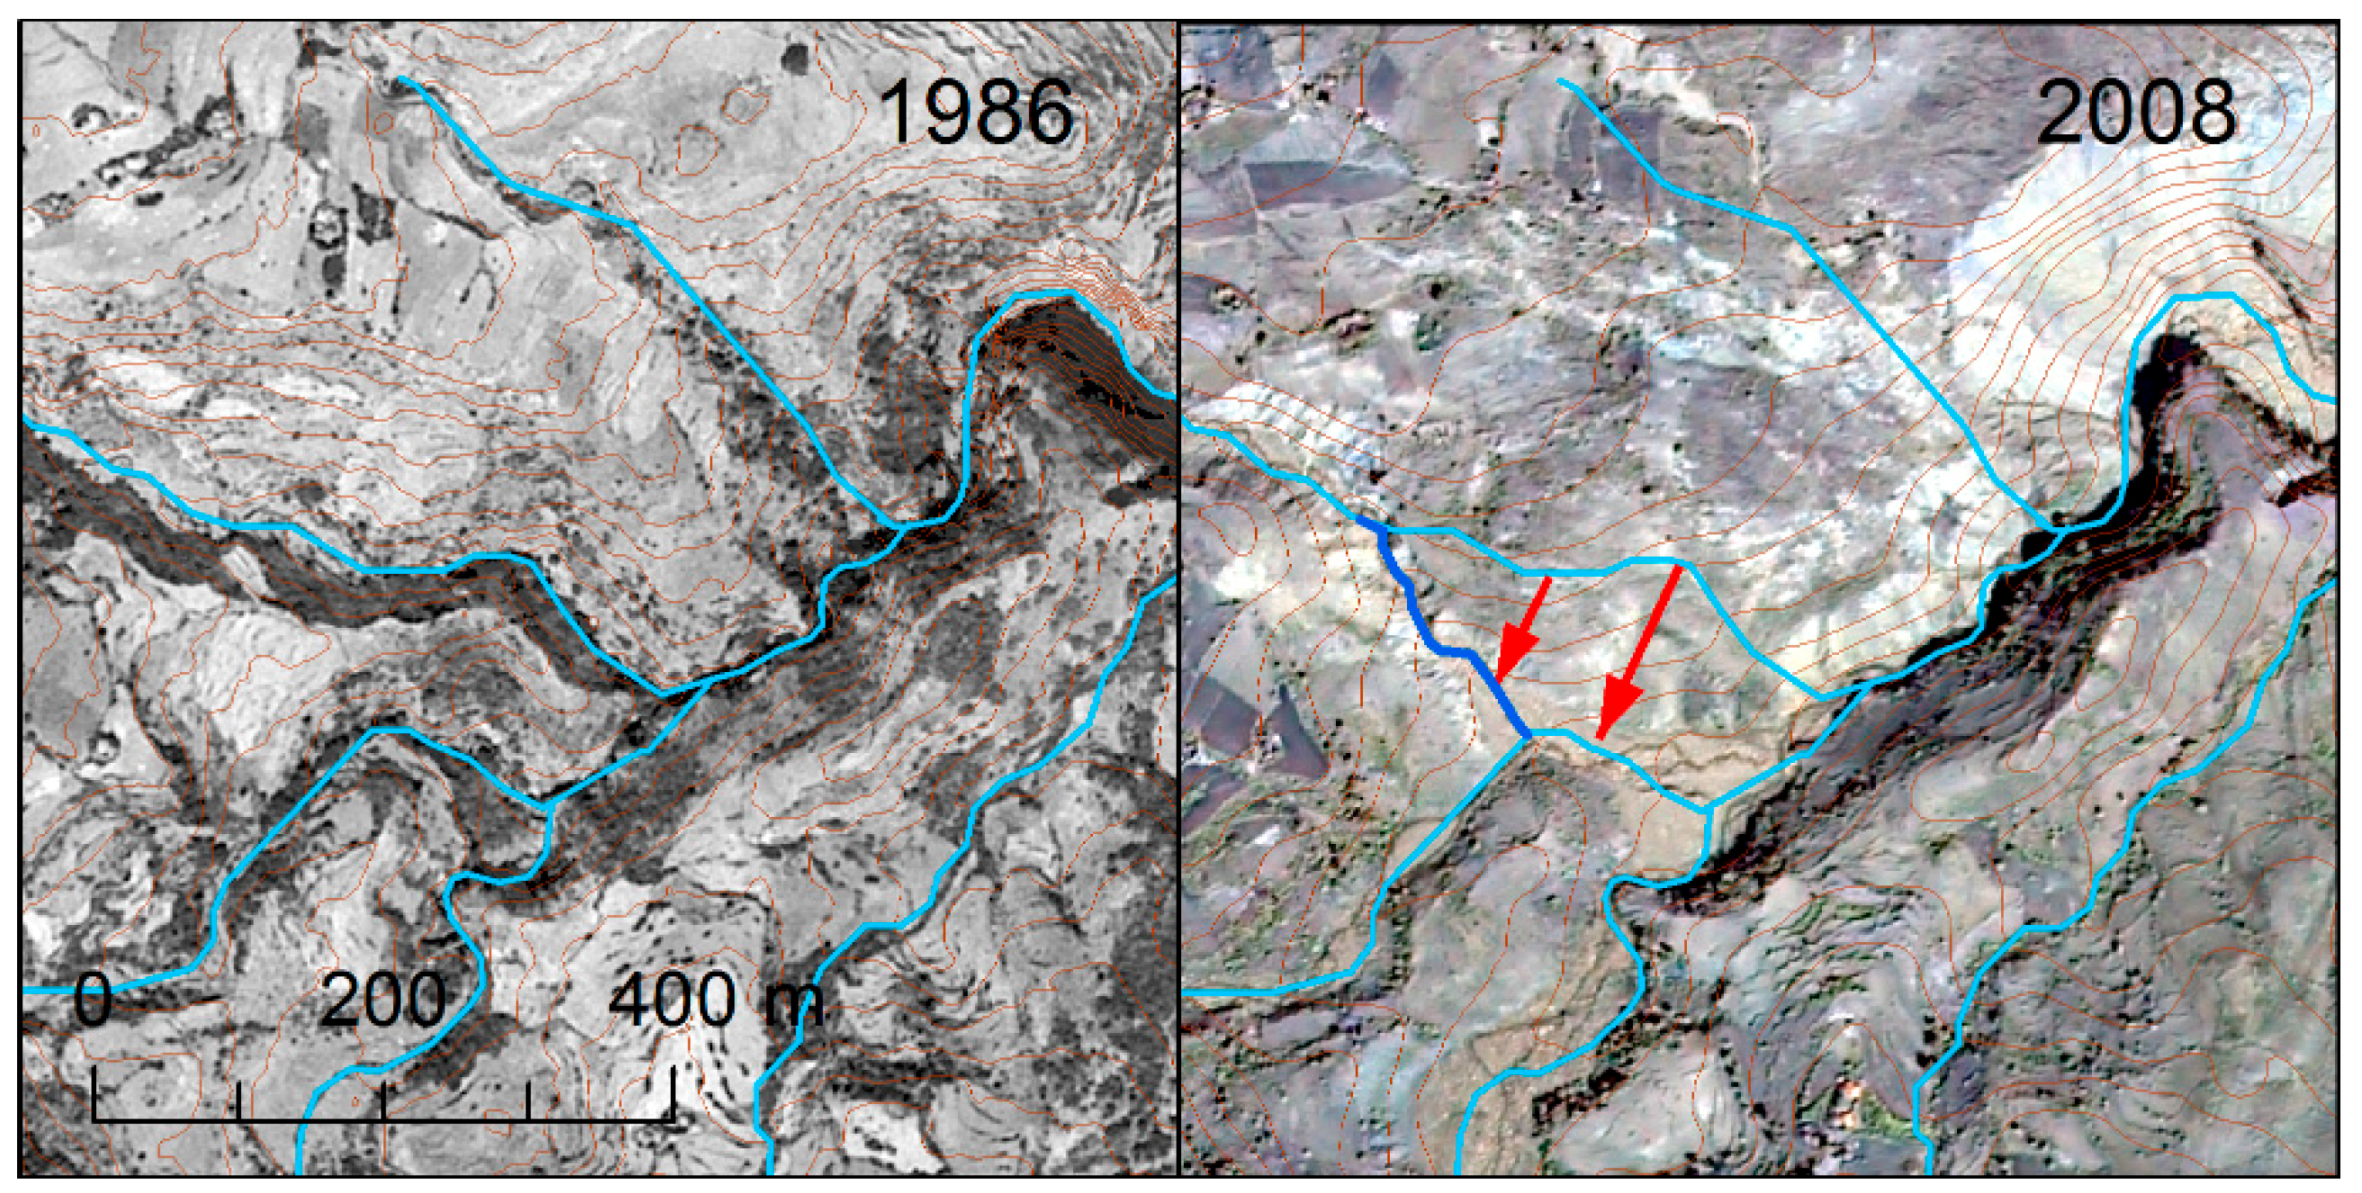
4.2. Surface Morphology and Extent of the Landslide

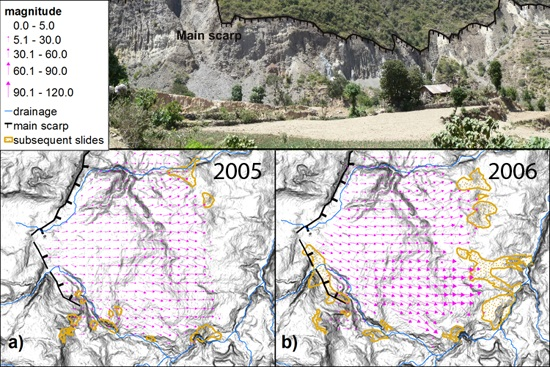
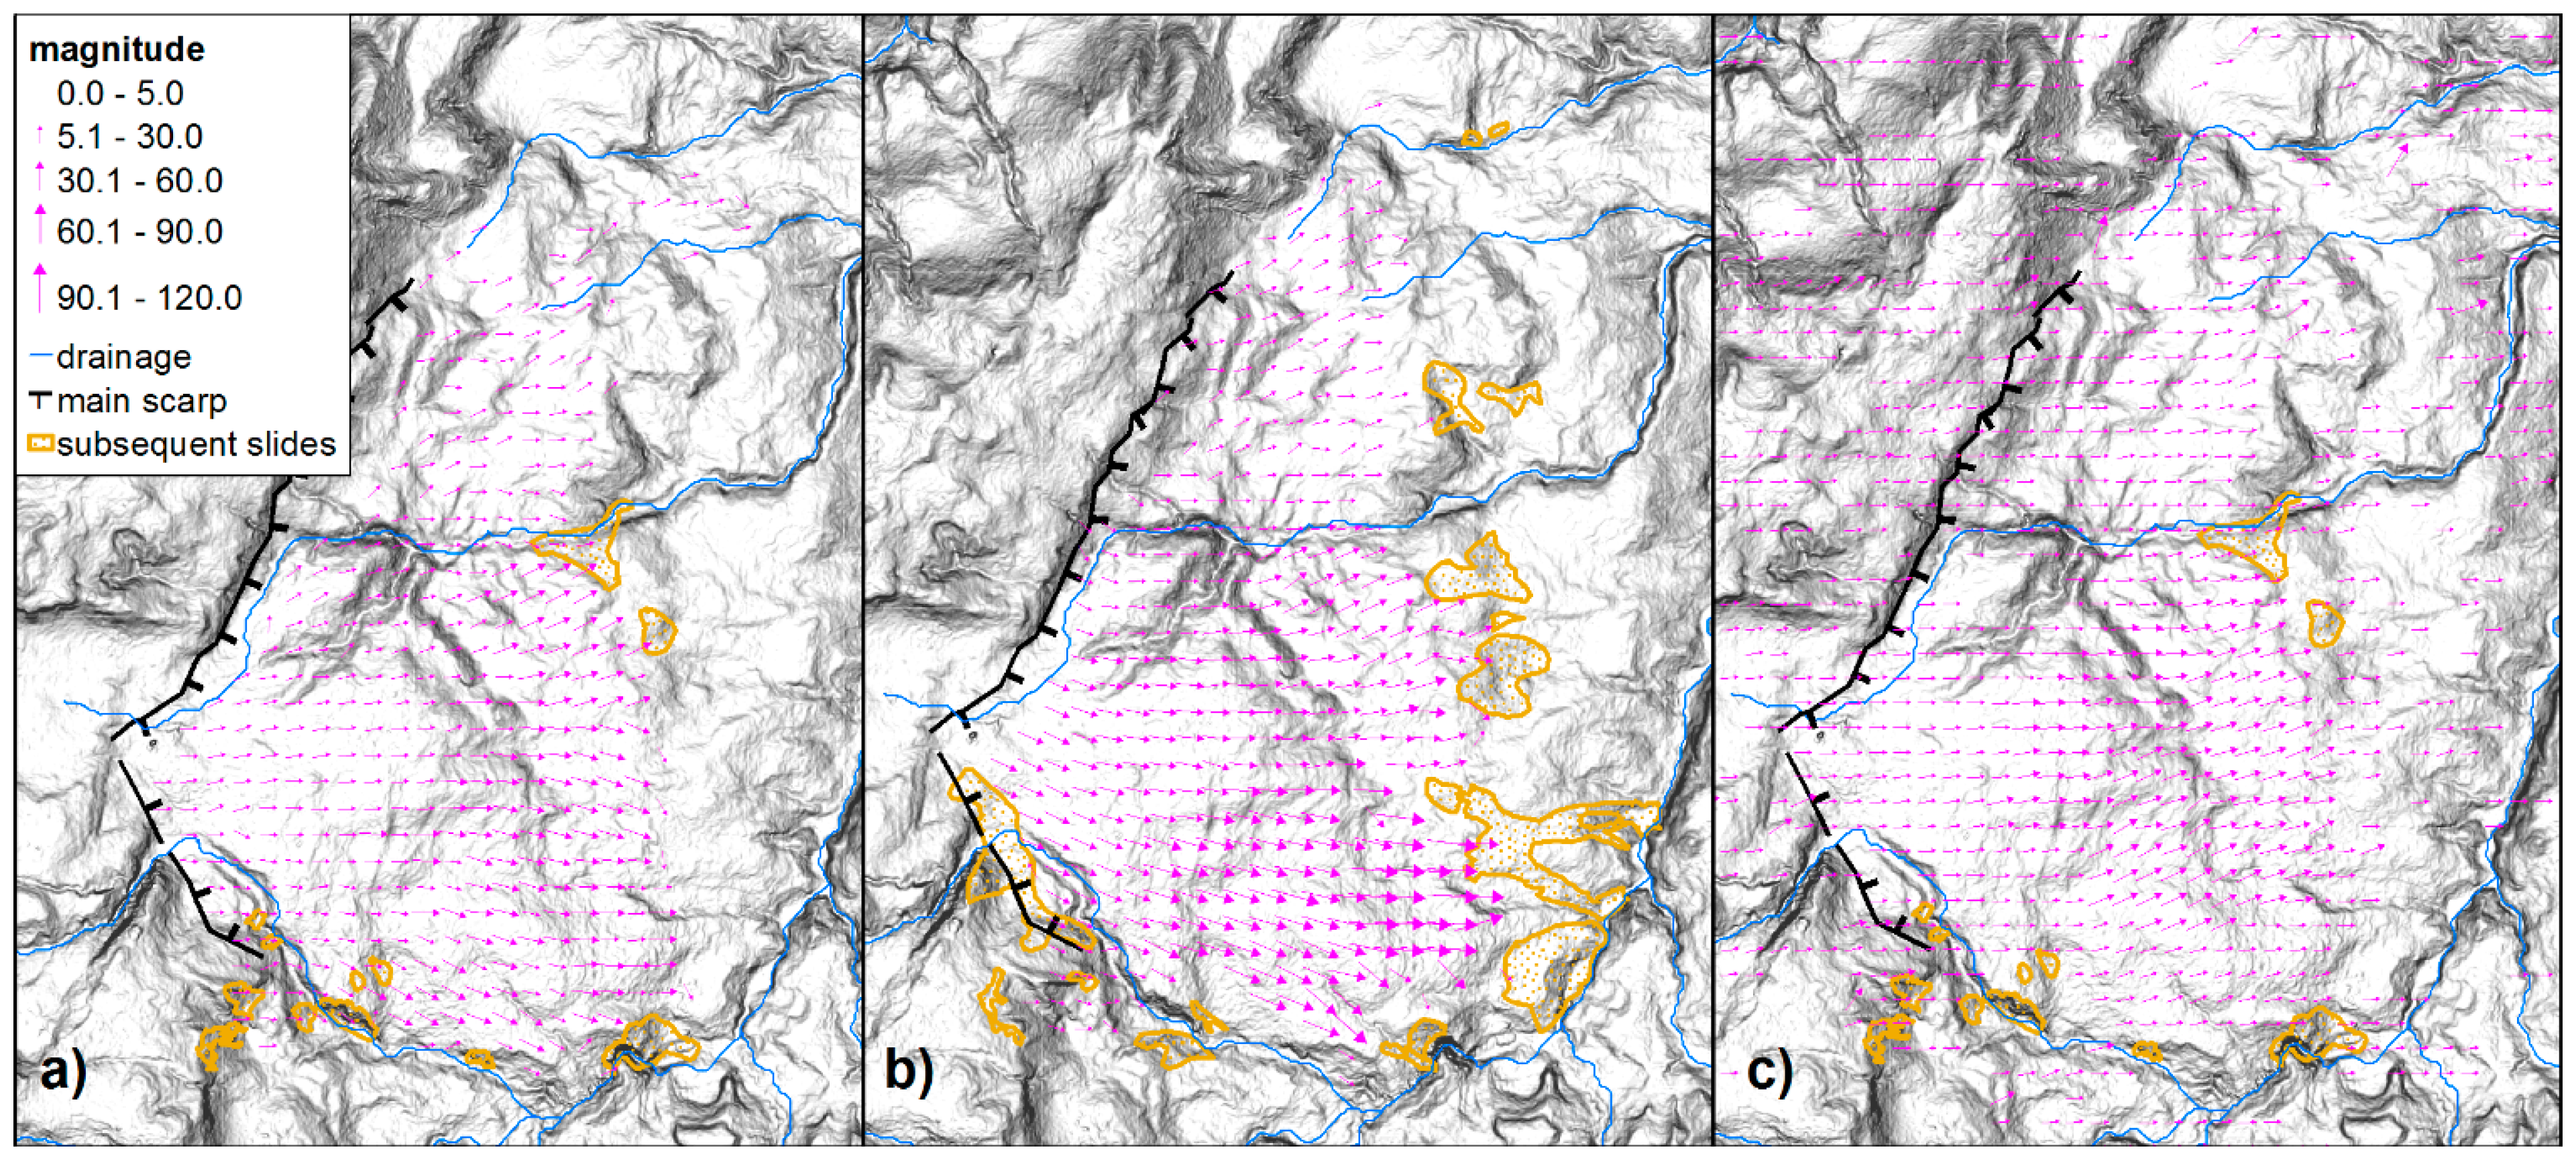
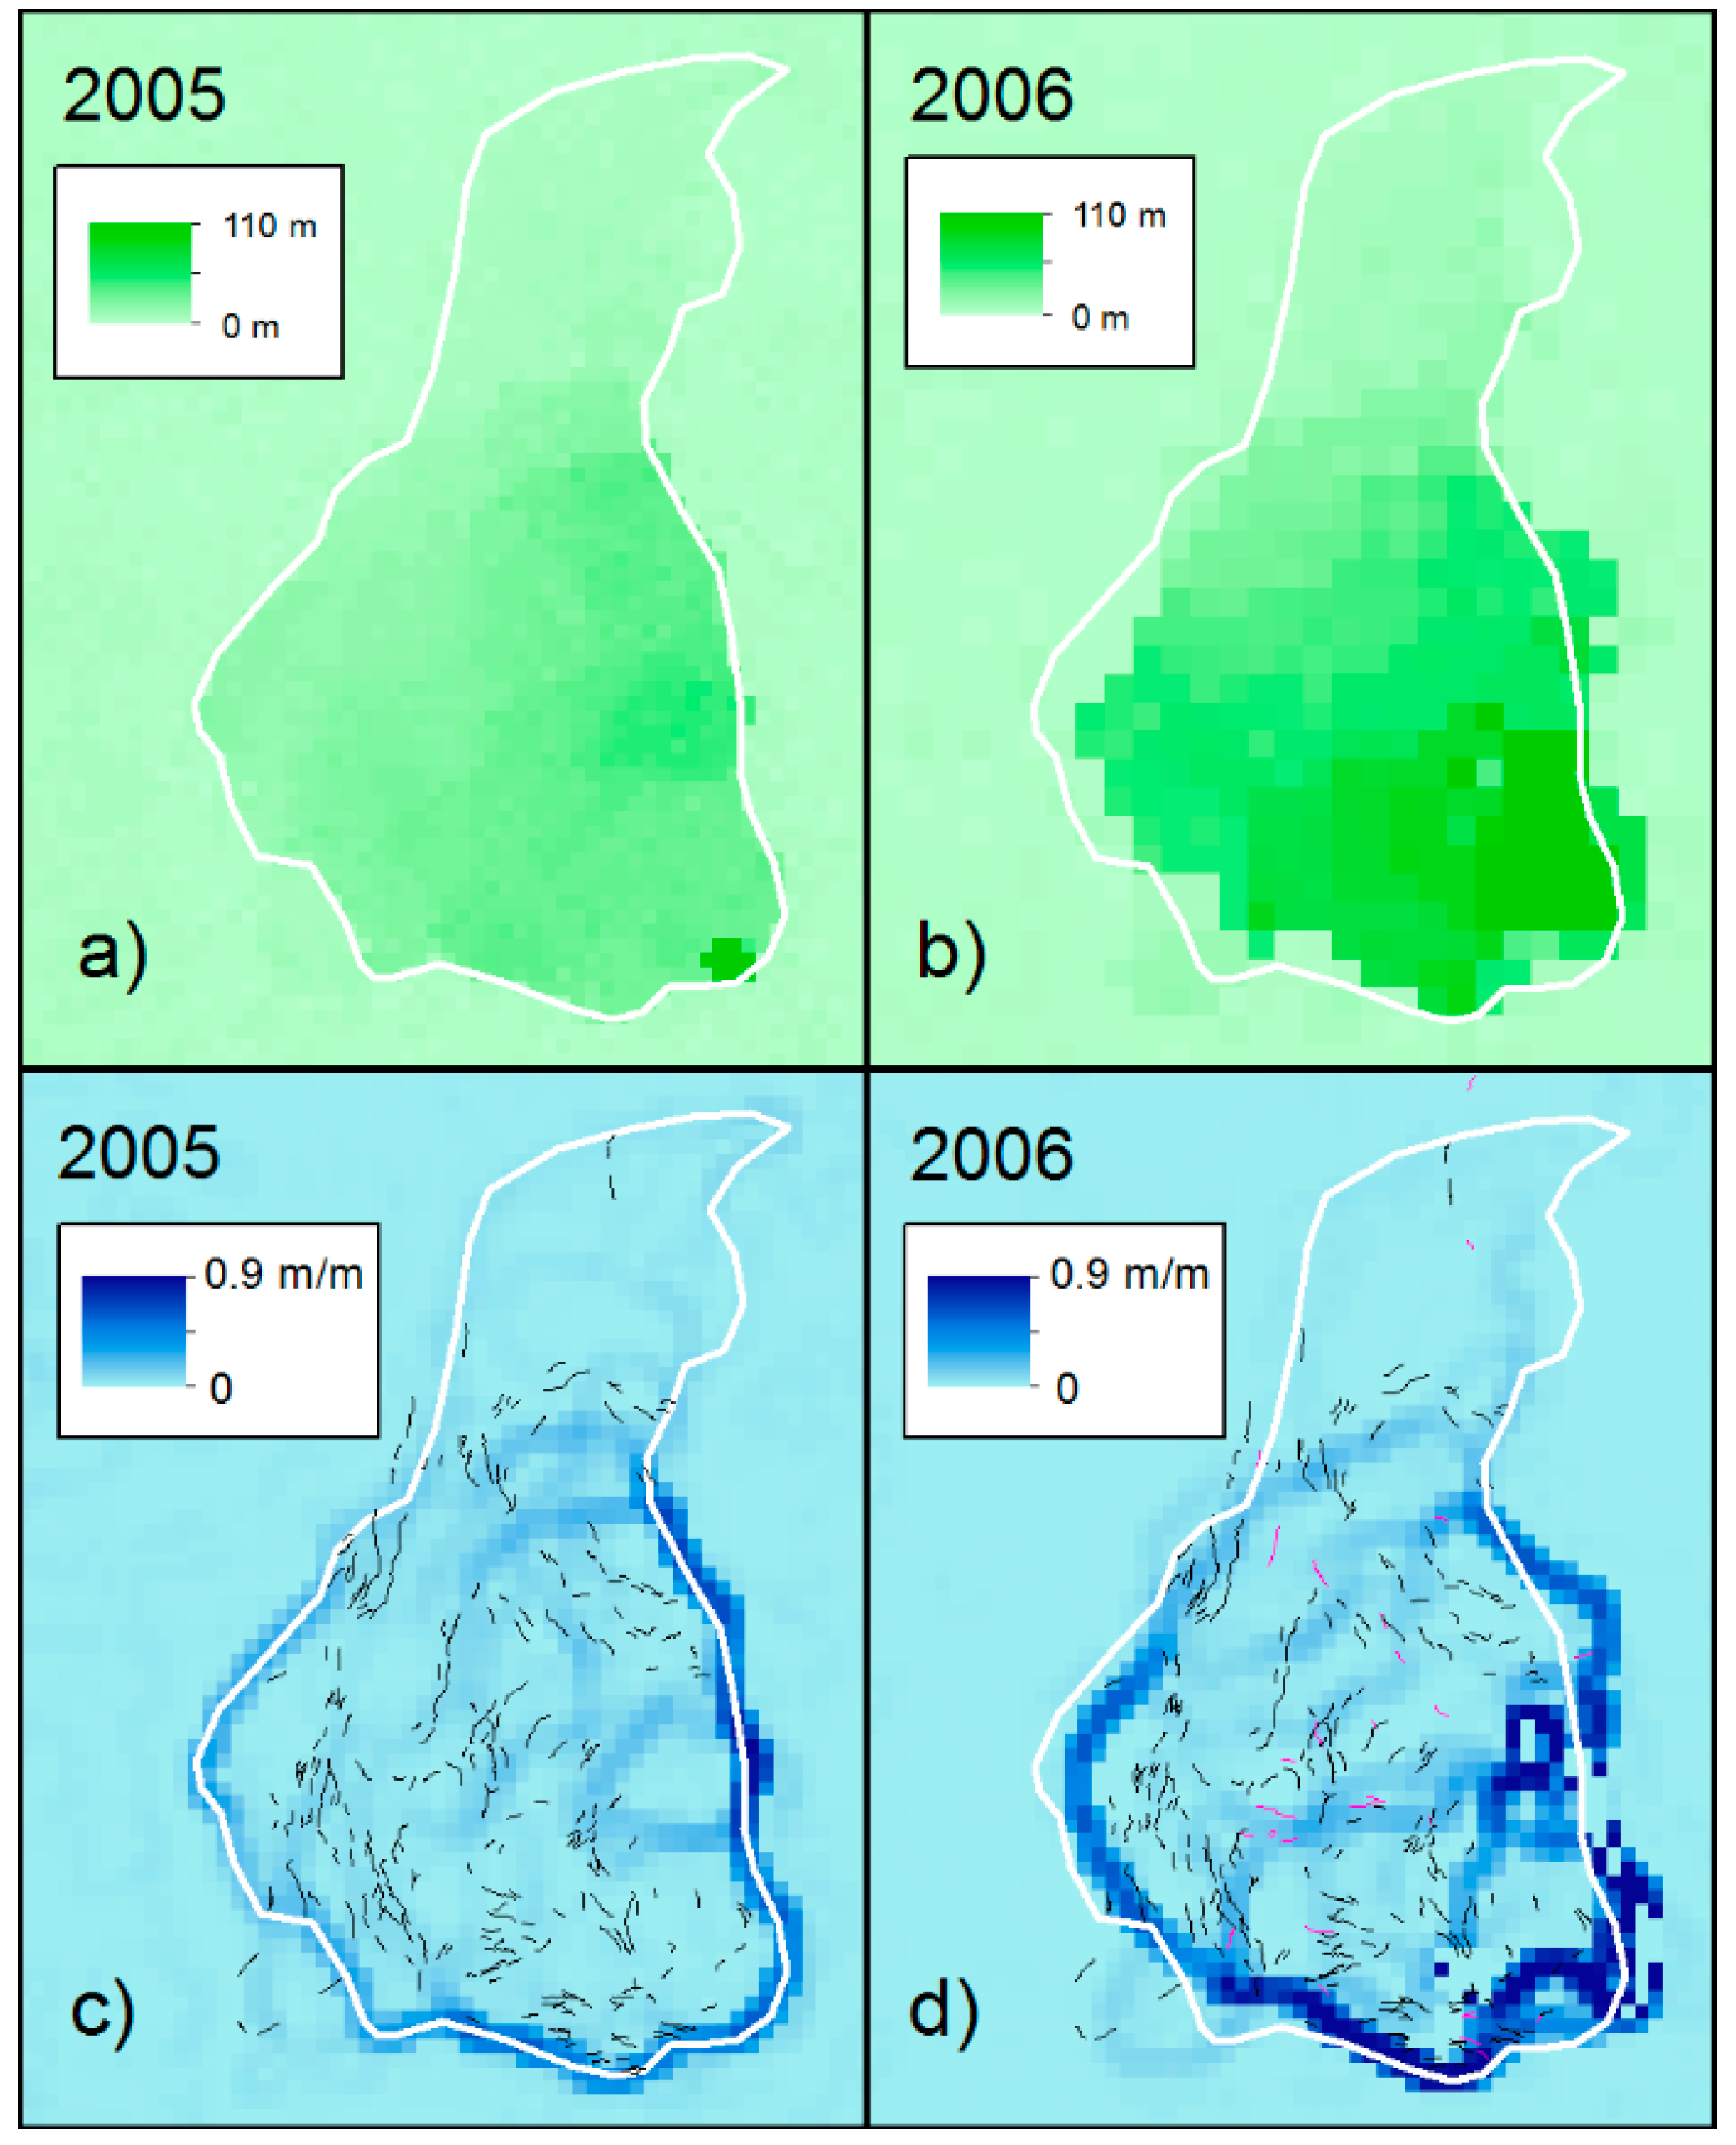
4.3. Horizontal Displacements Revealed by Feature Tracking
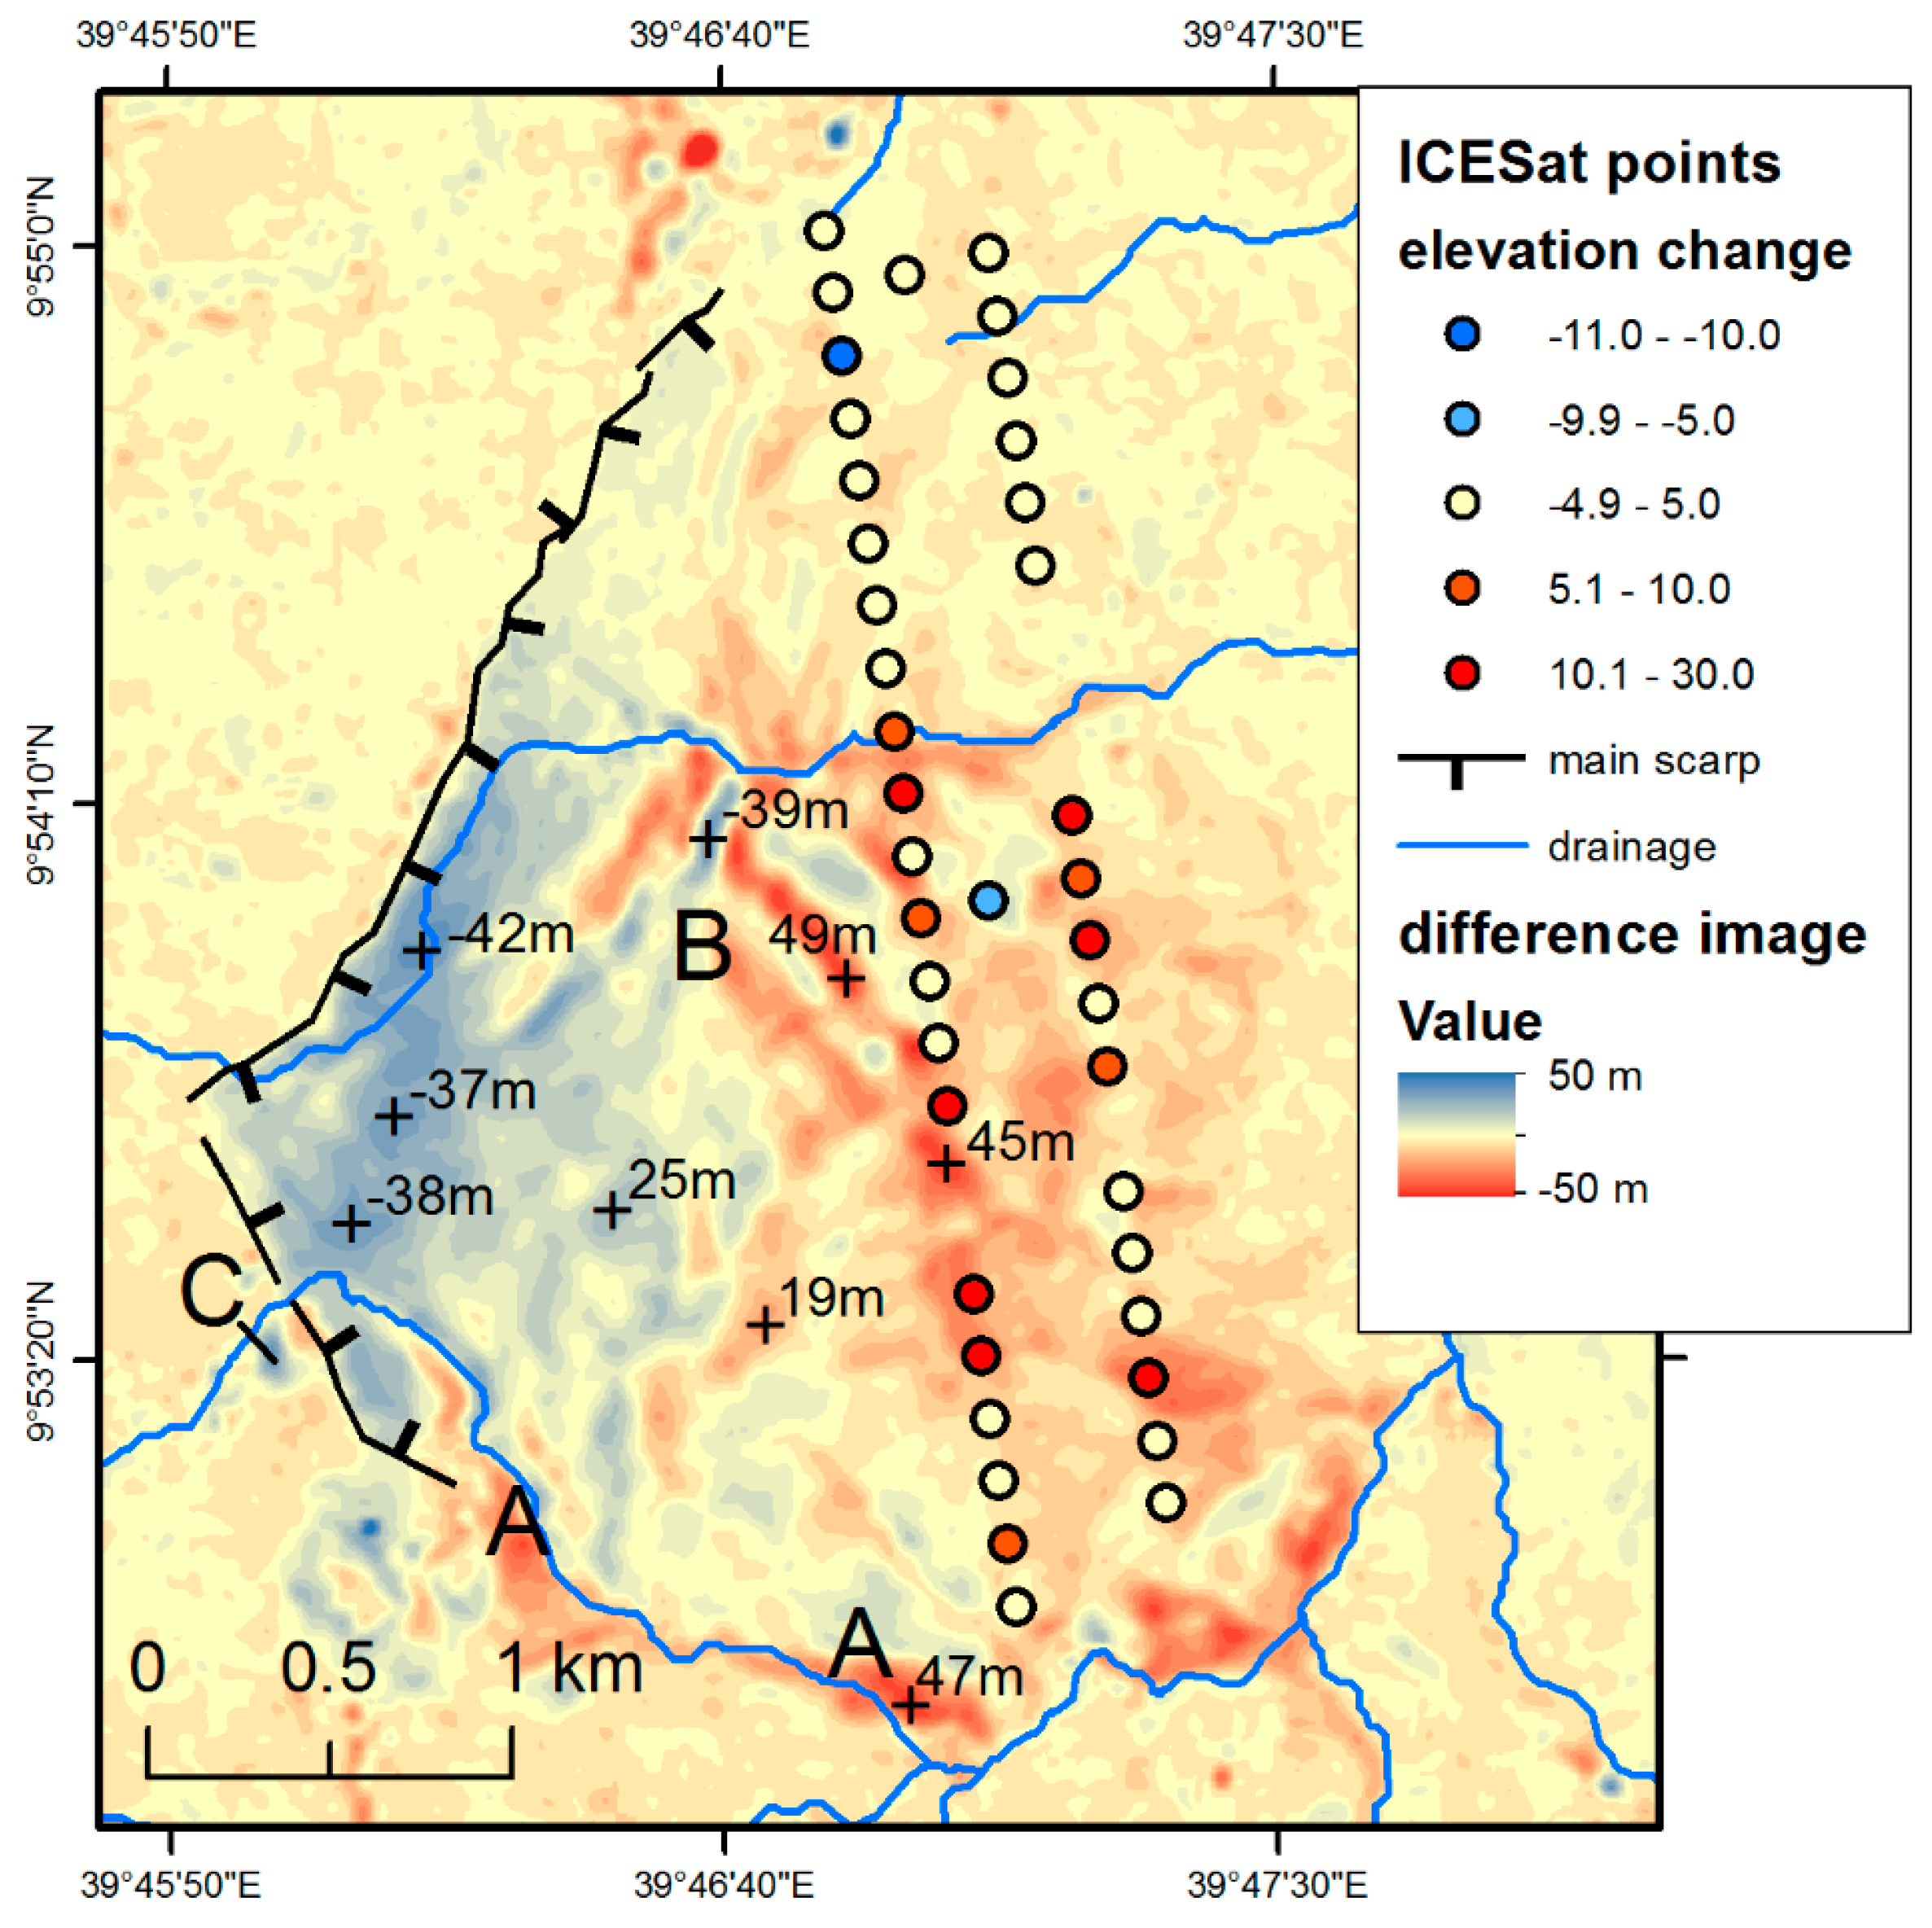
4.4. Vertical Displacements Identified by Differential DEMs
5. Discussion
5.1. Character of the Movement
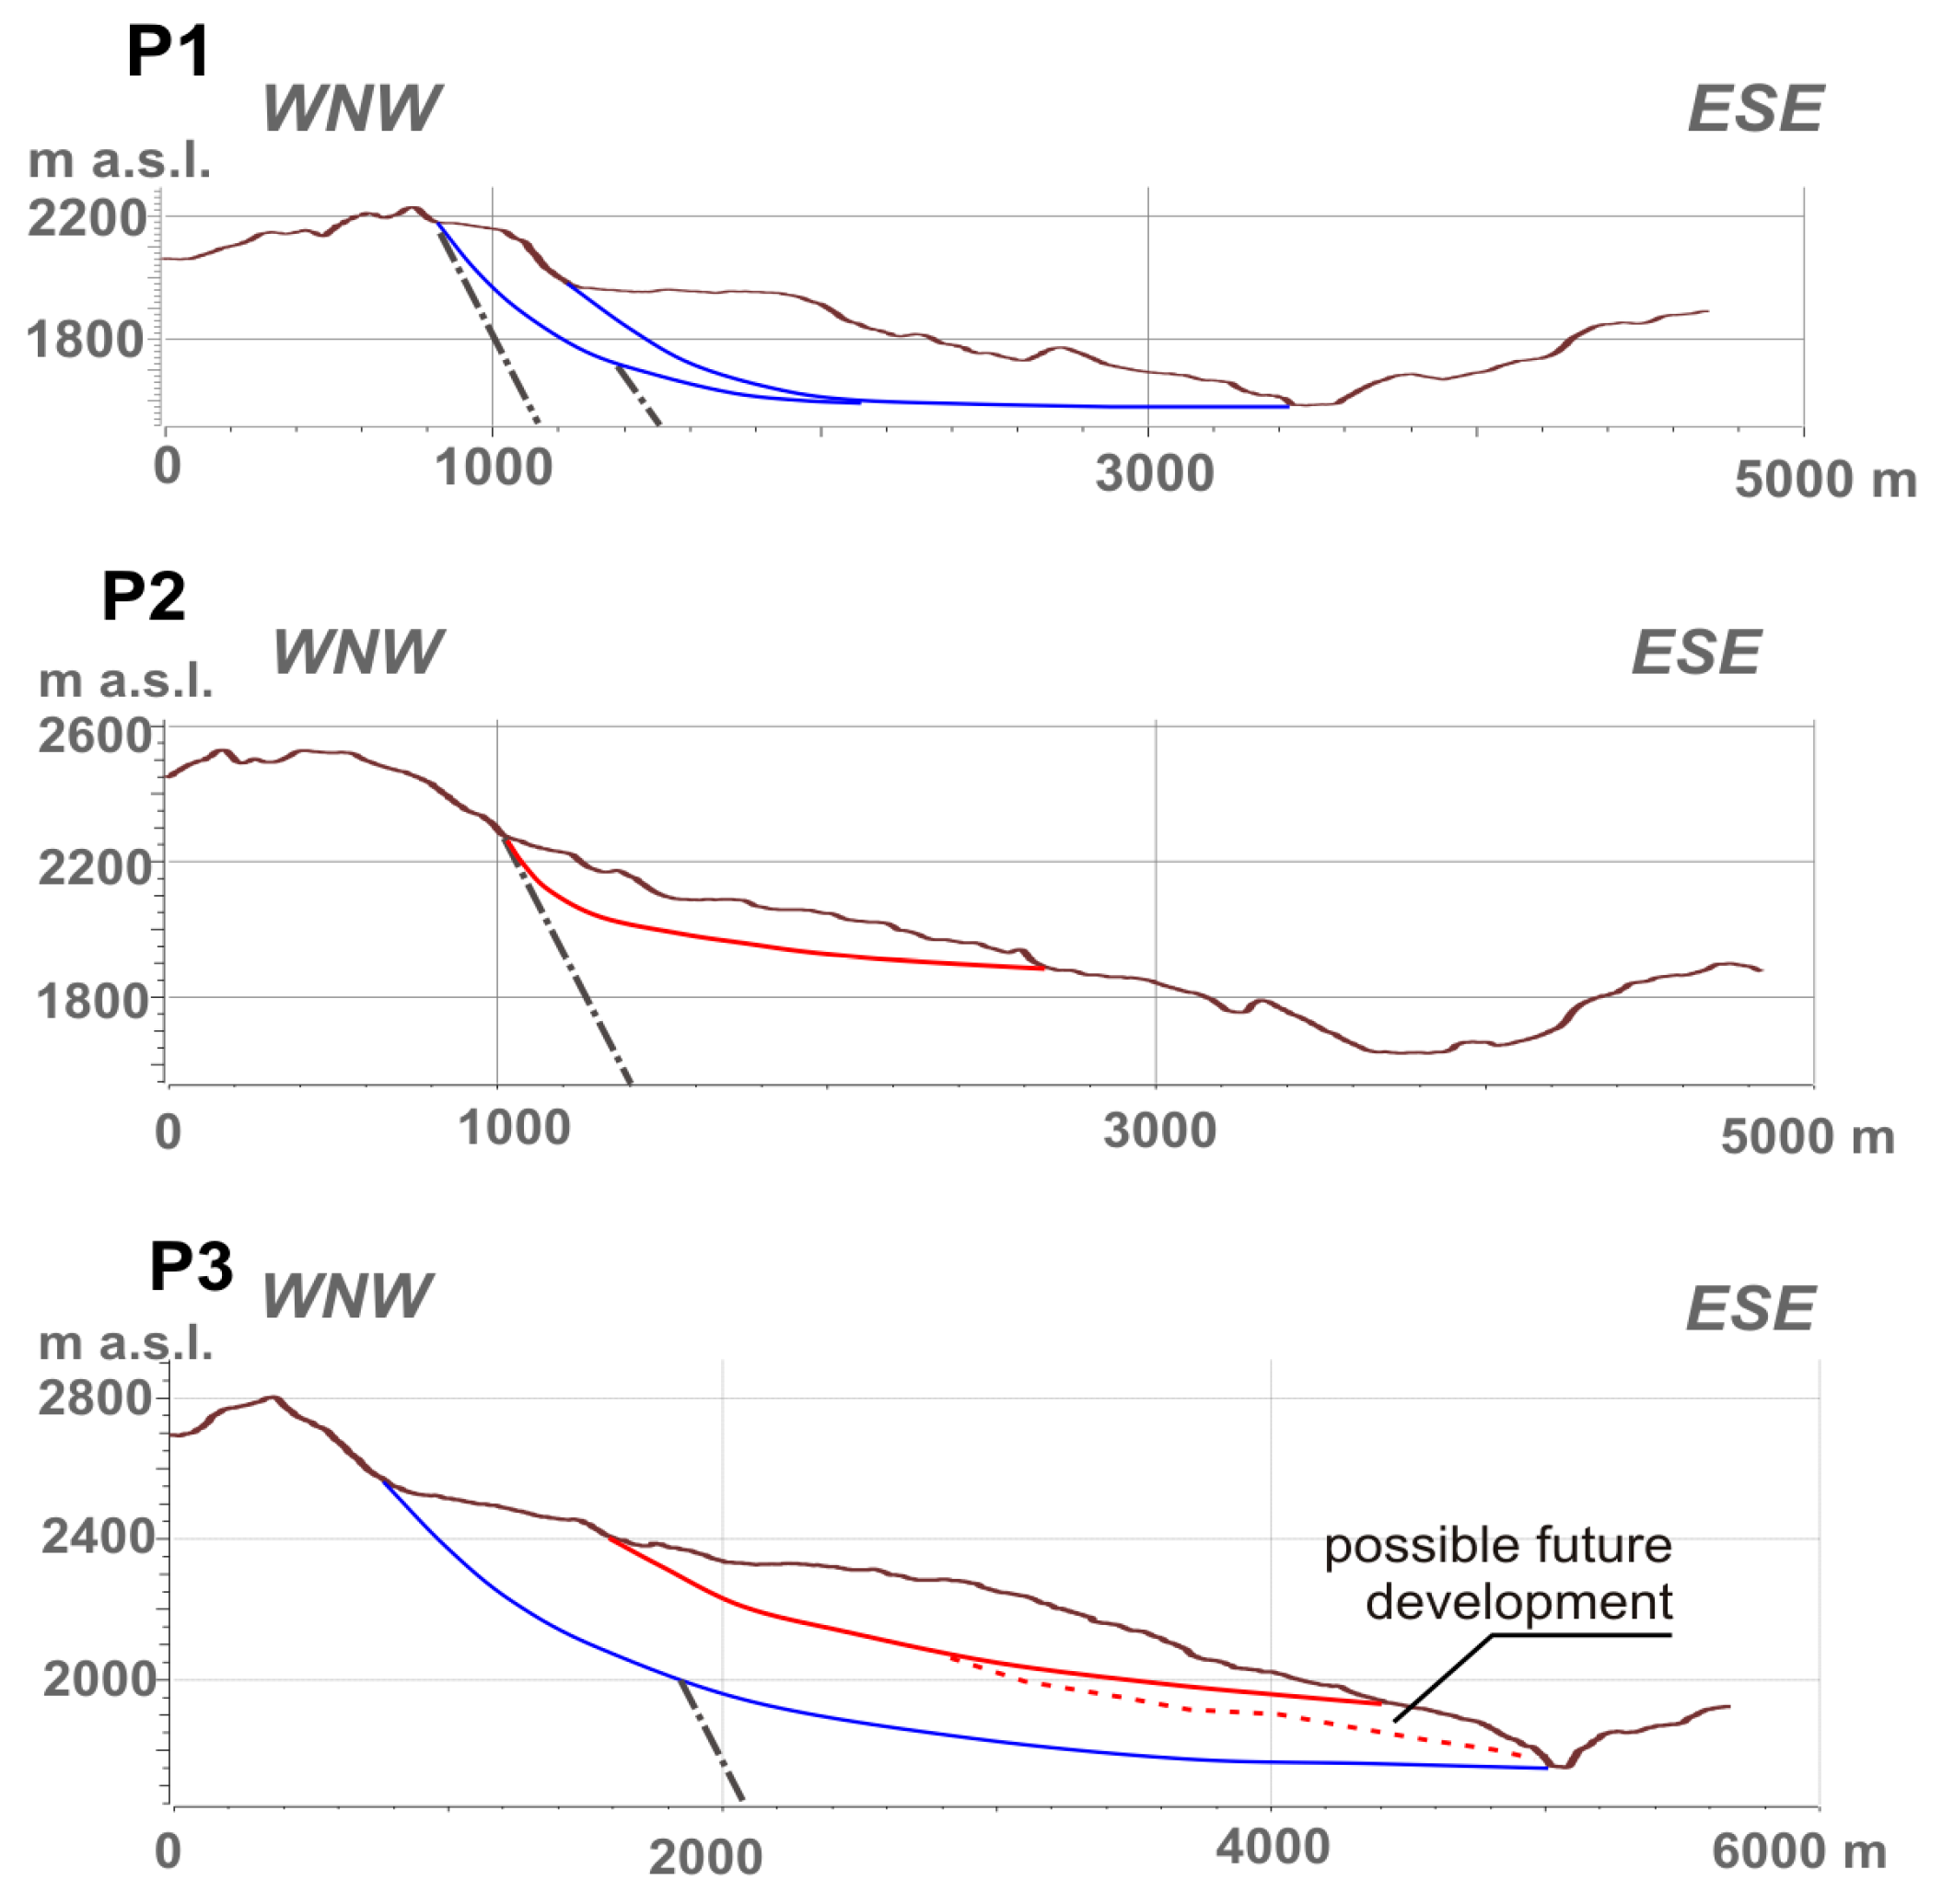
5.2. Evolution of the Slope Failure
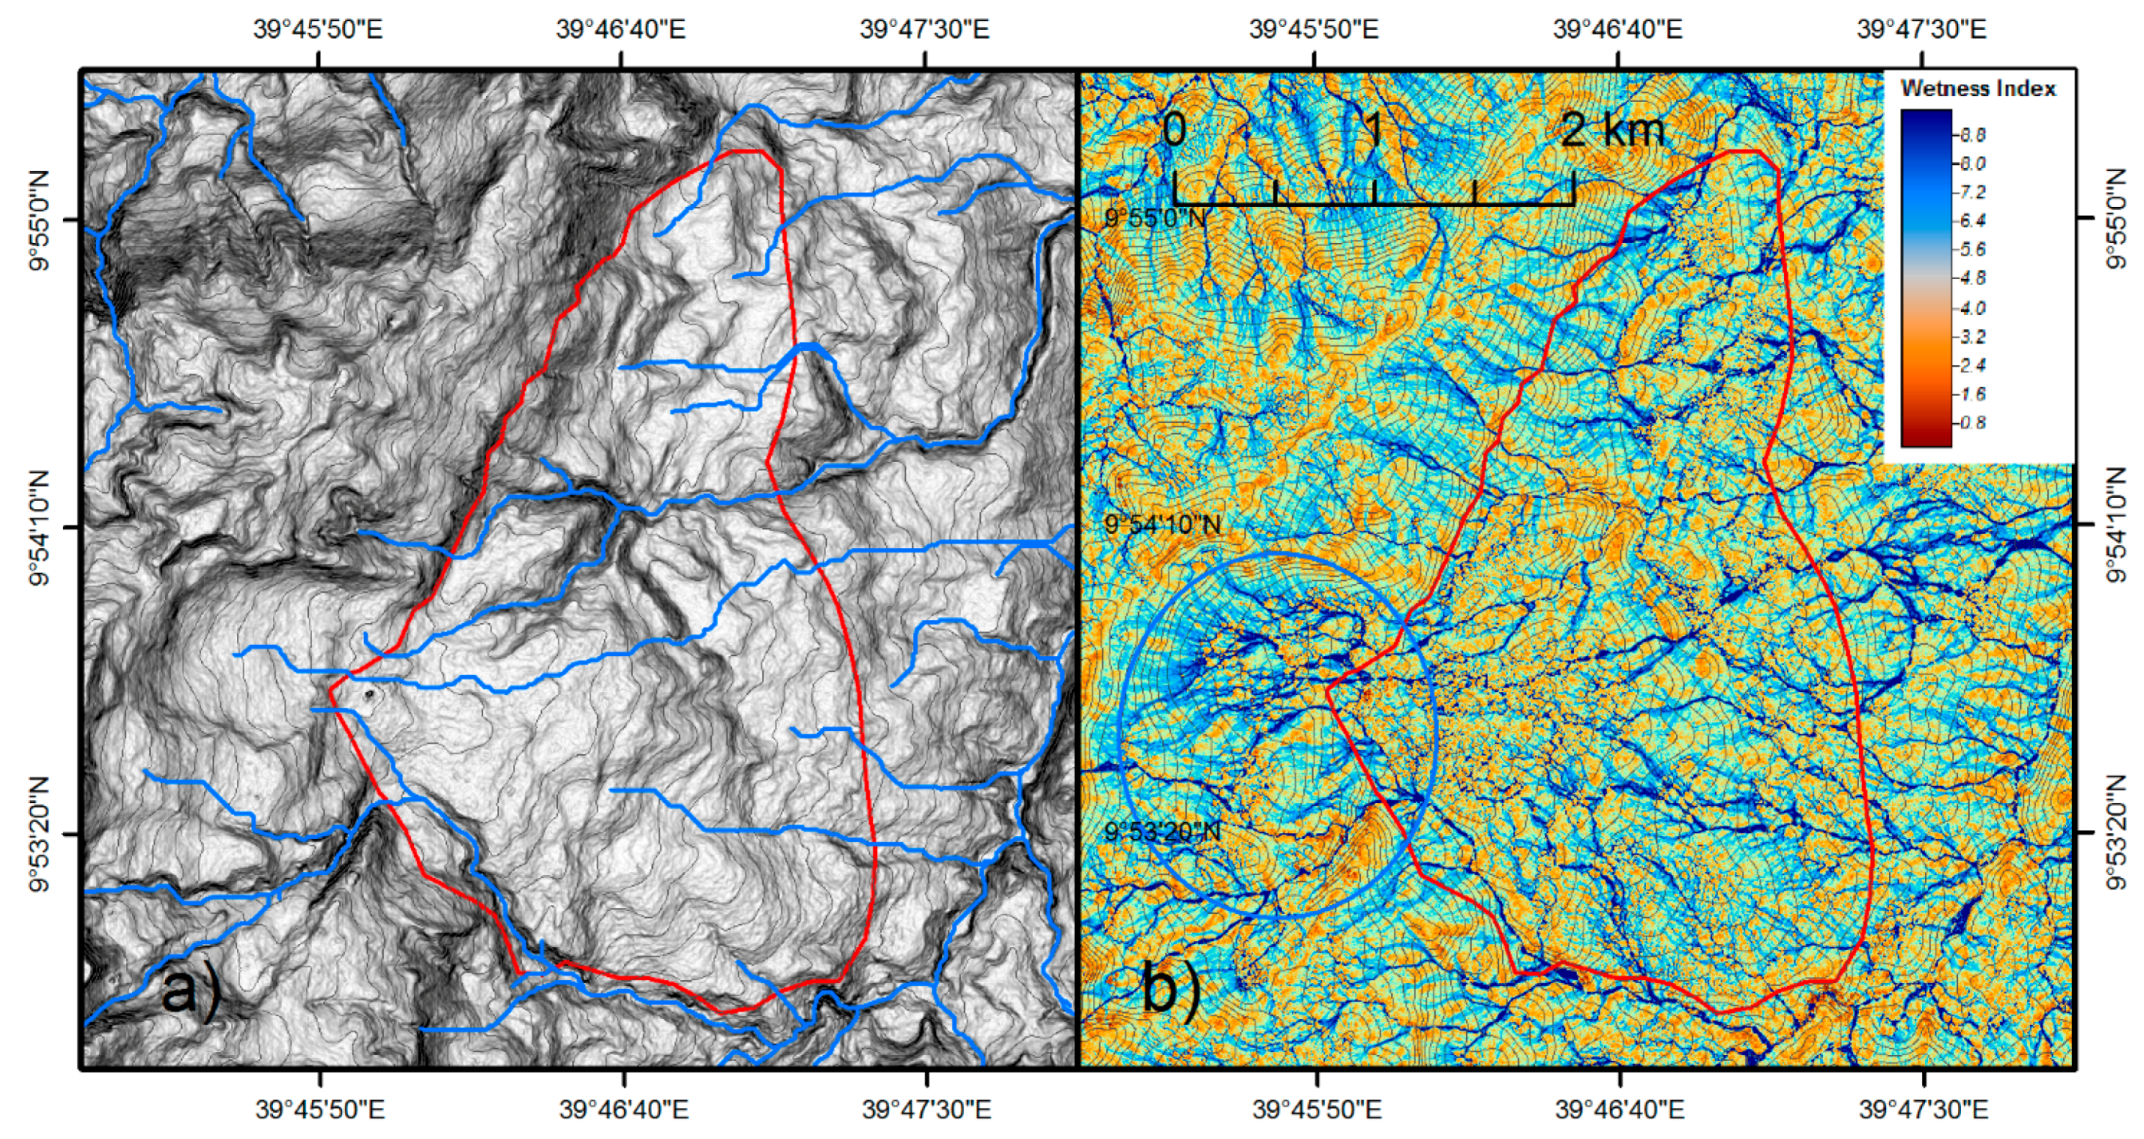
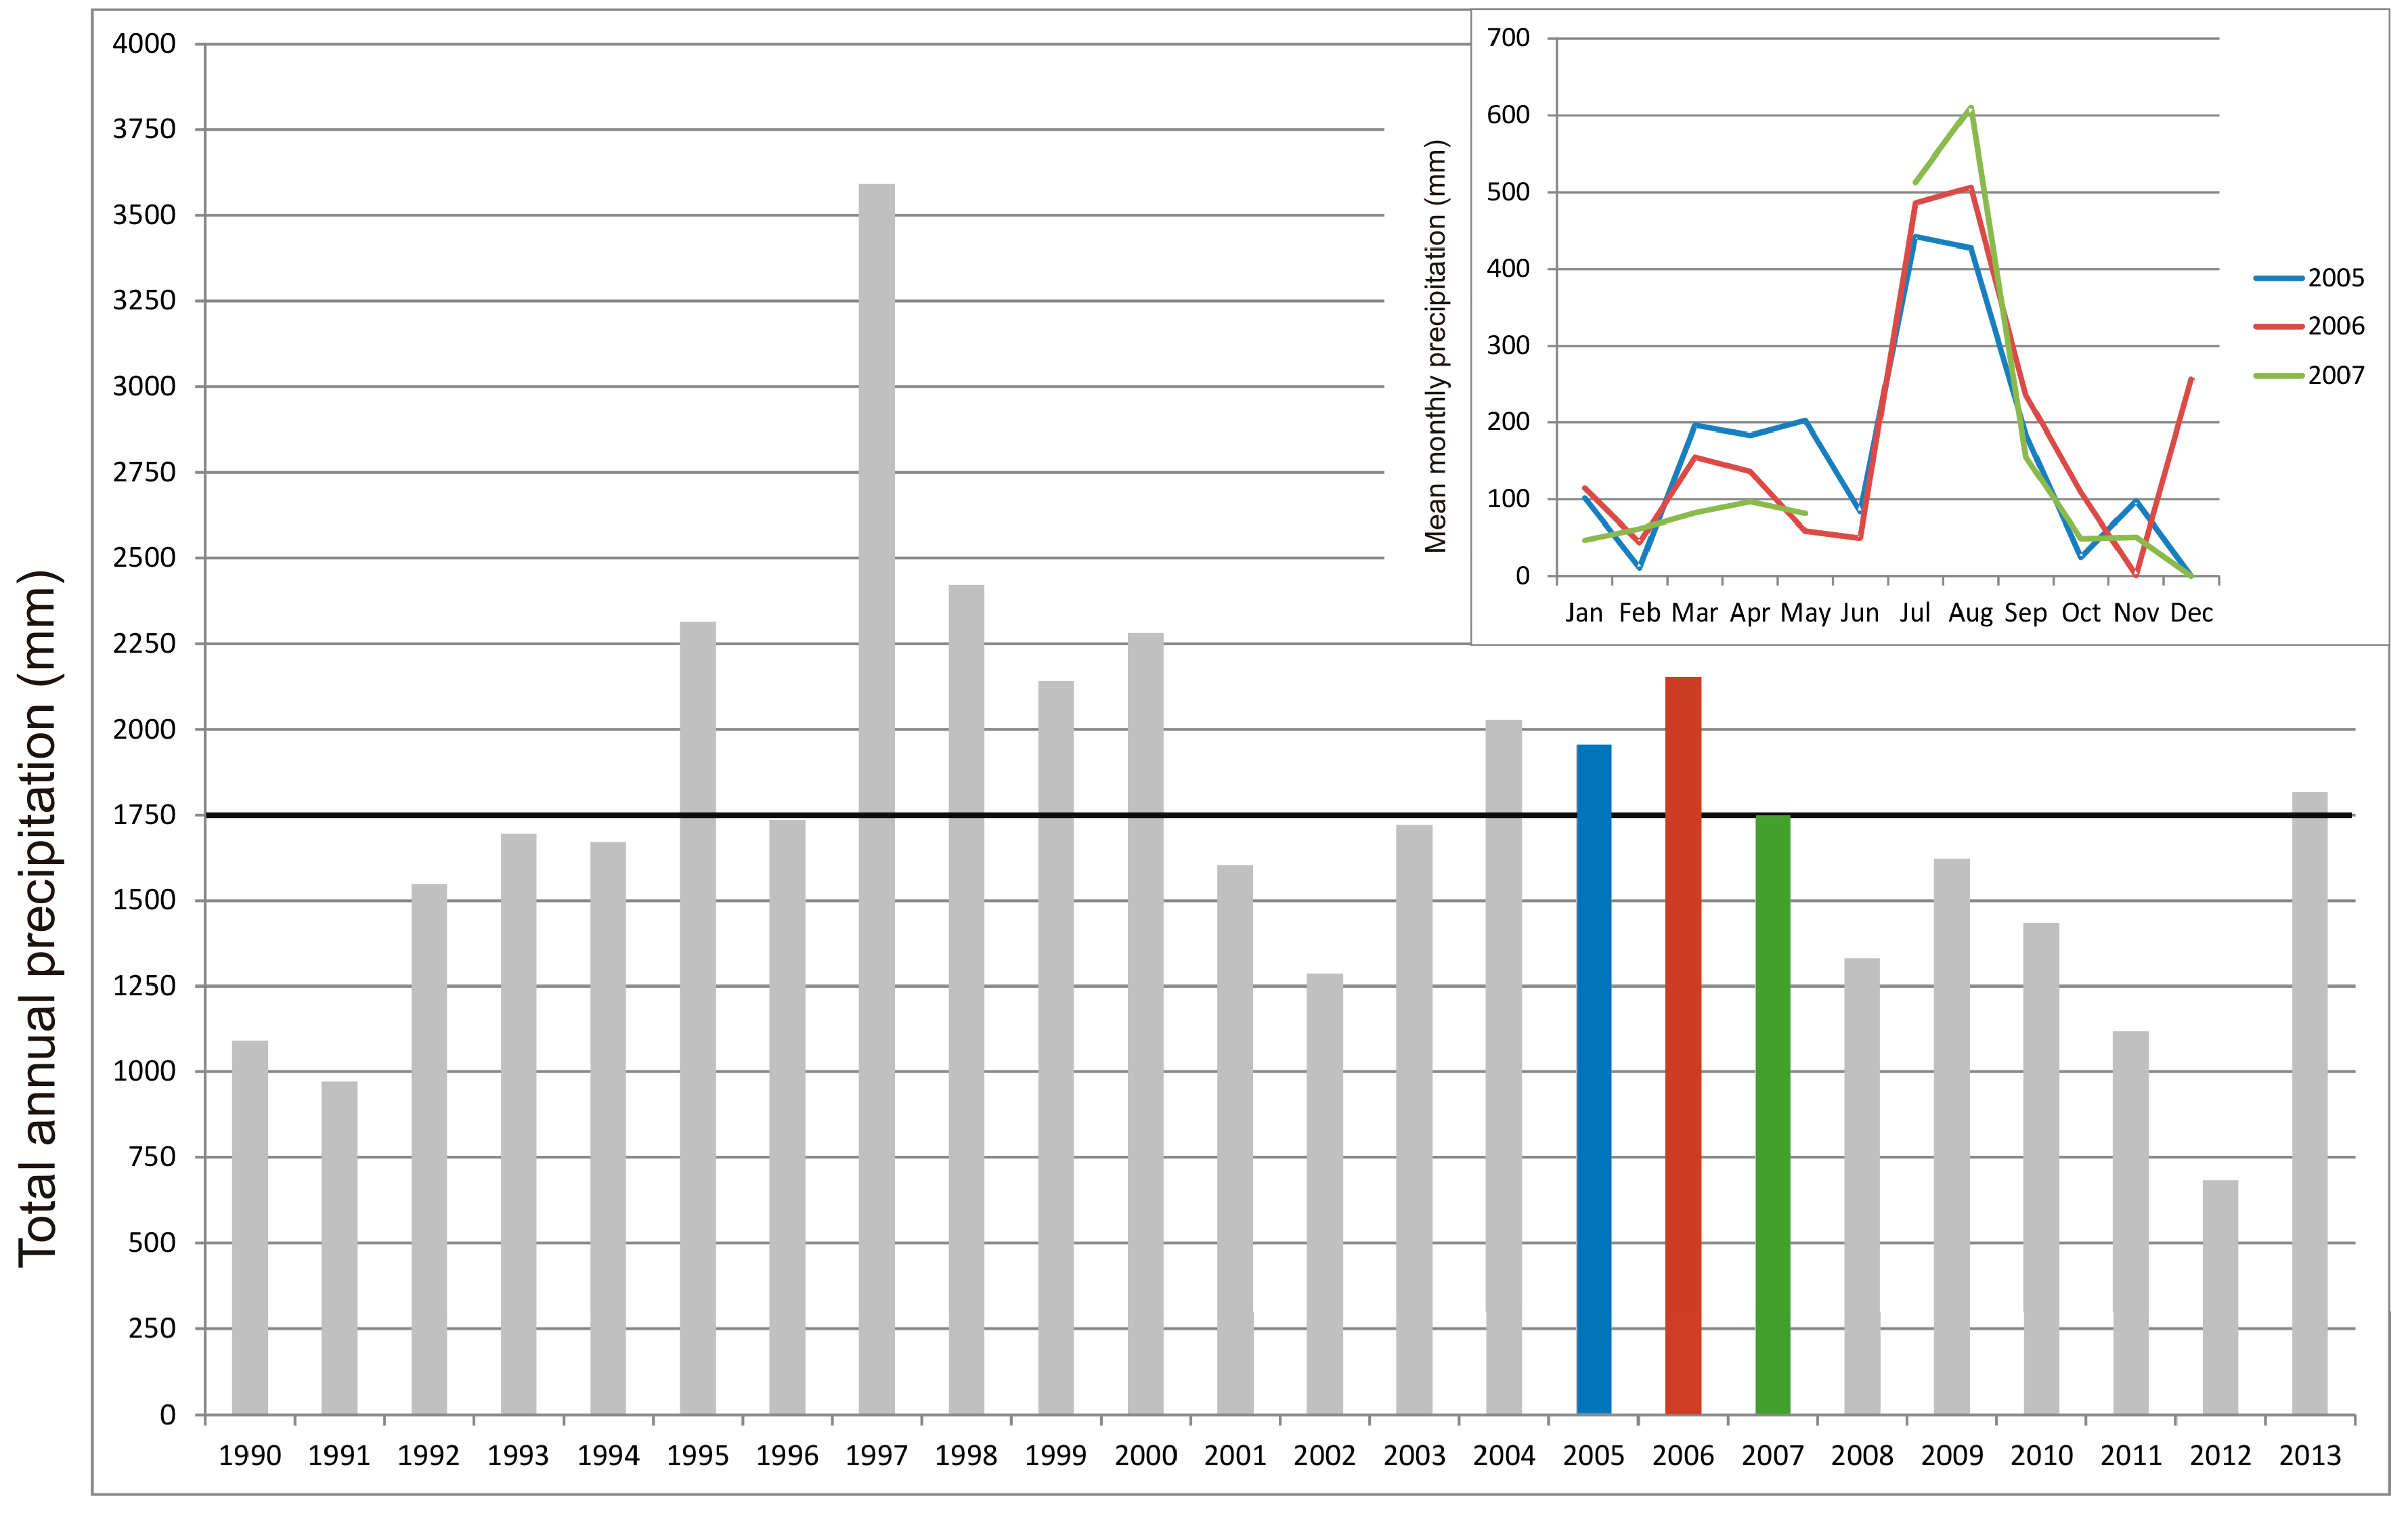
5.3. Predisposition and Triggering

6. Conclusions
Acknowledgments
Author Contributions
Conflicts of Interest
References
- Kääb, A. Photogrammetry for early recognition of high mountain hazards: New techniques and applications. Phys. Chem. Earth Part B: Hydrol. Ocean. Atmos. 2000, 25, 765–770. [Google Scholar] [CrossRef]
- Kääb, A. Monitoring high-mountain terrain deformation from repeated air- and spaceborne optical data: Examples using digital aerial imagery and ASTER data. ISPRS J. Photogramm. Remote Sens. 2002, 57, 39–52. [Google Scholar] [CrossRef]
- Delacourt, C.; Raucoules, D.; Le Mouélic, S.; Carnec, C.; Feurer, D.; Allemand, P.; Cruchet, M. Observation of a large landslide on La Reunion Island using differential SAR interferometry (JERS and Radarsat) and correlation of optical (Spot5 and Aerial) images. Sensors 2009, 9, 616–630. [Google Scholar] [CrossRef] [PubMed]
- Kääb, A.; Vollmer, M. Surface Geometry, Thickness changes and flow fields on creeping mountain permafrost: Automatic extraction by digital image analysis. Permafr. Periglac. Process. 2000, 11, 315–326. [Google Scholar] [CrossRef]
- Leprince, S.; Barbot, S.; Ayoub, F.; Avouac, J.-P. Automatic and precise orthorectification, coregistration, and subpixel correlation of satellite images, application to ground deformation measurements. IEEE Trans. Geosci. Remote Sens. 2007, 45, 1529–1558. [Google Scholar] [CrossRef]
- Scherler, D.; Leprince, S.; Strecker, M.R. Glacier-surface velocities in alpine terrain from optical satellite imagery—Accuracy improvement and quality assessment. Remote Sens. Environ. 2008, 112, 3806–3819. [Google Scholar] [CrossRef]
- Stumpf, A.; Malet, J.P.; Allemand, P.; Ulrich, P. Surface reconstruction and landslide displacement measurements with Pléiades satellite images. ISPRS J. Photogramm. Remote Sens. 2014, 95, 1–12. [Google Scholar] [CrossRef]
- Lacroix, P.; Berthier, E.; Maquerhua, E.T. Earthquake-driven acceleration of slow-moving landslides in the Colca valley, Peru, detected from Pléiades images. Remote Sens. Environ. 2015, 165, 148–158. [Google Scholar] [CrossRef]
- Fruneau, B.; Achache, J.; Delacourt, C. Observation and modelling of the Saint-Etienne-de-Tinee landslide using SAR interferometry. Tectonophysics 1996, 265, 181–190. [Google Scholar] [CrossRef]
- Rott, H.; Scheuchl, B.; Siegel, A.; Grasemann, B. Monitoring very slow slope motion by means of SAR interferometry: A case study from a mass waste above a reservoir in the Ötztal Alps, Austria. Geophys. Res. Lett. 1999, 26, 1629–1632. [Google Scholar] [CrossRef]
- Strozzi, T.; Farina, P.; Corsini, A.; Ambrosi, C.; Thüring, M.; Zilger, J.; Wiesmann, A.; Wegmüller, U.; Werner, C. Survey and monitoring of landslide displacements by means of L-band satellite SAR interferometry. Landslides 2005, 2, 193–201. [Google Scholar] [CrossRef]
- Delacourt, C.; Allemand, P.; Berthier, E.; Raucoules, D.; Casson, B.; Grandjean, P.; Pambrun, C.; Varel, E. Remote-sensing techniques for analysing landslide kinematics: A review. Bull. Soc. Geol. France 2007, 178, 89–100. [Google Scholar] [CrossRef]
- Strozzi, T.; Luckman, A.; Murray, T.; Wegmüller, U.; Werner, C.L. Glacier motion estimation using SAR offset-tracking procedures. IEEE Trans. Geosci. Remote Sens. 2002, 40, 2384–2391. [Google Scholar] [CrossRef]
- Pritchard, H.; Murray, T.; Luckman, A.; Strozzi, T.; Barr, S. Glacier surge dynamics of Sortebræ, east Greenland, from synthetic aperture radar feature tracking. J. Geophys. Res.: Earth Surf. 2005, 110, 1–13. [Google Scholar] [CrossRef]
- Jiang, Z.-L.; Liu, S.-Y.; Peters, J.; Lin, J.; Long, S.-C.; Han, Y.-S.; Wang, X. Analyzing Yengisogat Glacier surface velocities with ALOS PALSAR data feature tracking, Karakoram, China. Environ. Earth Sci. 2012, 67, 1033–1043. [Google Scholar] [CrossRef]
- Weber, D.; Herrmann, A. Contribution of digital photogrammetry in spatio-temporal knowledge of unstable slopes: the example of the Super-Saute landslide (Alpes-de-Haute-Provence, France). Bull. Soc. Geol. France 2000, 171, 637–648. [Google Scholar] [CrossRef]
- Walstra, J.; Chandler, J.H.; Dixon, N.; Dijkstra, T.A. In time for change-quantifying landslide evolution using historical aerial photographs and modern photogrammetric methods. In Proceedings of the 20th ISPRS, Istanbul, Turkey, 12–23 July 2004; pp. 475–480.
- Tsutsui, K.; Rokugawa, S.; Nakagawa, H.; Miyazaki, S.; Chin-Tung, C.; Shiraishi, T.; Shiun-Der, Y. Detection and volume estimation of large-scale landslides based on elevation-change analysis using DEMs extracted from high-resolution satellite stereo imagery. IEEE Trans. Geosci. Remote Sens. 2007, 45, 1681–1696. [Google Scholar] [CrossRef]
- Abebe, B.; Dramis, F.; Fubelli, G.; Umer, M.; Asrat, A. Landslides in the Ethiopian highlands and the Rift margins. J. Afr. Earth Sci. 2010, 56, 131–138. [Google Scholar] [CrossRef]
- Woldearegay, K. Review of the occurrences and influencing factors of landslides in the highlands of Ethiopia: With implications for infrastructural development. Momona Ethiop. J. Sci. 2013, 5, 3–31. [Google Scholar]
- Ayalew, L. The effect of seasonal rainfall on landslides in the highlands of Ethiopia. Bull. Eng. Geol. Environ. 1999, 58, 9–19. [Google Scholar] [CrossRef]
- Abay, A.; Barbieri, G. Landslide Susceptibility and Causative Factors Evaluation of the Landslide Area of Debresina, in the Southwestern Afar Escarpment, Ethiopia. J. Earth Sci. Eng. 2012, 2, 133–144. [Google Scholar]
- Alemayehu, L.; Gerra, S.; Zvelebil, J.; Šíma, J. Landslide Investigations in Tarmaber, Debre Sina, North Shewa Zone; Amhara Regional State; AQUATEST a.s.: Prague, Czech Republic, 2012. [Google Scholar]
- Woldearegay, K. Characteristics of a large-scale landslide triggered by heavy rainfall in Tarmaber area, central highlands of Ethiopia. Geophys. Res. Abstr. 2008, 10. EGU2008-A-04506-EGU02008. [Google Scholar]
- Schneider, J.; Woldearegay, K.; Atsbah, G. Reactivated large-scale landslides in Tarmaber district, central Ethiopian Highlands at the western rim of afar triangle. In Proceedings of the International Geological Congress, Oslo, Sweeden, 6–14 August 2008.
- Hagos, A.A. Remote sensing and GIS-based mapping on landslide phenomena and landslide susceptibility evaluation of Debresina Area (Ethiopia) and Rio San Girolamo basin (Sardinia). Ph.D. Thesis, Universita degli Studi di Cagliari, Cagliari, Italy, 2012. [Google Scholar]
- Kebede, F.; Kulhánek, O. Recent seismicity of the East African Rift system and its implications. Phys. Earth Planet. Inter. 1991, 68, 259–273. [Google Scholar] [CrossRef]
- Keir, D.; Ebinger, C.J.; Stuart, G.W.; Daly, E.; Ayele, A. Strain accommodation by magmatism and faulting as rifting proceeds to breakup: Seismicity of the northern Ethiopian rift. J. Geophys. Res.: Solid Earth 2006, 111. [Google Scholar] [CrossRef]
- Midzi, V.; Hlatywayo, D.J.; Chapola, L.S.; Kebede, F.; Atakan, K.; Lombe, D.K.; Turyomurugyendo, G.; Tugume, F.A. Seismic hazard assessment in Eastern and Southern Africa. Ann. Geophys. 1999, 42. [Google Scholar]
- USGS. Earthquake Hazards Program. Available online: http://earthquake.usgs.gov/earthquakes/search/ (accessed on 2 September 2015).
- Gouin, P. Earthquake History of Ethiopia and the Horn of Africa; International Development Research Centre: Ottawa, ON, Canada, 1979. [Google Scholar]
- Westoby, M.J.; Brasington, J.; Glasser, N.F.; Hambrey, M.J.; Reynolds, J.M. Structure-from-Motion photogrammetry: A low-cost, effective tool for geoscience applications. Geomorphology 2012, 179, 300–314. [Google Scholar] [CrossRef]
- Lucieer, A.; de Jong, S.M.; Turner, D. Mapping landslide displacements using Structure from Motion (SfM) and image correlation of multi-temporal UAV photography. Prog. Phys. Geogr. 2013, 38, 97–116. [Google Scholar] [CrossRef]
- Beven, K.J.; Kirkby, M.J.; Seibert, J. A physically based, variable contributing area model of basin hydrology. Hydrol. Sci. Bull. 1979, 24, 43–69. [Google Scholar] [CrossRef]
- Conoscenti, C.; Maggio, C.D.; Rotigliano, E. GIS Analysis to assess landslide susceptibility in a fluvial basin of NW Sicily (Italy). Geomorphology 2008, 94, 325–339. [Google Scholar] [CrossRef]
- Yilmaz, I. Landslide susceptibility mapping using frequency ratio, logistic regression, artificial neural networks and their comparison: A case study from Kat landslides (Tokat-Turkey). Comput. Geosci. 2009, 35, 1125–1138. [Google Scholar] [CrossRef]
- Takaku, J.; Futamura, N.; Iijima, T.; Tadono, T.; Shimada, M. High resolution DSM generation from ALOS PRISM–Perform-ance Analysis. In Proceedings of the IEEE IGARSS, Barcelona, Spain, 23–27 July 2007.
- Zwally, H.J.; Schutz, R.; Bentley, C.; Bufton, J.; Herring, T.; Minster, J.; Spinhirne, J.; Thomas, R. GLAS/ICESat L2 Global Land Surface Altimetry Data, Version 33, National Snow and Ice Data Center: Boulder, CO, USA, 2003.
- Kääb, A.; Berthier, E.; Nuth, C.; Gardelle, J.; Arnaud, Y. Contrasting patterns of early twenty-first-century glacier mass change in the Himalayas. Nature 2012, 488, 495–498. [Google Scholar] [CrossRef] [PubMed]
- Neckel, N.; Kropáček, J.; Bolch, T.; Hochschild, V. Glacier mass changes on the Tibetan Plateau 2003–2009 derived from ICESat laser altimetry measurements. Environ. Res. Lett. 2014, 9, 014009. [Google Scholar] [CrossRef]
- Kropáček, J.; Neckel, N.; Bauder, A. Estimation of mass balance of the Aletsch Glacier, Swiss Alps, from ICESat laser altimetry data. Remote Sens. 2014, 6, 5614–5632. [Google Scholar] [CrossRef]
- Nuth, C.; Kääb, A. Co-registration and bias corrections of satellite elevation data sets for quantifying glacier thickness change. Cryosphere 2011, 5, 271–290. [Google Scholar] [CrossRef]
- Bhang, K.J.; Schwartz, F.W.; Braun, A. Verification of the vertical error in C-band SRTM DEM using ICESat and Landsat-7, Otter Tail County, MN. IEEE Trans. Geosci. Remote Sens. 2007, 45, 36–44. [Google Scholar] [CrossRef]
- Koblet, T.; Gärtner-Roer, I.; Zemp, M.; Jansson, P.; Thee, P.; Haeberli, W.; Holmlund, P. Reanalysis of multi-temporal aerial images of Storglaciären, Sweden (1959–99)—Part 1: Determination of length, area, and volume changes. The Cryosphere 2010, 4, 333–343. [Google Scholar] [CrossRef]
- Parise, M. Observation of surface features on an active landslide, and implications for understanding its history of movement. Nat. Hazards Earth Syst. Sci. 2003, 3, 569–580. [Google Scholar] [CrossRef]
- Niethammer, U.; James, M.R.; Rothmund, S.; Travelletti, J.; Joswig, M. UAV-based remote sensing of the Super-Sauze landslide: Evaluation and results. Eng. Geol. 2012, 128, 2–11. [Google Scholar] [CrossRef]
- Stumpf, A.; Malet, J.-P.; Kerle, N.; Niethammer, U.; Rothmund, S. Image-based mapping of surface fissures for the investigation of landslide dynamics. Geomorphology 2013, 186, 12–27. [Google Scholar] [CrossRef]
- Farr, T.G.; Kobrick, M. Shuttle radar topography mission produces a wealth of data. Eos Trans. AGU 2000, 81, 583–583. [Google Scholar] [CrossRef]
- Rabus, B.; Eineder, M.; Roth, A.; Bamler, R. The shuttle radar topography mission–A new class of digital elevation models acquired by spaceborne radar. ISPRS J. Photogramm. Remote Sens. 2003, 57, 241–262. [Google Scholar] [CrossRef]
- Booth, A.M.; Lamb, M.P.; Avouac, J.-P.; Delacourt, C. Landslide velocity, thickness, and rheology from remote sensing: La Clapière landslide, France. Geophys. Res. Lett. 2013, 40, 4299–4304. [Google Scholar] [CrossRef]
- Raucoules, D.; de Michele, M.; Malet, J.P.; Ulrich, P. Time-variable 3D ground displacements from high-resolution synthetic aperture radar (SAR). Application to La Valette landslide (South French Alps). Remote Sens. Environ. 2013, 139, 198–204. [Google Scholar] [CrossRef]
- Krige, D.G. A statistical approach to some basic mine valuation problems on the Witwatersrand. J. Chem., Metall. Min. Soc. South Afr. 1951, 52, 119–139. [Google Scholar]
- Turner, A.K.; Schuster, L.R. Landslides: Investigation and Mitigation; Transportation Research Board: Washington, WA, USA, 1996. [Google Scholar]
- Hilbert, C.; Schmullius, C. Influence of surface topography on ICESat/GLAS forest height estimation and waveform shape. Remote Sens. 2012, 4, 2210–2235. [Google Scholar] [CrossRef]
- Záruba, Q.; Mencl, V. Landslides and Their Control; Elsevier: New York, NY, USA, 1972. [Google Scholar]
- Wolfenden, E.; Ebinger, C.; Yirgu, G.; Deino, A.; Ayalew, D. Evolution of the northern Main Ethiopian rift: Birth of a triple junction. Earth Planet. Sci. Lett. 2004, 224, 213–228. [Google Scholar] [CrossRef]
- Baroň, I.; Kernstocková, M.; Faridi, M.; Bubík, M.; Milovský, R.; Melichar, R.; Sabouri, J.; Babůrek, J. Paleostress analysis of a gigantic gravitational mass movement in active tectonic setting: The Qoshadagh slope failure, Ahar, NW Iran. Tectonophysics 2013, 605, 70–87. [Google Scholar] [CrossRef]
- Wright, T.; Ebinger, C.; Biggs, T.; Ayele, A.; Yirgu, G.; Keir, D.; Stork, A. Magma maintained rift segmentation at continental rupture in the 2005 Afar diking episode. Nature 2006, 442, 291–294. [Google Scholar] [CrossRef] [PubMed]
- Yirgu, G.; Ababa, A.; Ayele, A. Recent seismovolcanic crisis in northern Afar, Ethiopia. Eos, Trans. Am. Geophys. Union 2006, 87, 325–329. [Google Scholar] [CrossRef]
© 2015 by the authors; licensee MDPI, Basel, Switzerland. This article is an open access article distributed under the terms and conditions of the Creative Commons by Attribution (CC-BY) license (http://creativecommons.org/licenses/by/4.0/).
Share and Cite
Kropáček, J.; Vařilová, Z.; Baroň, I.; Bhattacharya, A.; Eberle, J.; Hochschild, V. Remote Sensing for Characterisation and Kinematic Analysis of Large Slope Failures: Debre Sina Landslide, Main Ethiopian Rift Escarpment. Remote Sens. 2015, 7, 16183-16203. https://doi.org/10.3390/rs71215821
Kropáček J, Vařilová Z, Baroň I, Bhattacharya A, Eberle J, Hochschild V. Remote Sensing for Characterisation and Kinematic Analysis of Large Slope Failures: Debre Sina Landslide, Main Ethiopian Rift Escarpment. Remote Sensing. 2015; 7(12):16183-16203. https://doi.org/10.3390/rs71215821
Chicago/Turabian StyleKropáček, Jan, Zuzana Vařilová, Ivo Baroň, Atanu Bhattacharya, Joachim Eberle, and Volker Hochschild. 2015. "Remote Sensing for Characterisation and Kinematic Analysis of Large Slope Failures: Debre Sina Landslide, Main Ethiopian Rift Escarpment" Remote Sensing 7, no. 12: 16183-16203. https://doi.org/10.3390/rs71215821
APA StyleKropáček, J., Vařilová, Z., Baroň, I., Bhattacharya, A., Eberle, J., & Hochschild, V. (2015). Remote Sensing for Characterisation and Kinematic Analysis of Large Slope Failures: Debre Sina Landslide, Main Ethiopian Rift Escarpment. Remote Sensing, 7(12), 16183-16203. https://doi.org/10.3390/rs71215821