Article

Application of High Resolution Satellite Imagery to Characterize Individual-Based Environmental Heterogeneity in a Wild Blue Tit Population

1
Centre d’Ecologie Fonctionnelle et Evolutive, Centre National de la Recherche Scientifique (CNRS) UMR 5175. 1919 Route de Mende, 34293 Montpellier cedex 5, France
2
Centre of New Technologies, University of Warsaw, 2c Banacha St., 02-097 Warsaw, Poland
3
Biologie, Faculté des Sciences, Université de Sherbrooke, Sherbrooke, QC J1K 2R1, Canada
*
Author to whom correspondence should be addressed.
Remote Sens. 2015, 7(10), 13319-13336; https://doi.org/10.3390/rs71013319
Submission received: 25 May 2015 / Revised: 15 September 2015 / Accepted: 29 September 2015 / Published: 12 October 2015

Abstract

:
Environmental heterogeneity in space and time plays a key role in influencing trait variability in animals, and can be particularly relevant to animal phenology. Until recently, the use of remotely sensed imagery in understanding animal variation was limited to analyses at the population level, largely because of a lack of high-resolution data that would allow inference at the individual level. We evaluated the potential of SPOT 4 (Take 5) satellite imagery data (with observations every fifth day at 20 m resolution and equivalent to acquisition parameters of Sentinel-2) in animal ecology research. We focused on blue tit Cyanistes caeruleus reproduction in a study site containing 227 nestboxes scattered in a Mediterranean forest dominated by deciduous downy oaks Quercus pubescens with a secondary cover of evergreen holm oaks Quercus ilex. We observed high congruence between ground data collected in a 50 m radius around each nestbox and NDVI values averaged across a 5 by 5 pixel grid centered around each nestbox of the study site. The number of deciduous and evergreen oaks around nestboxes explained up to 66% of variance in nestbox-centered, SPOT-derived NDVI values. We also found highly equivalent patterns of spatial autocorrelation for both ground- and satellite-derived indexes of environmental heterogeneity. For deciduous and evergreen oaks, the derived NDVI signal was highly distinctive in winter and early spring. June NDVI values for deciduous and evergreen oaks were higher by 58% and 8% relative to February values, respectively. The number of evergreen oaks was positively associated with later timing of breeding in blue tits. SPOT-derived, Sentinel-2 like imagery thus provided highly reliable, ground-validated information on habitat heterogeneity of direct relevance to a long-term field study of a free-living passerine bird. Given that the logistical demands of gathering ground data often limit our understanding of variation in animal reproductive traits across time and space, there appears to be great promise in applying fine-resolution satellite data in evolutionary ecology research.

Graphical Abstract

1. Introduction

Studying individual variation in the wild is a cornerstone of evolutionary ecology research. This is because individual variation, determined by genetic and non-genetic sources, is the raw material for natural selection to operate on, and its interaction with the environment can induce evolutionary change over time by triggering shifts in genotype and mean phenotype at the population level [1].
Animal phenology is an example of phenotypic change across time and space: In a meta-analysis spanning 203 species, Parmesan [2] reported significant phenological advancement of spring events of 2.8 days/decade across the northern hemisphere. More specifically, Both et al. [3] report earlier budburst, caterpillar emergence and hatching dates in five bird species over 17 years of data. Animal phenology is also found to substantially vary across space. For example, the breeding phenology of a passerine bird, the blue tit Cyanistes caeruleus can differ by up to one month when populations are 24 km apart, and up to 10 days when 6 km apart [4]. These differences in breeding time are attributed to the type of habitat blue tits use for reproduction: they breed earlier in deciduous oak forests (Quercus pubescens), and later in evergreen oak (Quercus ilex) forests [4,5,6]. A better understanding of the nature of such phenological changes [7], as well as their ecological, demographic and evolutionary consequences [8,9,10] at a fine spatial and temporal scale, is thus of key interest to evolutionary biologists and conservation scientists alike.
Historically, most studies linked changes in animal phenology to population-centered environmental variables, such as changes in temperature for the study site [11], daylight length [12], or predominant vegetation type [13]. This is because individual-based environmental predictors were believed to vary only minimally across individuals in a population, were difficult to extract, or both. Although the environment is an inherently multi-dimensional space, logistical constraints reduce environmental sampling on the ground to points in space and point in time estimates, thereby imposing limits to inference relevant at the level of a single organism or reproductive event. Moreover, coarse environmental predictors such as temperature rarely impact higher organisms such as birds directly, and variation in phenology across trophic levels is therefore not necessarily hard-wired in a linear fashion [3,9,14].
Insectivorous passerine birds in temperate forests usually synchronize their timing of reproduction and offspring energy requirements with peak food availability [15] -such as the availability of oak-dependent caterpillars in the case of blue tits [16,17,18,19]. While caterpillar peaks are triggered by spring temperatures [20], they also show substantial variation across deciduous and evergreen habitats [16]. Blue tit reproductive peaks are dependent on photoperiod and temperature [12,21], but also vegetation type [4] and/or vegetation phenology [22,23]. In Mediterranean habitats, the contrasted phenology of deciduous and evergreen oaks can in fact override the importance of temperature variation: thus, blue tit timing of breeding is strongly correlated with the phenology of the dominant vegetation, which was found to be a more robust predictor of the timing of breeding than temperature at the inter-population level [13]. At the population level, co-variation of avian breeding time and vegetation phenology can also occur at surprisingly low spatial scales: using a 13 year dataset of blue tit and great tit breeding events in Oxfordshire, UK, Cole et al. [22] demonstrated that the onset of egg laying was positively correlated with local vegetation green-up when using 250 m MODIS imagery across a 385-ha mixed deciduous woodland. The same study system was also investigated on the ground, where it was found that measures of phenology at very local scales –as low as 20 m around the nestbox –were the most important predictors of the timing of breeding.
While open-access archives of MODIS and Landsat data offer means to study phenological variation from past records, until now, individual-based studies have been hampered by low-resolution (250 m for MODIS) or low frequency (every 16 days in the case of Landsat) image acquisitions (but see [22]). As a consequence, satellite-derived information on environmental heterogeneity in animal ecology studies is usually applied to population-level analyses ([24,25], but see Cole et al. [22]).
Because of sensor availability and cost limitations, high resolution remotely sensed data is an underexplored resource for animal ecologists in the monitoring of environmental heterogeneity and phenology. The increasing availability of higher frequency and high-resolution imagery is therefore likely to unleash the potential of remotely sensed data for individual based studies. Moreover, birds, and especially bird species breeding in nestboxes, are particularly amenable to the application of remote sensing approaches when inferring environmental heterogeneity: indeed, nestboxes provide insight into the reproductive success of individually marked birds, yet are static in time and easily geolocated. This offers the potential to decouple genetic properties of individuals from their environment, and can be characterized for each nestbox—and in consequence, each reproductive event—in a study site.
Here, we took advantage of detailed vegetation ground data available as part of a long-term study of blue tits in the forest of La Rouvière, a 300 hectares large typical Mediterranean woodland [4,5] to validate the potential of high resolution Sentinel-2 satellite sensors for animal ecology research. We combined ground data with imagery stemming from an experiment on SPOT 4 satellite (Take 5) experiment acquired from February till June 2013, which generated images at a resolution of 20 m and revisit time every five days for five months. The SPOT 4 (Take 5) experiment was to be used as a simulator of time series generated by the European Space Agency’s Sentinel-2 mission [26], which will capture scenes every five days with 10–20 m resolution and generate imagery freely accessible to all from 2015 onwards.
In preparation for the fine spatial and temporal resolution imagery that will be available from Sentinel-2 sensors, we first asked whether the Normalized Difference Vegetation Index (NDVI, [14]) derived from an analogous sensor, SPOT 4 (Take 5), accurately renders habitat heterogeneity observed on the ground in terms of oak composition and spatial autocorrelation. Second, we evaluated NDVI time series of phenological change in two key tree species for the reproductive biology of the Mediterranean blue tit: the deciduous downy oak Quercus pubescens and the evergreen holm oak Quercus ilex. Finally, by using one year of blue tit breeding data matching the SPOT 4 (Take 5) experiment, we tested the potential for associations between ground-collected oak composition, NDVI-derived vegetation signal and blue tit egg-laying date.

2. Materials and Methods

2.1. Study Site

The La Rouvière study site (6.758721, 42.954448) is located 16 km north-west of the city of Montpellier, southern France. It is a 2.4 km long × 1.4 km wide, 300 hectares large forest typically representative of the Mediterranean habitat, with distinct interspersed patches of deciduous downy oak Quercus pubescens and evergreen holm oak Quercus ilex. Evergreen oaks are considered a poorer habitat for blue tits since for the same leaf volume, they support a much lower volume of caterpillars [16,27], compared to deciduous oaks. This difference is largely due to the fact that deciduous oaks renew all of their leaf biomass in spring, while evergreen oaks renew only 30% of their foliage annually [27]. At an inter-population level in southern continental France and Corsica, evergreen oaks budburst occurs two to three weeks later than in deciduous oaks ([13], but see Morin et al. [28]). Oak budburst is matched by a caterpillar peak synchronized with predominant oak vegetation in any given study site [6]. Caterpillar abundance and blue tit offspring hatching peaks in evergreen oak-dominated forests occur up to 4 weeks later than in deciduous oak forests [6], yet this difference varies across years and between geographical areas.
Since 1991, 227 nestboxes have been erected throughout the La Rouvière woodland, which is monitored annually for bird reproduction. Nestbox entrance holes are specifically designed for blue tit (Cyanistes caeruleus) and great tit (Parus major) use. Nestboxes are monitored annually from the onset of nest construction and up until the offspring have fledged. After hatching, parents preferentially feed their offspring with Tortrix viridana caterpillars [29] foraging on oak leaves and available in a narrow time window of 2–3 weeks [17].
Parents are caught and ringed at the nest while feeding young, with uniquely marked metal rings provided by the Centre de Recherches sur la Biologie des Populations d’Oiseaux (C.R.B.P.O., Paris). Offspring are ringed at the nest two weeks after hatching and before fledging. Egg laying date (lay date) refers to the calendar day of the first egg laid by the female blue tit counted from the first of March in any given year. Only the lay date of first clutches was included in this study, while second clutches represent 1% of total clutches. For more information on the Mediterranean blue tit study system, see also Charmantier et al. [4] and Blondel et al. [5].

2.2. Ground Data Measurements

Coordinates of each nestbox in the study site (n = 227) were recorded with a handheld GPS (Garmin© GPSmap62s) with an accuracy of ±3 m. For any nestbox, the average distance to the closest nestbox in the study site was 45 m. A relascope was used to quantify the number of deciduous and evergreen oaks in a radius of 50 m around each nestbox.

2.3. Image Data Acquisition and Processing

To characterize vegetation heterogeneity and phenology progression, SPOT 4 image acquisitions of the entire study site started on the on 2 February 2013, and ended on 17 June 2013 as part of the Take 5 experiment. Out of 28 SPOT 4 (Take 5) scenes originally scheduled, 14 acquisitions were excluded due to cloud cover. Fourteen images with a minimum time interval between each acquisition of 5 days, a maximum interval of 20 days and a mean and median of 10 days between acquisitions were used in all further analyses.
We used level 2A imagery with ortho-rectified surface reflectance data and cloud and snow mask [30]. Images were processed using UN FAO Open Foris Geospatial Toolkit [31] and Quantum GIS 2.8 [32]. The procedure included clipping the spatial extent and calculating the Normalized Difference Vegetation Index (NDVI, [14]) based on bands B2 (red: 0.61–0.68 μm) and B3 (near infrared: 0.78–0.89 μm). In addition to NDVI values derived from any given pixel at a given point in time, we also filtered all images using mean filters with a kernel of 5 pixels, which generated average NDVI values in a 5 by 5 pixel grid around any given nestbox. For any given date and nestbox, this procedure generated NDVI values resulting from square regions centered around each nestboxes that were either 20 or 100 m. wide. The former is thus equivalent to SPOT 4 (Take 5) original spatial resolution (20 m); the latter, thereafter called “50 m. filter NDVI”, is equivalent to ground data collection effort spanning a 50 m radius around each nestbox. Finally, for each nestbox, we also calculated seasonal amplitude of NDVI (“amplitude NDVI”), defined as the difference between averaged NDVI of the first three and last three of the considered dates. This captured seasonal variability in a single index, therefore eliminating the time dimension of the considered data.
Out of 227 nestboxes in the study site, 33 nestboxes were excluded from analyses due to their close proximity to the forest edge and the possible resulting influence on NDVI values. In addition, 11 nestboxes from the image dated 14 March were excluded due to their positioning in relation to cloud shadows. For each valid nestbox and date, we recorded the NDVI value of the 20 m wide pixel a nestbox was positioned in, as well as mean NDVI for a 100 × 100 m square surrounding each nestbox and corresponding to vegetation ground data sampling effort.
To infer the progression of NDVI in time, we focused on nestboxes surrounded by NDVI time series for nestboxes characterized by deciduous-only (n = 110, in black) and evergreen-only (n = 10, in grey) oak environments in a 50 m radius.

2.4. Statistical Analysis

All statistical analyses of the relationship between oaks and the NDVI index were performed on a dataset of 194 nestboxes, which were all at least 50 m from the forest edge. The dataset spans one season of phenological data (2013) and focuses on blue tit first clutches only. We used standard linear models (-lm function) in R [33] to regress oak composition (number of deciduous oaks, number of evergreen oaks) on NDVI, and oak composition on egg laying date. To infer the influence of oak composition on lay date, we restricted the nestbox dataset to select only those where a blue tit reproductive event occurred in 2013 (n = 53). For each valid image acquisition throughout the experiment (total n = 14), we tested the effect of NDVI on lay date. We further reran the analysis by selecting nestboxes surrounded by deciduous oaks only in a 50 m radius (n = 27).
To detect spatial autocorrelation in vegetation patterns and resulting pixel-based NDVI values, we used the function -sp.correlogram in R (spdep library) to derive Moran’s index I [34] and plotted it as a function of distance between observations using correlograms [35]. The minimum distance required to connect all nestboxes together, inputted as lag distance in the analysis, was 146 m. Moran’s index was thus calculated from 146 m to 1565 m (the maximum distance to connect all nestboxes) with increments of 146 m, and resulted in 11 distance classes. For more details about spatial autocorrelation analyses related to the life-history of La Rouvière blue tits, see also Marrot et al. [36]. We performed Moran’s I correlograms on (1) the proportion of deciduous oaks (nr of deciduous oaks/nr od deciduous and evergreen oaks) in a 50 m radius to each nestbox, and 50 m filter NDVI values around each nestbox from (2) the earliest SPOT 4 (Take 5) image (“winter image”, taken on7 February 2013) and (3) the latest image in the phenological season (“summer image”, taken on 17 June 2013).

3. Results

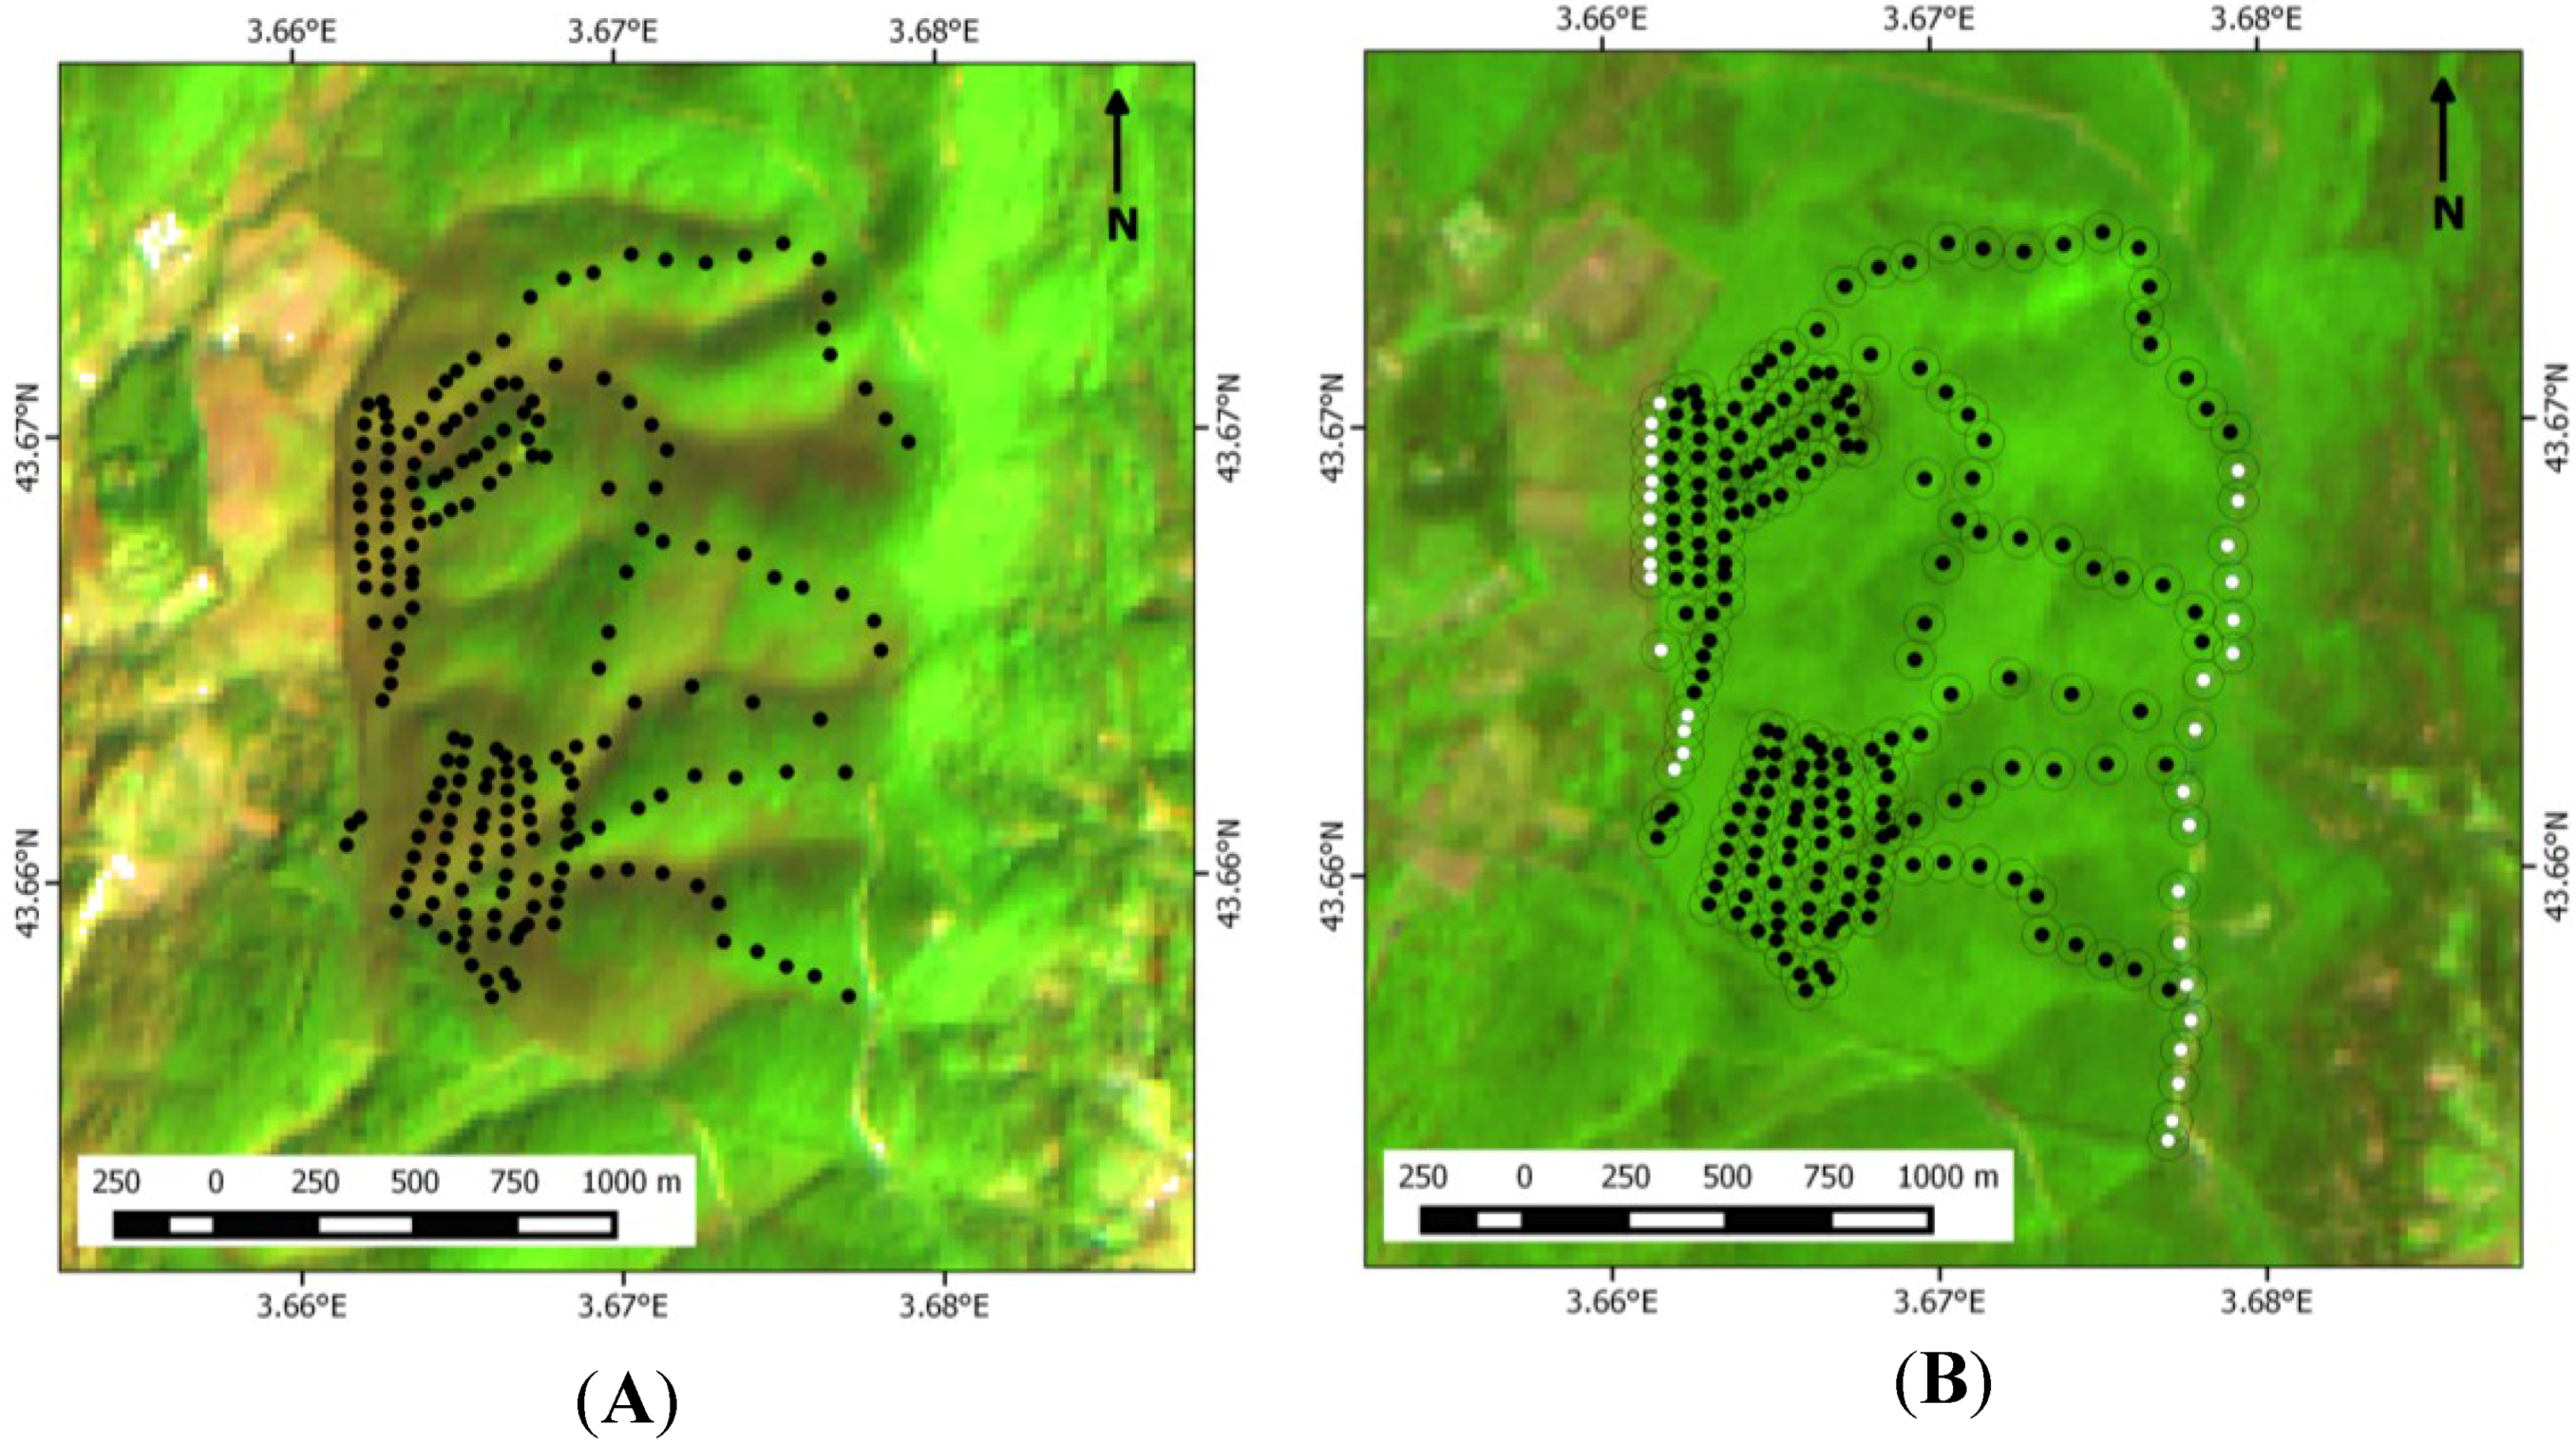
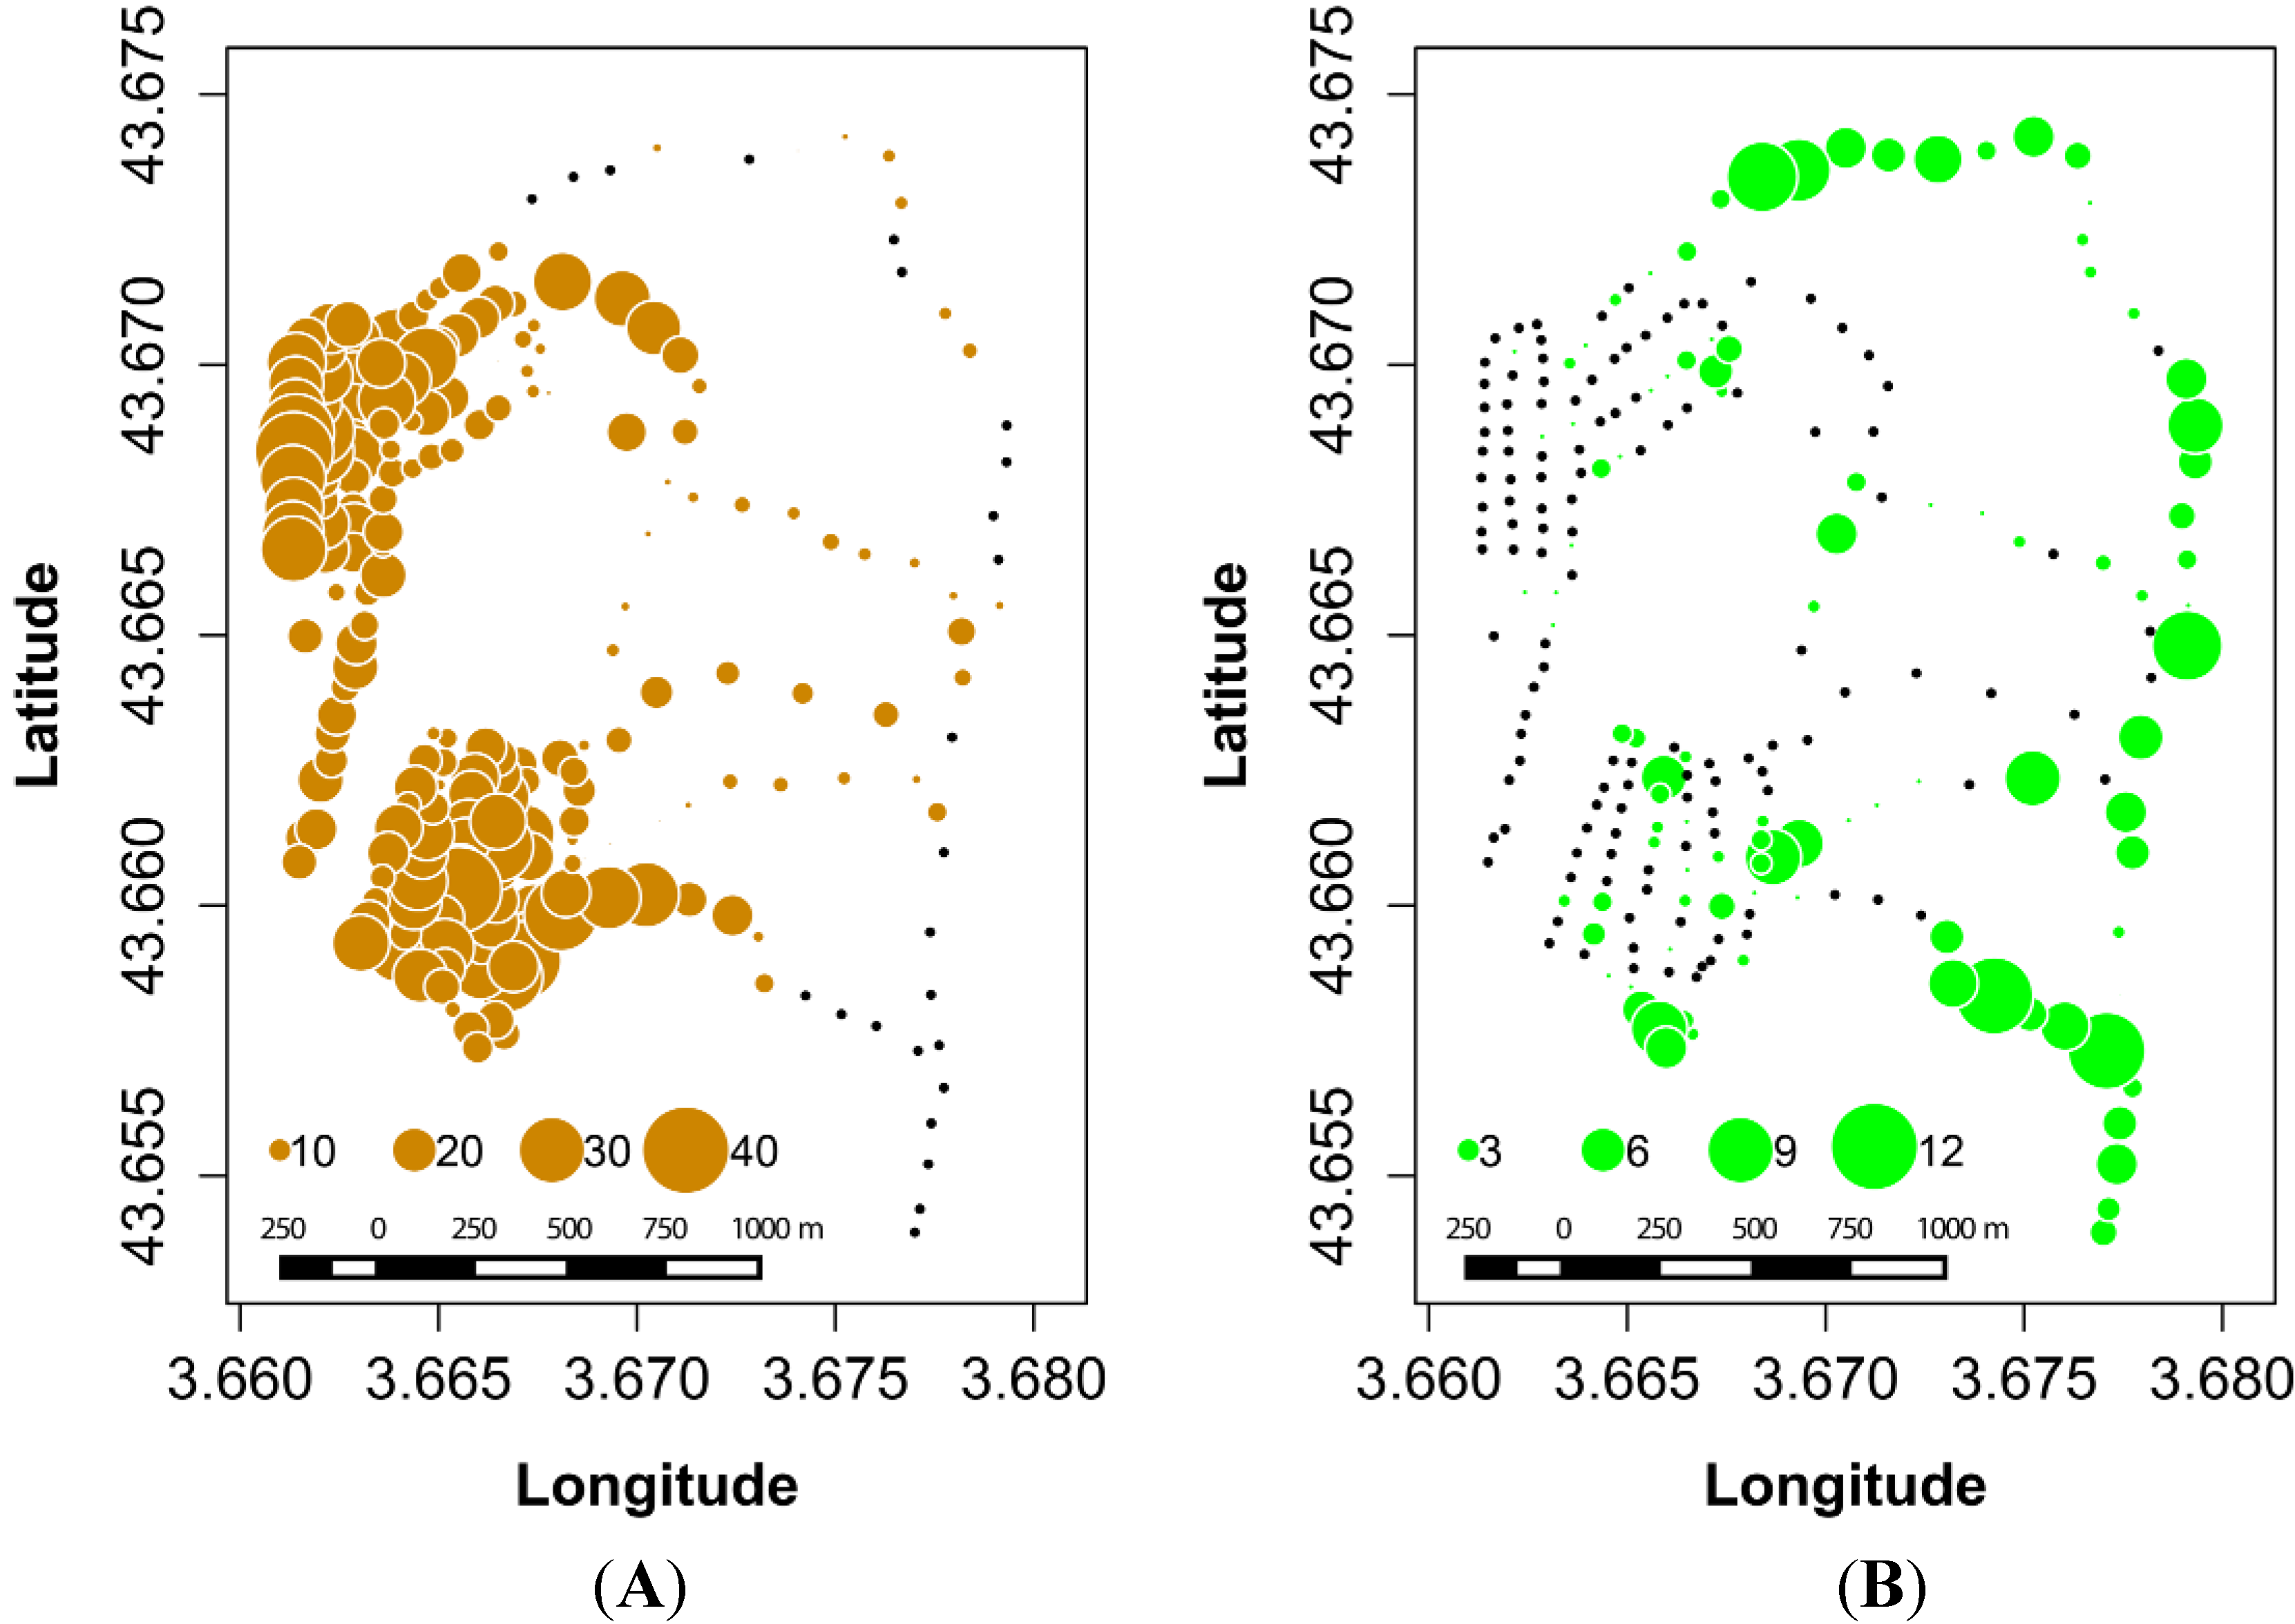
3.1. Ground Data on Oak Distribution across the Study Site

For every blue tit nestbox in the La Rouvière study site, the number of deciduous (Quercus pubescens) and evergreen (Quercus ilex) oaks in a 50 m radius was recorded. Their distribution was unequal in terms of density and distribution across the study site (Figure 1). All 227 nestboxes were surrounded by an average of 15.1 deciduous (SD = 9.8) oaks and 1.5 (SD = 2.4) evergreen oaks. When restricting the dataset to nestboxes that were more than 50 m from the forest edge (n = 194), there were on average 15.4 (91.7%) deciduous oaks (SD = 9.0) and 1.4 (8.3%) evergreen oaks (SD = 2.3) recorded around each nestbox.

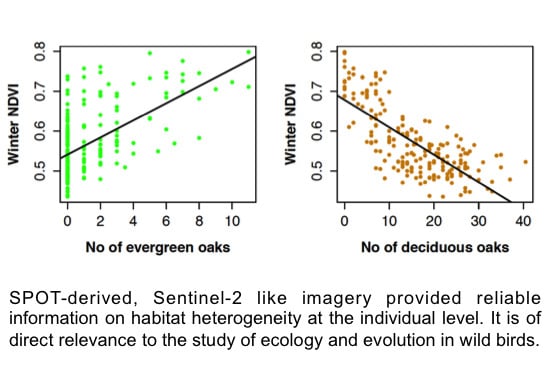
3.2. SPOT 4 (Take 5) Imagery as an Index of Vegetation Type is Accurately Validated with Ground Data from the Study Site

Patches of deciduous and evergreen oaks were clearly visible in a winter SPOT 4 (Take 5) image of the La Rouvière woodland (Figure 2A). In the summer, differences in vegetation were more limited to the naked eye (Figure 2B). Out of 227 nestboxes in the study site, 33 nestboxes were excluded from further analyses due to their close proximity to the forest edge (Figure 2B, in white).
Figure 1. Number of deciduous (A) and evergreen (B) oaks in a 50 m radius around each nestbox in the study site. Nestboxes with no oaks in a 50 m radius are in black. Colored dot size is proportional to the number of oaks around each nestbox.
Remotesensing 07 13319 g001
Figure 2. (A) Winter image (7 February 2013) of the La Rouviere study site with all 227 nestboxes indicated as black dots; and (B) summer image (17 June 2013) of the same study site shows nestboxes with a 50 m radius drawn around them, which corresponds to ground oak census for each nestbox. Nestboxes represented in white (n = 33) were discarded from further analyses due to their proximity to habitat edge.
Remotesensing 07 13319 g002
NDVI patterns measured in a 50 m radius for deciduous and evergreen oaks (Figure 3) matched vegetation differences observed in visible color bands (Figure 2): during winter time, a greater number of evergreen oaks generated increasingly high NDVI values, while the opposite was true for deciduous oaks with no photosynthetic activity during that season (Table 1). In the summer, both evergreen and deciduous oaks generated higher values of NDVI than in the winter (Figure 3). However, there was an overall negative relationship between the number of evergreen oaks in a 50 m radius to a nestbox and summer NDVI (Figure 3c), while the opposite was true for deciduous oaks (Figure 3c,d and Table 2): a greater number of oaks around a nestbox generated higher values of NDVI.
Table 1. Effect of the number of deciduous oaks (DeO), evergreen Oaks (EvO) and DeO + EvO on pixel-based winter NDVI in a 10 m and a 50 m radius around the nestbox (image acquisition: 7 February 2013).
NDVI Radius ModelDeciduous Oaks (DeO)Evergreen Oaks (EvO)DeO + EvO
10 mEstimate−0.007330.0243DeO: −0.00557, EvO: 0.01318
SE0.000520.00228DeO: 0.00056, EvO: 0.00216
T value−14.0710.69DeO: −9.985, EvO: 6.105
p-value<2 × 10⁻¹⁶<2 × 10⁻¹⁶DeO: <2 × 10⁻¹⁶; EvO: 5.63 × 10⁻⁹
% var. explained51%37%58%
50 mEstimate−0.006880.02148DeO: −0.00548, EvO: 0.01052
SE0.000460.00210DeO: 0.00050, EvO: 0.00192
T value−15.1410.24DeO: −11.079, EvO: 5.489
p-value2 × 10−162 × 10−16DeO: 2 × 10⁻¹⁶, EvO: 1.27 × 10⁻⁷
% var. explained54%35%60%
Table 2. Effect of the number of deciduous oaks (DeO), evergreen Oaks (EvO) and DeO + EvO on pixel-based summer NDVI in a 10 m and 50 m radius around the nestbox (image acquisition: 17 June 2013).
NDVI RadiusModelDeciduous Oaks (DeO)Evergreen Oaks (EvO)DeO + EvO
10 mEstimate0.00124−0.00361DeO: 0.00103, EvO: −0.00154
SE0.000160.00065DeO: 0.00018, EvO: 0.00070
T value7.958−5.594DeO: 5.743, EvO: −2.207
p-value1.48 × 10−137.55 × 10⁻⁸DeO: 3.62 × 10⁻⁸, EvO: 0.0285
% var. explained24%14%26%
50 mEstimate0.00103−0.00333DeO: 0.00080, EvO: −0.00174
SE0.000130.00051DeO: 0.0001431, EvO: 0.0005540
T value8.215−6.531DeO: 5.575, EvO: −3.134
p-value3.07 × 10−145.71 × 10⁻¹⁰DeO: 8.34 × 10⁻⁸, EvO: 0.00199
% var. explained26%18%29%
Figure 3. Regression of the number of evergreen and deciduous oaks on winter (a,b) and summer (c,d) NDVI values measured in a 50 m radius around each nestbox (n = 194). Percentage of variance explained in each model: (a) 35%, (b) 54%, (c) 18%, and (d) 26% (more details in Table 1, Table 2 and Table 3).
Remotesensing 07 13319 g003
There was thus strong co-variation between vegetation quantified on the ground (deciduous and evergreen oaks) and winter NDVI (Table 1), summer NDVI (Table 2) and amplitude NDVI (Table 3): the number of deciduous and evergreen oaks explained up to 60% of variance in winter NDVI values (Table 1, Figure 3), 29% of variance in summer NDVI values (Table 2, Figure 3), and up to 66% of variance in amplitude NDVI values (Table 3).
Table 3. Effect of the number of deciduous oaks (DeO), evergreen Oaks (EvO) and DeO + EvO on pixel-based NDVI in a 50 m radius around the nestbox using NDVI amplitude data (average of three latest NDVI values—three earliest NDVI values).
NDVI RadiusModelDeciduous Oaks (DeO)Evergreen Oaks (EvO)DeO + EvO
50 mEstimate0.00876−0.02709DeO: 0.00702, EvO: −0.01305
SE0.000520.00248DeO: 0.00055, EvO: 0.00213
T value17.02−10.94DeO: 12.74, EvO: −6.12
p-value<2 × 10⁻¹⁶<2 × 10⁻¹⁶DeO: < 2 × 10⁻¹⁶, EvO: 5.19 × 10⁻⁹
% var. explained60%38%66%
In three out of four tests (Table 1 and Table 2), ground data inferred in a 50 m radius around each nestbox explained a greater amount of variance in NDVI captured over a 50 m radius around each nestbox than in NDVI derived from any specific pixel (10 m) a nestbox was attributed to, thereby confirming the validity of using 50 m NDVI filters when comparing ground data collected within the same radius.

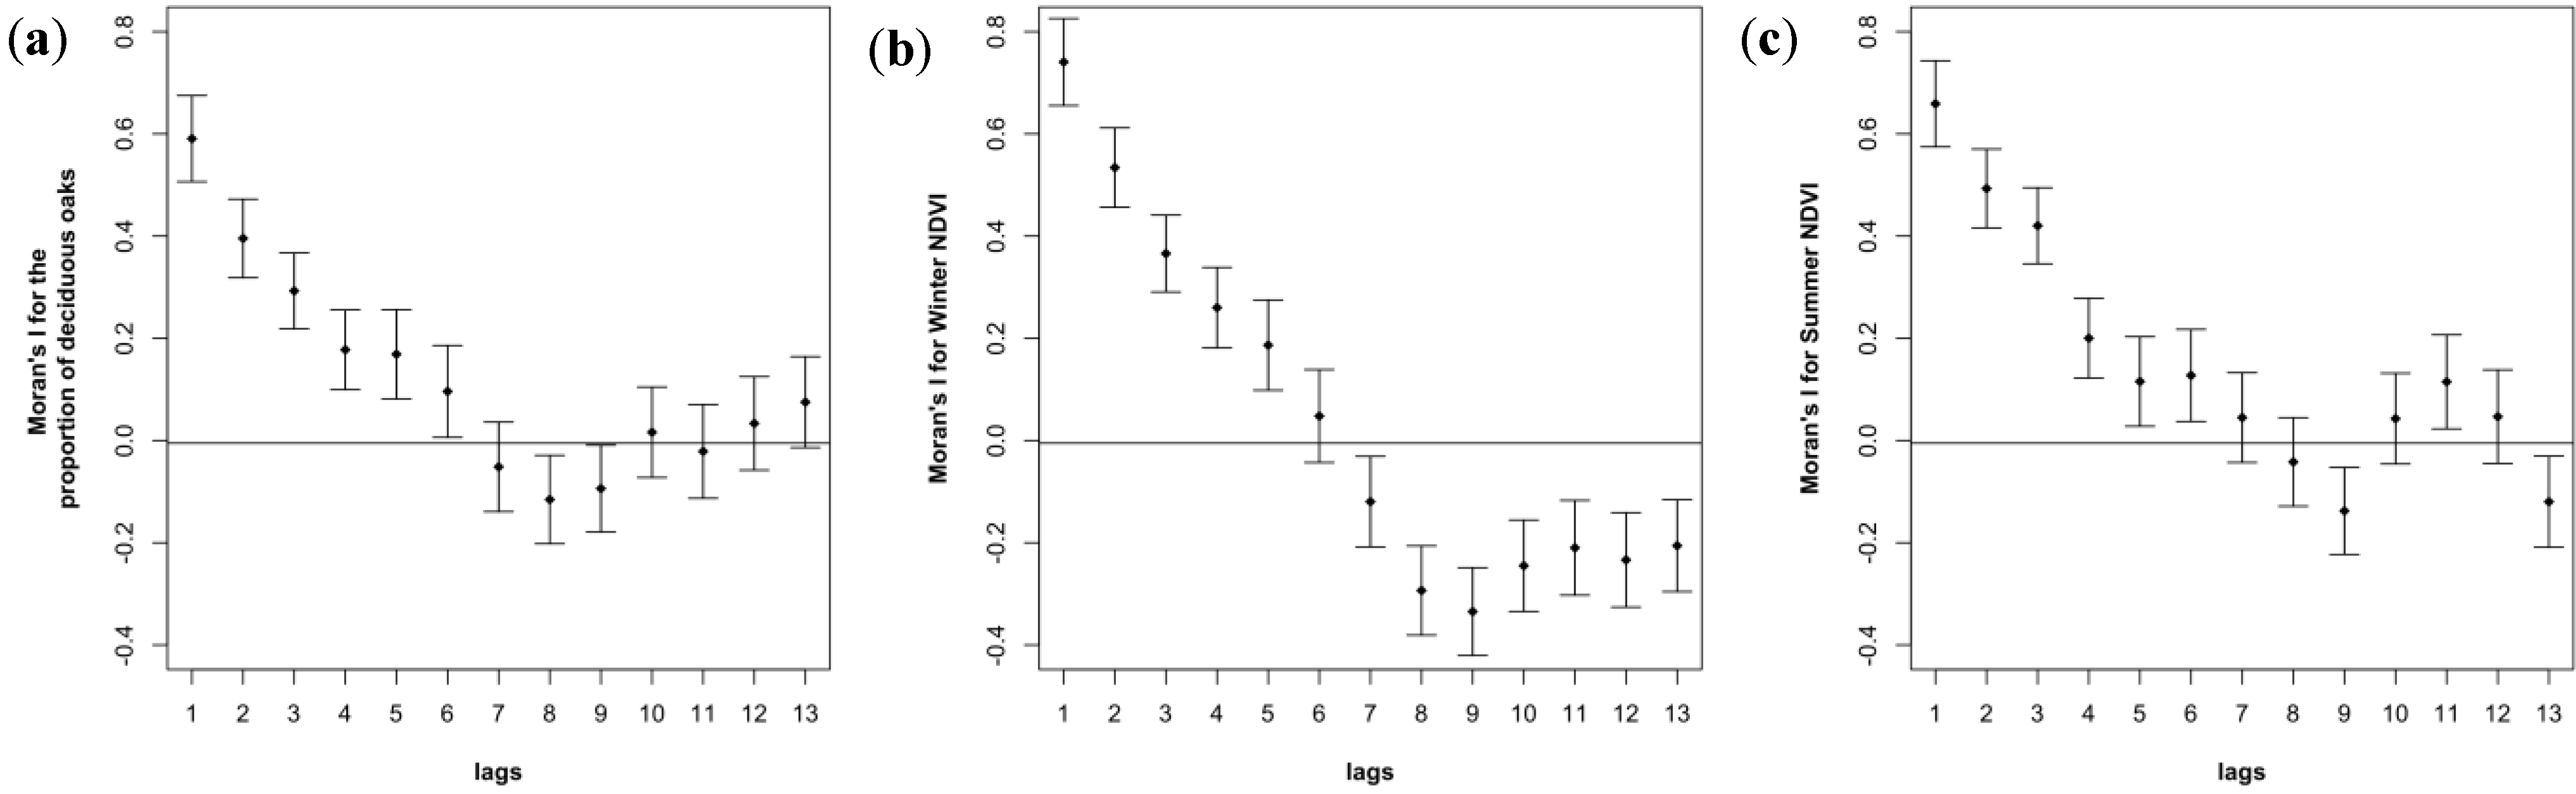
3.3. Spatial Autocorrelation in Oak Composition is Visible in Ground-Based and NDVI-Based Correlograms

There were equivalent patterns of spatial autocorrelation in terms of the proportion of deciduous oaks (Figure 4a), as well as winter and summer NDVI value in a 50 m radius to the nestbox (Figure 4b,c): in all three cases, we observed significant positive spatial autocorrelation in the smaller distance classes. This was followed by significant negative spatial autocorrelation for the larger distant spatial classes for winter NDVI (Figure 4b), and significantly negative or non-significant spatial autocorrelation in larger spatial classes for the proportion of deciduous oaks (Figure 4a) and summer NDVI (Figure 4c).
Figure 4. Spatial autocorrelation (Moran’s I estimate and its 95% confidence interval) measured in a 50 m radius to the nestbox across 13 distance classes (lags) of 158 m, in terms of (a) the proportion of deciduous vs. evergreen oaks; (b) winter NDVI; and (c) summer NDVI.
Remotesensing 07 13319 g004
The correlation coefficient for Moran’s I estimates was high, and reached the values of r = 0.92 and r = 0.85 when correlograms of the proportion of deciduous oaks were compared against correlograms of winter and summer NDVI, respectively.

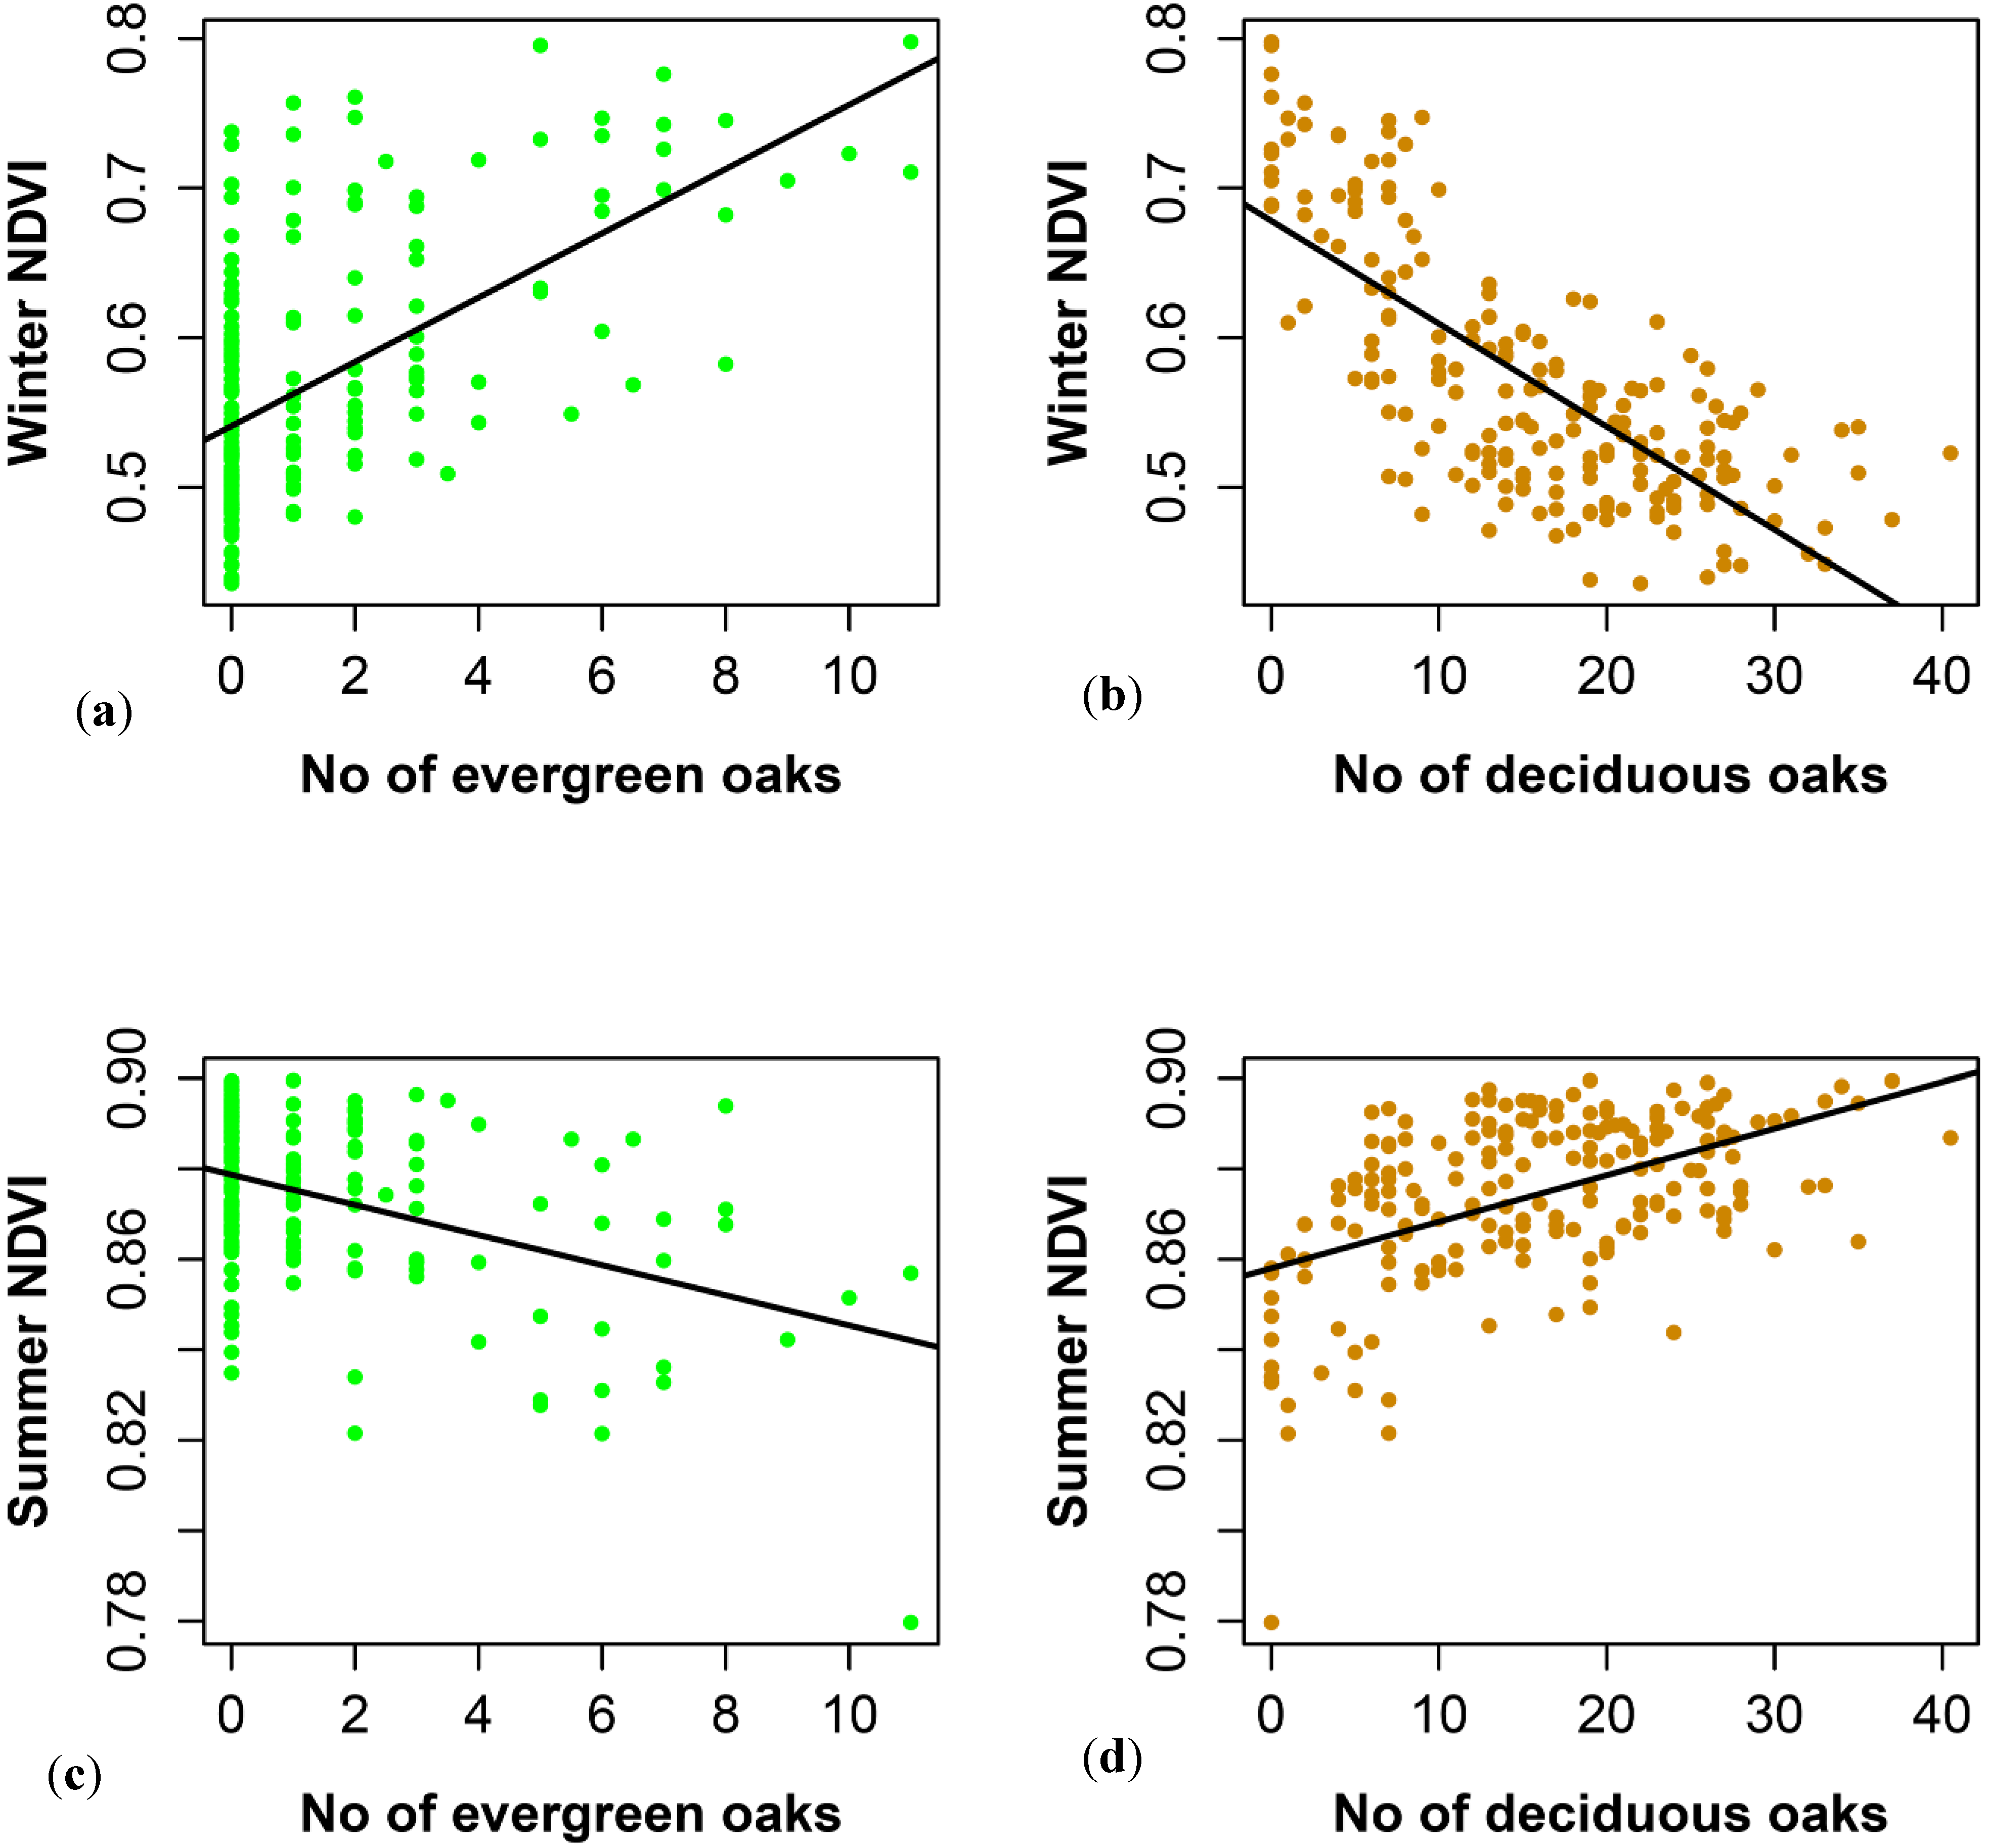
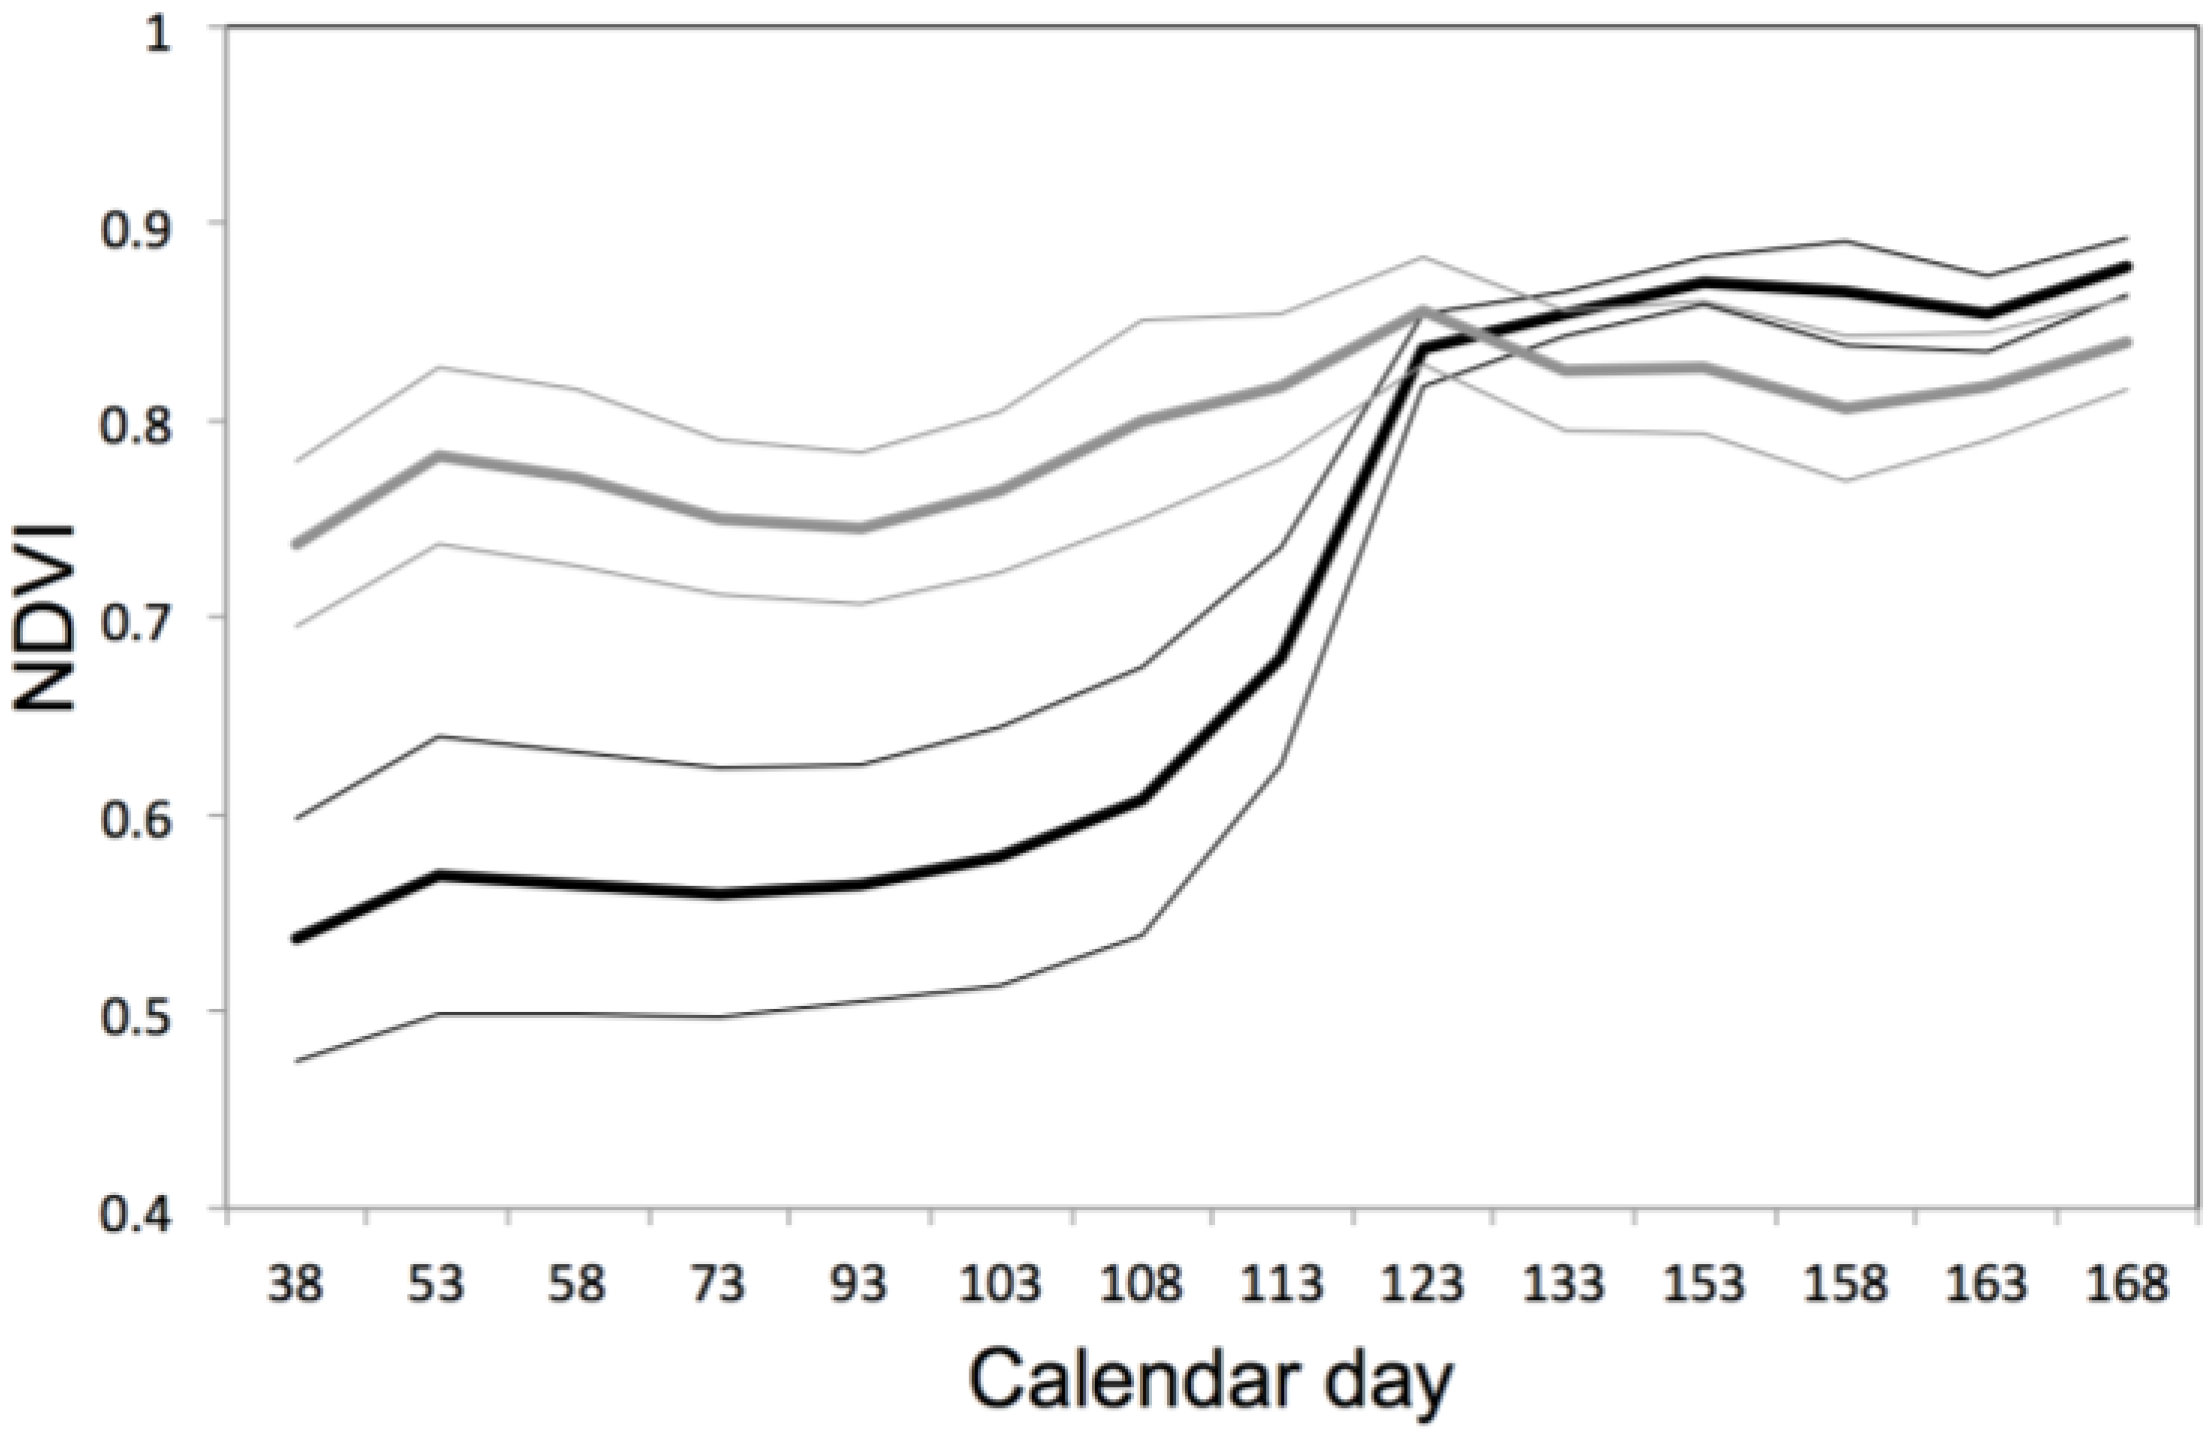
3.4. Contrasted Signatures of NDVI for Deciduous and Evergreen Oaks in a Temporal Time Series

The NDVI signal recorded for nestboxes set within a 50 m radius of deciduous-only or evergreen-only area (n = 110 and n = 10, respectively; Figure 5) reveals distinct NDVI temporal signatures for each species: deciduous oak NDVI remained constant for the first seven points in time, but increased drastically in image acquisitions 113 and 123 (23 April 2013 and 3 May 2013, respectively) and reached a plateau from day 133 (13 May 2013) onwards. In contrast, evergreen oak NDVI is characterized by a weak but steady increase of NDVI in time. Overall, the last three NDVI measures were higher by 58% and 8% for deciduous and evergreen oaks relative to the first three NDVI measures.
Figure 5. NDVI time series for nestboxes characterized by deciduous-only (n = 110, in black) and evergreen-only (n = 10, in grey) oak environments in a 50 m radius. Averages and standard deviations are presented as thick and thin lines, respectively.
Remotesensing 07 13319 g005

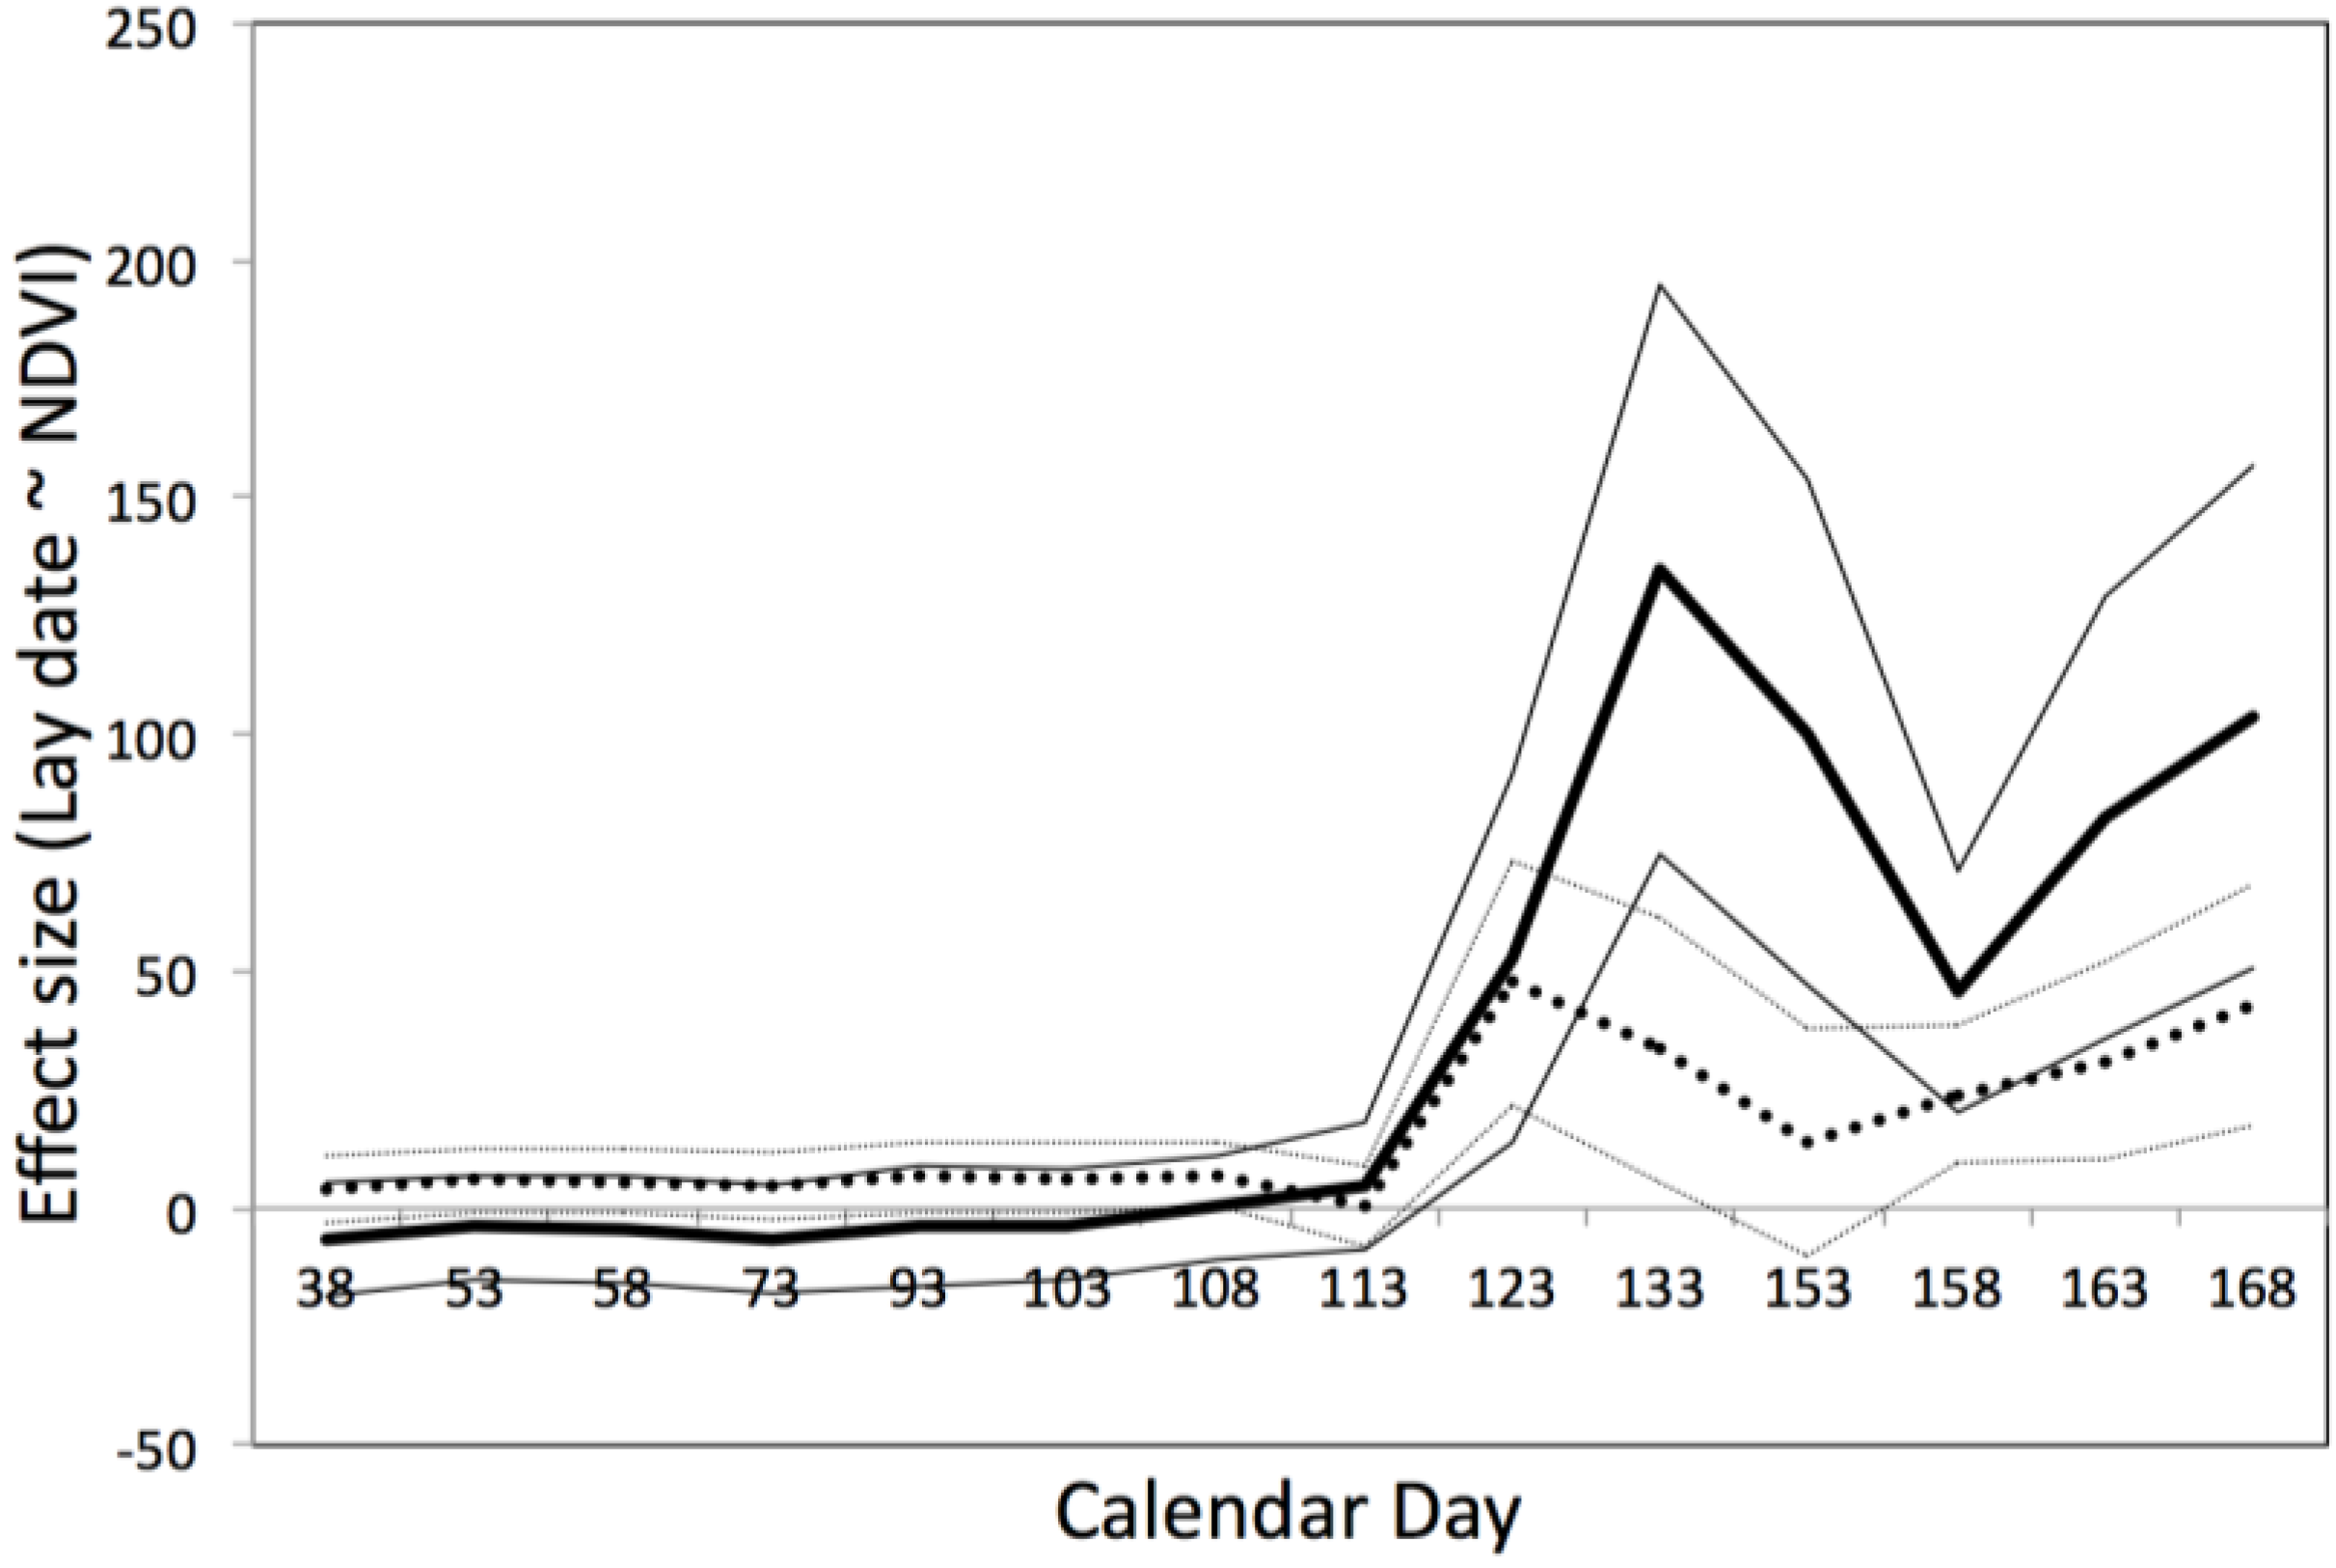
3.5. Predicting the Timing of Blue Tit Reproduction

Although blue tits breed earlier in deciduous oak habitats than in evergreen oak habitats at an inter-population scale [4], we tested whether the same pattern exists at a within-site level.
There was no effect of the number of deciduous oaks on blue tit egg laying date in 2013 (regression coefficient: −0.062, SE: 0.062, p = 0.323, n = 53). However, a greater number of evergreen oaks was significantly associated with later breeding dates in the study site (regression coefficient: 0.409, SE: 0.187, p = 0.035, n = 53). Similarly, a smaller proportion of deciduous oaks in a 50 m radius around the nestbox (and a resulting greater proportion of evergreen oaks) was associated with later breeding dates, although the result was borderline non-significant (regression coefficient: −0.031, SE: 0.018, p = 0.09).
We further tested whether NDVI measured in a 50 m radius to each occupied nestbox predicts blue tit egg-laying date at any available point in time. When all occupied nestboxes were included (n = 53, average proportion of deciduous oaks: 80%), the effect of NDVI measured in winter time—reflecting evergreen vegetation activity—on blue tit egg laying date was positive and non-significant. The effect of NDVI remained positive and non-significant throughout the season. When restricting the dataset to nestboxes surrounded solely by deciduous oaks (n = 27), we recorded a non-significant (all p > 0.05) yet consistently negative trend of earlier lay date associated with higher NDVI in each of the first eight images taken in winter and early spring (Figure 6), suggesting earlier lay date in deciduous habitat where photosynthetic activity in winter time (as visualized by NDVI) is occurring. The effect of NDVI on lay date changed from negative to positive although not significantly so (but in one case on the deciduous subset; day 133–13 May 2013, p = 0.03). This occurred at the same time when the rate of change in NDVI values of deciduous oaks reached its maximum from day 113 onwards (Figure 5).
Figure 6. Regression coefficients (±SE) of the effect of NDVI on blue tit timing of reproduction (lay date) in 2013 (n = 14 images, corresponding to 14 NDVI analyses). The effect of NDVI on lay date for all nestboxes where a reproductive event occurred in that year (n = 53) is presented as a dashed thick black line (regression coefficient) and thin grey lines (standard errors). The effect of NDVI on lay date in nestboxes solely surrounded by deciduous oaks in a 50 m radius (n = 27) is presented as a thick black line (regression coefficient) and thin black lines (standard errors).
Remotesensing 07 13319 g006

4. Discussion

Imagery extracted from the SPOT 4 (Take 5) satellite sensor, programmed for image acquisition every five days at 20 m resolution, provided highly reliable, ground-validated information on habitat heterogeneity of direct relevance to a long-term field study of the blue tit (Cyanistes caeruleus). Given that the gathering of ground data is often an important barrier in our understanding of variation in animal phenology in time and space, harnessing the potential offered by satellite imagery is of prime importance as it may reveal unprecedented detail into the interaction between vegetation dynamics and animal variation in phenology and other reproductive traits.

4.1. Winter NDVI Successfully Captured Oak Composition

Oak information collected on the ground was well captured by high-resolution imagery delivered by SPOT 4 (Take 5), as winter NDVI values explained 60% of variance in the number of deciduous and evergreen oaks around each nestbox in a 50 m radius. Moreover, the fact that “amplitude NDVI”, explicitly related to the change in NDVI between winter and summer NDVI values captured up to 66% of variation in such a key resource for breeding blue tits is particularly promising.
High correlations between ground collected oak information and winter NDVI values validated the prediction that vegetation heterogeneity visible on SPOT 4 imagery (Figure 2a) is indeed largely driven by patches of evergreen and deciduous oaks interspersed across the study site. Interestingly, areas with no evergreen oaks display a large variation in NDVI values (Figure 3a), revealing that the NDVI in winter can be influenced by the presence/absence of other tree species such as the evergreen Strawberry tree Arbutus unedo, as well as evergreen understory (grass and shrubs). Although evergreen oaks Q. ilex are typical of Mediterranean habitats, such heterogeneous patterns of winter NDVI signal is also likely to occur in any mixed woodland in temperate Europe, where deciduous, oak populated woodlands are interspersed with evergreen vegetation. A valuable contribution for future research in the field would be to validate whether high-resolution imagery (such as 10–20 m Sentinel 2 or 30 m Landsat data) of mixed deciduous plots in other temperate zones is equally successful in validating the potential of satellite imagery to field sites of relevance for animal ecology research.

4.2. Performance of Summer and Winter NDVI Values to Detect Environmental Heterogeneity

Summer images were not as informative as winter satellite imagery in characterizing fine-scale environmental heterogeneity. While the inspection of canopy imagery (Figure 2a) appears quite uniform to the naked eye, the effect of the type of oaks and its abundance in a 50 m radius to each nestbox on summer NDVI values was nevertheless highly significant, and captured around half of the variance relative to winter NDVI analyses (Table 1 and Table 2). This is at least in part due to saturation of NDVI signal in time: tree-derived NDVI generate much higher values than grass or shrubs, and usually saturate at a value of 0.9 in the summer season ([14], Figure 3d), thereby decreasing summer NDVI variance and contributing to a reduction in strength of statistical associations for the same explanatory variables. It is worth noting, however, that spatial autocorrelation patterns were largely similar independently of whether the proportion of deciduous oaks, winter NDVI values or summer NDVI values were analyzed (Figure 4). These patterns revealed significant positive spatial autocorrelation for the first 5–6 distance classes and largely negative or non-significant spatial autocorrelation for the remaining (larger) distance classes. These analyses suggest that although summer NDVI has more limited explanatory power than winter NDVI imagery in explaining oak composition due to NDVI saturation in the summer, summer NDVI imagery can still successfully identify vegetation similarity in neighboring localities.

4.3. From Points in Space to Open-Ended Gradients: A Question of Scale

In comparison to ground data which requires significant field effort and is limited to only a few point in time and space estimates, satellite imagery opens up immeasurably larger possibilities regarding the spatial scale at which a biological phenomena is to be explored [37]. A first step in our exploration of the potential for remote sensing in addressing environmental heterogeneity that is relevant to individual-based animal studies was to compare pixel-based and 50 m based estimates of vegetation reflectance.
The rationale for a 50 m value to be selected when collecting data on the ground lies in the biology of the species studied: indeed, although foraging distance when provisioning offspring with caterpillars is to some extent habitat related (for example, blue tit foraging distance in evergreen habitat was twice as long as in deciduous habitat; [38]), two independent radio-tracking studies show that the large majority of blue tit foraging movements when feeding offspring at the nest occurs within 50 m of the nestbox [38,39]. Thus, information on the availability of a key resource required at the time of blue tit reproduction—oak-reliant caterpillars—are accurately captured by the quantification of oaks in a 50 m radius to each nestbox. A square grid of 100 m wide, largely reflecting a radius around each nestbox was therefore tested to maintain consistent methodology (and allow validation) with data collected on the ground.
Out of six models inferring the explanatory power of oaks in NDVI imagery, five models showed higher congruence between 50 m filters and ground oak data collected in a 50 m radius than between pixel-based NDVI and ground oak data (Table 1, Table 2 and Table 3). By validating the assumption that there is consistent covariation between data collected on the ground and recorded from space at the same spatial scale, we now have the possibility to move beyond data available from the ground and use filters centered around each nestbox of a radius that is relevant to any particular ecological process of interest. The question of scale has been recently emphasized by Hinks et al. [23], who demonstrated that while spatial scales at which association between oak phenology and great tit Parus major breeding occurs is often limited to a 50 m radius around the nestbox, this value varies depending on life-history stage. For example, the scale of oak and tit associations differ when laying dates vs. hatching dates are compared, as well as depending on the type of biological information included in the models. NDVI filters of varying size and centered around key points of biological interest (such as breeding nestboxes) are thus a particularly promising avenue for future research that can complement ground data information, or even act as an alternative mean to infer what spatial scale is most relevant to a biological process when ground data on environmental variation is not available. At a larger spatial scale, Marshal et al. [40] took a similar approach to the 50 m filter presented in this study by using MODIS-derived NDVI to infer foraging behavior of African elephants at three spatial scales relevant to the biology of the species (total home range, seasonal home range and 16-day home range). The authors found that the importance of vegetation greenness varied with the scale of analyses, and was likely to reflect hierarchical processes involved in habitat selection by elephants. By using finer-scale imagery such as in this study, such approaches have the potential to be applied to a large variety of organisms with a much smaller home range than that observed in large mammals.

4.4. Matching Oak and Blue Tit Phenology

While the temporal NDVI time series revealed that deciduous oaks followed the expected phenological trajectory for a deciduous tree, the phenological profile of evergreen oaks was less clear-cut (Figure 5). A greater number of replicate time series and/or longer time span of satellite imagery availability could facilitate the fitting of start and end of season statistics, and in particular establish reliable start of season estimators for evergreen oaks.
In this study, blue tit timing of reproduction was influenced by the number of evergreen oaks in a 50 m radius to a nestbox, but not by the number of deciduous oaks or by any of the NDVI values derived from the temporal series of image acquisition. This finding is consistent with the general observation that blue tits reproduce later in evergreen-rich areas of the woods (unpublished data). However, such analysis was only performed on one year of data (2013), while the detection of phenological matching between oak and bird timing of reproduction usually requires the use of long-term datasets [22,23]. Future analyses of the synchrony between animal and vegetation phenology would therefore benefit from multi-year or multi-site approaches, but also from deriving start of season statistics that are robust to both evergreen and deciduous oak phenology dynamics (see for example [22] where generalized additive models are used to infer the greatest rate of change in green-up).
Confirming an absence or presence of phenological matching between oak and blue tit phenology in the study site—whether measured on the ground or monitored with remote sensors—will necessitate the analysis of the study’s multi-year dataset, which could be matched with long-term datasets of satellite imagery from satellite sensors such as Landsat or MODIS.
An interesting point worth noting is that when we restricted nestboxes to select only those that were surrounded solely by deciduous oaks (Figure 5), the first eight images, corresponding to a time of oak dormancy (Figure 5), revealed a non-significant yet consistent negative association between blue tit egg laying date and NDVI values (Figure 6). Although this link would need to be investigated in greater detail using a larger dataset of reproductive event, it is a puzzling finding suggesting that for blue tits reproducing in deciduous-only nestboxes, early-reproducing birds are more often found in nestboxes surrounded by higher values of NDVI. This NDVI signal of vegetation reflectance is presumably introduced by specific grass or shrub assemblages since at this point in time deciduous oaks are not yet photosynthetically active. This finding appears to mirror a result reported by Cole et al. [22], who analyzed MODIS-derived maximum green-up dates associated with blue tit and great tit egg laying dates in a mixed deciduous woodland in the UK. The authors found that maximum green-up was in fact occurring well before canopy species such as oaks would come into full leaf, suggesting that an important proportion of the green-up signal associated with avian timing of reproduction may be caused by understory vegetation.

5. Conclusions

We established that up to 66% of variance in winter NDVI values is explained by oak number and oak type as recorded on the ground in a long-term field study of wild blue tits from Southern France. High spatial resolution imagery can therefore significantly contribute to the quantification of environmental heterogeneity, even when ground data availability is limited. By offering high temporal and spatial resolution information over large spatial scales, satellite imagery can bring unprecedented insight for evolutionary ecology studies where information on environmental heterogeneity is key, yet was traditionally restricted to point in space and point in time estimates. Importantly, NDVI values can be extracted for any required radius around a point of interest (a nestbox in this case), while ground estimates are limited by fieldwork protocol at the time of sampling.
Past imagery archives of satellite sensors (such as AVHRR, Landsat, MODIS) are undervalued in individual-based, evolutionary ecology studies (but see [22]), despite offering a wealth of records across a large number of years. At the same time, the launch of Sentinel 2 in 2015 (with equivalent parameters as those used in this study: 10–20 m resolution on a five day cycle) is likely to offer unprecedented insight into the spatial and temporal heterogeneity of environments. Harnessing the potential of both past and future satellite records to characterize environmental variation in space and time is thus likely to be a promising research avenue to individual-based evolutionary ecology studies.

Acknowledgments

We thank CNES & Irstea TETIS, the OSU-OREME, and Olivier Hagolle and Sylvia Sylvander for organizing the SPOT 4 (Take 5) users meeting. We thank all field workers from La Rouvière for collecting blue tit data. We thank Silvia Valero for discussions on the manuscript. M.S. was funded by an IEF Marie Curie Fellowship, A.C. was funded by an ERC Starting Grant (ERC-2013-StG-337365-SHE), and P.Z. by a Sonata BIS grant from the Polish National Science Centre.

Author Contributions

M.S. and P.Z. conceived and designed the experiments. A.C. and M.S. coordinated the image acquisition procedure for the study site. P.M. carried out oak fieldwork. M.S., P.Z. and P.M. analyzed the data. M.S. wrote the paper with feedback from A.C., P.M. and P.Z.

Conflicts of Interest

The authors declare no conflict of interest.

References

  1. Stearns, S.C. The Evolution of Life Histories; Oxford University Press: Oxford, UK, 1992. [Google Scholar]
  2. Parmesan, C. Influences of species, latitudes and methodologies on estimates of phenological response to global warming. Glob. Chang. Biol. 2007, 13, 1860–1872. [Google Scholar] [CrossRef]
  3. Both, C.; van Asch, M.; Bijlsma, R.G.; van den Burg, A.B.; Visser, M.E. Climate change and unequal phenological changes across four trophic levels: Constraints or adaptations? J. Anim. Ecol. 2009, 78, 73–83. [Google Scholar] [CrossRef] [PubMed]
  4. Charmantier, A.; Doutrelant, C.; Dubuc-Messier, G.; Fargevieille, A.; Szulkin, M. Mediterranean blue tits as a case study of local adaptation. Evol. Appl. 2015, in press. [Google Scholar] [CrossRef]
  5. Blondel, J.; Thomas, D.W.; Charmantier, A.; Perret, P.; Bourgault, P.; Lambrechts, M.M. A thirty-year study of phenotypic and genetic variation of blue tits in mediterranean habitat mosaics. Bioscience 2006, 56, 661–673. [Google Scholar] [CrossRef]
  6. Blondel, J.; Dias, P.C.; Ferret, P.; Maistre, M.; Lambrechts, M.M. Selection-based biodiversity at a small spatial scale in a low-dispersing insular bird. Science 1999, 285, 1399–1402. [Google Scholar] [CrossRef] [PubMed]
  7. Charmantier, A.; Gienapp, P. Climate change and timing of avian breeding and migration: Evolutionary versus plastic changes. Evol. Appl. 2014, 7, 15–28. [Google Scholar] [CrossRef] [PubMed]
  8. Both, C.; Bouwhuis, S.; Lessells, C.M.; Visser, M.E. Climate change and population declines in a long-distance migratory bird. Nature 2006, 441, 81–83. [Google Scholar] [CrossRef] [PubMed]
  9. Van Asch, M.; Visser, M.E. Phenology of forest caterpillars and their host trees: The importance of synchrony. Annu. Rev. Entomol. 2007, 52, 37–55. [Google Scholar] [CrossRef] [PubMed]
  10. Reed, T.E.; Grotan, V.; Jenouvrier, S.; Saether, B.-E.; Visser, M.E. Population growth in a wild bird is buffered against phenological mismatch. Science 2013, 340, 488–491. [Google Scholar] [CrossRef] [PubMed]
  11. Charmantier, A.; McCleery, R.H.; Cole, L.R.; Perrins, C.; Kruuk, L.E.B.; Sheldon, B.C. Adaptive phenotypic plasticity in response to climate change in a wild bird population. Science 2008, 320, 800–803. [Google Scholar] [CrossRef] [PubMed]
  12. Visser, M.E.; van Noordwijk, A.J.; Tinbergen, J.M.; Lessells, C.M. Warmer springs lead to mistimed reproduction in great tits (Parus major). Proc. R. Soc. B 1998, 265, 1867–1870. [Google Scholar] [CrossRef]
  13. Bourgault, P.; Thomas, D.; Perret, P.; Blondel, J. Spring vegetation phenology is a robust predictor of breeding date across broad landscapes: A multi-site approach using the corsican blue tit (Cyanistes caeruleus). Oecologia 2010, 162, 885–892. [Google Scholar] [CrossRef] [PubMed]
  14. Pettorelli, N.; Vik, J.O.; Mysterud, A.; Gaillard, J.M.; Tucker, C.J.; Stenseth, N.C. Using the satellite-derived ndvi to assess ecological responses to environmental change. Trends Ecol. Evol. 2005, 20, 503–510. [Google Scholar] [CrossRef] [PubMed]
  15. Verhulst, S.; Tinbergen, J.M. Experimental evidence for a causal relationship between timing and success of reproduction in the great tit Parus major. J. Anim. Ecol. 1991, 60, 269–282. [Google Scholar] [CrossRef]
  16. Blondel, J.; Dias, P.C.; Maistre, M.; Perret, P. Habitat heterogeneity and life-history variation of mediterranean blue tits (Parus caeruleus). Auk 1993, 110, 511–520. [Google Scholar] [CrossRef]
  17. Banbura, J.; Blondel, J.; Dewildelambrechts, H.; Galan, M.J.; Maistre, M. Nestling diet variation in an insular mediterranean population of blue tits Parus caeruleus—Effects of years, territories and invididuals. Oecologia 1994, 100, 413–420. [Google Scholar] [CrossRef]
  18. Zandt, H.; Strijkstra, A.; Blondel, J.; van Balen, H. Food in two mediterranean blue tit populations: Do differences in caterpillar availability explain differences in timing of the breeding season? In Population Biology of Passerine Birds; Blondel, J., Gosler, A., Lebreton, J.D., Mccleery, R., Eds.; Springer-Verlag: Berlin/Heidelberg, Germany, 1990; pp. 145–155. [Google Scholar]
  19. Van Balen, J.H. A comparative study of the breeding ecology of the great tit Parus-major in different habitats. Ardea 1973, 61, 1–93. [Google Scholar]
  20. Visser, M.E.; Holleman, L.J.M.; Gienapp, P. Shifts in caterpillar biomass phenology due to climate change and its impact on the breeding biology of an insectivorous bird. Oecologia 2006, 147, 164–172. [Google Scholar] [CrossRef] [PubMed]
  21. Visser, M.E.; Holleman, L.J.M. Warmer springs disrupt the synchrony of oak and winter moth phenology. Proc. R. Soc. B-Biol. Sci. 2001, 268, 289–294. [Google Scholar] [CrossRef] [PubMed]
  22. Cole, E.F.; Long, P.; Zelazowski, P.; Szulkin, M.; Sheldon, B.C. Predicting bird phenology from space: Satellite-derived vegetation green-up signal uncovers spatial variation in phenological synchrony between birds and their environment. Ecol. Evol. 2015, in press. [Google Scholar] [CrossRef]
  23. Hinks, A.; Cole, E.F.; Fannon, K.; Wilkin, T.A.; Nakagawa, S.; Sheldon, B.C. Scale-dependent phenology synchrony between songbirds and their caterpillar food source. Am. Nat. 2015, 186, 84–97. [Google Scholar] [CrossRef] [PubMed]
  24. Hurley, M.A.; Hebblewhite, M.; Gaillard, J.M.; Dray, S.; Taylor, K.A.; Smith, W.K.; Zager, P.; Bonenfant, C. Functional analysis of normalized difference vegetation index curves reveals overwinter mule deer survival is driven by both spring and autumn phenology. Philos. Trans. R. Soc. B 2014, 369. [Google Scholar] [CrossRef] [PubMed]
  25. Tveraa, T.; Stien, A.; Bardsen, B.-J.; Fauchald, P. Population densities, vegetation green-up, and plant productivity: Impacts on reproductive success and juvenile body mass in reindeer. PLoS ONE 2013, 8. [Google Scholar] [CrossRef] [PubMed]
  26. Drusch, M.; Del Bello, U.; Carlier, S.; Colin, O.; Fernandez, V.; Gascon, F.; Hoersch, B.; Isola, C.; Laberinti, P.; Martimort, P.; et al. Sentinel-2: Esa’s optical high-resolution mission for gmes operational services. Remote Sens. Environ. 2012, 120, 25–36. [Google Scholar] [CrossRef]
  27. Blondel, J.; Isenmann, P.; Maistre, M.; Perret, P. What are the consequences of being a downy oak (Quercus pubescens) or a holm oak (Quercus-ilex) for breeding blue tits (Parus caeruleus). Vegetatio 1992, 100, 129–136. [Google Scholar] [CrossRef]
  28. Morin, X.; Roy, J.; Sonie, L.; Chuine, I. Changes in leaf phenology of three european oak species in response to experimental climate change. New Phytol. 2010, 186, 900–910. [Google Scholar] [CrossRef] [PubMed]
  29. Charmantier, A.; Blondel, J.; Perret, P.; Harmelin-Vivien, M. Tracing site-specific isotopic signatures along a blue tit Cyanistes caeruleus food chain. Ibis 2014, 156, 165–175. [Google Scholar] [CrossRef]
  30. Hagolle, O.; Huc, M.; Pascual, D.V.; Dedieu, G. A multi-temporal method for cloud detection, applied to Formosat-2, Venus, Landsat and Sentinel-2 images. Remote Sens. Environ. 2010, 114, 1747–1755. [Google Scholar] [CrossRef] [Green Version]
  31. Open foris geospatial toolkit: Free open-source solutions for environmental monitoring. Available online: http://www.openforis.org/ (accessed on 5 November 2014).
  32. QGIS Developmment Team. QGis Geographic Information System v. 2.8. Open Source Geospatial Foundation. Availbale online: http://qgis.osgeo.org (accessed on 1 April 2015).
  33. Team, R.D.C. R: A Language and Environment for Statistical Computing; R Foundation for Statistical Computing: Vienna, Austria, 2015. [Google Scholar]
  34. Moran, P.A. The interpretation of statistical maps. J. R. Stat. Soc. Ser. B (Methodol.) 1948, 10, 243–251. [Google Scholar]
  35. Borcard, D.; Gillet, F.; Legendre, P. Numerical Ecology with R; Springer: New York, NY, USA, 2011; pp. 1–300. [Google Scholar]
  36. Marrot, P.; Garant, D.; Charmantier, A. Spatial autocorrelation in fitness affects the estimation of natural selection in the wild. Methods Ecol. Evol. 2015, in press. [Google Scholar] [CrossRef]
  37. Levin, S.A. The problem of pattern and scale in ecology. Ecology 1992, 73, 1943–1967. [Google Scholar] [CrossRef]
  38. Tremblay, I.; Thomas, D.; Blondel, J.; Perret, P.; Lambrechts, M.M. The effect of habitat quality on foraging patterns, provisioning rate and nestling growth in corsican blue tits Parus caeruleus. Ibis 2005, 147, 17–24. [Google Scholar] [CrossRef]
  39. Naef-Daenzer, B. Patch time allocation and patch sampling by foraging great and blue tits. Anim. Behav. 2000, 59, 989–999. [Google Scholar] [CrossRef] [PubMed]
  40. Marshal, J.P.; Rajah, A.; Parrini, F.; Henley, M.; Henley, S.R.; Erasmus, B.F.N. Scale-dependent selection of greenness by african elephants in the kruger-private reserve transboundary region, South Africa. Eur. J. Wildl. Res. 2011, 57, 537–548. [Google Scholar] [CrossRef]

