Abstract
In this study we present a hyperspectral flying goniometer system, based on a rotary-wing unmanned aerial vehicle (UAV) equipped with a spectrometer mounted on an active gimbal. We show that this approach may be used to collect multiangular hyperspectral data over vegetated environments. The pointing and positioning accuracy are assessed using structure from motion and vary from σ = 1° to 8° in pointing and σ = 0.7 to 0.8 m in positioning. We use a wheat dataset to investigate the influence of angular effects on the NDVI, TCARI and REIP vegetation indices. Angular effects caused significant variations on the indices: NDVI = 0.83–0.95; TCARI = 0.04–0.116; REIP = 729–735 nm. Our analysis highlights the necessity to consider angular effects in optical sensors when observing vegetation. We compare the measurements of the UAV goniometer to the angular modules of the SCOPE radiative transfer model. Model and measurements are in high accordance (r2 = 0.88) in the infrared region at angles close to nadir; in contrast the comparison show discrepancies at low tilt angles (r2 = 0.25). This study demonstrates that the UAV goniometer is a promising approach for the fast and flexible assessment of angular effects.
1. Introduction
Spectral radiometers (spectrometers) reach beyond the capabilities of human vision and enable scientists to retrieve diverse information from reflected light. Field spectroscopic measurements have a long history [1] and are nowadays a common investigative tool in various research areas. Moreover, spectral vegetation analysis from air- or spaceborne platforms is a mature technology, and is commonly used for the accurate derivation of land cover classes [2]. Hyperspectral measurements, which consist of continuous narrow spectral bands, help to retrieve information about the biophysical and biochemical components of vegetation [3,4,5] and may be used to discriminate healthy or stressed plants [6,7].
With their synoptic view, airborne and spaceborne imaging sensors typically capture a large swath. Discrete image elements (pixels) located in the geometric center of an image are commonly acquired from a nadir view angle, whereas pixels at image edges are recorded from oblique angles. Off-nadir view geometry depends on the field of view (FOV) specifications and measurement methodology and varies among sensor systems; MODIS, for example is imaging ±55° off nadir [8].
The bidirectional reflectance distribution function (BRDF) is the conceptual framework that explains changes in reflectance that result from view angle changes dependent on surface property and illumination [9,10]. BRDF influence is not desirable in a nadir image, as it impacts reflectance values recorded by the sensor and complicates the compositing of multiple images or flight lines. However, angular or off-nadir imaging can complement nadir image data by integrating additional spectral information. In forest environments, for example, an oblique view will—depending on the stand density—detect less reflectance from tree crowns and more from tree trunks [11,12]. Lack of knowledge in effects created from different sun-sensor geometries throughout the vegetation season have for instance led to incorrect greening estimates from satellite data in the Amazon rainforest, as recently shown by Morton et al. [13].
The need for BRDF correction, along with an interest in angular characteristics, has led to the development of various goniometric measurement approaches. These are able to exploit a center point from multiple view angles. The most common approach utilizes a semi-automated goniometer equipped with a point spectrometer with a radius of one meter or larger [14,15,16]. On larger scales the POLDER and MISR instruments and the orbiting sensor Chris/Proba are capable of retrieving spectral data of the same area from different angles during one or multiple overpasses [17,18]. On a smaller scale Comar et al. [19] used a conoscope to assess the BRDF of wheat at leaf surface level. This technique allows characterizing the reflectance of small leaf structures, such as veins. Such multiangular measurements are necessary to accumulate knowledge regarding vegetation cover BRDF characteristics. The fundamental goal of these research efforts is to develop a model capable of predicting the BRDF of a known vegetation cover type as well as the other way round, to derive knowledge about unidentified vegetation cover from multiangular measurements. Various models have been introduced in the past to estimate BRDF on a mathematical or empirical basis [20,21], or to compute the aggregate energy balance of a vegetation canopy including radiative transfer, as done in the SCOPE (Soil-Canopy-Observation of Photosynthesis and the Energy balance) model [22].
Using these methods, an effective theoretical understanding of the BDRF was developed for flat and accessible land cover like snow or soil [23]. The small size of common goniometers along with their small FOV made the BRDF characterization of other important land cover types (including forest or agriculture) difficult [24] or impossible. Forest and agriculture land covers are of particular significant scientific and economic interest, and alternative analytic approaches are necessary to allow BRDF measurements on larger scales and within inaccessible areas.
Some recent studies have investigated UAVs as a novel platform for goniometric measurements. Burkhart et al. [25] performed a survey over ice fields using a fixed-wing UAV equipped with an on-board spectrometer. Principally due to maneuvering and incident wind, the flight patterns of this platform introduced banking levels of up to ±30°, causing the spectrometer to collect multiangular hyperspectral measurements of numerous points that were overflown. A more defined method was presented by Hakala et al. [26] and Honkavaara et al. [27], who deployed a rotary-wing UAV equipped with a stabilized gimbal mounting RGB and multispectral camera, respectively. Utilizing specific flight patterns, multiangular information could be derived in the bands of the given camera.
To fully understand the BRDF effects of vegetation, we suggest that an optimized dataset providing a comprehensive understanding of multiple agricultural sites would consist of frequent multiangular hyperspectral measurements acquired at a number of different locations throughout a complete vegetation phenological cycle. Only airborne platforms can fulfill these requirements without disturbing crop growth by physically stepping through the field or casting shadows within the sensor FOV. With their recent development and improving utility and stability, UAVs can be employed as platforms for multi-angular remote data collection.
The main focus of this study is to introduce a way of collecting multiangular hyperspectral data over almost every kind of terrain and scale with a flying spectrometer. The approach combines the benefits of goniometers equipped with a high-resolution spectrometer and the flexibility of UAV platforms. We then demonstrate the acquisition and analysis of a datasets to explore BRDF effects over wheat. The angular dependency of reflectance as measured with the UAV goniometer was also compared to the reflectance modeled by SCOPE.
2. Material and Methods
The Falcon-8 octocopter UAV (Ascending Technology, Krailing, Germany) was used in this study. This platform was chosen due to its accurate flight controls and inherent stability. A hyperspectral measurement system was integrated on the UAV [28]. This instrument was recently developed at the interdisciplinary Research Center Jülich (Forschungszentrum Jülich GmbH) and is based on the STS-VIS spectrometer (Ocean Optics Inc. Dunedin, USA). The FOV of this spectrometer is approximately 12°; spectral resolution was at a full width at half maximum (FWHM) of 3 nm, with 256 spectral bands (4 pixel spectrally binned) within the range of 338 to 823 nm.
The Falcon-8 was originally designed as a camera platform for photographers and video production. It is equipped with a camera mount whose angle can be set during flight within 1° increments. The vertical angle (tilt) is defined by the camera mount, while the horizontal angle (heading) is determined by UAV orientation. The position and navigation is done by combining the GPS information from a navigation grade GPS (Ublox LEA 6T) and the information of the orientation information of the sensors onboard the UAV. Wind gusts during the flight are counteracted by an active system, which stabilizes the camera by pitch and roll. The spectrometer is also equipped with a RGB camera, which feeds a live video stream to the operator to facilitate operation and allow proper aiming of the system.
Airborne hyperspectral target reflectance measurements were performed with the UAV spectrometer wirelessly synchronized with a second spectrometer on the ground. Latter measured a white reference (Spectralon®) to adapt to changing illumination. A thorough calibration of the hyperspectral system was performed following the procedure described by Burkart, et al. [28]. This process included dark current correction [29], spectral shift, dual spectrometer cross-calibration and additional quality checks using the SpecCal tool [30]. Our approach allows to compute the ratio of light reflected by the target surface to the hemispherical illumination (diffuse-, ambient-, and direct-sunlight) as reflected by the white reference and is termed a hemispherical/conical reflectance factor. The actual BRDF is thus only approximated by this approach. Schaepman-Strub et al. [10] provide a comprehensive BRDF description and nomenclature.
2.1. Flight Pattern
Grenzdörffer and Niemeyer [31] demonstrated that a distinct hemispherical flight pattern is necessary to enable goniometric measurements using an UAV-based airborne RGB camera. The flight pattern accurately defines the position of the UAV as well as the aiming of the camera. The flight path of the UAV is selected to follow waypoints (WP) in a hemisphere and the angle and heading of the spectrometer is set to continuously point towards the center of the hemisphere. In this manner the center of the hemisphere is measured from different viewing angles.
To quickly compute such flight patterns for UAVs, we developed the software mAngle. It was written in the platform independent open source language “Processing” and is freely available as source code and compiled versions [32]. mAngle calculates the desired WP around a given center GPS coordinate. Placement of the WP are optimized for speed, as the UAV can quickly change horizontal position but requires more time to climb vertically to a different altitude. Flight pattern parameters including number of WP, initial angle, and hemisphere diameter can be set as desired (Figure 1). A designated flight pattern can be exported as a *.kml file to Google Earth (Google Inc., Mountain View, CA, USA) for visualization. The flight pattern can also be exported as a *.csv file, the format used by the Falcon-8 flight planning software (AscTec Autopilot Control V1.68). Such a hemispheric flight pattern is also useful to acquire pictures around a center object of interest for 3D reconstruction.
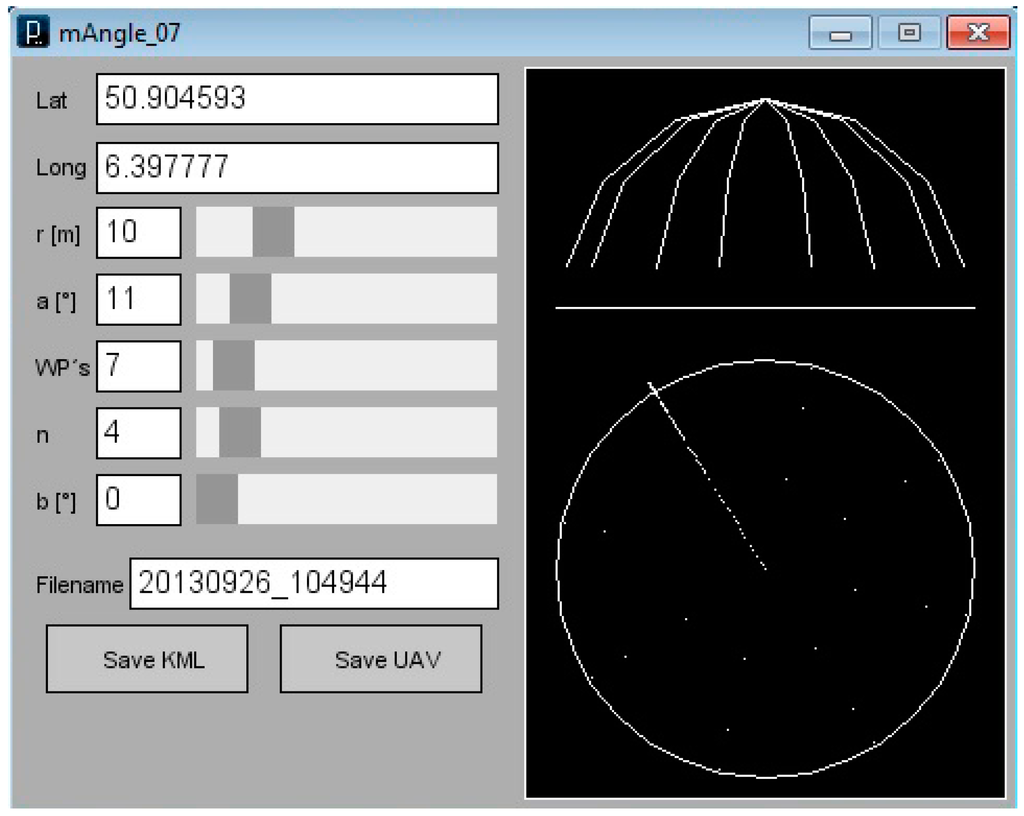
Figure 1.
Graphical user interface of the mAngle software with input fields for the desired waypoint pattern. By setting radius, number of desired waypoints as well as starting angle and other parameters, a distinct goniometric flight pattern can be generated. A draft of the waypoint pattern is visualized in the right box of the program window.
2.2. Accuracy of the Unmanned Aerial Vehicle (UAV) Goniometer
To assess the positioning and pointing accuracy of the UAV goniometer the spectrometer was replaced by a high resolution RGB camera (NEX 5n, Sony, 16 mm lens) mounted on a similar active stabilized gimbal. In this configuration the UAV was flown following the same waypoint pattern as was used for a multi-angular spectrometer flight. In operation, the airborne spectrometer is triggered three times at each WP. The RGB camera also acquired three digital images at each WP (84 in total). Eleven ground control points (GCPs) were distributed within the covered area and registered using a differential GPS (Topcon HiPer Pro, Topcon). 3D reconstruction software (Agisoft Photoscan, version 1.0.4) was used to structure the spatial arrangement of the scene and georeference it with the GCPs. This rendering was calculated with a resolution of 3.53 mm/pixel and an average error of 1.46 pixels. The camera position and view angles for each individual image were exported and served as an estimator for the spatial accuracy of the UAV under operational conditions.
2.3. Field Campaign
Two multiangular flights (referred to as MERZ1, MERZ2) were conducted over farmland (Lat 50.93039, Lon 6.29689) on 18 June 2013 during the ESA-HyFlex campaign in Merzenhausen, Germany. The two flights were performed under cloud-free moderate wind (1.6–5.5 m/s) conditions with an interval of two hours—one hour before and one hour after solar noon (Table 1). At the time of the study, the field contained mature wheat, with fully developed but still green ears (Figure 2). The centroid of the hemispherical waypoint pattern was located within the field in an area of uniform cover, avoiding farm equipment tracks and trails. The center point was defined using aerial imagery, in order to avoid disturbing measurements by walking into the area of interest. The two datasets produced in this campaign are freely available via SPECCHIO [33] at the server of the University of Zuerich under the campaign name “Merzen”.
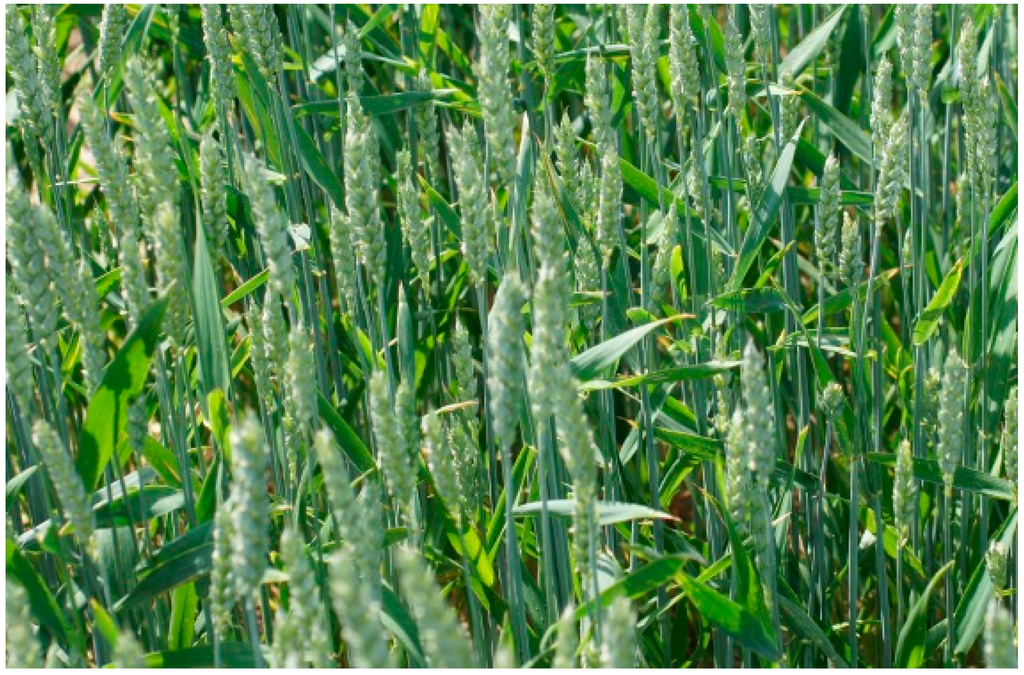
Figure 2.
Wheat (Triticum aestivum) at the study site Merzenhausen, Germany, at the time of the multiangular flights, 18 June 2013. Ears were fully developed but still green.

Table 1.
Local time and duration with the corresponding sun angle parameters for the two hyperspectral flights performed over wheat field in Merzenhausen, Germany.
| Flight | Start Time | Duration | Sun Azimuth | Sun Elevation |
|---|---|---|---|---|
| MERZ1 | 12:43 | 09 min | 155° | 61° |
| MERZ2 | 14:47 | 11 min | 213° | 59° |
For these flights a hemisphere with a radius of 16 m was specified. The spectrometer has a FOV of 12°. The areal coverage of each measurement is a function of sensor tilt angle, encompassing here 9 m2 at nadir up to 30 m2 with 20° tilt. WPs around the hemisphere were set to cover vertical tilt angles of 90° (nadir), 66°, 43° and 20°, at 8 equally distributed heading angles, potentially producing a total of 28 WPs. However, nadir measurements were only acquired at four different headings, which were then merged into a single WP, leading to a total of 25 WPs included in the analysis. In the following individual WPs will be identified as WP (tilt degree, heading degree). The spectrometer was activated three times at each WP to allow averaging and assessment of response variance. MERZ1 required a flight time of nine minutes, and MERZ2 required eleven minutes to consecutively measure the WP pattern. An additional UAV flight was conducted over the target using an RGB camera (NEX 5n, Sony Corporation, Minato, Japan, 16 mm lens) to image each WPs (Figure 3).
2.4. Data Preprocessing
Each spectrum captured from the UAV was transformed to reflectance using the reference spectra simultaneously measured by the ground spectrometer. Then, for each WP, the mean, standard deviation and coefficient of variation were calculated from the three measured spectra. All further analyses were based on the mean spectra. To analyze the data with regard to the tilt and heading angle, averaged values were calculated depending on the parameter of interest. Additionally, to analyze relative changes in reflectance, spectra from all measurement positions were normalized using the nadir spectra response values [34]. The resulting normalized nadir anisotropy factor (ANIFband) produces a coefficient for each band, which individually adjusts (increases or decreases) reflectance factor values for each spectral band in relation to those recorded at nadir (Equation A). Thus, an ANIF factor of one describes an identical reflectance as recorded for a given band at nadir, while values above or below one describe higher or lower reflectance than the nadir value.

Figure 3.
Example Red-Green-Blue (RGB) images with tilt angles of 20°, 66° and 90°. These images were acquired at the Merzenhausen site at approximately 13:30 following a multiangular flight path identical to the spectrometer flights. The Field-Of-View (FOV) of the RGB camera is 73.7° × 53.1° (compared to the 12° FOV of the airborne spectrometer) and allows observing multiangular effects within a single image–the bright hotspot with the shadow of the unmanned aerial vehicle in the center, located in the lower left corner of the 90° image is an example.
2.5. Vegetation Indices
Broadband vegetation indices (VIs) have an extensive history in remote sensing. Together with their hyperspectral counterparts they are still widely used in vegetation studies [35,36]. VIs commonly ratio near-infrared (NIR) and red band reflectance values in order to compensate for influences of different illumination conditions or background materials. To investigate the effect of the BRDF we examined three common Vis (Table 2) and calculated their values for all WPs. The Normalized Difference Vegetation Index (NDVI) uses two wavelengths in the red and NIR domain and has been widely used in a diverse range of applications. In our study we used the NDVI as proposed by Blackburn et al. [37]. As a second index we used the Transformed Chlorophyll Absorption in Reflectance Index (TCARI) developed by Haboudane et al. [38]. TCARI was developed to predict chlorophyll absorption and uses wavelengths in the green, red and NIR spectral regions. The last index used in this study is the Red Edge Inflection Point (REIP). Originally introduced by Guyot et al. [39] it characterizes the inflection in the spectral red edge by calculating the wavelength with maximum slope. It has been used to quantify leaf chlorophyll content [40].

Table 2.
Vegetation indices used in this study and their underlying formulas.
| Index | Formula | Reference |
|---|---|---|
| NDVI | (R800 − R680)/(R800 + R680) | Blackburn et al. 1998 |
| TCARI | 3 × ((R700 – R760) – 0.2 × (R700 – R550) × (R700/R670)) | Haboudane et al. 2002 |
| REIP | 700 + 40 × (((R667 + R782)/2) – R702)/(R738 – R702)) | Guyot et al. 1988 |
2.6. Data Visualization
Several different visualizations or graphics were used in this study to focus on specific features under investigation. An effective method for assessing multiangular measurements includes the use of a segmented circular display known as a “polar plot”. The polar plot shown here in Figure 4 represents the UAV headings and sensor tilt angles within a circular matrix and illustrates the intensity of the measurement values by applying a color to each segment. To provide an useful overview of the dataset of this study and to include as well a comparison of the reflectance in the spectral domain, multiple plots are necessary.
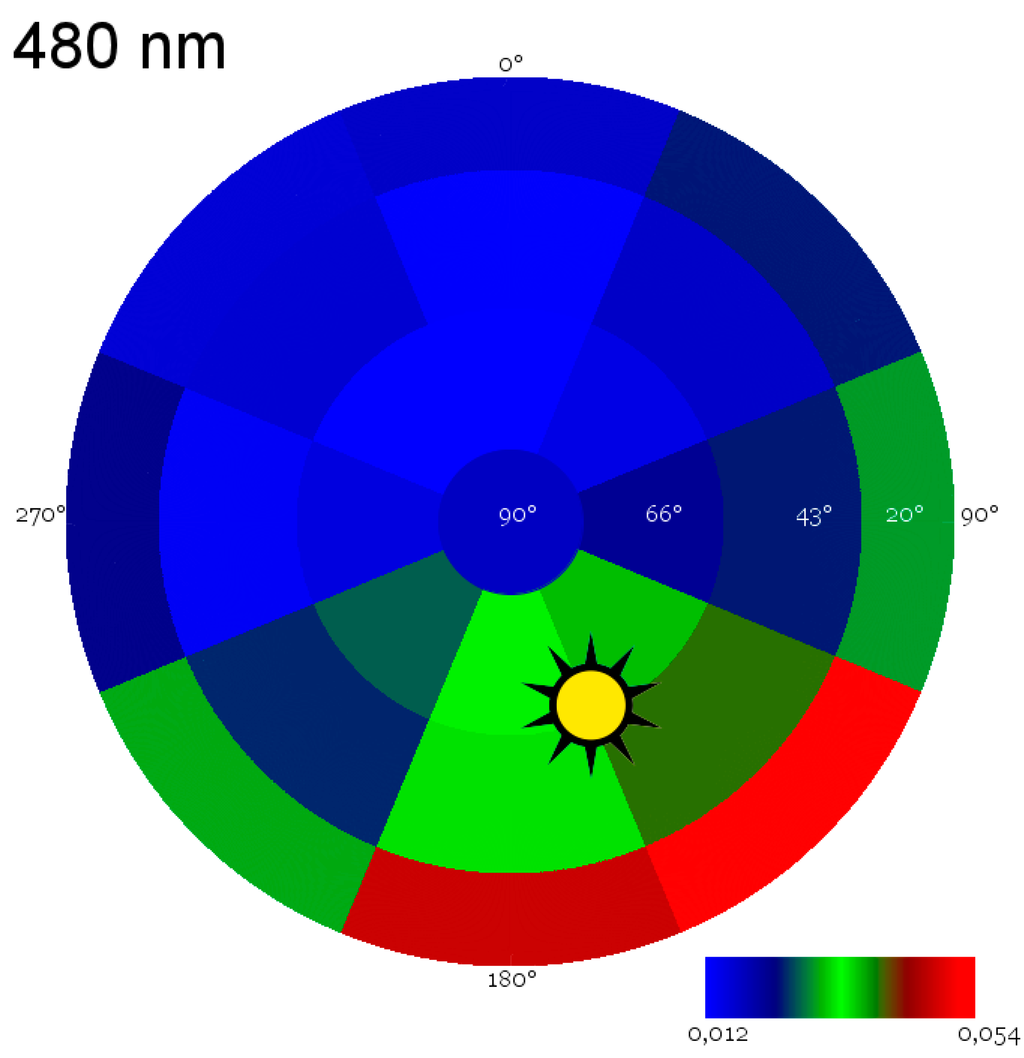
Figure 4.
Reflectance of wheat at 480 nm measured at all 25 waypoints shown as a circular graph, or polar plot. Each “slice” represents a heading while each ring represents a sensor tilt angle. Spectral reflectance magnitude is color coded from low values of light blue, to high values in bright red. The angular position of the sun is depicted by the sun-symbol. In this figure no interpolation between waypoints is performed.
2.7. Radiative Transfer Model Comparison
To compare the multiangular UAV measurements to modeled data, the SCOPE radiative transfer model was tested. The model generates the spectrum of outgoing radiation in the viewing direction as a function of vegetation structure [22]. SCOPE input parameters were derived through comparison of the MERZ1 nadir spectrum with a lookup table of SCOPE spectra generated using a permutation of input parameters that were expected from wheat at the present phenological state. The resulting best-fit parameters are shown in Table 3.

Table 3.
Soil-Canopy-Observation of Photosynthesis and the Energy balance model (SCOPE) input parameters: Leaf Area Index (LAI), Leaf Inclination (LIDFa), Chorophyll A/B (Cab) content in µg/cm2, Leaf Thickness Parameter (N), Leaf water equivalent layer (Cw) in cm, Dry matter content (Cdm) in g/cm2, Senescent material fraction (Cs), Variation in leaf inclination (LIDFb). Default values were used for all other SCOPE input parameters.
| Fitted Parameters | Constant Parameters | ||||||
|---|---|---|---|---|---|---|---|
| LAI | LIDFa | Cab | N | Cw | Cdm | Cs | LIDFb |
| 3.5 | −0.35 | 95 | 1.5 | 0.004 | 0.005 | 0.15 | −0.15 |
Using the input parameters above, the angular module of SCOPE was run to estimate the reflectance spectra at identical angles as those measured with the UAV goniometer. Sun azimuth and zenith angles were set to match the values present at the time of the MERZ1 measurements.
3. Results
In this section we first present the results of the accuracy assessment of the UAV goniometer. We then summarize the results of the analysis of the MERZ1 dataset and the influence of the BRDF on the full hyperspectral data as well as on the vegetation indices. Then the BRDF effects of MERZ1 are compared to the MERZ2 dataset. Finally, we compare the data derived from the UAV goniometer with results of the SCOPE radiative transfer model.
3.1. Accuracy Assessment of the Unmanned Aerial Vehicle (UAV) Goniometer
Table 4 shows the deviation of the UAVs actual position from the planned position. Definitions of altitude and position in X and Y dimensions are commonly accepted. However, to describe the functions of vehicle and sensor heading and tilt angle, several different definitions exist. Figure 5 shows how heading and tilt angles were used in this study with the UAV and its spectrometer system. The average deviation in heading and tilt may differ slightly from the actual UAV spectrometer pointing error, as a small error may have been introduced during the process of replacing the spectrometer with the RGB camera in the gimbal mount using a tripod screw.

Table 4.
Accuracy of the unmanned aerial vehicle (UAV) heading and spatial positioning calculated by structure from motion using 75 high-resolution images. Nine images were unusable due to motion induced “blur” and excluded from processing. Heading and tilt columns represent the deviation of the cameras actual pointing direction to the programmed angle. Altitude, X- and Y-position describe the deviation of the UAVs position as calculated from the differential-Global-Positioning-System ground-referenced structure from motion approach compared to the programmed waypoints.
| Deviation of: | Heading (°) | Camera Tilt (°) | Altitude (m) | Position X (m) | Position Y (m) |
|---|---|---|---|---|---|
| Average | 0.11 | 6.07 | 0.03 | −1.15 | −2.22 |
| SD | 8.67 | 1.22 | 0.70 | 0.68 | 0.82 |
| Max | 26.20 | 9.74 | 1.44 | 0.67 | −0.39 |
| Min | −17.99 | 3.68 | −1.09 | −2.79 | −4.60 |
Movements of the airborne platform cause slight variations in the footprint of the spectrometer and introduce minor differences in the individual measurements at each waypoint. Figure 6 shows the average coefficient of variation (CV) of the spectral measurements acquired at all WP during the MERZ1 flight. CV values within the blue and red regions of the spectrum are between 5% and 6%; in the green portion the value is approximately 4%. The CV in the NIR is less than 1.5%.
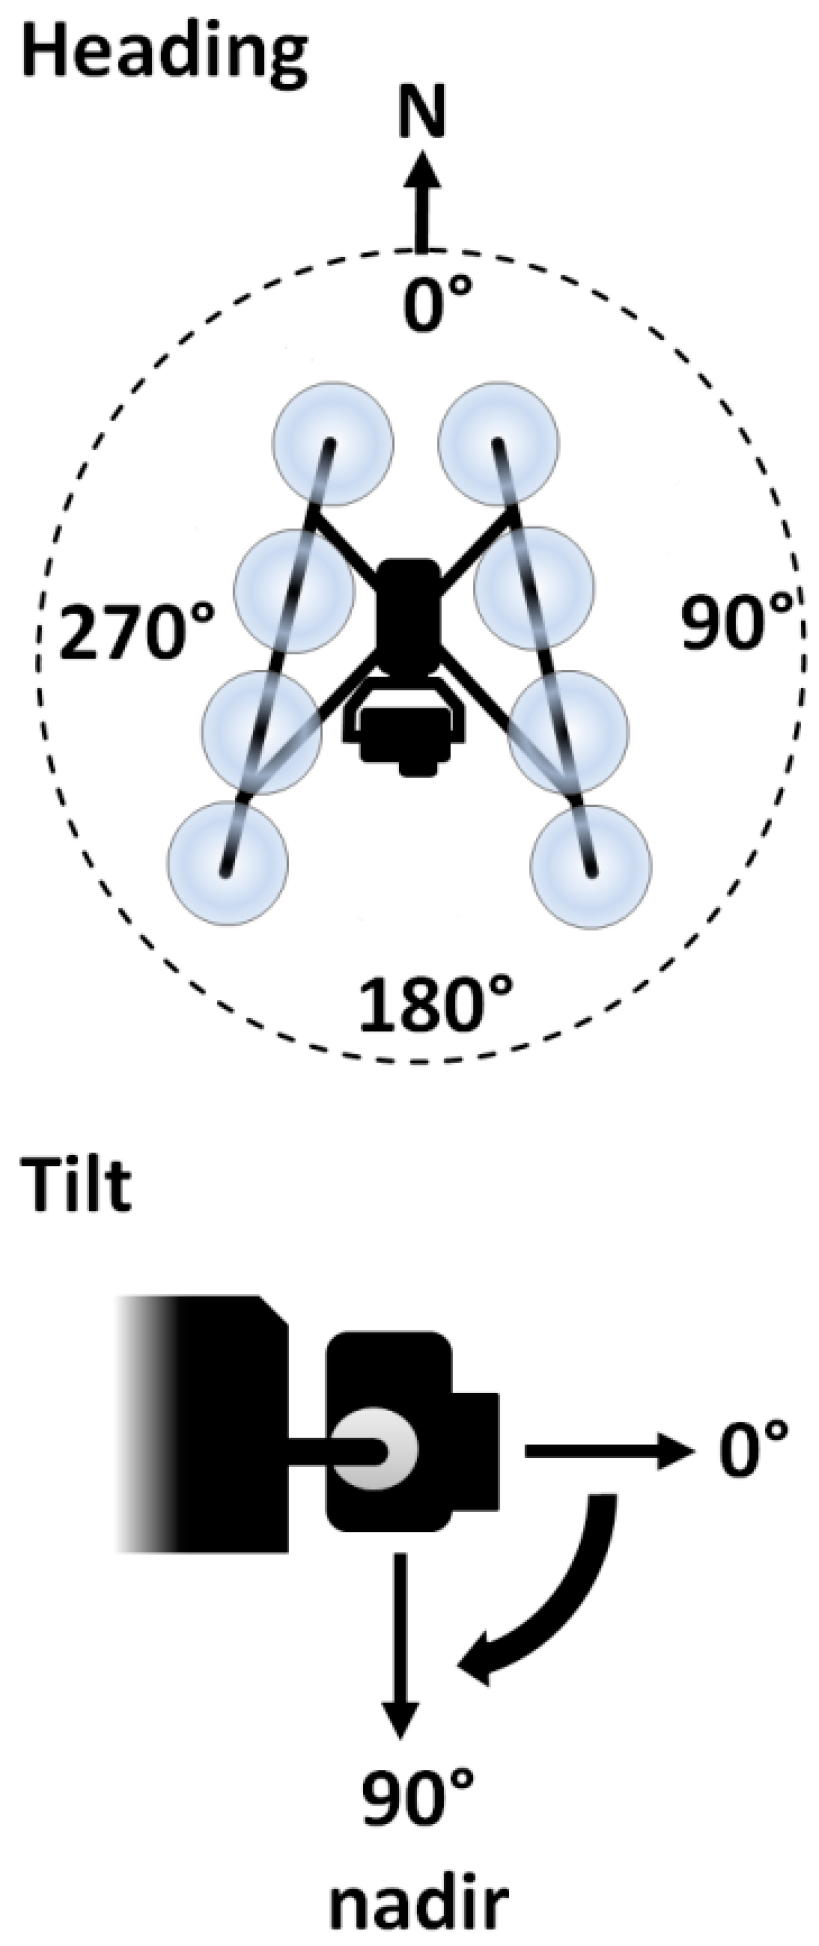
Figure 5.
Camera orientation: Heading (azimuth) of the spectral measurements expressed in angular degrees from north. To assume a view angle of 0°, the Unmanned Aerial Vehicle (UAV) will hover north of the centeroid and aim the spectrometer at 180°. Tilt: 0° = horizontal and 90° = nadir view.
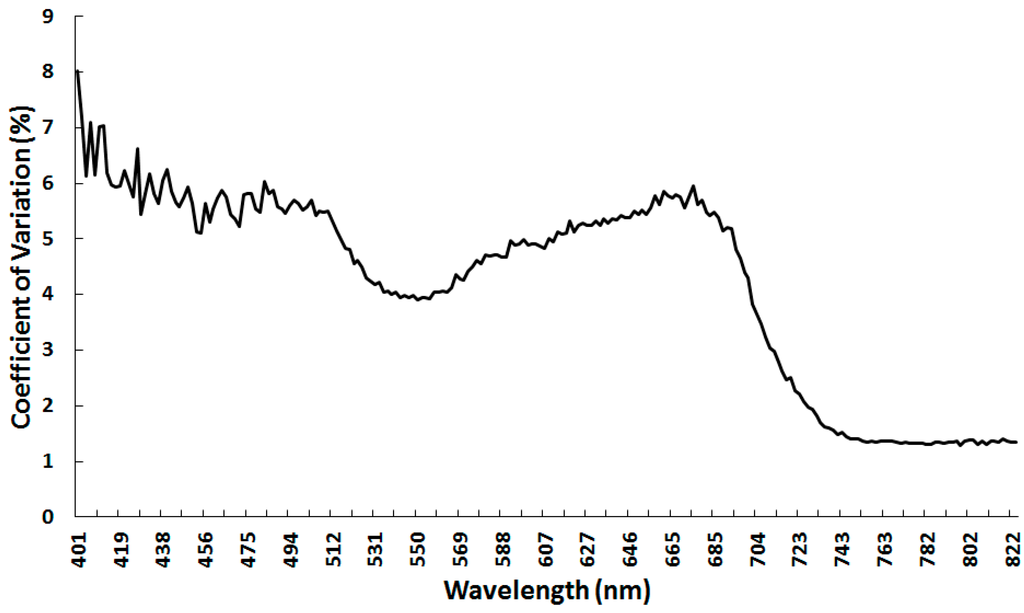
Figure 6.
The spectrometer of the unmanned aerial vehicle goniometer was triggered three times at each waypoint. This figure shows the overall variation of the three spectra measured at each waypoint as average for the MERZ1 dataset.
3.2. Full Spectrum Analysis
In Figure 7 the ANIF for the MERZ1 dataset is shown for a tilt of 66°. All spectral measurements acquired at headings between 90° and 225° exceed nadir values, with the largest increases seen in measurements taken within the blue spectral region. When heading parameters are examined, the 180° heading shows an increase of approximately 95% (the highest). The 90° measurement shows the lowest increase at approximately 25%. Deviation for these headings show a gradual decrease until the red edge position where values for 135°, 180° and 225° headings drop to range between 25% and 30%. For all these WP, the deviation decreases in the green spectral region. At headings of 0°, 45°, 270° and 315° reflectance measurements are 10% to 30% lower than nadir within the blue spectra. Until the red edge spectral region is reached, reflectance values decrease from 20% to 40% below the nadir measurement. In the red edge region the reflectance increases to approximately 10% above that of the nadir measurement.
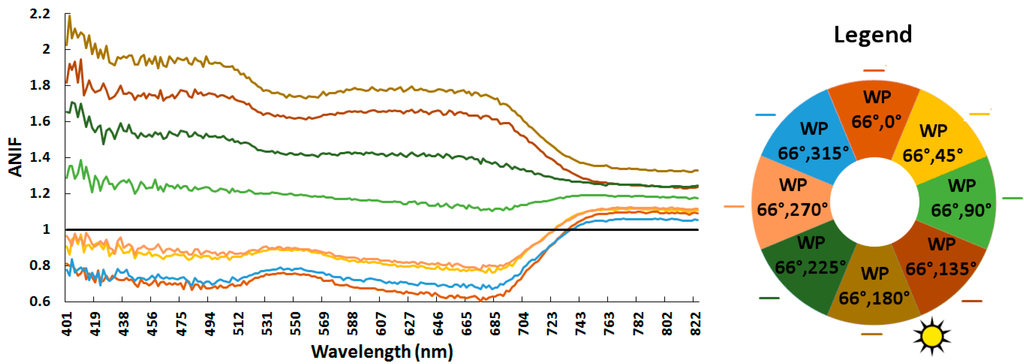
Figure 7.
To present the angular influence at different waypoints on the full spectrum the normalized nadir anisotropy factor (ANIF) of 66° tilt for all headings at MERZ1 from 400 to 823 nm is plotted as example. By using the ANIF notation spectral deviation of single waypoints is referred to the nadir waypoint and thus can be relatively compared. A waypoint with the same spectrum as nadir would remain at an ANIF of 1 throughout all wavelengths. The legend on the right represents the color of each ANIF curve and depicts their respective heading angle. The azimuth position of the sun (155°) is visualized by the sun symbol.
This shape of the ANIF which was observed for the 66° sensor tilt angle can also be found for the other tilt angles used in the overflights. Figure 8 shows the ANIF for five regions of the spectrum for all investigated tilt and heading angles. For all wavelengths the ANIF decreases with increase of the tilt angle. Only for most of the VIS region with heading from 180° to 270° the ANIF is smaller in the 43° tilt than in the 66°. On average the reflectance of the 135° and 180° show the highest increase from nadir with 191% and 181%, respectively. Lower reflectance values than in nadir are seen in the VIS spectral region with headings of 0°, 45°, 270° and 315°. At 0° and 315° even the average of all tilt reflection values is lower than in nadir.
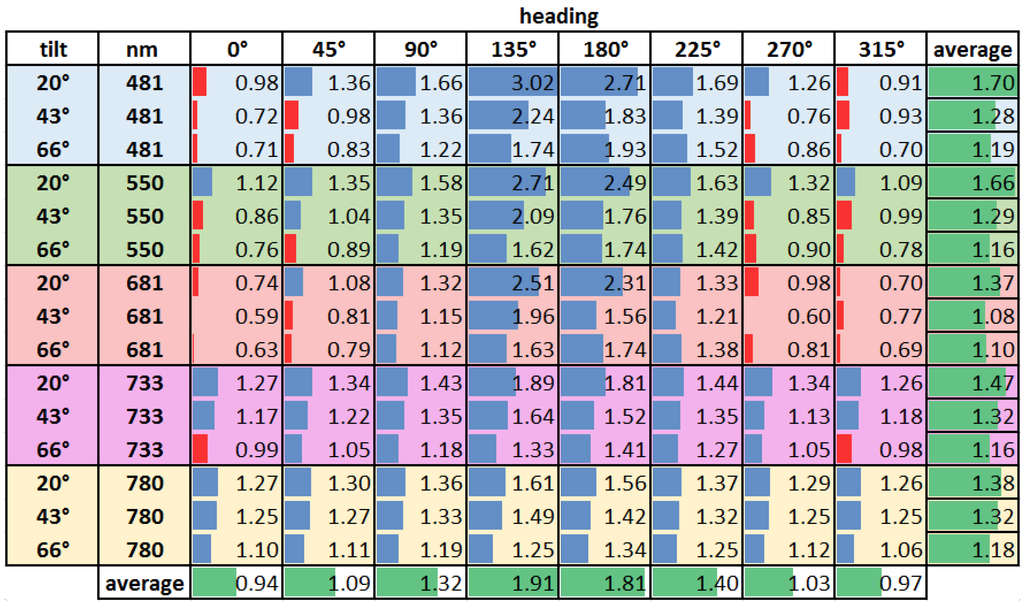
Figure 8.
Normalized nadir anisotropy factor (ANIF) values for five characteristic wavelengths in the blue (480 nm), green (550 nm), red (680 nm) spectral bands; red-edge-inflection-point (REIP) (733 nm) and near-infrared (NIR) (780 nm) for 20°, 43° and 66° tilt, as well as all headings together with their average values. Values greater than 1 (blue bar) represent spectral reflectance measurements greater than nadir; values below 1 (red bar) represent measurements less than nadir. The suns azimuth was 155° and elevation 66°.
3.3. Vegetation Indices
NDVI values range from 0.83 (WP 20°, 135°) to 0.95 (WP 43°, 0°), compared to the nadir value of 0.89. Values decrease for each tilt angle as the 135° heading is approached and generally increase toward the 0° heading, with an increase seen only at the WP (43°, 270°). On average, the 43° tilt yields the highest NDVI value with 0.92 (within a range of 0.86–0.95) while the 20° and 66° tilt parameters show an average NDVI of 0.9 (0.83–0.94, and 0.86–0.94, respectively). Relative differences from nadir NDVI range between −6.5% and 6.2%. The relative mean absolute difference is 3.3 percent. The 90° and the 225° headings show the smallest differences from the nadir NDVI. Aside from the 135° and 180° headings, all WPs return higher NDVI values when compared with the nadir position. The tilt angle has only a minor influence on the relative difference (Figure 9).
TCARI values vary with UAV heading, ranging from 0.04 (WP 66°, 315°) to 0.116 (WP 20°, 135°), against a nadir value of 0.046. This pattern is opposite as observed for NDVI. Vehicle heading values vary systematically, increasing (for all tilt angles) towards 135° and decreasing as the 0° heading is approached. As seen for the NDVI, WP (43°, 270°) poses an exception with a lower TCARI value.
Sensor tilt parameter variability can be briefly summarized. The 20° tilt setting shows the highest mean TCARI value of 0.078 (within a range of 0.06–0.116); the 43° setting yields a mean TCARI value of 0.062 (with a range of 0.046–0.090) and the 66° tilt shows mean TCARI of 0.053 (range 0.038–0.074). In relative terms, the differences from the nadir TCARI range from −16.8% to 153.2%. The relative mean absolute difference is 40%. Most WPs greatly surpass the nadir TCARI value; at a sensor tilt of 20° no TCARI value is smaller than the nadir value at 43° only a single value is smaller and at tilt = 66° four values are smaller than the nadir value. The tilt parameter is shown to have a significant influence on the relative difference. From 20° to 60° the relative mean absolute difference decreases from 69% to 25% (Figure 9 bottom).
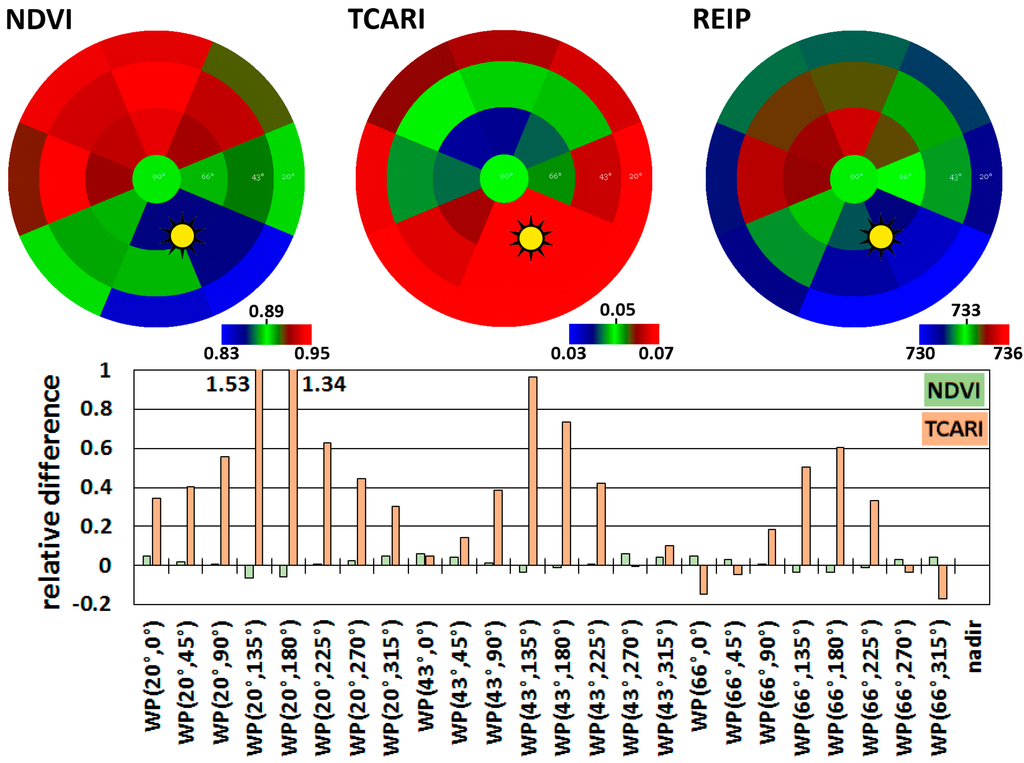
Figure 9.
(Top) Absolute values for the NDVI, TCARI and REIP compared to the nadir value (center of the polar plot) for all waypoints of MERZ1. The range of values is chosen with nadir as center value, respectively, for each plot. Figure 5 details the angular arrangement depicted here. (Bottom) Relative differences for NDVI and TCARI compared to the nadir value.
The Red Edge Inflection Point (REIP) was also analyzed in this study (Figure 9). For nadir spectral measurements the REIP is approximately 733 nm. WP (20°, 135°) shows the lowest REIP (approximately 729 nm) while WP (66°, 0°) shows the highest REIP (735 nm). The average REIP value was slightly lower than the nadir value with 732.5 nm. At all WPs, measurements acquired at a heading of 135° show the lowest values; these increase towards the 0° heading. All the WPs measured with a sensor tilt angle of 20° surpass the nadir REIP. Measurements acquired at tilts of 43° and 66° produced two, respectively, 4 values that are smaller than the nadir value. The overall mean absolute difference was less than 0.2%, decreasing from approximately 0.3% at 20° tilt to 0.15% at 66° tilt.
3.4. Diurnal Variations of Angular Effects
Ideal clear weather conditions were present over the Merzenhausen study area throughout 18 June 2013. Sequencing a pair of overflights enabled us to compare these two datasets and analyze how the change in sun illumination affects multiangular sensor response (Figure 10). Nadir measurements remained consistent during the day. However, significant changes in target response (including hotspot and backscattering features) were observed at lower sensor tilt angles, dependent on sun position (Table 1). These features show distinct spectral differences within the five different wavelengths (Figure 7 and Figure 8). The hotspot feature is clearly visible and is characterized by higher spectral reflectance values within the shorter blue and green wavelengths. These spectral differences are less apparent in the infrared wavelengths.
Figure 10 shows the angular distribution of reflectance in five selected wavelengths of interest: 480 nm (blue), 550 nm (green), 680 nm (red), 733 nm (Red-REIP) and 780 nm (NIR). All bands show the directional effect of increased reflectance values as heading angles approach 180°, and decreased reflectance with the opposite orientation. This effect is most pronounced in the shorter spectral wavelengths (up to 680 nm) and is less characteristic in the NIR region. Angular distribution differs in MERZ1 and MERZ2. Elevated reflectance values cluster between 135° and 180° headings in the MERZ1 dataset, while in MERZ2 this phenomena is oriented to heading angles between 180° and 225°.
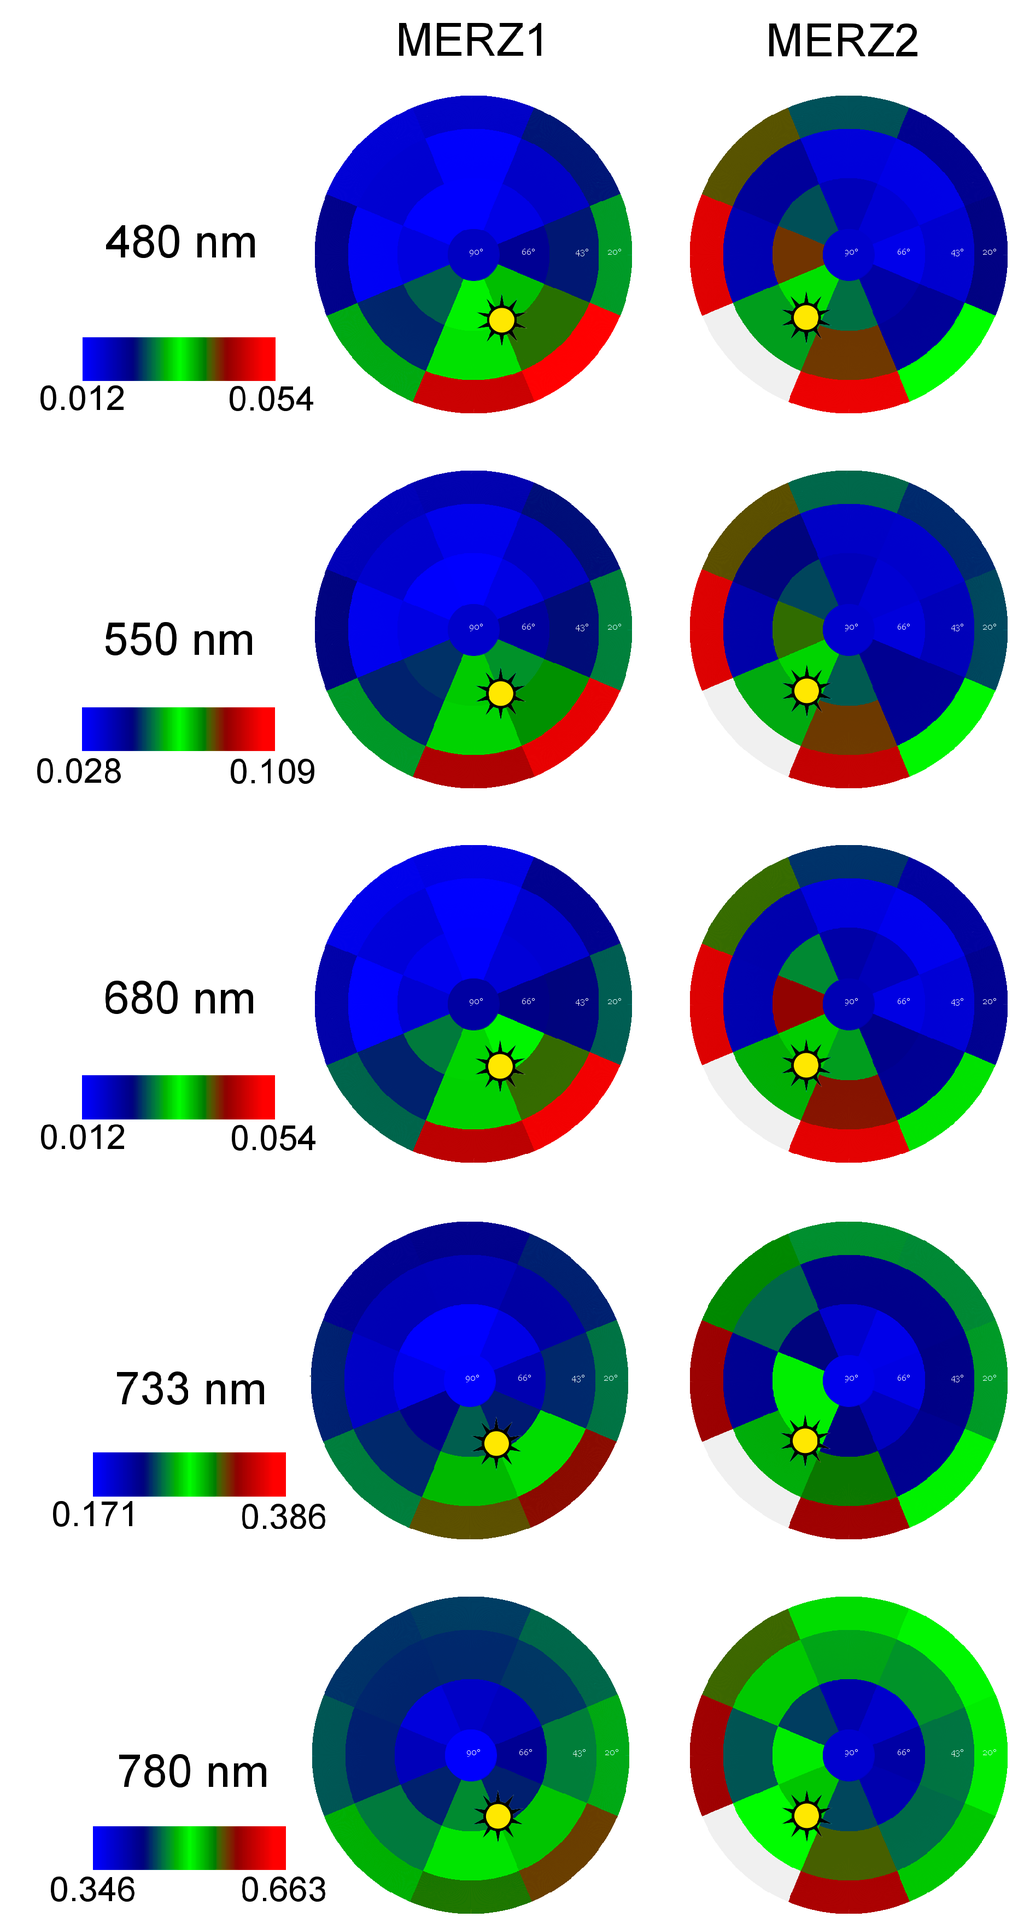
Figure 10.
Reflection of MERZ1 and MERZ2 for 5 wavelengths of interest. The color legend of reflection for each horizontal pair was scaled to the occurring reflectance wavelength range. Figure 5 details the angular arrangement depicted here. Waypoint (20°, 225°) is missing in MERZ2 and coded in this graphic in grey.
3.5. Flying Goniometer vs. Radiative Transfer Model
Results of the comparison between the scope model and the flying spectrometer measurements are shown in Figure 11 for exemplary wavelengths of 550 nm and 780 nm.
Correlation of angular measurements with modeled data show clear differences in wavelengths and tilt angles. To test this hypothesis, ANIF values were calculated for both datasets. Our comparison included sensor tilt angles of 66°, 43° and 20° and wavelengths at 480 nm, 570 nm, 680 nm and 750 nm. Correlation statistics (r2) were calculated for the linear regression of UAV-ANIF against SCOPE-ANIF. While SCOPE produces results similar to UAV measurements at high tilt angles, r2 is low at the 20° angle (Table 5).
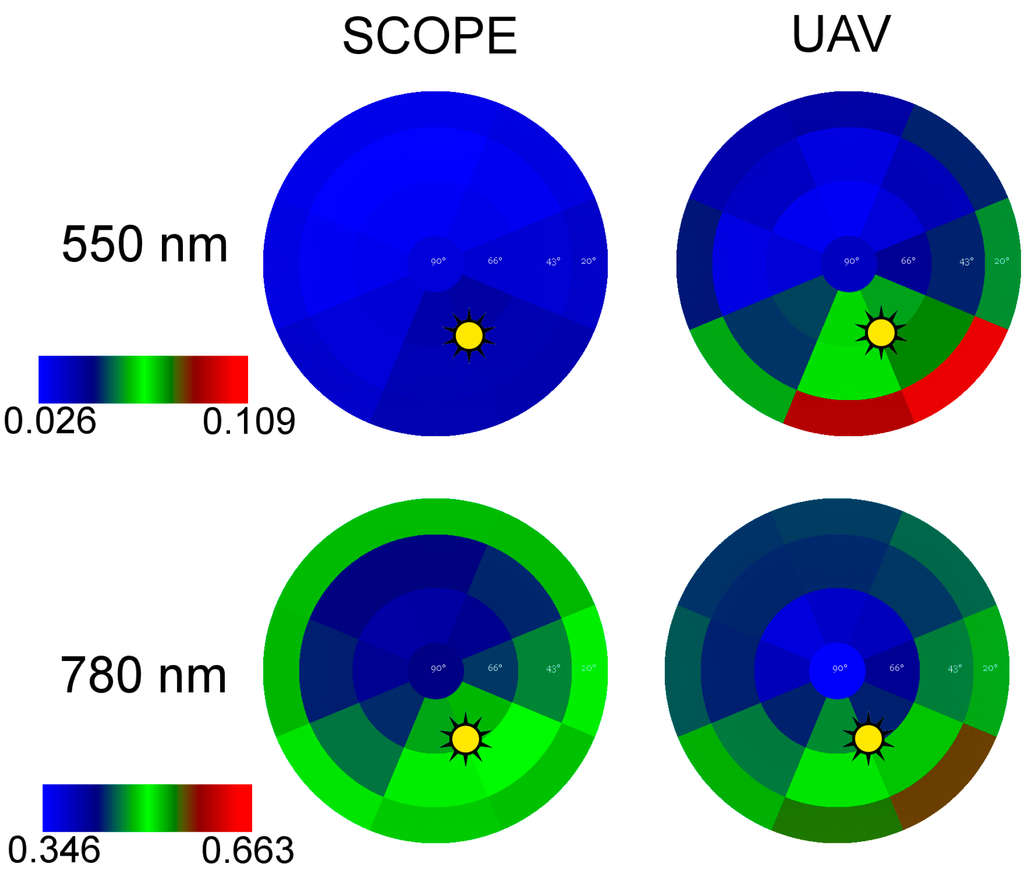
Figure 11.
Comparison of modeled angular reflectance Soil-Canopy-Observation of Photosynthesis and the Energy balance (SCOPE) with the unmanned aerial vehicle (UAV) measured values for MERZ1. Shown are two exemplary wavelengths, which are scaled to the present range of values.

Table 5.
Correlation of modeled data with measured data for different tilt angles.
| Tilt | 20° | 43° | 66° |
|---|---|---|---|
| Correlation (r2) | 0.2504 | 0.7484 | 0.8819 |
In the spectral domain the maximum UAV reflectance/SCOPE model r2 was found in the NIR (750 nm); the lowest correlation value was derived for the 680 nm spectral wavelength (Table 6).

Table 6.
Correlation of modeled data with measured data for all tilt angles at specific wavelengths.
| Wavelength | 480 nm | 570 nm | 680 nm | 750 nm |
|---|---|---|---|---|
| Correlation (r2) | 0.4298 | 0.5685 | 0.3605 | 0.815 |
4. Discussion
In this study, a new goniometer approach for large-scale measurement of BRDF is presented and an initial hyperspectral dataset is analyzed. By deploying the spectrometer on a rotary-wing UAV there is no longer a need to mount the instrument on large ground-based positioning structures. The large FOV has the advantage of averaging out small variations, which are part of the canopies variability. As the device is flying, surfaces can be investigated with desired measurement patterns even over areas inaccessible by land and without disturbing the eventual surface cover like vegetation. Until now these areas had to be approached using satellites or by modeling [41]. In remote sensing applications, where goniometers cannot be deployed, angular effects are currently minimized or correction approaches are applied: Field-spectrometer measurements are carried out around the same time (noon) and from nadir view [5]. Thus the sun-object-sensor geometry is almost stable. For UAV-, air- and spaceborne systems a number of correction methods have been developed. These include the use of image statistic based methods for flat terrain [42] and physical or semi-empirical models such as for the processing of MODIS data [43]. Lately, a more generic BRDF correction method was introduced, which builds on a surface cover characterization [44]. Since physical and empirical models are based on the current knowledge and BRDF effects depend on many factors, the flying goniometer could help to evaluate and eventually improve the correction methods.
We assessed the pointing accuracy of the UAV system and found it to be of acceptable accuracy for a GPS-aided flying system, although it is still not as precise as ground-based instrumentation [34,45]. Parameters of altitude, X/Y position and sensor tilt angle are highly accurate within the navigation grade GPS specifications. Additionally, the remounting of the RGB camera described in Section 2.2 might have introduced an artificial error. The relative position as described by the low standard deviation demonstrates the precision of the system (Table 4). However, the vehicle heading parameters are less accurate. Relative heading inaccuracies may be ascribed to the Falcon-8 flight control system, which does not make use of a magnetic compass. If operated in an environment with a strong magnetic field, a compass system could produce serious errors in vehicle position and heading readings and cause catastrophic UAV failures. However, in the case of the UAV goniometer, the accuracy would improve through the use of a compass system for heading correction.
Additional sources of error in the platform/sensor system are found in gimbal calibration in the tilt axis and during the process of physically mounting the spectrometer on the gimbal. Inconsistencies in either one or both of these procedures will lead to pointing offsets. The system could also be improved by deploying the spectrometer and a RGB camera in tandem, triggering both simultaneously. Camera and spectrometer could be aligned and calibrated in the laboratory to determine the spectrometer field of view in the camera image. The camera imagery could then be utilized to accurately calculate the position and pointing of the UAV using the structure from motion approach used in this study to evaluate the pointing accuracy (Section 2.2).
The UAV system in combination with the “mAngle” software enables users to plan, setup and perform a multiangular flight around a center point of interest efficiently and quickly (in less than 30 min, 10 min for the measurement flight itself). In addition, the UAV and spectrometer system is deployed in a single, easily portable package, making it highly mobile. Since the completion of this study, the system has been deployed at a number of other sites in Europe and New Zealand.
The large radius and thus big footprint of the UAV ensures a good averaging over the fine structure of the vegetation (e.g., leaves, shaded areas, stems). This was assessed by calculating standard deviation of multiple spectra at the same waypoint (Figure 6) and shows good agreement of consecutive spectra taken at the same WP. If smaller footprints are desired the flying radius can be reduced or the spectrometer can be equipped with a fore optic with a narrower FOV.
The results of the multiangular reflectance measurements acquired in this study are consistent with previous measurements characterizing common angular reflectance distribution over vegetation [46]. The common hotspot feature is clearly visible in the data and changes over time with sun angle. High levels of reflectance were found at the rather low tilt angle of 20° in the heading of the hotspot. As the tilt angle is lower than the hotspot feature, these high levels might be introduced by a viewing angle, whereas only the very top of the canopy is seen by the sensor (Figure 9). Along with the results of our accuracy assessment of UAV imagery pointing and of the spectral domain response, we are confident that we have utilized a novel platform-sensor combination to acquire a valid and valuable hyperspectral dataset.
The complete spectrum analysis emphasizes that BRDF effects are both wavelength and angle dependent. Around the hot spot the measured reflection is higher than in nadir, in both in the VIS and NIR part of the spectrum. For WPs towards the dark spot the reflectance is lower in most parts of the VIS and higher in the NIR. Overall, lower sensor tilt angles increase reflectance compared with the nadir position. While the NDVI reduces angular effects quite efficiently, these effects were a significant factor in TCARI. This distinction can be ascribed primarily to the differing formula structures of the two VIs. For the NDVI, the reflectance in the NIR dominates the nominator of the formula. Thus the differences due to the observation angle influence the index nominator and denominator in similar ways and the entire ratio only slightly changes. The TCARI formula does not provide such normalization. The reflection factors at the wavelength of the first part of the term (R700–R760) are differently influenced by the angle (Figure 8) and introduce strong fluctuations to the VI. Minor influences are introduced by the second term. The first part (R700–R550) of the second term is not strongly influenced, since both reflection factors of the wavelengths are affected similarly by the angle. However, the second component of TCARI again uses the R700 and R760 band ratio. This increases the variations in the second term of the formula caused by the differing observation angles. In combination, these factors produce the significant differences (up to 150 percent), which are seen in the TCARI values. Differing observation angles cause only minor fluctuations in REIP values. As seen with NDVI, formula deviation normalizes most of the variation in REIP values. However, it must be emphasized that, as for most VIs, the practical dynamic range of the REIP is narrower than what is theoretically possible. Thus even the small observation angle variances suggested by the REIPs results could lead to errors in interpreting this index if BRDF effects are disregarded. Other studies have been carried out for other VIs or vegetation cover [47,48,49,50] support the angular dependency found in this study.
Radiative transfer models show significant potential as tools for correcting angular influences introduced by solar effects or imaging sensors. They are based on existing theory of radiative transfer and plant physiology [22]. So far, real world multiangular data for various vegetation covers are rare and thus, a rigorous validation of the model is challenging. With the approach described in this study datasets for the validation and improvement of those methods may be generated. However, it has to be taken into account that SCOPE does not account for certain sensor variables such as FOV and FWHM. Due to the footprint of the spectrometer, light reflected at different angles by the canopy is collected by the sensor. Thus, this might be one source for the increasing discrepancies towards low tilt angles observed in this study. Following studies could minimize this effect by using spectrometer fore optics with narrower FOV. A careful investigation on the difference between modeled and measured spectra go beyond the scope of this study but should be investigated in the future.
Based on this study, we strongly encourage the extensive compilation of multiangular datasets for various vegetation cover types and environments. A more sophisticated knowledge base regarding vegetation angular effects could also enable researchers to derive accurate complementary information through the use of angular measurements that capture vegetation features not typically visible from a nadir perspective [12]. Additionally, these results could help to understand influences of BRDF effects in imaging spectroscopy. Typically, current hyperspectral (image-frame and push broom) imaging systems as well as RGB systems have a FOV of up to 50° [35]. Thus, pixels captured towards the edges of the image have tilt angles of about 66°. As shown here, angular effects have a significant contribution to these observation angles and need to be taken into account during analysis. To improve the correction of these effects consecutive studies should examine tilt angles found in the FOV of common UAV and airborne sensors. This is foreseen within a number of parallel research activities that are ongoing and focused on improving models and collecting spectral databases. These include COST Action ES0903 EUROSPEC, COST Action ES1309 OPTIMISE, and the SPECCHIO online spectral database [33]. These projects could also serve as a basis for enhanced training of models leading to highly accurate correction methods.
5. Conclusions
This study presents a novel hyperspectral (338 to 823 nm) goniometer system based on an unmanned aerial vehicle (UAV) and specifically developed software. The approach allows measurements over inaccessible areas and without disturbing the surface cover. Using the system in an exemplary field experiment, we test the positioning and spectral accuracy (VIS < 6% CV, NIR < 1.5% CV) While a larger footprint can be analyzed, this UAV system does not provide the same absolute pointing accuracy as common ground based goniometers. With the presented field data we highlight the influence of angular effects on the spectrum (0.6 to 3 fold relative difference) and vegetation indices (up to more than 1.5 fold relative difference) and thus the necessity for correction of angular effects in remote sensing data. Radiative transfer models like SCOPE represent an opportunity for angular corrections, but differ especially for low tilt angles from the UAV goniometer data. The fast and flexible UAV goniometer contributes a technique to assess angular effects over any given land cover with low efforts. Based on this assessment of relevant reflection parameters a new way of UAV-driven plant parameter retrieval by the inclusion of oblique angels could be developed. Finally, we hope to contribute additional understanding to the broad and complex topic of BRDF in vegetation.
Acknowledgments
The authors thank Christian van der Tol for the preparation of the SCOPE exercise used in this study. Also, the authors acknowledge the funding of the CROP.SENSe.net and PhenoCrops project in the context of the Ziel 2-Programms NRW 2007–2013 “Regionale Wettbewerbsfähigkeit und Beschäftigung” by the Ministry for Innovation, Science and Research (MIWF) of the state North Rhine Westphalia (NRW) and European Union Funds for regional development (EFRE) (005-1103-0018). We also acknowledge the contribution of Mr. Joseph Scepan of Medford, Oregon, USA, in producing this document.
Author Contributions
Andreas Burkart developed the measurement system and participated in data analysis that was designed and led by Helge Aasen. Luis Alonso created multiangular flight patterns and contributed practical expertise in bidirectional effects characterization and spectrometer calibration. Gunter Menz gave essential scientific advice and contributed a major part of lecturing of the manuscript. Georg Bareth participated in spectral data analysis and interpretation and discussion of the results. Uwe Rascher did supervise the methodologies and provided the fundamental question that led to the research.
Conflicts of Interest
The authors declare no conflict of interest.
References
- Milton, E.J. Review article principles of field spectroscopy. Remote Sens. 1987, 8, 1807–1827. [Google Scholar] [CrossRef]
- Tian, Y.; Dickinson, R.E.; Zhou, L.; Zeng, X.; Dai, Y.; Myneni, R.B.; Knyazikhin, Y.; Zhang, X.; Friedl, M.; Yu, H. Comparison of seasonal and spatial variations of leaf area index and fraction of absorbed photosynthetically active radiation from Moderate Resolution Imaging Spectroradiometer (MODIS) and Common Land Model. J. Geophys. Res 2004, 109. [Google Scholar] [CrossRef]
- Gnyp, M.L.; Yu, K.; Aasen, H.; Yao, Y.; Huang, S.; Miao, Y.; Bareth, G. Analysis of crop reflectance for estimating biomass in rice canopies at different phenological Stages Reflexionsanalyse zur Abschätzung der Biomasse von Reis in unterschiedlichen phänologischen Stadien. Photogramm. Fernerkund. Geoinf. 2013, 2013, 351–365. [Google Scholar] [CrossRef]
- Yu, K.; Leufen, G.; Hunsche, M.; Noga, G.; Chen, X.; Bareth, G. Investigation of leaf diseases and estimation of chlorophyll concentration in seven barley varieties using fluorescence and hyperspectral indices. Remote Sens. 2013, 6, 64–86. [Google Scholar] [CrossRef]
- Aasen, H.; Gnyp, M.L.; Miao, Y.; Bareth, G. Automated hyperspectral vegetation index retrieval from multiple correlation matrices with hypercor. Photogramm. Eng. Remote Sens. 2014, 80, 785–795. [Google Scholar] [CrossRef]
- Penuelas, J.; Pinol, J.; Ogaya, R.; Filella, I. Estimation of plant water concentration by the reflectance water index WI (R900/R970). Int. J. Remote Sens. 1997, 18, 2869–2875. [Google Scholar] [CrossRef]
- Mahlein, A.K.; Rumpf, T.; Welke, P.; Dehne, H.W.; Plümer, L.; Steiner, U.; Oerke, E.C. Development of spectral indices for detecting and identifying plant diseases. Remote Sens. Environ. 2013, 128, 21–30. [Google Scholar] [CrossRef]
- Barnes, W.L.; Pagano, T.S.; Salomonson, V.V. Prelaunch characteristics of the moderate resolution imaging spectroradiometer (MODIS) on EOS-AM1. IEEE Trans. Geosci. Remote Sens. 1998, 36, 1088–1100. [Google Scholar] [CrossRef]
- Nicodemus, F.E. Directional reflectance and emissivity of an opaque surface. Appl. Opt. 1965, 4, 767–773. [Google Scholar] [CrossRef]
- Schaepman-Strub, G.; Schaepman, M.E.; Painter, T.H.; Dangel, S.; Martonchik, J.V. Reflectance quantities in optical remote sensing—Definitions and case studies. Remote Sens. Environ. 2006, 103, 27–42. [Google Scholar] [CrossRef]
- Fassnacht, F.; Koch, B. Review of forestry oriented multi-angular remote sensing techniques. Int. For. Rev. 2012, 14, 285–298. [Google Scholar]
- Schlerf, M.; Atzberger, C. Vegetation structure retrieval in beech and spruce forests using spectrodirectional satellite data. IEEE J. Sel. Top. Appl. Earth Obs. Remote Sens. 2012, 5, 8–17. [Google Scholar] [CrossRef]
- Morton, D.C.; Nagol, J.; Carabajal, C.C.; Rosette, J.; Palace, M.; Cook, B.D.; Vermote, E.F.; Harding, D.J.; North, P.R.J. Amazon forests maintain consistent canopy structure and greenness during the dry season. Nature 2014, 506, 221–224. [Google Scholar] [CrossRef] [PubMed]
- Peltoniemi, J.I.; Kaasalainen, S.; Naranen, J.; Matikainen, L.; Piironen, J. Measurement of directional and spectral signatures of light reflectance by snow. IEEE Trans. Geosci. Remote Sens. 2005, 43, 2294–2304. [Google Scholar] [CrossRef]
- Bourgeois, C.S.; Ohmura, A.; Schroff, K.; Frei, H.-J.; Calanca, P. IAC ETH goniospectrometer: A tool for hyperspectral HDRF measurements. J. Atmos. Ocean. Technol. 2006, 23, 573–584. [Google Scholar] [CrossRef]
- Buchhorn, M.; Petereit, R.; Heim, B. A Manual transportable instrument platform for ground-based spectro-directional observations (ManTIS) and the resultant hyperspectral field goniometer system. Sensors 2013, 13, 16105–16128. [Google Scholar] [CrossRef]
- Deschamps, P.-Y.; Bréon, F.-M.; Leroy, M.; Podaire, A.; Bricaud, A.; Buriez, J.-C.; Seze, G. The POLDER mission: Instrument characteristics and scientific objectives. IEEE Trans. Geosci. Remote Sens. 1994, 32, 598–615. [Google Scholar] [CrossRef]
- Barnsley, M.J.; Settle, J.J.; Cutter, M.A.; Lobb, D.R.; Teston, F. The PROBA/CHRIS mission: A low-cost smallsat for hyperspectral multiangle observations of the Earth surface and atmosphere. IEEE Trans. Geosci. Remote Sens. 2004, 42, 1512–1520. [Google Scholar] [CrossRef]
- Comar, A.; Baret, F.; Viénot, F.; Yan, L.; de Solan, B. Wheat leaf bidirectional reflectance measurements: Description and quantification of the volume, specular and hot-spot scattering features. Remote Sens. Environ. 2012, 121, 26–35. [Google Scholar] [CrossRef]
- Qin, W.; Goel, N.S. An evaluation of hotspot models for vegetation canopies. Remote Sens. Rev. 1995, 13, 121–159. [Google Scholar] [CrossRef]
- Andrieu, B.; Baret, F.; Jacquemoud, S.; Malthus, T.; Steven, M. Evaluation of an improved version of SAIL model for simulating bidirectional reflectance of sugar beet canopies. Remote Sens. Environ. 1997, 60, 247–257. [Google Scholar] [CrossRef]
- Tol, C.; Verhoef, W.; Timmermans, J.; Verhoef, A.; Su, Z. An integrated model of soil-canopy spectral radiances, photosynthesis, fluorescence, temperature and energy balance. Biogeosciences 2009, 6, 3109–3129. [Google Scholar]
- Nolin, A.W.; Liang, S. Progress in bidirectional reflectance modeling and applications for surface particulate media: Snow and soils. Remote Sens. Rev. 2000, 18, 307–342. [Google Scholar] [CrossRef]
- Deering, D.W.; Eck, T.F.; Banerjee, B. Characterization of the reflectance anisotropy of three boreal forest canopies in spring–summer. Remote Sens. Environ. 1999, 67, 205–229. [Google Scholar] [CrossRef]
- Burkhart, J.F.; Bogren, W.S.; Storvold, R.; Pedersen, C.A.; Gerland, S. A new measure of BRDF, banking on UAS measurements. In Proceedings of the AGU Fall Meeting Abstracts, San Francisco, CA, USA, 13 December 2010; Volume 1, p. 3.
- Hakala, T.; Suomalainen, J.; Peltoniemi, J.I. Acquisition of bidirectional reflectance factor dataset using a micro unmanned aerial vehicle and a consumer camera. Remote Sens. 2010, 2, 819–832. [Google Scholar] [CrossRef]
- Honkavaara, E.; Markelin, L.; Hakala, T.; Peltoniemi, J. The metrology of directional, spectral reflectance factor measurements based on area format imaging by UAVs. Photogramm. Fernerkund. Geoinform. 2014, 2014, 175–188. [Google Scholar]
- Burkart, A.; Cogliati, S.; Schickling, A.; Rascher, U. A novel UAV-Based ultra-light weight spectrometer for field spectroscopy. IEEE Sens. J. 2014, 14, 62–67. [Google Scholar] [CrossRef]
- Kuusk, J. Dark signal temperature dependence correction method for miniature spectrometer Modules. J. Sens. 2011, 2011. [Google Scholar] [CrossRef]
- Busetto, L.; Meroni, M.; Crosta, G.F.; Guanter, L.; Colombo, R. SpecCal: Novel software for in-field spectral characterization of high-resolution spectrometers. Comput. Geosci. 2011, 37, 1685–1691. [Google Scholar] [CrossRef]
- Grenzdörffer, F.N. UAV based BRDF-measurements of agricultural surfaces with pfiffikus. In Proceedings of the UAV-g 2011, Conference on Unmanned Aerial Vehicle in Geomatics, Zurich, Switzerland, 14 September 2011; Volume XXXVI, pp. 1–6.
- mAngle. Available online: https://github.com/wemperor/mAngle/releases (accessed on 8 January 2015).
- Hueni, A.; Nieke, J.; Schopfer, J.; Kneubühler, M.; Itten, K.I. The spectral database SPECCHIO for improved long-term usability and data sharing. Comput. Geosci. 2009, 35, 557–565. [Google Scholar] [CrossRef]
- Sandmeier, S.R.; Itten, K.I. A field goniometer system (FIGOS) for acquisition of hyperspectral BRDF data. IEEE Trans. Geosci. Remote Sens. 1999, 37, 978–986. [Google Scholar] [CrossRef]
- Lucieer, A.; Malenovský, Z.; Veness, T.; Wallace, L. HyperUAS-imaging spectroscopy from a multirotor unmanned aircraft system. J. F. Robot. 2014, 31, 571–590. [Google Scholar] [CrossRef]
- Quemada, M.; Gabriel, J.; Zarco-Tejada, P. Airborne hyperspectral images and ground-level optical sensors as assessment tools for maize nitrogen fertilization. Remote Sens. 2014, 6, 2940–2962. [Google Scholar] [CrossRef]
- Blackburn, G.A. Spectral indices for estimating photosynthetic pigment concentrations: A test using senescent tree leaves. Int. J. Remote Sens. 1998, 19, 657–675. [Google Scholar] [CrossRef]
- Haboudane, D.; Miller, J.R.; Tremblay, N.; Zarco-Tejada, P.J.; Dextraze, L. Integrated narrow-band vegetation indices for prediction of crop chlorophyll content for application to precision agriculture. Remote Sens. Environ. 2002, 81, 416–426. [Google Scholar] [CrossRef]
- Guyot, G.; Baret, F. Utilisation de la haute resolution spectrale pour suivre l’etat des couverts vegetaux. Spectr. Signatures Objects Remote Sens. 1988, 278, 279–286. [Google Scholar]
- Lichtenthaler, H.K.; Gitelson, A.; Lang, M. Non-destructive determination of chlorophyll content of leaves of a green and an aurea mutant of tobacco by reflectance measurements. J. Plant Physiol. 1996, 148, 483–493. [Google Scholar] [CrossRef]
- Gastellu-Etchegorry, J.P.; Guillevic, P.; Zagolski, F.; Demarez, V.; Trichon, V.; Deering, D.; Leroy, M. Modeling BRF and radiation regime of boreal and tropical forests: I. BRF. Remote Sens. Environ. 1999, 68, 281–316. [Google Scholar] [CrossRef]
- Kennedy, R.E.; Cohen, W.B.; Takao, G. Empirical methods to compensate for a view-angle-dependent brightness gradient in AVIRIS imagery. Remote Sens. Environ. 1997, 62, 277–291. [Google Scholar] [CrossRef]
- Wanner, W.; Strahler, A.; Hu, B.; Lewis, P.; Muller, J.; Li, X.; Schaaf, C.; Barnsley, M. Global retrieval of bidirectional reflectance and albedo over land from EOS MODIS and MISR data: Theory and algorithm. J. Geophys. Res.-Atmos. 1997, 102, 17143–17161. [Google Scholar] [CrossRef]
- Schlapfer, D.; Richter, R.; Feingersh, T. Operational BRDF effects correction for wide-field-of-view optical scanners (BREFCOR). IEEE Trans. Geosci. Remote Sens. 2015, 53, 1855–1864. [Google Scholar] [CrossRef]
- Peltoniemi, J.I.; Hakala, T.; Suomalainen, J.; Honkavaara, E.; Markelin, L.; Gritsevich, M.; Eskelinen, J.; Jaanson, P.; Ikonen, E. Technical notes: A detailed study for the provision of measurement uncertainty and traceability for goniospectrometers. J. Quant. Spectrosc. Radiat. Transf. 2014, 146, 376–390. [Google Scholar] [CrossRef]
- Strub, G.; Beisl, U.; Schaepman, M.; Schlaepfer, D.; Dickerhof, C.; Itten, K. Evaluation of diurnal hyperspectral HDRF data acquired with the RSL field goniometer during the DAISEX’99 campaign. ISPRS J. Photogramm. Remote Sens. 2002, 57, 184–193. [Google Scholar] [CrossRef]
- Kuusk, A. The angular distribution of reflectance and vegetation indices in barley and clover canopies. Remote Sens. Environ. 1991, 37, 143–151. [Google Scholar] [CrossRef]
- Epiphanio, J.N.; Huete, A.R. Dependence of NDVI and SAVI on sun/sensor geometry and its effect on fAPAR relationships in alfalfa. Remote Sens. Environ. 1995, 51, 351–360. [Google Scholar] [CrossRef]
- Leblanc, S.G.; Chen, J.M.; Cihlar, J. NDVI directionality in boreal forests: A model interpretation of measurements. Can. J. Remote Sens. 1997, 23, 369–380. [Google Scholar] [CrossRef]
- Verrelst, J.; Schaepman, M.E.; Koetz, B.; Kneubühler, M. Angular sensitivity analysis of vegetation indices derived from CHRIS/PROBA data. Remote Sens. Environ. 2008, 112, 2341–2353. [Google Scholar] [CrossRef]
© 2015 by the authors; licensee MDPI, Basel, Switzerland. This article is an open access article distributed under the terms and conditions of the Creative Commons Attribution license (http://creativecommons.org/licenses/by/4.0/).