Abstract
This paper presents two algorithms used to derive Aerosol Optical Depth (AOD) from a synergy of satellite and ground-based observations, as well as aerosol transport model output. The Spinning Enhanced Visible Infrared Radiometer (SEVIRI) instrument on board Meteosat Second Generation (MSG) allows us to monitor aerosol loading over land at high temporal and spatial resolution. We present the algorithms which were fed with the data acquired via the SEVIRI channel 1, and also channels 1 and 3 in conjunction. In both cases, the surface reflectance is the most important parameter that should be estimated during the retrieval process. The surface properties are estimated during days with a low AOD (less than 0.1 at 500 nm) based on the radiance measured by the SEVIRI detector and aerosol optical properties modeled with the aerosol transport model or measured by the MODIS sensor. For data from the model and the MODIS, ground-based stations equipped with a sun photometer have been applied to correct the AOD fields using the optimal interpolation method. By assuming that surface reflectance at the SEVIRI resolution changes slowly over time, the AOD has been computed. Comparison of the SEVIRI AOD with the sun photometer observations shows good agreement/correlation. The mean bias is small (an order of 0.01–0.02) and the root mean square (rms) is about 0.05 for both one- and two-channel methods. In addition, the rms for the one-channel method does not change with the AOD.1. Introduction
As one of the most important components of the atmosphere, aerosols have recently become a subject of intensive research. However, current knowledge about the impact of aerosols on climate is insufficient, and uncertainties in the estimated values of radiative forcing are high [1]. Problems with imprecise estimation of the impact of aerosols on climate systems are caused by a lack of scientific understanding of the role of aerosols in atmospheric processes as well as by a shortage of reliable observations. Ground-based measurements of aerosol properties are quite accurate but still limited by their spatial distribution. Satellite detectors allow us to expand the set of aerosol data [2]. The first algorithms for aerosol satellite remote sensing were created for the ocean area only. Initially, algorithms for the AVHRR instrument (Advanced Very High-Resolution Radiometer) on board the NOAA polar-orbiting satellites [3], and for the SeaWIFS detector (Sea-viewing Wide Field-of-view Sensor) placed on SeaStar [4], were developed. The retrieval of aerosol properties over land is more challenging due to higher surface reflectance, its temporal variability, spatial inhomogeneity but also due to anisotropic bidirectional reflectance of land surfaces, which induces higher uncertainties of retrieved parameters. Satellite retrievals usually focus on aerosol optical depth (AOD) estimation. Methods of AOD retrieval over land from the Total Ozone Mapping Spectrometer (TOMS) [5,6] and from Moderate Resolution Imaging Spectroradiometer (MODIS) [2,7,8] measurements have been developed. More recent studies provide results from the up-to-date detectors such as MISR, POLDER, OMI and SCHIAMACHY [2,9,10].
Nevertheless, despite their good spatial resolution (about 1 km), polar satellites have insufficient temporal resolution caused by their long revisit time (from several hours to several days). Other possibilities to monitor aerosol loading over land at high temporal resolution are offered by geostationary satellites. The first results of the AOD retrieval from geostationary satellite measurements were obtained for the Geostationary Meteorological Satellite 5 (GMS5) data collected over the West Pacific Ocean during the Aerosol Characterization Experiment (ACE-Asia) [11]. In the case of another Asian geostationary satellite, the Multi-functional Transport Satellite (MTSAT-1R), visible and mid-IR channels were used in the AOD retrieval [12]. For the western hemisphere, measurements are made by the Geostationary Operational Environmental Satellite (GOES), for which an AOD retrieval algorithm was presented by Zhang et al. [13], and recently a new version of the algorithm that uses data from two geostationary satellites, GOES-West and GOES-East [14], was developed.
Europe is monitored by the Meteosat geostationary satellites with the SEVIRI instrument on board. SEVIRI measures radiance in 12 channels with high time resolution (15 min) and relatively good spatial resolution (3 km in nadir for channels 1–11, 1 km in nadir for the HRV channel). This characteristic gives a good opportunity to expand the aerosol data set for Europe. On the other hand, a small number of visible channels, as well as the lack of an IR channel with a wavelength over 2 μm, causes difficulties in defining surface reflectance. In the algorithm proposed by Popp et al. [15], it is assumed that the surface characteristics at each image location do not change during the observation period of 31 days, and that there is at least one observation under “aerosol-free” conditions for each pixel and each acquisition time. The Satellite Application Facilities (SAF) operational algorithm uses data in visible (0.6 μm) and near infrared (1.6 μm) channels [16,17]. The algorithm construction includes the assumption that the top of the atmosphere reflectance increases with the aerosol load, which is untrue only in the case of absorbing aerosols above bright surfaces [18]. The surface reflectance estimation is based on choosing the minimum TOA reflectance in a 14-day period. Another methodology was presented by Goevartes et al. [19], who proposed a joint retrieval method of surface reflectance and AOD from MSG SEVIRI with an optimal estimation approach. This method utilizes knowledge about measured daily solar radiation and the assumption that surface properties do not change significantly during the day, which allows for separation of an atmospheric signal and retrieval of the AOD. A method for obtaining a daily estimate AOD over the continents was described by Carrer et al. [20]. As properties of land surface are more stationary than those of atmosphere, the temporal dimension is exploited for the simultaneous retrieval of the surface and aerosol bidirectional reflectance distribution function (BRDF). Another type of algorithm uses the far-IR channels to estimate dust AOD [21]. Brindley and Russell [22] developed a method to estimate the Infrared Difference Dust Index from the brightness temperature measured by SEVIRI at 10.8 μm. The next algorithm, the Oxford-Ral Aerosol and Cloud (ORAC) scheme, uses an optimal estimation approach and allows the retrieved AOD, aerosol effective radius and surface albedo to vary simultaneously to calculate the retrieved state with the maximum probability, whilst accounting for both measurements and a priori data and uncertainties in both [23]. The retrieval developed by Mei et al. [24] is based on a time-series technique, which makes use of two visible bands at 0.6 and 0.8 μm in three orderly scan times. In this case, the surface properties estimation technique takes into account the assumption that the ratio of the reflectance in the solar band for two subsequent observations may be well approximated by the ratio of the reflectance at 1.6 μm.
One way of improving the quality of retrieved aerosol properties is a synergy of data from different instruments. Detectors placed on satellites assembled in the Afternoon Constellation (A-Train) [25] are a good example of this approach. Recently, studies on the joint use of satellite and ground-based observations, collected within the AERONET network, have also been conducted [26–28]. This allows for an improvement in surface properties estimation. In the algorithm proposed by Bennouna and Leeuw [29], for example, surface properties were estimated for days with low aerosol content in the atmosphere. Nevertheless, this solution requires information about the aerosol background, which is acquired either from the AERONET or the ENVIST-AATSR.
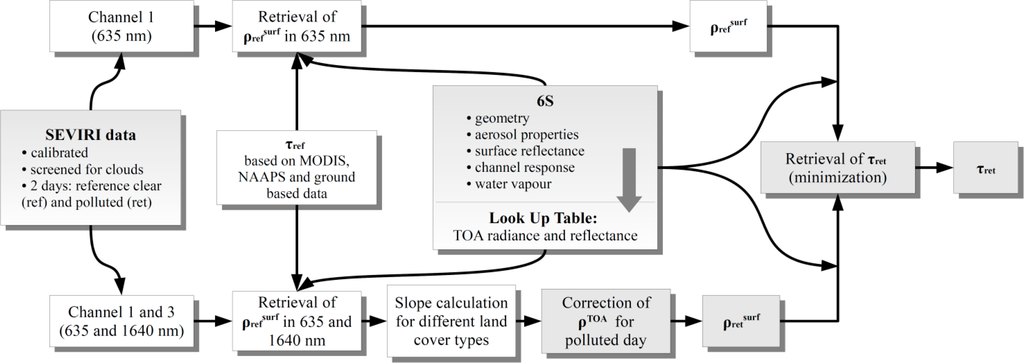
Large number of uncertainties of the AOD retrieved over land [18] as well as poor temporal resolution of polar orbiting satellites, which are often used for the AOD observations, lay at the foundation for the motivation for this study. In addition, a small number of aerosol monitoring stations in the Central-Eastern part of Europe, where the AOD is relatively high [30], causes problems with the study of the spatial and temporal variation of AOD and radiative forcing. Therefore, the main objective of this paper is to find ways of improving the satellite retrieval of the surface reflectance and the AOD over land. In order to do this, we will apply the SEVIRI based information as well as the additional data from surface measurements and other satellite observations or aerosol transport models. This paper describes one- and two-channel methods, which allow retrieving AOD at a spatial resolution of about 5 × 5 km and at a frequency of once every 15 min. In both algorithms the surface reflectance is estimated for reference clear days (days with small AOD) from the SEVIRI top-of-atmosphere (TOA) reflectance and the spatial distribution of AODs obtained from MODIS observations or from the aerosol transport model (Figure 1). The main advantage of such methods is the ability to use the optimal interpolation method [31] to correct the AOD defined for reference clear days from ground-based measurements before the surface reflectance minimization. This method allows to reduce the uncertainties related to the MODIS or aerosol transport model errors and to improve the AOD retrieval.
Such estimated surface reflectance is used to retrieve the AOD several days before and after the reference day. The section below gives an overview of the instrumentation and the data that are used for both methods. Section 3 describes the methodology of AOD retrieval in the case of one- and two-channel algorithms. Section 4 includes results of uncertainty and limitation studies. The last two sections present validation of the results and final conclusions.
2. Instrumentation and Data
2.1. SEVIRI Data
The SEVIRI instrument on board Meteosat Second Generation 2 (MSG2) offers good capabilities to monitor aerosol loadings over land at high temporal and spatial resolutions. The MSG2 is a geostationary satellite developed by the European Organization for the Exploitation of Meteorological Satellites (EUMETSAT) in collaboration with the European Space Agency. The SEVIRI collects data in 12 spectral channels, between 0.635 and 13.4 μm, with very high temporal resolution (15 min). Spatial resolution for sub-satellite point is 3 km for channels 1–11, and 1 km in the last channel (HRV—High Resolution Visible channel). Due to the scan geometry, the spatial resolution for the area of Poland is about 5.5 and 3 km for the two channel groups, respectively. In this study, a spatial resolution of 5.5 km was used. Specifically, a SEVIRI pixel is a 6.8 × 3.6 km rhomboid. In the presented retrieval of aerosol properties, we decided to use the radiance measurements in channels 1 (visible channel: 635 nm) and 3 (shortwave infrared channel: 1640 nm) of the SEVIRI.
2.2. AOD Data Used for the Estimation of Surface Reflectance on the Reference Day
2.2.1. MODIS Data
In order to minimize the influence of aerosol loading on retrieved surface reflectance, the AOD data from MODIS (Moderate Resolution Imaging Spectroradiometer) were used. The MODIS instrument is mounted on board the Aqua and Terra satellites. The satellite-based data are averaged for each day and gridded to 10 × 10 km spatial resolution. The data from level 2 of the MOD04_L2 (Terra) and MYD04_L2 (Aqua) product of collection 05 and 051 have been used [32]. The overpasses for Poland take place between 08:00 and 11:30 UTC. In addition, to minimize errors related to high optical air mass, only data collected at a satellite zenith angle lower than 60° have been taken into account. The AOD uncertainty for the MODIS land (reflectance smaller than 0.25) retrieval is ±0.05 + 0.15 τ [33,34]. The main contribution to the satellite AOD uncertainty for land retrieval is related to the sub-pixel surface albedo variability [34,35] and its high value [36]. In addition, the majority of land surfaces are highly anisotropic, which increases the AOD uncertainty [37].
2.2.2. Surface Observations
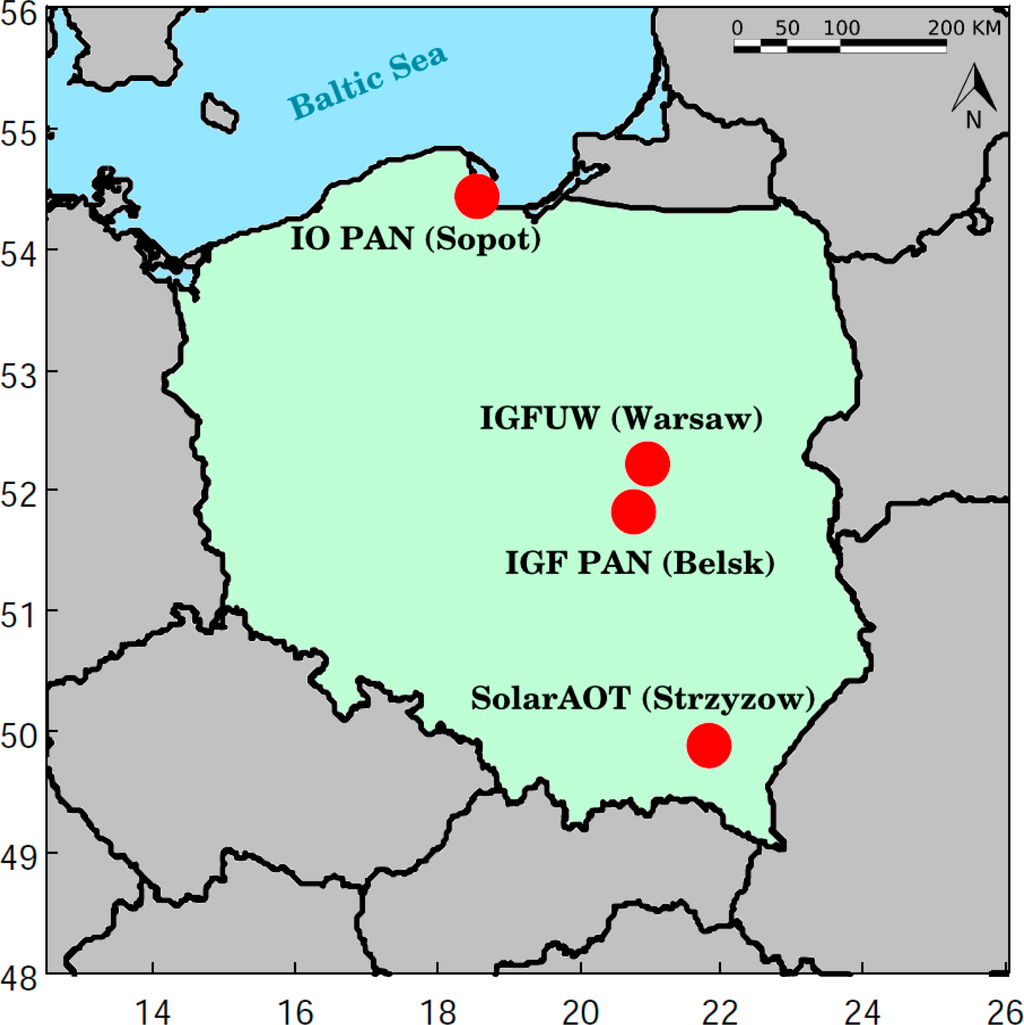
Because of the significant uncertainty of the AOD retrieved from the MODIS data, we corrected this information using surface observations. For this purpose, the AOD measurements from Belsk, Sopot, Warszawa and Strzyzow were used (Figure 2). The Belsk and Strzyzow (since August 2013) stations belong to the AERosol RObotic NETwork-AERONET [38] and beside Belsk, the three stations belong to the Poland-AOD national network [39]. The AERONET is one of the most widespread aerosol networks [40], which uses CIMEL Electronique 318A sun photometers [41]. These are multi-channel, automatic sun-and-sky scanning radiometers that measure the direct solar irradiance and sky radiance at the Earth’s surface. Solar radiation is measured at seven wavelengths (380, 440, 500, 675, 870, 936 and 1020 nm). The AOD is retrieved from six channels. For the purpose of this paper we present data from level 2.0 of the data quality assurance. The Poland-AOD [42] was officially established in 2011, but observations of aerosol optical properties and radiation fluxes have been performed since 2007. This network currently includes three stations: Sopot (Baltic coast), Warsaw (central Poland, urban type) and Strzyzow (southeast part of Poland, rural mountain type). Multifilter Rotating Shadowband Radiometers (MFR-7) are used to measure the AOD within the Poland-AOD [43]. These instruments have six narrow-band channels (415, 500, 610, 675, 870 and 940 nm) and one broadband channel to measure direct, diffuse and total solar radiation. In addition to the continuous MFR-7 measurements, irregular observations with hand-held Microtops sun photometers [44,45] are performed. These instruments provide the AOD from the direct solar measurements at 380, 500, 675, 870 and 1020 nm. An important issue in data quality assurance involves the proper calibration of the sun photometers. The calibration coefficient of the Microtops instruments was derived during different field campaigns and routine calibrations within the Poland-AOD network. The calibration coefficient may produce a significant systematic error, in particular for small solar zenith angles. However, in the case of our Microtopses, the calibration coefficients did not change significantly between Langley calibrations. Therefore, the AOD uncertainty estimated based on the Langley calibration coefficient variability and signal standard deviation was ±0.01 for all channels. The MFR-7 instruments are regularly calibrated in situ with the Langley method [46]. However, due to the significant degradation of diffuser and filter optical properties that influence the channel sensitivity, as well as to the temporal cosine zenith correction, the uncertainty of the retrieved AOD is higher than that of the Microtops instruments. Based on the sensitivity study, and in comparison to the CIMEL instrument, it was estimated at the level of ±0.025.
In this study, we used AOD values in the SEVIRI channels with wavelengths of 635 and 1640 nm. Initial AODs were converted to the above-mentioned wavelengths with use of the Ångstrom exponent α obtained from the AERONET data, defined as a linear fit of the logarithm of the AOD to the logarithm of wavelength:
In calculations for the 635 nm channel, data for two wavelengths was used (500 and 675 nm). In the case of the 1640 nm channel, we used data for four wavelengths (500, 675, 870 and 1020 nm).
2.2.3. NAAPS Data
The Navy Aerosol Analysis and Prediction System (NAAPS) [47] has been used to predict the spatial distribution of the AOD and aerosol species. The current version of NAAPS includes gaseous SO2 and four aerosol components: mineral dust, sea salt, particulate sulphates (SO4) and smoke. The total biomass burning mass (smoke class) is converted to 95% organic and 5% soot aerosols [30], and therefore we have five aerosol types (sulphates, soot, sea salt, dust and water soluble). Aerosol optical properties such as the AOD, single scattering albedo, asymmetry parameter and Ångstrom exponent for each aerosol type are computed every six hours based on optical interface [30]. For each of the aerosol species, source areas and values of emission from the Earth’s surface are parameterized. The emitted aerosol undergoes advection by large-scale flow and diffusion by turbulent processes, and it is removed from the atmosphere via dry deposition and precipitation processes. The horizontal resolution used in the NAAPS simulations is 1 × 1 degree and vertical 25 sigma-coordinate levels are employed.
2.3. Look-Up Tables
Because of the large number of pixels connected with the relatively high spatial resolution of the SEVIRI data, the retrieval of the AOD for the whole territory of Poland is time consuming. The most common way of handling this problem is to simulate the TOA radiance and to store it in arrays commonly referred to as look-up tables (LUT). For simulations of satellite observations, we use the 6S (Second Simulation of a Satellite Signal in the Solar Spectrum) radiative transfer model [48,49] in vector version released in 2005 (6SV1.0B). The radiative transfer equation solution is based on successive orders of scattering (SOS) approximations [50]. The 6S radiative transfer code has been written in the Fortran language, and it enables observation simulation for many different factors that influence transfer of radiation in the atmosphere, including the optical properties of the atmosphere and surface, among others. Calculations can be conducted for wavelengths of the range 0.25–4 μm for cloudless sky only. The accuracy of radiative transfer calculations varies with the number of calculation angles and layers. By default, 6SV1.0B uses the “standard accuracy” conditions, which provide the user with a relative average accuracy of approximately 0.4%–0.6%, compared to standard benchmarks and other radiative transfer codes [49].
As a result of simulations, the LUTs for two channels (635 nm and 1640 nm) were prepared. The eight most important parameters were taken into account, with values and ranges presented in Table 1. First of all, geometrical conditions had to be characterized. The position of the sun and the satellite are described by three angles: solar zenith angle (θs), relative azimuth angle (Δφ) and view zenith angle (θv). For simulations, only angles respective for Poland were used (see Table 1). The next step is to determine the atmospheric properties. We assumed that the amount of ozone in the stratosphere over Poland is constant and equals 350 DU. In the case of water vapor, calculations were made for two values: 0.5 and 4 g/cm2. Vertical profiles of ozone and water vapor were taken from the US62 profile proposed in the 6S model. Calculation of atmospheric correction requires describing the aerosol optical properties. In the LUT simulations, the following parameters were taken into consideration: AOD, single scattering albedo, asymmetry parameter and phase function. Since the AOD over Poland is usually in the range of 0.05–0.9 (at 500 nm), we specified 21 values with an irregular step. The chosen AODs cover also aerosol content both lower (from 0.02 at 635 nm) and higher (up to 0.806 at 635 nm) than average. The single scattering albedo is the ratio of scattering efficiency to total extinction efficiency. Calculations were made for values of the single scattering albedo from the range of 0.8–1 with the step of 0.05. The asymmetry parameter, which is a measure of the preferred scattering direction (forward or backward) for the light encountering the aerosol particles, has values from 0.55–0.75 with the step of 0.05. The probability of a photon being scattered into a given solid angle, described by a phase function was characterized by the asymmetry parameter with use of the Henyey-Greenstein equation [51]. The structure of the LUTs is a result of a compromise between the size of matrix, time of calculation and steps of parameters.

2.4. Additional Data
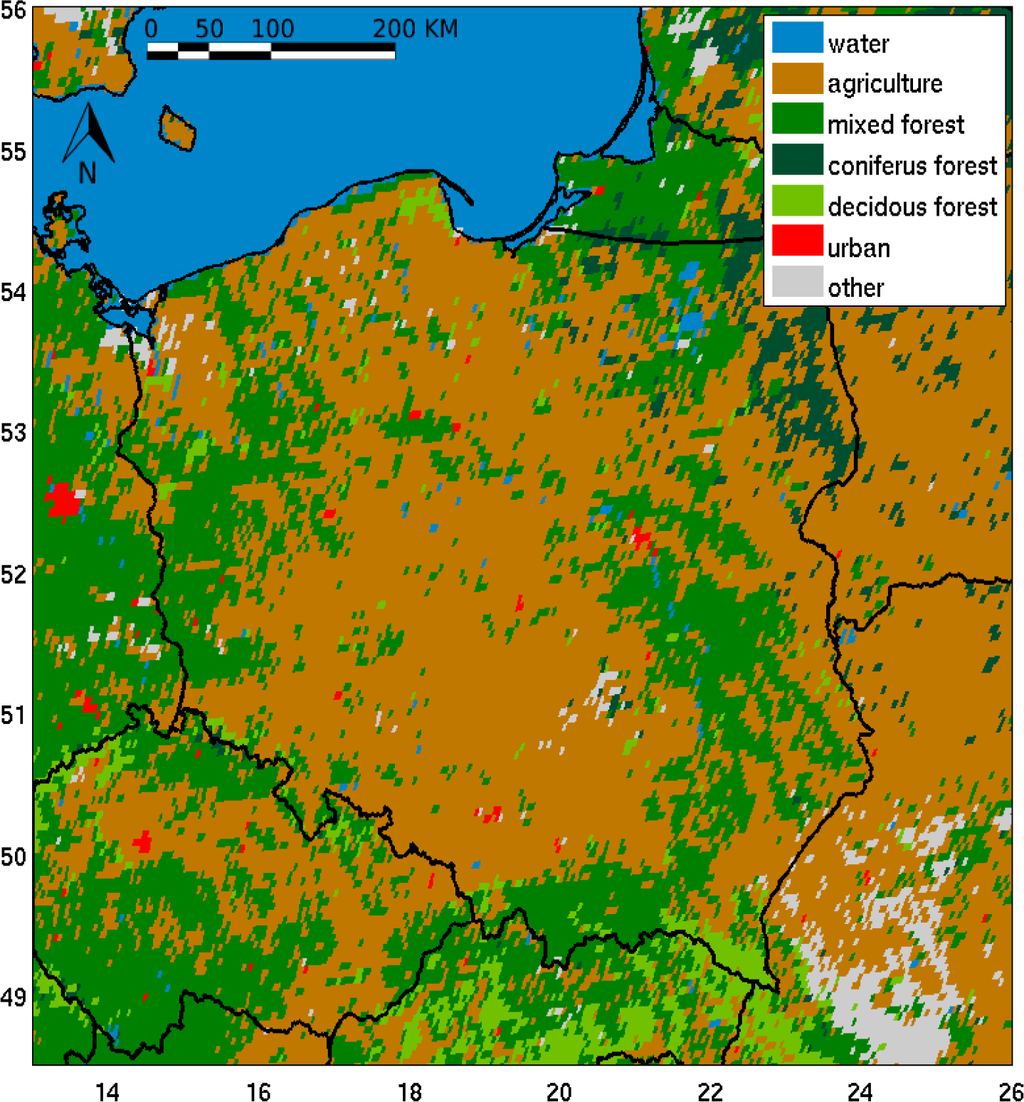
The retrieval of the AOD requires information about surface optical properties as well as the type of land cover. For this purpose, data from the Land Cover Map for Europe [52] created by the USGS (United States Geological Survey) was used to define areas of different surface cover types in Poland. Based on a high-resolution map (1 km spatial resolution), the most frequent types of land covers for boxes of the SEVIRI resolution size (about 5 × 5 km) were chosen (Figure 3). The acquired data allowed us to estimate the surface reflectance as described in the next section.
3. Methodology of the AOD Retrieval
We propose two algorithms to derive aerosol optical properties from the synergy of satellite and ground-based observations (Figure 1). In both versions of the algorithm, the first step involves the removal of cloud-contaminated pixels. In order to classify pixels we used the cloud mask created and programmed by Riedi and Nicolas [53] for the SEVIRI measurements. The calculation scheme required the following data: reflectance (channels: 635, 865 and 1640 nm), variance of reflectance (box of 3 × 3 pixels, channels: 635 and 865 nm) and brightness temperature (channels: 3.9, 8.7, 10.8 and 12 μm). As a result, the pixels are marked with numbers from 0–4 (0—clear, 1—probably clear, 2—probably cloud, 3—cloud, 4—edge of cloud). For further calculations, only pixels specified as 0 or 1 were taken into account. Pixels marked as “probably clear” were taken into consideration because, for early morning hours, due to the sun geometry and thus high air mass of the atmosphere, clear pixels are often labeled with Flag 1. The next step is to provide surface reflectance which is the main difficulty in the determination of aerosol optical properties over land. For this purpose, we used two different methods.
3.1. One Channel Method
To estimate the surface reflectance, we used the SEVIRI radiance and aerosol optical properties defined for a day with a very low AOD (reference clear day). Furthermore, in order to analyze spatial variability of the AOD as reference to clear days, we chose only ones when at least half of Poland was cloud free. Even if the AOD is low (below 0.1 at 500 nm) and the impact of the AOD is relatively low (see Section 4), the elimination of influence of atmospheric components, in particular atmospheric aerosols, on the reflectance measured by satellite is still essential. For this purpose, we used spatial distribution of the AOD (τref) obtained from the NAAPS model or the MODIS measurements additionally corrected by the surface observations collected at four stations (see Section 3.3).
The next part of the algorithm concerns minimization of the function defined as the difference between satellite and model radiance stored in the LUT for 635 nm. As an outcome, surface reflectance (ρcsurf) for the reference clear day in channel 635 nm was retrieved for each cloud free pixel. To perform the minimization, the MatLAB fminbnd function was applied. This algorithm is based on the golden section search method and parabolic interpolation [54]. The aerosol single scattering albedo and asymmetry parameter were taken from the NAAPS model. In addition, we also tested the constant single scattering albedo of 0.96 and asymmetry parameter obtained from the simple relation with the Ångstrom exponent measured by sun photometers [55]. In the case of water vapor content, we made an assumption of 1 g/cm2 but this value has a marginal impact on the TOA radiance at 635 nm.
The last part of the one channel algorithm is related to the retrieval of the AOD based on minimizing the same function as the one described above for polluted days. In this case, we assume that surface reflectance at the SEVIRI resolution does not change with time for a specific pixel. Therefore, we can use previous results to calculate the AOD for the few following or previous polluted days.
3.2. Two Channel Method
The second method is based on information about land cover from the Land Cover Map for Europe [52]. After cloud screening, we defined areas of different surface cover types in Poland. The next step provides us with the most frequent type of land cover for boxes 10 × 10 km. For the reference clear day, the surface reflectance at the wavelengths of 635 and 1640 nm is retrieved, similarly as in the one channel method. Afterwards, surface reflectance for each surface cover type in channels 635 and 1640 nm is used to compute the linear regression. For the AOD retrieval we assume that the obtained linear relationship between the reflectance in channels 1 and 3 does not change significantly over several days (about 2 weeks). In addition, we assume that the aerosol has negligible impact on the TOA reflectance at 1640 nm, even for a high AOD at visible range both for reference and retrieval days. This allowed us to estimate the surface reflectance at 1640 nm from the TOA radiance observation. Based on the linear relationship estimated for the reference clear day, the surface reflectance at 635 nm was then computed. Finally, the AOD at 635 nm was retrieved similarly as in the one-channel method. In the case of the two-channel algorithm, we did not lose information from pixels that were covered by clouds on the reference day.
3.3. Estimation of AOD Spatial Distribution for Reference Days
In this section, we describe an optimal interpolation methodology [31,56–58], which was used to compute the AOD spatial field used in the inversion algorithms.
The vector of the corrected AOD xa can be obtained as a perturbation of uncorrected (background field) xb from
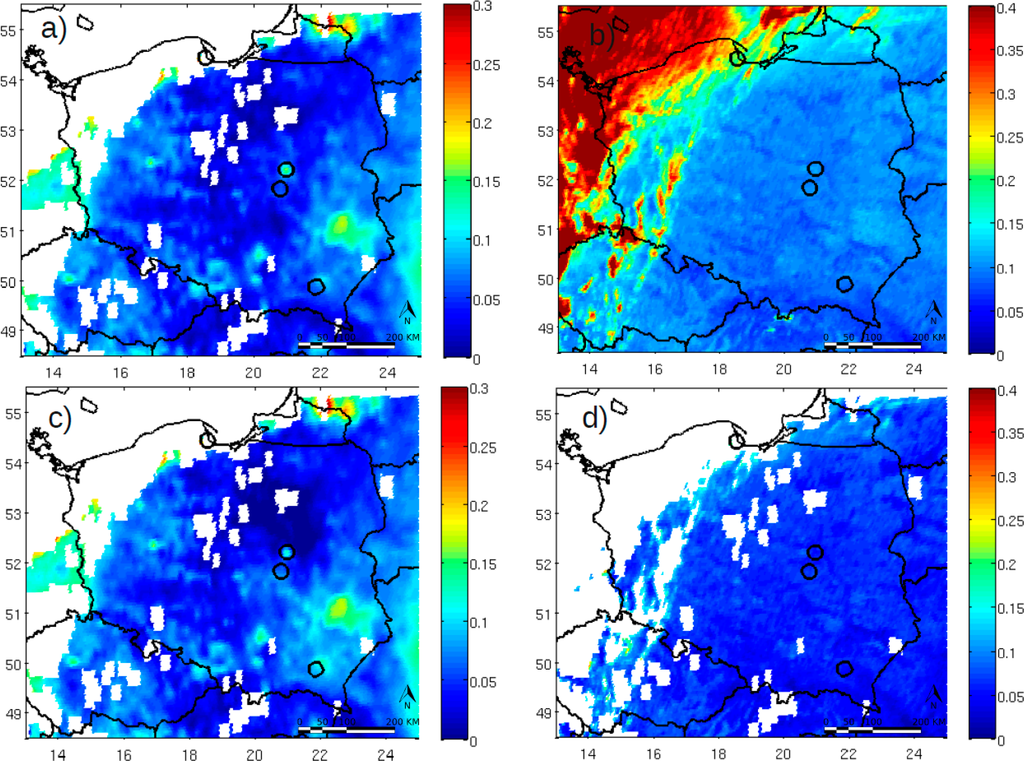
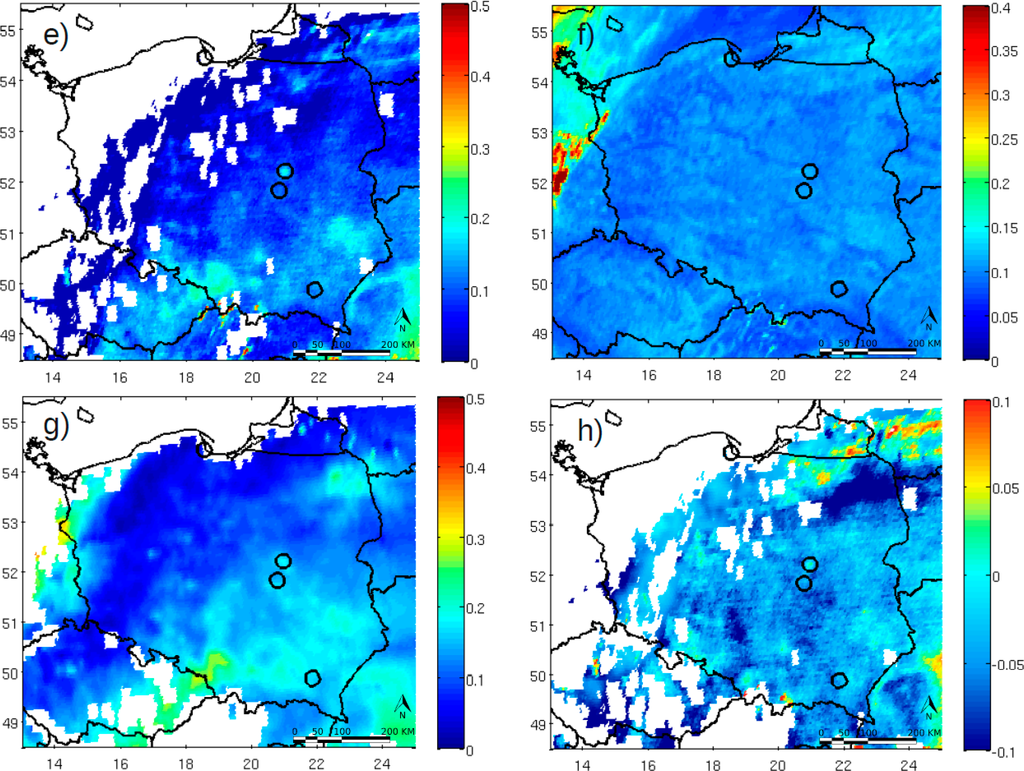
Exemplary successive steps of the surface reflectance and AOD estimations are presented in Figure 3. For the clear reference day, differences between the aerosol optical depth from MODIS before (Figure 4a) and after optimal interpolation (Figure 4c) are shown. TOA reflectance and estimated surface reflectance are shown on Figure 4b,d, respectively. In the case of the retrieval day, AOD SEVIRI (Figure 4e) and MODIS (Figure 4g) were compared. Figure 4h shows the differences between 0.02 and −0.02 for most parts of Poland. Additionally, a map of TOA reflectance is presented (Figure 4f).
4. Sensitivity Study and Estimation of Uncertainties
In order to determine the sensitivity of the retrieved AOD to the assumed input parameters, several tests were carried out. First of all, we described tests concerning the influence of the assumed AOD on the reference clear day (τref) on the retrieved AOD for the polluted day (τret). The results, presented in Table 2, indicate that the impact of τref is relatively low, in particular when the difference as regards aerosol content between clear and polluted days is high (τret = 0.5). In this case, uncertainties in the retrieved AOD vary between 2% (for ±0.01 error in the assumed τref) and 8%–9% (for ±0.05 error in the assumed τref). On the other hand, when the retrieval is done throughout the day with the AOD of 0.2, the uncertainties in the computed AOD vary from 4%–23%, for error in the τref of 0.01 and 0.05, respectively. Thus, even for high AOD uncertainties (±0.05), during the clear reference days the retrieved values have small errors, especially for polluted atmosphere.
In the subsequent tests, the influence of perturbation of the aerosol single-scattering properties (single scattering albedo ω, asymmetry parameter g), surface reflectance ρsurf and geometry parameters (solar zenith θs and relative azimuth Δφ angles) on the retrieved AOD was estimated. For surface reflectance sensitivity, we took into account only its absolute value and we omitted the non-homogeneity and non-Lambertian cases. Regarding geometry, we focused on the morning (θs = 60°, Δφ = 100°) and midday (θs = 30°, Δφ = 0°) conditions, and regarding surface reflectance we considered three values (0.02, 0.05 and 0.1 at 550 nm). The test results are presented in Table 3 for three different AODs (0.2, 0.5 and 1.0). For the given perturbation of both ω and g (±0.05), there is a noticeable (about 3%–7%) difference between the AODs obtained for morning and midday geometries, in particular, for higher values of surface reflectance (up to 35%). In general, uncertainties of the retrieved AOD in this case vary from 9%–17% for early morning and from 12%–35% for midday conditions, and both for a surface reflectance between 0.02 and 0.05. Again, when high values of the surface reflectance are considered, the differences increase to 50%. The presented values are calculated for relatively high (±0.05) ω and g errors. For the perturbation of ±0.02 (not shown in the table), during morning conditions, uncertainties in the retrieved AOD range as little as 3%–8%. Finally, we focus on surface reflectance uncertainties in the AOD retrieval. In this case, sun and satellite geometry play the most important role due to the impact on the surface reflectance and scattering geometry. For morning conditions, the error of the retrieved AOD is about 12%–16% for a relatively clear day (AOD = 0.2), about 5% for a more polluted day (AOD = 0.5), and about 3% for a highly polluted day (AOD = 1), regardless of the ±0.01 surface reflectance uncertainties (Table 3). On the other hand, when midday conditions are applied, the difference between the retrieved and actual AOD is more than 50% for AOD = 0.2, about 16%–28% for AOD = 0.5, and only 7%–10% for AOD = 1. In general, the retrieved AOD uncertainty increases with surface reflectance. For the MSG2 geometry for Poland, the surface reflectance has a diurnal cycle with a minimum close to 7–8 UTC and maximum around 14 UTC. The maximum is related to the strong hot-spot effect for vegetation land cover. In addition, the error of the retrieved AOD decreases with AOD due to the fact that for polluted atmosphere the surface reflectance has little impact on the TOA reflectance.
In addition, in the case of the two-channel algorithm, we tested the sensitivity of the retrieved AOD due to the assumption that aerosol has a negligible impact on the TOA radiance. Our calculations show that the AOD error corresponding to this effect is small. For the Ångstrom exponent of 1.5 and 0.5, the uncertainties of the retrieved AOD were 0.15% and 1.1%, respectively, while the 500 nm AOD was 0.2 and 1.1% and 4.1%, while the 500 nm AOD was 0.5. Even for the high AOD and low Ångstrom exponent, the uncertainties of the retrieved AOD are significantly smaller than in the case of other contributions.
Finally, the total uncertainty of the retrieved AOD was estimated. For this purpose, we assumed that the AOD for the reference clear day, single scattering albedo, asymmetry parameter and TOA reflectance all contributed significantly to the AOD uncertainty. If we assume that the uncertainties of these quantities are independent, we can estimate the retrieval error from the following equation:
5. Results and Discussion
The data presented in this section were obtained from observations performed between 2009 and 2012. In general, the calculation described below was made for days with low surface reflectance to eliminate snow conditions. The SEVIRI AOD validation was done for three ground-based stations and against the MODIS and the NAAPS data. For this purpose, we selected eight reference days, which were used to compute the AOD during 34 days between 05:00 and 10:00 UTC. In the case of the surface stations, we compared the SEVIRI AOD from the nearest pixel. To compare satellite data, we interpolated the MODIS data to SEVIRI pixels with a resolution of about 5.5 km.
5.1. AOD Validation in the Framework of the Poland-AOD Network
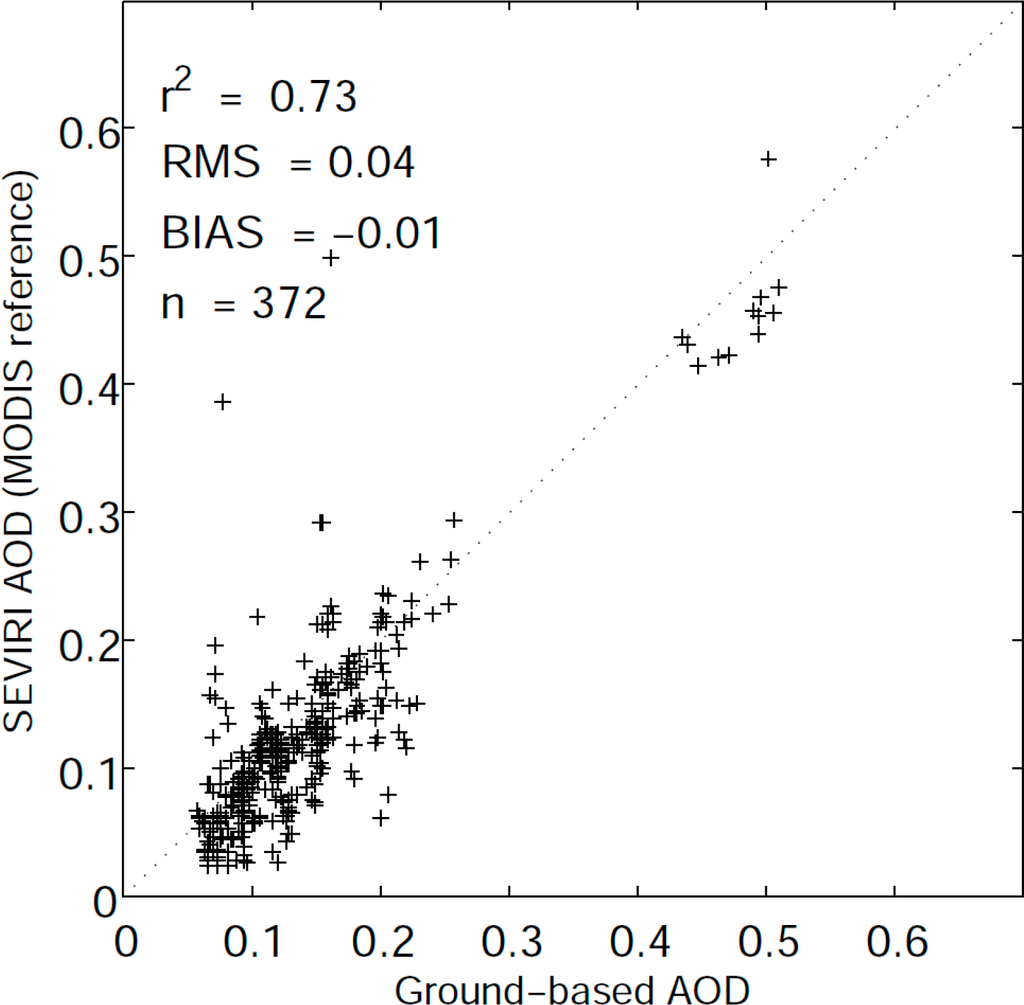
Figure 5 shows a comparison of the AOD at 635 nm retrieved from the SEVIRI and observed by the CIMEL sun photometer at the Belsk station. The crosses mark the SEVIRI data obtained using the MODIS aerosol optical properties data to define the aerosol optical properties for the reference clear days. The mean difference between SEVIRI and CIMEL is about 0.01, while the root mean square (rms, not bias corrected) is 0.04 in the case of the MODIS data. Near to zero mean bias indicates that there is no systematic difference between the satellite and surface data. A statistical analysis of the difference between the SEVIRI and CIMEL data shows that for 26%–28% of observations it is less than 0.01 and for 49% it is less than 0.02. On the other hand, in 19% of cases the AOD difference is larger than 0.05, and only in 3% of cases it exceeded 0.1. For the Belsk station, the rms decreased slightly from 0.055 for the AOD of less than 0.05–0.036 for the AOD of between 0.15 and 0.25. For the large AOD, the rms showed some fluctuation, probably due to the small amount of data. This relationship is a consequence of the surface reflectance sensitivity for the computed AOD. For large AOD, the uncertainty of the surface reflectance has little impact on the retrieved AOD.
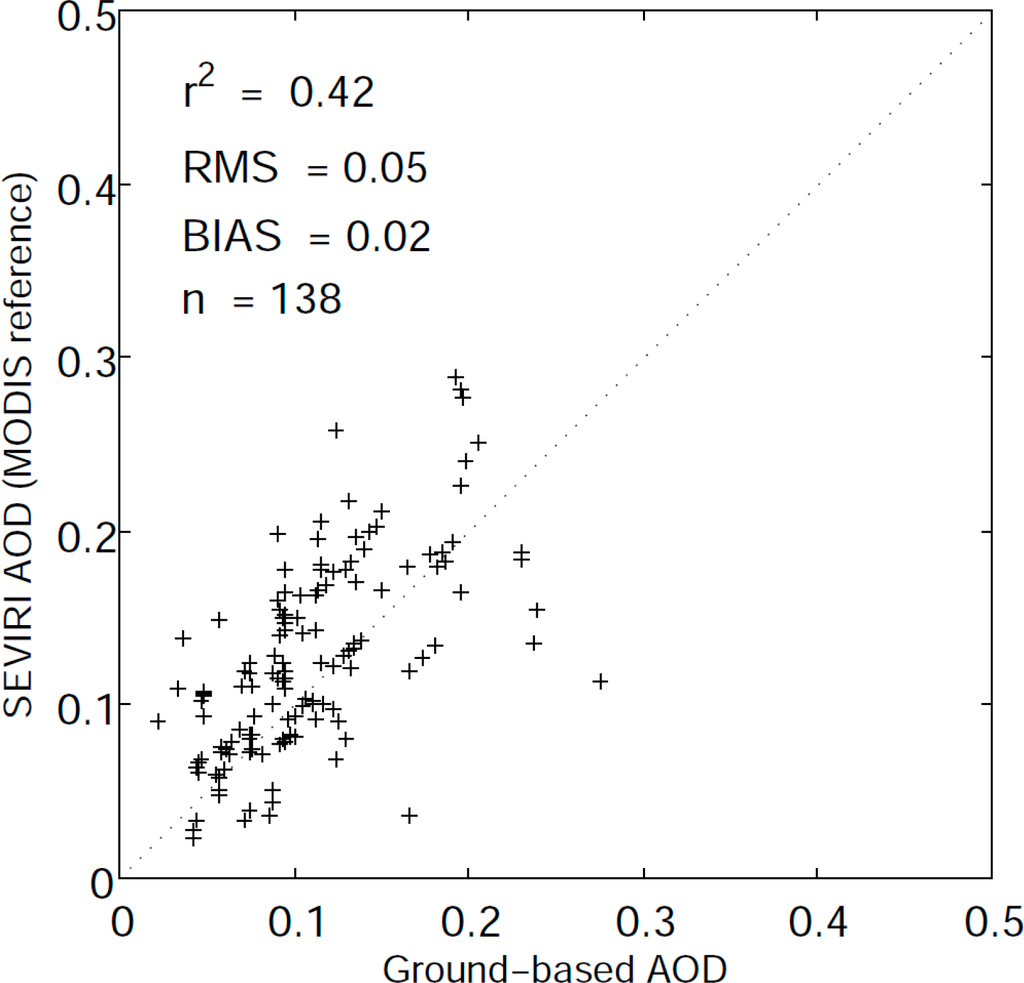
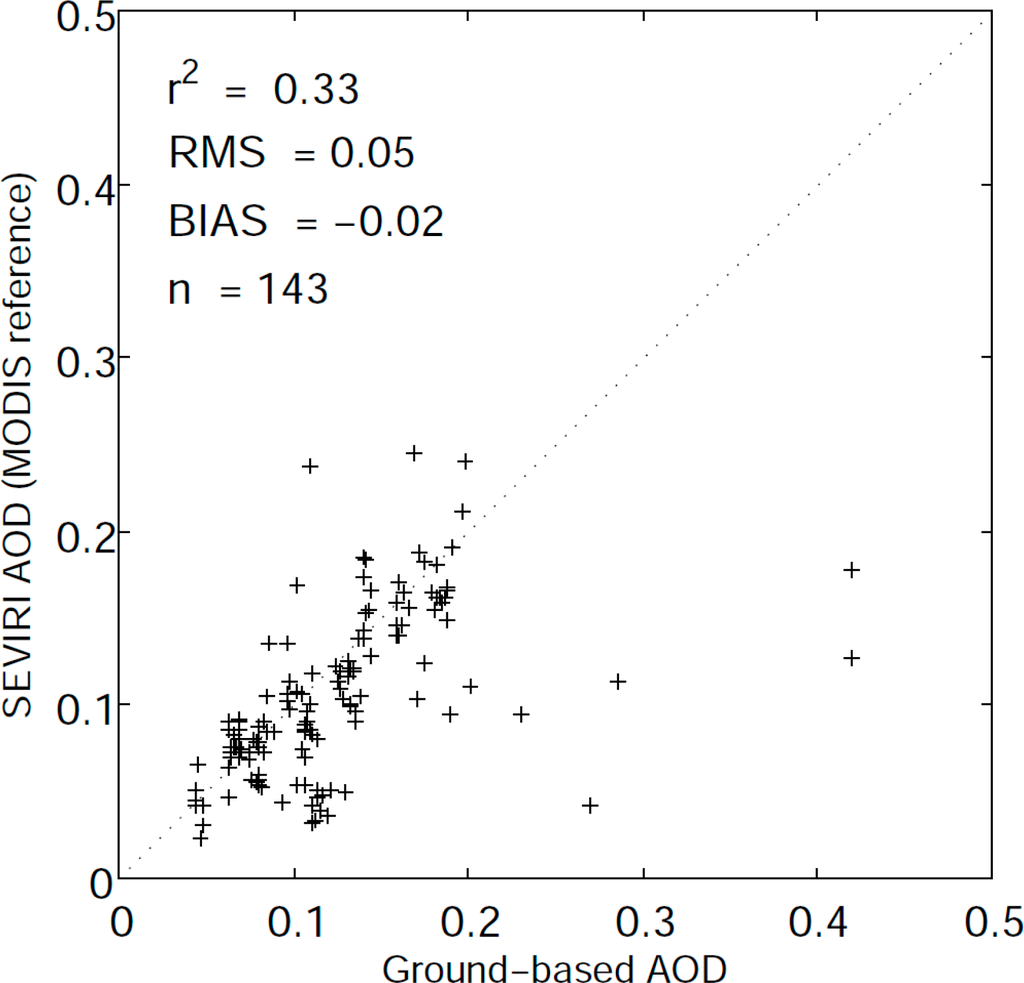
Figures 6 and 7 present a comparison of the SEVIRI with the MFR-7 radiometer AOD for the Warsaw and Strzyzow stations, respectively. In both cases, the time period is shorter compared to the Belsk station and includes only data from 2011 and 2012. For this reason, the Warsaw and Strzyzow data do not show as high AODs as the Belsk station, and this is probably one of the reasons why the squared correlation coefficient is significantly lower in comparison to the Belsk results. The second explanation may be the uncertainty of the ground-based instruments. In the case of CIMEL, at the Belsk station it is ±0.01 but for MFR-7 in Warsaw and Strzyzow it is ±0.025. However, we cannot see any large differences in the rms between the CIMEL and MFR-7 stations. In Warsaw, the rms is 0.05 and in Strzyzow the rms is 0.05. The mean bias varies between −0.02 and 0.02 for both stations.
The comparison of the AOD from SEVIRI and CIMEL at the Belsk station for the two-channel method is shown in Figure 8. In this case, the surface reflectance was estimated based on the MODIS AOD spatial distribution. We found that the statistical parameters are similar to the one-channel method. For example, the mean bias is slightly negative (−0.02), the rms is 0.05 and the determination coefficient is 0.68.
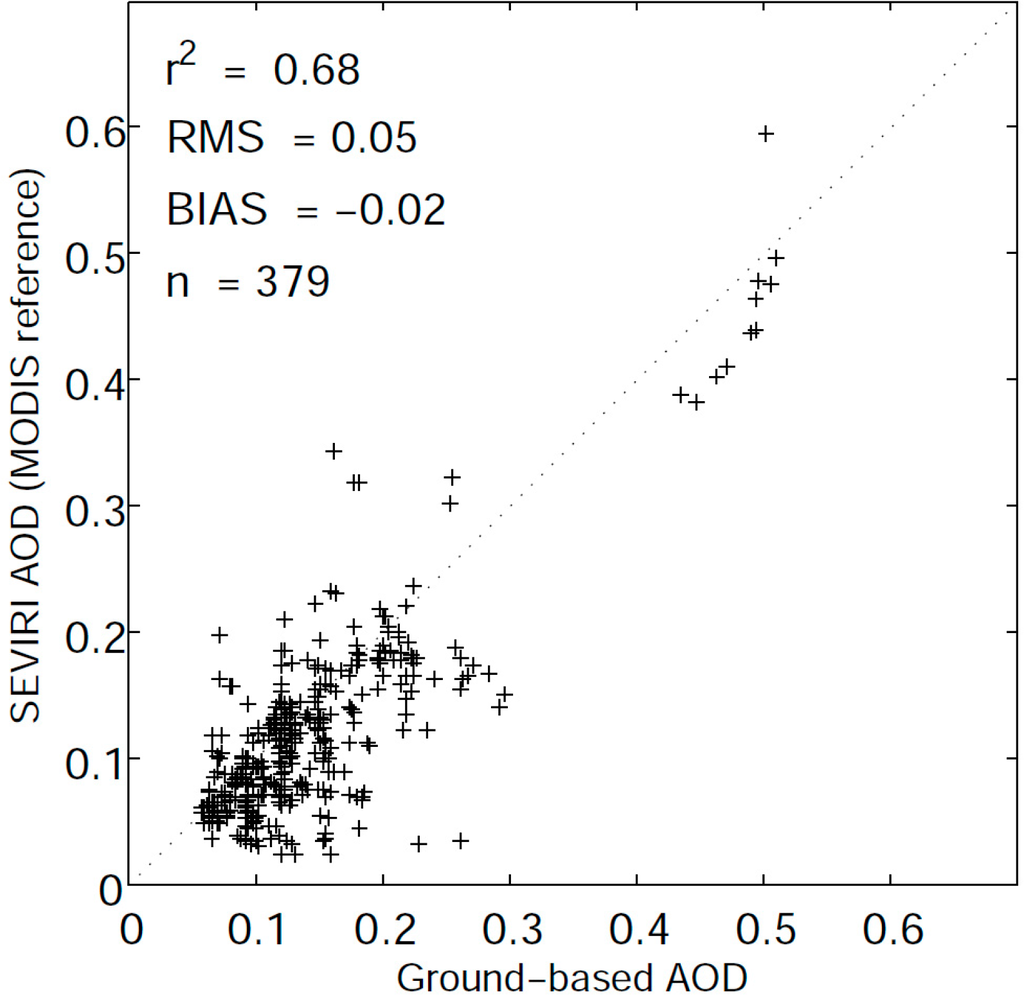
In all described cases (Figures 5 and 8), several agglomerations of points in shape of vertical lines can be observed. To find a reason for the mentioned structures as well as for the outlying ones for the Belsk station, we computed the relation of rms and differences between values of parameters measured by CIMEL and assumed in algorithm (single scattering albedo, asymmetry parameters, Ångstrom exponent). The influence of the number of days between the reference date and the retrieval day was also analysed.
The received results show only a small rms variation, between 0.04 and 0.05, which indicates that we cannot say that the large uncertainty connected with the assumed single scattering albedo or asymmetry parameter or Ångstrom exponent is responsible for the significant AOD error. The same applies to the assumption of the time invariant surface reflectance. We have not found premises that observed structures are connected to the presented algorithms. Despite tests that were carried out, we cannot provide explanation for the presence of mentioned agglomerations of points at the moment. However, the one possible explanation for that can be subpixel clouds which are usually removed from the ground-based AOD observation but can produce clear sky TOA reflectance bias in the SEVIRI measurements.
Due to the algorithm construction, any source of the AOD data can be used to define the aerosol optical properties for clear reference days. As an example, the results obtained using the NAAPS model data are presented in Table 5. Lower than in the case of the MODIS, the spatial resolution is not a significant limitation since the spatial variance of AOD is small during the reference days. Furthermore, by using the model data we do not lose pixels that were clouded on the reference day. In the case of the NAAPS data, the rms is about 0.05 and mean bias is close to zero for all stations. The small difference between the MODIS and the NAAPS cases stems from the methodology. In the case of ground-based stations, the AOD for the reference days is obtained from the optimal interpolation, where data from the MODIS/NAAPS are corrected by photometer observations. Therefore, the AOD that is used to estimate the surface reflectance is almost the same for pixels close to the sun photometric stations.
5.2. Comparison of the SEVIRI AOD with the MODIS and the NAAPS Data
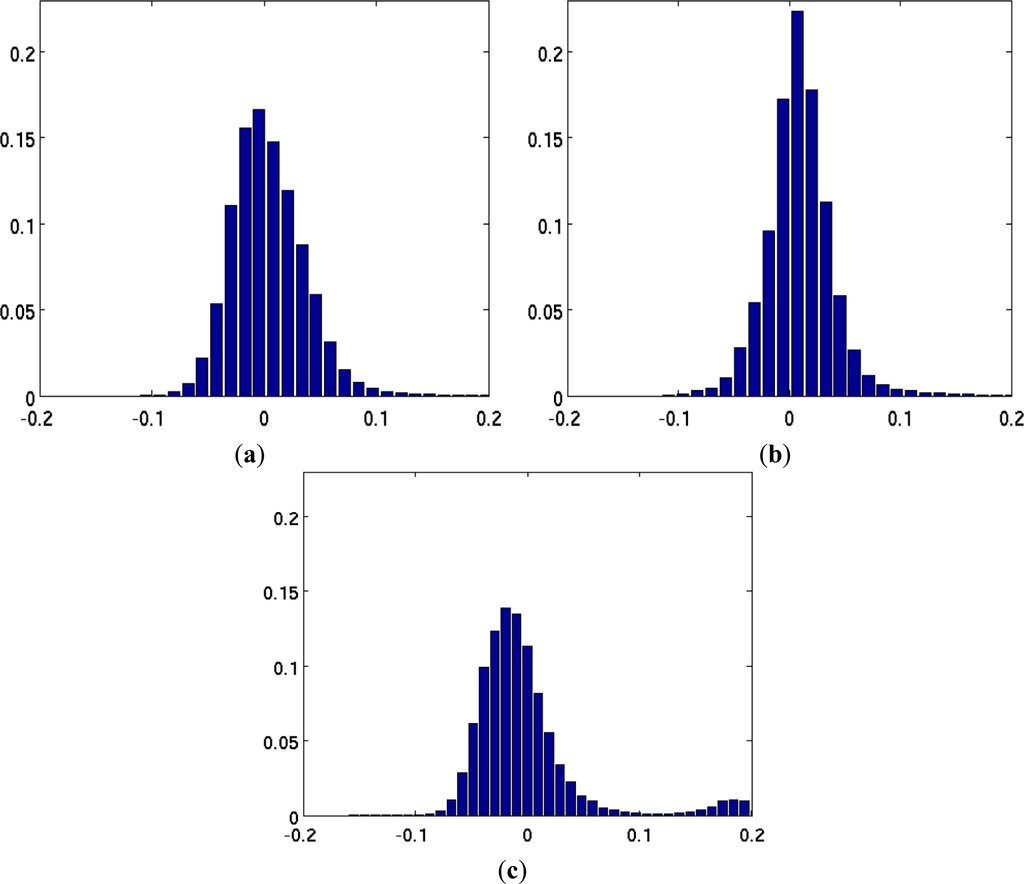
In this section, we present the results of the AOD validation against the MODIS and the NAAPS data. Figure 8a,b show the probability of density function (pdf) for the 635 nm AOD difference between the SEVIRI, the MODIS and the NAAPS data obtained for Poland between 2009 and 2012 for the one-channel method. In the case of the MODIS data, the AOD at 635 nm was estimated from values retrieved at 550 nm and based on the Ångstrom exponent measured within the framework of the Poland-AOD network activities. The statistical distribution of the AOD difference has a nearly Gaussian shape with a mean value of less than 0.01 and standard deviations of 0.035 and 0.031 for the MODIS and the NAAPS data, respectively (Table 6). In the case of the one-channel method, in 49% and 56% of the SEVIRI observations the AOD difference is less than 0.02 for the MODIS and the NAAPS results, respectively. For every fourth measurement this difference is smaller than 0.01. Only in 11% and 8% of measurements is the AOD difference greater than 0.05 and only in 1% of the SEVIRI data is the AOD difference is larger than 0.01. Thus, the one-channel method shows relatively small difference with the MODIS satellite observations (rms = 0.035) and with the NAAPS aerosol transport model (rms = 0.032). In the case of the two-channel method, the pdf has a similar shape (Figure 9c) and statistics (Table 6). Although the mean bias is close to zero (0.001), the standard deviation and rms are close to 0.05. For 23% and 44% of the measurements, the AOD difference is smaller than 0.01 and 0.02, respectively. For 14% and 6% of cases, the AOD difference is greater than 0.05 and 0.1, respectively. The slightly wider pdf for the two-channel method can be explained by the assumption that the relationship between surface reflectance for channels 1 and 3 for the same (strictly speaking the most frequent one) surface type. In a real case, the same surface type can have a slightly different relationship, for example due to the different vegetation state. Some improvement can be made by the parameterization of the relationship of channels 1 and 3 by the Normalized Difference Vegetation Index (NDVI) [55].
5.3. Case Study
To discuss the spatial differences of the AOD we selected three days: 4 and 30 April and 1 May 2009, with small cloud contamination over Poland. The SEVIRI retrieval of the AOD was done based on the surface reflectance computed for the reference day of 2 April (in the case of 4 April) and 28 April 2009 (in the case of 30 April and 1 May). For both reference days, the 500 nm AOD was about 0.08 and 0.1, respectively. On 4 April, a hazy condition was observed over almost the entire region of Poland.
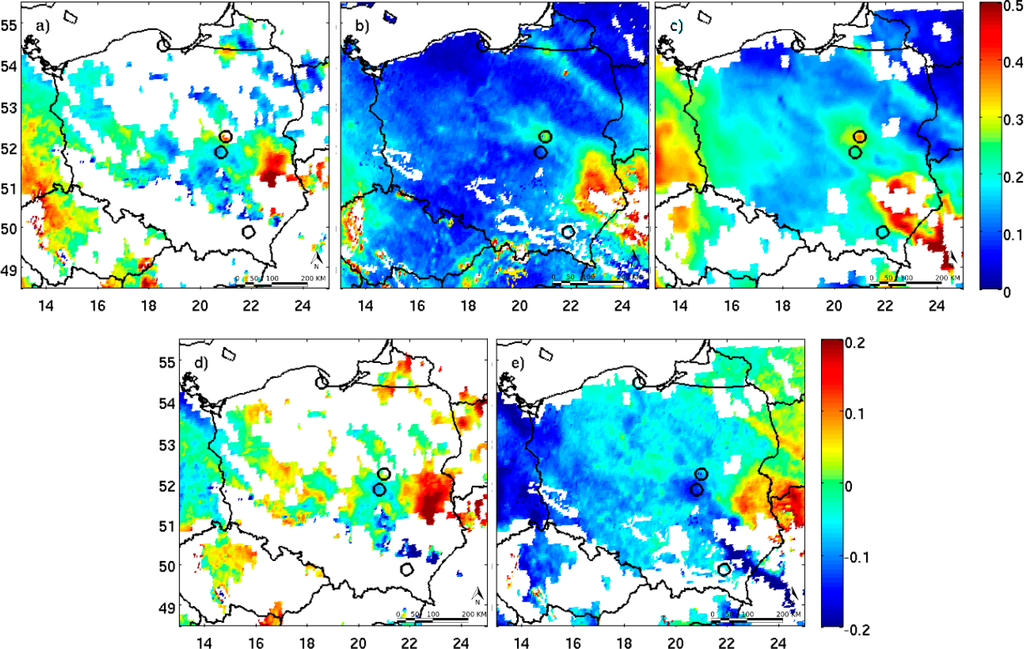
The relatively clear polar air masses were strongly transformed over Central Europe due to anthropogenic emission in the very slow anticyclone circulation and under large subsidence [42]. The back-trajectories from the NOAA-HYSPLIT (Figure 10) [62] which ended in Warsaw at 12:00 UTC show that the air mass at 500 m (blue dots) and 3000 m (blue open squares) took about 70 h and 65 h, respectively, to travel across Poland (and partly Slovakia, the Czech Republic and eastern Germany) before it reached Warsaw. During the night from 3–4 April, the WMO Legionowo station (about 20 km from Warsaw) reported a very strong and low-level inversion with a temperature jump of 10.2 °C in the surface layer with a depth of 80 m. This situation as well as the local emission are responsible for the significant spatial distribution of the AOD greater aerosol concentration close to the surface. Figure 11a shows profiles of the aerosol backscatter coefficient at 1064 nm measured between 00:00–01:00 UTC (solid line) and between 19:00–20:00 UTC (dotted line) obtained from the CHM15K ceilometer in Warsaw. Both profiles indicate a high value of the aerosol backscatter coefficient close to the surface (0.01–0.02 km−1·sr−1) and a significant decrease with altitude. The atmosphere above 1.2 km was very clean. Figures 12 and 14 shows the SEVIRI AOD obtained for 1- and 2-channel methods on 4 (Figure 12a,b) and 30 (Figure 13a,b) April and 1 May (Figure 14a,b), as well as the SEVIRI and the MODIS difference for both algorithms. The spatial distribution of the SEVIRI AOD obtained by the one-channel method (Figure 12a) includes a lot of gaps due to cloudy conditions on the reference day (2 April). However, the two-channel method provided almost a full set of the AOD data (Figure 12b). The AOD varies between 0.1 and 0.55 with a maximum over southeast Poland. The local maxima are visible close to large Polish cities (e.g., Warsaw, Poznan, Lodz, Wroclaw) but also in Berlin, Dresden and Prague. To determine the difference between the SEVIRI and the MODIS AOD we computed the MODIS AOD (Figure 12c) at 635 nm from the AOD at 550 nm and the Ångstrom exponent measured only by CIMEL at the Belsk station. In 2009, data from the Poland-AOD network was not yet available. The AOD difference in the case of both algorithms changes significantly between −0.2 and 0.2 (Figure 12d,e). However, for the majority of pixels the difference is less than ±0.05, and negative values dominate in the western and positive ones in the eastern part of the region. For the area close to the Belsk station, the difference between the SEVIRI and CIMEL AOD is 0.01 and −0.04 for the one- and two-channel methods, respectively.
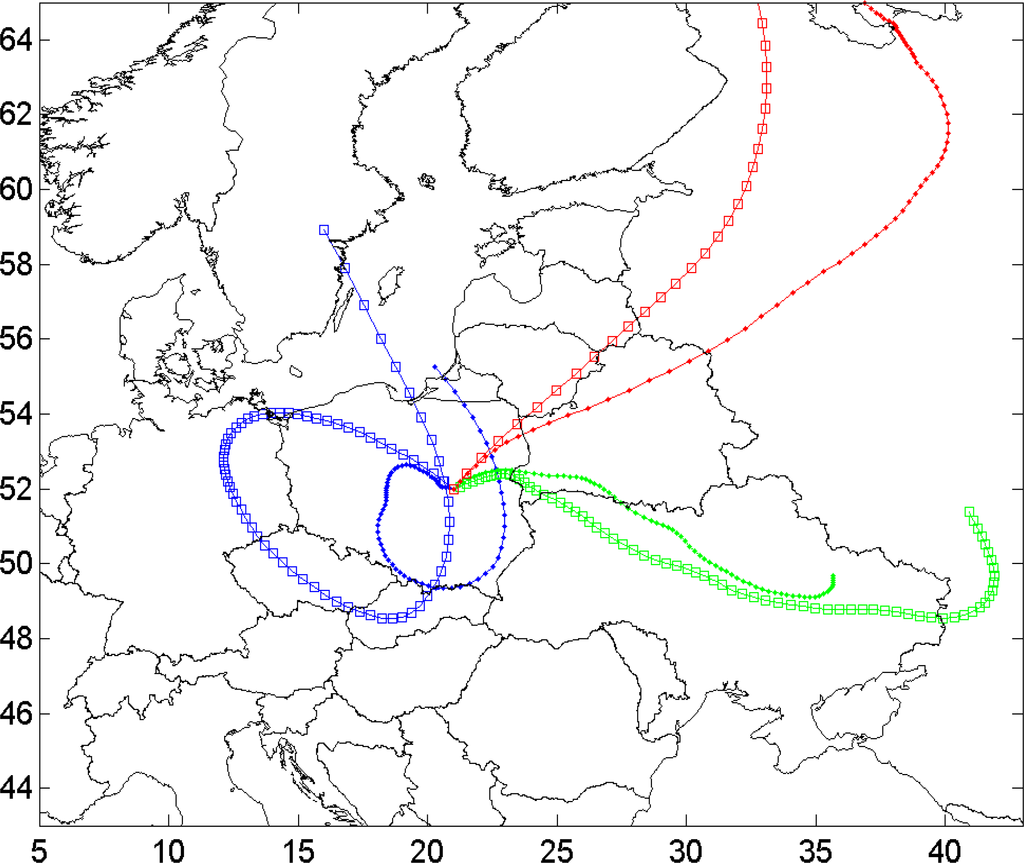
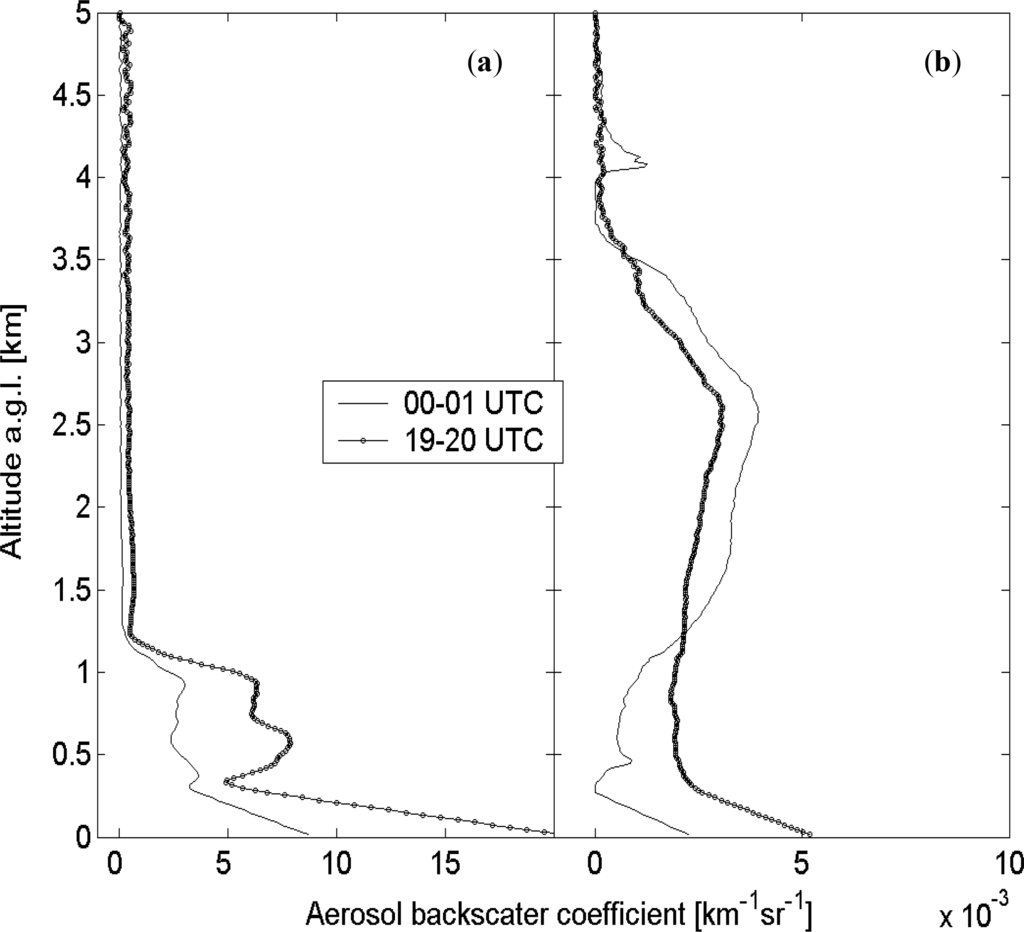
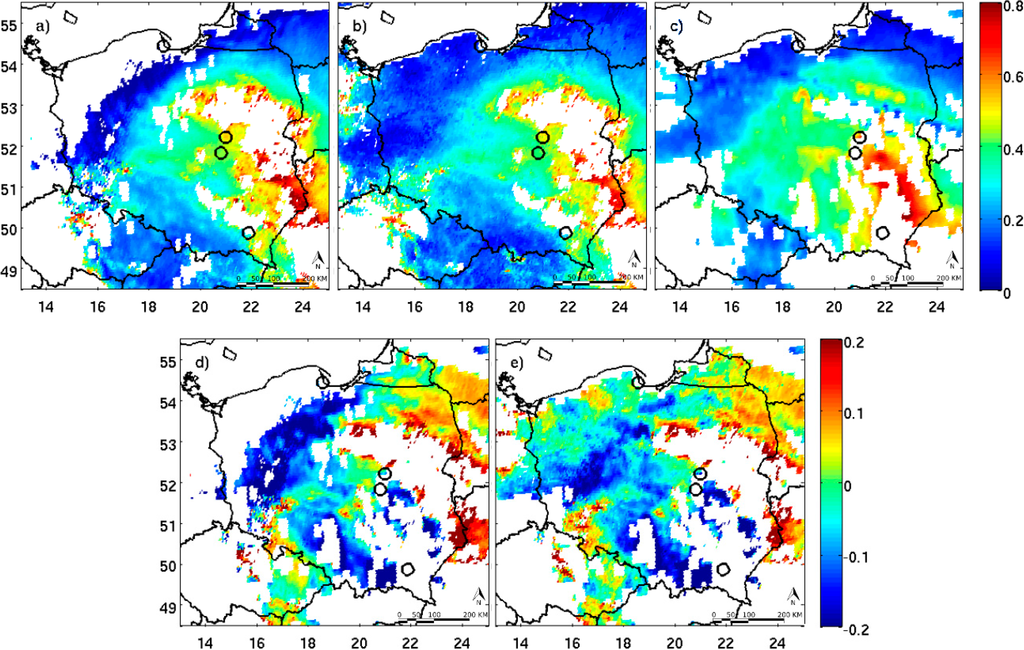
On 30 April, atmospheric circulation over the Central Europe was different. Almost straight-line back-trajectories (Figure 10) show transport of air masses from the eastern part of Europe. The back-trajectories at 500 (green dots) and 3000 (green open squares) passed Ukraine and brought aerosol from biomass burning. The MODIS fire location product [63] indicates a lot of fire activity between 21 and 30 April 2009, in Eastern Europe, in particular in Belarus, Ukraine and Russia. The NAAPS model indicates transport of the biomass burning aerosol and mineral dust emitted from the Sahara desert [64]. The vertical profiles of the aerosol backscatter coefficient in Warsaw (Figure 11b) confirm aerosol long-range transport in the middle troposphere. Significant values of the aerosol backscatter coefficients were observed up to 4.5 km with a maximum of around 2.5 km overnight (00:00–01:00 UTC) and during late afternoon (19:00–20:00 UTC). The spatial distribution of the AOD shows (Figure 13a,b) its maximum in eastern Poland. For both one- and two-channel methods, the AOD exceeds 0.7. In southern and in northwest Poland, the AOD was significantly lower (0.1–0.3). Although the highest values are close to regions where cloud contamination was indicated by the cloud mask, such high values are realistic. The AERONET station in Belsk observed an AOD at 500 nm of almost 0.75. A relatively high value of the Ångstrom exponent (about 1.8) indicates that aerosol was dominated by biomass burning rather than by mineral dust. The AOD difference between the SEVIRI and the MODIS in the case of the one-channel algorithm is positive where the AOD is high and negative where it is low (Figure 13d). For the two-channel method, this relation is more complicated, but it is larger than ±0.05 only in a small part of Poland (Figure 13e).
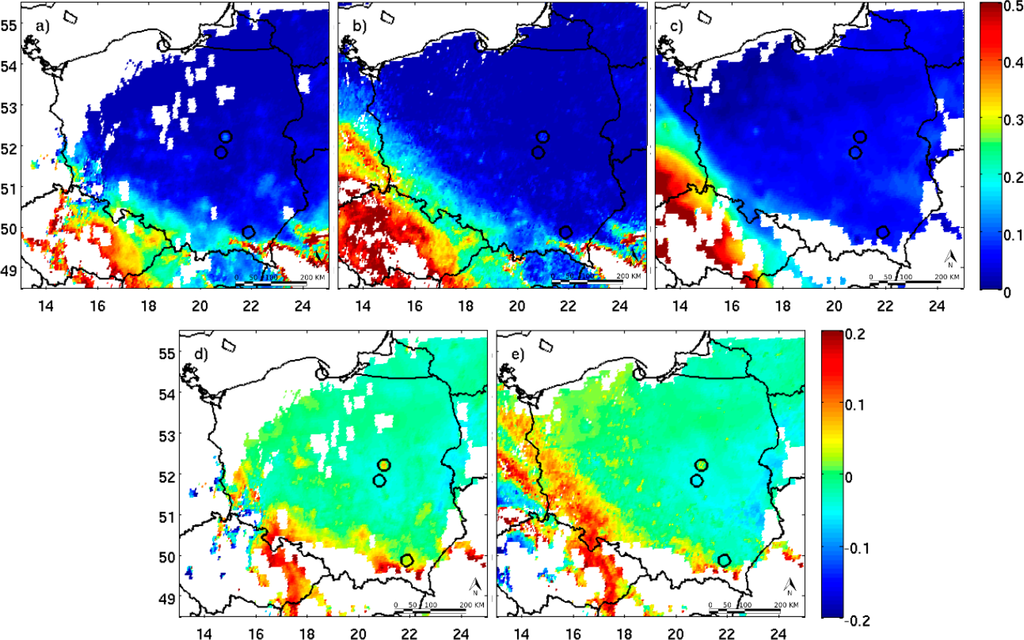
On 1 May, the atmospheric advection changed slightly to the northeast but the back-trajectories (Figure 9) show transport of Arctic air masses from Northern Europe. The ceilometer data are not available for that day, whereas the CIMEL observations in Belsk show the 500 nm AOD to be about 0.1 and the Ångstrom exponent at about 1.25. The SEVIRI data shows (Figure 14a,b) that the AOD is below 0.15 (based on both methods) with the exception of southeast and southwest Poland. In the first region, the AOD exceeds 0.5 because of biomass burning, and in the latter one the AOD is about 0.25–0.3. The correlation of the SEVIRI and the MODIS (Figure 14c) data is quite good (up to ±0.05) with the exception of the region with large AOD. In this case, the SEVIRI AOD locally exceeds the MODIS by 0.1–0.2 (Figure 14d,e).
The difference between the SEVIRI and the MODIS AOD can be explained by the uncertainty of the Ångstrom exponent used to scale the MODIS 550 nm to 635 nm value and also by the fact that the MODIS tends to overestimate small AODs and underestimate high AODs [8,33,65]. The regression between the MODIS and the AERONET AOD at 550 nm is τMODIS = 0.1 + 0.9τAERONET [65]. Thus, for a low AOD, the difference between the SEVIRI and the MODIS tends to be negative, and for a high AOD the difference becomes positive.
6. Conclusions
We present two methods for the retrieval of aerosol optical depth (AOD) which utilize a new approach to surface reflectance estimation based on the optimal interpolation technique [31]. In two algorithms described—the one- and the two-channel ones—the surface reflectance is calculated for reference clear days (days with small AOD) from the SEVIRI top-of-atmosphere (TOA) reflectance and the AOD spatial distribution. The latter ones have been obtained from the NAAPS model or the MODIS data. The NAAPS/MODIS data are corrected by the ground based sun photometer measurements of aerosol optical properties. The surface reflectance determined in the minimization process can be used for up to several days (in this study, up to 10 days) to retrieve the AOD from the SEVIRI data. A very small fluctuation in the retrieved surface reflectance indicates that the algorithm is quite stable. The correlation coefficient (r2) between the AOD retrieved from the SEVIRI and the ground-based AOD measured by the CIMEL and the MFR-7 radiometers ranges from 0.33–0.73. The mean bias is smaller than 0.02 and the root mean square is about 0.04–0.05. The estimated AOD uncertainty is about ±0.05 for both the one- and two-channel methods.
The main advantage of our methods is a high temporal resolution (15 min) in comparison to polar orbiting satellites. In addition, we improved the surface reflectance estimation based on the optimal interpolation methods which use the ground-based measurements and could be applied to aerosol transport model results or other satellite observations. Therefore, the uncertainty of the retrieved AOD is comparable with the MODIS algorithm.
The largest limitation of the presented algorithms is related to the surface hot-spot effect for scattering angles close to 180° and a small solar zenith angle. For the Polish conditions, the AOD retrieval can be usually recorded up to 10:00 UTC and after 14:00 UTC. Between 10:00 and 14:00 UTC, the retrieved AOD is very sensitive to surface reflectance even for the visible channel. In addition, during this period there is the greatest probability of convective clouds development, and the presence of small (sub-pixel) clouds leads to the uncertainties of the AOD.
Although we present data only for Poland, both algorithms can be easily applied to different geographical regions. The described methodology can also be used for various current and future satellite detectors.
Acknowledgments
This research has been partly conducted as part of the Polish National Grants No. 1276/B/P01/2010/38 of the Ministry of Science and Higher Education of Poland, 2012/05/E/ST10/01578 of the National Science Centre, both coordinated by IGF UW, and within the framework of the European Social Fund, contract number UDAPOKL.04.01.01-00-072/09-00. We acknowledge Brent Holben for the use of the data from the Belsk AERONET station, and EUMETSAT for the data availability, license number 50001643. The MODIS data used in this study were acquired as part of the NASA’s Earth-Sun System Division and archived and distributed by the MODIS Adaptive Processing System (MODAPS). The authors wish to thank Douglas L. Westphal and Piotr Flatau from the Naval Research Laboratory in Monterey for providing NAAPS data.
Authors Contributions
Olga Zawadzka developed the research concept and methods, and conducted the research. Krzysztof Markowicz collected and prepared the ground based and model data. Olga Zawadzka and Krzysztof Markowicz performed and interpreted the data analyses and wrote the manuscript.
Conflicts of Interest
The authors declare no conflict of interest.
References
- Boucher, O.; hRandall, D.; Artaxo, P.; Bretherton, C.; Feingold, G.; Forster, P.; Kerminen, V.-M.; Kondo, Y.; Liao, H.; Lohmann, U.; et al. Clouds and aerosols. In Climate Change 2013: The Physical Science Basis. Contribution of Working Group I to the Fifth Assessment Report of the Intergovernmental Panel on Climate Change; Stocker, T.F., Qin, D., Plattner, G.-K., Tignor, M., Allen, S.K., Boschung, J., Nauels, A., Xia, Y., Bex, V., Midgley, P.M., Eds.; Cambridge University Press: Cambridge, UK, 2013. [Google Scholar]
- King, M.D.; Kaufman, Y.J.; Tanré, D.; Nakajima, T. Remote sensing of tropospheric aerosols from space: Past, present and future. Bull. Meteorol. Soc 1999, 80, 2229–2259. [Google Scholar]
- Stowe, L.L.; Ignatov, A.M.; Singh, R.R. Development, validation, and potential enhancements to the second generation operational aerosol product at the National Environmental Satellite, Data, and Information Service of the National Oceanic and Atmospheric Administration. J. Geophys. Res 1997, 102, 16923–16934. [Google Scholar]
- Gordon, H.R.; Wang, M.H. Retrieval of water-leaving radiance and aerosol optical-thickness over the oceans with SeaWiFS—A preliminary algorithm. Appl. Opt 1994, 33, 443–452. [Google Scholar]
- Hsu, N.C.; Herman, J.R.; Bhartia, P.K.; Seftor, C.J.; Torres, O.; Thompson, A.M.; Gleason, J.F.; Eck, T.F.; Holben, B.N. Detection of biomass burning smoke from TOMS measurements. Geophys Res. Lett 1996, 23, 745–748. [Google Scholar]
- Herman, J.R.; Bhartia, P.K.; Torres, O.; Hsu, N.C.; Seftor, C.J.; Celarier, E. Global distribution of UV- absorbing aerosols from Nimbus-7/TOMS data. J. Geophys. Res 1997, 102, 16911–16922. [Google Scholar]
- Kaufman, Y.J.; Tanré, D.; Gordon, H.R.; Nakajima, T.; Lenoble, J.; Grassl, H.; Herman, B.M.; King, M.D.; Teillet, P.M. Passive remote sensing of tropospheric correction for the aerosol effect aerosol and atmospheric. J. Geophys. Res 1997, 102, 16815–16830. [Google Scholar]
- Chu, D.A.; Kaufman, Y.J.; Zibordi, G.; Chern, J.D.; Mao, J.; Li, C.; Holben, B.N. Global monitoring of air pollution over land from Earth Observing System-Terra MODIS. J. Geophys. Res 2003, 108. [Google Scholar] [CrossRef]
- Kokhankovsky, A.A.; Bréon, F.-M.; Cacciari, A.; Carboni, E.; Diner, D.; Di Nicolantonio, W.; Grainger, R.G.; Grey, W.M.F.; Holler, R.; Lee, K.-H.; et al. Aerosol remote sensing over land: A comparison of satellite retrievals using different algorithms and instruments. Atmos. Res 2007, 85, 372–394. [Google Scholar]
- Kaufman, Y.J.; Tanré, D.; Boucher, O. A satellite view of aerosols in the climate system. Nature 2002, 419, 215–223. [Google Scholar]
- Wang, J.; Christopher, S.A.; Brechtel, F.; Kim, J.; Schmid, B.; Redemann, J.; Russell, P.B.; Quinn, P.; Holben, B.N. Geostationary satellite retrievals of aerosol optical thickness during ACE-Asia. J. Geophys. Res 2003, 108. [Google Scholar] [CrossRef]
- Kim, J.; Yoon, J.M.; Ahn, M.H.; Sohn, B.J.; Lim, H.S. Retrieving aerosol optical depth using visible and mid-IR channels from geostationary satellite MTSAT-1R. Int. J. Remote Sens 2008, 29, 6181–6192. [Google Scholar]
- Zhang, J.; Christopher, S.A.; Holben, B.N. Intercomparison of smoke aerosol optical thickness derived from GOES 8 imager and ground-based sun photometers. J. Geophys. Res 2001, 106, 7387–7397. [Google Scholar]
- Zhang, H.; Hoff, R.M.; Kondragunta, S.; Laszlo, I.; Lyapustin, A. Aerosol optical depth (AOD) retrieval using simultaneous GOES-East and GOES-West reflected radiances over the western United States. Atmos. Meas. Tech 2013, 6, 471–486. [Google Scholar]
- Popp, C.; Hauser, A.; Foppa, N.; Wunderle, S. Remote sensing of aerosol optical depth over central Europe from MSG-SEVIRI data and accuracy assessment with ground-based AERONET measurements. J. Geophys. Res 2007, 112. [Google Scholar] [CrossRef]
- Aerosol Retrievals from METEOSAT-8, SAF on Climate Monitoring. Available online: http://www.knmi.nl/roebelin/papers/MSG_vs_activity_hygeos_version_2.pdf (accessed on 30 July 2014).
- Jolivet, D.; Ramon, D.; Bernard, E.; Deschamps, P.-Y.; Riedi, J.; Nicolas, J.M.; Hagolle, O. Aerosol monitoring over land using MSG/SEVIRI. Proceeding of the EUMETSAT Meteorological Satellite Conference, Darmstadt, Germany, 8–12 September 2008.
- Bernard, E.; Moulin, C.; Ramon, D.; Jolivet, D.; Riedi, J.; Nicolas, J.-M. Description and validation of an AOT product over land at the 0.6 mm channel of the SEVIRI sensor onboard MSG. Atmos. Meas. Tech 2011, 4, 2543–2565. [Google Scholar]
- Govaerts, Y.M.; Arriaga, A.; Schmetz, J. Operational vicarious calibration of the MSG/SEVIRI solar channels. Adv. Space Res 2001, 28, 21–30. [Google Scholar]
- Carrer, D.; Roujean, J.L.; Hautecoeur, O.; Elias, T. Daily estimates of aerosol optical thickness over land surface based on a directional and temporal analysis of SEVIRI MSG visible observations. J. Geophys. Res 2010, 115. [Google Scholar] [CrossRef]
- Carboni, E.; Thomas, G.E.; Sayer, A.M.; Siddans, R.; Poulsen, C.A.; Grainger, R.G.; Ahn, C.; Antoine, D.; Bevan, S.; Braak, R.; et al. Intercomparison of desert dust optical depth from satellite measurements. Atmos. Meas. Tech 2013, 5, 1973–2002. [Google Scholar]
- Brindley, H.E; Russell, J.E. An assessment of Saharan dust loading and the corresponding cloud-free long-wave direct radiative effect from geostationary satellite observations. J. Geophys. Res 2009, 114. [Google Scholar] [CrossRef]
- Bulgin, C.E.; Palmer, P.I.; Merchant, C.J.; Siddans, R.; Gonzi, S.; Poulsen, C.A.; Gareth, E.; Thomas, G.E.; Sayer, A.M.; Carboni, E.; et al. Quantifying the response of the ORAC aerosol optical depth retrieval for MSG SEVIRI to aerosol model assumptions. J. Geophys. Res 2011, 116. [Google Scholar] [CrossRef]
- Mei, L.; Xue, Y.; de Leeuw, G.; Holzer-Popp, T.; Guang, J.; Li, Y.; Yang, L.; Xu, X.; Li, C.; Wang, Y.; et al. Retrieval of aerosol optical depth over land based on a time series technique using MSG/SEVIRI data. Atmos. Chem. Phys 2012, 12, 9167–9185. [Google Scholar]
- Stephens, G.L.; Vane, D.G.; Boain, R.J.; Mace, G.G.; Sassen, K.; Wang, Z.; Illingworth, A.J.; O’Connor, E.J.; Rossow, W.B.; Durden, S.L.; et al. The CLOUDSAT mission and A-Train. Bull. Am. Meteorol. Soc 2002, 83, 1771–1790. [Google Scholar]
- Ignatov, A. Estimation of the aerosol phase function in backscatter from simultaneous satellite and sun- photometer measurements. J. Appl. Meteorol 1997, 36, 688–694. [Google Scholar]
- Tang, J.; Xue, Y.; Yu, T.; Guan, Y. Aerosol optical thickness determination by exploiting the synergy of TERRA and AQUA MODIS. Remote Sens. Environ 2005, 94, 327–334. [Google Scholar]
- Xu, Q.; Obradovic, Z.; Han, B.; Li, Y.; Braverman, A.; Vucetic, S. Improving aerosol retrieval accuracy by integrating AERONET, MISR and MODIS data. Proceeding of the 8th International Conference on Information Fusion, Philadelphia, PA, USA, 25–28 July 2005.
- Bennouna, Y.S.; de Leeuw, G. Aerosol retrievals over land and sea surface using combined satellite measurements from MSG-SEVIRI and ENVISAT-AATSR. Proceedings of the Envisat Symposium, Montreux, Switzerland, 23–27 April 2007.
- Maciszewska, A.; Markowicz, K.; Witek, M. Multiyear analysis of the aerosol optical thickness over Europe. Acta Geophys 2010, 58, 1147–1163. [Google Scholar]
- Rodgers, C. Inverse Methods for Atmospheric Sounding; Theory and Practise; Series on Atmospheric, Oceanic and Planetary Physics; World Scientific: Singapore, 2000; Volume 2. [Google Scholar]
- Levy, R.C.; Leptoukh, G.G.; Kahn, R.; Zubko, V.; Gopalan, A.; Remer, L.A. A critical look at deriving monthly aerosol optical depth from satellite data IEEE. Trans. Geosci. Remote Sens 2009, 47, 2942–2956. [Google Scholar]
- Remer, L.; Kaufman, Y.; Tanré, D.; Mattoo, S.; Chu, D.; Martins, J.; Li, R.; Ichoku, C.; Levy, R.; Kleidman, R.; et al. The MODIS aerosol algorithm, products, and validation. J. Atmos. Sci 2005, 62, 947–973. [Google Scholar]
- Levy, R.C.; Remer, L.A.; Kleidman, R.G.; Mattoo, S.; Ichoku, C.; Kahn, R.; Eck, T.F. Global evaluation of the collection 5 MODIS dark-target aerosol products over land. Atmos. Chem. Phys 2010, 10, 10399–10420. [Google Scholar]
- Seidel, F.C.; Kokhanovsky, A.A.; Schaepman, M.E. Fast retrieval of aerosol optical depth and its sensitivity to surface albedo using remote sensing data. Atmos. Res 2011, 116, 22–32. [Google Scholar]
- Seidel, F.C.; Popp, C. Critical surface albedo and its implications to aerosol remote sensing. Atmos. Meas. Tech 2012, 5, 1653–1665. [Google Scholar]
- Hu, B.; Lucht, W.; Strahler, A.H. The interrelationship of atmospheric correction of reflectances and surface BRDF retrieval: A sensitivity study. IEEE Trans. Geosci. Remote Sens 1999, 37, 724–738. [Google Scholar]
- AERosol RObotic NETwork-AERONET. Available online: http://aeronet.gsfc.nasa.gov (accessed on 30 July 2014).
- Poland-AOD National Network. Available online: www.polandaod.pl (accessed on 30 July 2014).
- Holben, B.N.; Eck, T.F.; Slutsker, I.; Tanré, D.; Buis, J.P.; Setzer, A.; Vermote, A.E.; Reagan, J.A.; Kaufman, Y.J.; Nakajima, T.; et al. AERONET—A federated instrument network and data archive for aerosol characterization. Remote Sens. Environ 1998, 66, 1–16. [Google Scholar]
- CIMEL Electronique 318A Sun Photometers. Available online: www.cimel.fr (accessed on 30 July 2014).
- Zawadzka, O.; Markowicz, K.M.; Pietruczuk, A.; Zielinski, T.; Jaroslawski, J. Impact of urban pollution emitted in Warsaw on aerosol properties. Atmos. Environ 2013, 69, 15–28. [Google Scholar]
- Harrison, L.; Michalsky, J.; Berndt, J. Automated multifilter rotating shadow-band radiometer: An instrument for optical depth and radiation measurements. Appl. Opt 1994, 33, 5118–5125. [Google Scholar]
- Morys, M.; Mims, F.M.; Hagerup, S.; Anderson, S.E.; Baker, A.; Kia, J.; Walkup, T. Design, calibration, and performance of MICROTOPS II hand held ozone monitor and Sun photometer. J. Geophys. Res 2001, 106, 14573–14582. [Google Scholar]
- MICROTOPS II Sunphotometer, Aerosol Optical Thickness Measurement. Available online: http://www.solarlight.com/products/sunphoto.html (accessed on 30 July 2014).
- Shaw, G.E. Sun photometry. Bull. Am. Meteorol. Soc 1983, 64, 4–10. [Google Scholar]
- Witek, M.L.; Flatau, P.J.; Quinn, P.K.; Westphal, D.L. Global sea-salt modeling: Results and validation against multicampaign shipboard measurements. J. Geophys. Res 2007, 112. [Google Scholar] [CrossRef]
- Vermote, E.; Tanré, D.; Deuzé, J.; Herman, M.; Morcrette, J.J. Second simulation of the satellite signal in the solar spectrum, 6S: An overview. IEEE Trans. Geosci. Remote Sens 1997, 35, 675–686. [Google Scholar]
- Second Simulation of a Satellite Signal in the Solar Spectrum—Vector (6SV). Available online: http://6s.ltdri.org/6S_code2_thiner_stuff/6s_ltdri_org_manual.htm (accessed on 29 July 2014).
- Liou, K.N. An Introduction to Atmospheric Radiation; International Geophysics; Academic Press: San Diego, CA, USA, 2002; Volume 84. [Google Scholar]
- Henyey, L.C.; Greenstein, J.L. Diffuse radiation in the galaxy. Astrophys. J 1941, 93, 70–83. [Google Scholar]
- The Land Cover Map for Europe in the Year 2000; GLC2000 Database. Availble online: http://http://bioval.jrc.ec.europa.eu/products/glc2000/products.php (accessed on 29 July 2014).
- Riedi, J.; Nicolas, J.M. Science_modules_msg.c; Laboratoire d’Optique Atmospherique: Lille, France, 2005. [Google Scholar]
- Brent, R.P. Algorithms for minimization without derivatives; Prentice-Hall: Englewood Cliffs, NJ, USA, 1973. [Google Scholar]
- Anikin, P.; Sviridenkov, A.; Romashova, E.V. Estimation of aerosol single-scattering albedo over ZZS from MFRSR data. Proceedings of the Twelfth ARM Science Team Meeting, St. Petersburg, FL, USA, 8–12 April 2002.
- Kalnay, E. Atmospheric modeling, data assimilation, and predictability; Cambridge University Press: New York, NY, USA, 2003. [Google Scholar]
- Ghill, M.; Malanotte-Rizzoli, P. Data assimilation in meteorology and ocean-ography. Adv. Geophys 1991, 33, 141–266. [Google Scholar]
- Talagrand, O. Assimilation of observations, an introduction. J. Meteorol. Soc. Jpn 1997, 75, 191–209. [Google Scholar]
- Typical Radiometric Accuracy and Noise for MSG-1/2. Available online: www.eumetsat.int/website/wcm/idc/idcplg?IdcService=GET_FILE&dDocName=PDF_TYP_RADIOMET_ACC_MSG-1-2&RevisionSelectionMethod=LatestReleased&Rendition=Web (accessed on 30 July 2014).
- Govaerts, Y.M.; Clerici, M. MSG-1/SEVIRI Solar Channels Calibration Commissioning Activity Report; Technical Report EUM/MSG/TEN/04/0024; EUMETSAT: Darmstadt, Germany, 2004. [Google Scholar]
- Goevarts, Y.M.; Wagner, S.; Lattanzio, A.; Watts, P. Joint retrieval of surface reflectance and aerosol optical depth from MSG/SEVIRI observations with an optimal estimation approach: 1. Theory. J. Geophys. Res 2010, 115. [Google Scholar] [CrossRef]
- HYSPLIT—HYbrid Single-particle Lagran-gian Integrated Trajectory Model. Available online: http://ready.arl.noaa.gov/HYSPLIT.php (accessed on 7 July 2014).
- Giglio, L.; Descloitres, J.; Justice, C.O.; Kaufman, Y.J. An enhanced contextual fire detection algorithm for MODIS. Remote Sens. Environ 2003, 87, 273–282. [Google Scholar]
- Navy Aerosol Analysis and Prediction System (NAAPS). Available online: http://www.nrlmry.navy.mil/aerosol/ (accessed on 30 July 2014).
- Levy, R.C.; Remer, L.A.; Mattoo, S.; Vermote, E.F.; Kaufman, Y.J. Second-Generation operational algorithm: Retrieval of aerosol properties over land from inversion of Moderate Resolution Imaging Spectroradiometer spectral reflectance. J. Geophys. Res 2007, 112. [Google Scholar] [CrossRef]
© 2014 by the authors; licensee MDPI, Basel, Switzerland This article is an open access article distributed under the terms and conditions of the Creative Commons Attribution license (http://creativecommons.org/licenses/by/3.0/).