Assessing Land Degradation and Desertification Using Vegetation Index Data: Current Frameworks and Future Directions


Abstract
: Land degradation and desertification has been ranked as a major environmental and social issue for the coming decades. Thus, the observation and early detection of degradation is a primary objective for a number of scientific and policy organisations, with remote sensing methods being a candidate choice for the development of monitoring systems. This paper reviews the statistical and ecological frameworks of assessing land degradation and desertification using vegetation index data. The development of multi-temporal analysis as a desertification assessment technique is reviewed, with a focus on how current practice has been shaped by controversy and dispute within the literature. The statistical techniques commonly employed are examined from both a statistical as well as ecological point of view, and recommendations are made for future research directions. The scientific requirements for degradation and desertification monitoring systems identified here are: (I) the validation of methodologies in a robust and comparable manner; and (II) the detection of degradation at minor intensities and magnitudes. It is also established that the multi-temporal analysis of vegetation index data can provide a sophisticated measure of ecosystem health and variation, and that, over the last 30 years, considerable progress has been made in the respective research.1. Introduction
The United Nations Convention to Combat Desertification (UNCCD), ratified by 195 countries, identifies land degradation and desertification as one of the most pressing environmental concerns of our times [1,2]. Furthermore, the UN Conference on Sustainable Development (“Rio + 20”) has called for a target of “zero net land degradation”, whereby the rate of deteriorating lands would be counterbalanced by the rate of land improvement. These political frameworks, whilst admirable, require sound scientific evidence for effective implementation [3]. However, in spite of political and scientific recognition of the importance of land degradation, current estimates of its extent and severity are highly unreliable and spurious. The often quoted statistics that 15% of the Earth’s surface and 60% of drylands are degraded [4], are acknowledged as qualitative and unsubstantiated [5,6]. These estimates, based on coarse resolution expert opinions, are not suitable for policy making or for scientific investigations into the potential remediation of degraded lands [7].
The timely and early detection of degradation processes is necessary to prevent the continuing deterioration of land condition. The lack of authenticated evidence on the magnitude of desertification has led to questions over the very existence of a global degradation problem [8,9], with large-scale studies frequently at odds with plot and field-scale studies [10,11]. There is a pressing need, therefore, for accessible and accurate measurements on the extent of degradation and desertification for policy, natural resource management and scientific research needs [7,12]. Given the temporal nature of land degradation, it is paramount that measurements adhere to the principles of repetitiveness, objectivity and consistency [13]. These requirements, combined with the size of the land occupied by semi-arid regions and the degree of development of many vulnerable nations, make Earth Observation (EO)-based systems a candidate choice for establishing monitoring networks [14,15]. So far, the most frequently utilised method employing EO datasets is trend analysis of vegetation index data, most commonly the Normalised Difference Vegetation Index (NDVI), as a proxy for Net Primary Production (NPP).
Land degradation and desertification is a complex area of scientific research. This complexity partly arises from an open discussion on the definition of what actually constitutes degradation. This confusion occurs due to the interdisciplinary nature of desertification, encompassing geographical, ecological, meteorological and social perspectives, all of which can have regionally specific interpretations [16]. Early observations, provided by European foresters in 1930’s West Africa, classified desertification as the consequence of desert boundary displacement [17]. This viewpoint was later adapted to cover a variety of mechanisms that would result in a detrimental impact upon “the physical, chemical or biological status of land which may also restrict the land's productive capacity” [18]. Quantifying desertification by measurements of vegetation productivity and cover has led to long running debates concerning both the acknowledgment and inference of climatic influence on semi-arid ecosystems, with the UNCCD acknowledging that degradation can result from “various factors including climate variations and human activities” [1]. For a comprehensive review of the various definitions and their contexts see reviews by [5,6,19]. For the purpose of this article, we follow the definition used by the Millennium Ecosystem Assessment [20], which refers to land degradation as “the reduction in the capacity of the land to perform ecosystem goods, functions and services that support society and development”, and to desertification as the same process in arid and semi-arid environments (collectively, the drylands). Hence, we use the terms desertification and degradation interchangeably. This definition considers the ability of land to support primary production as key ecosystem service, and its adoption implies that a reduction in the measured NPP at a site can potentially be viewed as land degradation [21]. This notion forms the theoretical framework on which the majority of EO-based assessments of degradation are founded, e.g., [14,15,22]. The potential of vegetation index variation as a measure of ecosystem health has been acknowledged for nearly 30 years [23], yet in spite of this simple concept, the subject has become extremely controversial within the scientific literature [11,24,25]. This controversy prevents the realisation of land degradation early warning and monitoring systems, which have been postulated for some time [15].
In this paper, we review the theoretical and statistical frameworks used for assessing land degradation with vegetation indices with a view to clarify current understandings and to highlight avenues for future research. Our specific objectives are to provide:
– a brief review of the origin of NDVI and the association of multi-temporal analysis in an land degradation framework;
– an evaluation of the current methods used to assess degradation and desertification through vegetation indices;
– an assessment of how these methods integrate into the wider debates on the mechanisms and processes of land degradation.
Although the focus of this review is the assessment of degradation and desertification in drylands, the frameworks discussed are by no means exclusive to this subject or environment, and are in many cases equally applicable to more wide-ranging global environmental change studies [26].
2. NDVI: Origin and Data
NDVI is expressed as:
NDVI is not a direct measure of vegetation or biomass, hence, it is not directly translatable into NPP. However, there is a considerable volume of literature reporting a close coupling between NDVI and in-situ NPP measurements [23,33–35]. For a full review of the advantages and limitations of vegetation index usage in dryland regions refer to Eisfelder et al. [36] and references therein. A key limitation of NDVI in regions of sparse biomass is the influence of soil interference, thus it is not advisable to apply NDVI in regions with an average value of NDVI < 0.1.
Time series analysis of NDVI can be applied using any system capable of measuring reflectances in the red and near infrared reflectance bands. However, long-term studies encounter data consistency and availability issues from a number of factors, including solar zenith angle, volcanic aerosols, sensor degradation and sensor compatibility. As such, analyses commonly utilise pre-processed datasets corrected for these issues (Table 1). The longest source of imagery available is obtained from the Advanced Very High Resolution Radiometer (AVHRR) sensor. Developed datasets include the 1981–2001 Pathfinder AVHRR Land-record (PAL) [37], the 1981–2006 Global Inventory Modelling and Mapping Studies (GIMMSg) [38], and the 1981–2011 GIMMS3g [39] at 8 km resolutions A recent European consortium have merged AVHRR data with SPOT imagery generating a 5 km (1981–1998) and 1 km (1998–2012) product [40]. The AVHRR-derived datasets, in particular the GIMMS and GIMMS3g products, continue as the most popular record, due to the unparalleled time span, in spite of the increasing availability of higher resolution products, such as SPOT (1 km), MERIS (1 km) and MODIS (500 m), all of which feature reduced time-spans. A comprehensive review of the available NDVI data sets is given in Pettorelli [41].
3. Background of Multi-Temporal Analyses
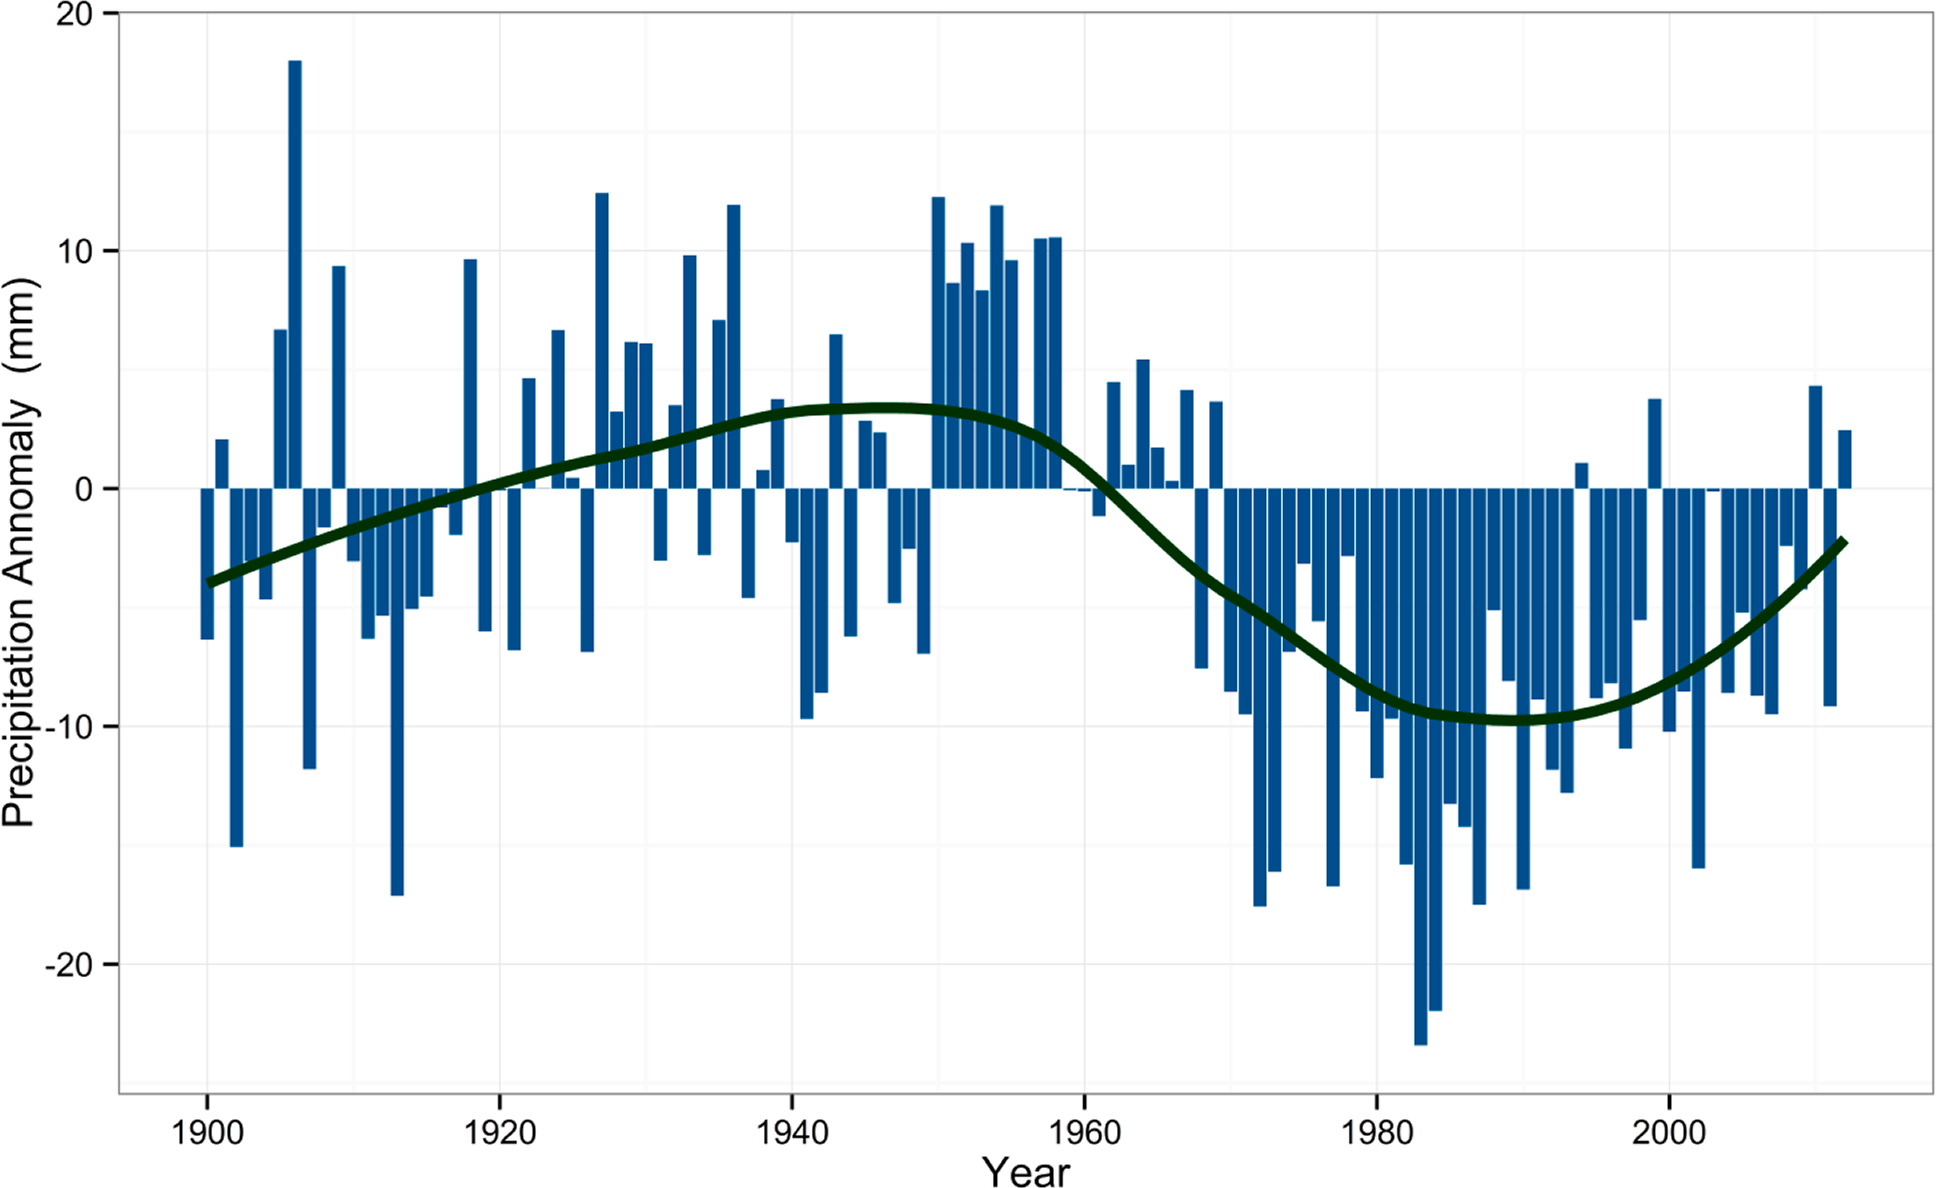
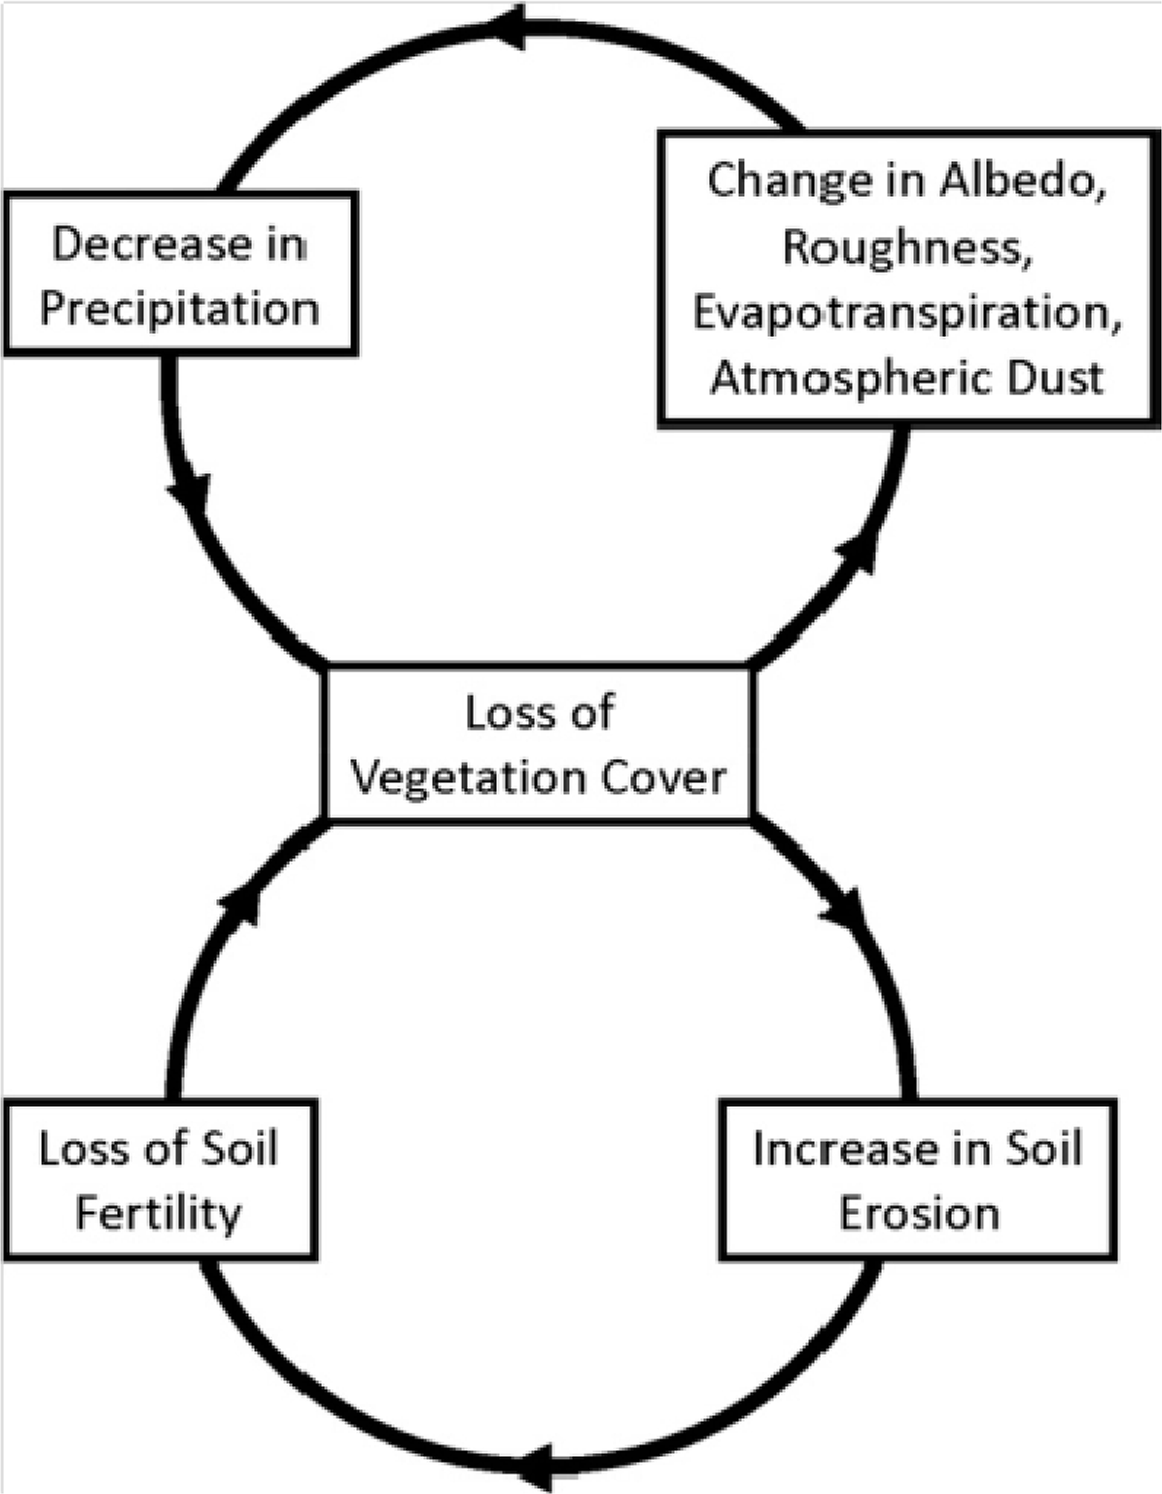
The use of NDVI for assessing desertification originates in the Sahel region of sub-Saharan Africa, which experienced a prolonged reduction in rainfall between 1960 and 1990 (Figure 1), with particularly severe droughts in 1973, 1984 and 1990 [42]. These droughts represent the most dramatic climatic shift on modern record and resulted in widespread famine across the region [42]. This ecological and meteorological transition was viewed as the consequence of anthropogenic desertification, supporting the “expanding deserts” paradigm [17,43,44]. Desertification was understood to result from human alteration of land-atmosphere interactions (Figure 2) [45]. Reduced vegetation cover, initiated by increased grazing pressures [46,47], was postulated to increase localised albedo and temperature, in turn reducing regional rainfall leading to further vegetation cover loss [48,49]. Thus, an increased anthropogenic pressure was attributed as the major driver of regional climate and land cover processes [50]. This was in agreement with studies demonstrating the impact of intensive grazing on surface reflectance across the Negev-Sinai border [51–53]. Conclusions regarding an expanding Sahara and encroaching dune systems, such as those proposed by Lamprey [44] and Stebbing [17], were heavily cited in both scientific publication and media outlets [54]. More recent research heavily challenged this viewpoint and paradigm [5,55–57]. A number of studies in the Sudano-Sahelian region combined field surveys with aerial photography and multi-temporal NDVI. These studies revealed little expansion of the Sahara, and a relatively minor human footprint when compared to the climatic signal [55–57]. Other regional-scale analyses [54,58] reinforced this conclusion, casting serious doubt on the expanding deserts paradigm [6]. The study of Tucker [58] was a seminal study in demonstrating the potential of EO for long-term regional-scale ecosystem studies. In combination with other studies in the tropics [59,60], Tucker [58] demonstrated the potential to apply time-series analysis on EO imagery for monitoring and assessing ecosystem processes.
The demonstration of the potential of multi-temporal NDVI imagery [58], coupled with the development of pre-processed long-term data sets [37], resulted in an increase in the application of time-series analysis using NDVI. In the Sahel, a greening trend was observed by numerous studies [62–65]. Herrmann et al. [63] used the residual trend method (see Section 4) in combination with trend analysis on 19 years of monthly NVDI data to conclude that the region was, in general, greening with only localised degradation present. This analysis was reinforced by Huber et al. [64] on an extended NDVI data set, in conjunction with soil moisture estimates, with similar conclusions. Process-based ecosystem-modelling studies reported an agreement between the observed NDVI patterns and climate model-based estimates [66], with little influence from population or grazing pressures [67]. Growing season NDVI was found to have increased by 0.09 units from 1981–2007 [64], although a reduction in the rate of greening was noted around 2000 [68].This greening trend was found to be consistent across semi-arid regions globally, traditionally viewed as the hot-spots of land degradation [9,69,70]. With comparable desert boundary variation also noted in Asian drylands [71,72]. Greening was found to occur through two mechanisms: a lengthening of the growing season through earlier springs and delayed senescence and an increase in the maximum amplitude of NDVI [70,73,74]. Evidence of increased vegetation productivity accompanied a revised view of the cause of Sahelian rainfall fluctuations. Modelling studies revealed that the desiccation-vegetation feedback loop, theorised by Charney [48], had been greatly exaggerated [5]. Regional rainfall variation is primarily related to external drivers, principally sea surface temperature in the low-latitudes [75] but also northern hemisphere volcanic aerosol emissions [76], with localised vegetation-atmospheric interactions playing a minor role [75]. The majority of vegetation greening, in the Sahel and globally, can be attributed to increased precipitation over the past 30 years [77]. However, the question of human influence on semi-arid ecosystems remains highly controversial [14,78]. Furthermore, the sensitivity of trend methods to detecting degradation processes has been questioned [21]. Claims that current precipitation patterns may be disguising wide-spread degradation [11,21] require urgent investigation. The consequences of this degradation would be severe when dry periods return to degrading or degradation-prone localities.
In arid regions, vegetation, and therefore NDVI, is highly correlated to rainfall [79], thus any variation in rainfall affects the NPP. Although temperature variation is also important in many regions [72,80]. Therefore, in order for any long-term permanent degradation to be detected, it is necessary to remove the influence of a precipitation trend. A number of methods have been proposed that aim to accomplish this. Le Houerou [81] originally proposed the ratio of NPP to rainfall, the Rain-Use Efficiency (RUE), as an ecosystem indicator. It was suggested that arid lands would produce around 4 kg-dry matter/ha/year/mm rainfall, and that a reduced RUE indicated land degradation. Further analysis revealed that RUE values varied between regions [82,83]. Consequently, temporal variation in RUE was proposed as an indicator of degradation [22]. Prince et al. [22] investigated the regional RUE of the Sahel from 1982–1994, using seasonally integrated NDVI as a proxy for NPP. This analysis revealed little temporal variation in RUE across the region, thus indicating a consistent ecosystem dynamic through periods of droughts. However, the application of RUE as an indicator of land degradation has become highly controversial [24,78,84]. An explanation of the limitations and assumptions of RUE is given in Section 4. Statistical methods to separate NDVI from rainfall trends have also been proposed; these include the RESidual TRENDds (RESTREND) method [85,86] and the Precipitation Marginal Response (PMR) [87]. These methods both focus on detecting a shift in the statistical relationship between rainfall and NDVI. The proposed degradation mechanism is comparable to RUE: as degradation occurs, the usage of precipitation shifts, whereas meteorologically-induced degradation relationships stay constant [85,86,88].
4. Trend Analysis Frameworks
4.1. NDVI Trend Analysis
Time series techniques can be grouped into parametric and non-parametric methods. The application of these techniques on EO imagery has become a contentious issue due to the inherent limitations and assumptions; an overview of the most commonly used ones, is given below.
Linear trend analysis applies a linear regression model to quantify change in the dependent variable, y (i.e., NDVI) against an independent variable, x (i.e., time). The direction and magnitude of change from this model thus explains the change in NDVI over the period analysed. This test has a number of assumptions that must be met in order to be considered robust [89]:
- (1)
independence of the dependent variable;
- (2)
normality in the model residuals;
- (3)
consistency in residual variance over time;
- (4)
independence in residuals.
In addition to spatial autocorrelation functions present [90,91], memory effects in dryland systems make inter- and intra-annual NDVI values strongly correlated [92–94]. Thus, assumption one above and, commonly, four, are unlikely to be met. The consistency in residual variance is heavily influenced by anomalous and outlier values, such as those caused by hemispheric climatic oscillations [21], and may also be breached.
The Theil-Sen trend is a non-parametric trend estimation technique. Functionally similar to linear least squares regression, it operates on non-parametric statistics and is not dependent upon the assumptions of linear regression. Trends are estimated using the median values and are therefore less susceptible to noise and outliers, with a robust trend estimated with up to ∼29% noise across the data [95,96].
The Mann-Kendall test measures the monotonicity or consistency of a trend [97]. The test is a cumulative value of the instances of increases or decreases from a pairwise comparison, with values of +1 indicating a continually increasing and −1 a continually decreasing trend. Although robust against the assumption of linear regression, the trend is susceptible to producing low values for time series with a strong overall change but moderate annual fluctuations.
4.2. Differences between Trends, Datasets and Sensors
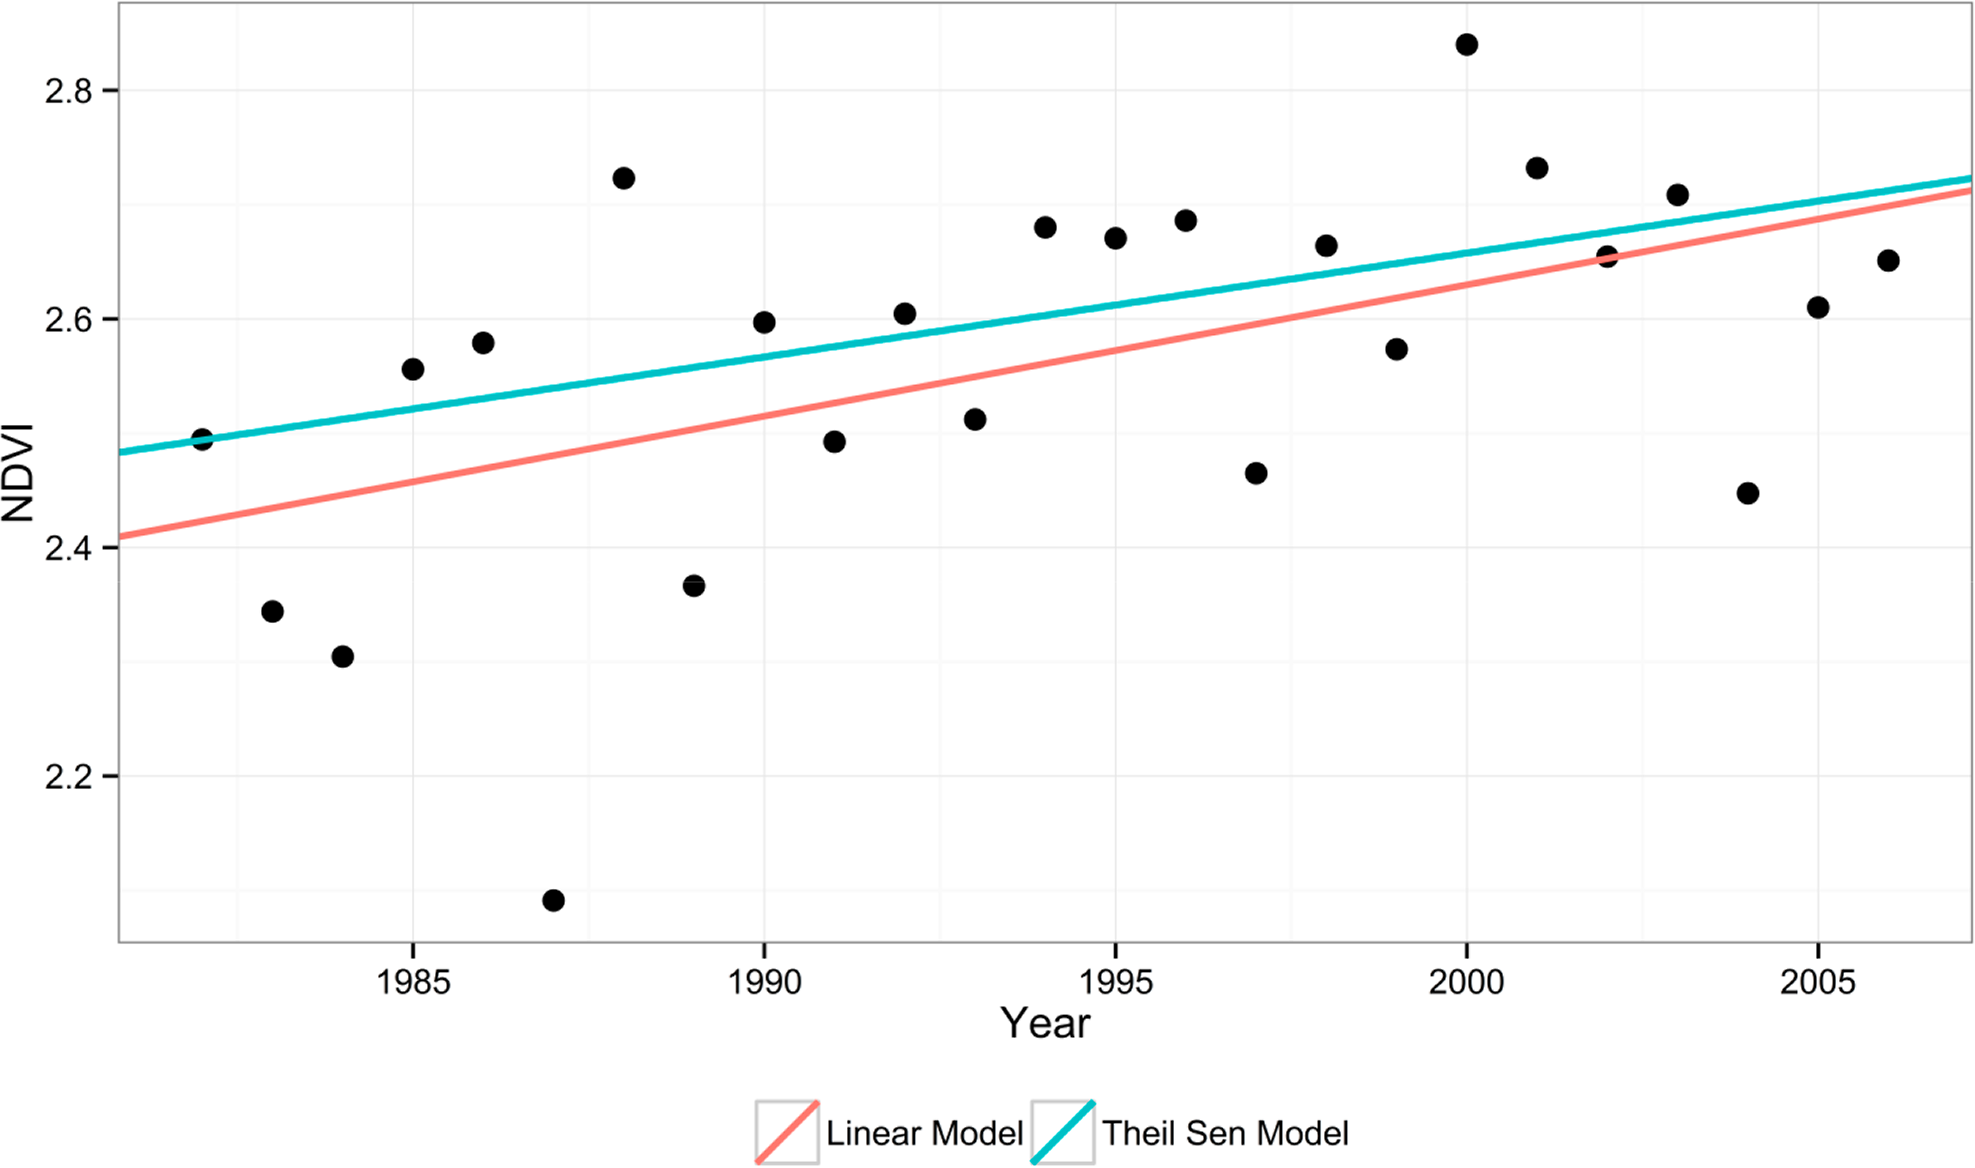
A number of studies have compared the results obtained from applying a variety of trend methods [8,70]. Results indicate that although the trend estimations differ, there is rarely a major difference between results with both direction and magnitude consistent across methods. For global semi-arid regions, Fensholt et al. [8] compared Mann-Kendall and linear regression models, finding a mean difference of 0.039 and −0.019 for positive and negative trends and maximum differences of 0.285 and 0.158 with standard deviations of 0.037 and 0.029, respectively. A comparison of trend estimation, for a pixel in the Sudanese Sahel, is shown in Figure 3.
A majority of studies use NDVI data sets derived from the AVHRR sensor (Table 1). As a meteorological sensor the AVHRR was not designed for terrestrial ecosystem applications [98], thus a number of issues are inherent. For example, the near-infrared waveband (Channel 2) overlaps with a region of strong atmospheric water vapour absorption, influencing the resulting NDVI values. Unlike modern sensors such as MODIS and SPOT, AVHRR does not possess ancillary bands that allow for the detection of atmospheric conditions. Thus, a range of processing is applied to raw AVHRR imagery in the preparation of NDVI records. The PAL and GIMMS/3 g records do not apply atmospheric correction, instead using maximum value compositing (MVC) of Top of Atmosphere (TOA) values to preserve the original data patterns [38,39,99]. However, comparison with the LTDR, which possess an atmospheric correction procedure, highlights the residual error that may remain within the GIMMS data due to this omission, particularly in regions with high Aerosol Optical Thickness (AOT) [100]. Furthermore, aging of the AVHRR carrying satellite results in a shift in the equatorial crossing time of the sensor, referred to as orbital drift. Orbital drift can, without reliable correction, influence NDVI values and computed trends, for a location specific quantification of orbital drift effects on AVHRR data see Nagol et al. [101]. Comparisons of the various AVHRR-derived datasets (PAL, GIMMS/3g, LTDR, FASIR) display regionally varying levels of agreement. For the Iberian peninsula, Alcaraz-Segura et al. [102] found good spatial agreement between the PAL, LTDR and FASIR datasets, with the GIMMS-derived trends differing. A similar observation was identified in South America where the GIMMS data failed to identify trend highlighted by PAL and FASIR records [103]. In the USA and Mexico, records displayed good correlation, however, trend estimates did vary particularly in dryland areas [104]. In a global-scale analysis, Beck et al. [105] compared the four AVHRR-derived records with Landsat and MODIS imagery. Consistency in trends was identified for Australia and central Asia, with divergent trend estimates in Africa, South America and the Sahel [105].
Comparisons between sensor datasets are a common method of quality assurance for AVHRR-derived NDVI records. The MODIS sensor is considered the most accurately calibrated and atmospherically corrected NDVI record available. Therefore, comparing the MODIS products with overlapping AVHRR-derived data can highlight issues present with the older AVHRR records. A global comparison of MODIS and GIMMS NDVI trends, for dryland regions was, undertaken by Fensholt et al. [8]. Trend values show high correlations (0.8>) for most semi-arid regions; however, areas bordering the arid zone with sparse vegetation were lower indicating spurious NDVI in these localities. This was in agreement with earlier work which identified that MODIS-GIMMS correlations were higher in the humid regions of the Sahel, compared to the arid areas [65].
4.3. Detecting Structural and Real-Time Change
Trend breaks. All of the methods detailed above establish a trend detailing the change in NDVI over time; this represents a simplification of what may be a highly complex chronology of shorter duration trends [106,107]. Analysing the overall trend, particularly with long time series, may be misleading as contrasting trends can potentially balance out. Verbesselt et al. [107] proposed that NDVI change can be classified in three components: seasonal/cyclic changes, gradual variation, and abrupt or sudden changes. Within this outline, they developed the Breaks for Additive Season and Trend (BFAST) algorithm, which disaggregates an NDVI time-series into three constituents: seasonal variation, trends, and noise [107]. By allowing the detection of multiple shorter duration trends, a better understanding of the temporal drivers of NDVI can be obtained. de Jong et al. [106] implemented the BFAST algorithm on the global GIMMS NDVIg archive. Semi-arid regions were identified as being highly variable in trend direction and magnitude, partly due to the impact of hemispheric climatic oscillations [68,106]. It was highlighted that dryland regions frequently displayed abrupt greening spells followed by periods of gradual browning.
Real-Time Change Detection
The detection of historic trends and shifts in vegetation productivity is very useful to scientific inquiry, and may serve to inform land management policies to mitigate degradation drivers. However, historic trends are of limited value to contemporary management, as considerable reductions must first materialise (see Section 5.2). Thus, real-time or near real-time detection is necessary to inform policy makers at the earliest possible opportunity. This objective, i.e., the identification of real-time environmental disturbance, is shared by a number of environmental applications, such as food security [108], deforestation [109] and epidemiology [110]. The challenge of being able to identify real-time disturbance is in distinguishing a genuine trend from the seasonal trend and noise components. White and Nemani [111] demonstrated that phenological change could be forecast by comparing a user-defined threshold against the historical variability found within clustered phenoregions. The setting of arbitrary user-defined thresholds encounters difficulty when there are complex land cover transitions or frequent periods of high instability, adding a significant cost to application [112]. To overcome this issue, Verbesselt et al. [112] proposed a pixel-level disturbance detection approach, based on the historical time-series of each individual pixel. For each pixel, a stable “history” period is automatically determined and disturbances are compared to this regime [112]. This approach proved suitable for detecting drought-induced disturbance but was not so successful in removing background noise.
4.4. Removing Precipitation Influence
As previously mentioned, Rain Use Efficiency (RUE) is the quotient value of NPP to corresponding precipitation [22,81]. It has been proposed that degradation reduces the precipitation usage of an area, as overland flow and runoff increase with reduced vegetation cover and density. Thus, a reduced RUE can be indicative of land degradation, independent of climatic effects [22]. This mechanism is based on two key assumptions: (1) linearity in the response of NDVI/NPP to increased precipitation; and (2) an independence of RUE to fluctuation in its constituents [65]. The well reported linear relationship between NPP and rainfall in drylands [79] can potentially be compromised when tail events for both rainfall and NPP occur. At high precipitation amounts, factors other than rainfall become limitations to NPP, and increases in precipitation do not induce further productivity [79]. At very low precipitation there may be no vegetation present resulting in RUE values approaching infinity. This is further exacerbated by the positive intercept caused by soil reflectance [65]. At low biomass levels the vegetation is unable to prevent runoff and infiltration from occurring, thus subsequently low RUE will be observed. Rainfall increases may potentially drive an increase in both RUE and biomass, rendering RUE irrelevant as a detrending technique [84]. However, this interpretation has been criticised as being limited to sites with anomalous precipitation regimes [24,113,114]. RUE values have been demonstrated to correlate with inter-annual precipitation fluxes [65,88]. However, it is statistically questionable to test for dependence between RUE and rain as they are not independent [115]. Fensholt et al. [116] proposed the use of a seasonality subtracted “small integral” of NDVI, as opposed to the full growth season integral, which could mitigate against correlations with rainfall, provided linearity assumptions are satisfied.
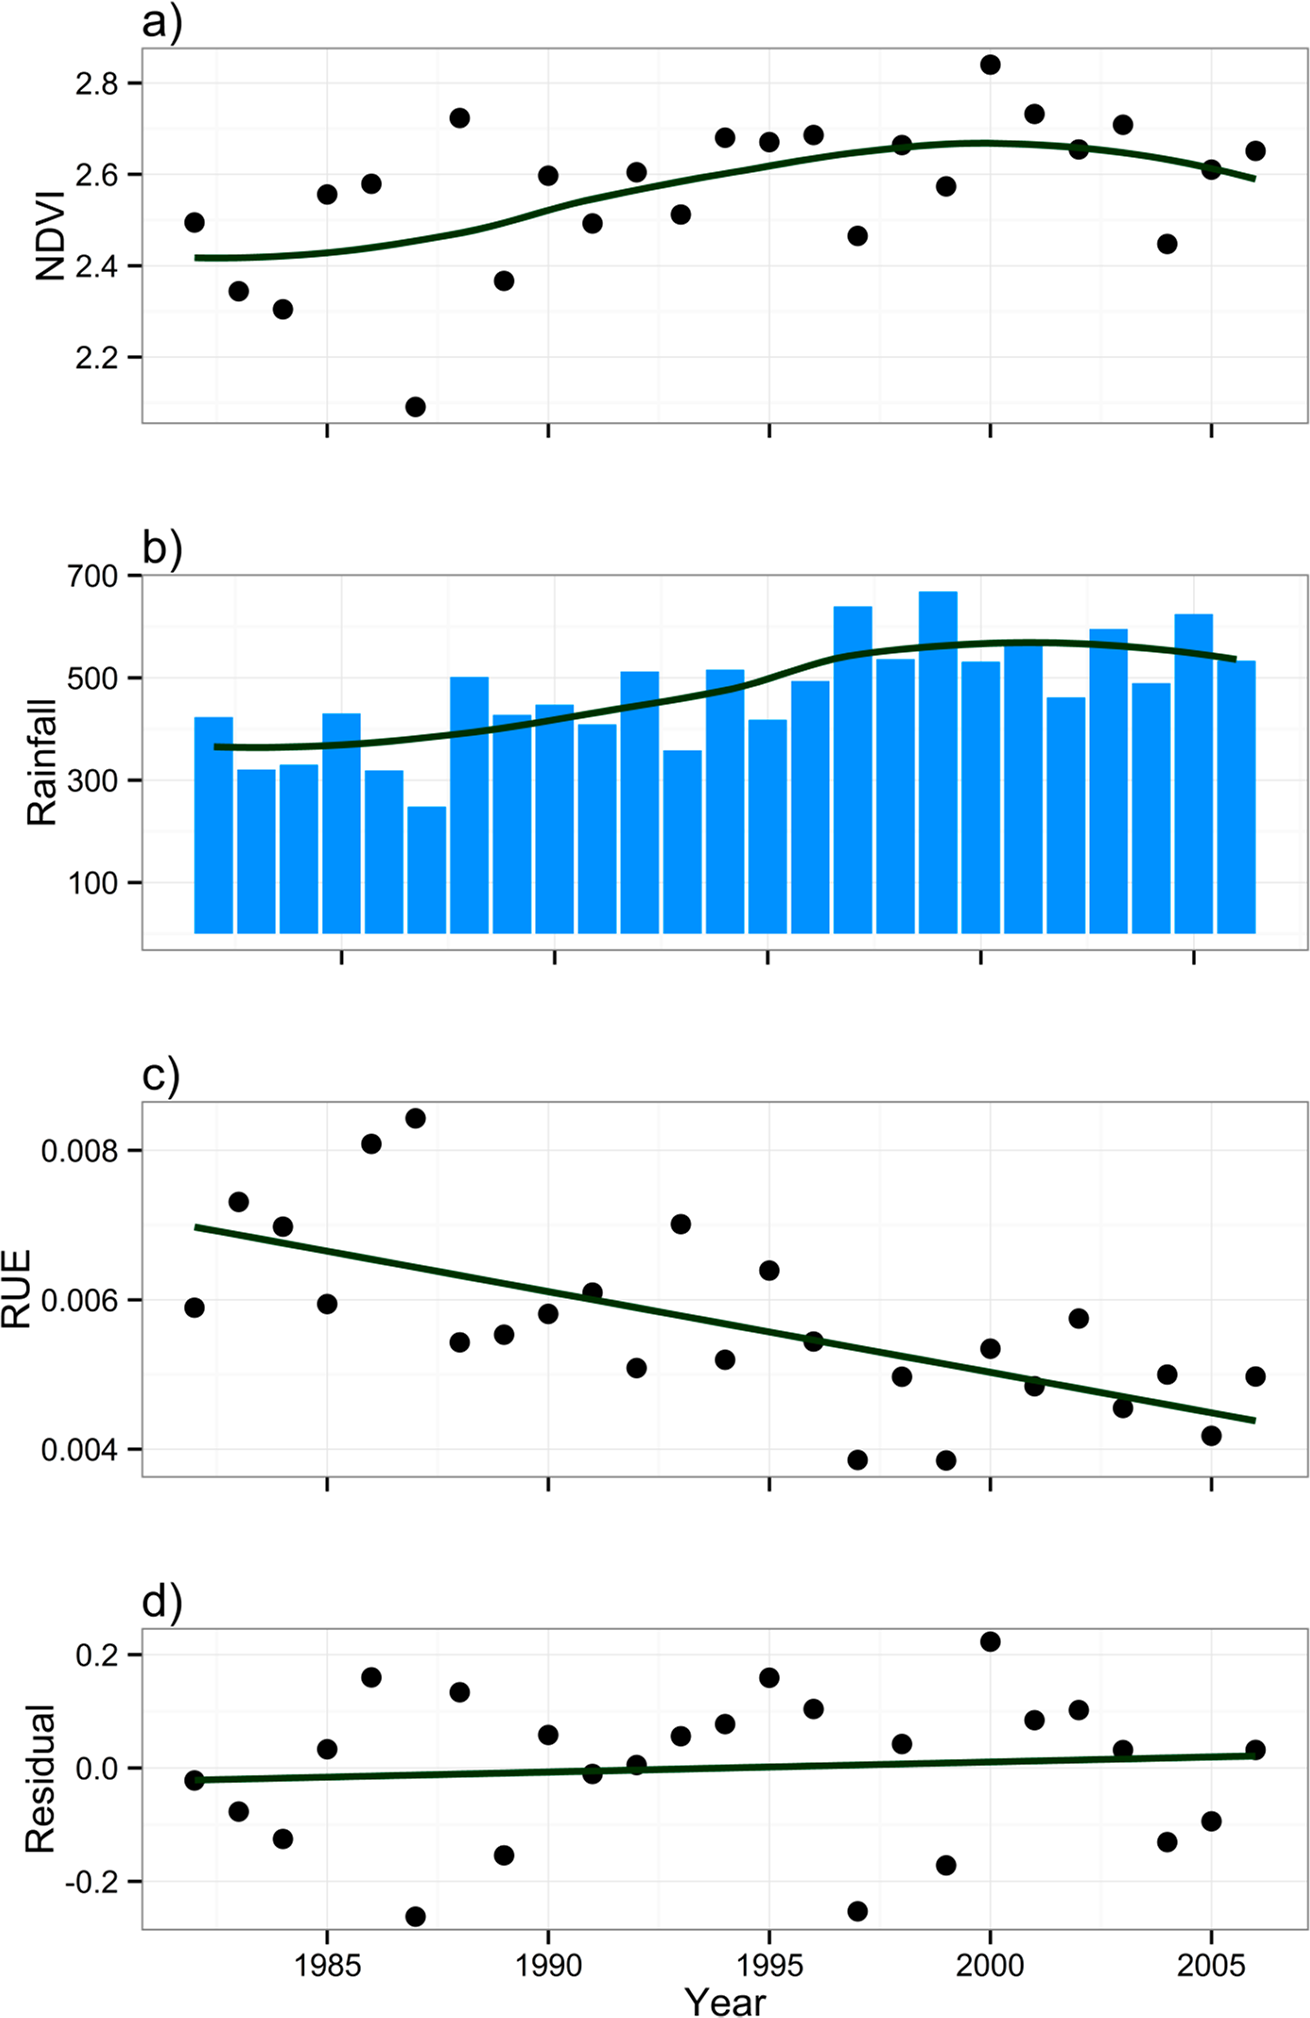
The Residual Trends (RESTREND) method compares the response of an NDVI time-series to a predicted response. The predicted response is generated by calculating a regression between NDVI values and precipitation [85,86]. The residuals from this regression are then subjected to a trend analysis. A positive trend in residuals indicates an increasing NDVI signal compared to the precipitation trend (land improvement), whereas a negative trend indicates a declining NDVI per precipitation unit (degradation). By implementing a statistical rather than a quotient method, this approach avoids the limitations of RUE with regards to linearity and dependence [88]. A comparison of RUE and RESTREND is shown in Figure 4, note the negative RUE trend induced by high rainfall at the end of the time series.
The Precipitation Marginal Response (PMR) quantifies the slope of a linear regression between NPP/NDVI and rainfall, thus describing the sensitivity of NPP to rainfall fluxes by expressing the change in the dependent variable (NDVI) per unit of precipitation [87,117].
5. Relating Time-Series Frameworks to Degradation Processes
All trend analysis assessments are based on the foundation that comparable sites, when subjected to degradation, will display reduced photosynthetic production, and thus NDVI [35,118]. This represents a symptomatic approach, as the mechanism of land degradation is irrelevant, provided a reduction in NPP materialises [13]. Thus, the two key assumptions of these methods are, firstly, that degradation consistently materialises as a reduction in NPP, and secondly, that NDVI variation is capable of capturing this reduction. These issues are reviewed below.
5.1. Does Land Degradation Initiate a Decline in NPP?
The assumption that land degradation reduces the NPP of a site is dependent upon the underlying mechanism. A reduction in vegetation cover, whilst species composition and diversity is maintained, will materialise as a reduction in NPP [10]. However, a common degradation mechanism affecting dryland regions is encroachment of woody shrub species into grasslands. This process results in an increase in bare ground coverage coupled with increased runoff and alterations of soil C and N stocks [45,119]. Nevertheless, shrubland encroachment does not necessitate a reduction in NPP. Thus, the analysis of the seasonal maximum or annual integral of NDVI is unlikely to detect this process successfully. However, shrubs species, and encroachment, do exhibit a number of distinct eco-hydrological responses, which may be exploited by an NDVI-based analysis. Shrubs species are, in general, perennial plants and manage to survive the dry season. Mitchard and Flintrop [120] mapped woody and shrub biomass in African Savannahs, using the dry season maximum NDVI. The results of this analysis agreed with collated field data of shrub encroachment and forest degradation, although the authors stipulate that the results should be viewed with caution due to the technical issue with dry season NDVI [120]. The ability of shrub species to support deeper root networks also influences their usage of precipitation. Williamson et al. [121] investigated the species-specific response of NDVI to preceding precipitation events. Grassland species reported the highest relationships for concurrent precipitations, whereas shrubland relationships were notably improved when the previous years were included [121]. Verón and Paruelo [87] highlighted the potential of variation in the rainfall-NDVI co-efficient (the precipitation marginal response) as a potential indicator of species composition variation. It should be noted that shrub encroachment is not universally accepted as a component of land degradation [122]. Nevertheless, the associated reduction in pastoral resource that accompanies an increase in shrub coverage makes it a commonly perceived degradation process in many regions, and is thus included herein. In addition to the commonly acknowledge process of shrub encroachment an impoverishment of woody vegetation species has also been reported [123]. Herrmann and Tappan [123] and Herrmann et al. [124] compared Senegalese vegetation trend maps with archive photography and focus group meetings with local inhabitants. Results indicated that NDVI derived-greening trends did not necessarily correlate with users perceptions of vegetation improvement. In some locations a decrease in tree coverage and a shift to drought tolerant shrub species was reported, irrespective of changes in population and land usage. Interestingly, opposing results were found for an area of the Sahel in Mali, where an increase in cultivation and tree cover was identified [125].
In summary, a variety of NDVI-based methods have been designed and tested, but validation of results, and hence the suitability of NDVI-based methods to assess degradation, remains limited
5.2. Can NDVI Trends Capture a Reduction in NPP?
The ground truthing and validation of products generated by remote sensing is a critical methodological stage. However, the validation of trend analyses is inherently problematic. It is rarely feasible to validate 30-year trends with a large spatial footprint. In addition, there are few biomass-sampling sites with a spatial scale suitable for validating coarse resolution pixels and even fewer sites with a continuous record dating back to the early 1980s. Here, we summarise the existing literature on comparisons of long-term biomass data with vegetation index values and trends, and discuss alternative methods of validation, such as qualitative validation and simulation analysis.
Wessels et al. [35] compared a 533-site, 19-year biomass dataset with an AVHRR-derived NDVI record for the Kruger National Park, South Africa. This comparison produced generally favourable correlations for the NDVI/biomass relationships, with an average R2 of 0.42 capturing the majority of inter-annual variability. Sites with low correlations were attributed to the heterogeneous land cover resulting in mixed pixels, poorly represented by the biomass samples [35]. A number of Sahelian localities have been subjected to long-term observation under the African Monsoon Multidisciplinary Analysis—Coupling the Tropical Atmosphere and the Hydrological Cycle (AMMA-CATCH) programme. Two of these sites, i.e., Gourma, located in northern Mali (data from 1984–2011) and Fakara in southern Niger (data from 1994–2011), were assessed against long-term GIMMS3g NDVI time-series trends [126]. At both sites, field data agreed with the direction and magnitude of the corresponding NDVI trend, with respective correlation co-efficients of 0.74 and 0.41. The co-efficient for Fakara becomes 0.59 when an outlier for 2010 is omitted [126]. The lower values obtained for Fakara were attributed to a mixed agro-pastoral land use pattern, when compared to the predominantly pastoral land use identified at the Gourma site [126]. The issue of localised land use/cover patterns resulting in mixed pixels was also noted by Brandt et al. [127]. This was partially rectified by utilising a higher-resolution NDVI product (Geoland V1 at 5 km resolution), which revealed patterns obscured by the GIMMS3g data. However, attempts to document localised factors for regional analysis proved problematic due to the large variety of land use/cover conditions present [128]. In the absence of long-term biomass records, a number of studies have used qualitative comparisons to validate trend outputs. Wessels et al. [88] compared rainfall-corrected NDVI trends, using RESTREND, to a national land survey output, with an acceptable level of agreement between the two outputs. Further qualitative validation was undertaken by Evans and Geerken [85], who used field study surveys and visual interpretation of Landsat imagery to validate degradation assessments for Syrian drylands. Both of these studies relied on a generally high level of agreement between outputs and the validation data to assess the reliability of applied methods. Studies that attempt large-scale regional [64,65] or global [8,14] assessments, frequently rely on even less robust validations and focus on the linkages of hot-spots with environmental change narratives postulated by field studies. Although commonplace, studies utilising qualitative validation methods have been highly criticised. Wessels et al. [21] highlighted that this process does not sufficiently assess the accuracy and sensitivity of methodologies to variable start-dates and intensities of degradation.
A recent alternative to the approaches above is simulation analysis, which tests the sensitivity of methods by artificially altering a dataset prior to analysis, thus a technique is assessed against a known baseline. This approach has been used to test the responsiveness of time-series segmentation methods aiming to decompose noisy data series [107,112,129] prior to the application on a global time-series [68,106]. The advantage of the simulation approach is that the intensity and duration of a shift can be determined, and the response of the applied analysis directly compared [130]. A land degradation simulation assessment was implemented by Wessels et al. [21], where a variety of start-date and intensity land degradation simulations were applied to 1 km-NDVI data covering the Kruger National Park, to represent the degradation of a non-degraded baseline. This study revealed that an NDVI reduction of 20%–40% was required to identify a significant negative trend in the region, using either RESTREND or a number of other trend techniques [21]. Thus, the majority of trend techniques employed [8] would be capable of detecting only the most severe of degradation processes, and would therefore not be useful as a degradation early-warning system [21]. Comparable simulation experiments were used to test the sensitivity of RUE in the Sahel region [115]. Here a degradation of >20% was found to be detectable, provided it did not occur at the start or end period of analysis.
A number of studies have proposed that additional analyses using higher resolution imagery, such as the Landsat and SPOT satellites, would be well suited to provide further localised information on trends observed [63,131,132]. Comparisons of Landsat and AVHRR-based trends have revealed generally similar patterns [131], with further analysis demonstrating that vegetation estimates derived from Landsat imagery all display similar trend patterns [133]. Recent progress in applying time-series analysis on Landsat imagery stacks has demonstrated the potential for observing land use/cover variation at high spatial and temporal resolution [134–137]. In addition, the ability to generate large-area compositing techniques from multiple Landsat scenes [138,139], offers new opportunities for multi-scale analyses to improve on the relationships between land use/cover change and NDVI trends on multiple spatial and temporal scales.
An important consideration of remote sensing studies is the resolution and scale of imagery used [140]. Higher resolution imagery will better identify local issues and trends, particularly in heterogeneous areas [128,131]. This advantage must be balanced with the more generalised large-scale view undertaken a large number of studies, where observing local factors is not a primary objective [8,14]. NDVI-based studies have historically been limited to the coarse-resolution preprocessed datasets details above (Table 1); this has limited the discussion of the impacts of altering the scale upon trend estimations. Recent developments in the provision of both free and pre-processed Landsat data [141,142] may lead to an increased focus on higher-resolution sensor data, therefore the impact of varying pixel size on trend estimation should be a research priority prior to the undertaking analysis.
6. Conclusions and Outlook
Land degradation and desertification are important issues to both ecological and social research. The need for a quantitative, repeatable methodology to assess land degradation and desertification reliably is more pressing than ever before. EO data offer the only viable method for large-scale assessments, and despite the continued controversy over the techniques used, considerable progress has been made over the last 30 years. This review has identified two key prerequisites to the establishment of degradation and desertification monitoring and early warning systems. Firstly, methodologies must be subject to a standardised and robust validation in order for policy makers and planners to have confidence in results; secondly, degradation at minor intensities or early stages must be detectable in order for preventive action to be taken before irreversible damage occurs.
The validation of trend analysis would ideally be undertaken by robust comparisons with field biomass data covering a comparable spatial and temporal scale. However, this is rarely possible. The need for using remotely sensed vegetation data is related to this very issue and a major concern is the requirement for consistency between studies. This could potentially be achieved through a standardised comparison with whatever long-term data exist. The proposed Global Drylands Observing System (GDOS) [143,144] would be a critical precursor to this. Alternatively, the simulation experiments proposed by Wessels et al. [21] and Verbesselt et al. [112] offer clear potential for the development of consistent and repeatable methodologies [115], which could be aided by the transition to open-source statistical programs. The availability of packages such as BFAST [107] and Greenbrown [130] demonstrates the potential for such a transition.
The early detection of land degradation, particularly at low intensities represents a major limitation on the usability of degradation early-warning and monitoring systems. The application of structural and real-time change detection represent the greatest progress on this issue, but further work is still required. Bayesian statistics, whereby model assumptions are based on prior knowledge, may also be beneficial for identifying deviation form expected trajectories.
The land degradation monitoring community may also benefit from the experiences of deforestation observation projects, which have acknowledged the importance of local stakeholders and end-users for efficient development [145,146]. The use of volunteered information and photographs for validation of land cover maps could be of value as an additional data source in regions with limited long-term field data. The monitoring of desertification is meaningless if not integrated with local end-users. The traditional top-down approach of researchers developing products leads to a lack of connection between the intended users and the design procedure, and may not be suitable for handling the wide variety of local issues [145]. Software tailored for land degradation, comparable to the CLASlite (Carnegie Landsat Analysis System-lite) program, which allows end-users to access information and development methodologies to map deforestation and forest cover, would be of advantageous [147]. However, technological limitations in many developing regions may hamper the uptake of such technology [148].
It should be cautioned that NDVI analysis is best suited as one component of a multi-faceted methodology. The multiple symptoms and drivers of land degradation provide a number of opportunities for quantitative assessment using EO [149,150]. It is through the combination of these indicators that a holistic assessment of land degradation can be achieved [15,151]. In addition, NDVI-based analyses only consider the biomass of an ecosystem; this falls short of fully appreciating the wide range of ecosystem services and local uses that may be present [152]. Degradation assessments cannot be achieved through a biomass or Carbon stock assessment alone, as it is the usage and flow of biomass/Carbon that provide benefit to the biosphere [153]. Land degradation and desertification prevention and remediation efforts should also consider local stakeholder usage and ecosystem functions in order to promote poverty alleviation and environmental health objectives in synchrony [154].
Acknowledgments
We thank the editors and anonymous reviewers for their in-depth comments and review, which greatly improved this manuscript. Thomas Higginbottom is funded by a Manchester Metropolitan University (MMU) Research Fellowship. Elias Symeonakis is supported by an EU FP7 Marie Curie Career Integration Grant (PCIG12-GA-2012-3374327) and an MMU Research Accelerator Grant.
Author Contributions
Thomas Higginbottom is the main author who initiated the idea and wrote the manuscript; Elias Symeonakis provided review and comment.
Conflicts of Interest
The authors declare no conflict of interest.
References
- UNCCD, United Nations Convention to Combat Desertification in Those Countries Experiencing Serious Drought and/or Desertification, Particularly in Africa; UN: Paris, France, 1994.
- UNCCD, Recommendations and Conclusions of the African Regional Conference Preparatory to the First Session of the Committee for the Review of the Implementation of the United Nations Convention to Combat Desertification (UNCCD–CRIC1); Secretariat of the Convention to Combat Desertification: Windhoek, Namibia, 2002.
- Grainger, A. Is Land Degradation Neutrality feasible in dry areas? J. Arid Environ 2014, 7. [Google Scholar] [CrossRef]
- Oldeman, L.; Hakkeling, R.; Sombrock, W. Global Assessment of Soil Degradation (GLASOD). World Map of the Status of Human–Induced Soil Degradation; ISRIC: Wageningen, The Netherlands, 1991. [Google Scholar]
- Nicholson, S.E.; Tucker, C.J.; Ba, M.B. Desertification, drought, and surface vegetation: An example from the West African Sahel. Bull. Am. Meteorol. Soc 1998, 79, 815–830. [Google Scholar]
- Thomas, D.S.; Middleton, N.J. Desertification: Exploding the Myth; John Wiley & Sons Ltd: Hoboken, NJ, USA, 1994. [Google Scholar]
- Glenn, E.; Stafford Smith, M.; Squires, V. On our failure to control desertification: Implications for global change issues, and a research agenda for the future. Environ. Sci. Policy 1998, 1, 71–78. [Google Scholar]
- Fensholt, R.; Langanke, T.; Rasmussen, K.; Reenberg, A.; Prince, S.D.; Tucker, C.; Scholes, R.J.; Le, Q.B.; Bondeau, A.; Eastman, R. Greenness in semi-arid areas across the globe 1981–2007—An Earth Observing Satellite based analysis of trends and drivers. Remote Sens. Environ 2012, 121, 144–158. [Google Scholar]
- Helldén, U.; Tottrup, C. Regional desertification: A global synthesis. Glob. Planet. Chang 2008, 64, 169–176. [Google Scholar]
- Miehe, S.; Kluge, J.; von Wehrden, H.; Retzer, V. Long-term degradation of Sahelian rangeland detected by 27 years of field study in Senegal. J. Appl. Ecol 2010, 47, 692–700. [Google Scholar]
- Hein, L.; de Ridder, N.; Hiernaux, P.; Leemans, R.; de Wit, A.; Schaepman, M. Desertification in the Sahel: Towards better accounting for ecosystem dynamics in the interpretation of remote sensing images. J. Arid Environ 2011, 75, 1164–1172. [Google Scholar]
- Veron, S.; Paruelo, J.; Oesterheld, M. Assessing desertification. J. Arid Environ 2006, 66, 751–763. [Google Scholar]
- Hill, J.; Stellmes, M.; Udelhoven, T.; Röder, A.; Sommer, S. Mediterranean desertification and land degradation: Mapping related land use change syndromes based on satellite observations. Glob. Planet. Chang 2008, 64, 146–157. [Google Scholar]
- Bai, Z.G.; Dent, D.L.; Olsson, L.; Schaepman, M.E. Proxy global assessment of land degradation. Soil Use Manag 2008, 24, 223–234. [Google Scholar]
- Symeonakis, E.; Drake, N. Monitoring desertification and land degradation over sub-Saharan Africa. Int. J. Remote Sens 2004, 25, 573–592. [Google Scholar]
- Warren, A. Land degradation is contextual. Land Degrad. Dev 2002, 13, 449–459. [Google Scholar]
- Stebbing, E. The encroaching Sahara: The threat to the West African colonies. Geogr. J 1935, 85, 506–519. [Google Scholar]
- Chartres, C. Australia’s land resources at risk. In Land Degradation: Problems and Policies; Chisholm, A., Dumsday, R., Eds.; Cambridge University Press: Cambridge, UK, 1987; pp. 7–26. [Google Scholar]
- Herrmann, S.M.; Hutchinson, C.F. The changing contexts of the desertification debate. J. Arid Environ 2005, 63, 538–555. [Google Scholar]
- Safriel, U.; Adeel, Z. Dryland systems. In Ecosystems and Human Well-Being: Current State and Trends; Hassan, R., Scholes, R.J., Ash, N., Eds.; Island Press: London, UK, 2005; Volume 1, p. 917. [Google Scholar]
- Wessels, K.J.; van den Bergh, F.; Scholes, R.J. Limits to detectability of land degradation by trend analysis of vegetation index data. Remote Sens. Environ 2012, 125, 10–22. [Google Scholar]
- Prince, S.D.; Colstoun, D.; Brown, E.; Kravitz, L. Evidence from rain-use efficiencies does not indicate extensive Sahelian desertification. Glob. Chang. Biol 1998, 4, 359–374. [Google Scholar]
- Tucker, C.J.; Justice, C.O.; Prince, S.D. Monitoring the grasslands of the Sahel 1984–1985. Int. J. Remote Sens 1986, 7, 1571–1581. [Google Scholar]
- Prince, S.D.; Wessels, K.J.; Tucker, C.J.; Nicholson, S.E. Desertification in the Sahel: A reinterpretation of a reinterpretation. Glob. Chang. Biol 2007, 13, 1308–1313. [Google Scholar]
- Wessels, K. Comments on “Proxy global assessment of land degradation”. Soil Use Manag 2008, 25, 91–92. [Google Scholar]
- Alcaraz-Segura, D.; Chuvieco, E.; Epstein, H.E.; Kasischke, E.S.; Trishchenko, A. Debating the greening vs. browning of the North American boreal forest: Differences between satellite datasets. Glob. Chang. Biol 2010, 16, 760–770. [Google Scholar]
- Deering, D.W. Rangeland Reflectance Characteristics Measured by Aircraft and Spacecraft Sensors; Texas A & M University: College Station, TX, USA, 1978. [Google Scholar]
- Rouse, J., Jr.; Haas, R.; Schell, J.; Deering, D. Monitoring vegetation systems in the Great Plains with ERTS. In Proceedings of the Third ERTS Symposium, NASA, Washington, DC, USA, 10–14 December 1973; p. 309.
- Birth, G.S.; McVey, G.R. Measuring the color of growing turf with a reflectance spectrophotometer. Agron. J 1968, 60, 640–643. [Google Scholar]
- Jordan, C.F. Derivation of leaf-area index from quality of light on the forest floor. Ecology 1969, 50, 663–666. [Google Scholar]
- Pearson, R.L.; Miller, L.D. Remote mapping of standing crop biomass for estimation of the productivity of the shortgrass prairie. Proceedings of the Eighth International Symposium on Remote Sensing of Environment, Ann Arbor, MI, USA, 2–6 October 1972.
- Tucker, C.J. Red and photographic infrared linear combinations for monitoring vegetation. Remote Sens. Environ 1979, 8, 127–150. [Google Scholar]
- Tucker, C.; Vanpraet, C.L.; Sharman, M.; van Ittersum, G. Satellite remote sensing of total herbaceous biomass production in the Senegalese Sahel: 1980–1984. Remote Sens. Environ 1985, 17, 233–249. [Google Scholar]
- Prince, S.D.; Tucker, C.J. Satellite remote sensing of rangelands in Botswana. II. NOAA AVHRR and herbaceous vegetation. Int. J. Remote Sens 1986, 7, 1555–1570. [Google Scholar]
- Wessels, K.; Prince, S.; Zambatis, N.; MacFadyen, S.; Frost, P.; van Zyl, D. Relationship between herbaceous biomass and 1-km2 Advanced Very High Resolution Radiometer (AVHRR) NDVI in Kruger National Park, South Africa. Int. J. Remote Sens 2006, 27, 951–973. [Google Scholar]
- Eisfelder, C.; Kuenzer, C.; Dech, S. Derivation of biomass information for semi-arid areas using remote-sensing data. Int. J. Remote Sens 2012, 33, 2937–2984. [Google Scholar]
- Townshend, J.R. Global data sets for land applications from the Advanced Very High Resolution Radiometer: An introduction. Int. J. Remote Sens 1994, 15, 3319–3332. [Google Scholar]
- Tucker, C.J.; Pinzon, J.E.; Brown, M.E.; Slayback, D.A.; Pak, E.W.; Mahoney, R.; Vermote, E.F.; el Saleous, N. An extended AVHRR 8-km NDVI dataset compatible with MODIS and SPOT vegetation NDVI data. Int. J. Remote Sens 2005, 26, 4485–4498. [Google Scholar]
- Pinzon, J.E.; Tucker, C.J. A non-stationary 1981–2012 AVHRR NDVI3g time series. Remote Sens 2014, 6, 6929–6960. [Google Scholar]
- Verger, A.; Baret, F.; Weiss, M.; Lacaze, R.; Makhmara, H.; Vermote, E. Long term consistent global GEOV1 AVHRR biophysical products. In Proceedings of the 1st EARSeL Workshop on Temporal Analysis of Satellite Images, Mykonos, Greece, 23–25 May 2012; pp. 1–6.
- Pettorelli, N. The Normalized Difference Vegetation Index; Oxford University Press: Oxford, UK, 2013. [Google Scholar]
- Hulme, M. Climatic perspectives on Sahelian desiccation: 1973–1998. Glob. Environ. Chang 2001, 11, 19–29. [Google Scholar]
- Aubréville, A. Climats, Forêts et Désertification de l’Afrique Tropicale; Société des Editions Gelgraphiques, Maritimes et Coloniales: Paris, France, 1949. [Google Scholar]
- Lamprey, H. Report on the Desert Encroachment Reconnaissance in Northern Sudan, Khartoum; National Council for Research, Ministry of Agriculture: Khartoum, Sudan, 1975. [Google Scholar]
- D’Odorico, P.; Bhattachan, A.; Davis, K.F.; Ravi, S.; Runyan, C.W. Global desertification: Drivers and feedbacks. Adv. Water Resour 2013, 51, 326–344. [Google Scholar]
- Sinclair, A.; Fryxell, J. The Sahel of Africa: Ecology of a disaster. Can. J. Zool 1985, 63, 987–994. [Google Scholar]
- Dregne, H. Desertification of arid lands. In Physics of Desertification; Springer: Berlin, Germany, 1986; pp. 4–34. [Google Scholar]
- Charney, J.G. Dynamics of deserts and drought in the Sahel. Q. J. R. Meteorol. Soc 1975, 101, 193–202. [Google Scholar]
- Charney, J.; Quirk, W.J.; Chow, S.H.; Kornfield, J. A comparative study of the effects of albedo change on drought in semi-arid regions. J. Atmos. Sci 1977, 34, 1366–1385. [Google Scholar]
- Prothero, R.M. Some perspectives on drought in north-west Nigeria. Afr. Aff 1974, 73, 162–169. [Google Scholar]
- Tsoar, H.; Karnieli, A. What determines the spectral reflectance of the Negev-Sinai sand dunes. Int. J. Remote Sens 1996, 17, 513–525. [Google Scholar]
- Otterman, J.; Tucker, C. Satellite measurements of surface albedo and temperatures in semi-desert. J. Clim. Appl. Meteorol 1985, 24, 228–235. [Google Scholar]
- Otterman, J. Satellite and field studies of man’s impact on the surface in arid regions. Tellus 1981, 33, 68–77. [Google Scholar]
- Helldén, U. Desertification: Time for an assessment? Ambio 1991, 20, 372–383. [Google Scholar]
- Hellden, U. Remote sensing for drought impact assessment—A study of land transformation in Kordofan, Sudan. Adv. Space Res 1984, 4, 165–168. [Google Scholar]
- Ahlcrona, E. The Impact of Climate and Man on Land Transformation in Central Sudan: Applications of Remote Sensing; Meddelanden Fraan Lunds Universitets Geografiska Institutioner: Avhandlingar, Sweden, 1988. [Google Scholar]
- Hanan, N.P.; Prevost, Y.; Diouf, A.; Diallo, O. Assessment of desertification around deep wells in the Sahel using satellite imagery. J. Appl. Ecol 1991, 28, 173–186. [Google Scholar]
- Tucker, C.J.; Dregne, H.E.; Newcomb, W.W. Expansion and contraction of the Sahara Desert from 1980 to 1990. Science 1991, 253, 299–301. [Google Scholar]
- Skole, D.; Tucker, C. Tropical deforestation and habitat fragmentation in the Amazon. Satellite data from 1978 to 1988. Science 1993, 260, 1905–1910. [Google Scholar]
- Malingreau, J.P.; Tucker, C.J. Large-scale deforestation in the southeastern Amazon basin of Brazil. Ambio 1988, 17, 49–55. [Google Scholar]
- Janowiak, J.E. An investigation of interannual rainfall variability in Africa. J. Clim 1988, 1, 240–255. [Google Scholar]
- Eklundh, L.; Olsson, L. Vegetation index trends for the African Sahel 1982–1999. Geophys. Res. Lett 2003, 30. [Google Scholar] [CrossRef]
- Herrmann, S.M.; Anyamba, A.; Tucker, C.J. Recent trends in vegetation dynamics in the African Sahel and their relationship to climate. Glob. Environ. Change 2005, 15, 394–404. [Google Scholar]
- Huber, S.; Fensholt, R.; Rasmussen, K. Water availability as the driver of vegetation dynamics in the African Sahel from 1982 to 2007. Glob. Planet Change 2011, 76, 186–195. [Google Scholar]
- Fensholt, R.; Rasmussen, K. Analysis of trends in the Sahelian “rain-use efficiency” using GIMMS NDVI, RFE and GPCP rainfall data. Remote Sens. Environ 2011, 115, 438–451. [Google Scholar]
- Hickler, T.; Eklundh, L.; Seaquist, J.W.; Smith, B.; Ardö, J.; Olsson, L.; Sykes, M.T.; Sjöström, M. Precipitation controls Sahel greening trend. Geophys. Res. Lett 2005, 32. [Google Scholar] [CrossRef]
- Seaquist, J.W.; Hickler, T.; Eklundh, L.; Ardö, J.; Heumann, B.W. Disentangling the effects of climate and people on Sahel vegetation dynamics. Biogeosciences 2009, 6, 469–477. [Google Scholar]
- De Jong, R.; Verbesselt, J.; Zeileis, A.; Schaepman, M.E. Shifts in global vegetation activity trends. Remote Sens 2013, 5, 1117–1133. [Google Scholar]
- Donohue, R.J.; McVicar, T.R.; Roderick, M.L. Climate-related trends in australian vegetation cover as inferred from satellite observations, 1981–2006. Glob. Chang. Biol 2009, 15, 1025–1039. [Google Scholar]
- De Jong, R.; de Bruin, S.; de Wit, A.; Schaepman, M.E.; Dent, D.L. Analysis of monotonic greening and browning trends from global NDVI time-series. Remote Sens. Environ 2011, 115, 692–702. [Google Scholar]
- Piao, S.; Fang, J.; Liu, H.; Zhu, B. NDVI-indicated decline in desertification in China in the past two decades. Geophys. Res. Lett 2005, 32. [Google Scholar] [CrossRef]
- Jeong, S.J.; Ho, C.H.; Brown, M.E.; Kug, J.S.; Piao, S. Browning in desert boundaries in Asia in recent decades. J. Geophys. Res. Atmos 2011, 116. [Google Scholar] [CrossRef]
- Heumann, B.W.; Seaquist, J.; Eklundh, L.; Jönsson, P. AVHRR derived phenological change in the Sahel and Soudan, Africa, 1982–2005. Remote Sens. Environ 2007, 108, 385–392. [Google Scholar]
- Piao, S.; Fang, J.; Zhou, L.; Ciais, P.; Zhu, B. Variations in satellite-derived phenology in China’s temperate vegetation. Glob. Change Biol 2006, 12, 672–685. [Google Scholar]
- Giannini, A.; Saravanan, R.; Chang, P. Oceanic forcing of Sahel rainfall on interannual to interdecadal time scales. Science 2003, 302, 1027–1030. [Google Scholar]
- Haywood, J.M.; Jones, A.; Bellouin, N.; Stephenson, D. Asymmetric forcing from stratospheric aerosols impacts Sahelian rainfall. Nat. Clim. Change 2013, 3, 660–665. [Google Scholar]
- De Jong, R.; Schaepman, M.E.; Furrer, R.; Bruin, S.; Verburg, P.H. Spatial relationship between climatologies and changes in global vegetation activity. Glob. Change Biol 2013, 19, 1953–1964. [Google Scholar]
- Wessels, K.J. Letter to the editor: Comments on “Proxy global assessment of land degradation” by Bai et al. 2008. Soil Use Manag 2009, 25, 91–92. [Google Scholar]
- Nicholson, S.E.; Davenport, M.L.; Malo, A.R. A comparison of the vegetation response to rainfall in the Sahel and East Africa, using normalized difference vegetation index from NOAA AVHRR. Clim. Change 1990, 17, 209–241. [Google Scholar]
- Peng, S.; Chen, A.; Xu, L.; Cao, C.; Fang, J.; Myneni, R.B.; Pinzon, J.E.; Tucker, C.J.; Piao, S. Recent change of vegetation growth trend in China. Environ. Res. Lett 2011, 6. [Google Scholar] [CrossRef]
- Le Houerou, H.N. Rain use efficiency: A unifying concept in arid-land ecology. J. Arid Environ 1984, 7, 213–247. [Google Scholar]
- Nicholson, S.E.; Farrar, T.J. The influence of soil type on the relationships between NDVI, rainfall and soil moisture in semiarid Botswana. I. NDVI response to rainfall. Remote Sens. Environ 1994, 50, 107–120. [Google Scholar]
- Farrar, T.J.; Nicholson, S.E.; Lare, A.R. The influence of soil type on the relationships between NDVI, rainfall, and soil moisture in semiarid Botswana. II. NDVI response to soil moisture. Remote Sens. Environ 1994, 50, 121–133. [Google Scholar]
- Hein, L.; de Ridder, N. Desertification in the Sahel: A reinterpretation. Glob. Change Biol 2006, 12, 751–758. [Google Scholar]
- Evans, J.; Geerken, R. Discrimination between climate and human-induced dryland degradation. J. Arid Environ 2004, 57, 535–554. [Google Scholar]
- Archer, E.R.M. Beyond the “climate vs. grazing” impasse: Using remote sensing to investigate the effects of grazing system choice on vegetation cover in the eastern Karoo. J. Arid Environ 2004, 57, 381–408. [Google Scholar]
- Verón, S.R.; Paruelo, J.M. Desertification alters the response of vegetation to changes in precipitation. J. Appl. Ecol 2010, 47, 1233–1241. [Google Scholar]
- Wessels, K.; Prince, S.; Malherbe, J.; Small, J.; Frost, P.; VanZyl, D. Can human-induced land degradation be distinguished from the effects of rainfall variability? A case study in South Africa. J. Arid Environ 2007, 68, 271–297. [Google Scholar]
- De Beurs, K.; Henebry, G. A statistical framework for the analysis of long image time series. Int. J. Remote Sens 2005, 26, 1551–1573. [Google Scholar]
- Gaughan, A.E.; Stevens, F.R.; Gibbes, C.; Southworth, J.; Binford, M.W. Linking vegetation response to seasonal precipitation in the Okavango-Kwando-Zambezi catchment of southern Africa. Int. J. Remote Sens 2012, 33, 6783–6804. [Google Scholar]
- Lennon, J.J. Red-shifts and red herrings in geographical ecology. Ecography 2000, 23, 101–113. [Google Scholar]
- Martiny, N.; Camberlin, P.; Richard, Y.; Philippon, N. Compared regimes of NDVI and rainfall in semi-arid regions of Africa. Int. J.Remote Sens 2006, 27, 5201–5223. [Google Scholar]
- Philippon, N.; Jarlan, L.; Martiny, N.; Camberlin, P.; Mougin, E. Characterization of the interannual and intraseasonal variability of West African vegetation between 1982 and 2002 by means of NOAA AVHRR NDVI data. J. Clim 2007, 20, 1202–1218. [Google Scholar]
- Richard, Y.; Martiny, N.; Rouault, M.; Philippon, N.; Tracol, Y.; Castel, T. Multi-month memory effects on early summer vegetative activity in semi-arid South Africa and their spatial heterogeneity. Int. J. Remote Sens 2012, 33, 6763–6782. [Google Scholar]
- Theil, H. A rank-invariant method of linear and polynomial regression analysis. In Henri Theil’s Contributions to Economics and Econometrics; Springer: Berlin, Germany, 1992; pp. 345–381. [Google Scholar]
- Sen, P.K. Estimates of the regression coefficient based on Kendall’s tau. J. Am. Stat. Assoc 1968, 63, 1379–1389. [Google Scholar]
- Kendall, M.G. A new measure of rank correlation. Biometrika 1938, 30, 81–93. [Google Scholar]
- Cracknell, A.P. The exciting and totally unanticipated success of the AVHRR in applications for which it was never intended. Adv. Space Res 2001, 28, 233–240. [Google Scholar]
- Holben, B.N. Characteristics of maximum-value composite images from temporal AVHRR data. Int. J. Remote Sens 1986, 7, 1417–1434. [Google Scholar]
- Nagol, J.R.; Vermote, E.F.; Prince, S.D. Effects of atmospheric variation on AVHRR NDVI data. Remote Sens. Environ 2009, 113, 392–397. [Google Scholar]
- Nagol, J.R.; Vermote, E.F.; Prince, S.D. Quantification of impact of orbital drift on inter-annual trends in AVHRR NDVI data. Remote Sens 2014, 6, 6680–6687. [Google Scholar]
- Alcaraz-Segura, D.; Liras, E.; Tabik, S.; Paruelo, J.; Cabello, J. Evaluating the consistency of the 1982–1999 NDVI trends in the Iberian Peninsula across four time-series derived from the AVHRR sensor: LTDR, GIMMS, FASIR, and PAL-II. Sensors 2010, 10, 1291–1314. [Google Scholar]
- Baldi, G.; Nosetto, M.D.; Aragón, R.; Aversa, F.; Paruelo, J.M.; Jobbágy, E.G. Long-term satellite NDVI data sets: Evaluating their ability to detect ecosystem functional changes in South America. Sensors 2008, 8, 5397–5425. [Google Scholar]
- Scheftic, W.; Zeng, X.; Broxton, P.; Brunke, M. Intercomparison of seven NDVI products over the United States and Mexico. Remote Sens 2014, 6, 1057–1084. [Google Scholar]
- Beck, H.E.; McVicar, T.R.; van Dijk, A.I.J.M.; Schellekens, J.; de Jeu, R.A.M.; Bruijnzeel, L.A. Global evaluation of four AVHRR–NDVI data sets: Intercomparison and assessment against Landsat imagery. Remote Sens. Environ 2011, 115, 2547–2563. [Google Scholar]
- De Jong, R.; Verbesselt, J.; Schaepman, M.E.; Bruin, S. Trend changes in global greening and browning: Contribution of short-term trends to longer-term change. Glob. Change Biol 2012, 18, 642–655. [Google Scholar]
- Verbesselt, J.; Hyndman, R.; Newnham, G.; Culvenor, D. Detecting trend and seasonal changes in satellite image time series. Remote Sens.Environ 2010, 114, 106–115. [Google Scholar]
- Haile, M. Weather patterns, food security and humanitarian response in sub-Saharan Africa. Philos. Trans. R. Soc. B Biol. Sci 2005, 360, 2169–2182. [Google Scholar]
- Hargrove, W.W.; Spruce, J.P.; Gasser, G.E.; Hoffman, F.M. Toward a national early warning system for forest disturbances using remotely sensed canopy phenology. Photogramm. Eng. Remote Sens 2009, 75, 1150–1156. [Google Scholar]
- Spruce, J.P.; Sader, S.; Ryan, R.E.; Smoot, J.; Kuper, P.; Ross, K.; Prados, D.; Russell, J.; Gasser, G.; McKellip, R.; et al. Assessment of MODIS NDVI time series data products for detecting forest defoliation by gypsy moth outbreaks. Remote Sens. Environ 2011, 115, 427–437. [Google Scholar]
- White, M.A.; Nemani, R.R. Real-time monitoring and short-term forecasting of land surface phenology. Remote Sens. Environ 2006, 104, 43–49. [Google Scholar]
- Verbesselt, J.; Zeileis, A.; Herold, M. Near real-time disturbance detection using satellite image time series. Remote Sens. Environ 2012, 123, 98–108. [Google Scholar]
- Kaspersen, P.S.; Fensholt, R.; Huber, S. A spatiotemporal analysis of climatic drivers for observed changes in Sahelian vegetation productivity (1982–2007). Int. J. Geophys 2011, 2011. [Google Scholar] [CrossRef]
- Ruppert, J.C.; Holm, A.; Miehe, S.; Muldavin, E.; Snyman, H.A.; Wesche, K.; Linstädter, A. Meta-analysis of ANPP and rain-use efficiency confirms indicative value for degradation and supports non-linear response along precipitation gradients in drylands. J. Veg. Sci 2012, 23, 1035–1050. [Google Scholar]
- Dardel, C.; Kergoat, L.; Hiernaux, P.; Grippa, M.; Mougin, E.; Ciais, P.; Nguyen, C.C. Rain-use-efficiency: What it tells us about the conflicting Sahel greening and Sahelian paradox. Remote Sens 2014, 6, 3446–3474. [Google Scholar]
- Fensholt, R.; Rasmussen, K.; Kaspersen, P.; Huber, S.; Horion, S.; Swinnen, E. Assessing land degradation/recovery in the African Sahel from long-term earth observation based primary productivity and precipitation relationships. Remote Sens 2013, 5, 664–686. [Google Scholar]
- Verón, S.R.; Oesterheld, M.; Paruelo, J.M. Production as a function of resource availability: Slopes and efficiencies are different. J. Veg. Sci 2005, 16, 351–354. [Google Scholar]
- Prince, S.D.; Reshef, I.; Rishmawi, K. Detection and mapping of long-term land degradation using local net production scaling: Application to Zimbabwe. Remote Sens. Environ 2009, 113, 1046–1057. [Google Scholar]
- Ravi, S.; Breshears, D.D.; Huxman, T.E.; D’Odorico, P. Land degradation in drylands: Interactions among hydrologic–aeolian erosion and vegetation dynamics. Geomorphology 2010, 116, 236–245. [Google Scholar]
- Mitchard, E.T.; Flintrop, C.M. Woody encroachment and forest degradation in sub-Saharan Africa’s woodlands and savannas 1982–2006. Philos. Trans. R. Soc. B Biol. Sci 2013, 368. [Google Scholar] [CrossRef]
- Williamson, J.C.; Bestelmeyer, B.T.; Peters, D.P. Spatiotemporal patterns of production can be used to detect state change across an arid landscape. Ecosystems 2012, 15, 34–47. [Google Scholar]
- Eldridge, D.J.; Bowker, M.A.; Maestre, F.T.; Roger, E.; Reynolds, J.F.; Whitford, W.G. Impacts of shrub encroachment on ecosystem structure and functioning: Towards a global synthesis. Ecol. Lett 2011, 14, 709–722. [Google Scholar]
- Herrmann, S.M.; Tappan, G.G. Vegetation impoverishment despite greening: A case study from central Senegal. J. Arid Environ 2013, 90, 55–66. [Google Scholar]
- Herrmann, S.M.; Sall, I.; Sy, O. People and pixels in the Sahel: A study linking coarse-resolution remote sensing observations to land users’ perceptions of their changing environment in Senegal. Ecol. Soc 2014, 19. [Google Scholar] [CrossRef]
- Spiekermann, R.; Brandt, M.; Samimi, C. Woody vegetation and land cover changes in the Sahel of Mali (1967–2011). Int. J. Appl. Earth Obs. Geoinf. 2015, 34, 113–121. [Google Scholar]
- Dardel, C.; Kergoat, L.; Hiernaux, P.; Mougin, E.; Grippa, M.; Tucker, C. Re-greening Sahel: 30 years of remote sensing data and field observations (Mali, Niger). Remote Sens. Environ 2014, 140, 350–364. [Google Scholar]
- Brandt, M.; Verger, A.; Diouf, A.A.; Baret, F.; Samimi, C. Local vegetation trends in the Sahel of Mali and Senegal using long time series FAPAR satellite products and field measurement (1982–2010). Remote Sens 2014, 6, 2408–2434. [Google Scholar]
- Brandt, M.; Romankiewicz, C.; Spiekermann, R.; Samimi, C. Environmental change in time series—An interdisciplinary study in the Sahel of Mali and Senegal. J. Arid Environ 2014, 105, 52–63. [Google Scholar]
- Verbesselt, J.; Hyndman, R.; Zeileis, A.; Culvenor, D. Phenological change detection while accounting for abrupt and gradual trends in satellite image time series. Remote Sens. Environ 2010, 114, 2970–2980. [Google Scholar]
- Forkel, M.; Carvalhais, N.; Verbesselt, J.; Mahecha, M.D.; Neigh, C.S.; Reichstein, M. Trend change detection in NDVI time series: Effects of inter-annual variability and methodology. Remote Sens 2013, 5, 2113–2144. [Google Scholar]
- Stellmes, M.; Udelhoven, T.; Röder, A.; Sonnenschein, R.; Hill, J. Dryland observation at local and regional scale—Comparison of Landsat TM/ETM+ and NOAA AVHRR time series. Remote Sens. Environ 2010, 114, 2111–2125. [Google Scholar]
- Röder, A.; Udelhoven, T.; Hill, J.; del Barrio, G.; Tsiourlis, G. Trend analysis of Landsat-TM and -ETM+ imagery to monitor grazing impact in a rangeland ecosystem in Northern Greece. Remote Sens. Environ 2008, 112, 2863–2875. [Google Scholar]
- Sonnenschein, R.; Kuemmerle, T.; Udelhoven, T.; Stellmes, M.; Hostert, P. Differences in Landsat-based trend analyses in drylands due to the choice of vegetation estimate. Remote Sens. Environ 2011, 115, 1408–1420. [Google Scholar]
- Griffiths, P.; Kuemmerle, T.; Kennedy, R.E.; Abrudan, I.V.; Knorn, J.; Hostert, P. Using annual time-series of Landsat images to assess the effects of forest restitution in post-socialist Romania. Remote Sens. Environ 2012, 118, 199–214. [Google Scholar]
- Kennedy, R.E.; Cohen, W.B.; Schroeder, T.A. Trajectory-based change detection for automated characterization of forest disturbance dynamics. Remote Sens. Environ 2007, 110, 370–386. [Google Scholar]
- Kennedy, R.E.; Yang, Z.; Cohen, W.B. Detecting trends in forest disturbance and recovery using yearly Landsat time series: 1. LandTrendr—Temporal segmentation algorithms. Remote Sens. Environ 2010, 114, 2897–2910. [Google Scholar]
- Pflugmacher, D.; Cohen, W.B.; Kennedy, R.E. Using Landsat-derived disturbance history (1972–2010) to predict current forest structure. Remote Sens. Environ 2012, 122, 146–165. [Google Scholar]
- Griffiths, P.; van der Linden, S.; Kuemmerle, T.; Hostert, P. Erratum: A pixel-based landsat compositing algorithm for large area land cover. IEEE J. Sel. Top. Appl. Earth Obs. Remote Sens 2013, 6, 2088–2101. [Google Scholar]
- Roy, D.P.; Ju, J.; Kline, K.; Scaramuzza, P.L.; Kovalskyy, V.; Hansen, M.; Loveland, T.R.; Vermote, E.; Zhang, C. Web-enabled Landsat Data (WELD): Landsat ETM+ composited mosaics of the conterminous United States. Remote Sens. Environ 2010, 114, 35–49. [Google Scholar]
- Woodcock, C.E.; Strahler, A.H. The factor of scale in remote sensing. Remote Sens. Environ 1987, 21, 311–332. [Google Scholar]
- Masek, J.G.; Vermote, E.F.; Saleous, N.E.; Wolfe, R.; Hall, F.G.; Huemmrich, K.F.; Gao, F.; Kutler, J.; Lim, T.K. A Landsat surface reflectance dataset for North America, 1990–2000. IEEE Geosci. Remote Sens. Lett 2006, 3, 68–72. [Google Scholar]
- Wulder, M.A.; Masek, J.G.; Cohen, W.B.; Loveland, T.R.; Woodcock, C.E. Opening the archive: How free data has enabled the science and monitoring promise of Landsat. Remote Sens. Environ 2012, 122, 2–10. [Google Scholar]
- Verstraete, M.M.; Scholes, R.J.; Smith, M.S. Climate and desertification: Looking at an old problem through new lenses. Front Ecol. Environ 2009, 7, 421–428. [Google Scholar]
- Verstraete, M.M.; Hutchinson, C.F.; Grainger, A.; Stafford Smith, M.; Scholes, R.J.; Reynolds, J.F.; Barbosa, P.; Léon, A.; Mbow, C. Towards a global drylands observing system: Observational requirements and institutional solutions. Land Degrad. Dev 2011, 22, 198–213. [Google Scholar]
- Asner, G.P. Satellites and psychology for improved forest monitoring. PNAS 2014, 111, 567–568. [Google Scholar]
- Foody, G.M.; Boyd, D.S. Using volunteered data in land cover map validation: Mapping West African forests. IEEE J. Sel. Top. Appl. Earth Obs. Remote Sens 2013, 6, 1305–1312. [Google Scholar]
- Asner, G.P.; Knapp, D.E.; Balaji, A.; Paez-Acosta, G. Automated mapping of tropical deforestation and forest degradation: CLASlite. APPRES 2009, 3. [Google Scholar] [CrossRef]
- Roy, D.P.; Ju, J.; Mbow, C.; Frost, P.; Loveland, T. Accessing free Landsat data via the Internet: Africa’s challenge. Remote Sens. Lett 2010, 1, 111–117. [Google Scholar]
- De Jong, R.; de Bruin, S.; Schaepman, M.; Dent, D. Quantitative mapping of global land degradation using earth observations. Int. J. Remote Sens 2011, 32, 6823–6853. [Google Scholar]
- Vrieling, A. Satellite remote sensing for water erosion assessment: A review. Catena 2006, 65, 2–18. [Google Scholar]
- Le, Q.B.; Tamene, L.; Vlek, P.L.G. Multi-pronged assessment of land degradation in West Africa to assess the importance of atmospheric fertilization in masking the processes involved. Glob. Planet. Chang 2012, 92–93, 71–81. [Google Scholar]
- Jacob, A.L.; Wilson, S.J.; Lewis, S.L. Ecosystem services: Forests are more than sticks of carbon. Nature 2014, 507, 306–306. [Google Scholar]
- Janzen, H. The soil carbon dilemma: Shall we hoard it or use it? Soil Biol. Biochem 2006, 38, 419–424. [Google Scholar]
- Stringer, L.; Dougill, A.; Thomas, A.; Spracklen, D.; Chesterman, S.; Speranza, C.I.; Rueff, H.; Riddell, M.; Williams, M.; Beedy, T. Challenges and opportunities in linking carbon sequestration, livelihoods and ecosystem service provision in drylands. Environ. Sci. Policy 2012, 19, 121–135. [Google Scholar]


| Name | Sensor | Time-Span | Time-Step | Resolution |
|---|---|---|---|---|
| Pathfinder (PAL) | AVHRR | 1981–2001 | 10-day | 8 km |
| Global Vegetation Index GVI) | AVHRR | 1981–2009 | 7-day | 4 km |
| Land Long Term Dara Record (LTDR) | AVHRR | 1981–2013 | Daily | 5 km |
| Fourier-Adjusted, Sensor and Solar zenith angle corrected, Interpolated, Reconstructed (FASIR) | AVHRR | 1982–1998 | 10-day | 0.125° |
| GIMMS | AVHRR | 1981–2006 | 15-day | 8 km |
| GIMMS3G | AVHRR | 1981–2011 | 15-day | 8 km |
| S10 | SPOT-Vegetation | 1998+ | 10-day | 1 km |
| EM10 | ENVISAT-MERIS | 2002–2012 | 10-day | 1/1.2 km |
| SeaWiFS | SeaWiFS | 1997–2010 | Monthly | 4 km |
| MOD (MYD)13 A1/A2 | Terra (Aqua) MODIS | 2000+ | 16-day | 500 m/1 km |
| MOD13 (MYD)A3 | Monthly | 1 km | ||
| MOD13 (MYD)C1/C2 | 16-day/Monthly | 5.6 km | ||
| MOD13 (MYD) Q1 | 16-day | 250 | ||
| MEDOKADS | AVHRR | 1989+ | Daily | 1 km |
© 2014 by the authors; licensee MDPI, Basel, Switzerland This article is an open access article distributed under the terms and conditions of the Creative Commons Attribution license (http://creativecommons.org/licenses/by/4.0/).
Share and Cite
Higginbottom, T.P.; Symeonakis, E. Assessing Land Degradation and Desertification Using Vegetation Index Data: Current Frameworks and Future Directions. Remote Sens. 2014, 6, 9552-9575. https://doi.org/10.3390/rs6109552
Higginbottom TP, Symeonakis E. Assessing Land Degradation and Desertification Using Vegetation Index Data: Current Frameworks and Future Directions. Remote Sensing. 2014; 6(10):9552-9575. https://doi.org/10.3390/rs6109552
Chicago/Turabian StyleHigginbottom, Thomas P., and Elias Symeonakis. 2014. "Assessing Land Degradation and Desertification Using Vegetation Index Data: Current Frameworks and Future Directions" Remote Sensing 6, no. 10: 9552-9575. https://doi.org/10.3390/rs6109552
APA StyleHigginbottom, T. P., & Symeonakis, E. (2014). Assessing Land Degradation and Desertification Using Vegetation Index Data: Current Frameworks and Future Directions. Remote Sensing, 6(10), 9552-9575. https://doi.org/10.3390/rs6109552