Overcoming Limitations with Landsat Imagery for Mapping of Peat Swamp Forests in Sundaland


 ,
,
Abstract
:
1. Introduction
2. Study Area
3. Methods
3.1. Original Peat Swamp Forest Cover Map
3.2. Satellite Imagery
3.3. Image Classification
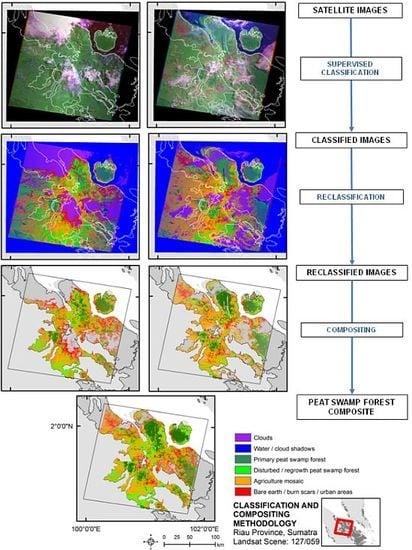
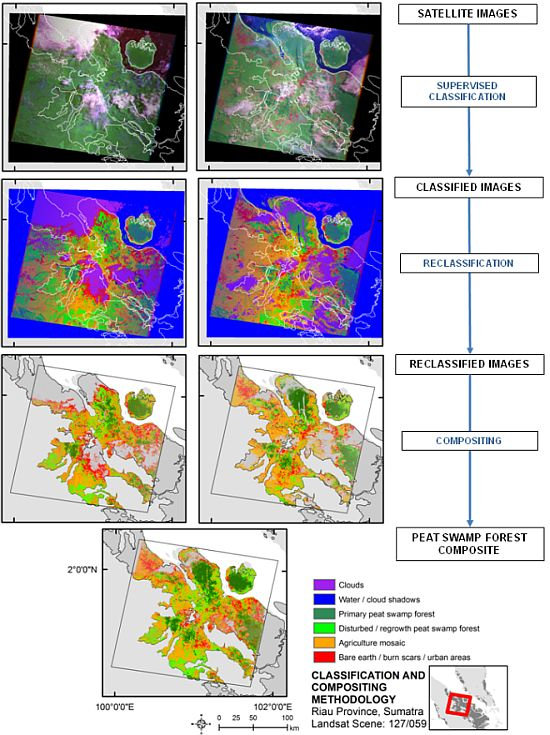
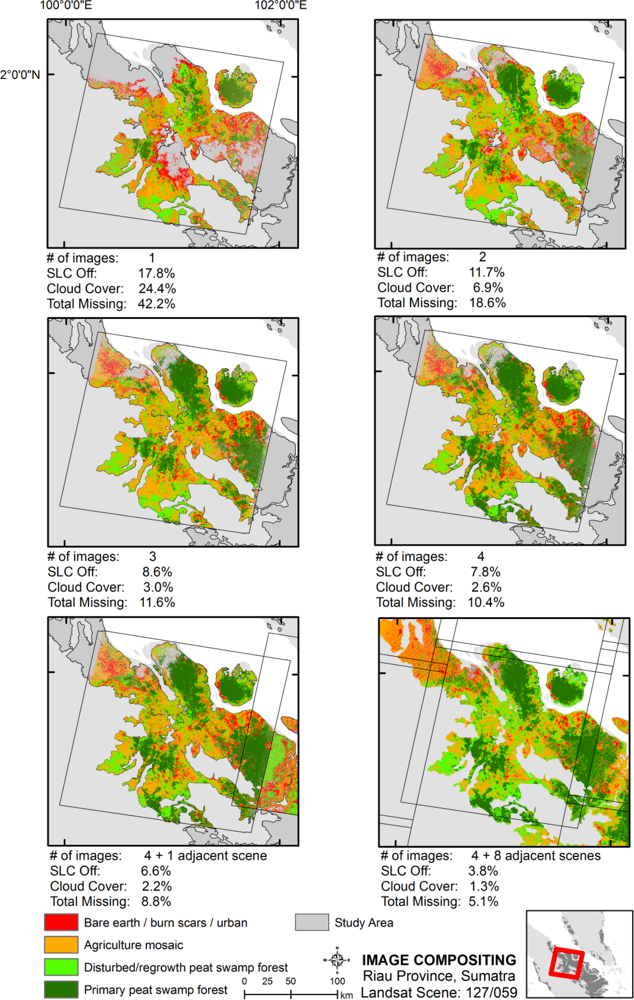
3.4. Map Compositing
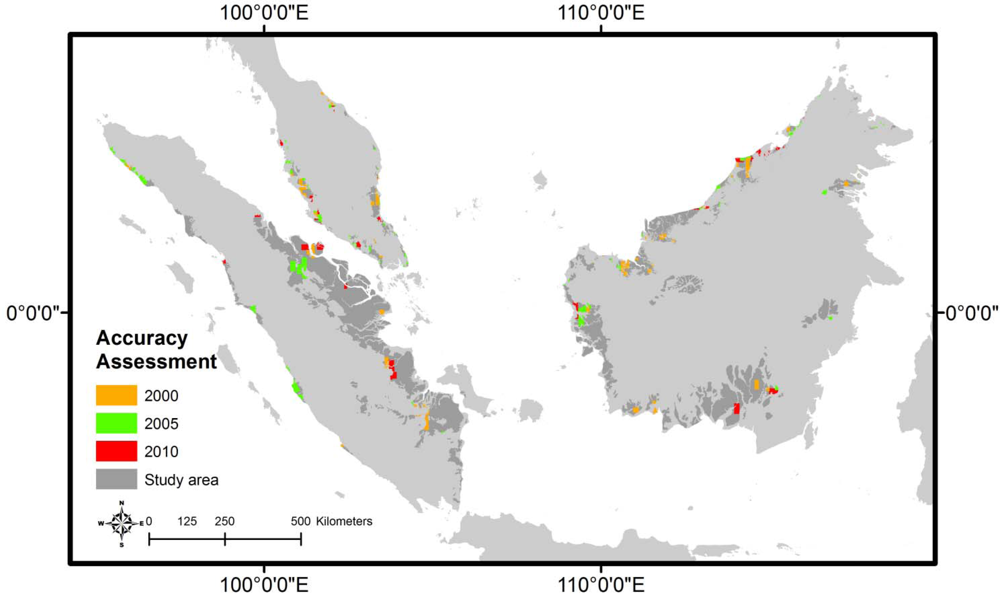
3.5. Accuracy Assessment
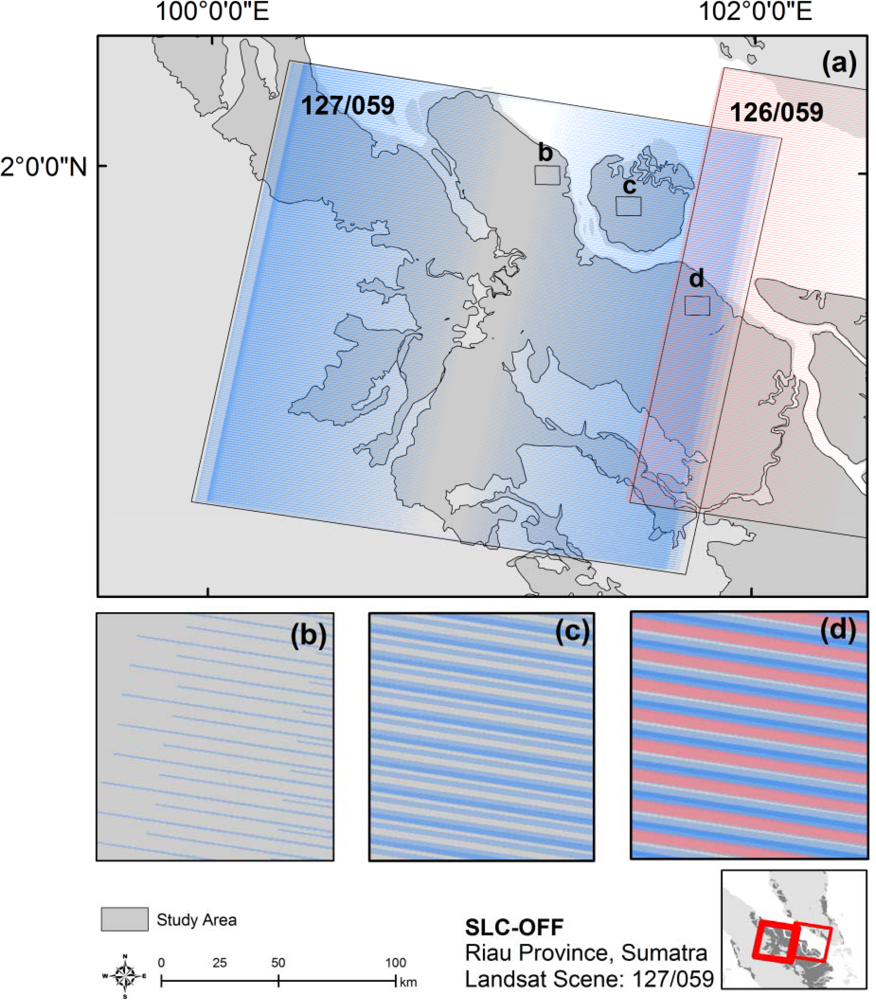
3.6. Missing Data
4. Results
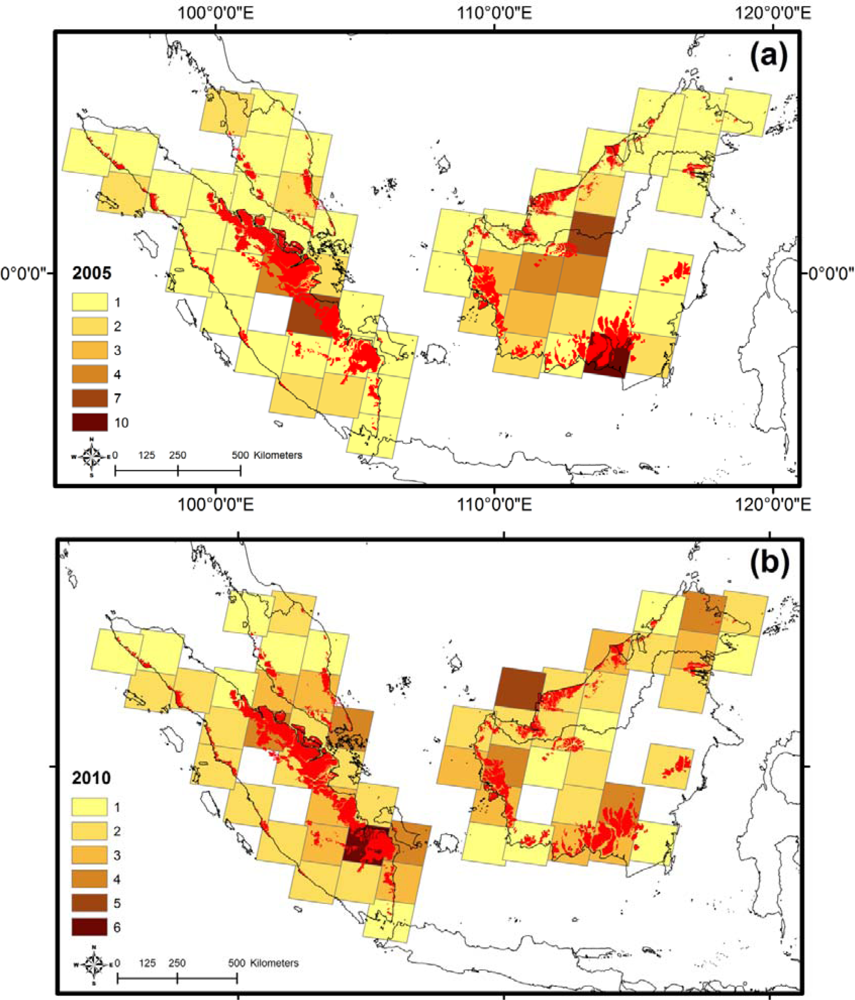
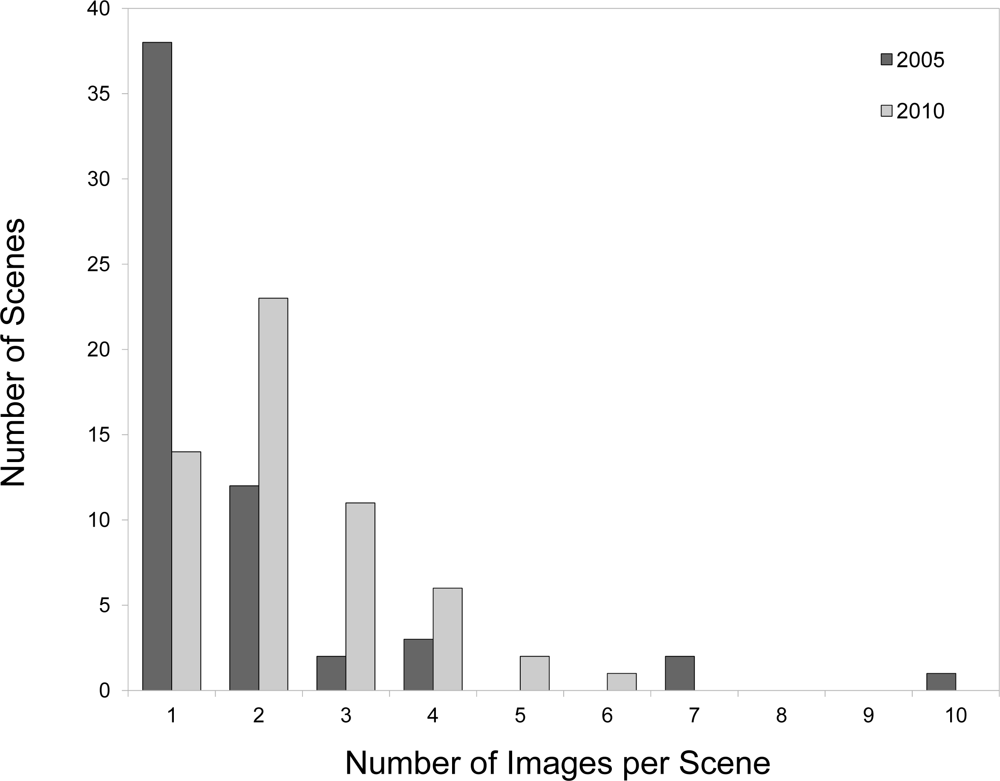
4.1. Images Needed Per Composite Scene
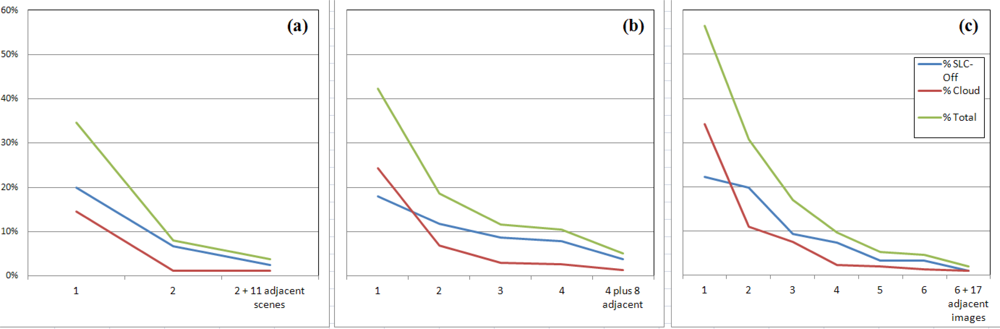
4.2. Extent of Missing Data
4.3. Error Estimation
5. Discussion
6. Conclusion
Acknowledgments
References and Notes
- Posa, M.R.C.; Wijedasa, L.S.; Corlett, R.T. Biodiversity and conservation of tropical peat swamp forest. BioScience 2011, 61, 49–57. [Google Scholar]
- Page, S.E.; Wust, R.A.; Weiss, J.; Rieley, J.O.; Shotyk, W; Limin, S.H. A record of late Pleistocene and Holocene carbon accumulation and climate change from an equatorial bog (Kalimantan, Indonesia): Implications for past, present and future carbon dynamics. J. Quart. Sci 2004, 19, 625–635. [Google Scholar]
- Jaenicke, J.; Rieley, J.O.; Mott, C.; Kimman, P.; Siegert, F. Determination of the amount of carbon stored in Indonesian peatlands. Geoderma 2008, 47, 151–158. [Google Scholar]
- Page, S.E.; Siegert, F.; Böhm, H-D.V.; Jaya, A.; Limin, S. The amount of carbon released from peat and forest fires in Indonesia in 1997. Nature 2002, 420, 61–65. [Google Scholar]
- Page, S.E.; Rieley, J.O.; Banks, C.J. Global and regional importance of the tropical peatland carbon pool. Glob. Change Biol 2011, 17, 798–818. [Google Scholar]
- Miettinen, J.; Shi, C.; Liew, S.C. Two decades of destruction in Southeast Asia’s peat swamps. Front. Ecol. Environ 2012, 10, 124–128. [Google Scholar]
- Friess, D.A.; Webb, E.L. Bad data equals bad policy: How to trust estimates of ecosystem loss when there is so much uncertainty? Environ. Conserv 2011, 38, 1–5. [Google Scholar]
- Hansen, M.C.; Stehman, S.V.; Potapov, P.V. Quantification of global gross forest cover loss. Proc. Natl. Acad. Sci. USA 2010, 107, 8650–8655. [Google Scholar]
- Uryu, Y.; Mott, C.; Foead, N.; Yulianto, K.; Budiman, A.; Setiabudi; Takakai, F.; Nursamsu, S.; Purastuti, E.; Fadhli, N.; et al. Deforestation, Forest Degradation, Biodiversity Loss and CO2 Emissions in Riau, Sumatra, Indonesia; Technical Report; WWF Indonesia: Jakarta, Indonesia, 2008. [Google Scholar]
- Langner, A.; Miettinen, J.; Siegert, F. Land cover change 2002–2005 in Borneo and the role of fire derived from MODIS imagery. Glob. Change Biol 2007, 13, 2329–2340. [Google Scholar]
- Miettinen, J.; Shi, C.; Tan, W.J.; Liew, S.C. 2010 land cover map of insular Southeast Asia in 250m spatial resolution. Remote Sens. Lett 2012, 3, 11–20. [Google Scholar]
- Miettinen, J.; Wong, C.M.; Liew, S.C. New 500m spatial resolution land cover map of the western insular Southeast Asia region. Int. J. Remote Sens 2008, 29, 6075–6081. [Google Scholar]
- Miettinen, J.; Shi, C.; Liew, S.C. Deforestation rates in insular Southeast Asia between 2000 and 2010. Glob. Change Biol 2011, 17, 2261–2270. [Google Scholar]
- Wulder, M.A.; White, J.C.; Masek, J.G.; Dwyer, J.; Roy, D.P. Continuity of Landsat observations: Short term considerations. Remote Sens. Environ 2011, 115, 747–751. [Google Scholar]
- Hansen, M.C.; Stehman, S.V.; Potapov, P.V. Quantification of global gross forest cover loss. Proc. Natl. Acad. Sci. USA 2010, 107, 8650–8655. [Google Scholar]
- Sloan, S. Historical tropical successional forest mapped with Landsat MSS imagery. Int. J. Remote Sens 2012, in press.. [Google Scholar]
- Walker, W.S.; Stickler, C.M.; Kellndorfer, J.M.; Kirsch, K.M.; Nepstad, D.C. Large-area classification and mapping of forest and land cover in the Brazilian Amazon: A comparative analysis of ALOS/PALSAR and Landsat data sources. IEEE J. Sel. Top. Appl 2010, 3, 594–604. [Google Scholar]
- Broich, M.; Hansen, M.C.; Potapov, P.; Adusei, B.; Lindquist, E.; Stehman, S.V. Time-series analysis of multi-resolution optical imagery for quantifying forest cover loss in Sumatra and Kalimantan, Indonesia. Int. J. Appl. Earth Obs 2011, 13, 277–291. [Google Scholar]
- Asner, G. Cloud cover in Landsat observations of the Brazilian Amazon. Int. J. Remote Sens 2001, 22, 3855–3862. [Google Scholar]
- Nezry, E.; Mougin, E.; Lopes, A.; Gastellu-Etchegorry, J.P. Tropical vegetation mapping with combined visible and SAR spareborne data. Int. J. Remote Sens 1993, 14, 2165–2184. [Google Scholar]
- Storey, J.P.; Scaramuzza, G.; Schmidt, J.B. Landsat-7 Scan Line Corrector-Off Gap Filled Product Development. Proceedings of Pecora 16 Global Priorities in Land Remote Sensing, Sioux Falls, SD, USA, 23–27 October 2005.
- Trigg, S.N.; Curran, L.M.; McDonald, A.K. Utility of Landsat-7 satellite data for continued monitoring of forest cover change in protected areas in Southeast Asia. Singapore J. Trop. Geo 2006, 27, 49–66. [Google Scholar]
- Wulder, M. A.; Ortlepp, S. M.; White, J.C.; Maxwell, S. Evaluation of Landsat-7 SLC-off image products for forests change detection. Can. J. Remote Sens 2008, 34, 93–99. [Google Scholar]
- Chen, J.; Zhu, X; Vogelmann, J.E.; Gao, F.; Jin, S. A simple and effective method for filling gaps in Landsat ETM+ SLC-off images. Remote Sens. Environ 2011, 115, 1053–1064. [Google Scholar]
- Hansen, M.C.; Roy, D.P.; Lindquist, E.; Adusei, B.; Justice, C.O.; Altstatt, A. A method of integrating MODIS and Landsat data for systematic monitoring of forest cover and change in the Congo Basin. Remote Sens. Environ 2008, 112, 2495–2513. [Google Scholar]
- Tuomisto, H; Linna, A.; Kalliola, R. Use of digitally processed satellite images in studies of tropical rain forest vegetation. Int. J. Remote Sens 1994, 15, 1595–1610. [Google Scholar]
- Tuomisto, H; Ruokolainen, K.; Kalliola, R.; Linna, A.; Danjoy, W.; Rodriguez, Z. Dissecting Amazonian biodiversity. Science 1995, 269, 63–66. [Google Scholar]
- Tuomisto, H. What satellite imagery and large-scale field studies can tell about biodiversity patterns in Amazonian forests. Ann. Mo. Bot. Gard 1998, 85, 48–62. [Google Scholar]
- Nagendra, H.; Rocchini, D.; Ghate, R.; Sharma, B.; Pareeth, S. Assessing plant diversity in a dry tropical forest: comparing the utility of Landsat and IKONOS satellite images. Remote Sens 2010, 2, 478–496. [Google Scholar]
- Eva, H.D.; Achard, F.; Beuchle, R.; de Miranda, E.; Carboni, S.; Seliger, R.; Vollmar, M.; Holler, W.A.; Oshiro, O.T.; Arroyo, V.B.; Gallego, J. Forest cover changes in tropical South and Central America from 1990 and 2005 and related carbon emissions and removals. Remote Sens 2012, 4, 1369–1391. [Google Scholar]
- Gervin, J.C.; Kerber, A.G.; Witt, R.G.; Lu, Y.C.; Sekhon, R. Comparison of level I land cover classification accuracy for MSS and AVHRR data. Int. J. Remote Sens 1985, 6, 47–57. [Google Scholar]
- Laporte, N.T.; Stabach, J.A.; Grosch, R.; Lin, T.S.; Goetz, S.J. Expansion of industrial logging in Central Africa. Science 2007, 316, 1451. [Google Scholar]
- Brandão, A.O., Jr.; Souza, C.M., Jr. Mapping unofficial roads with Landsat images: A new tool to improve the monitoring of the Brazilian Amazon rainforest. Int. J. Remote Sens 2006, 27, 177–189. [Google Scholar]
- Brook, B.; Bradshaw, C.A.; Koh, L.P.; Sodhi, N.S. Momentum drives the crash: Mass extinction in the Tropics. Biotropica 2006, 38, 302–305. [Google Scholar]
- Lindquist, E.J.; Hansen, M.C.; Roy, D.P.; Justice, C.O. The suitability of decadal image data sets for mapping tropical forest change in the Democratic Republic of Congo: Implications for the global land survey. Int. J. Remote Sens 2008, 29, 7269–7275. [Google Scholar]
- Roy, D.P.; Ju, J.; Kline, K.; Scaramuzza, P.L.; Kovalskyy, V.; Hansen, M.; Loveland, T.R.; Vermote, E.; Zhang, C. Web-enabled Landsat Data (WELD): Landsat ETM+ composited mosaics of the conterminous United States. Remote Sens. Environ 2010, 114, 35–49. [Google Scholar]
- Roy, D.P.; Ju, J.; Lewis, P.; Schaaf, C.; Gao, F.; Hansen, M.; Lindquist, E. Multi-temporal MODIS-Landsat data fusion for relative radiometric normalization, gap filling and prediction of Landsat data. Remote Sens. Environ 2008, 112, 3112–3130. [Google Scholar]
- Staff of the Soils and Analytical Services Branch. Division of Agriculture. Ministry of Agriculture and Fisheries, Malaysia under the Supervision of Law, W.M. Reconnaissance Soil Map of Peninsular Malaysia. Sheet 1. Series L 40A; Directorate of National Mapping: Kuala Lumpur, Malaysia, 1968; Scale: 1:500,000. [Google Scholar]
- Soil Survey Division, Research Branch, Department of Agriculture, Sarawak, with the assistance of the Directorate of National Mapping, Malaysia. Soil Map of Sarawak; Sheets: A & B; Directorate of National Mapping: Kuala Lumpur, Malaysia, 1970; Scale 1: 500,000.
- Directorate of National Mapping, Malaysia. Soils of Sabah. Sheets: NB, NB 50-6, NB 50-7, NB 50-9, NB 50-10, NB 50-11, NB 50-12, NB 50-14, NB 50-15, NB 50-16; The British Government’s Overseas Development Administration (Land Resources Division): London, UK, 1974; Scale 1:250,000. [Google Scholar]
- Center for Soil and Agroclimatic Research. Soil Resource Atlas of Indonesia. Sheets: MA47, MA48, MA49, MB48, MB54, NA47, NA48, NA49, NA50, NB46, NB47 and NB50; Center for Soil and Agroclimatic Research: Bogor, Indonesia, 2000; Scale 1:1,000,000. [Google Scholar]
- Wahyunto; Ritung, S.; Subagjo, H. Maps of Area of Peatland Distribution and Carbon Content in Sumatra, 1990–2002; Wetlands International, Indonesia Programme & Wildlife Habitat Canada (WHC): Bogor, Indonesia, 2003. [Google Scholar]
- Wahyunto; Ritung, S.; Suparto; Subagjo, H. Maps of Area of Peatland Distribution and Carbon Content in Kalimantan, 2000–2002; Wetlands International, Indonesia Programme & Wildlife Habitat Canada (WHC): Bogor, Indonesia, 2004. [Google Scholar]
- Coulter, J.K. Peat formations in Malaya. Malay. Agric. J 1950, 33, 63–81. [Google Scholar]
- Wyatt-Smith, J. Peat swamp forest in Malaya. Malay. For 1959, 22, 5–32. [Google Scholar]
- Anderson, J.A.R. The structure and development of the peat swamps of Sarawak and Brunei. J. Trop. Geogr 1964, 18, 7–16. [Google Scholar]
- Whitmore, T.C. Tropical Rainforests of the Far East; Clarendon Press: Oxford, UK, 1975; p. 281. [Google Scholar]
- Anderson, J.A.R.; Marsden, D. Brunei Forest Resources and Strategic Planning Study; Anderson & Marsden: Singapore, 1984; Scale 1:50, 000. [Google Scholar]
- Laumonier, Y.; Gadrinab, A.; Purnajaya; Blasco, F. International Map of the Vegetation and Environmental Conditions. Sheet No. 1 (Southern Sumatra), Sheet No. 2 (Central Sumatra) and Sheet no. 3 (Northern Sumatra); SEAMEO-BIOTROP: Bogor, Indonesia, 1986; Scale 1:1,000,000. [Google Scholar]
- Anderson, J.A.R. The structure and development of the peat swamps of Sarawak and Brunei. J. Trop. Geogr 1964, 18, 7–16. [Google Scholar]
- Van Steenis, C.G.G.J. Outline of vegetation types in Indonesia and some adjacent regions. Proc. Pacif. Sci. Congr 1957, 8, 61–97. [Google Scholar]
- Wyatt-Smith, J. Manual of Malayan Silviculture for Inland Forests; Malayan Forest Records; Forest Research Institute Malaysia: Kuala Lumpur, Malaysia, 1963; Issue 22. [Google Scholar]
- Director of Lands and Surveys, Sarawak. Sarawak Land Use. Series No. 22. Sheets: NA 49-4, NA 49-7, NA 49-10, NA 49-11, NA 49-12, NA 50-1, NA 50-5, NB 50-13; Directorate of National Mapping: Kuala Lumpur, Malaysia, 1968–1980; Scale 1:25,000. [Google Scholar]
- Land Use Survey section. Soil Science Division. Division of Agriculture. Ministry of Agriculture and Lands, Malaysia. Present Land Use. West Malaysia. Sheet 1 & 2; Directorate of National Mapping: Kuala Lumpur, Malaysia, 1966; Scale 1: 500,000. [Google Scholar]
- UNEP-WCMC. Tropical Moist Forest s and Protected Areas: The Digital Files. Version 1. 1996..
- The Global Land Cover Facility. Landsat Orthorectified Dataset (January 2005– December 2011). 2005. Available online: www.glovis.org (accessed on 31 December 2011).
- USGS. Shuttle Radar Topography Mission, 1 Arc Second scene SRTM_u03_n008e004, Unfilled Unfinished 2.0, Global Land Cover Facility; University of Maryland, College Park: MD, USA, 2004. [Google Scholar]
- Koh, L.P.; Miettinen, J.; Liew, S.C.; Ghazoul, J. Remotely sensed evidence of tropical peatland conversion to oil palm. Proc. Natl. Acad. Sci. USA 2011, 108, 5127–5132. [Google Scholar]
- Steininger, M.K. Tropical secondary regrowth in the Amazon: Age, area and change estimation with Thematic Mapper data. Int. J. Remote Sens 1996, 17, 9–27. [Google Scholar]
- Miettinen, J.; Hooijer, A.; Shi, C.H.; Tollenaar, D.; Vernimmen, R.; Liew, S.C.; Malins, C.; Page, S. Extent of industrial plantations on Southeast Asian peatlands in 2010 with analysis of historical expansion and future projections. GCB Bioenergy 2012. [Google Scholar] [CrossRef]
- Bontemp, S.; Defourny, P.; Van Bogaert, E.; Arino, O.; Kalogirou, V.; Ramos Perez, J. GlobCover 2009: Product Description and Validation Report; Universite Catholoque de Louvain, European Space Agency: Louvain, Belgium, 2011. [Google Scholar]
- Miettinen, J.; Shi, C.; Liew, S.C. Influence of peatland and land cover distribution on fire regimes in insular Southeast Asia. Reg. Environ. Change 2011, 11, 191–201. [Google Scholar]
- Giam, X.; Koh, L.P.; Tan, H.H.; Miettinen, J.; Tan, H.T.W.; Ng, P.K.L. Global extinctions of freshwater fishes follow peatland conversion in Sundaland. Front. Ecol. Environ 2012, in press.. [Google Scholar]
Appendix


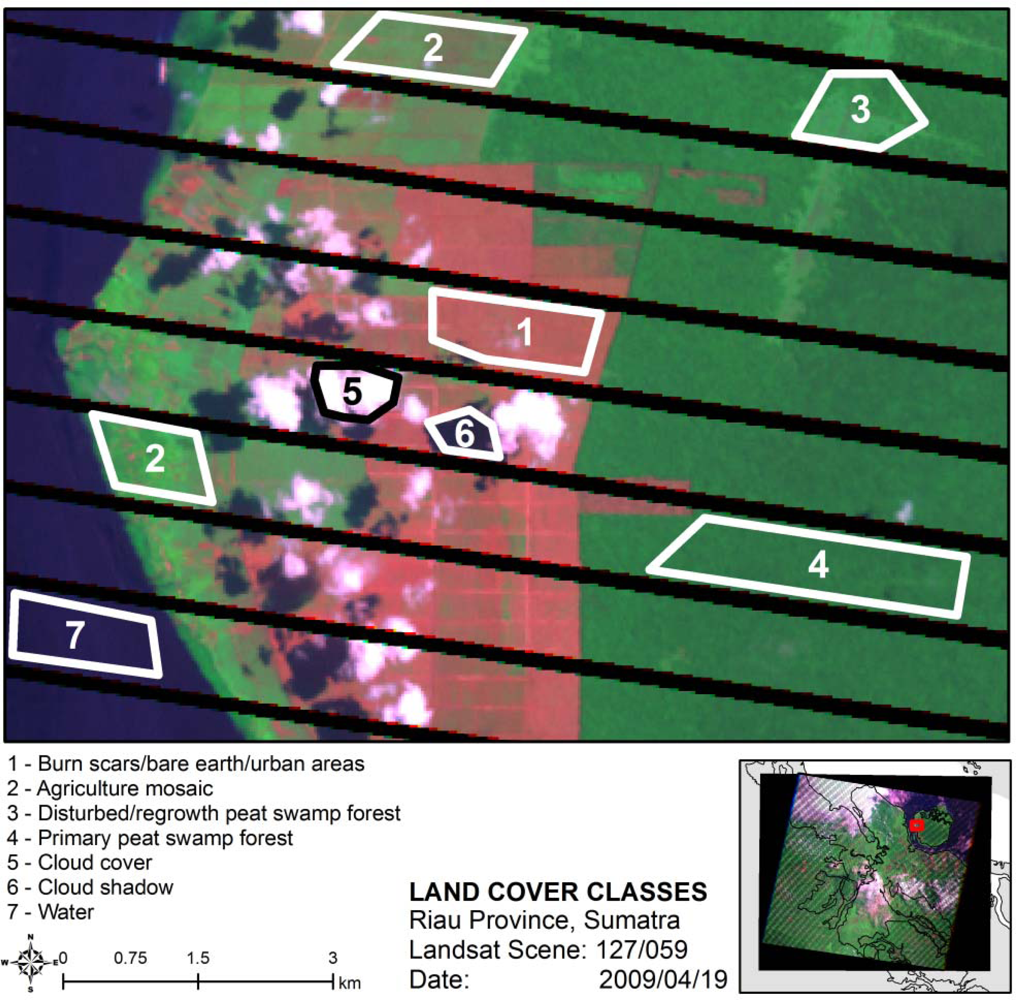
| Land Cover Type | Description |
|---|---|
| Primary peat swamp forest | Undisturbed peat swamp forest and old re-growth peat swamp forest with little or no disturbance due to logging, conversion or fire. Old re-growth includes some previously logged peat swamp forest that has regenerated and cannot be distinguished from undisturbed peat swamp forest. |
| Disturbed/re-growth peat swamp forest | Peat swamp forest that has been disturbed by logging and fire. Visible as open canopy peat swamp forest with a visibly different texture and reflectance than primary peat swamp forest. This class includes re-growth peat swamp forest which does not have the same reflectance and texture as undisturbed primary peat swamp forest or old re-growth peat swamp forest. |
| Agriculture mosaic | Comprises all non-peat swamp forest land use types except burn scars/bare earth/urban areas. This a heterogeneous class made up mostly of large scale industrial plantations of oil palm and acacia and small holder plantations. Some of the other land use types in this class are open areas with ferns/low shrubs and young regrowth forest. |
| Burn scars/bare earth/urban areas | Urban areas and bare earth. This includes bare earth caused by recently burnt areas. |
| Missing data | SLC-Off areas, clouds, shadows caused by clouds in the image and open water. |
| Reference Dataset | ||||||
|---|---|---|---|---|---|---|
| Landsat Classified Composite | Primary Peat Swamp Forest | Disturbed/Regrowth Peat Swamp Forest | Agriculture Mosaic | Burn Scars/ Bare Earth/ Urban Areas | Total | User’s Accuracy |
| Primary peat swamp forest | 247 | 6 | 32 | 1 | 286 | 86% |
| Disturbed/regrowth peat swamp forest | 25 | 85 | 48 | 2 | 160 | 53% |
| Agriculture mosaic | 19 | 6 | 126 | 0 | 151 | 83% |
| Burn scars/bare earth/urban areas | 2 | 0 | 19 | 44 | 65 | 68% |
| Total | 293 | 97 | 225 | 47 | ||
| Producer’s Accuracy | 84% | 88% | 56% | 94% | ||
| Proportion of Land Cover | 50% | 20% | 20% | 10% | ||
| Weighted Overall Accuracy = 77% | ||||||
| Reference Dataset | ||||||
|---|---|---|---|---|---|---|
| Landsat Classified Composite | Primary peat swamp forest | Disturbed/regrowth peat swamp forest | Agriculture mosaic | Burn scars/ bare earth/ urban areas | Total | User’s Accuracy |
| Primary peat swamp forest | 181 | 13 | 11 | 0 | 205 | 88% |
| Disturbed/regrowth peat swamp forest | 8 | 86 | 51 | 2 | 147 | 59% |
| Agriculture mosaic | 10 | 4 | 286 | 1 | 301 | 95% |
| Burn scars/bare earth/urban areas | 9 | 1 | 13 | 65 | 88 | 74% |
| Total | 208 | 104 | 361 | 68 | 741 | |
| Producer’s Accuracy | 87% | 83% | 79% | 96% | ||
| Proportion of Land Cover | 45% | 19% | 27% | 9% | ||
| Weighted Overall Accuracy = 85% | ||||||
| Reference Dataset | ||||||
|---|---|---|---|---|---|---|
| Landsat Classified Composite | Primary peat swamp forest | Disturbed/regrowth peat swamp forest | Agriculture mosaic | Burn scars/ bare earth/ urban areas | Total | user’s accuracy |
| Primary peat swamp forest | 252 | 12 | 55 | 1 | 320 | 79% |
| Disturbed/regrowth peat swamp forest | 3 | 87 | 63 | 0 | 153 | 57% |
| Agriculture mosaic | 2 | 0 | 303 | 1 | 306 | 99% |
| Burn scars/bare earth/urban areas | 2 | 1 | 3 | 56 | 62 | 90% |
| Total | 259 | 100 | 424 | 58 | ||
| Producer’s Accuracy | 97% | 87% | 71% | 97% | ||
| Proportion of Land Cover | 45% | 14% | 34% | 6% | ||
| Weighted Overall Accuracy = 86% | ||||||
Share and Cite
Wijedasa, L.S.; Sloan, S.; Michelakis, D.G.; Clements, G.R. Overcoming Limitations with Landsat Imagery for Mapping of Peat Swamp Forests in Sundaland. Remote Sens. 2012, 4, 2595-2618. https://doi.org/10.3390/rs4092595
Wijedasa LS, Sloan S, Michelakis DG, Clements GR. Overcoming Limitations with Landsat Imagery for Mapping of Peat Swamp Forests in Sundaland. Remote Sensing. 2012; 4(9):2595-2618. https://doi.org/10.3390/rs4092595
Chicago/Turabian StyleWijedasa, Lahiru S., Sean Sloan, Dimitrios G. Michelakis, and Gopalasamy R. Clements. 2012. "Overcoming Limitations with Landsat Imagery for Mapping of Peat Swamp Forests in Sundaland" Remote Sensing 4, no. 9: 2595-2618. https://doi.org/10.3390/rs4092595
APA StyleWijedasa, L. S., Sloan, S., Michelakis, D. G., & Clements, G. R. (2012). Overcoming Limitations with Landsat Imagery for Mapping of Peat Swamp Forests in Sundaland. Remote Sensing, 4(9), 2595-2618. https://doi.org/10.3390/rs4092595