Article

Prelaunch Assessment and Correction of Polarization Effects for HIRAS-II on the Fengyun-3 Satellite

1
Key Laboratory of Infrared System Detection and Imaging Technologies, Shanghai Institute of Technical Physics, Chinese Academy of Sciences, Shanghai 200083, China
2
University of Chinese Academy of Sciences, Beijing 100049, China
*
Author to whom correspondence should be addressed.
Remote Sens. 2026, 18(17), 3025; https://doi.org/10.3390/rs18173025
Submission received: 18 August 2026 / Accepted: 29 August 2026 / Published: 4 September 2026

Highlights

What are the main findings?
  • A dedicated prelaunch thermal-vacuum polarization test apparatus provided controlled scan-angle measurements, revealing a clear polarization-induced angular modulation in all three HIRAS-II bands.
  • A decoupled two-step least-squares method retrieved FOV- and channel-specific polarization parameters and reduced the scan-angle-dependent brightness temperature deviations, with maximum reductions of 0.093, 0.064, and 0.174 K in the LW, MW1, and MW2 bands, respectively.
What are the implications of the main findings?
  • Controlled prelaunch measurements enable instrument-specific characterization of the polarization response while reducing interference from scene variability and other on-orbit factors.
  • The retrieved polarization parameters provide a basis for on-orbit evaluation and correction, helping to improve HIRAS-II radiometric calibration accuracy and the reliability of Level-1 radiance data for atmospheric profile retrievals and assimilation into global numerical weather prediction (NWP) systems.

Abstract

The Hyperspectral Infrared Atmospheric Sounder II (HIRAS-II) onboard the Fengyun-3 satellites is a Fourier-transform infrared spectrometer that requires high radiometric calibration accuracy, making the characterization and correction of polarization effects essential. Although the gold-coated scan mirror introduces only weak polarization, its rotation changes the polarization orientation relative to the fixed polarization-sensitive axis of the downstream optics, producing scan-angle-dependent radiometric errors. To characterize and correct this effect, we designed and constructed a dedicated polarization test apparatus and used it to conduct a prelaunch thermal-vacuum (TVAC) polarization test. During the test, HIRAS-II observed the same stable 290 K area-source blackbody over a densely sampled scan-angle range, with the internal calibration target and cold shield serving as the warm and cold references, respectively. Guided by a polarization-induced radiometric error model formulated within the two-point calibration framework, we developed a decoupled two-step least-squares method to retrieve the polarization parameters from the resulting measurements. The method first estimates the equivalent polarization-axis angle of the downstream optical system from the phase of the band-averaged angular modulation and then retrieves the effective combined polarization parameter separately for each field of view (FOV) and spectral channel. The retrieved parameters were subsequently used to calculate the scan-angle-dependent polarization correction term and correct the calibrated spectra. After correction, the FOV-averaged standard deviation over the scan angle decreased from 0.023 to 0.007 K, from 0.024 to 0.007 K, and from 0.045 to 0.014 K in the long-wave (LW), mid-wave 1 (MW1), and mid-wave 2 (MW2) bands, respectively. The corresponding maximum reductions in brightness temperature deviation were 0.093, 0.064, and 0.174 K. The model, experimental approach, and retrieved prelaunch parameters establish a basis for the on-orbit evaluation and correction of scan-angle-dependent polarization-induced radiometric errors. Reducing these errors improves the radiometric calibration accuracy of HIRAS-II and helps provide more reliable Level-1 radiance data for atmospheric profile retrievals and data assimilation in global numerical weather prediction (NWP) systems.

1. Introduction

Hyperspectral infrared sounding data are one of the key observational pillars for global numerical weather prediction (NWP) and climate studies, and they are also used to retrieve atmospheric temperature, humidity, and other trace-gas profiles with high vertical resolution [1,2]. Radiometric calibration biases can propagate into atmospheric retrievals and further affect data assimilation in forecast models and the long-term consistency of climate data records [3,4]. Therefore, spaceborne hyperspectral infrared sounders generally demand high radiometric calibration accuracy. Achieving this level of accuracy requires careful identification and correction of various sources of calibration error. Among them, polarization effects constitute one important source of error affecting the radiometric calibration accuracy of hyperspectral infrared measurements [5]. Their accurate characterization and correction are therefore important for quantitative hyperspectral infrared remote sensing.
A number of studies have been conducted to characterize and correct polarization effects. For the Moderate Resolution Imaging Spectroradiometer (MODIS) onboard the Terra and Aqua satellites, the reflective solar bands are sensitive to the polarization state of incident radiation, especially in the visible spectral region. Because the on-orbit calibration of MODIS is mainly based on unpolarized sources, whereas solar radiation may become partially polarized after scattering and reflection by the Earth–atmosphere system, previous studies retrieved the polarization factors and polarization phase angles of MODIS from prelaunch polarization-sensitivity measurements and showed that these parameters are related to wavelength, scan-mirror angle of incidence, detector, and mirror side [6]. In addition, the response versus scan angle of the MODIS thermal emissive bands was also characterized through prelaunch system-level ground testing [7]. Although MODIS is not a thermal-infrared hyperspectral sounder, these studies provide important methodological references for characterizing instrument polarization sensitivity and scan-angle-dependent response under controlled ground conditions.
For hyperspectral infrared sounders, polarization effects have also been investigated in several representative spaceborne instruments. For the Atmospheric Infrared Sounder (AIRS), a spaceborne hyperspectral infrared grating sounder, Pagano et al. showed that the coupling between the scan-mirror polarization and the spectrometer polarization response can produce scan-angle-dependent radiometric modulation in the measured signal [8,9,10]. They established a model based on instrument test data and validated it using prelaunch large-area blackbody radiometric measurements. For the Cross-track Infrared Sounder (CrIS), a Fourier transform spectrometer (FTS), Taylor et al. treated the scene selection mirror (SSM) and the downstream optical system as a pair of partial linear polarizers in series and established a model for polarization-induced calibration bias [11]. Using deep-space observations acquired during the on-orbit pitch maneuvers of the Suomi National Polar-orbiting Partnership (SNPP) and NOAA-20 CrIS, they retrieved the polarization parameters, corrected the view-angle-dependent radiometric modulation, and further evaluated the correction impact under different scene temperatures and scene types [12]. For the Hyperspectral Infrared Atmospheric Sounder (HIRAS) onboard Fengyun-3D (FY-3D), also a FTS, Wu et al. identified a non-negligible scene-selection-mirror polarization effect during on-orbit calibration and accuracy assessment [13]. They derived polarization correction parameters using deep-space observations at different scan angles and FOV-to-FOV consistency analysis over uniform Earth scenes, and implemented on-orbit polarization correction in the Level-1 radiometric calibration. In addition, recent work on the Geostationary Interferometric Infrared Sounder (GIIRS) onboard Fengyun-4B (FY-4B), a geostationary FTS, investigated scan-mirror thermal-radiation interference and analyzed its coupling with the instrument polarization-dependent response [14]. A temperature-field-driven adaptive compensation method was further developed to improve radiometric calibration stability.
The studies reviewed above indicate that polarization-related calibration errors in spaceborne hyperspectral infrared sounders are commonly associated with the coupling between the polarization response of the scan mirror or SSM and the polarization sensitivity of the downstream optical system. Rotation of the scan mirror or SSM changes the relative orientation between its polarization response and that of the downstream optics, thereby introducing scan-angle- or view-angle-dependent radiometric modulation into the measured signal and further leading to radiometric calibration bias. However, the optical configuration, dominant polarization-sensitive components, scanning geometry, and parameter retrieval strategy differ among instruments. Therefore, the characterization and correction of polarization effects require instrument-specific models.
The Hyperspectral Infrared Atmospheric Sounder II (HIRAS-II) is the second-generation hyperspectral infrared atmospheric sounder in the Fengyun-3 series and has been deployed onboard the Fengyun-3E (FY-3E), Fengyun-3F (FY-3F), and Fengyun-3H (FY-3H) satellites. As an improved successor to FY-3D/HIRAS, HIRAS-II maintains the hyperspectral infrared sounding capability while expanding the field-of-view (FOV) array within each field of regard from 2 × 2 to 3 × 3, improving the nadir spatial resolution from 16 km to 14 km, and significantly enhancing instrument sensitivity and calibration performance [15]. With the improvement in radiometric calibration accuracy and instrument sensitivity, polarization-induced radiometric errors require more accurate correction. Although FY-3D/HIRAS has achieved polarization correction based on on-orbit observations, such on-orbit approaches rely on specific deep-space viewing geometries and Earth scenes satisfying spatial-uniformity conditions. Their available scan-angle range and scene conditions are limited, and the polarization term may be coupled with other instrument effects and observation conditions, making it difficult to independently characterize the intrinsic polarization response of the instrument. Therefore, controlled prelaunch ground-based polarization characterization of HIRAS-II can not only provide a basis for establishing a physics-based polarization correction model, but also offer important prior parameters and an independent reference for subsequent on-orbit polarization correction.
To characterize and correct the scan-angle-dependent polarization effect in HIRAS-II, this study develops a controlled prelaunch experimental and parameter-retrieval framework based on measurements acquired during a dedicated thermal-vacuum (TVAC) polarization test. The main contributions of this study are as follows:
  • A dedicated polarization test apparatus was designed and constructed for the prelaunch TVAC calibration campaign, and a scan-angle-dependent polarization test was conducted using a stable 290 K area-source blackbody. By synchronously rotating the blackbody and scan mirror, the apparatus enabled HIRAS-II to observe the same target over a densely sampled scan-angle range, providing controlled measurements of its angular polarization response.
  • Guided by a polarization-induced radiometric error model formulated within the two-point calibration framework, a decoupled two-step least-squares method was developed to retrieve the required polarization parameters from the TVAC measurements. The equivalent polarization-axis angle of the downstream optical system was retrieved separately for each FOV, followed by the effective combined polarization parameter for each FOV and spectral channel. Sensitivity simulations were also performed to examine the dependence of the modeled error on scene temperature, scan angle, and wavenumber.
  • The retrieved parameters were used to calculate the scan-angle-dependent polarization correction term and correct the calibrated spectra. The correction was evaluated at representative wavenumbers, across all nine FOVs, and over the full spectral ranges. Under the 290 K test condition, the maximum reductions in brightness temperature deviation reached 0.093, 0.064, and 0.174 K in the LW, MW1, and MW2 bands, respectively.
The remainder of this paper is organized as follows. Section 2 describes the HIRAS-II instrument, the polarization-induced radiometric error model and sensitivity analysis, the dedicated prelaunch TVAC polarization test apparatus and procedure, and the decoupled two-step parameter retrieval and correction method. Section 3 presents the sensitivity analysis results, retrieved polarization parameters, and polarization correction performance. Section 4 discusses the physical interpretation of the retrieved parameters, residual scan-angle-independent offsets, and comparisons with previous studies. Section 5 summarizes the main conclusions.

2. Materials and Methods

2.1. HIRAS-II Instrument Characteristics and Observation Modes

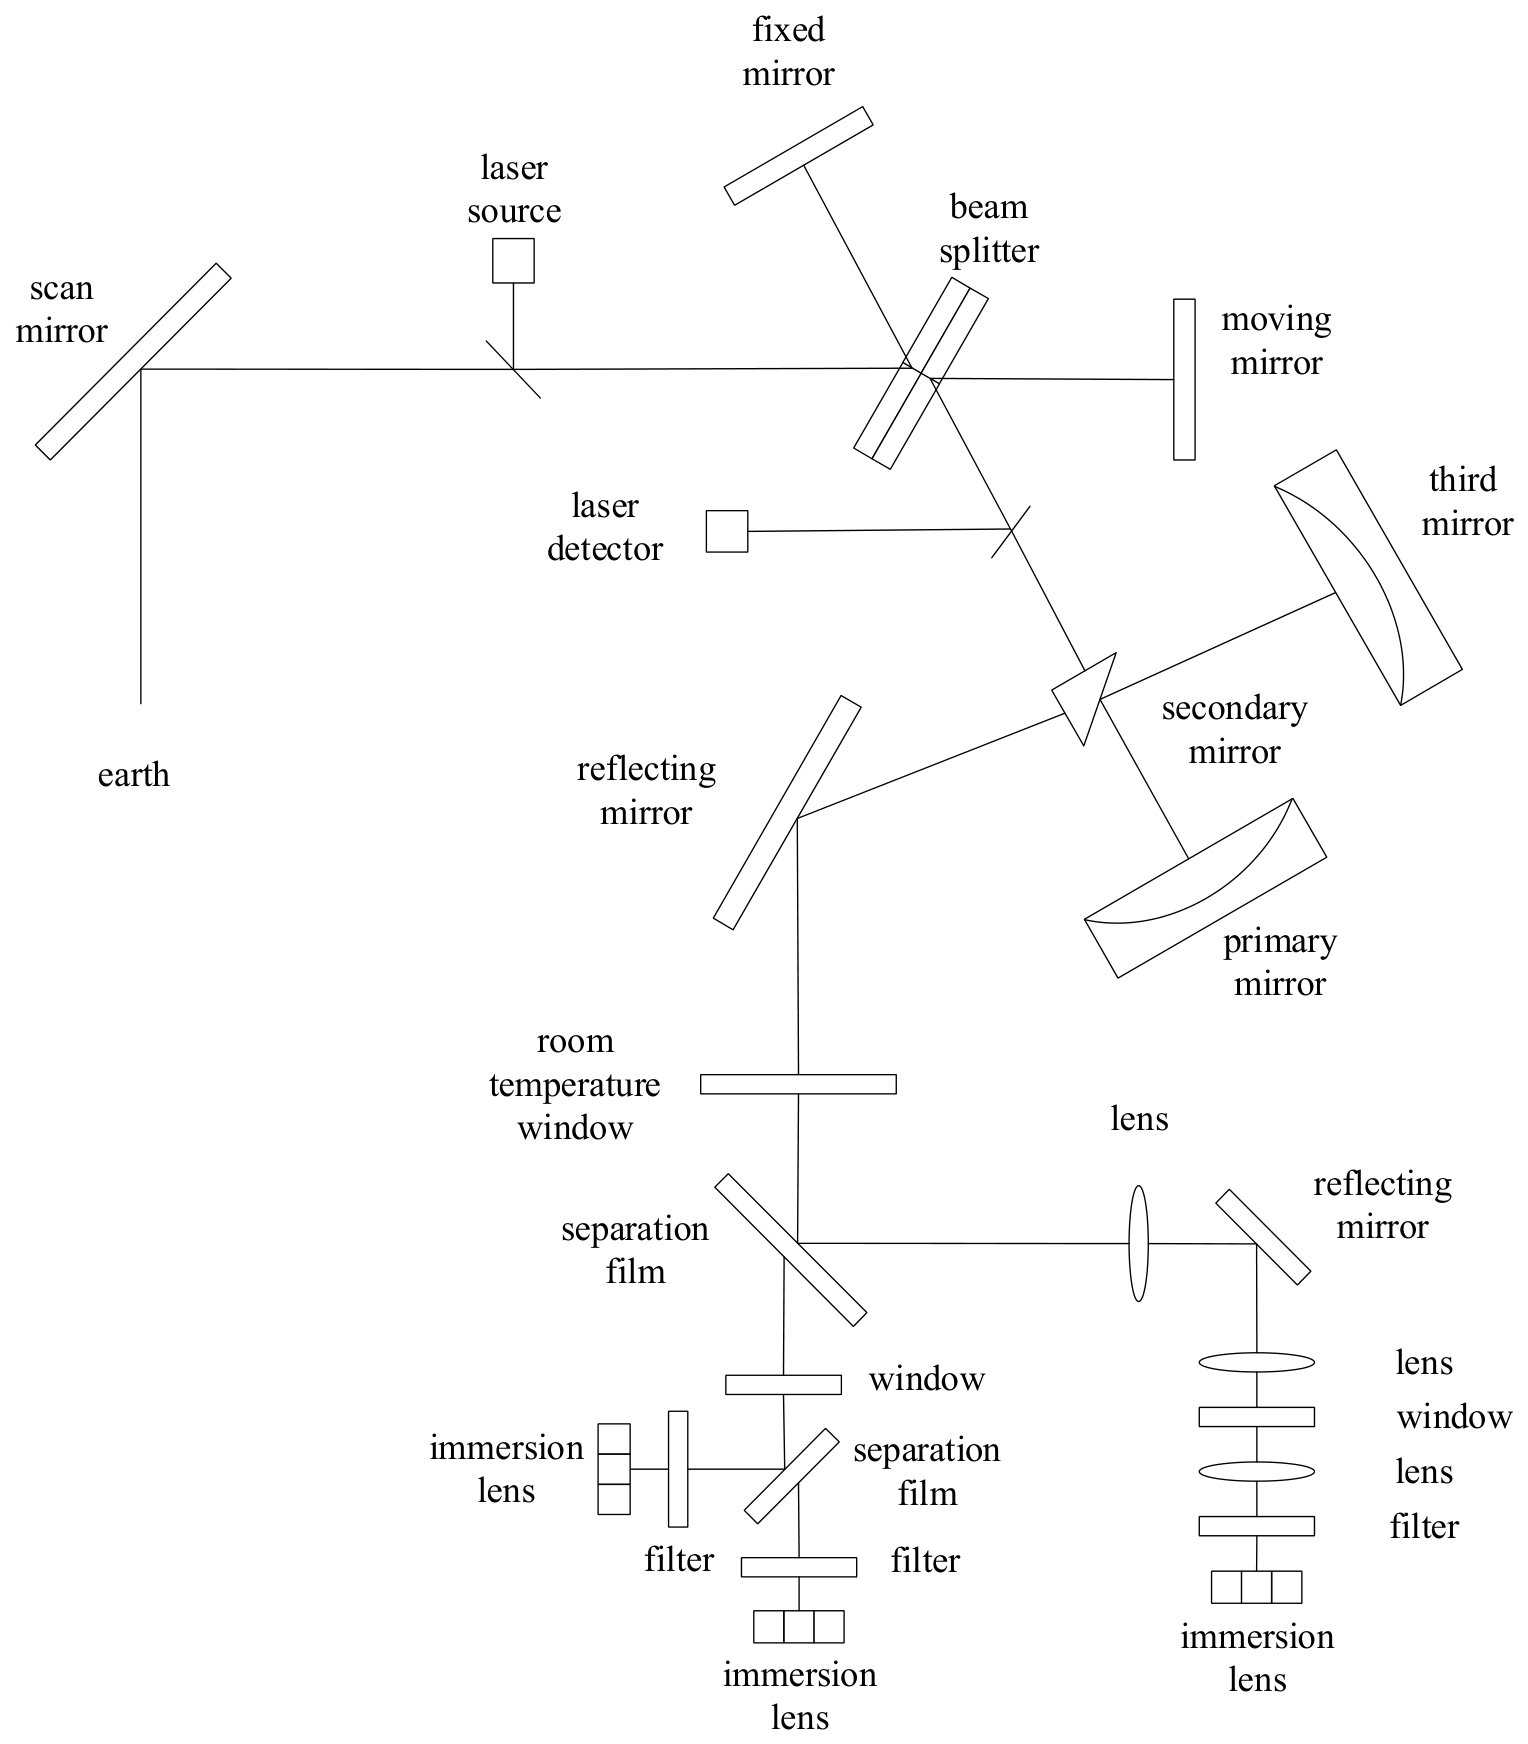
HIRAS-II is a second-generation hyperspectral infrared atmospheric sounder based on Fourier-transform spectroscopy. It was first launched onboard FY-3E, the first dawn–dusk-orbit meteorological satellite in the Fengyun-3 series [16], and has subsequently been deployed onboard FY-3F and FY-3H. The instrument employs a 3 × 3 FOV array within each field of regard and an instrument architecture that combines cross-track two-dimensional scanning, an interferometer subsystem, primary and relay optics, a small-area detector array, radiative cooling, and cold optics. The optical path of the HIRAS-II system is illustrated in Figure 1. Earth-emitted radiation is collected by a gold-coated 45° scan mirror and directed through the fore-optics, comprising the primary, secondary, and third mirrors, into the interferometer, where a beam splitter together with a fixed mirror and a moving mirror generates the optical path difference; a reference laser source and laser detector monitor the moving-mirror position. After the interferometer, the beam is separated and filtered into three spectral bands, each of which is focused onto its corresponding detector through dedicated lenses and immersion lenses housed in the cold optics.
The spectral and radiometric performance requirements of HIRAS-II are summarized in Table 1. These requirements are specified for three infrared bands, namely LW, MW1, and MW2, with required spectral resolutions of 0.625, 1.25, and 2.5 cm−1, respectively. The spectral calibration accuracy requirement is 7 ppm across all bands, while the radiometric calibration accuracy requirement ranges from 0.4 to 1.0 K depending on the band.
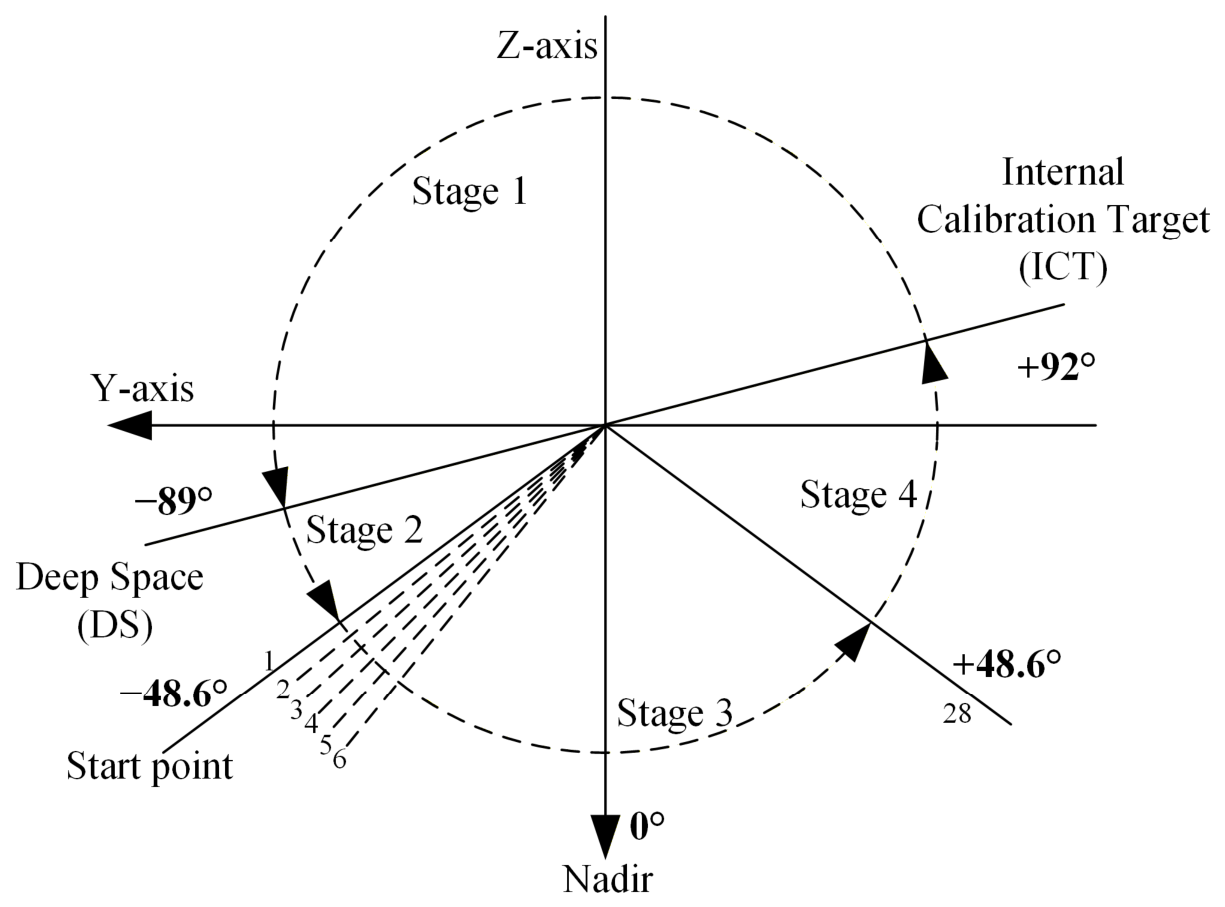
Scene selection and cross-track scanning are performed by a gold-coated scan mirror that directs radiance from the Earth scene, the internal calibration target (ICT), and deep space (DS) into the common downstream optical path. The scan mirror rotates about the main optical axis of the instrument, with its surface normal maintained at an angle of 45° to this axis. Consequently, the chief ray selected for each scene or calibration view is incident on the mirror at an approximately constant angle of 45° throughout the scan. Here, 45° refers to the fixed optical incidence angle between the incident chief ray and the mirror normal; it is distinct from the scene scan angle δS, which specifies the Earth-view position relative to nadir. Reflection from gold produces an extremely low degree of polarization over the infrared spectral range [12], so the polarization introduced by the gold-coated HIRAS-II scan mirror is very small. At a given wavenumber, the fixed incidence angle keeps the magnitude of the mirror-induced polarization nearly constant throughout the scan. However, the orientation of the reflection plane changes as the scan mirror rotates. This changes the relative angle between the polarization axis introduced by the scan mirror and the fixed polarization-sensitive axis of the downstream optics, producing scan-angle-dependent modulation. The scanning geometry and azimuth pattern are illustrated in Figure 2.
During nominal on-orbit Earth observation, the scan mirror follows the cross-track sequence shown in Figure 2. Each scan cycle starts from the first Earth-view position at −48.6° relative to nadir and then steps by 3.6° between adjacent Earth-view samples. After the 28th Earth-view sample at +48.6°, the scan mirror slews to the ICT, an onboard reference blackbody viewed at 92°, and acquires two samples. It then slews to the DS view at −89° and acquires two additional samples before returning to the initial Earth-view position. In this observation mode, radiometric calibration is performed using the DS and ICT observations as the cold and warm references, respectively. The corresponding scan angles of the Earth scene, DS, and ICT are used in the polarization error model described in Section 2.2.

2.2. Polarization-Induced Radiometric Error Model

Following the polarization modeling approach developed for FTS-based infrared sounders such as CrIS [12], the HIRAS-II scan mirror and downstream optical system are modeled as two partial linear polarizers in series. At a given wavenumber, their polarization magnitudes are treated as independent of scan-mirror rotation, whereas the rotation changes the relative angle between the polarization axis associated with the reflection plane and the fixed equivalent polarization-sensitive axis of the downstream optical system, as described in Section 2.1. This varying relative orientation modulates the detected signal. The response reaches its maximum when the two polarization axes are aligned and its minimum when they are perpendicular [17]. Because the Earth scene, ICT, and DS are observed at different scan-mirror rotation angles, their polarization-dependent responses do not completely cancel in the two-point calibration, leaving a scan-angle-dependent radiometric error.
Assuming that the radiation incident on the scan mirror is unpolarized, the detector output signal for a target with radiance R δ observed at a scan-mirror rotation angle δ is expressed according to Malus’s law [18] as
V δ = R δ 2 r p t m a x c o s 2 δ α + t m i n s i n 2 δ α               + R δ 2 r s t m a x s i n 2 δ α + t m i n c o s 2 δ α                         + B S M 2 ε p t m a x c o s 2 δ α + t m i n s i n 2 δ α                                                     + B S M 2 ε s t m a x s i n 2 δ α + t m i n c o s 2 δ α + V b k g
where Vδ is the detector output signal at the scan-mirror rotation angle δ; Rδ is the radiance of the target observed at this angle; rp and rs are the scan-mirror reflectances for the p- and s-polarized components, respectively, where the p component is parallel to the plane of incidence and the s component is perpendicular to it. For an opaque metallic mirror, the transmittance is zero, and the corresponding emissivities are therefore εp = 1 − rp and εs = 1 − rs. The parameters t m a x and t m i n are the intensity transmittances along the major and minor axes of the equivalent polarization response of the downstream optical system, respectively, and α denotes the orientation angle of its major axis, hereafter referred to as the downstream-optics polarization-axis angle. BSM is the blackbody radiance of the scan mirror at its physical temperature; and Vbkg represents the contribution from instrument background radiation and detector dark current. The first two terms of Equation (1) describe the target radiance reflected by the scan mirror, whereas the third and fourth terms describe the polarized thermal emission from the scan mirror itself.
To simplify Equation (1), we define the mean scan-mirror reflectance r, the mean transmittance t of the downstream optical system, and the corresponding polarization parameters p r and p t for the scan mirror and downstream optical system, respectively, as follows:
r = 1 / 2 r p + r s , t = 1 / 2 t m a x + t m i n
p r = r p r s r p + r s , p t = t m a x t m i n t m a x + t m i n
Using the trigonometric identity acos2θ + bsin2θ = (1/2)(a + b) + (1/2)(a − b)cos(2θ), with θ = δα, Equation (1) can be rearranged as
V δ = R δ B S M r t + B S M t + R δ B S M p r p t r t c o s [ 2 δ α ] + V b k g
Equation (4) separates the detector output into a scan-angle-independent term and a polarization modulation term proportional to p r p t c o s [ 2 δ α ] . Here, δ α represents the relative angle between the rotating mirror-induced polarization and the fixed equivalent polarization axis of the downstream optical system. This form shows that the scan-angle-dependent signal arises from the coupling between the scan-mirror polarization and the equivalent polarization response of the downstream optical system.
The calibrated radiance is obtained using the standard two-point radiometric calibration equation [19]:
R δ , S = R I C T R D S V δ , S V δ , D S V δ , I C T V δ , D S + R D S
where RICT and RDS are the radiances of the Internal Calibration Target and deep space, respectively; Rδ,S is the calibrated scene radiance affected by polarization; and Vδ,S, Vδ,DS, and Vδ,ICT are the detector output signals for the scene, DS, and ICT views, respectively. Because these three views are observed at different scan-mirror rotation angles, their polarization modulation terms are different. Substituting Equation (4) into Equation (5) for the scene, DS, and ICT views gives
R δ , S = R I C T R D S R S R D S + p r p t Δ N R I C T R D S + p r p t Δ D + R D S
where ΔN and ΔD are defined as
Δ N = R S B S M cos   [ 2 δ S α ] R D S B S M cos   [ 2 δ D S α ]               Δ D = R I C T B S M cos   [ 2 δ I C T α ] R D S B S M cos   [ 2 δ D S α ]
In these expressions, RS denotes the true scene radiance, and δS, δDS, and δICT are the scan-mirror rotation angles corresponding to the scene, DS, and ICT views, respectively.
Since the combined polarization term p r p t is small, Equation (6) can be expanded to first order in p r p t . The zeroth-order term reduces to the true scene radiance RS, indicating that the two-point calibration is unbiased in the absence of polarization. The first-order term represents the radiometric error introduced by the polarization modulation. Defining this error as the difference between the polarization-affected calibrated radiance and the true scene radiance gives
E p , δ s = R δ , S R S p r p t Δ N R S R D S R I C T R D S Δ D
Substituting the definitions of Δ N and Δ D in Equation (7) into Equation (8) yields the complete expression for the polarization-induced radiometric error:
E p , δ s ν p r p t { R S cos   [ 2 δ S α ] R I C T R S R D S R I C T R D S cos   [ 2 δ I C T α ] R D S R I C T R S R I C T R D S cos   [ 2 δ D S α ]                                                                                     B S M [ cos   [ 2 δ S α ] R S R D S R I C T R D S cos   [ 2 δ I C T α ]                                         R I C T R S R I C T R D S cos   [ 2 δ D S α ] ] }                        
where ν is the wavenumber. Equation (9) shows that the polarization-induced radiometric error depends on the combined polarization p r p t , the scan-mirror rotation angles of the scene and calibration views, the downstream-optics polarization-axis angle α, and the radiance contrast among the scene, DS, ICT, and scan mirror.

2.3. Simulation Setup for Polarization-Error Sensitivity Analysis

To investigate the characteristics of the polarization-induced radiometric error and provide an initial assessment of its dependence on observational and spectral variables, a sensitivity simulation was performed using the model derived in Section 2.2. Equation (9) was evaluated for blackbody targets at prescribed temperatures, with RS calculated from the corresponding Planck radiances. The ICT, DS, and scan-mirror temperatures and the ICT and DS view angles were specified according to the HIRAS-II calibration geometry. The target scene temperature was varied over a prescribed range, representative wavenumbers were selected, and the scene scan angle was swept over [−90°, 90°], covering and extending beyond the nominal HIRAS-II Earth-view scan-angle range of [−48.6°, 48.6°]. The downstream-optics polarization-axis angle α was set to a nominal value of 90°. The main simulation settings are listed in Table 2.
The individual polarization parameters p r and p t are not known a priori, and only their product p r p t enters the polarization-induced radiometric error model expressed in Equation (9). Therefore, a wavenumber-independent estimate of p r p t = 0.001 was adopted for the sensitivity analysis. This value represents weak polarization coupling and satisfies the assumption p r p t ≪ 1. Holding p r p t constant excludes its spectral variation from the sensitivity analysis, allowing the influence of the other model inputs to be evaluated under the same polarization-coupling strength. Because Ep is proportional to p r p t , this estimate sets the reference magnitude of the simulated error, and the results can be scaled proportionally for other assumed values. The FOV- and band-dependent α and the FOV- and wavenumber-dependent p r p t used in the correction are retrieved independently from the TVAC measurements in Section 3.2. The resulting sensitivity patterns are presented in Section 3.1.

2.4. Prelaunch TVAC Polarization Test

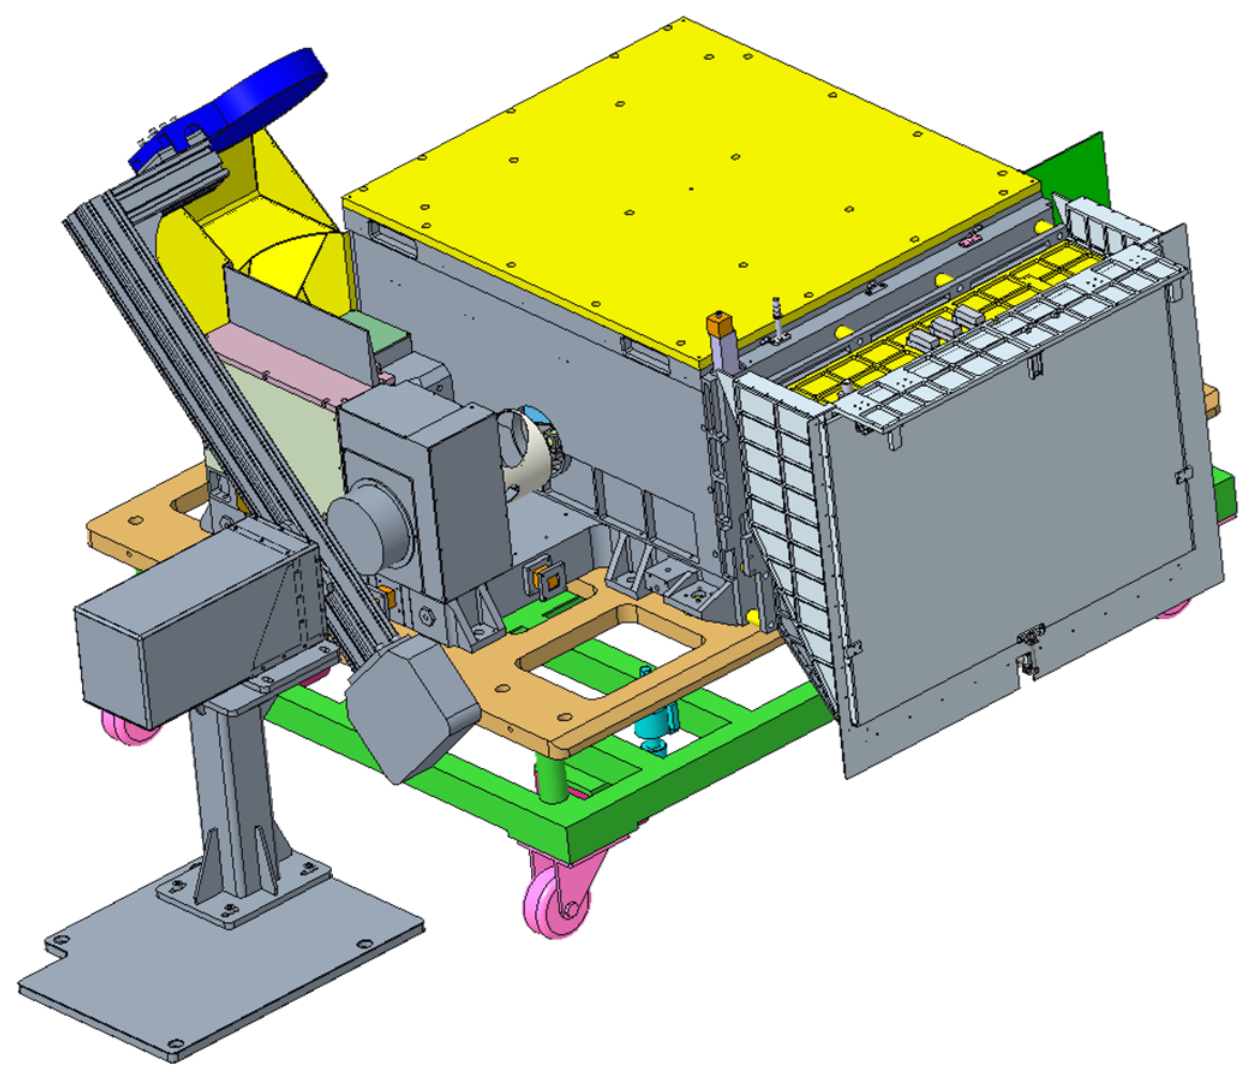
To characterize the scan-angle-dependent polarization response of HIRAS-II and provide measurements for subsequent polarization correction, a dedicated polarization test was conducted during the prelaunch TVAC radiometric and spectral calibration campaign of FY-3E/HIRAS-II. The experimental layout is shown in Figure 3. The HIRAS-II instrument and the polarization test apparatus were mounted on the calibration cart. The apparatus consisted of a high-precision, high-stability area-source blackbody, a swing arm, a high-accuracy rotation motor and its controller, and thermal-insulation pads. The area-source blackbody was placed above the scan mirror along the nadir direction of the instrument and served as a stable scene target for the polarization test.
In this ground-based configuration, the area-source blackbody represented the scene target, the ICT served as the warm reference, and the cold shield served as the cold reference corresponding to the on-orbit DS view. To ensure that the same stable target was observed at all scan angles, the rotating mechanism drove the area-source blackbody to rotate by the same angle as the scan mirror, so that the scan mirror pointed to the blackbody at each scan position. The scan mirror was stepped from −46.8° to +46.8° in 1.8° increments, which is finer than the 3.6° step used in the nominal on-orbit Earth-view sequence described in Section 2.1. This denser angular sampling provides more detailed measurements of the scan-angle-dependent radiometric modulation and is beneficial for retrieving the polarization parameters. For each scene scan angle δS,i, HIRAS-II sequentially observed the area-source blackbody at δS,i, the ICT at δICT, and the cold shield at δDS. During the test, both the area-source blackbody and ICT were temperature-controlled at 290 K, while the cold shield was maintained at 15 K. These measurements were then processed using the standard two-point calibration to obtain calibrated spectra at each scene scan angle. Owing to the experimental constraints, the measurements were carried out at a single target temperature of 290 K, rather than over the 210 to 310 K range used in the simulation.
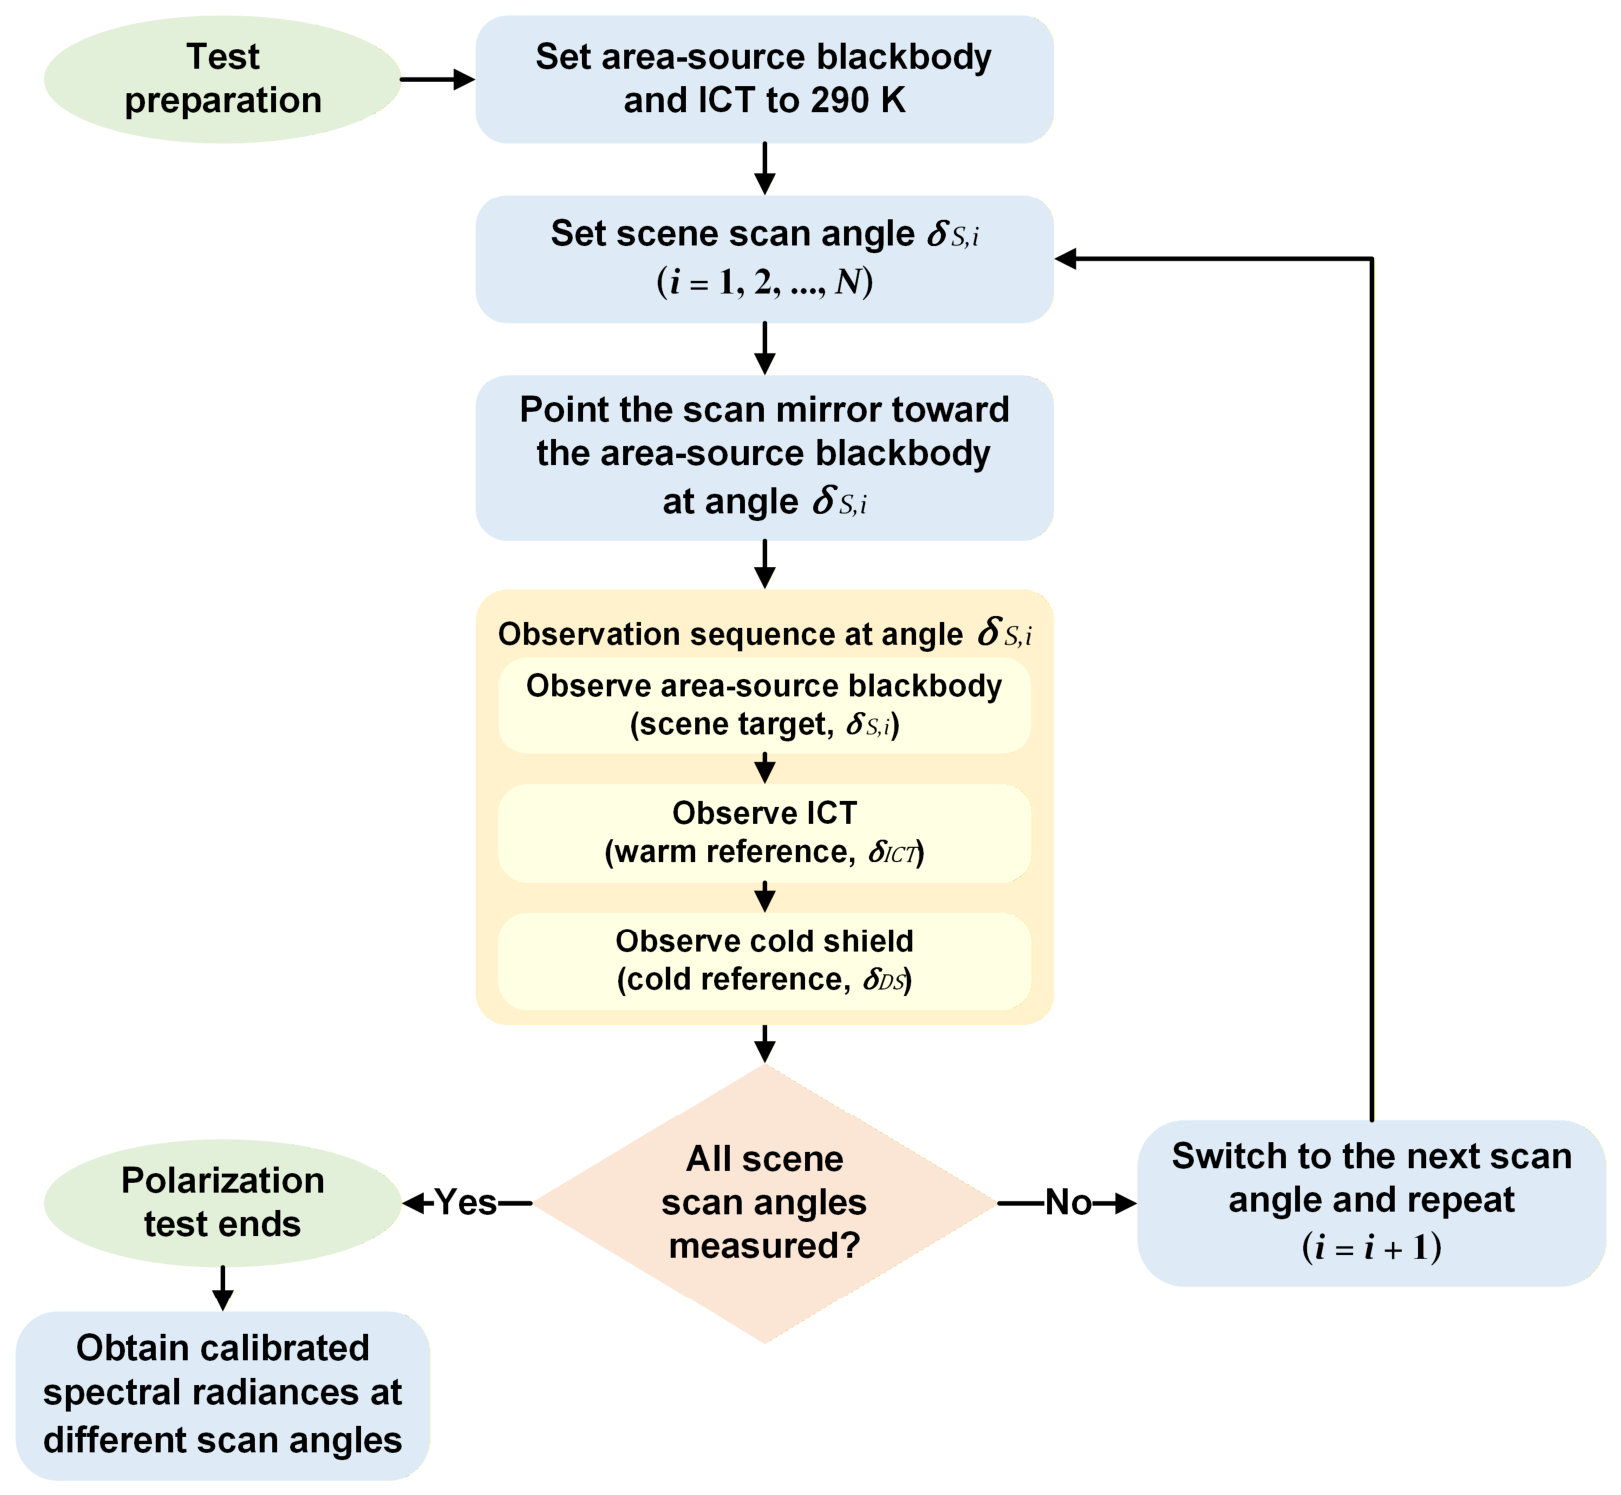
The test procedure is illustrated in Figure 4. The area-source blackbody and the ICT were first set to 290 K and allowed to reach thermal stability. For each scan angle, the scan mirror and the area-source blackbody were synchronously positioned so that, during the target observation, the scan mirror was directed toward the same stable area-source blackbody. After the pointing and instrument response became stable, the area-source blackbody was observed as the scene target, followed by observations of the ICT and the cold shield. The scan mirror and the area-source blackbody were subsequently rotated to the next scan angle, and the same observation sequence was repeated until all scan angles had been measured. In this way, a set of calibrated spectral radiances was obtained at different scan angles.

2.5. Decoupled Two-Step Polarization Parameter Retrieval and Correction

The downstream-optics polarization-axis angle α and the combined polarization p r p t are retrieved from the measured scan-angle-dependent calibration bias and are then used to correct the spectra. The retrieval is based on the polarization error model derived in Section 2.2. As shown in Equation (9), the polarization-induced radiometric error contains the angular term cos [2(δ − α)], which has a period of 180°. Its phase is determined by α, whereas its amplitude is related to the combined polarization p r p t and the radiance contrast among the scene target, ICT, cold shield, and scan mirror, where the cold shield provides the cold-reference radiance corresponding to the DS term in the model. This property allows α and p r p t to be retrieved in a decoupled manner.
To retrieve α, the calibrated spectral radiances obtained at different scene scan angles were first averaged over each spectral band for each FOV, forming a scan-angle-dependent radiance series y ( j ) ( δ S ) . Because the polarization modulation has a period of 180°, this radiance series was fitted by a constant term plus a sinusoidal term with the same period. Using the trigonometric identity cos [2(δS − α)] = cos(2δS)cos(2α) + sin(2δS)sin(2α), the fitting model can be linearized as
y ( j ) ( δ S ) = b 1 , j c o s 2 δ S + b 2 , j s i n 2 δ S + b 3 , j
where y ( j ) ( δ S ) is the band-averaged calibrated radiance of the j-th FOV at the scene scan angle δS, and b3,j represents the scan-angle-independent component. The coefficients b1,j, b2,j, and b3,j are obtained by linear least squares [20] using the measurements at all scan angles. The polarization-axis angle is then determined from the phase of the fitted modulation as
α ^ j = 1 2 a t a n 2 ( b 2 , j , b 1 , j )
Considering the slight differences in optical paths among the nine FOVs, α ^ j is retrieved separately for each FOV. Here and throughout this subsection, the ordinary italic symbol j denotes the FOV index (j = 1,…,9), while a hat denotes a fitted or retrieved parameter, or a quantity calculated using the retrieved parameters.
After α ^ j is obtained from the band-averaged scan-angle modulation, the effective combined polarization parameter p r p t is retrieved separately for each FOV and each wavenumber. According to Equation (9), the scan-angle-dependent component of the polarization-induced error is governed by the scene-to-scan-mirror radiance contrast and the periodic term cos [2(δS  − α)]. Therefore, the retrieval focuses on this periodic modulation term rather than the scan-angle-independent radiometric component.
For the j-th FOV and wavenumber ν, R δ S , m , S ( j ) ( ν ) denotes the polarization-affected calibrated scene radiance measured at the m-th scene scan angle δS,m. It corresponds to Rδ,S in Equation (8), with the FOV, scan-angle, and wavenumber indices explicitly included. The scan-angle mean is first removed as follows:
R ~ δ S , m , S ( j ) ( ν ) = R δ S , m , S ( j ) ( ν ) 1 N δ n = 1 N δ R δ S , n , S ( j ) ( ν )
where R ~ δ S , m , S ( j ) ( ν )  denotes the mean-removed polarization-affected calibrated radiance for the j-th FOV at the m-th scan angle, obtained by subtracting the scan-angle mean from R δ S , m , S ( j ) ( ν ) . Here, Nδ is the total number of scan angles, m denotes the current scan-angle index, and n is the summation index. With α ^ j fixed, the scan-angle-dependent modulation basis is defined as
G m j ν = R S δ S , m , ν B S M ν cos 2 δ S , m α ^ j
where R S δ S , m , ν is the reference radiance of the area-source blackbody at the m-th scan angle. It corresponds to RS in Equation (8), with the scan-angle measurement and wavenumber shown explicitly. BSM(ν) is the blackbody radiance of the scan mirror. The effective combined polarization parameter is then obtained by minimizing the following least-squares cost function:
J j , ν a , β = m = 1 N δ R ~ δ S , m , S ( j ) ( ν ) a β G m j ν 2
The fitted parameters are given by
a ^ j , ν , β ^ j , ν = arg min a , β J j , ν a , β
where a is an auxiliary constant term introduced to account for the scan-angle-independent component during least squares fitting. The coefficient β ^ j , ν represents the amplitude of the fitted angular modulation and is denoted as the retrieved effective combined polarization parameter:
( p r p t ) ^ j , ν = β ^ j , ν
Based on the retrieved effective combined polarization parameter ( p r p t ) ^ j , ν and polarization-axis angle α ^ j , the equivalent scan-angle-dependent polarization correction term is calculated for each scan angle, FOV, and wavenumber:
E ^ p , eq , δ S , m j ν = ( p r p t ) ^ j , ν R S δ S , m , ν B S M ν cos 2 δ S , m α ^ j
where E ^ p , eq , δ S , m j denotes the equivalent scan-angle-dependent polarization correction term. It corresponds to the fitted angular component indicated by Equation (9) and is used to correct the calibrated radiance. The corrected radiance is then obtained by subtracting this term from the measured calibrated radiance:
R δ S , m , S c o r r , j ν = R δ S , m , S j ν E ^ p , eq , δ S , m j ν
This procedure removes the fitted scan-angle-dependent polarization modulation from the calibrated spectra. Because the retrieval is performed on mean-removed radiance series with an auxiliary constant term, the estimated parameter mainly represents the angular modulation component rather than scan-angle-independent radiometric offsets.

3. Results

The results are presented in three stages. First, sensitivity simulations are used to examine the dependence of the polarization-induced radiometric error on scene temperature, scan angle, and wavenumber. Next, the prelaunch TVAC measurements are used to retrieve the downstream-optics polarization-axis angle α and the effective combined polarization parameter p r p t for each FOV and spectral channel. Finally, the retrieved parameters are applied to evaluate the polarization correction performance at representative wavenumbers, across all nine FOVs, and over the full spectral ranges.

3.1. Sensitivity Simulation of Polarization-Induced Radiometric Error

The simulation results were first examined over a range of target temperatures at three representative wavenumbers and then across six wavenumbers under the 290 K condition used in the prelaunch TVAC polarization test.
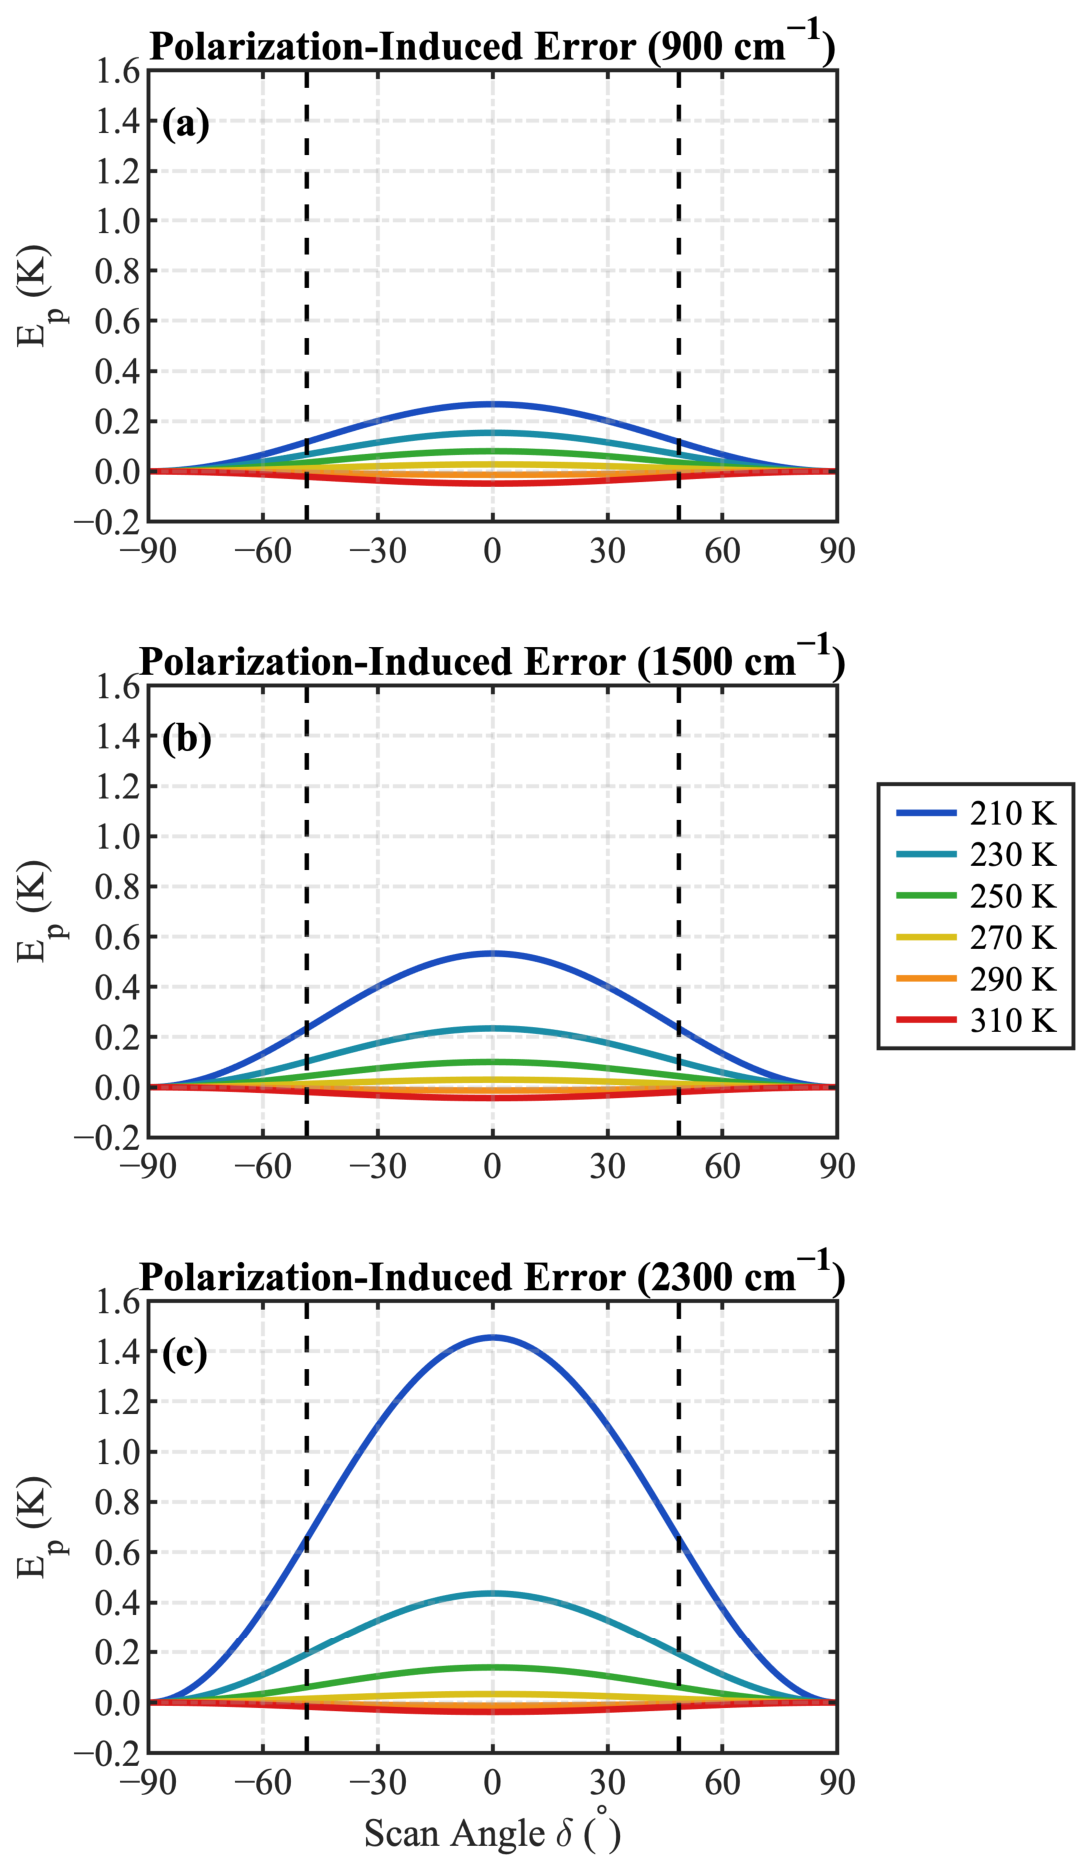
As shown in Figure 5, the simulated polarization-induced error exhibits a systematic scan-angle-dependent modulation whose magnitude is strongly affected by the target temperature. At all three representative wavenumbers, the maximum absolute error occurs at nadir and decreases toward the scan edges. When the target temperature is 270 K or lower, within the nominal HIRAS-II Earth-view scan-angle range, Ep is positive and decreases as the target temperature increases. As the target temperature increases beyond 270 K, Ep changes from positive to negative, and its absolute magnitude subsequently increases with increasing temperature. At 210 K, the nadir errors are 0.27, 0.53, and 1.45 K at 900, 1500, and 2300 cm−1, respectively. At 290 K, the corresponding values are approximately −0.01 K at all three wavenumbers. For a given target temperature, Ep increases consistently with increasing wavenumber. The largest absolute error among all simulated conditions is 1.45 K at 2300 cm−1 for the 210 K target. These results indicate that polarization-induced errors are particularly pronounced for cold targets at shorter wavelengths (higher wavenumbers).
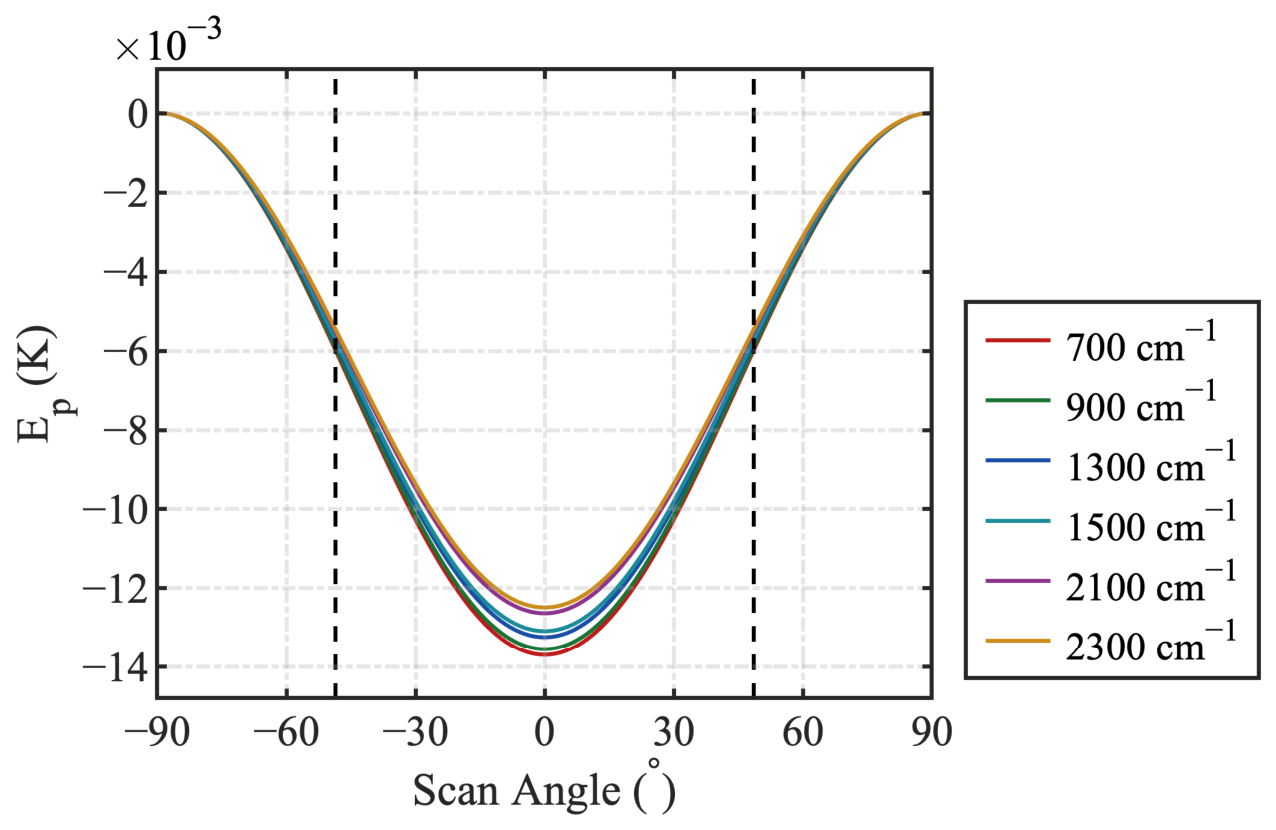
To further examine the dependence of the modeled error on wavenumber and scan angle, the target temperature was set to 290 K, matching the condition used in the prelaunch TVAC polarization test, while all other simulation settings remained as specified in Section 2.3. As shown in Figure 6, within the nominal HIRAS-II Earth-view scan-angle range, Ep is negative at all six representative wavenumbers and exhibits a similar scan-angle-dependent pattern, with the maximum absolute value occurring at nadir. The nadir error changes only slightly with wavenumber, decreasing in absolute magnitude from −0.0137 K at 700 cm−1 to −0.0136, −0.0132, −0.0131, −0.0126, and −0.0125 K at 900, 1300, 1500, 2100, and 2300 cm−1, respectively. Thus, under the simulated 290 K condition, the absolute error remains below 0.014 K throughout the examined spectral range and exhibits only a weak decrease toward higher wavenumbers.
Overall, the simulation results demonstrate that the polarization-induced radiometric error varies systematically with scan angle, target temperature, and wavenumber. The maximum absolute error occurs at nadir and decreases toward the scan edges. The target temperature has a pronounced influence on both the magnitude and sign of Ep: the error is positive at target temperatures of 270 K or lower but becomes negative at higher temperatures. At a given target temperature, the signed value of Ep increases with increasing wavenumber. The increase is particularly pronounced for cold targets, resulting in larger polarization-induced errors at shorter wavelengths. Under the 290 K test condition, however, the error remains small and varies only slightly across the examined wavenumbers.

3.2. Retrieval Results of Polarization Parameters

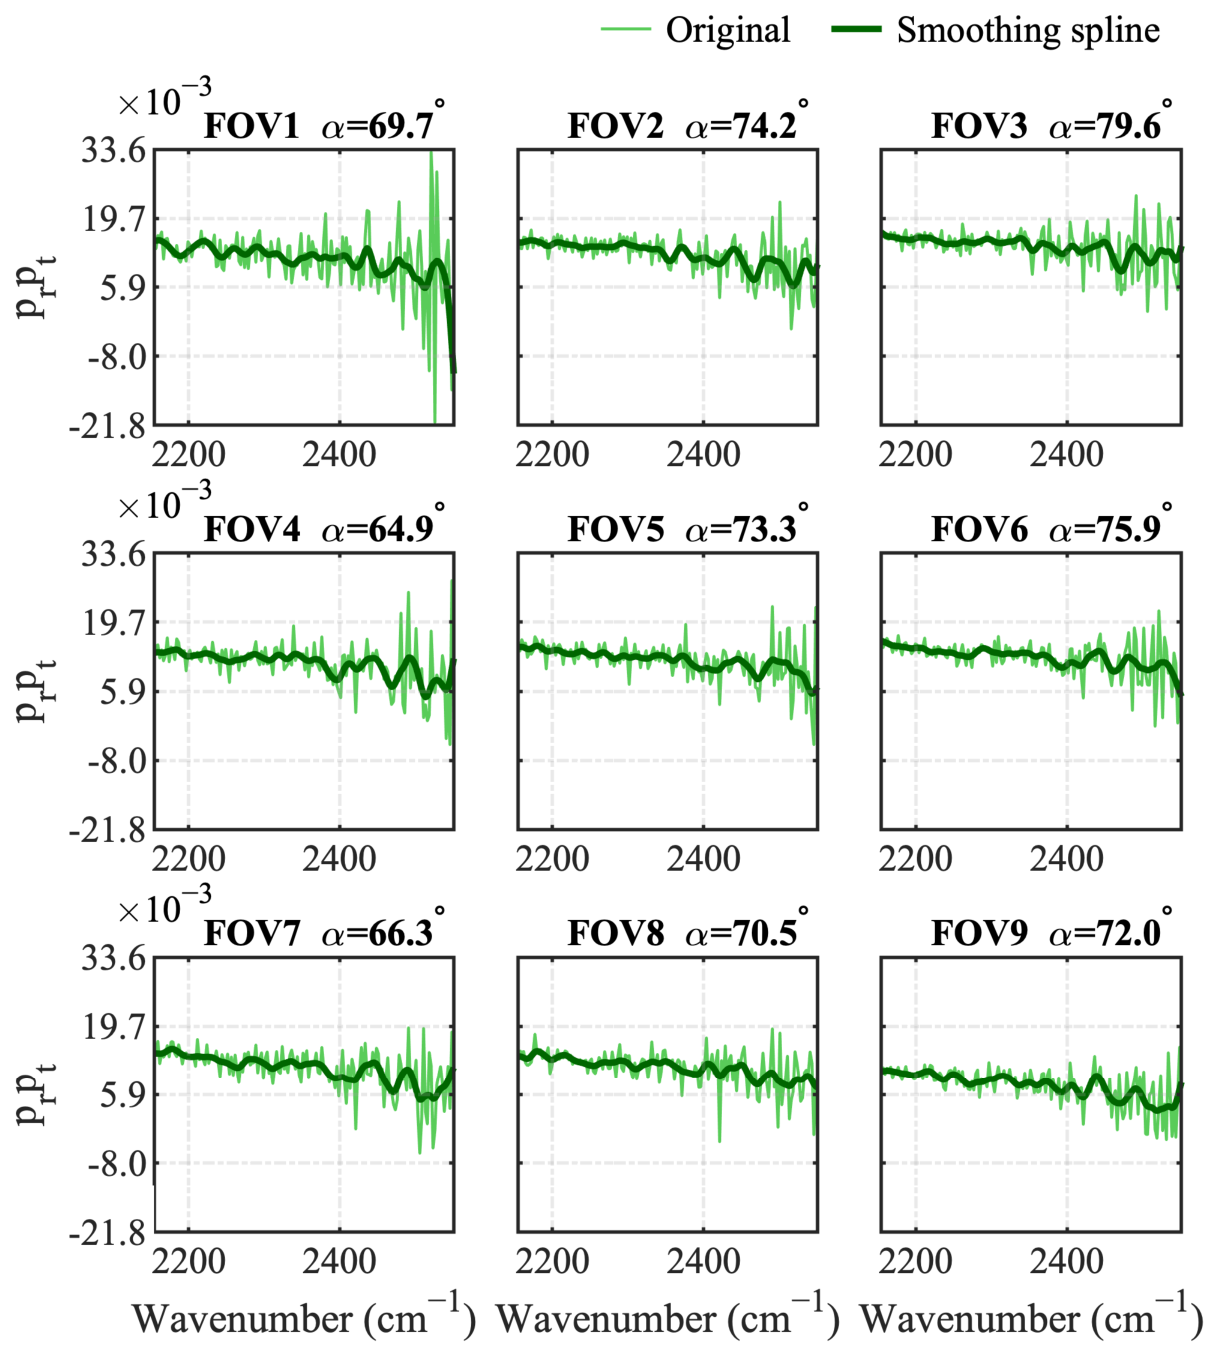
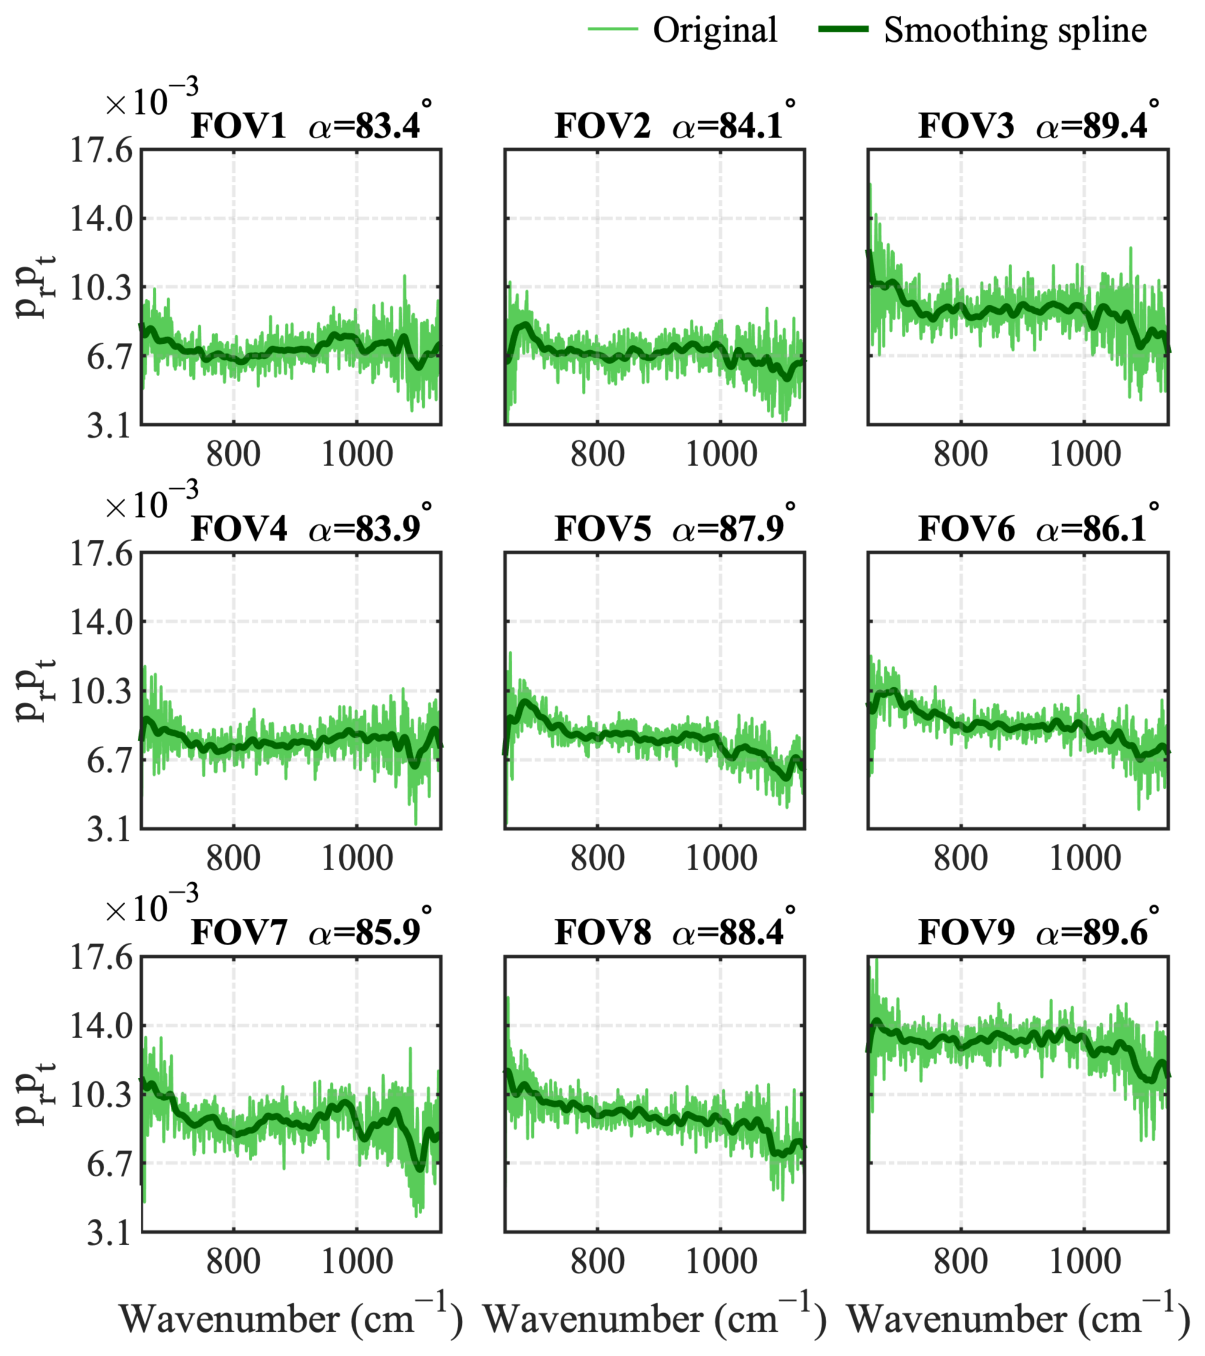
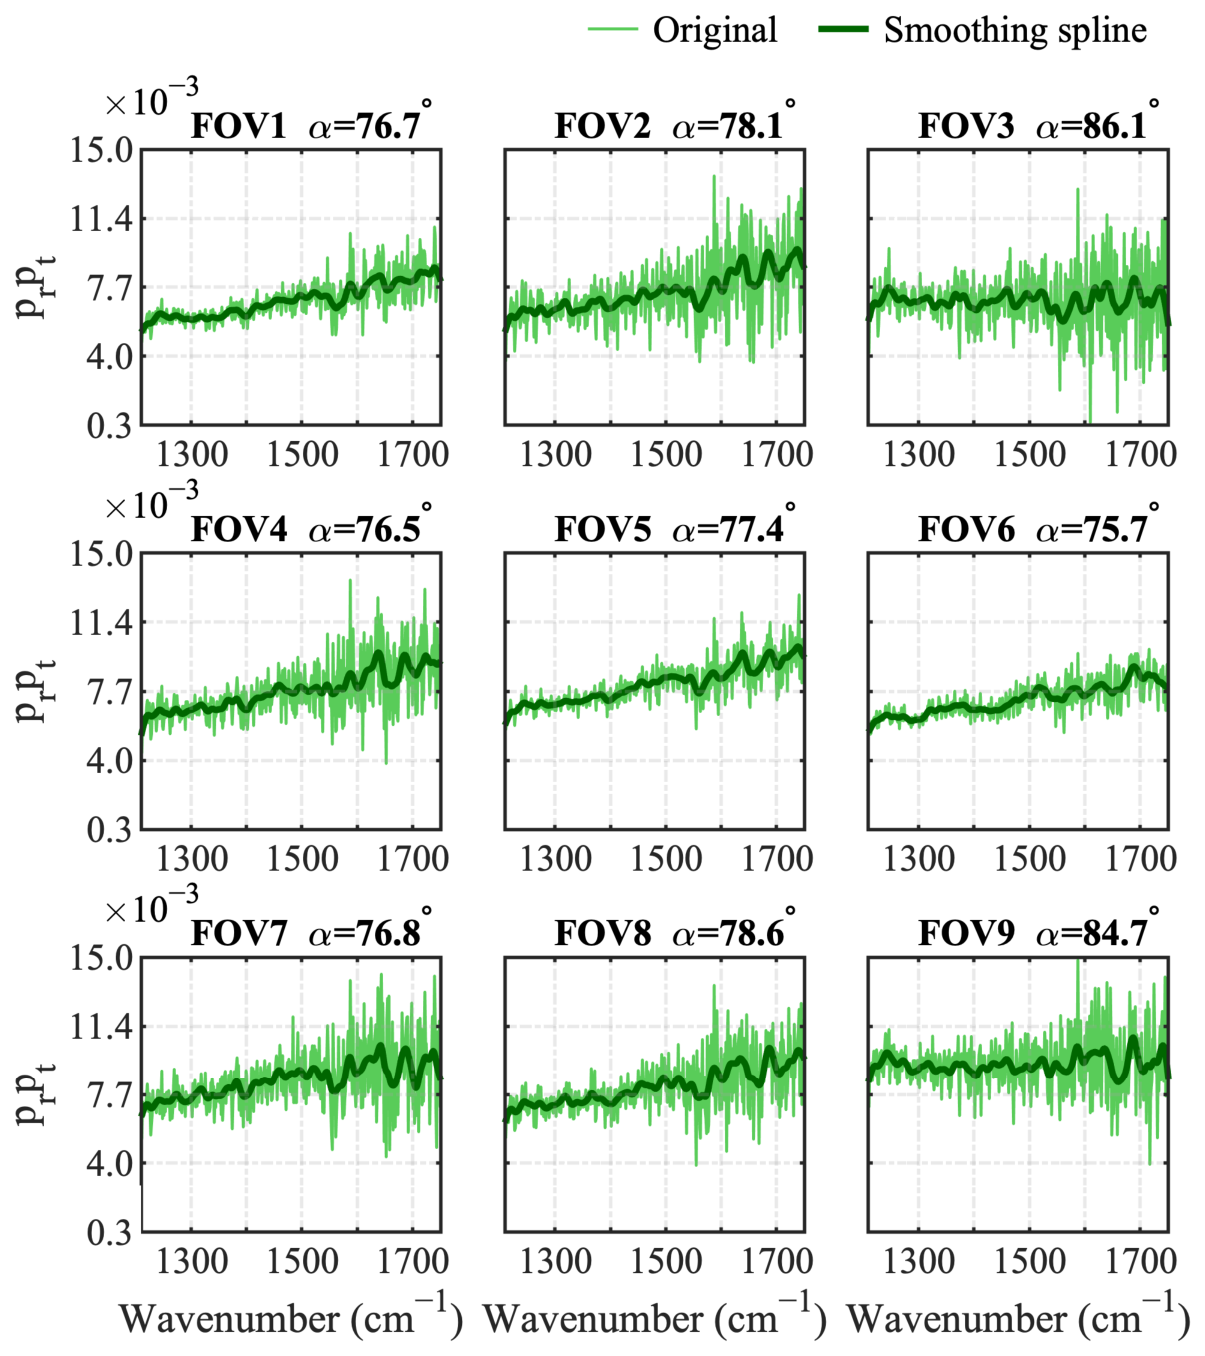
Using the decoupled retrieval method described in Section 2.5, the downstream-optics polarization-axis angle α and the effective combined polarization parameter p r p t were retrieved from the measurements acquired during the prelaunch TVAC polarization test. The angle α was determined separately for each FOV and spectral band from the phase of the band-averaged scan-angle modulation, whereas p r p t was retrieved for each FOV and spectral channel. Figure 7, Figure 8 and Figure 9 present the corresponding results for the LW, MW1, and MW2 bands, respectively. The smoothing-spline curves are included only to highlight the broad spectral trends of p r p t and are not used in the subsequent polarization correction, which is performed using the original channel-wise retrieved values.
The retrieved angle α is generally consistent among the nine FOVs within each band, while also exhibiting discernible FOV-to-FOV differences and a clear dependence on spectral band. Its mean value decreases from 86.5° in the LW band to 79.0° in MW1 and 71.8° in MW2. The corresponding ranges are 83.4–89.6°, 75.7–86.1°, and 64.9–79.6°, with standard deviations of 2.4°, 3.8°, and 4.6°, respectively. The progressive shift in α from LW to MW2 indicates that the orientation of the equivalent polarization response varies among the three optical bands. The discernible within-band differences further support retrieving α separately for each FOV.
The retrieved p r p t values are predominantly at the 10−3–10−2 level and exhibit distinct band- and FOV-dependent spectral characteristics. As shown in Figure 7, the LW results exhibit a broad nonmonotonic pattern, with p r p t generally decreasing at lower wavenumbers, increasing over the middle portion of the band, and decreasing again toward the high-wavenumber edge. Figure 8 shows that p r p t generally increases with wavenumber in the MW1 band, with the increase becoming more pronounced toward the high-wavenumber end. In the MW2 band, Figure 9 indicates an overall decreasing tendency with increasing wavenumber, together with stronger local variations near the high-wavenumber edge. Although the magnitudes and local variations differ among the FOVs, the principal spectral pattern within each band is broadly consistent across the nine FOVs. The original channel-wise retrieved values show greater scatter near the band edges, particularly toward the high-wavenumber ends.
Overall, the retrieved parameters exhibit systematic band-, FOV-, and wavenumber-dependent characteristics. The original retrieved values of α and p r p t are used directly in Section 3.3 to calculate the polarization correction term and correct the measured spectra.

3.3. Polarization Correction Results

Using the original FOV- and channel-dependent polarization parameters retrieved in Section 3.2, the equivalent scan-angle-dependent polarization correction term E ^ p , e q was calculated according to Equation (17) and applied to the TVAC spectra using Equation (18). The correction performance was evaluated from three complementary perspectives: the angular characteristics at representative wavenumbers, the FOV-level brightness temperature deviations in each band, and the nadir-referenced variations over the full spectral ranges.
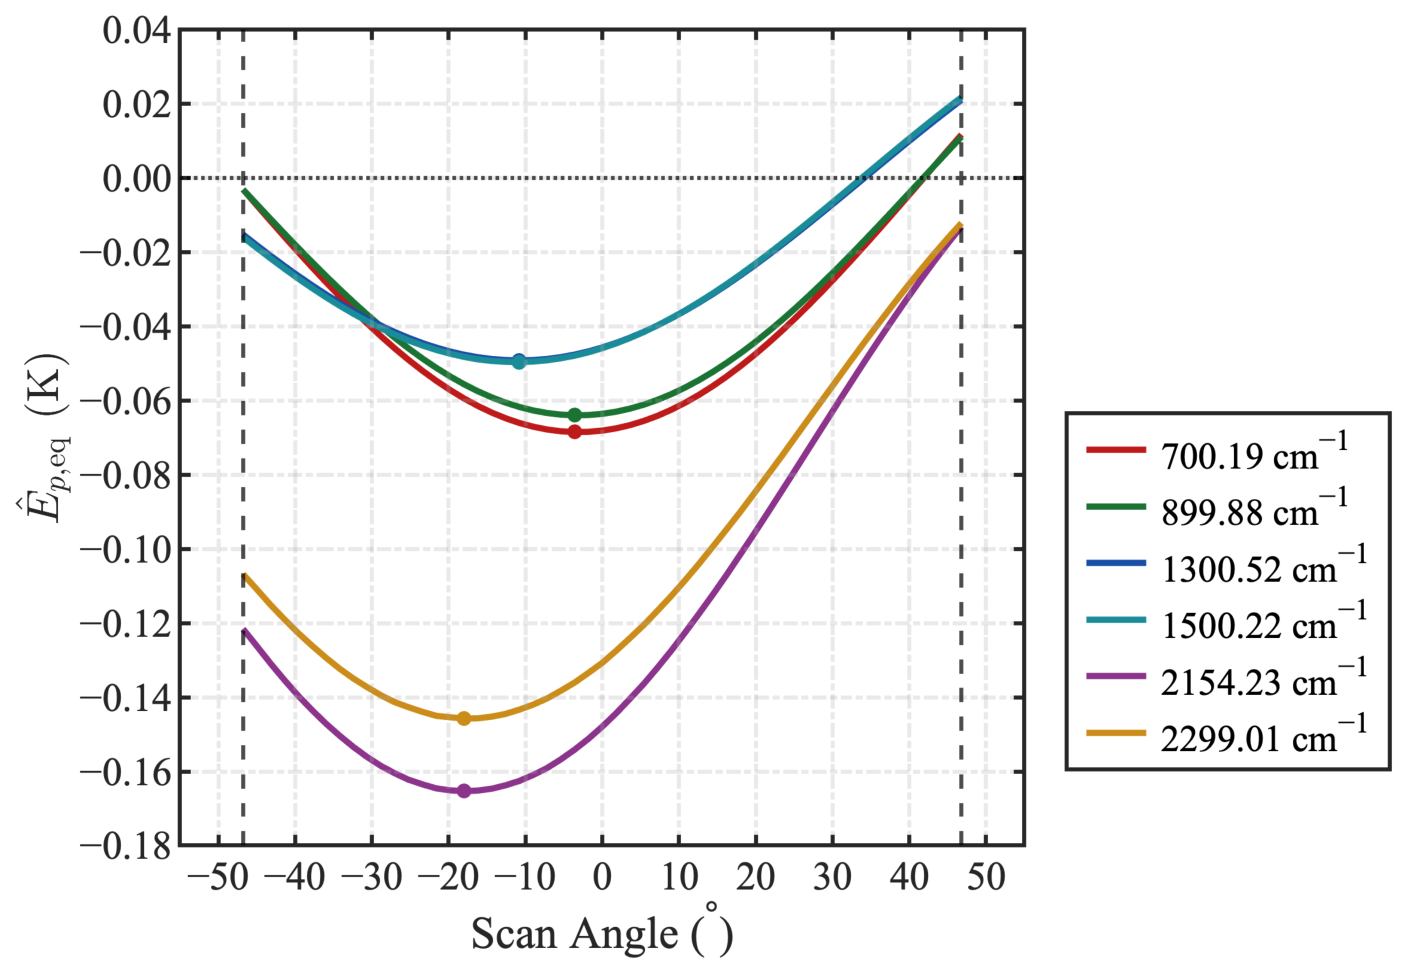
The retrieval-based correction terms at six representative wavenumbers under the 290 K TVAC target condition are presented in Figure 10. All six curves exhibit clear scan-angle-dependent modulation, with distinct minimum positions and amplitudes among the three bands. In the LW band, the minima are −0.0685 and −0.0640 K at 700.19 and 899.88 cm−1, respectively, both occurring at −3.6°. The corresponding minima in MW1 are −0.0492 and −0.0496 K at 1300.5 and 1500.2 cm−1, both at −10.8°. MW2 exhibits the largest absolute correction terms, reaching −0.1653 and −0.1457 K at 2154.2 and 2299.0 cm−1, respectively, with both minima located at −18°. The progressive shift in the minimum position from LW to MW2 is consistent with the retrieved values of α, because the angular minimum is expected near δS = α − 90°. In contrast, the simulated curves in Figure 6 reach their minima at 0° because α was prescribed as 90° in the sensitivity simulation. The differences in magnitude and cross-band ordering between the simulated error and the retrieval-based correction term are discussed in Section 4.2.
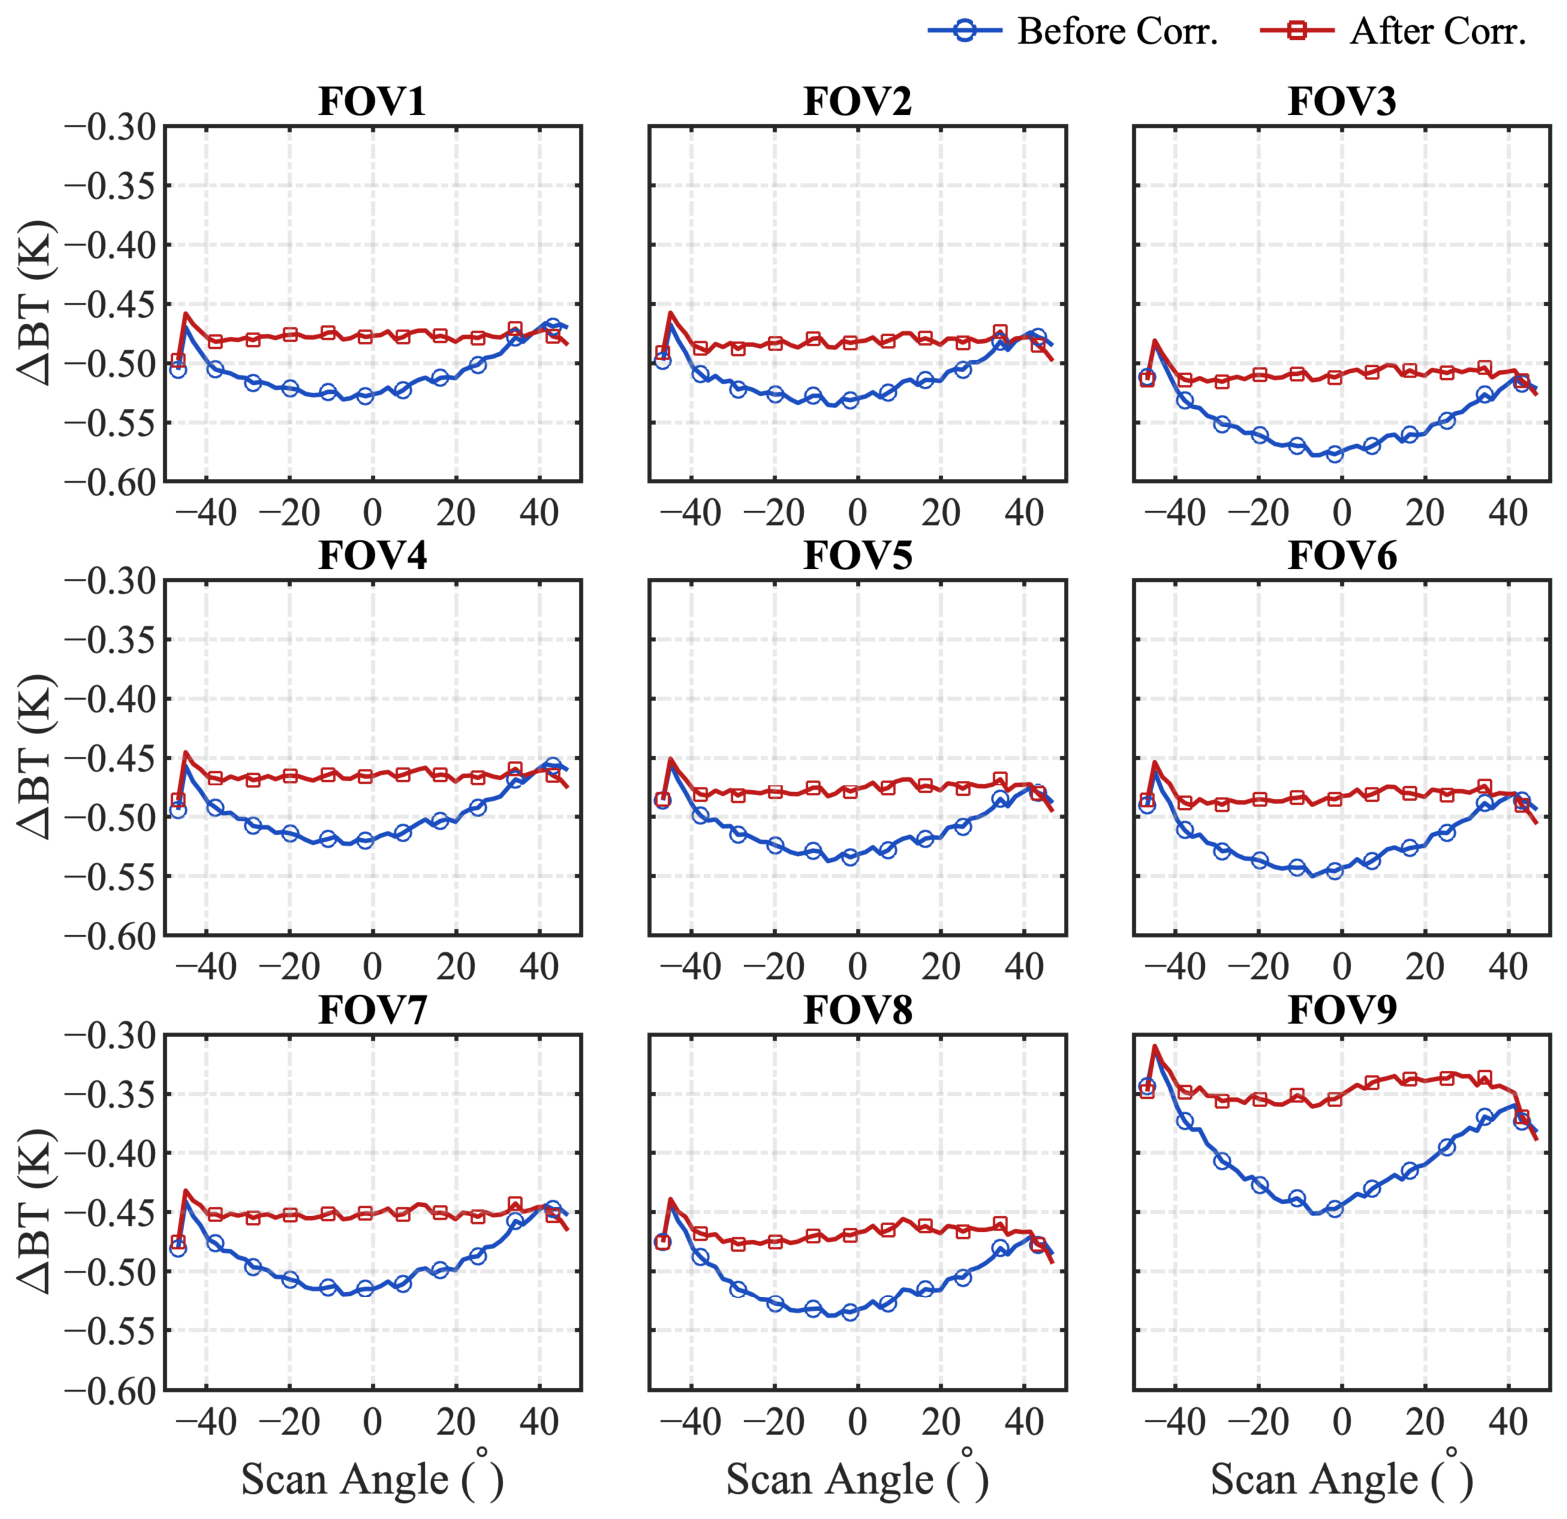
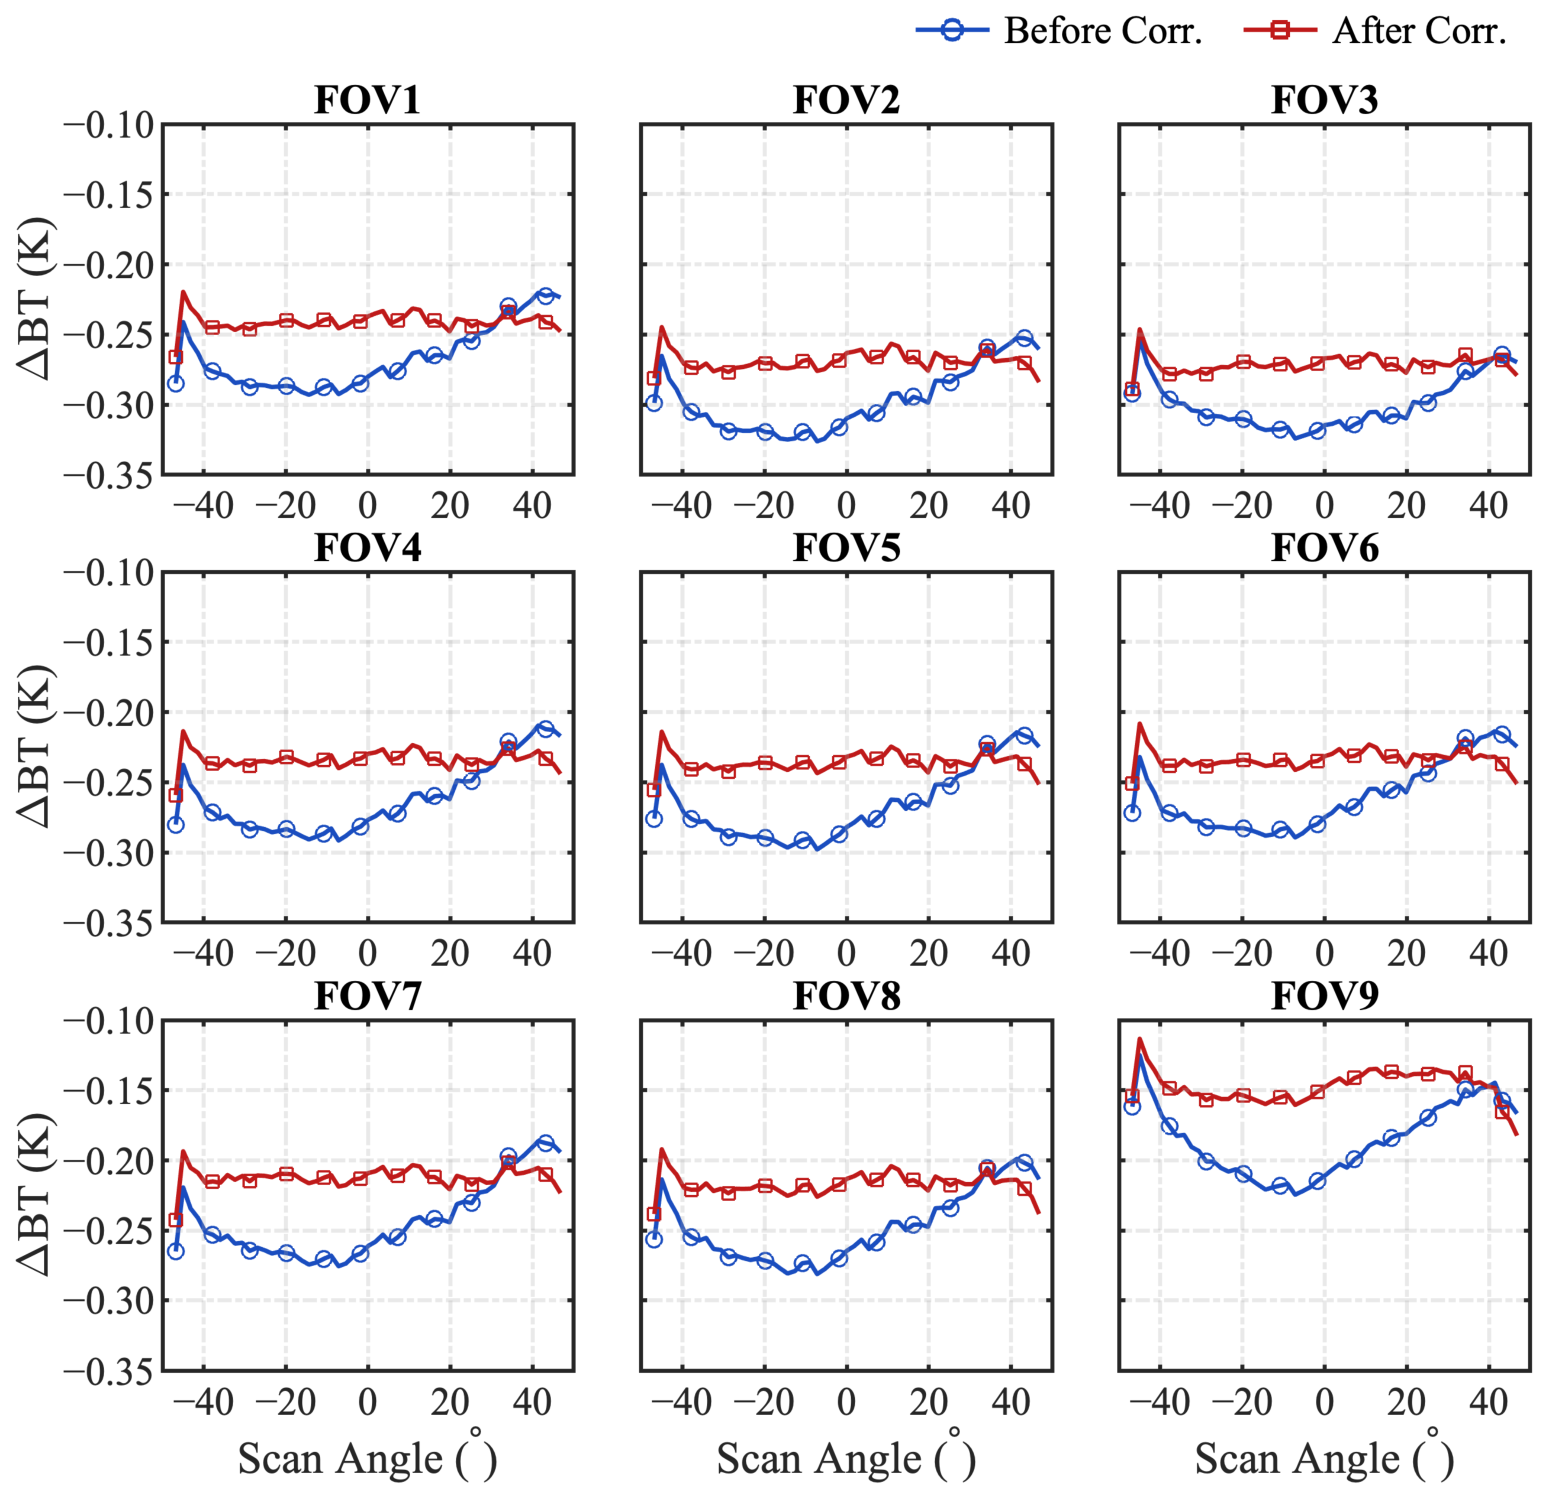
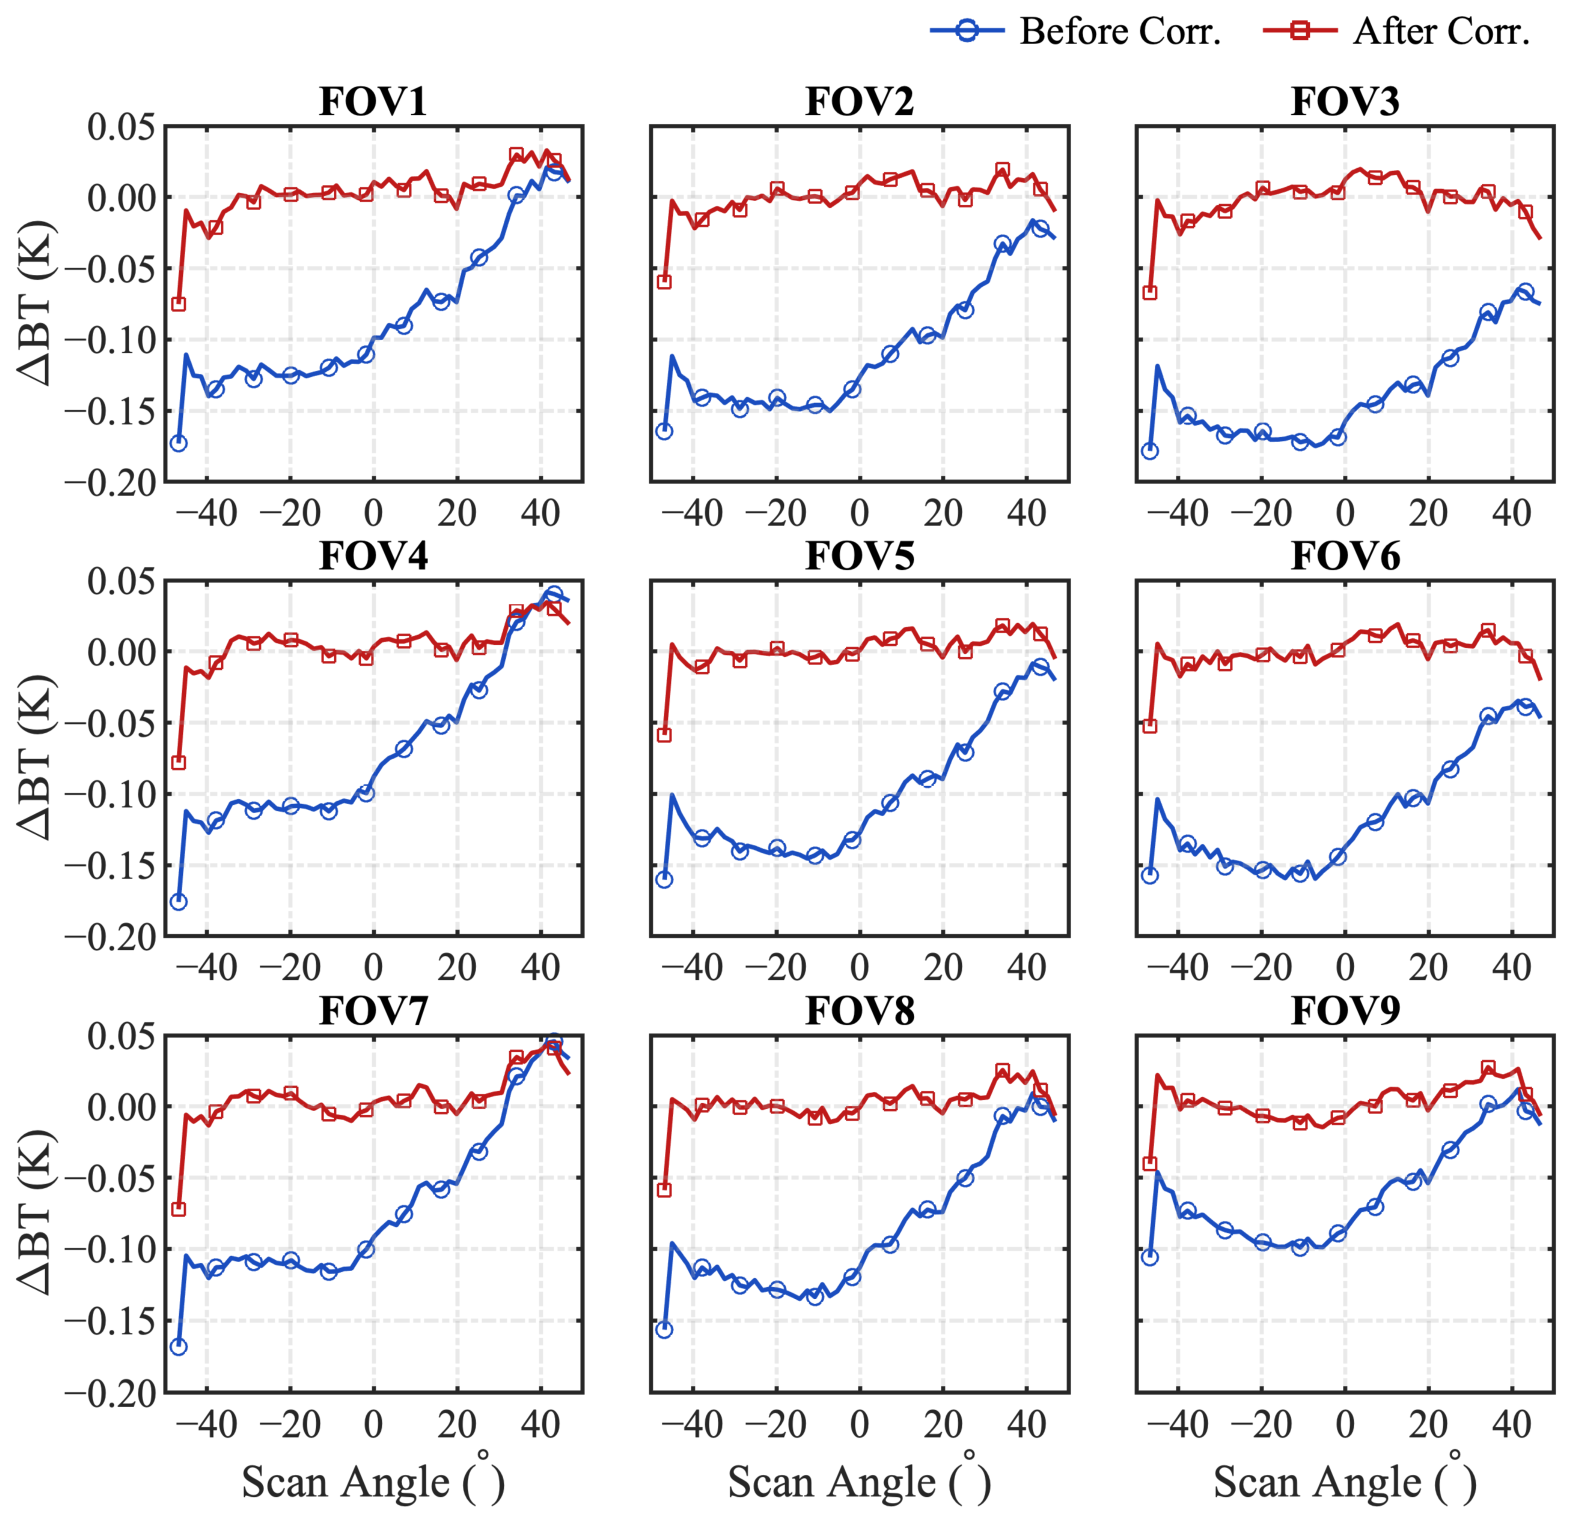
The FOV-resolved results in Figure 11, Figure 12 and Figure 13 demonstrate a substantial reduction in scan-angle-dependent modulation across all three bands. Before correction, the angular modulation is superimposed on a band-dependent radiometric offset. The overall magnitude of the uncorrected ΔBT is largest in the LW band, followed by MW1 and MW2. By contrast, the angular component is most pronounced in MW2, which consequently exhibits the largest correction amplitude. After correction, the curves become markedly flatter over the measured scan-angle range for all nine FOVs. Negative scan-angle-independent offsets remain in the LW and MW1 bands, whereas the corrected MW2 deviations are centered close to zero.
The statistical results further confirm the consistent improvement in angular stability. The FOV-averaged standard deviation of ΔBT over the scan angle decreases from 0.023 to 0.007 K in the LW band, from 0.024 to 0.007 K in MW1, and from 0.045 to 0.014 K in MW2, corresponding to reductions of approximately 69–71%. The peak-to-peak angular variations are reduced from 0.087, 0.081, and 0.161 K to 0.049, 0.047, and 0.089 K, respectively, representing reductions of approximately 42–45%. The maximum reductions in ΔBT reach 0.093 K for FOV 9 in the LW band, 0.064 K for FOV 9 in MW1, and 0.174 K for FOV 3 in MW2, with the latter occurring at a scan angle of −7.2°. These results show that the correction reduces both the overall angular dispersion and the dominant scan-angle-dependent excursions in all three bands.
Despite the substantial flattening of the angular curves, a nearly constant radiometric offset remains after correction. The FOV-averaged residual deviations are −0.462 K in the LW band, −0.229 K in MW1, and 0.002 K in MW2. This behavior is consistent with the retrieval formulation: the scan-angle mean is removed before p r p t is fitted, so the correction specifically targets the angular modulation rather than the scan-angle-independent radiometric component. The residual offset therefore represents a scan-angle-independent component outside the scope of the present polarization correction.
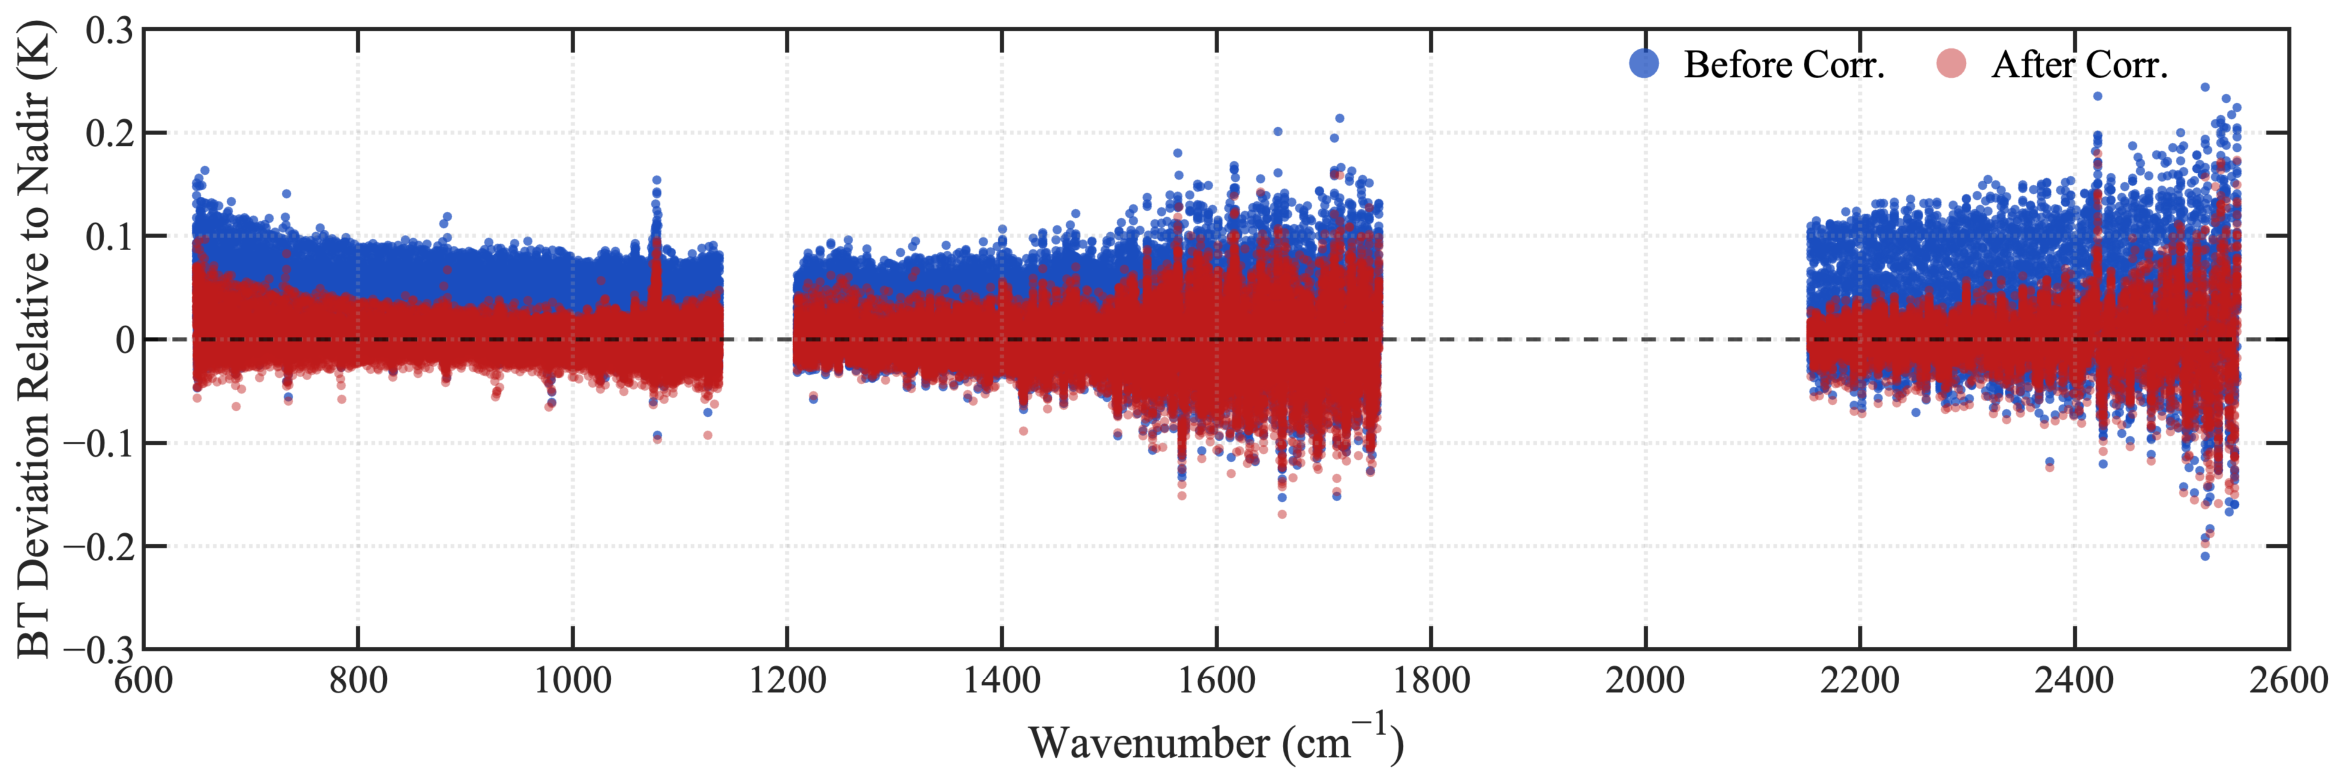
To assess whether the improvement extends beyond the representative channels and band-averaged angular curves, Figure 14 compares the full-spectrum brightness temperature deviations relative to the nadir view. Before correction, the nadir-referenced deviations are predominantly positive and show considerable dispersion across the three bands, indicating widespread scan-angle-dependent variations over the measured spectral channels. After correction, the distributions shift toward zero and become substantially narrower throughout most of the LW, MW1, and MW2 spectral ranges. The improvement is particularly evident in MW2, consistent with the larger angular correction amplitudes observed in Figure 13. Some residual spectral variability remains near the band edges and toward the high-wavenumber ends of MW1 and MW2. Because referencing each observation to the nadir view removes the scan-angle-independent component, these full-spectrum results directly demonstrate the reduction in angular modulation across most of the measured spectral ranges.
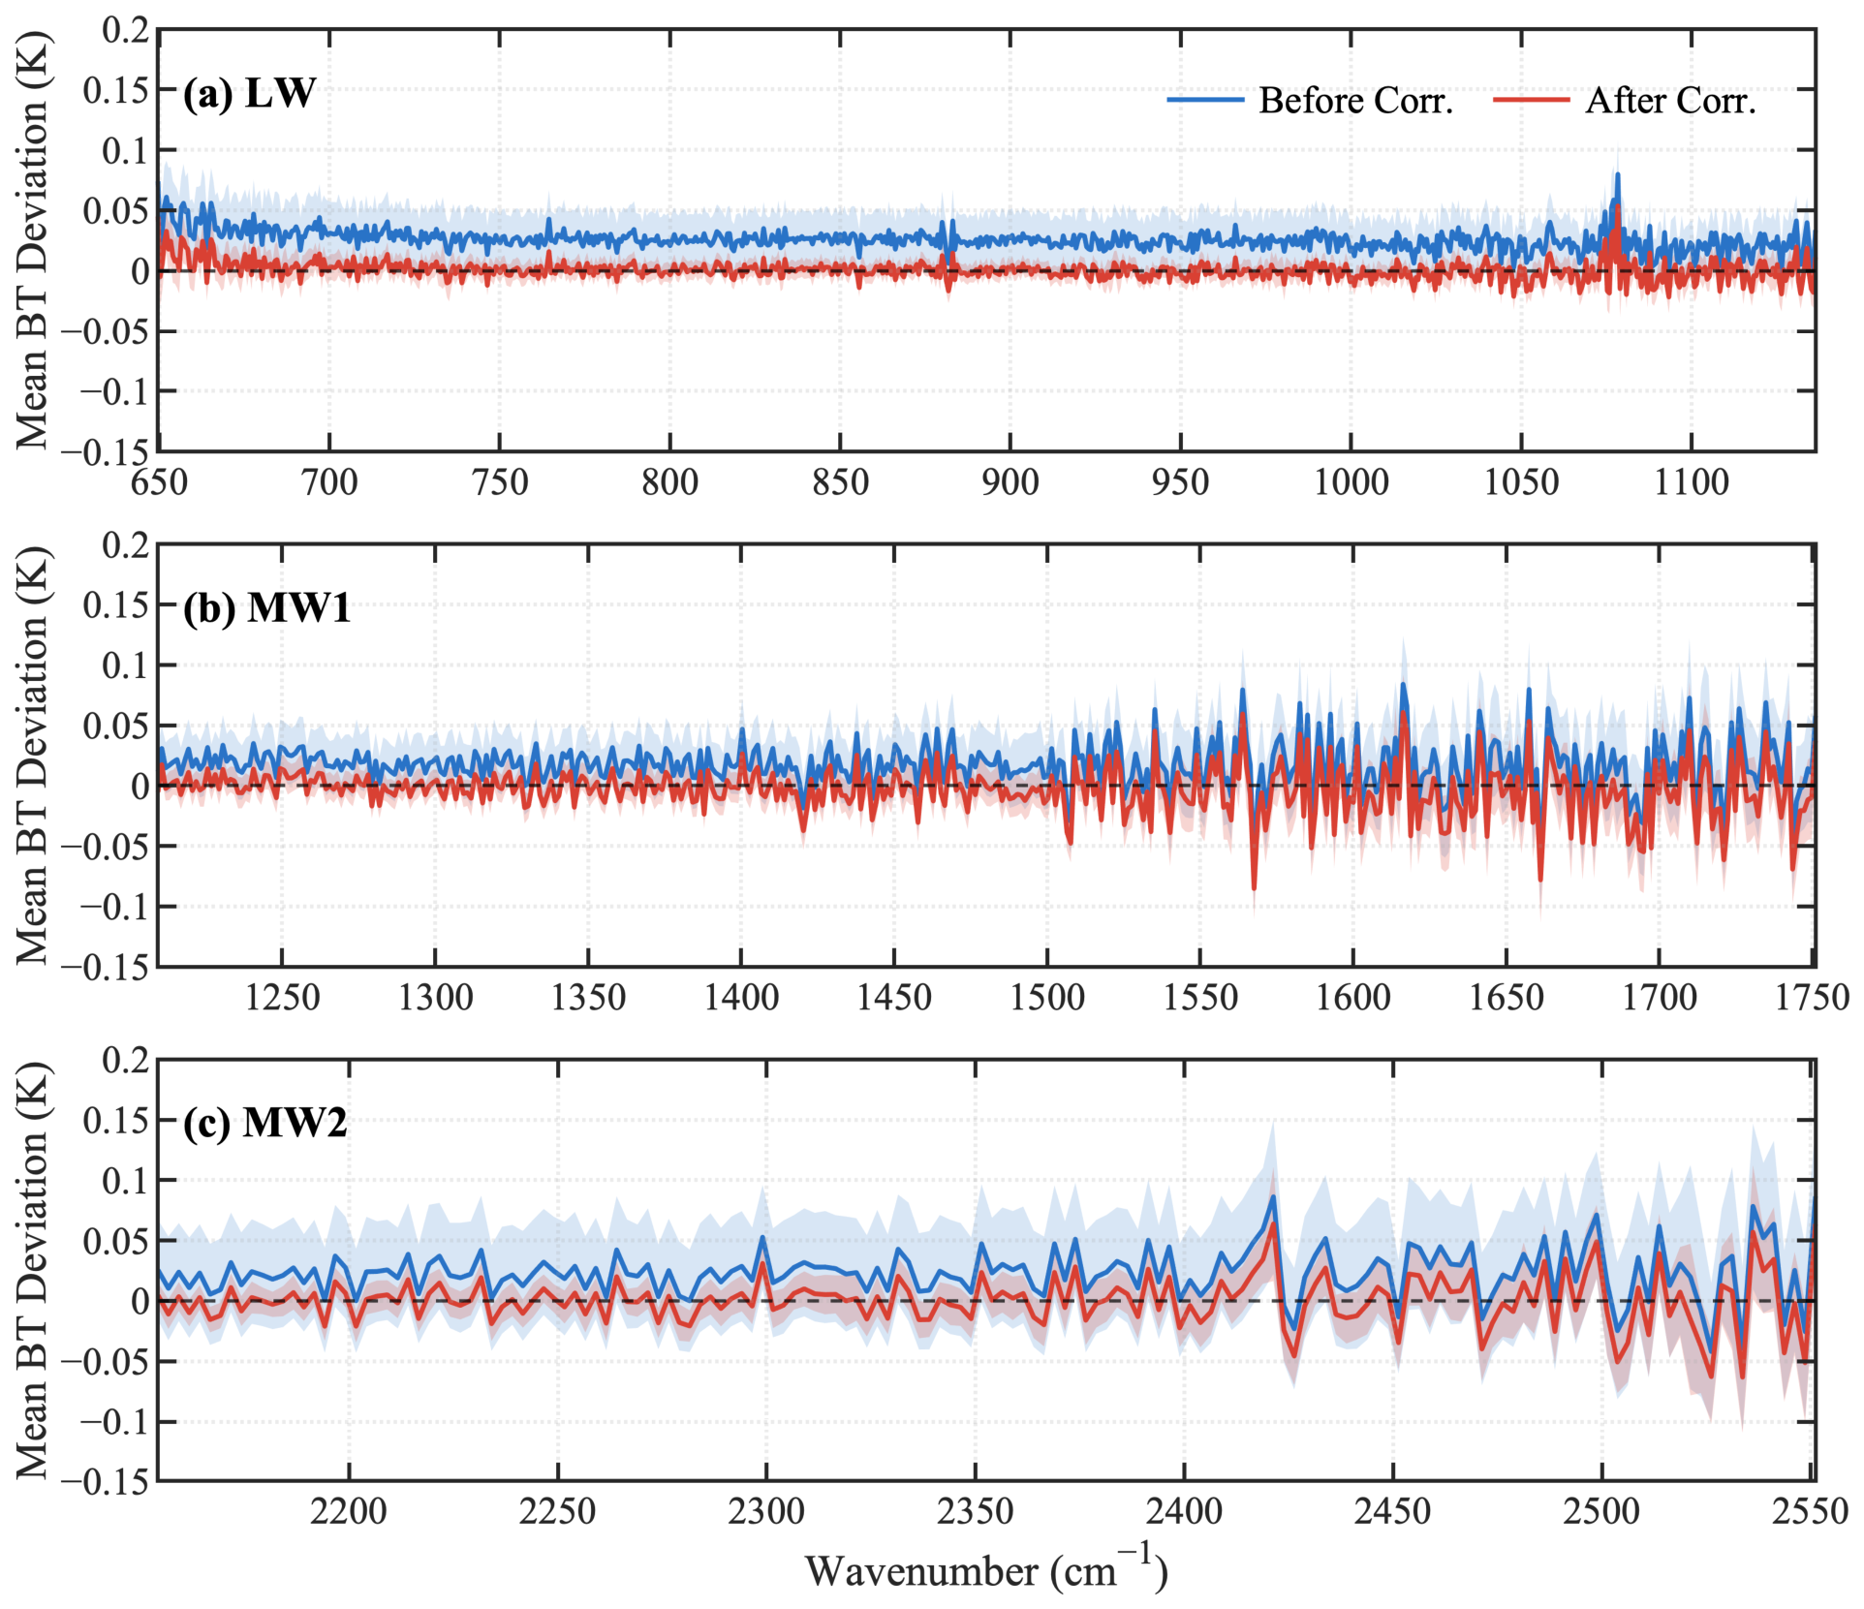
Figure 15 summarizes the mean and standard deviation of the FOV-averaged brightness-temperature deviations shown in Figure 14. After correction, the mean deviations shift closer to zero across all three bands, while the shaded standard-deviation ranges generally become narrower. This improvement is particularly evident in MW2, where the relatively large pre-correction variability is substantially reduced. LW and MW1 also show reductions in both the mean offsets and scan-angle-dependent variability.
Taken together, the reductions observed at representative wavenumbers, across the nine FOVs, and over the full spectral ranges demonstrate that the retrieved α and p r p t effectively characterize and correct the dominant scan-angle-dependent polarization modulation under the 290 K test condition.

4. Discussion

The results demonstrate that the scan-angle-dependent polarization response of HIRAS-II can be characterized under controlled prelaunch TVAC conditions and substantially reduced using the retrieved polarization parameters. The retrieved angle α and combined polarization parameter p r p t exhibit clear band-, FOV-, and wavenumber-dependent characteristics. These characteristics determine both the phase and amplitude of the measured angular modulation and explain why a single set of constant polarization parameters would be insufficient to represent the three spectral bands and nine FOVs. The following sections discuss the physical interpretation of the retrieved parameters, the relationship between the sensitivity simulation and the measured modulation, the correction performance and residual offset, and the implications and limitations of the present study.

4.1. Physical Interpretation of the Retrieved Polarization Parameters

The retrieved downstream-optics polarization-axis angle α exhibits a systematic dependence on spectral band. Its mean value decreases from 86.5° in the LW band to 79.0° in MW1 and 71.8° in MW2. This variation indicates that the equivalent orientation of the polarization-sensitive response is not common to the three bands. After the interferometer, the radiation is separated into three spectral branches and transmitted through band-specific filters, lenses, immersion optics, and detectors. The effective polarization response of each band therefore represents the combined contribution of a different downstream optical path. The observed band dependence of α is consequently consistent with the optical configuration of HIRAS-II rather than with a single polarization axis shared by the full instrument.
Within each band, the nine FOVs show broadly similar α values, although discernible FOV-to-FOV differences remain. These modest differences are consistent with the slightly different optical paths and corresponding polarization responses of the nine FOVs, supporting the retrieval of α separately for each FOV. Their physical relevance is also supported by the positions of the minima in Figure 10. For a modulation proportional to cos [2(δSα)], the minimum is expected near δS = α − 90°. The observed minima occur at approximately −3.6° in LW, −10.8° in MW1, and −18° in MW2, following the same shift predicted from the band-averaged values of α. Thus, the retrieved angles consistently describe the phase of the measured angular modulation.
The combined polarization parameter p r p t also exhibits distinct spectral characteristics in the three bands. The LW results show a broad nonmonotonic pattern, generally decreasing at lower wavenumbers, increasing over the middle part of the band, and decreasing again toward the high-wavenumber edge. In MW1, p r p t generally increases with wavenumber, whereas MW2 shows an overall decrease. Although the detailed magnitudes and local variations differ among FOVs, the main spectral pattern within each band is broadly consistent across the nine FOVs. These results indicate that the effective combined polarization cannot be represented by a single monotonic function of wavelength or wavenumber across all three bands.
It should also be emphasized that the retrieved p r p t is an effective parameter describing the coupling between the scan-mirror polarization and the equivalent polarization sensitivity of the downstream optical system. The present measurements do not independently separate the scan-mirror contribution p r from the downstream contribution p t . Consequently, the spectral behavior of p r p t should be interpreted as the overall response of the coupled optical system. The smoothing-spline curves in Figure 7, Figure 8 and Figure 9 are useful for visualizing these broad spectral tendencies, whereas the original channel-wise retrieved values are retained for the correction.

4.2. Relationship Between the Sensitivity Simulation and the Retrieved Polarization Modulation

Figure 6 and Figure 10 both show scan-angle-dependent polarization behavior under the 290 K target condition at comparable representative wavenumbers. However, Figure 6 presents the simulated polarization-induced radiometric error Ep, calculated using the complete two-point calibration model with the prescribed parameters p r p t = 0.001 and α = 90°. In contrast, Figure 10 presents the measurement-based equivalent correction term E ^ p , e q , calculated from the TVAC measurements using the retrieved FOV- and wavenumber-dependent p r p t and the FOV- and band-dependent α. Thus, Figure 6 illustrates the general sensitivity predicted by the polarization-error model, whereas Figure 10 characterizes the instrument-specific scan-angle-dependent polarization modulation of HIRAS-II.
The different values of α primarily explain the difference in angular phase. In Figure 6, all simulated curves reach their maximum absolute values at nadir because α is fixed at 90°. In Figure 10, the minima progressively shift toward negative scan angles from LW to MW2, consistent with the retrieved decrease in α. These positions are consistent with the corresponding band-averaged values of the retrieved polarization-axis angle and demonstrate that the retrieved α effectively characterizes the phase of the measured angular modulation.
The two figures also exhibit substantial differences in magnitude and spectral variation. In Figure 6, the maximum absolute error under the 290 K condition is 0.0137 K at 700 cm−1, and the absolute error decreases slightly with increasing wavenumber, reaching its minimum value of 0.0125 K at 2300 cm−1 in MW2. In Figure 10, the equivalent correction terms exhibit much stronger spectral and band-dependent variations. The largest absolute correction term reaches 0.1653 K at 2154.23 cm−1 in MW2, and the other selected MW2 channel at 2299.01 cm−1 also shows a relatively large value of 0.1457 K. The constant p r p t prescribed in Figure 6 cannot represent variations in the effective polarization response among spectral bands, FOVs, and wavenumbers. By contrast, the parameters used in Figure 10 are retrieved from the TVAC measurements and therefore reflect the instrument-specific band-, FOV-, and wavenumber-dependent polarization characteristics of HIRAS-II.
The temperature-dependent simulations in Figure 5 provide further context for these results. As the target temperature decreases, the simulated polarization-induced error increases markedly, particularly at higher wavenumbers. For the 210 K target, the nadir error increases from 0.27 K at 900 cm−1 to 0.53 K at 1500 cm−1 and reaches 1.45 K at 2300 cm−1 in MW2. Meanwhile, the measurement-based results in Figure 10 show that MW2 has the largest correction amplitudes under the 290 K test condition. These results indicate that both cold-scene observations and the MW2 band warrant particular attention in the evaluation and correction of HIRAS-II polarization effects.
The wavenumber- and FOV-dependent variations in the retrieved effective combined polarization parameter p r p t demonstrate the importance of instrument-specific characterization for HIRAS-II. Within the proposed framework, the sensitivity analysis using a wavenumber-independent nominal p r p t provides an initial assessment of how the modeled polarization-induced error responds to different observational conditions. The TVAC measurements then determine the measurement-derived variations in p r p t across wavenumbers and FOVs, allowing the distinct polarization characteristics of the three spectral bands to be incorporated into the correction. Together, these two steps establish a progression from general sensitivity assessment to measurement-based parameter characterization and polarization correction.

4.3. Correction Performance and the Scan-Angle-Independent Residual

The correction results show that the magnitude of the absolute radiometric deviation and the magnitude of its scan-angle-dependent component should be distinguished. Before correction, the overall absolute ΔBT offset is largest in the LW band, followed by MW1 and MW2. In contrast, the scan-angle-dependent modulation is strongest in MW2, which consequently requires the largest correction amplitude. This distinction explains why MW2 can have the smallest overall offset while exhibiting the most pronounced polarization-dependent angular variation.
After correction, the FOV-averaged standard deviation over the scan angle decreases from 0.023 to 0.007 K in LW, from 0.024 to 0.007 K in MW1, and from 0.045 to 0.014 K in MW2. Thus, the remaining angular standard deviations are approximately one third of their original values in all three bands. The corresponding peak-to-peak variations decrease from 0.087, 0.081, and 0.161 K to 0.049, 0.047, and 0.089 K, respectively. The maximum reductions in ΔBT reach 0.093 K in LW, 0.064 K in MW1, and 0.174 K in MW2. The larger improvement in MW2 is consistent with its stronger retrieved angular modulation.
The reduction in peak-to-peak variation is less pronounced than the reduction in standard deviation. This indicates that a small number of local residual excursions remain at particular scan angles even though the overall angular dispersion is substantially reduced. Such residual structure may result from measurement variability and from departures of the actual instrument response from an ideal single-period modulation. Nevertheless, the consistent flattening of the corrected curves across the nine FOVs demonstrates that the dominant periodic component is captured by the retrieved α and p r p t .
A nearly constant radiometric offset remains after correction, with FOV-averaged values of approximately −0.462 K in LW, −0.229 K in MW1, and 0.002 K in MW2. This behavior follows from the retrieval formulation: the scan-angle mean is removed before p r p t is fitted, and the correction therefore targets the periodic scan-angle-dependent component rather than the constant radiometric component. Possible sources of the residual offset include uncertainties in the temperature, emissivity, and radiance uniformity of the area-source blackbody and ICT; uncertainties in the temperature and emissivity of the cold shield; detector nonlinearity; and other gain or offset errors in the two-point radiometric calibration. Uncertainties in the target and reference radiances can propagate into the calibration gain and offset and produce band-dependent residual biases. These scan-angle-independent contributions are outside the scope of the present polarization correction and should be evaluated separately within a more comprehensive radiometric calibration model through improved characterization of the blackbody and reference sources and further calibration of the detector response.
Figure 14 provides a complementary full-spectrum assessment by referencing each non-nadir observation to the corresponding nadir result. This operation removes the constant offset and isolates the angular variation. The substantially narrower distributions after correction demonstrate that the improvement is not limited to the representative channels or band-averaged results shown in Figure 10, Figure 11, Figure 12 and Figure 13, but extends over most of the measured spectral ranges in all three bands. The agreement between the FOV-level angular curves and the nadir-referenced full-spectrum results provides further evidence that the correction reduces the dominant scan-angle-dependent polarization-induced radiometric modulation.
The polarization effect characterized here introduces a scan-angle-dependent systematic error into the calibrated Earth-view radiances. If uncorrected, this error may cause HIRAS-II Level-1 radiances to vary systematically with scan angle and may subsequently propagate into atmospheric profile retrievals and data assimilation in NWP systems. The observed reductions in angular standard deviation and peak-to-peak variation demonstrate that the correction reduces this instrument-related error, thereby improving the radiometric calibration accuracy of HIRAS-II and helping provide more reliable Level-1 radiance data for these quantitative remote sensing applications.

4.4. Comparison with Previous Studies

The scan-angle-dependent behavior observed for HIRAS-II is consistent with the general mechanism reported for other infrared sounders. For AIRS, coupling between scan-mirror polarization and the polarization sensitivity of the spectrometer was found to produce angular radiometric modulation and was characterized through prelaunch blackbody measurements [8,9,10]. For CrIS, the SSM and downstream optical system were modeled as partial linear polarizers in series, and polarization parameters were retrieved from special on-orbit observations [11,12]. HIRAS-II and CrIS both use gold as the reflecting surface of their scan mirrors, although HIRAS-II employs a gold-coated scan mirror whereas CrIS uses an unprotected gold scene select mirror. In both instruments, rotation of the scan mirror changes the orientation of the mirror-induced polarization relative to the fixed polarization-sensitive axis of the downstream optics, producing scan-angle-dependent radiometric modulation. Polarization correction has also been implemented for FY-3D/HIRAS using deep-space measurements and FOV consistency over uniform Earth scenes [13]. These studies support the interpretation that rotation of the scan mirror changes the relative orientation between its polarization response and that of the downstream optical system, thereby modulating the calibrated signal.
Because the instruments, scene temperatures, scan geometries, spectral aggregation methods, and reported metrics differ, these values provide only an order-of-magnitude comparison. Quantitatively, the maximum reduction in brightness-temperature deviation obtained for HIRAS-II is 0.174 K under the 290 K TVAC condition. This value is of the same order of magnitude as the shortwave band-averaged polarization correction of up to approximately 0.18 K reported for CrIS under cold on-orbit scenes near 230 K [12]. Prelaunch AIRS measurements showed channel-dependent corrections reaching approximately 0.5 K at a scan angle of about −50° relative to nadir for a 250 K target [8], whereas the model–measurement residuals were mostly below 0.1 K. For FY-3D/HIRAS, the brightness-temperature differences in selected MW channels near nadir decreased from approximately 0.8–1.0 K before polarization correction to approximately 0.1–0.2 K after correction [13]. The more pronounced scan-angle-dependent variation reported for HIRAS may be partly associated with the difference in scan-mirror coatings. HIRAS employs an aluminum scan mirror coated with a silicon compound [13], whereas HIRAS-II uses a gold-coated scan mirror. The weaker scan-angle-dependent variation observed for HIRAS-II may partly reflect the lower degree of polarization introduced by its gold-coated scan mirror compared with the scan mirror used in HIRAS, although differences in optical design and evaluation conditions may also contribute.
Although these instruments employ physically similar parameters to describe the combined polarization coupling and the phase or equivalent polarization-axis orientation, their characterization strategies differ. The AIRS polarization parameters were determined primarily from prelaunch component- and system-level measurements [8]. For CrIS, the parameters were retrieved from on-orbit deep-space observations acquired during pitch maneuvers [12]. For FY-3D/HIRAS, they were obtained from a combination of on-orbit deep-space scans and FOV-consistency measurements over uniform Earth scenes [13]. In contrast, the effective p r p t and α parameters of HIRAS-II were retrieved from controlled prelaunch TVAC measurements. During the HIRAS-II TVAC test, the same stable area-source blackbody was observed over a densely sampled scan-angle range while the warm and cold calibration references were also measured. This configuration reduces the influence of Earth-scene inhomogeneity and restricted on-orbit viewing geometry. It also enables the polarization angle to be retrieved separately for each of the nine FOVs and the effective combined polarization to be obtained channel by channel. The resulting parameters can serve as prelaunch priors and as an independent reference for subsequent on-orbit evaluation.

4.5. Limitations and Future Work

Several limitations should be considered. First, the prelaunch polarization test was performed at a single target temperature of 290 K. Within the polarization-induced radiometric error model expressed in Equation (9), the downstream-optics polarization-axis angle α and the combined polarization parameter p r p t are treated as instrument-specific polarization parameters that are independent of scene temperature, which enters the model through the radiance terms. Applying the parameters retrieved at 290 K to colder targets requires the assumption that they remain stable across different incident-radiance levels. If this assumption does not hold, the correction may result in undercorrection or overcorrection, with potentially larger absolute residuals for cold scenes because of their greater radiance contrast with the calibration references. The cold-target results in Figure 5 are model-based sensitivity estimates and do not verify this assumed parameter stability; thus, the associated cross-temperature transfer uncertainty cannot be quantified from the current measurements. Therefore, multi-temperature TVAC measurements and on-orbit observations over representative warm and cold scenes are needed to evaluate the stability and transferability of the retrieved parameters.
Second, the retrieved p r p t represents the effective coupling of the scan mirror and downstream optical system and does not distinguish their individual contributions. Independent component-level polarization measurements would be needed to separate pr and pt and to attribute the observed spectral structures to specific optical elements. In addition, the propagation of uncertainties in blackbody temperature, scan-angle positioning, radiometric noise, and phase fitting into the retrieved parameters should be quantified in future work.
Third, the present model assumes that the radiation incident on the scan mirror is unpolarized. Actual Earth-view infrared radiance may be partially polarized by surface emission and reflection or atmospheric scattering, particularly for water-viewing geometries [21,22]. Such scene polarization is a physical property of the incident radiation and is not itself the correction target of the present study. However, its coupling with the polarization sensitivity of HIRAS-II may produce an additional instrument-dependent contribution to the calibrated radiance. Quantifying this contribution requires both the Stokes parameters of the incident Earth-scene radiance and the corresponding Mueller response of HIRAS-II. The present TVAC measurements were obtained using unpolarized blackbody sources and therefore provide no information about the Stokes parameters of actual Earth scenes. Moreover, polarized-source measurements were not performed to determine the complete Mueller response of the instrument. Consequently, the influence of partially polarized Earth scenes cannot be quantified from the current measurements. Future work should combine polarized-source characterization with a Stokes–Mueller formulation [23], polarized radiative-transfer simulations, and on-orbit observations over representative Earth scenes.
Finally, the present results are based on prelaunch measurements of FY-3E/HIRAS-II. On-orbit observations are needed to evaluate the stability and transferability of the retrieved parameters under the actual space environment. Future work should combine these prelaunch parameters with deep-space observations, uniform Earth scenes, and cross-scan consistency analyses to validate and, if necessary, refine the operational polarization correction for HIRAS-II instruments onboard different Fengyun-3 satellites. The corrected on-orbit Level-1 radiances should then be evaluated in atmospheric profile retrieval and NWP data-assimilation experiments to quantify the benefit of reducing scan-angle-dependent polarization-induced radiometric errors for downstream quantitative remote sensing applications.

5. Conclusions

This study developed a physics-based framework for the prelaunch characterization and correction of scan-angle-dependent polarization effects in FY-3E/HIRAS-II. The principal conclusions are summarized as follows.
First, a polarization-induced radiometric error model was derived within the two-point calibration framework by treating the scan mirror and downstream optical system as two partial linear polarizers in series. The sensitivity simulations demonstrate that the modeled error depends jointly on scene temperature, scan angle, and wavenumber, with substantially stronger effects for colder scenes.
Second, a dedicated polarization test was conducted during the prelaunch TVAC calibration campaign, and a decoupled retrieval method was applied to determine the downstream-optics polarization-axis angle α and the effective combined polarization parameter p r p t . The mean retrieved values of α are 86.5°, 79.0°, and 71.8° for the LW, MW1, and MW2 bands, respectively. The retrieved parameters exhibit systematic band-, FOV-, and wavenumber-dependent characteristics, demonstrating the need for band-, FOV-, and channel-specific characterization of the HIRAS-II polarization response.
Finally, the proposed polarization correction substantially reduced the scan-angle-dependent brightness temperature deviations in all three bands. The maximum reductions in ΔBT reached 0.093, 0.064, and 0.174 K in the LW, MW1, and MW2 bands, respectively. The scan-angle standard deviations and peak-to-peak angular variations were also consistently reduced, while the nadir-referenced full-spectrum results confirmed improved angular stability over most of the measured spectral ranges. These results demonstrate that the retrieved parameters effectively characterize and correct the dominant scan-angle-dependent polarization modulation under the 290 K test condition, which is the only target temperature evaluated in the present TVAC measurements. The correction performance at other scene temperatures remains to be validated. The model, experimental approach, and retrieved prelaunch parameters establish a basis for subsequent on-orbit evaluation and operational correction of scan-angle-dependent polarization-induced radiometric errors. Reducing these errors improves the radiometric calibration accuracy of HIRAS-II and helps provide more reliable Level-1 radiance data for atmospheric profile retrievals and data assimilation in global NWP systems.

Author Contributions

Conceptualization, Z.Y. and C.S.; methodology, Z.Y. and C.S.; software, Z.Y. and C.S.; validation, Z.Y. and C.S.; formal analysis, Z.Y.; investigation, C.S.; resources, Z.Y., C.S. and M.G.; data curation, C.S. and Z.Y.; writing—original draft preparation, Z.Y. and C.S.; writing—review and editing, Z.Y. and C.S.; visualization, Z.Y., C.S. and K.L.; supervision, C.S. and M.G.; project administration, M.G.; funding acquisition, Z.Y. and C.S. All authors have read and agreed to the published version of the manuscript.

Funding

This research was funded by the National Key Research and Development Program of China, grant number 2023YFB3905303, and the Innovation Project of the Shanghai Institute of Technical Physics, Chinese Academy of Sciences, grant number CX-326.

Data Availability Statement

The data presented in this study are available on request from the corresponding author. The data are not publicly available due to instrument data-sharing restrictions.

Conflicts of Interest

The authors declare no conflicts of interest.

References

  1. Smith, N.; Barnet, C.D. CLIMCAPS Observing Capability for Temperature, Moisture, and Trace Gases from AIRS/AMSU and CrIS/ATMS. Atmos. Meas. Tech. 2020, 13, 4437–4459. [Google Scholar] [CrossRef] [Scilit]
  2. Aumann, H.H.; Chahine, M.T.; Gautier, C.; Goldberg, M.D.; Kalnay, E.; McMillin, L.M.; Revercomb, H.; Rosenkranz, P.W.; Smith, W.L.; Staelin, D.H.; et al. AIRS/AMSU/HSB on the Aqua Mission: Design, Science Objectives, Data Products, and Processing Systems. IEEE Trans. Geosci. Remote Sens. 2003, 41, 253–264. [Google Scholar] [CrossRef] [Scilit]
  3. Strow, L.L.; DeSouza-Machado, S. Establishment of AIRS Climate-Level Radiometric Stability Using Radiance Anomaly Retrievals of Minor Gases and Sea Surface Temperature. Atmos. Meas. Tech. 2020, 13, 4619–4644. [Google Scholar] [CrossRef] [Scilit]
  4. Smith, N.; Smith, W.L.; Weisz, E.; Revercomb, H.E. AIRS, IASI, and CrIS Retrieval Records at Climate Scales: An Investigation into the Propagation of Systematic Uncertainty. J. Appl. Meteorol. Climatol. 2015, 54, 1465–1481. [Google Scholar] [CrossRef] [Scilit]
  5. Taylor, J.K. Achieving 0.1 K Absolute Calibration Accuracy for High Spectral Resolution Infrared and Far Infrared Climate Benchmark Measurements. Doctoral Dissertation, Université Laval, Québec, QC, Canada, 2014. [Google Scholar]
  6. Sun, J.-Q.; Xiong, X. MODIS Polarization-Sensitivity Analysis. IEEE Trans. Geosci. Remote Sens. 2007, 45, 2875–2885. [Google Scholar] [CrossRef]
  7. Chiang, K.-F.; Xiong, X. Pre-Launch Characterization of Aqua MODIS Scan Mirror Response versus Scan Angle for Thermal Emissive Bands. In Proceedings of the Earth Observing Systems XII; SPIE: Bellingham, WA, USA, 2007; Volume 6677, p. 559. [Google Scholar]
  8. Pagano, T.S.; Aumann, H.H.; Overoye, K.; Gigioli, G.W., Jr. Scan-Angle-Dependent Radiometric Modulation Due to Polarization for the Atmospheric Infrared Sounder (AIRS). In Proceedings of the Earth Observing Systems V; SPIE: Bellingham, WA, USA, 2000; Volume 4135, p. 108. [Google Scholar]
  9. Gigioli, G.W., Jr.; Pagano, T.S. AIRS Instrument Polarization Response: Measurement Methodology. In Proceedings of the Infrared Spaceborne Remote Sensing VII; SPIE: Bellingham, WA, USA, 1999; Volume 3759, p. 279. [Google Scholar]
  10. Pagano, T.S.; Aumann, H.H.; Elliott, D.; Broberg, S.E. AIRS Infrared Polarization Sensitivity and In-Flight Observations. In Proceedings of the Earth Observing Systems IX; SPIE: Bellingham, WA, USA, 2004; Volume 5542, p. 45. [Google Scholar]
  11. Taylor, J.K.; Revercomb, H.E.; Tobin, D.C. An Analysis and Correction of Polarization Induced Calibration Errors for the Cross-Track Infrared Sounder (CrIS) Sensor. In Proceedings of the Light, Energy and the Environment 2018 (E2, FTS, HISE, SOLAR, SSL), Singapore, 5–8 November 2018; p. FW2B.3. [Google Scholar]
  12. Taylor, J.K.; Revercomb, H.E.; Tobin, D.C.; Knuteson, R.O.; Loveless, M.L.; Malloy, R.; Suwinski, L.; Iturbide-Sanchez, F.; Chen, Y.; White, G.; et al. Assessment and Correction of View Angle Dependent Radiometric Modulation Due to Polarization for the Cross-Track Infrared Sounder (CrIS). Remote Sens. 2023, 15, 718. [Google Scholar] [CrossRef] [Scilit]
  13. Wu, C.; Qi, C.; Hu, X.; Gu, M.; Yang, T.; Xu, H.; Lee, L.; Yang, Z.; Zhang, P. FY-3D HIRAS Radiometric Calibration and Accuracy Assessment. IEEE Trans. Geosci. Remote Sens. 2020, 58, 3965–3976. [Google Scholar] [CrossRef] [Scilit]
  14. Liang, X.; Zou, Y.; Han, C.; Huang, P.; Li, L.; Zhang, Y. Temperature-Field Driven Adaptive Radiometric Calibration for Scan Mirror Thermal Radiation Interference in FY-4B GIIRS. Remote Sens. 2025, 17, 3948. [Google Scholar] [CrossRef] [Scilit]
  15. Chen, H.; Guan, L. Assessing FY-3E HIRAS-II Radiance Accuracy Using AHI and MERSI-LL. Remote Sens. 2022, 14, 4309. [Google Scholar] [CrossRef] [Scilit]
  16. Zhang, P.; Hu, X.; Lu, Q.; Zhu, A.; Lin, M.; Sun, L.; Chen, L.; Xu, N. FY-3E: The First Operational Meteorological Satellite Mission in an Early Morning Orbit. Adv. Atmos. Sci. 2022, 39, 1–8. [Google Scholar] [CrossRef] [Scilit]
  17. Collett, E. Field Guide to Polarization; SPIE Field Guides; SPIE Press: Bellingham, WA, USA, 2005; ISBN 978-0-8194-5868-1. [Google Scholar]
  18. Goldstein, D.H. Polarized Light, 3rd ed.; CRC Press: Boca Raton, FL, USA, 2017. [Google Scholar]
  19. Revercomb, H.E.; Buijs, H.; Howell, H.B.; LaPorte, D.D.; Smith, W.L.; Sromovsky, L.A. Radiometric Calibration of IR Fourier Transform Spectrometers: Solution to a Problem with the High-Resolution Interferometer Sounder. Appl. Opt. 1988, 27, 3210–3218. [Google Scholar] [CrossRef] [Scilit]
  20. Lawson, C.L.; Hanson, R.J. Solving Least Squares Problems; Society for Industrial and Applied Mathematics: Philadelphia, PA, USA, 1995; ISBN 978-0-89871-356-5. [Google Scholar]
  21. Shaw, J.A. Degree of Linear Polarization in Spectral Radiances from Water-Viewing Infrared Radiometers. Appl. Opt. 1999, 38, 3157–3165. [Google Scholar] [CrossRef] [Scilit]
  22. Shaw, J.A. The Effect of Instrument Polarization Sensitivity on Sea Surface Remote Sensing with Infrared Spectroradiometers. J. Atmos. Ocean. Technol. 2002, 19, 820–827. [Google Scholar] [CrossRef] [Scilit]
  23. O’Neill, E.L. Introduction to Statistical Optics; Dover Books on Physics; Courier Corporation: North Chelmsford, MA, USA, 2003; ISBN 978-0-486-43578-7. [Google Scholar]
Figure 1. Schematic diagram of the optical path and major optical components of HIRAS-II.
Remotesensing 18 03025 g001
Figure 2. Cross-track scanning sequence and calibration views of HIRAS-II. The numbers 1–28 denote the sequential Earth-view sample positions, spanning scan angles from −48.6° to +48.6°; only samples 1–6 and 28 are labeled for clarity. The ICT and DS calibration views are located at +92° and −89°, respectively, while 0° denotes the nadir direction.
Remotesensing 18 03025 g002
Figure 3. Experimental layout of the prelaunch TVAC polarization test. The blue component is the area-source blackbody, which is connected to the swing arm and rotated synchronously with the scan mirror to ensure that the instrument observes the same stable target at different scan angles.
Remotesensing 18 03025 g003
Figure 4. Procedure of the prelaunch TVAC polarization test.
Remotesensing 18 03025 g004
Figure 5. Simulated polarization-induced radiometric error Ep as a function of scene scan angle for blackbody target scene temperatures from 210 to 310 K in 20 K increments: (a) 900 cm−1, (b) 1500 cm−1, and (c) 2300 cm−1. The effective combined polarization parameter p r p t and the downstream-optics polarization-axis angle α are set to 0.001 and 90°, respectively. The vertical dashed lines indicate the nominal HIRAS-II Earth-view scan-angle range of [−48.6°, 48.6°]. Other simulation settings are the same as those listed in Table 2.
Remotesensing 18 03025 g005
Figure 6. Simulated polarization-induced radiometric error Ep as a function of scene scan angle at six representative wavenumbers for a 290 K blackbody target: 700, 900, 1300, 1500, 2100, and 2300 cm−1. The effective combined polarization parameter p r p t and the downstream-optics polarization-axis angle α are set to 0.001 and 90°, respectively. The vertical dashed lines indicate the nominal HIRAS-II Earth-view scan-angle range of [−48.6°, 48.6°]. Other simulation settings are the same as those listed in Table 2.
Remotesensing 18 03025 g006
Figure 7. Retrieved combined polarization parameter p r p t and downstream-optics polarization-axis angle α for the nine FOVs in the LW band. The light-green traces represent the retrieved p r p t values, while the dark-green curves represent the corresponding smoothing-spline fits shown only to highlight their spectral trends. The retrieved value of α for each FOV is indicated in the corresponding panel title.
Remotesensing 18 03025 g007
Figure 8. Retrieved combined polarization parameter p r p t and downstream-optics polarization-axis angle α for the nine FOVs in the MW1 band. The light-green traces represent the retrieved p r p t values, while the dark-green curves represent the corresponding smoothing-spline fits shown only to highlight their spectral trends. The retrieved value of α for each FOV is indicated in the corresponding panel title.
Remotesensing 18 03025 g008
Figure 9. Retrieved combined polarization parameter p r p t and downstream-optics polarization-axis angle α for the nine FOVs in the MW2 band. The light-green traces represent the retrieved p r p t values, while the dark-green curves represent the corresponding smoothing-spline fits shown only to highlight their spectral trends. The retrieved value of α for each FOV is indicated in the corresponding panel title.
Remotesensing 18 03025 g009
Figure 10. FOV-averaged scan-angle-dependent polarization correction term E ^ p , e q in brightness temperature units under the 290 K TVAC target condition at six representative wavenumbers across the LW, MW1, and MW2 bands. For each nominal wavenumber, the nearest available instrument channel is used, and its exact wavenumber is shown in the legend. The vertical dashed lines mark the scan-angle range used in the prelaunch TVAC polarization test, and the horizontal dotted line denotes zero. The circular markers indicate the minimum value of each curve.
Remotesensing 18 03025 g010
Figure 11. Comparison of brightness temperature deviation versus scan angle before and after LW-band polarization correction. For clarity, markers are displayed at every fifth scan-angle sample, while the lines include all samples.
Remotesensing 18 03025 g011
Figure 12. Comparison of brightness temperature deviation versus scan angle before and after MW1-band polarization correction. For clarity, markers are displayed at every fifth scan-angle sample, while the lines include all samples.
Remotesensing 18 03025 g012
Figure 13. Comparison of brightness temperature deviation versus scan angle before and after MW2-band polarization correction. For clarity, markers are displayed at every fifth scan-angle sample, while the lines include all samples.
Remotesensing 18 03025 g013
Figure 14. Brightness temperature deviation relative to the nadir view before and after polarization correction as a function of wavenumber. For each scan angle and spectral channel, the deviation relative to nadir is calculated separately for each FOV as ΔBT(δ,ν) − ΔBT(0°,ν) and then averaged over the nine FOVs. Each point represents the FOV-averaged result at one non-nadir scan angle and one spectral channel. The three separated spectral intervals correspond to the LW, MW1, and MW2 bands, and the horizontal dashed line denotes zero.
Remotesensing 18 03025 g014
Figure 15. Mean FOV-averaged brightness-temperature deviations relative to nadir before and after polarization correction for the (a) LW, (b) MW1, and (c) MW2 bands under the 290 K TVAC condition. The shaded regions represent ±1 standard deviation across the non-nadir scan angles.
Remotesensing 18 03025 g015
Table 1. Spectral and radiometric calibration performance requirements of HIRAS-II.
BandSpectral Range (cm−1)Spectral Range (µm)Resolution (cm−1)Spectral Accuracy (ppm)Radiometric Accuracy (K)
LW650–113615.38–8.80.62570.4–1.0
MW11210–17508.26–5.711.2570.4–0.5
MW22155–25504.64–3.922.570.5–0.6
Note: LW, MW1, and MW2 denote the long-wave, mid-wave 1, and mid-wave 2 bands, respectively. The spectral ranges and resolutions listed here refer to the performance-requirement bands rather than the continuous calibrated on-orbit spectral grid.
Table 2. Parameters used in the sensitivity simulation of polarization-induced radiometric error.
ParameterValueRemarks
Target scene temperature[210 K, 310 K]Blackbody scene radiance RS; evaluated in increments of 20 K.
Scene scan angle δS[−90°, 90°]Simulation sweep; nominal HIRAS-II Earth-view range is [−48.6°, 48.6°]
ICT scan angle δICT92°Warm calibration reference
DS scan angle δDS−89°Cold calibration reference
Downstream-optics polarization-axis angle α90°Assumed value for the sensitivity simulation; α is retrieved from the measured scan-angle modulation in Section 3.2.
Scan-mirror temperature283 KUsed to calculate BSM
ICT temperature290 KWarm-reference temperature
DS temperature15 KCold-reference temperature
Effective combined polarization p r p t 0.001Wavenumber-independent nominal value representing weak polarization coupling; used to set the reference magnitude of the sensitivity simulation.
Disclaimer/Publisher’s Note: The statements, opinions and data contained in all publications are solely those of the individual author(s) and contributor(s) and not of MDPI and/or the editor(s). MDPI and/or the editor(s) disclaim responsibility for any injury to people or property resulting from any ideas, methods, instructions or products referred to in the content.