Article

UAV Visual Localization Method Based on Token-Level Local Matching Reranking and Neighborhood-Consistent Position Fusion


College of Electronic and Information Engineering, Changchun University of Science and Technology, Changchun 130022, China
*
Author to whom correspondence should be addressed.
Remote Sens. 2026, 18(17), 3016; https://doi.org/10.3390/rs18173016
Submission received: 15 May 2026 / Revised: 26 August 2026 / Accepted: 31 August 2026 / Published: 4 September 2026
(This article belongs to the Section Remote Sensing Image Processing)

Highlights

What are the main findings?
  • A token-level local matching reranking module improves the ranking reliability of top-K candidates by modeling token-level local matching evidence, geometric priors, and candidate set relationships.
  • A neighborhood-consistent position fusion module reduces meter-level localization error under same-area settings by adaptively fusing multiple candidate tile centers and learning residual offsets in a local coordinate system.
What are the implications of the main findings?
  • The proposed global-to-local framework bridges the gap between discrete satellite tile retrieval and continuous geographic position estimation for UAV visual localization.
  • Experiments on GTA-UAV and UAV-VisLoc datasets validate the method’s effectiveness. Over five independent runs under the GTA-UAV same-area setting, the proposed method achieves an average Recall@1 (R@1) gain of 2.89 percentage points and an average Dis@1 reduction of 60.95 m relative to Global Retrieval. In a single evaluation run under the UAV-VisLoc same-area setting, the proposed method achieves an R@1 gain of 3.03 percentage points and a Dis@1 reduction of 39.53 m relative to Global Retrieval.

Abstract

UAV visual localization aims to utilize real-time ground observation imagery captured by drone platforms to retrieve the most relevant images from a large-scale satellite remote sensing image database and thereby estimate their corresponding geographic coordinates. It is a critical task in autonomous navigation of unmanned systems, emergency reconnaissance, and low-altitude remote sensing applications. Existing UAV visual localization methods typically rely on global feature similarity to rank candidate satellite tiles and directly adopt the center of the Top-1 tile as the localization result, leading to unstable rankings and coordinate estimation errors in continuous area localization tasks. To address these issues, this paper proposes a token-level local matching reranking method and a neighborhood-consistent position fusion method for UAV visual localization. First, a global search efficiently retrieves a Top-K candidate set from a large-scale reference database. Second, a token-level local matching reranking module is introduced, which utilizes local token interactions, neighborhood geometric priors, and candidate relationship modeling to perform fine-grained reranking and score calibration of high-confidence candidates, thereby enhancing the reliability of the top candidates’ rankings. Finally, a neighborhood-consistent position fusion strategy is proposed, which adaptively fuses and predicts position coordinates by jointly utilizing the spatial distribution and confidence relationships of multiple candidate satellite tiles to mitigate the discretization errors caused by center-based localization using a single tile. Experimental results on the GTA-UAV and UAV-VisLoc datasets demonstrate that the proposed method effectively improves candidate ranking quality and reduces meter-level localization errors under same-area settings. Compared with the Global Retrieval baseline, over five independent runs under the GTA-UAV same-area setting, the proposed method achieves an average Recall@1 (R@1) gain of 2.89 percentage points and reduces the average Dis@1 localization error by 60.95 m. In a single-seed evaluation under the UAV-VisLoc same-area setting, it also improves R@1 by 3.03 percentage points and reduces Dis@1 localization error by 39.53 m.

1. Introduction

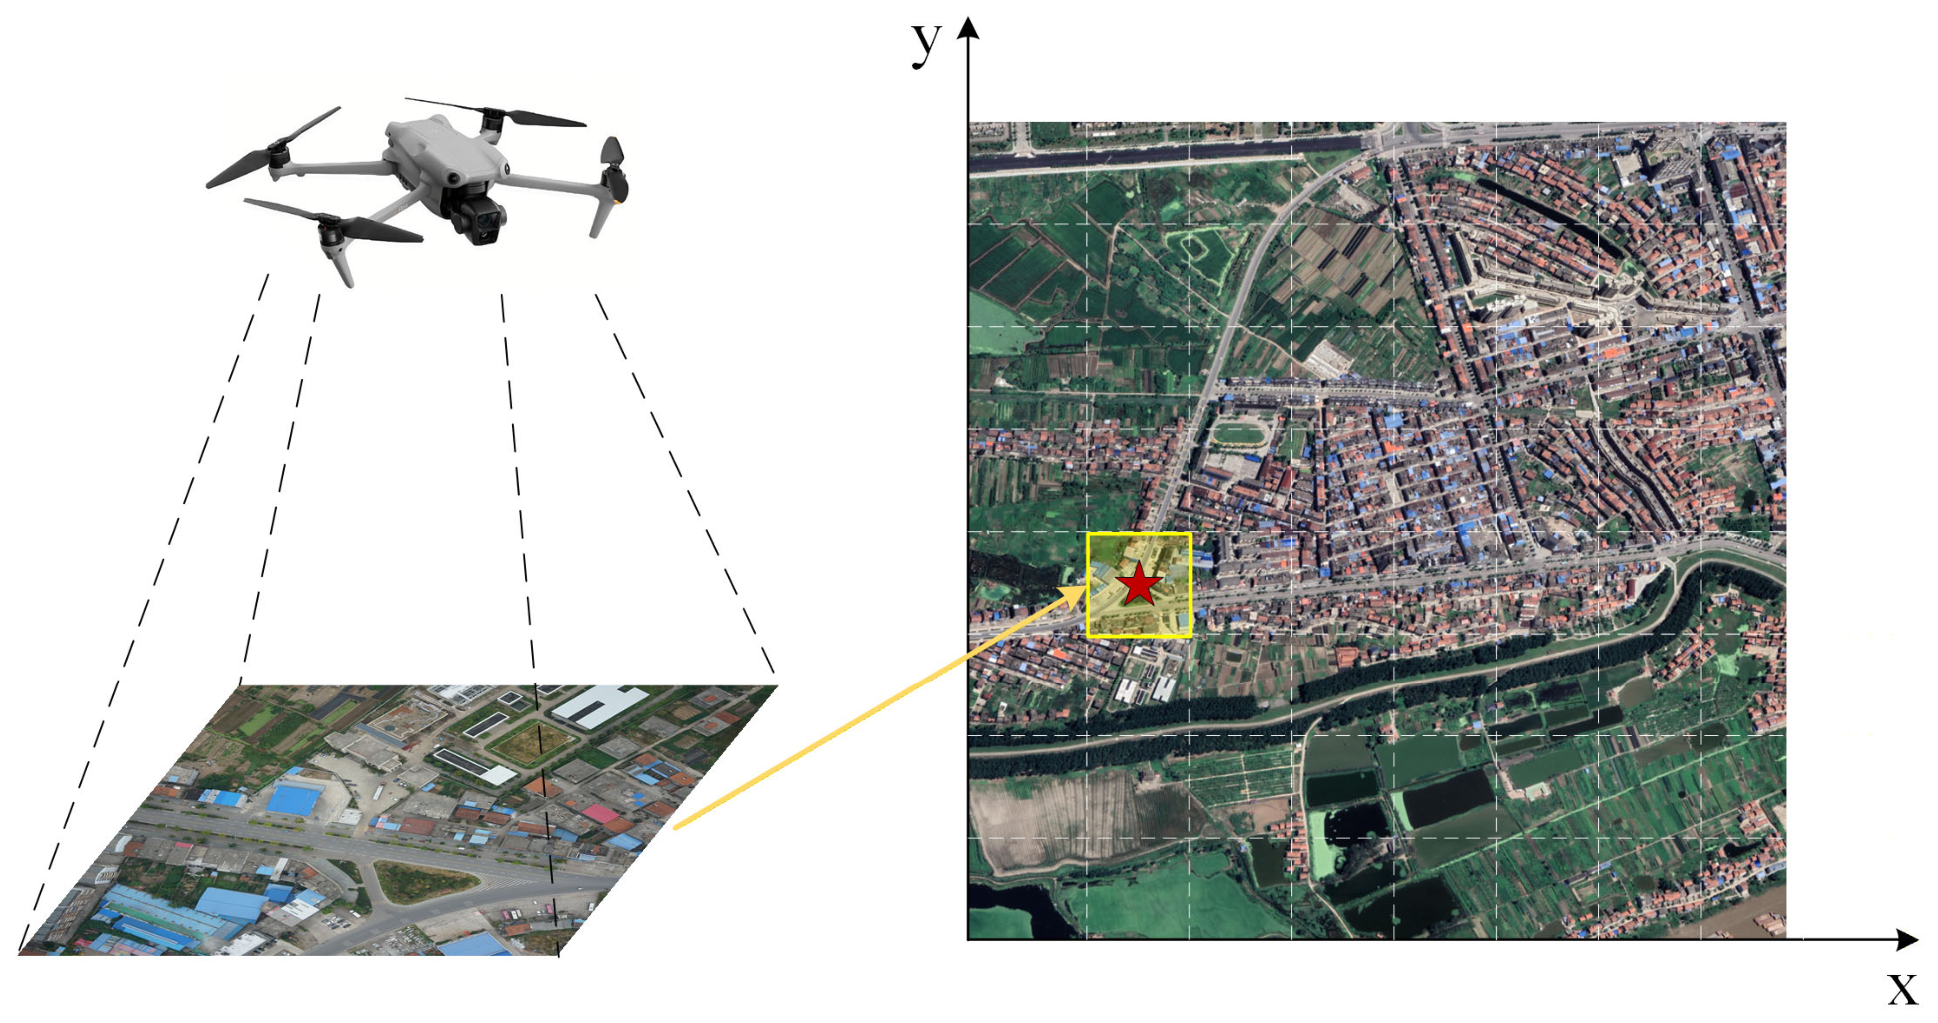
UAV visual localization plays an important role in complex urban environments, mountainous areas with line-of-sight obstructions, communication-limited scenarios, and conditions where satellite navigation signals are disrupted. It restores the UAV’s absolute position by leveraging the cross-view correspondence between onboard images and georeferenced reference imagery. This serves as a critical supplementary method for achieving autonomous positioning in Global Navigation Satellite System (GNSS)-denied environments. Existing research typically models this task as a retrieval-based cross-view geolocation problem, as shown in Figure 1, where the UAV image serves as a query to retrieve the most relevant candidate regions from a large-scale satellite reference database, and the current position is inferred based on the candidate results. Workman et al. [1] introduced deep learning into cross-view geolocation. Tian et al. [2] further improved positioning performance through cross-view region matching. Hu et al. [3] proposed CVM-Net, which advanced the development of retrieval-based cross-view positioning frameworks using global descriptors, gradually establishing this paradigm as the mainstream technical approach in this field.
Although significant progress has been made in the query-based paradigm, applying it directly to real-world UAV localization still faces two key challenges. First, after global retrieval returns the top K high-confidence candidates, what ultimately determines the final result is often not whether the candidates are relevant, but which one is closer to the optimal match. Particularly when local overlaps, multi-scale tile adjacencies, repetitive road and building textures, and target offsets coexist, relying solely on global similarity makes it difficult to reliably distinguish the optimal candidate from nearby interfering candidates. Second, the most similar result at the image level does not necessarily correspond to the optimal estimate at the location level. In continuous area satellite retrieval, multiple high-resolution candidates often originate from adjacent tiles or different scale levels; while they are highly similar in visual semantics, their corresponding geographic centers may not align. If the center of the top-ranked candidate is directly adopted as the final location, image-level errors will be directly converted into coordinate errors. Therefore, practical UAV visual localization cannot merely stop at identifying relevant regions; it must further utilize the spatial relationships among candidates to achieve greater accuracy.
Based on current research progress, improvements in coarse-grained localization primarily rely on more robust global cross-view representation learning, while improvements in high-precision localization increasingly depend on post-retrieval refinement modeling. TransGeo, proposed by Zhu et al. [4], utilizes a pure Transformer architecture to model cross-view global correlations, while Sample4Geo, proposed by Deuser et al. [5], enhances the stability and generalization capabilities of large-scale retrieval training through symmetric contrastive learning and hard negative sampling. On the other hand, R2Former, proposed by Zhu et al. [6] for location recognition, demonstrates that a reranking module can significantly improve the final ranking quality of high-confidence candidates. These works collectively indicate that high-value information worthy of further modeling still exists after global retrieval; however, existing methods still pay relatively insufficient attention to the post-retrieval stage, particularly lacking specialized modeling for local matching ambiguities and candidate set ambiguities in continuous UAV-based area retrieval scenarios.
In existing research, although attention has begun to focus on post-retrieval localization refinement, efforts have primarily centered on resolving view-angle discrepancies or enhancing geometric constraints. Toker et al. [7] mitigated cross-view appearance differences through satellite-to-street-view image synthesis, while Shi et al. [8] further estimated relative rotation and translation based on matching results to improve fine-grained localization capabilities. These studies demonstrate that image-level retrieval and ranking alone are insufficient to fully support high-precision localization systems. They tend to focus more on cross-view transformations or geometric inference between individual image pairs, rather than directly exploiting local matching evidence and spatial consistency within a set of high-confidence candidates. For UAV visual localization based on tile-level retrieval, this is precisely the critical link between candidate retrieval and continuous position estimation.
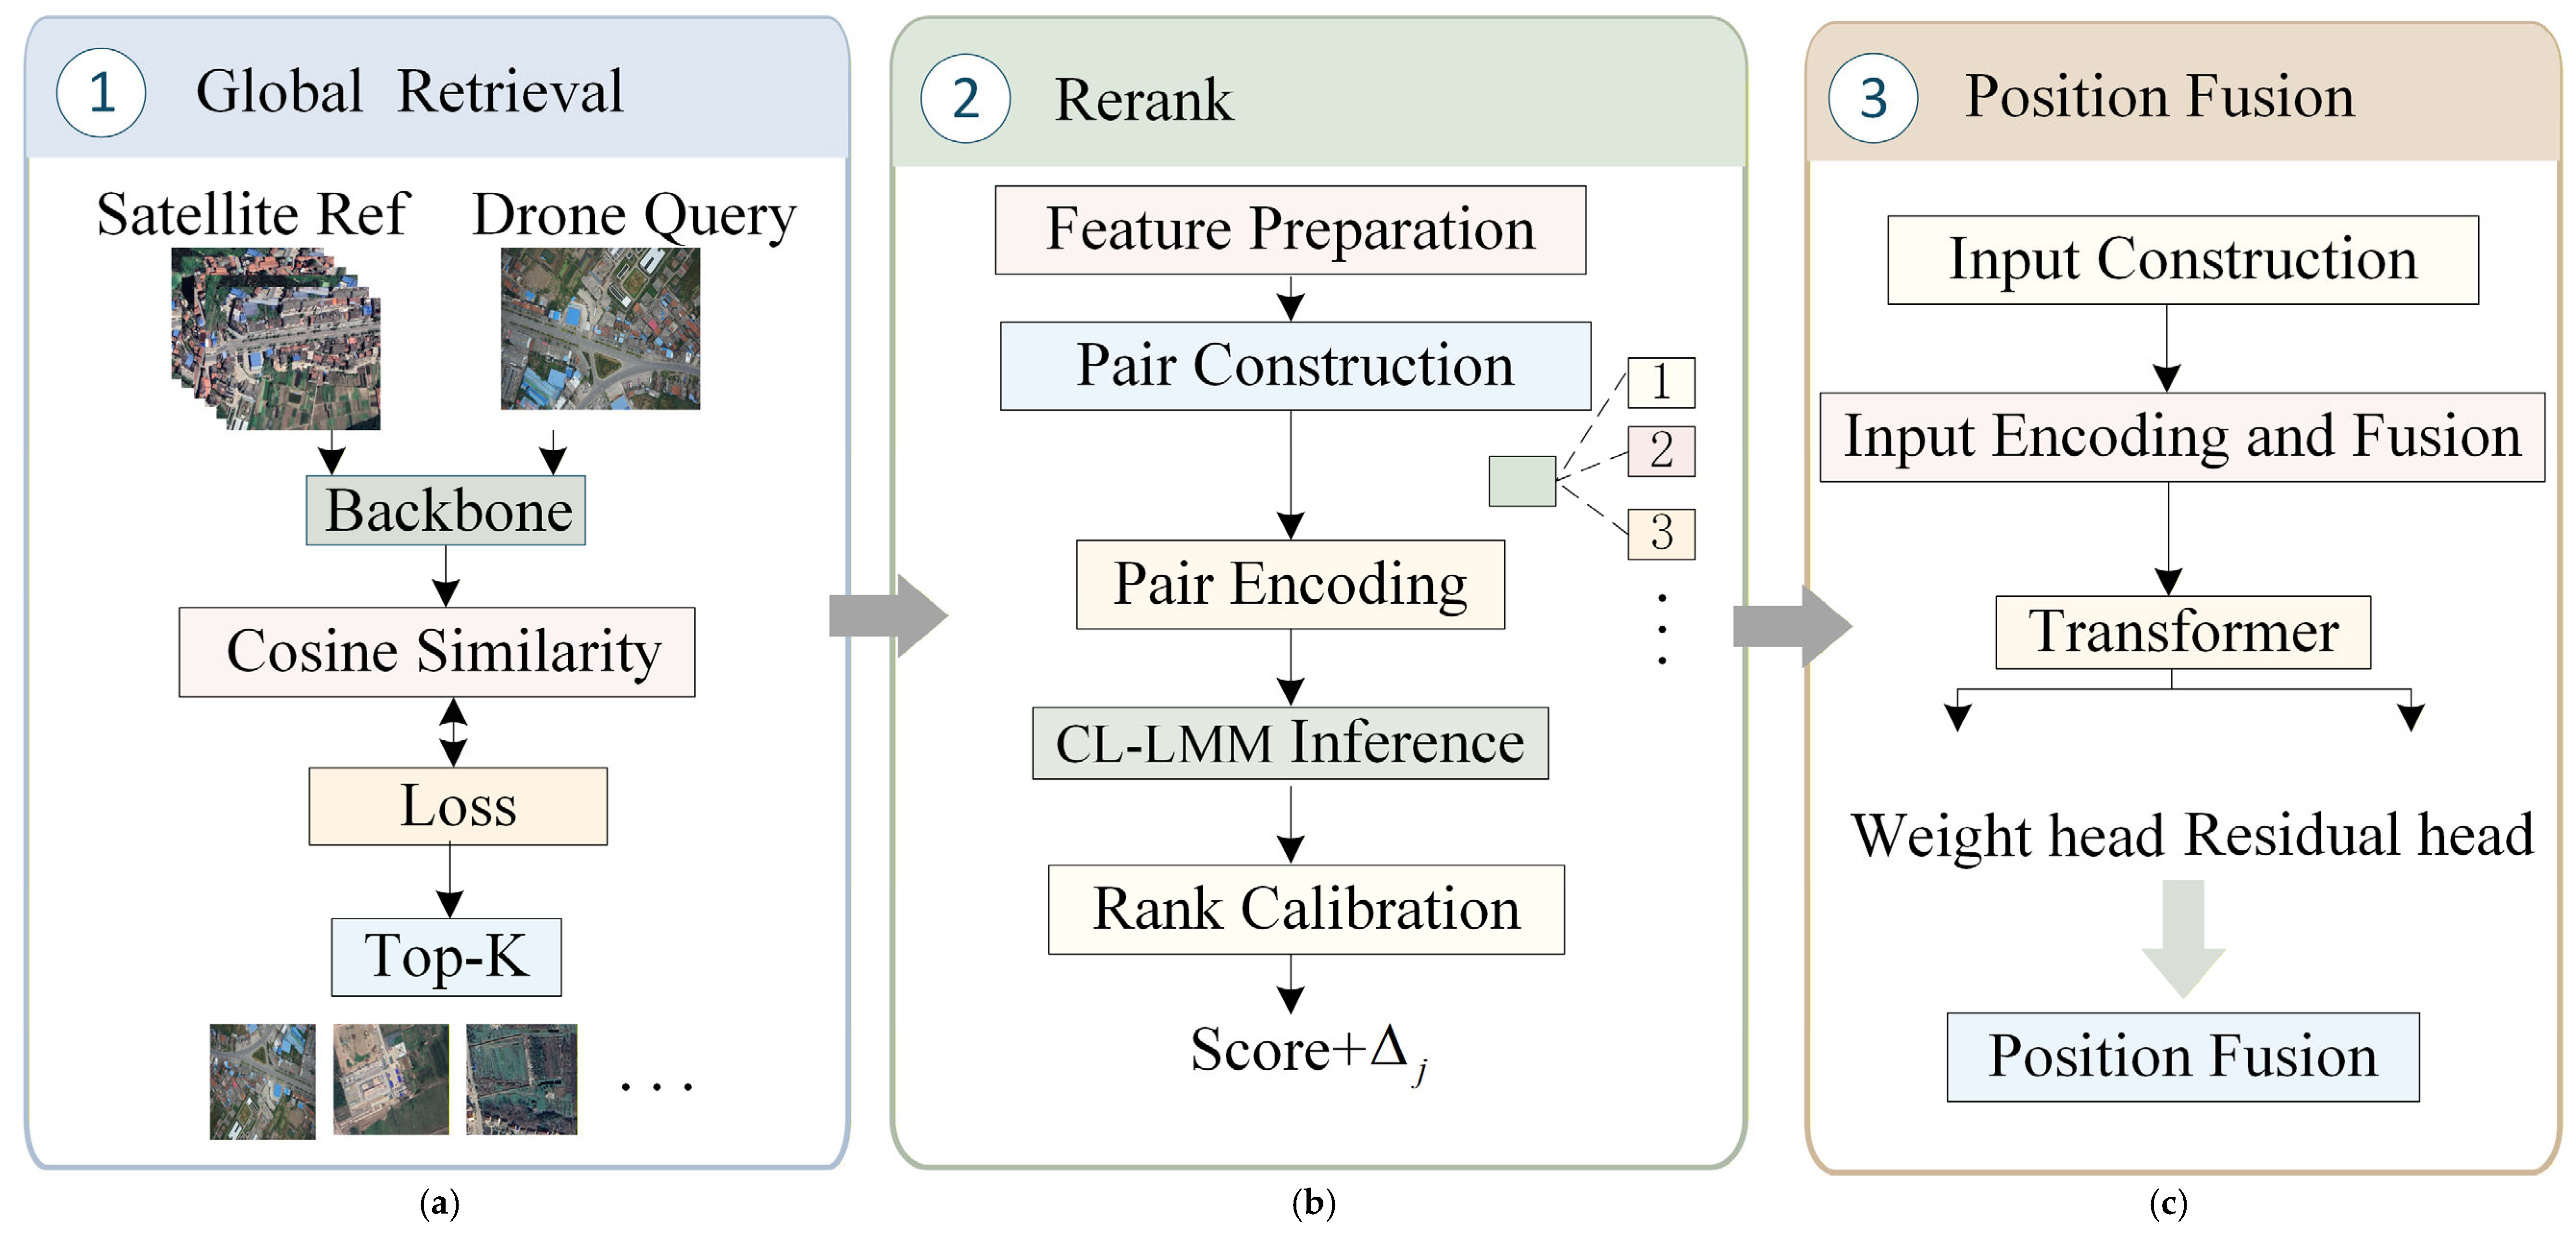
To address the aforementioned issues, this paper proposes a global-to-local framework for cross-view UAV localization. The framework consists of three components: global retrieval, token-level local matching reranking, and neighborhood-consistent position fusion. First, a standard global retrieval backbone is employed to efficiently retrieve candidates from a large-scale satellite reference database, ensuring the scalability and inference efficiency of the overall system. Second, a token-level local matching reranking module is introduced to improve the reliability of top candidate rankings by modeling fine-grained local matching evidence between the query image and candidate satellite images. Finally, a neighborhood-consistent position fusion module is designed to jointly estimate the refined candidate positions. By leveraging spatial consistency within the candidate set to perform coordinate correction, this module achieves a natural transition from discrete image retrieval results to continuous geographic position estimation. Through this hierarchical design, this paper unifies candidate refinement and position estimation within a single framework, while optimizing both retrieval accuracy and localization accuracy.

2. Related Work

2.1. Datasets, Task Settings, and Evaluation Protocols

The task definition and benchmark datasets for UAV visual localization have evolved from object-level cross-view matching to continuous-region localization, from strict one-to-one matching to partial-overlap matching, and from image-level recall evaluation to meter-level localization assessment, gradually approaching the requirements of real-world applications.
University-1652, proposed by Zheng et al. [9], was the first benchmark to systematically incorporate the UAV perspective into cross-view geo-localization, establishing a standardized evaluation paradigm for UAV-to-satellite image retrieval. Dai et al. [10] advanced the task with DenseUAV, which targets low-altitude UAV self-localization in continuous urban areas and proposes the Spatial Distance Metric (SDM) metric to jointly evaluate retrieval performance and localization accuracy. Zhu et al. [11] constructed the SUES-200 dataset to emphasize cross-view matching under multi-altitude flight conditions, making altitude adaptability a core evaluation dimension. Zhu et al. [12] further revised the strict one-to-one matching assumption in VIGOR, demonstrating that the query position can be off-center and non-unique in reference images, which better conforms to practical localization logic. Following this paradigm, Ji et al. [13] proposed the Game4Loc benchmark and built the GTA-UAV dataset. By introducing continuous-area coverage, multi-scale satellite tiles, partial matching relationships, and meter-level localization evaluation, this dataset shifted the research focus from image-level matching to position estimation in continuous regions. Xu et al. [14] proposed UAV-VisLoc, which provides real-world UAV flight data across multiple regions and serves as a benchmark for verifying algorithm transferability and generalization in real scenarios.
Beyond dedicated UAV benchmarks, practical remote-sensing-oriented studies have also examined UAV–satellite and street/aerial-view localization under more realistic imaging conditions. Ding et al. [15] and Zhuang et al. [16] investigated cross-view matching between drone and satellite imagery, highlighting the effects of viewpoint, scale, target shift, and appearance discrepancies in practical geo-localization tasks. Xia et al. [17] further investigated cross-view geo-localization with panoramic street-view and very-high-resolution satellite imagery under decentrality settings, emphasizing that conventional center-aligned assumptions are often violated in real-world reference databases and that query-reference offsets can affect localization efficiency and accuracy. These studies indicate that cross-view localization is moving from controlled image retrieval toward more practical remote-sensing and positioning scenarios.
Overall, the core challenge of current UAV visual localization lies in achieving stable candidate ranking and accurate position estimation under conditions of continuous regions, partial overlap, and meter-level evaluation.

2.2. Global Retrieval Methods for Cross-View Geo-Localization

Global retrieval serves as the foundational module of most cross-view UAV localization systems. Its core objective is to learn discriminative and cross-domain robust global image descriptors to efficiently recall a set of relevant satellite tile candidates from a large-scale reference database.
Early studies predominantly adopted convolutional neural network backbones and learned cross-view feature representations through contrastive learning. With the development of vision transformers, transformer-based architectures have been widely explored to further improve representation capability. Zhu et al. [4] proposed TransGeo, which uses a pure Transformer architecture to model cross-view global correlations. Deuser et al. [5] proposed Sample4Geo, which enhances the stability and generalization of large-scale retrieval training through symmetric contrastive learning and hard negative sampling. A series of studies have optimized global feature representation from different perspectives: Yang et al. [18] introduced an inter-layer Transformer in L2LTR to model correlations between multi-level features; Liu et al. [19] demonstrated that explicit directional prior modeling can effectively mitigate geometric inconsistency between cross-view images; Lin et al. [20] combined representation learning with keypoint detection to improve fine-grained discriminability; Chen et al. [21] proposed SDPL to optimize block-level representation for object displacement and off-center distribution in UAV views; and Zhu et al. [22] designed a simple and task-specific backbone to improve cross-view retrieval efficiency.
Recent studies have further explored semantic/attribute modeling and multi-source geographic information for global retrieval. Yan et al. [23] proposed IML-Net for cross-view geo-localization with multi-domain remote sensing data. Wu et al. [24] proposed CAMP, which improves cross-view retrieval through contrastive attribute mining and position-aware partitioning. Zhao et al. [25] introduced transformer-based feature aggregation and gradient guidance for UAV–satellite geo-localization. In addition to visual feature learning, structured geographic information has also been incorporated into cross-view localization. Hu et al. [26] combined OpenStreetMap with satellite imagery to enhance cross-view geo-localization. Wang et al. [27] proposed VecMapLocNet, which uses vector maps for vision-based UAV localization in GNSS-denied environments. These works suggest that semantic attributes and structured geographic information can complement visual appearance representations in cross-view localization.
Existing studies have continuously optimized global retrieval performance from the dimensions of feature encoding, prior introduction, and multi-source fusion, laying a solid foundation for cross-view localization. However, in continuous-area UAV localization tasks, even if global retrieval can recall a candidate set containing the true position, unstable candidate ranking and coordinate bias from discrete tile centers remain key bottlenecks restricting final localization accuracy. This paper focuses on this common problem in the post-retrieval stage. The proposed modules are built on the Top-K candidate output of global retrieval and can be flexibly integrated with various advanced global retrieval backbones.

2.3. Candidate Reranking Methods

After global retrieval obtains the initial candidate list, reranking can further improve the ranking quality of high-confidence candidates by mining finer-grained matching evidence and structural constraints, and has become an important component in many retrieval systems.
Early reranking methods usually exploit neighborhood relationships in the feature space, among which k-reciprocal encoding is a representative unsupervised reranking strategy [28]. It refines initial rankings through mutual-neighbor consistency and has been widely adopted in retrieval-related tasks. However, in continuous-area cross-view localization scenarios, spatially adjacent and visually similar satellite tiles can easily form pseudo-mutual-neighbor relationships in the feature space, which may instead lead to a decline in the ranking of correct candidates. With the development of local feature modeling, more fine-grained reranking methods have been proposed. In general visual place recognition, R2Former [6] verified that a reranking module can improve the final ranking quality of high-confidence candidates by modeling local correlations; PlaceFormer [29] performs geometric verification and reranking through multi-scale patch selection and fusion.
In cross-view localization, researchers have also explored various reranking and refinement strategies. CurriculumLoc [30] adopts a multi-stage refinement strategy that combines semantic scene recognition with geometric structure verification. GeoVLM [31] uses vision-language models to generate interpretable cross-view descriptions for trainable reranking. VICI [32] uses a vision-language-model-instructed strategy to improve cross-view image localization after the initial retrieval stage. LOCORE [33] introduces long-context sequence modeling into image reranking by jointly modeling local descriptor similarities between the query image and the gallery shortlist. These studies demonstrate that post-retrieval reranking can improve the ranking quality of candidate results by exploiting local matching evidence, semantic reasoning, or list-level context.
However, existing reranking methods mostly model the matching quality of each candidate pair independently, and rarely jointly model inherent tile structures such as adjacency relationships and multi-scale hierarchical relationships at the candidate set level. For continuous-area UAV localization, these structural relationships are important clues for distinguishing optimal candidates from adjacent interfering tiles.

2.4. Coordinate Refinement and Position Fusion

As evaluation metrics shift from image-level recall to meter-level distance error, coordinate refinement has become a critical step for high-precision localization. The goal of this stage is to go beyond the discrete tile center and obtain a more accurate continuous geographic coordinate estimate.
SliceMatch [34] achieves cross-view pose estimation through geometry-guided aggregation, verifying that introducing geometric structure after global retrieval can effectively reduce localization errors. HC-Net [35] achieves fine-grained cross-view image alignment via a correlation-aware homography estimator. Zhang et al. [36] extended the task to image sequence localization, using sequential observations to provide additional constraints for more stable position estimation. In the UAV context, Li et al. [37] proposed the GLVL method, which explicitly divides localization into coarse retrieval and local fine-grained matching to balance accuracy and efficiency.
Recent UAV-oriented studies have also explored post-retrieval geometric or pose refinement. Ye et al. [38] proposed a coarse-to-fine visual geo-localization method for GNSS-denied UAVs with oblique-view imagery. Shetty and Gao [39] estimated the global pose of a UAV with the aid of georeferenced satellite imagery and further integrated the cross-view geolocalization output with visual odometry. These studies confirm the importance of geometric or pose-level refinement after coarse localization. Nevertheless, most existing methods still focus on pairwise registration, relative pose estimation, or local fine-grained matching for individual candidates, whereas adaptive coordinate fusion using the spatial distribution and confidence relationships of the entire high-confidence candidate set remains insufficiently studied.
To address the above limitations, this paper proposes a token-level local matching reranking module, which resolves ranking ambiguity among high-confidence candidates by modeling token-level matching evidence, strict-positive tendency, and multi-scale candidate structural priors. Meanwhile, a neighborhood-consistent position fusion module is proposed, which performs coordinate fusion and residual correction at the candidate set level using spatial consistency to alleviate the localization bias caused by discrete satellite tile centers.

3. Methodology

The UAV visual localization method proposed in this paper follows a global-to-local processing approach and consists of three stages: global retrieval, token-level local matching reranking, and neighborhood-consistent position fusion, as illustrated in Figure 2. First, the global retrieval module performs efficient candidate retrieval from a large-scale continuous-area satellite reference database, providing a compact and reliable set of candidates for subsequent localization. Subsequently, the token-level local matching reranking module addresses the fine-grained ambiguities that still exist within high-confidence candidates. By leveraging the local correspondences and matching evidence between the query image and candidate satellite images, it performs fine-tuned corrections to the candidate rankings, thereby enhancing the reliability of the top-ranked results. Finally, the neighborhood-consistent position fusion module utilizes the spatial consistency and neighborhood support relationships among the refined candidates to perform learnable fusion and continuous refinement of candidate positions, yielding a more stable final geographic location estimate. Through these three stages of progressive refinement, our method unifies large-scale candidate retrieval, high-confidence candidate refinement, and final meter-level position estimation under same-area settings within a single framework, thereby simultaneously balancing retrieval efficiency, ranking accuracy, and localization accuracy.

3.1. Global Retrieval

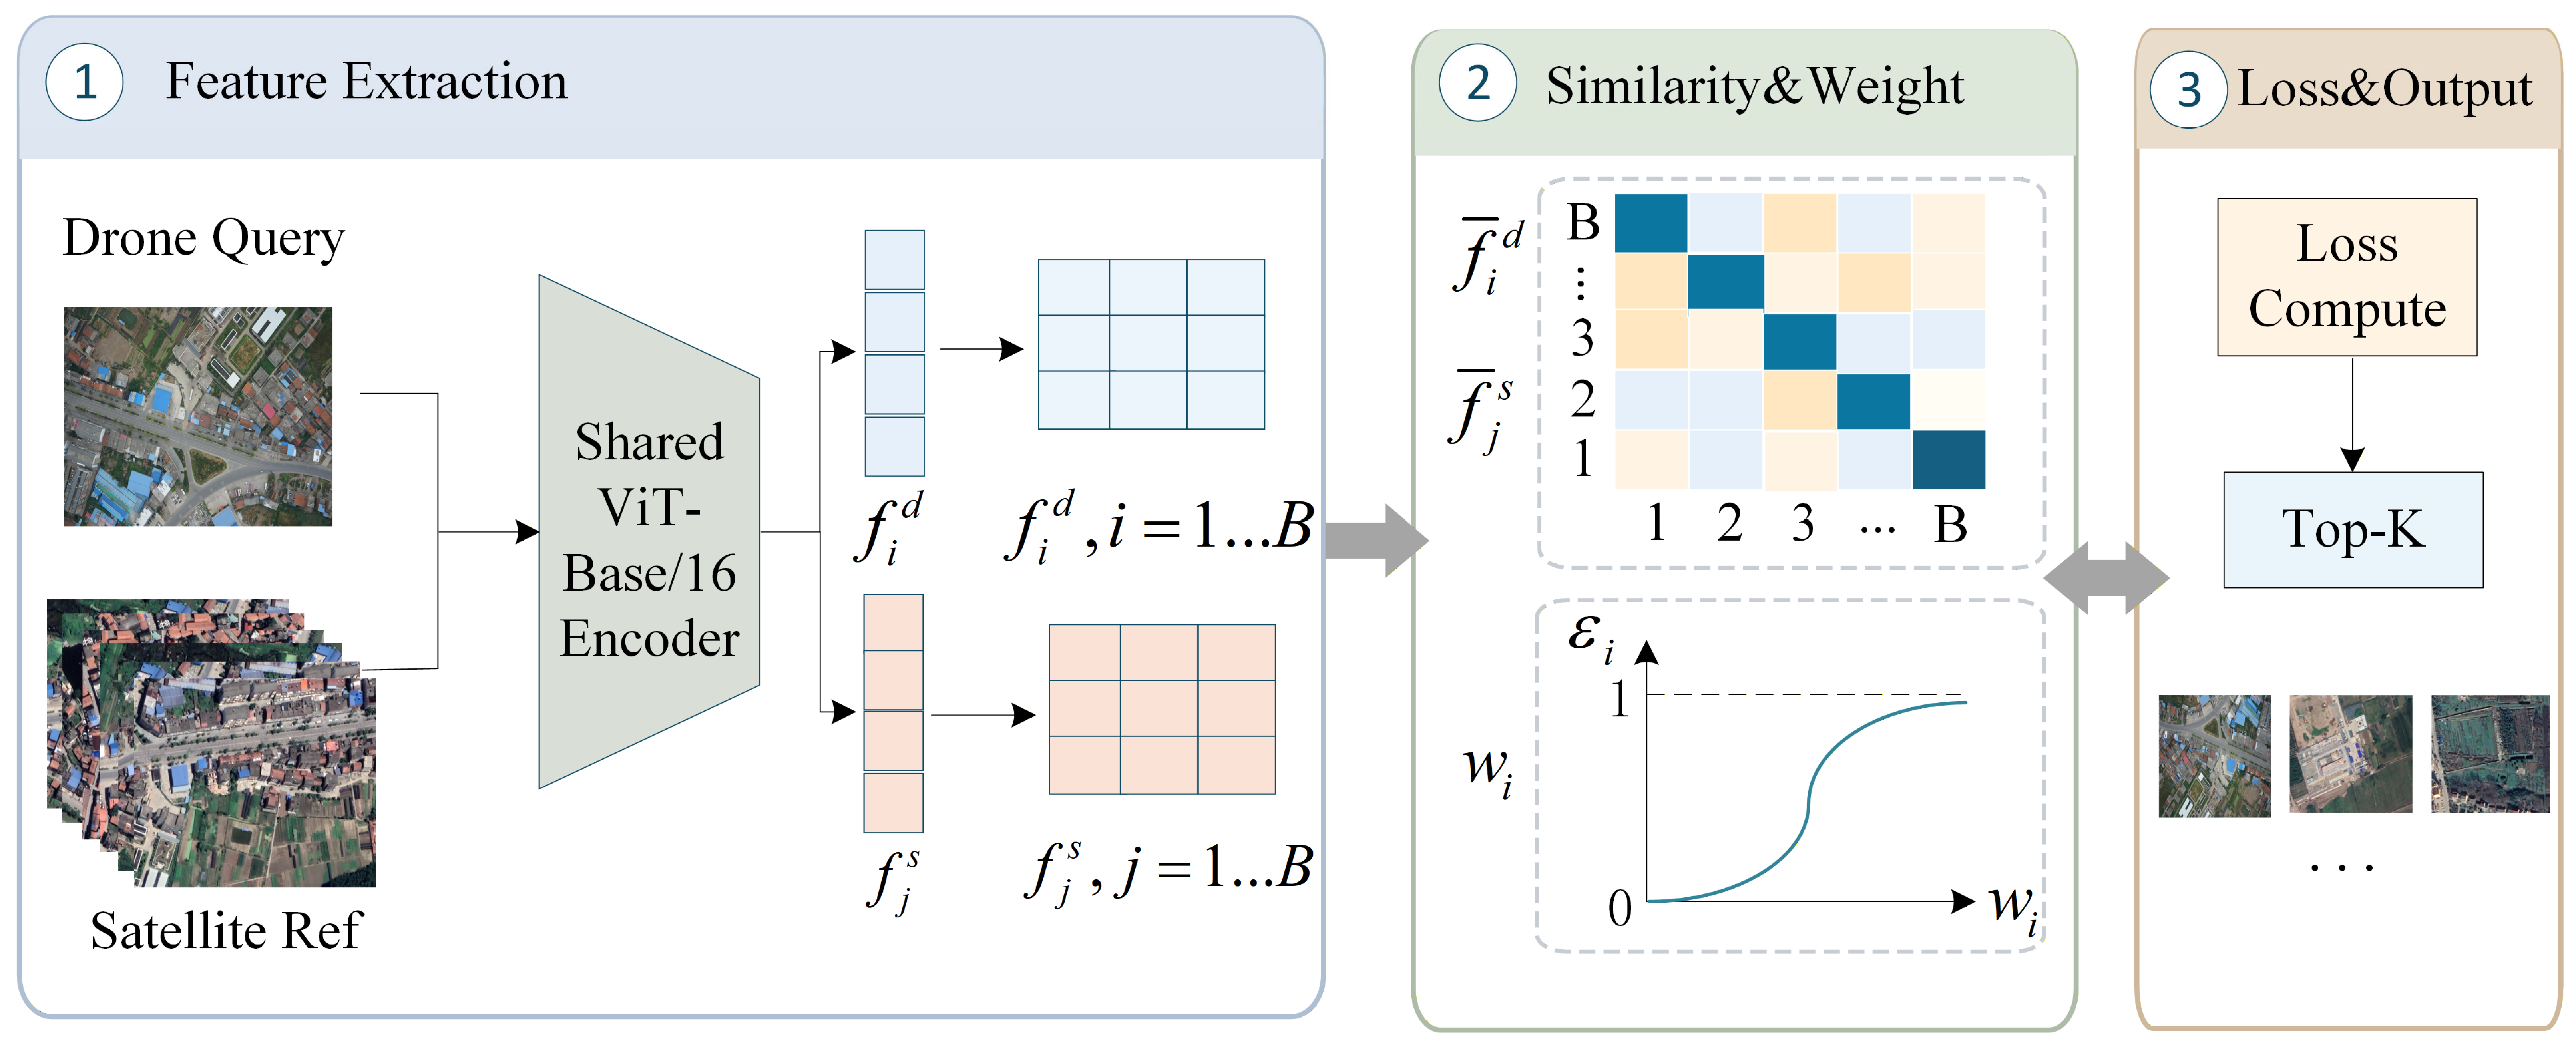
The global retrieval stage is responsible for global localization, as illustrated in Figure 3. Its objective is to rapidly retrieve a small subset of candidate regions most relevant to the query UAV image from a large-scale, continuous satellite reference database, thereby providing a reliable foundation of candidates for subsequent precision reranking and position fusion. Given the significant scale changes, perspective differences, and inconsistencies in local coverage between UAV and satellite viewpoints, this paper adopts a shared-weight dual-branch retrieval framework. Specifically, both the UAV image and the satellite reference image are fed into the same Vision Transformer (ViT-Base/16) encoder, and a global average pooling head is applied to the encoded features to obtain global image descriptors for similarity retrieval. In addition to the global descriptors used for similarity retrieval, the patch-token features before global average pooling are retained as local token features for the subsequent token-level local matching reranking stage. The encoder is initialized with ImageNet-pretrained weights and is fully fine-tuned during global retrieval training. Detailed training and implementation settings are provided in Section 4.2. Through this framework, the global retrieval stage learns unified cross-view representations and performs similarity retrieval in a common feature space. The core task of this stage is not to directly output the final position, but rather to efficiently and stably retrieve a high-confidence set of candidates containing the true position from a large-scale continuous region, so that subsequent reranking and position fusion can further refine candidate ranking and coordinate estimation.
For global retrieval training, a mini-batch is denoted as B = { ( I i d , I i s , w i ) } i = 1 B , where I i d denotes the i-th drone-view query image, I i s denotes its paired satellite reference tile, and w i denotes the overlap weight of this query-reference sample pair.
Both branches share the same encoder E θ ( ) . After encoding and global average pooling, the corresponding global descriptors are obtained as
f i d = E θ ( I i d ) , f j s = E θ ( I j s ) , i = 1 , , B , j = 1 , , B .
To eliminate the impact of differences in feature scales on similarity calculations, this paper applies L 2 normalization to the descriptors
  f   ¯ i d = f i d f i d 2 ,   f   ¯ j s = f j s f j s 2 .
For the mini-batch, the similarity matrix between the query branch and the reference branch is defined as
S i j = τ (   f   ¯ i d ) T   f   ¯ j s , i , j = 1 , , B
where S i j denotes the scaled cosine similarity between the i-th query descriptor and the j-th satellite descriptor. The diagonal entry S i i corresponds to the paired query–reference sample, while the off-diagonal entries correspond to other samples in the mini-batch. The learnable temperature coefficient τ rescales the cosine similarities before contrastive learning to control the sharpness of the similarity distribution. Consequently, the global retrieval stage essentially transforms the cross-view matching problem into a similarity learning problem within a unified feature space.
Since a single query image may correspond to multiple satellite reference tiles with different degrees of ground-area coverage, this paper adopts a weighted contrastive learning objective in the global retrieval stage. For each positive or semi-positive query–reference sample pair, the overlap weight w i is computed as the intersection-over-union (IoU) between the ground footprint of the query field of view and that of the satellite reference tile
w i = I O U ( G i d , G i s ) = G i d G i s G i d G i s
where G i d and G i s denote the ground footprints of the query field of view and the satellite reference tile, respectively. The positive and semi-positive pairing protocol is described in Section 4.1.1. The overlap weight is used as soft supervision information to represent the positive sample strength. Based on w i , the adaptive smoothing coefficient is defined as
ε i = 1 1 1 + exp ( k w i )
where k is a hyperparameter controlling the mapping curvature. A larger w i indicates a stronger cross-view correspondence for the sample pair. In this case, ε i is smaller, and the loss places greater emphasis on the primary match. A smaller w i introduces stronger smoothing constraints, thereby preserving necessary learning flexibility for partially matched samples.
Based on the similarity matrix S, the one-way loss from the drone to the satellite direction can be written as
L d s = 1 B i = 1 B [ ( 1 ε i ) ( S i i + log j = 1 B exp ( S i j ) ) + ε i ( 1 B j = 1 B S i j + log j = 1 B exp ( S i j ) ) .
Similarly, the loss in the direction from the satellite to the UAV can be derived as
L s d = 1 B i = 1 B [ ( 1 ε i ) ( S i i T + log j = 1 B exp ( S i j T ) ) + ε i ( 1 B j = 1 B S i j T + log j = 1 B exp ( S i j T ) ) .
The final global retrieval loss is defined in a bidirectionally symmetric form
L g l o b a l = 1 2 ( L d s + L s d ) .
In addition to the loss function design, this paper introduces a mutually exclusive sampling strategy during the batch construction phase to avoid the problem of pseudo-negative samples within a batch. Let P r e l be the set of all known positive or semi-positive UAV–satellite matching relationships. For any two distinct sample pairs ( I i d , I i s ) and ( I j d , I j s ) within the same batch, if they both appear in the same batch, they must satisfy
( I i d , I j s ) P r e l , ( I j d , I i s ) P r e l , i j .
This constraint means that once a particular sample pair is selected for inclusion in the current batch, other satellite images known to match that UAV image, as well as other UAV images known to match that satellite image, will no longer be included in the same batch. This approach effectively reduces the issue of negative sample contamination within a batch in partial-match scenarios, making the off-diagonal terms in contrastive learning more closely resemble true negative samples.
During the inference phase, global descriptors for all satellite reference images can be extracted offline to build a feature database. For any query UAV image, its global descriptor is extracted online, and the cosine similarity with the satellite descriptors in the reference database is computed as
s j g = (   f   ¯ d ) T   f   ¯ j s , j = 1 , , N s
where N s denotes the number of satellite reference tiles in the database. The results are then sorted from highest to lowest similarity to obtain the corresponding Top-K candidate set
C K = T o p K j ( { s j g } j = 1 N s ) .

3.2. Token-Level Local Matching Reranking

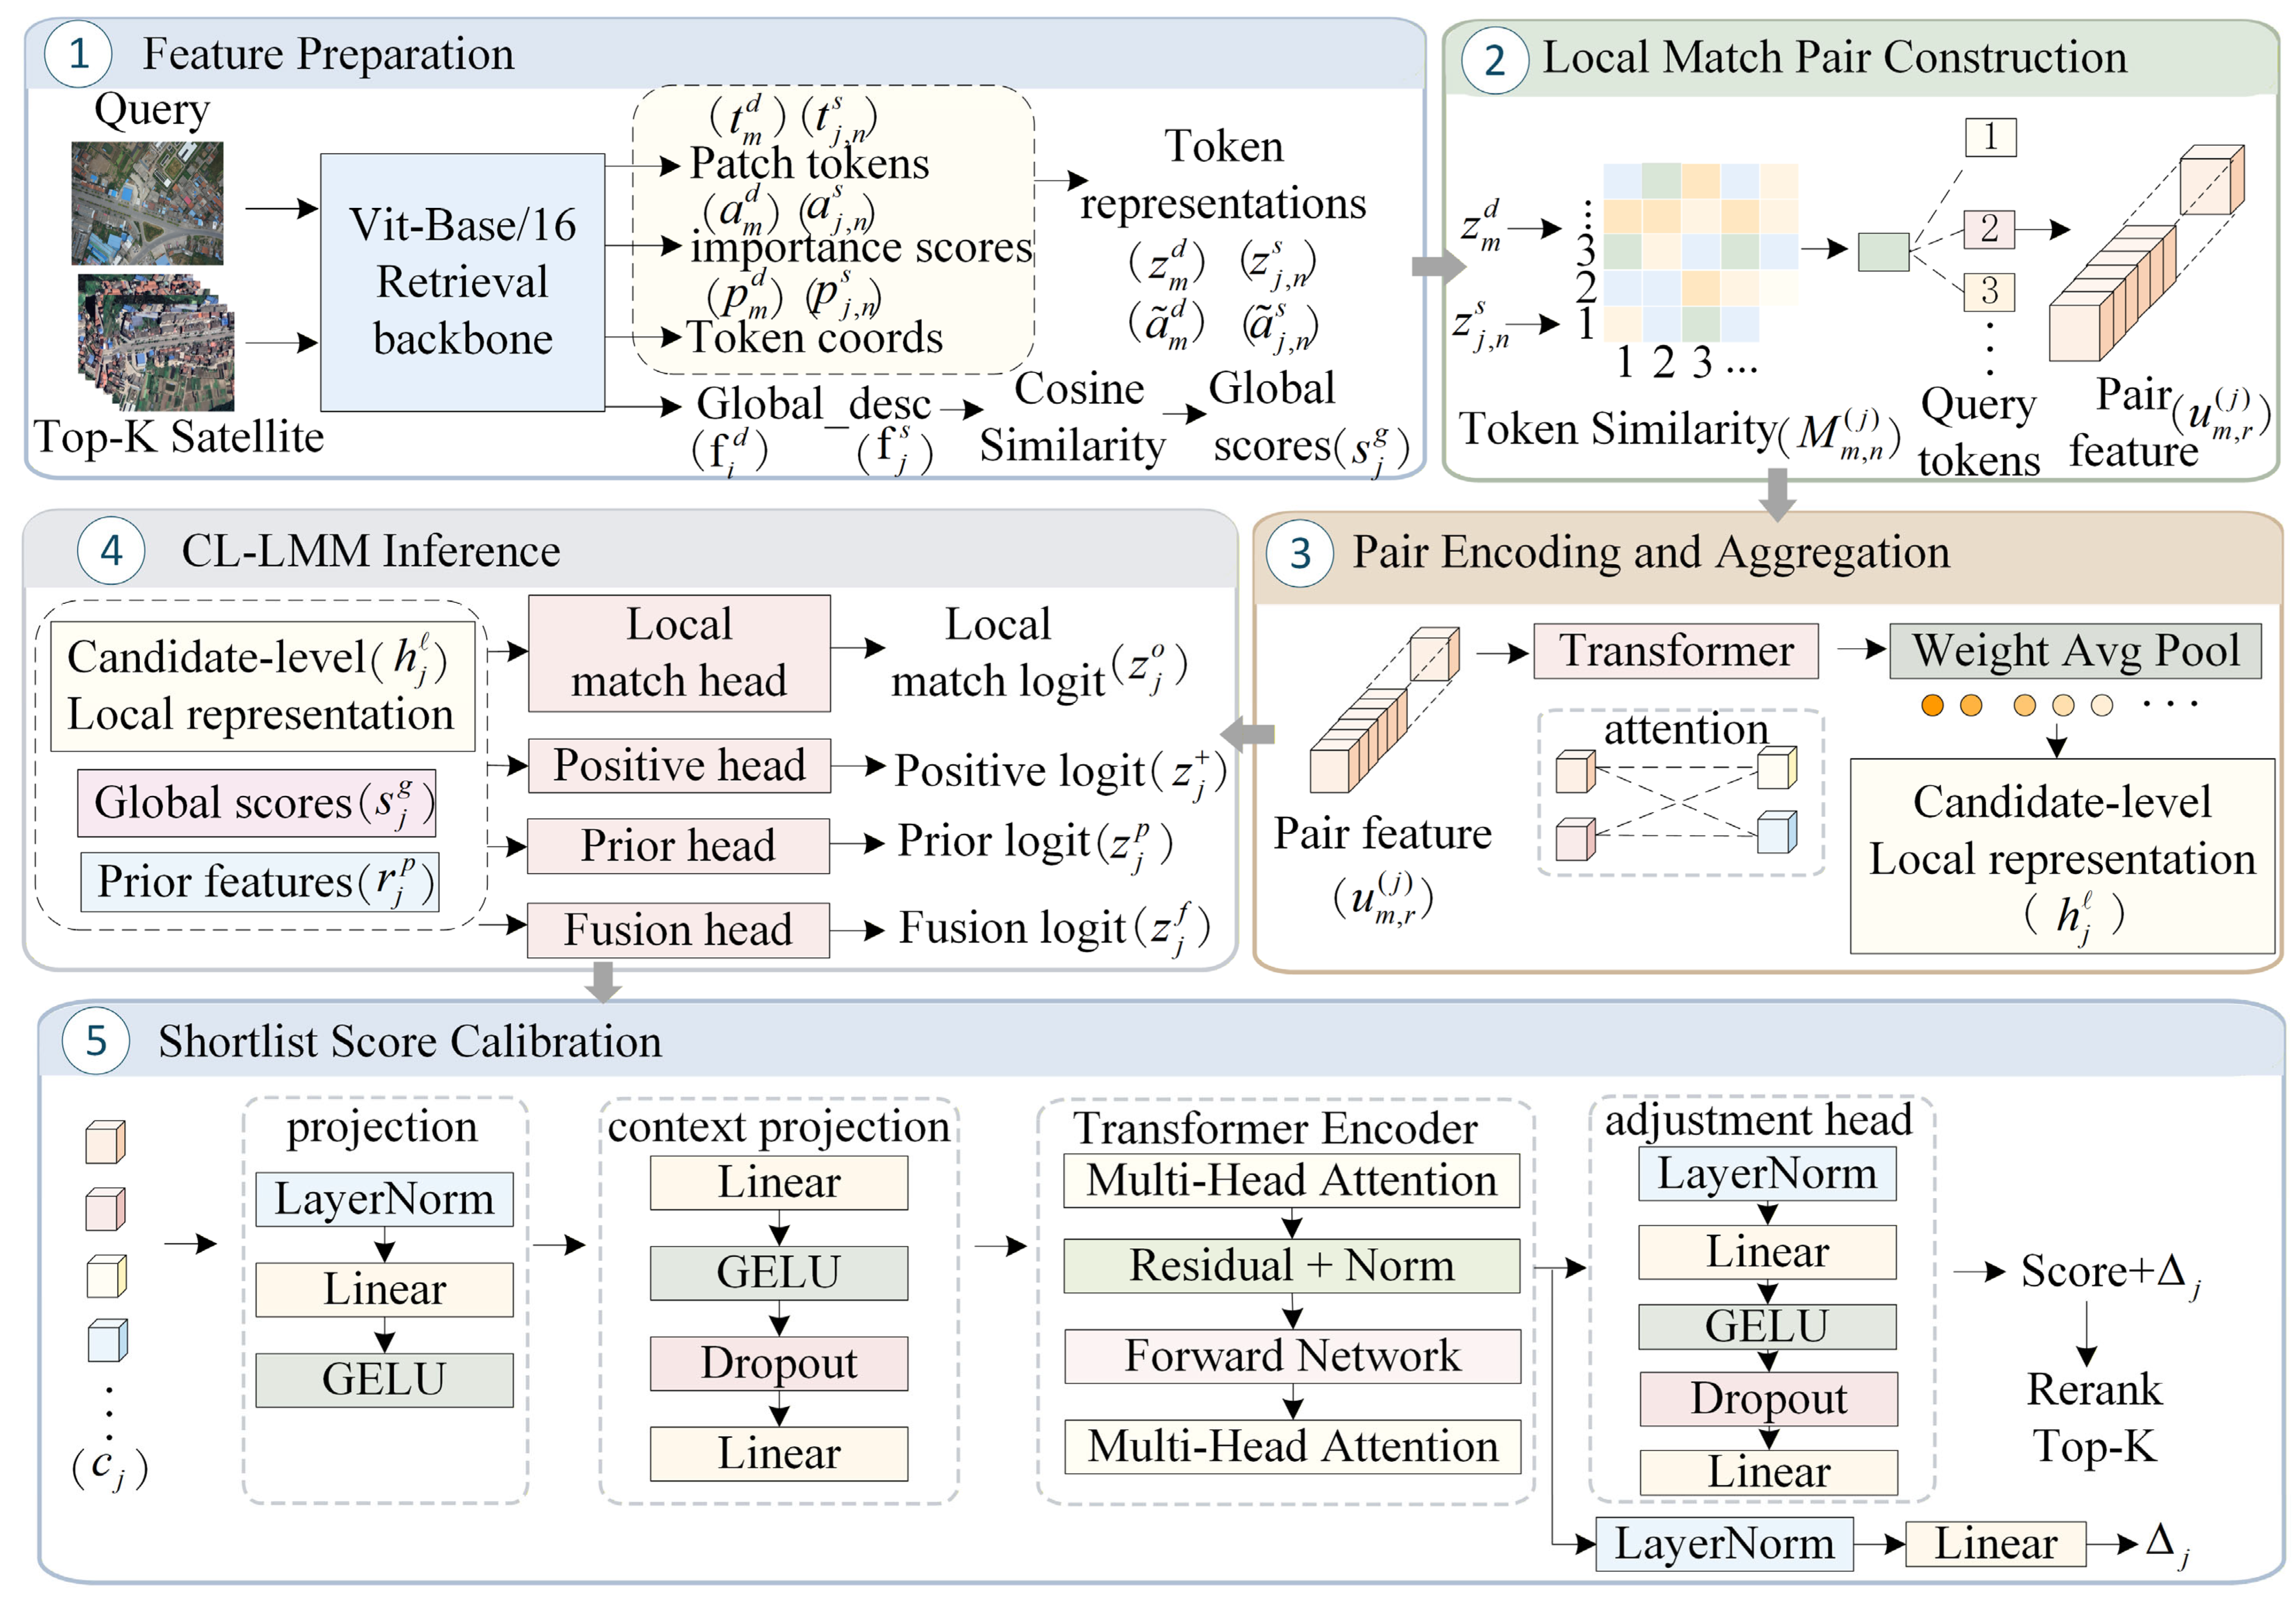
The candidate set C k obtained through global retrieval is already capable of narrowing the search area for the target region in the query image to a smaller range; however, under conditions of continuous regions and partial matches, significant fine-grained ambiguity still exists among the top candidates. The root cause lies in the fact that global scores primarily reflect the overall semantic relevance across the scene, yet struggle to adequately characterize whether reliable local matching has been established in local regions, nor can they distinguish the subtle differences between adjacent tiles, cross-scale parent–child tiles, and regions with repetitive textures. To address this issue, this paper proposes a token-level local matching reranking module, as shown in Figure 4. This module is composed of five sequential components: feature preparation, local match pair construction, pair encoding and aggregation, Candidate-Level Local Matching Modeling (CL-LMM) inference, and shortlist score calibration. The first component prepares local patch tokens, token importance scores derived from the backbone features, and normalized 2D coordinates; the second constructs token-level geometric-semantic match pairs between each query and candidate; the third encodes and aggregates these match pairs into a candidate-level local matching representation; and the fourth combines this representation with structural priors to infer local matching quality, strict-positive tendency, prior confidence, and the fused candidate score; the fifth component performs shortlist-level score calibration for the Top-K candidates, thereby suppressing ranking fluctuations and improving the distinguishability of top-ranked results. In this work, the module is implemented on the local patch tokens extracted from the ViT-Base/16 global retrieval backbone. Although implemented here with a ViT-Base/16 backbone, this token-level reranking conceptually generalizes to any architecture via simple patch-level feature partitioning.

3.2.1. Feature Preparation

For each query, the top K candidates with the highest scores from the global retrieval results are selected to form the candidate set, where K represents the number of candidates participating in token-level local matching reranking. For the query image I i d and the j-th satellite candidate I j s in the candidate set, this paper uses the local patch tokens output by the global retrieval backbone, the token importance scores computed from these patch-token features, and the corresponding normalized 2D coordinates as inputs. Here, the local token features are the ViT patch-token embeddings extracted from the global retrieval backbone before global average pooling. With a 384 × 384 input and a ViT-Base/16 backbone, each image is divided into a 24 × 24 patch grid, and each original patch token has a 768-dimensional feature before linear projection.
The token importance score serves as a token-level saliency prior directly computed from the patch-token features retained by the global retrieval backbone. Specifically, before undergoing global average pooling, the global retrieval backbone produces the raw patch-token features. Let f ¯ i d and f ¯ j s denote the image-level descriptors obtained by averaging the patch-token features of the query image and the j-th candidate satellite image, respectively
f ¯ i d = 1 N t m = 1 N t t m d , f ¯ j s = 1 N t m = 1 N t t j , n s ,
where t m d and t j , n s denote the local token features of the query image and the j-th candidate satellite image, respectively. For each patch token, its token importance score is determined by the cosine response between the local patch-token feature and the corresponding aggregated image-level descriptor
a m d = ( t m d ) T f ¯ i d t m d 2 f ¯ i d 2 + ε 0 , a j , n s = ( t j , n s ) T f ¯ j s t j , n s 2 f ¯ j s 2 + ε 0
where ε 0 is a small constant for numerical stability. Mathematically, the token importance score quantifies the directional consistency between each local patch token and the global retrieval descriptor of the same image, thereby acting as a deterministic saliency prior derived from the intrinsic backbone features. In practice, these scores are min-max normalized within each individual image boundaries before being fused with the learnable token gate in Equations (17) and (18).
The normalized 2D coordinate records the spatial position of each patch token in the feature grid. Specifically, for the m-th query token located at row r m and column c m in a feature grid of size H g × W g , its coordinate is defined as p m d = ( c m / ( W g 1 ) , r m / ( H g 1 ) , where ( H g = W g = 24 ) in our implementation. The candidate-side token coordinate is computed in the same way. These normalized coordinates are used to calculate the relative displacement between matched query and candidate tokens. Let the number of local tokens retained in each image be N t . Then, the query image and the j-th candidate are represented as
T d = { ( t m d , a m d , p m d ) } m = 1 N t ,
T j s = { ( t j , n s , a j , n s , p j , n s ) } n = 1 N t ,
where a m d and a j , n s denote the importance scores of the corresponding tokens; and p m d and p j , n s denote the 2D coordinates of the corresponding tokens in the normalized feature grid. To reduce the original token dimension and enhance the stability of local interactions, this paper first performs linear projection and normalization on the local tokens to obtain the dimension-reduced local token representations
z m d = N o r m ( W t t m d ) , z j , n s = N o r m ( W t t j , n s )
where W t denotes the shared linear projection matrix, and N o r m ( ) denotes the L 2 normalization operation. Relying solely on fixed token importance scores can easily lead to local matches being overly driven by global features. Therefore, this paper further introduces a learnable gating mechanism to fuse explicit saliency with learned local discriminative capabilities. Let M i n M a x ( ) denote min-max normalization within a single sample, σ ( ) denote the Sigmoid function, and w d and w s denote the learnable parameter vectors for the query-side and candidate-side token gates, respectively. Then, the fused token weights for the query and candidate are defined as
a ˜ m d = 1 2 M i n M a x ( a m d ) + 1 2 σ ( w d T z m d ) ,
a ˜ j , n s = 1 2 M i n M a x ( a j , n s ) + 1 2 σ ( w s T z j , n s ) .
Equations (17) and (18) define the fused token weights for the query image and the candidate satellite image, respectively. The first term, M i n M a x ( ) , is the normalized token importance score defined above, which provides an explicit saliency prior derived from the backbone features. The second term is a learnable gating score computed from the dimension-reduced local token representation, which allows the reranking module to adaptively evaluate the local discriminative capability of each token. The two terms are averaged to balance the fixed token-level saliency prior and the learnable local discrimination cue without introducing an additional weighting hyperparameter. The fused token weights are then used in local match pair weighting for subsequent local representation aggregation.

3.2.2. Local Match Pair Construction

Based on the prepared local token representations and fused token weights, the second component constructs local match pairs between the query image and each candidate satellite tile. The token similarity matrix between the query image and the j-th candidate is defined as
M m , n ( j ) = z m d T z j , n s , m , n = 1 , , N t
where M m , n ( j ) denotes the cosine similarity between the m-th token in the query image and the n-th token in the j-th candidate image. For each query token, this paper selects the top-R positions with the strongest local responses among the candidate tokens. Let the r-th matching position of the m-th query token in the j-th candidate be denoted as π j r ( m ) . Then the corresponding local displacement is defined as
Δ p m , r ( j ) = p j , π j r ( m ) s p m d
where Δ p m , r ( j ) denotes the two-dimensional relative displacement between the query token and the matching candidate token. The selected matching position and the corresponding local displacement are used to construct the local match pair feature in the next step. Based on the query token position, candidate token position, relative displacement, saliency, and local similarity, this paper constructs a 12-dimensional joint geometric-semantic feature for each local match pair as follows:
u m , r ( j ) = [ x m d , y m d , x j , π j r ( m ) s , y j , π j r ( m ) s , Δ x m , r ( j ) , Δ y m , r ( j ) , Δ x m , r ( j ) , Δ y m , r ( j ) , a ˜ m d , a ˜ j , π j r ( m ) s , M m , π j r ( m ) ( j ) , Δ p m , r ( j ) 2 ] .
The 12-dimensional feature u m , r ( j ) contains four groups of information: the 2D coordinate of the query token, the 2D coordinate of the matched candidate token, the relative displacement and absolute displacement between the two tokens, and the token-level saliency and similarity scores. The coordinate and displacement terms provide geometric information, while the saliency and similarity terms provide semantic matching evidence. To distinguish the importance of different local match pairs, we define the weight of a match pair as
w m , r ( j ) = a ˜ m d a ˜ j , π j r ( m ) s M m , π j r ( m ) ( j ) + 1 2 .

3.2.3. Pair Encoding and Aggregation

After local match pairs are constructed, the third component encodes their interactions and aggregates them into a candidate-level local matching representation. The match-pair weighting ensures that pairs with both high saliency and high local similarity contribute more to the subsequent aggregation. All local match pairs are first mapped to a unified feature space via linear embedding, and then the interdependencies among local match pairs are modeled using a Transformer encoder. Let the encoded local match pairs be denoted as h m , r ( j ) . Then the encoded pair features are aggregated by weighted average pooling and max pooling to obtain the candidate-level local matching representation of the j-th candidate.
h ¯ j = m , r w ^ m , r ( j ) h m , r ( j ) , w ^ m , r ( j ) = w m , r ( j ) u , v w u , v ( j ) + ε 0
h j l = ϕ l ( [ h ¯ j ; max m , r h m , r ( j ) ] )
where ε 0 > 0 is a very small constant to prevent division by zero, and ϕ l ( ) denotes the local representation transformation comprising linear mapping, normalization, and nonlinear activation.

3.2.4. CL-LMM Inference

The fourth component performs CL-LMM inference by combining the candidate-level local matching representation with multi-scale structural priors. In addition to the local matching relationships between queries and candidates, contiguous-area satellite tiles naturally possess same-scale adjacency relationships and cross-scale parent–child relationships. To further leverage the structural information of candidates within the shortlist, this paper constructs 6-dimensional neighborhood prior features for each candidate. First, a linear mapping is applied to the global score s j g
s ^ j g = s j g + 1 2 .
Let the scaling level of the satellite tile corresponding to the j-th candidate be z j , and the tile grid coordinates be ( x j , y j ) . Within the candidate set, the same-scale neighborhood of the j-th candidate is defined as
N j s a m e = { u z u = z j , x u x j 1 , y u y j 1 , u j } .
The cross-scale neighborhood set is defined as
N j c r o s s = { u ( z u = z j 1 , x u = [ x j / 2 ] , y u = [ y j / 2 ] ) } .
Thus, the same-scale support and cross-scale support are expressed as
η j s a m e = 1 N j s a m e u N j s a m e s ^ u g , N j s a m e > 0 0 , N j s a m e = 0 ,
η j c r o s s = 1 N j c r o s s u N j c r o s s s ^ u g , N j c r o s s > 0 0 , N j c r o s s = 0 .
Furthermore, the same-scale density and cross-scale density are defined as
c j s a m e = N j s a m e K 1 , c j c r o s s = N j c r o s s K 1 .
The normalized rank and normalized hierarchy of the j-th candidate in the candidate set are defined as
ρ j = j 1 K 1 ,
ζ j = z j z min z max z min ,
where z min and z max denote the minimum and maximum values of the satellite tile levels, respectively. Consequently, the 6-dimensional structural prior feature of the j-th candidate is expressed as
p j 0 = [ η j s a m e , η j c r o s s , c j s a m e , c j c r o s s , ρ j , ζ j ] T .
Subsequently, the structural prior is mapped using the prior encoder ϕ p ( ) to obtain the prior representation of the j-th candidate
r j p = ϕ p ( p j 0 ) .
The a priori classification head ϕ p c l s ( ) is then used to output the logits for the a priori branch
z j p = ϕ p c l s ( r j p ) .
Based on this, the candidate-level local matching representation, prior representation, and global score are combined to form the candidate shared representation
h j = [ h j l ; r j p ; s j g ] .
Subsequently, the local matching discriminator ϕ o ( ) , the strict positive discriminator ϕ + ( ) , and the fusion discriminator ϕ f ( ) output their respective logits
z j o = ϕ o ( h j ) , z j + = ϕ + ( h j ) , z j f = ϕ f ( [ h j ; z j o ; z j + ; z j p )
where z j o represents the local matching quality logit, z j + represents the strict positive sample tendency logit, z j p represents the prior branch logit, and z j f represents the candidate-level fusion logit. The corresponding probabilistic form is denoted as
p ^ j o = σ ( z j o ) , p ^ j + = σ ( z j + ) , p ^ j p = σ ( z j p ) , p ^ j f = σ ( z j f ) .
During the training phase, let the soft overlap label for the j-th query-candidate pair be t j o [ 0 , 1 ] , and the strict positive label be t j + { 0 , 1 } , and let
v j { 0 , 1 }
where v j indicates whether the query to which the sample belongs has at least one strict positive sample among the top-K candidates. Thus, the supervised label for the fusion branch is defined as
t j f = 0.7 t j + + 0.3 t j o , v j = 1 t j o , v j = 0 .
Here, the coefficients 0.7 and 0.3 are fixed balancing weights for the fusion-branch supervision. The soft overlap label is assigned the larger weight to preserve continuous partial-matching information, while the strict-positive label provides auxiliary binary guidance for emphasizing exact positive candidates. The same coefficients are used in all experiments. To mitigate the imbalance between positive and negative samples, sample weights are defined as
w j = 1 + I ( t j o > 0 ) + t j +
where I ( ) denotes the indicator function. Thus, the three training losses for candidate-level local matching modeling are expressed as
L o = 1 N p j = 1 N p w j B C E ( z j o , t j o ) ,
L + = j = 1 N p v j B C E ( z j + , t j + ) j = 1 N p v j + ε 0 ,
L f = 1 N p j = 1 N w j B C E ( z j f , t j f ) ,
where N p denotes the number of query-candidate pairs in the current batch, and B C E ( , ) denotes the binary cross-entropy loss. Finally, the total loss for candidate-level local matching modeling is
L p a i r = λ o L o + λ + L + + λ f L f .

3.2.5. Shortlist Score Calibration

The fifth component in Figure 4 corresponds to shortlist score calibration, which performs rank calibration for the Top-K candidates after CL-LMM inference. After candidate-level local matching modeling, the Top-K high-confidence candidates from the same query retain their original global retrieval order and form an ordered shortlist. Shortlist score calibration then performs list-level confidence correction based on candidate-level evidence and query-level shortlist context. The input for the shortlist score calibration stage consists of three parts. The first part is the original global score s j g for each candidate in the shortlist. The second part is the local matching probability p ^ j o , strict positive sample probability p ^ j + , prior probability p ^ j p , fusion probability p ^ j f , and structural prior p j 0 output by candidate-level local matching modeling. The third part is a query-level shortlist context vector computed from deterministic summary descriptors of the entire Top-K shortlist. By simultaneously leveraging candidate-level discriminative results and list-level contextual information, shortlist score calibration can further mitigate ranking fluctuations among the top candidates.
First, we perform min-max normalization on the global scores within the shortlist
s ˜ j g = s j g min u L K s u g max u L K s u g min u L K s u g + ε 0 .
Next, we linearly combine the normalized global score, strict positive sample probability, local matching probability, and prior probability to construct the baseline score prior to shortlist calibration
u j = λ g s ˜ j g + λ + p ^ j + + λ o p ^ j o + λ p p ^ j p
where λ g , λ + , λ o , and λ p are the weight coefficients of the four components, respectively. Based on this, the baseline score is further normalized within the shortlist
u ˜ j = u j min v L K u v max v L K u v min v L K u v + ε 0 .
Using the same-scale neighborhood set defined in Equation (26), we can further define the same-scale consistency feature
K j = 1 N j s a m e v N j s a m e u ˜ v , N j s a m e > 0 0 , N j s a m e = 0 .
Thus, the candidate-level feature vector for the j-th candidate is written as
c j = [ s j g , s ˜ j g , s ˜ 1 g s ˜ j g , s ˜ 2 g s ˜ j g , p ^ j + , p ^ j o , p ^ j p , p ^ j f , ( p j 0 ) T , K j , b j , u j , ρ j ] T
where s ˜ 1 g and s ˜ 2 g represent the normalized global scores of the top two candidates in the shortlist, respectively; b j { 0 , 1 } indicates whether the current candidate is the global Top-1; and ρ j denotes the normalized rank of the j-th candidate within the shortlist.
In addition to the candidate-level features, a query-level context vector is also constructed. Let the mean and standard deviation of the top 5 normalized global scores in the shortlist be
μ 5 = 1 min ( 5 , K ) j = 1 min ( 5 , K ) s ˜ j g , σ 5 = S t d ( s ˜ 1 g , , s ˜ min ( 5 , K ) g ) .
Let the renormalized entropy be
H = 1 log ( max ( 2 , K ) ) j = 1 K ω j H log ω j H , ω j H = max ( s ˜ j g , ε 0 ) u = 1 K max ( s ˜ u g , ε 0 ) .
We define the same-scale density, cross-scale density, and same-scale support mean of the shortlist as a whole, denoted respectively as
c ¯ s a m e = 1 K j = 1 K c j s a m e ,
c ¯ c r o s s = 1 K j = 1 K c j c r o s s ,
η ¯ s a m e = 1 K j = 1 K η j s a m e .
Thus, the query-level context vector is expressed as
q = [ s ˜ 1 g , s ˜ 2 g , s ˜ 1 g s ˜ 2 g , μ 5 , σ 5 , H , c ¯ s a m e , c ¯ c r o s s + η ¯ s a m e ] T .
This vector does not assume a specific parametric statistical distribution; instead, it summarizes the confidence concentration and neighborhood consistency of the shortlist at the query level. The shortlist score calibration network consists of a candidate feature encoder, a query context encoder, and a Transformer encoder. Let the candidate feature encoder be denoted as ϕ c ( ) and the query context encoder as ϕ q ( ) . Then, the input for the j-th candidate is represented as
e j = ϕ c ( c j ) + ϕ q ( q ) .
After passing through the Transformer, the candidate representation in the shortlist context is obtained as r j . Based on this, the score correction head ϕ Δ ( ) and the auxiliary classification head ϕ a ( ) output the original residual and auxiliary logit, respectively,
d j = ϕ Δ ( r j ) , z j a = ϕ a ( r j ) .
Subsequently, the raw residuals undergo hyperbolic tangent compression and magnitude scaling. Let α Δ > 0 denote the residual scaling coefficient. Then the actual score adjustment is
Δ j = α Δ tanh ( d j ) .
The final refined ranking score is defined as
s j r = u j + Δ j .
During the training phase, the shortlist score calibration network employs a joint objective comprising listwise ranking, pairwise ordering constraints, auxiliary classification, anchor protection, and residual regularization. First, a listwise target distribution is constructed only for strictly positive samples. Let the set of strictly positive samples be
P + = { j t j + = 1 }
where t j + { 0 , 1 } indicates whether the j-th candidate is a strictly positive sample, the listwise target distribution is defined as
π j = t j + u = 1 K t u + + ε 0 .
The corresponding listwise loss is
L l i s t = j = 1 K π j log exp ( s j r ) u = 1 K exp ( s u r ) .
To explicitly preserve the order relationships among strict positive, semi-positive, and negative samples, the semi-positive and negative sample sets are defined as
S s e m i = { j t j s = 1 , t j + = 0 } , N n e g = { j t j + = 0 , t j s = 0 } .
where t j s { 0 , 1 } indicates whether the j-th candidate is a semi-positive sample. For any two sets A and B, the pairwise ranking loss is defined as
L A , B r a n k = 1 | A | | B | j A u B s o f t p l u s ( ( s j r s u r m A , B ) )
where s o f t p l u s ( ) denotes the smoothing activation function, and m A , B denotes the ordering margin set between set A and set B. Thus, the overall ordering constraint can be written as
L o r d = L P , N r a n k + λ s L P , S r a n k + λ s L S , N r a n k .
The auxiliary classification head uses strict positive class binary supervision
L a u x = 1 K j = 1 K B C E ( z j a , t j + ) .
To prevent the downgrading of already highly reliable global Top-1 candidates in certain simple samples, an anchor protection loss is further introduced. Let
g = s ˜ 1 g s ˜ 2 g
denote the normalized score gap between the global Top-1 and the runner-up, and define the anchor activation indicator
X = I ( t 1 + = 1 ) I ( g > m g )
where m g denotes the anchor activation threshold. The anchor protection loss is expressed as
L a n c = X s o f t p l u s ( max j > 1   s j r s 1 r + m a )
where m a denotes the anchor protection margin. Additionally, the residual correction term incorporates the L 1 regularization constraint
L Δ = 1 K j = 1 K Δ j .
Finally, the total loss of the shortlist score calibration network is defined as
L c a l = λ l i s t L l i s t + λ o r d L o r d + λ a u x L a u x + λ a n c L a n c + λ Δ L Δ .
The token-level local matching reranking module operates only on high-confidence candidates most likely to contain the true position. Without compromising the global recall structure, it significantly improves the ranking reliability of top results and provides more stable input for the subsequent position fusion stage.

3.3. Neighborhood-Consistent Position Fusion

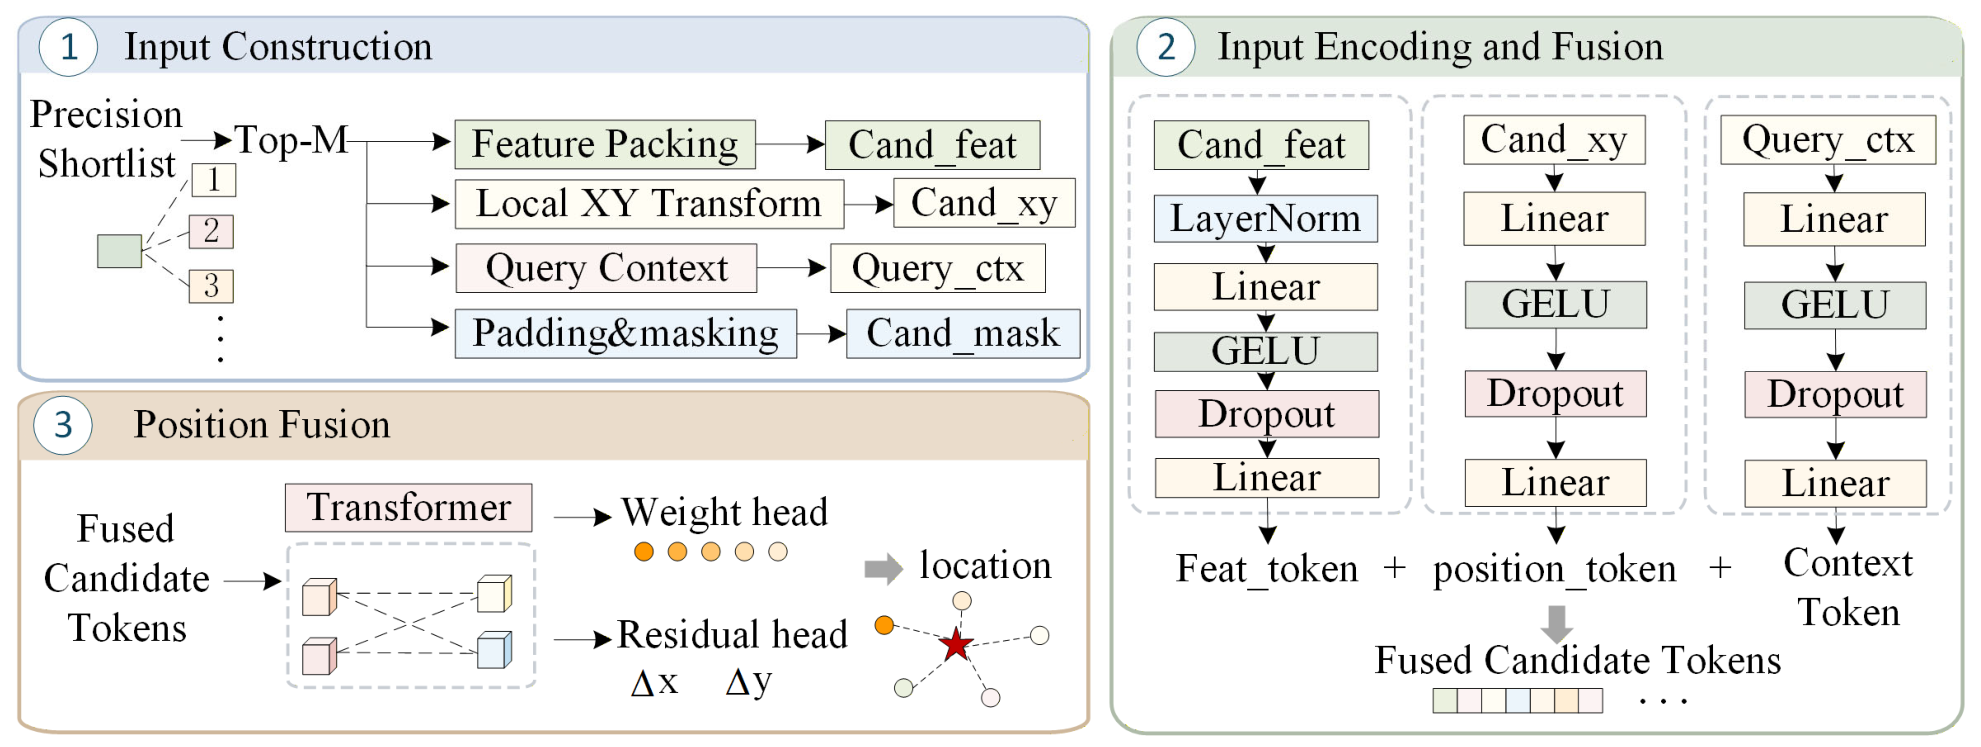
While token-level local matching reranking significantly improves the ranking reliability of top candidates, for continuous region localization tasks, directly using the center of the top-ranked satellite tile as the final position remains constrained by the discrete tile sampling method. Even if the candidate ranking is largely correct, there may still be a significant offset between the tile center and the true field-of-view center. To further improve the accuracy of the final coordinate estimation, this paper proposes a neighborhood-consistent position fusion (LocFusion) module based on the refined ranking results. The overall architecture and working principle of this module are illustrated in Figure 5.This module constructs a local support set around the refined anchor candidates, jointly utilizing candidate-level discriminative evidence, neighborhood relationships, and relative spatial positions in a local coordinate system to perform position fusion and residual correction through a learnable approach. It should be noted that the position fusion stage does not alter the image ordering sequence after refined ranking, but only performs continuous coordinate estimation for the final Top-1 position.

3.3.1. Local Support Set Construction

Let the true geographic location of the query image be l d , and the refined shortlist be L K r . The first candidate in L K r is selected as the anchor candidate; its corresponding satellite tile is denoted as I 1 s , and its center geographic coordinates are denoted as l a . Based on this, a local support set consisting of M candidates is selected from L K r , denoted as
U M = { I j 1 s , I j 2 s , , I j M s } .
Here, M denotes the number of candidates used in the position fusion stage, and { j m } m = 1 M represents the indices of these candidates in the refined shortlist, with the first candidate fixed as the anchor candidate. The construction of the local support set follows the principle of “anchor first, neighborhood first, then fill in the rest.” Specifically, the Top-1 candidate from the refined list is first retained as the anchor. Subsequently, candidates are selected in the order of L K r , prioritizing those that satisfy either a same-scale adjacency relationship or a cross-scale parent–child relationship with the anchor. If the number of candidates satisfying the above structural constraints is insufficient to reach M, the remaining candidates are added sequentially according to the refined ranking order. Thus, the local support set retains both the high-confidence candidates from the refined ranking and explicitly preserves the local spatial structure around the anchor.
To transform the discrete tile positions into a continuous coordinate estimation problem, this paper establishes a local tangent plane coordinate system using the center of the anchor candidate l a as a reference. Let Ψ ( , ) denote the projection onto the local tangent plane with origin l a . Then, the center positions of the m-th support candidate and the true query location in the local coordinate system are defined as follows:
c m = Ψ ( l a , l m ) , c * = Ψ ( l a , l d )
where l m denotes the geographic coordinates of the center of the m-th support candidate, c m = [ x m l o c , y m l o c ] T denotes the local plane coordinates of that candidate relative to the anchor point, and c * = [ x * , y * ] T denotes the target coordinates of the query’s true location within the same local coordinate system. Through this representation, position fusion is transformed from a nonlinear localization problem in geographic coordinate space into a continuous regression problem in local Euclidean space.

3.3.2. Learnable Position Fusion Network

The objective of the position fusion stage is to predict the final local coordinates c ^ based on the local support set U M , by comprehensively utilizing the candidate’s ranking evidence, neighborhood evidence, and spatial position information, and then further reconstructing them into the geographic coordinate space. To this end, this paper constructs candidate-level input features for each candidate in the local support set. Let the refined ranking score corresponding to the m-th support candidate be denoted as s m r , its min-max normalized result within the local support set as s ˜ m r , and the candidate’s normalized global retrieval score as s ˜ m g . Thus, the candidate feature vector for the m-th support candidate is expressed as
v m = [ s ˜ m r , s m r , s ˜ m g , p ^ m + , p ^ m o , p ^ m p , η ¯ m , η m s a m e , η m c r o s s , K m , ζ m , ρ m s e l , b m , n m c r o s s , x m l o c / γ c , y m l o c / γ c , c m 2 / γ 2 , δ z m ] T
where p ^ m + , p ^ m o , and p ^ m p denote the strict positive sample probability, local matching probability, and prior probability of the m-th candidate, respectively; η ¯ m = 0.5 ( η m s a m e + η m c r o s s ) denotes the average of same-scale support and cross-scale support; K m denotes same-scale consistency; ζ m denotes the normalization level; ρ m s e l = ( m 1 ) / max ( 1 , M 1 ) denotes the normalized sequential position of the candidate within the local support set; b m { 0 , 1 } indicates whether the candidate is an anchor; n m s a m e { 0 , 1 } and n m c r o s s { 0 , 1 } denote, respectively, whether the candidate is an in-scale neighbor or cross-scale neighbor of the anchor; γ c > 0 denotes the local coordinate normalization scale factor; z m denotes the tile level of the mth support candidate, z 1 denotes the tile level of the anchor candidate, and δ z m = z m z 1 2 denotes the relative level difference.
In terms of network architecture, the position fusion module consists of a candidate feature encoder, a coordinate encoder, a query context encoder, and a Transformer encoder. Let ψ v ( ) , ψ c ( ) , and ψ q ( ) denote the candidate feature encoder, the local coordinate encoder, and the query context encoder, respectively. Then, the input representation of the m-th support candidate is defined as
e m = ψ v ( v m ) + ψ c ( c m ) + ψ q ( q )
where q denotes the query-level context vector from the shortlist score calibration phase. Subsequently, { e m } m = 1 M is fed into the Transformer encoder to obtain the representation of the supporting candidate in the local context, denoted as r m . Based on this, a weighted prediction head ψ w ( ) is used to output a weight logit for each supporting candidate
α m = ψ w ( r m )
and the fusion weights are obtained via softmax
w m = exp ( α m ) u = 1 M exp ( α u )
where w m denotes the contribution of the m-th support candidate to the final position estimate, satisfying m = 1 M w m = 1 . Based on the above weights, the weighted average position of the candidate centers is first computed as
c ¯ = m = 1 M w m c m .
However, relying solely on the weighted average of candidate centers is still subject to the limitations of discrete tile center bias. Therefore, this paper further introduces a learnable residual term to continuously refine the weighted center. It is expressed as
Δ c = α l o c tanh ( ψ Δ ( r ¯ ) )
where r ¯ = m = 1 M w m r m denotes the context representation after weight aggregation, ψ Δ ( ) denotes the residual prediction head, and α l o c > 0 is the residual scaling coefficient. Thus, the final local coordinate estimate output by the position fusion module is
c ^ = c ¯ + Δ c .

3.3.3. Training Objective

To enable the position fusion network to simultaneously learn candidate weight distribution and continuous coordinate correction, this paper adopts a joint training objective comprising coordinate regression, weight distribution constraints, residual regularization, entropy regularization, and easy-sample constraints.
First, based on the local coordinate estimates c ^ and the target coordinates c * output by the position fusion network, we construct the position regression loss
L l o c = S m o o t h L 1 ( c ^ c * γ c , 0 )
where S m o o t h L 1 ( , ) denotes the smoothed L 1 loss, and γ c is consistent with the coordinate normalization scale factor in Equation (75). Second, to provide explicit supervision for candidate weights, we first calculate the geographical distance between the query’s true location and the centers of each supporting candidate. Let D ( , ) denote the Haversine distance. Then, the true distance of the m-th support candidate is
d m g t = D ( l d , l m )
where l d denotes the true geographic location of the query, and l m denotes the geographic coordinates of the m-th support candidate. Based on this, we construct the soft objective weight distribution
w ˜ m = exp ( d m g t / σ t ) u = 1 M exp ( d u g t / σ t )
where σ t > 0 denotes the distance decay scale parameter. Then, the Kullback–Leibler divergence is used to constrain the consistency between the predicted weight distribution and the soft target distribution
L w = m = 1 M w ˜ m log w ˜ m w m + ε 0 .
Additionally, to suppress excessive residual bias, an L 1 regularization term is applied to the residual correction term
L r = Δ c 1 γ c .
Simultaneously, a constraint is imposed on the entropy of the weight distribution. The normalized weight entropy is defined as
L e = 1 log ( max ( 2 , M ) ) m = 1 M w m log ( w m + ε 0 ) .
This term is used to regulate the dispersion of candidate weights, thereby preventing all candidates from being used in an overly averaged manner. Finally, to avoid introducing unnecessary large residual corrections when the anchor is already very close to the true location, an easy-sample constraint is further introduced. Let the geographical distance between the anchor center and the true location be
d a = D ( l d , l a ) .
We define the easy-sample indicator
β = I ( d a τ a )
where τ a > 0 represents the easy-sample threshold. Thus, the easy-sample constraint loss is written as
L a = β Δ c 2 γ c .
Combining all terms, the total loss for the position fusion network is defined as
L l o c f u s i o n = λ l o c L l o c + λ w L w + λ r L r + λ e L e + λ a L a
where λ l o c , λ w , λ r , λ e , and λ a represent the weight coefficients of the five loss terms, respectively. Through the aforementioned training objective, the position fusion stage not only learns the relative contribution weights of candidate centers but also explicitly learns the residual correction from discrete tile centers to continuous true positions, thereby further improving the final meter-level localization accuracy under same-area settings based on the refined results.

3.4. Summary of Notation

To improve the readability of the Section 3, the main notation used in the proposed framework is summarized in Table 1.

4. Results

4.1. Experimental Datasets

To systematically validate the effectiveness of the proposed method in both synthetic continuous-area scenarios and real-world flight scenarios, this paper conducts experiments using the GTA-UAV and UAV-VisLoc datasets. Specifically, the GTA-UAV dataset is used to verify the method’s retrieval and localization capabilities under conditions of large-scale continuous areas, partial matching, and a multi-scale satellite reference database, while the UAV-VisLoc dataset is used to further evaluate the method’s generalization performance in real-world UAV aerial photography scenarios.

4.1.1. GTA-UAV Dataset

The GTA-UAV dataset, constructed in the Game4Loc benchmark [13] is a continuous-area benchmark dataset designed for UAV visual localization. Built on the Grand Theft Auto V simulation environment, the dataset covers a continuous area of approximately 81.3 km2 and comprises 33,763 UAV-perspective images, along with a reference database consisting of 14,640 satellite tiles. To accommodate the field-of-view variations caused by different UAV flight altitudes, GTA-UAV constructs a multi-scale satellite tile pyramid from the continuous satellite map. In this tiling scheme, the zoom level denotes the internal scale index used to crop satellite tiles at different ground coverage scales. Tiles from different zoom levels correspond to different ground footprints and ground sampling scales. Specifically, a higher zoom level corresponds to a smaller ground footprint and finer spatial detail, whereas a lower zoom level covers a larger ground area. In this paper, satellite tiles from zoom levels 4 to 7 are used to construct the reference database. Zoom levels 1 to 3 are not considered because their coarse spatial details and large ground footprints introduce excessive background information for the query field-of-view scale. Before being fed into the network, all query and satellite reference images are resized to 384 × 384 to standardize the network input size. The UAV images cover a variety of scenes, including urban areas, mountains, deserts, forests, fields, and coastlines, with flight altitudes ranging from approximately 80 m to 650 m. They also incorporate a range of roll, pitch, and yaw angle variations, thereby exhibiting strong scene and attitude diversity.
Unlike traditional datasets that use strict one-to-one matching, GTA-UAV adopts a partial matching approach that more closely resembles the real-world localization process. This dataset does not perform center-aligned matching between UAV and satellite images; instead, it pairs them based on the degree of overlap in the ground areas they cover. When the intersection-over-union (IoU) ratio exceeds 0.39, the pair is considered a positive sample; when it exceeds 0.14, it is classified as semi-positive. For each query image in GTA-UAV, the ground footprint is estimated by projecting the camera field of view onto the ground according to the recorded UAV position, flight altitude, field-of-view angle, and camera attitude. The query–reference relationship is then constructed by calculating the IoU between the estimated query ground footprint and the ground footprint of each satellite tile. For localization evaluation and position fusion, the UAV GNSS coordinate is used as the ground-truth location, and the offset between a query image and a candidate satellite tile is represented by the geographic displacement from the candidate tile center to the UAV GNSS location. In this construction, the UAV flight altitude, camera field-of-view angle, and camera attitude determine the estimated ground footprint of each query image, while the satellite zoom level determines the ground footprint and ground sampling scale of each reference tile. The overlap label is assigned in geographic space before network resizing by comparing the projected query footprint with the satellite tile footprint. Therefore, the 384 × 384 image size only standardizes the network input resolution and does not change the geographic overlap relationship used for sample pairing. This construction method ensures that a given UAV query image typically corresponds to multiple satellite candidates with varying degrees of overlap, better aligning with the application requirements of real-world continuous area localization.
Regarding the evaluation protocol, GTA-UAV includes two settings: same-area and cross-area. “Same-area” indicates that the training and test sets are distributed within the same region, and is primarily used to evaluate the method’s localization capability within a known flight area. “Cross-area” indicates that the training and test regions are geographically separated and feature different scene types, serving to assess the model’s generalization ability in unknown areas. This paper employs both settings on the GTA-UAV dataset, with same-area serving as the primary experimental scenario and cross-area as a supplementary generalization experiment.

4.1.2. UAV-VisLoc Dataset

UAV-VisLoc is a real-world UAV visual localization dataset primarily used to evaluate a model’s transferability and generalization performance on real-world data. The dataset contains 6742 aerial UAV images taken from a bird’s-eye view, all of which are GPS-tagged. The flight altitude ranges from approximately 400 m to 840 m, covering multiple continuous regions. Compared to simulated data, UAV-VisLoc more closely resembles real-world application environments in terms of imaging conditions, scene textures, lighting variations, and viewpoint perturbations, making it suitable as a test platform for verifying the practicality of algorithms.
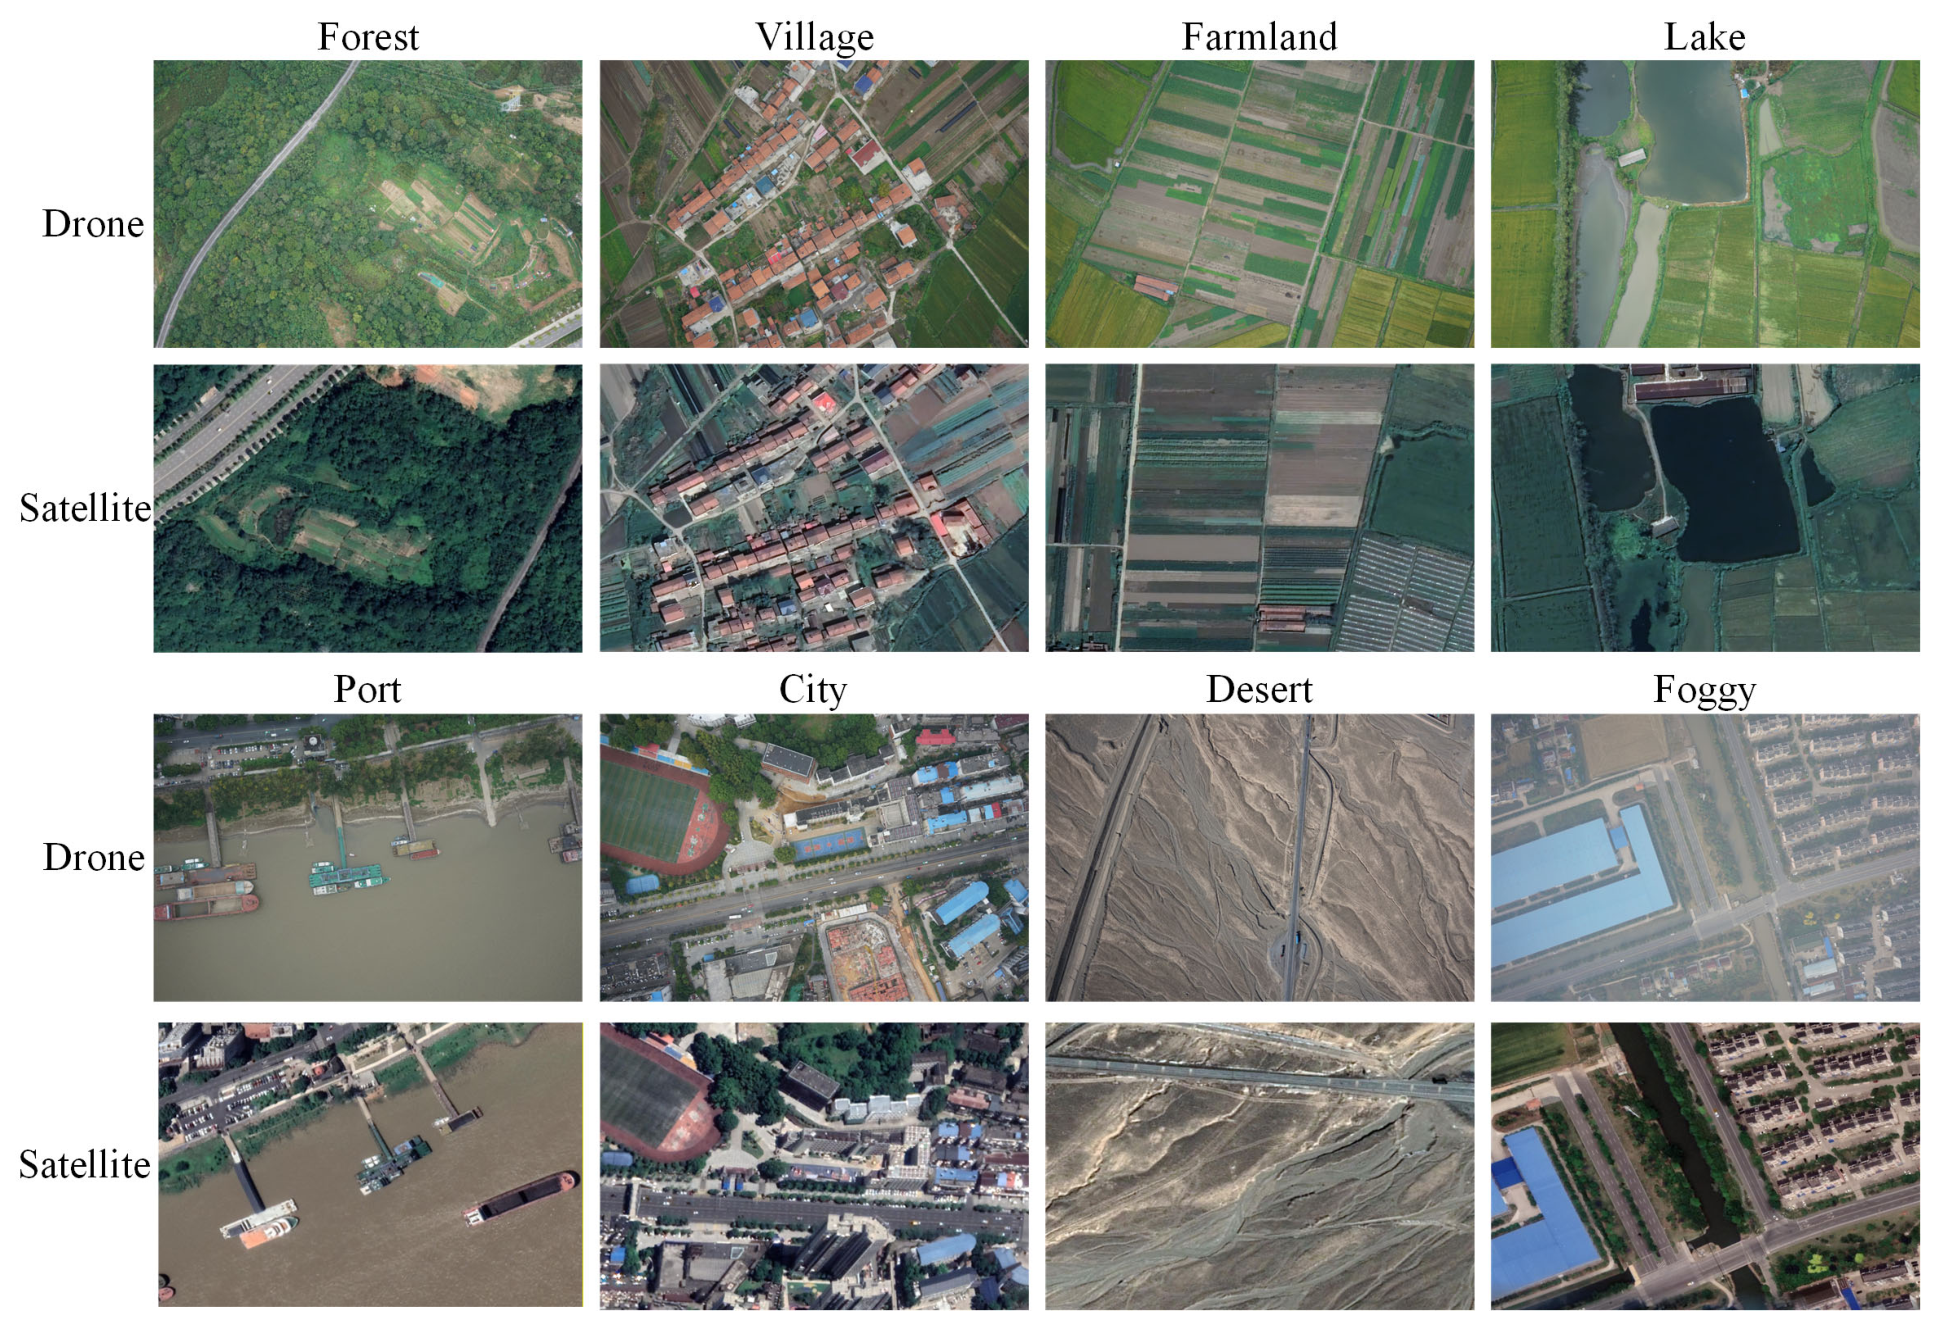
For UAV-VisLoc, the wide-area satellite images of each region are first converted into a searchable satellite reference tile database. Specifically, each regional satellite image is cropped into hierarchical multi-scale satellite tiles following the GTA-UAV tiling strategy, and each tile is assigned a geographic center and a ground footprint. The GPS coordinate of each UAV image is used as the localization ground truth. For a candidate satellite tile, the offset used in localization evaluation and position fusion is computed as the geographic displacement from the tile center to the UAV GPS location. Based on this preprocessing, UAV-VisLoc adopts a training and evaluation workflow consistent with GTA-UAV, conducting experiments under both same-area and cross-area protocols. Under the same-area protocol, the training and test samples are drawn from the same geographic region, allowing the method’s real-world in-region localization performance to be evaluated. Under the cross-area protocol, Changjiang-20 and Taizhou-1 are used as the training regions, while Changjiang-23 and Taizhou-6 are used as the test regions. This setting ensures that training and testing are conducted on geographically separated regional subsets, while the satellite tiling strategy, model configuration, and evaluation procedure remain unchanged. The two protocols are used to assess real-world in-region performance and generalization to unseen geographic regions, respectively. Figure 6 displays representative images from the UAV-VisLoc dataset.

4.2. Experimental Setup

To validate the effectiveness of the proposed method, this chapter conducts experiments based on the complete technical workflow of “global retrieval—token-level local matching reranking—neighborhood-consistent position fusion.” The experiments are primarily conducted on the GTA-UAV and UAV-VisLoc datasets.
The experimental platform runs on the Windows operating system, with hardware configured with an NVIDIA RTX 4090 GPU. The deep learning framework used is PyTorch 2.2.0, and the Python version is 3.8.20. The ViT-Base/16 architecture with 16 × 16 patch embedding and approximately 86 M parameters is uniformly adopted as the backbone network for global retrieval. The encoder is initialized with ImageNet-pretrained weights and is fully fine-tuned during global retrieval training. Both UAV and satellite images are resized to 384 × 384 before being fed into the network. For each dataset, the global retrieval backbone is trained on the corresponding training split using Weighted-InfoNCE and mutually exclusive sampling. During training, the batch size is set to 64. The Adam optimizer is used with an initial learning rate of 0.0001 and a cosine learning rate scheduler; the global retrieval model is trained for 20 epochs. For the efficiency analysis, online latency is measured with a batch size of 1 on an NVIDIA RTX 4090 GPU. Satellite reference descriptors are extracted offline. The GTA-UAV reference database contains 14,640 satellite tiles, and the reranking shortlist size is set to K = 100. Extra parameters are counted relative to the shared ViT-Base/16 global retrieval backbone. The hyperparameter k in Weighted-InfoNCE is set to 5 by default, and the learnable temperature parameter τ is initialized to 1. Flipping, rotation, and grid dropout are used as data augmentation during global retrieval training. Most training and structural hyperparameters are fixed across all datasets and evaluation protocols to ensure a controlled comparison. The two task-sensitive parameters, namely the reranking candidate pool size (K) and the LocFusion residual correction scale (S), are selected according to the parameter sensitivity analysis in Section 4.6. Other internal coefficients, such as the fusion-branch supervision weights, are fixed according to their functional roles and are not tuned separately for different test sets.To facilitate reproducibility, the numerical values of all key hyperparameters used in the proposed modules—including local matching capacity, margin constraints, spatial position fusion scales, and the balancing weights for all loss functions—are consolidated in Table 2.
To quantify the run-to-run variability of the main results, the GTA-UAV same-area and cross-area experiments reported in Table 3 and Table 4 were independently repeated five times using random seeds 40, 41, 42, 43, and 44. The dataset partitions, model configurations, training schedules, hyperparameters, and evaluation protocols were kept unchanged across runs. Results are reported as the mean ± standard deviation. R@1 was treated as the primary metric for statistical analysis, and its improvement was assessed using a two-sided paired t-test across matched random seeds, with p < 0.05 considered statistically significant. Because LocFusion refines candidate coordinates without changing candidate ranking, the paired comparison was performed between Global Retrieval and the complete reranking stage (+CL-LMM + Calibration) before LocFusion. Unless otherwise specified, the remaining comparative, ablation, sensitivity, efficiency, and UAV-VisLoc experiments are conducted under the default configuration with random seed 42, and are used as controlled diagnostic experiments to analyze module behavior and cross-dataset performance.
Regarding evaluation metrics, this paper evaluates the method using both retrieval and localization metrics. Retrieval performance is measured by Recall@K and Average Precision (AP). Recall@K represents the proportion of correct matches appearing among the top K candidates, which is a core metric for quantifying cross-view retrieval recall capability; a smaller K value indicates a higher requirement for retrieval precision. AP reflects the overall ranking quality of the candidate list, which provides a more comprehensive assessment of retrieval sorting performance than single-point recall metrics. Localization performance is evaluated using Spatial Distance Metric (SDM)@K and Dis@K. SDM@K is a comprehensive metric designed for continuous region localization tasks, which takes both retrieval matching correctness and position estimation accuracy into account, and is more aligned with practical UAV localization application requirements. Dis@K quantifies the spatial accuracy of localization results, with smaller values indicating higher localization accuracy. Specifically, Dis@1 is the Haversine geodesic distance between the top-ranked predicted coordinate and the ground-truth UAV geographic coordinate, and Dis@K is the average Haversine distance over the top K candidates. Before LocFusion, the candidate coordinate is represented by the satellite tile center; after LocFusion, it is represented by the refined coordinate estimate corresponding to the same candidate rank. The distance component used in SDM@K follows the same Haversine geodesic distance definition, and all distance errors are reported in meters.The specific values of all key hyperparameters used in the proposed modules are summarized in Table 2 for experimental reproducibility.

4.3. Main Experimental Results Across Multiple Scenarios

To comprehensively validate the effectiveness of the proposed method, this section conducts main experimental evaluations under two experimental settings: GTA-UAV same-area and GTA-UAV cross-area. Specifically, GTA-UAV same-area is used to test the method’s localization performance under conditions of a known flight area and a continuous satellite reference database, while GTA-UAV cross-area is used to evaluate the model’s domain generalization capability when the training and testing areas are separated.
The experimental results of the proposed method are reported step by step according to the complete processing pipeline, including the global retrieval baseline, results after incorporating candidate-level local matching modeling, results after further incorporating shortlist score calibration, and the final results of the complete system after incorporating neighborhood-consistent position fusion. It should be emphasized that all stages were evaluated using the same dataset partitions, global retrieval backbone, evaluation protocol, and five matched random seeds. Therefore, the reported mean ± standard deviation values directly reflect the effects of the individual post-retrieval stages under controlled experimental conditions.

4.3.1. GTA-UAV Same-Area Scenario Experiments

The GTA-UAV same-area scenario is the primary experimental setting in this paper. In this setup, the training and test sets are drawn from the same geographical area, allowing for a stable assessment of the model’s continuous area localization capability within a known flight zone. In this scenario, the satellite reference database consists of multi-scale tiles. Issues such as partial overlap, scale differences, and interference from adjacent tiles exist between the query image and the reference tiles. Therefore, the same-area experiment not only evaluates the candidate recall capability of the global retrieval model but also verifies the effectiveness of the post-retrieval stages in this paper for re-ranking high-confidence candidates and final coordinate correction. The experimental results are shown in Table 3.
Table 3. GTA-UAV same-area results over five independent runs.
MethodR@1 (%)R@5 (%)AP (%)SDM@1 (%)SDM@3 (%)Dis@1 (m)Dis@3 (m)
GlobalRetrieval85.18 ± 0.2397.61 ± 0.0990.50 ± 0.1590.17 ± 0.1288.95 ± 0.11145.85 ± 2.90177.20 ± 3.30
+CL-LMM87.45 ± 0.4498.49 ± 0.0892.04 ± 0.2391.25 ± 0.1690.01 ± 0.14140.95 ± 2.60169.40 ± 3.00
+CL-LMM
+Calibration
88.07 ± 0.61 98.77 ± 0.0792.38 ± 0.2591.47 ± 0.1889.69 ± 0.15139.30 ± 2.40167.95 ± 2.80
+CL-LMM + Calibration + LocFusion88.07 ± 0.6198.77 ± 0.0792.38 ± 0.2593.84 ± 0.1690.66 ± 0.1484.90 ± 2.30145.90 ± 2.70
Note: CL-LMM denotes Candidate-Level Local Matching Modeling, and Calibration denotes shortlist score calibration; together, they form the two sub-stages of the Token-Level Local Matching Reranking module. † Compared with Global Retrieval, the R@1 of +CL-LMM + Calibration was significantly higher according to a two-sided paired t-test across matched random seeds (t(4) = 16.23, p < 0.001). Because LocFusion does not modify candidate ranking, R@1, R@5, and AP remain unchanged after its introduction.
As shown in Table 3, across five independent runs under the GTA-UAV same-area setting, Global Retrieval achieves an R@1 of 85.18 ± 0.23 % , but its Dis@1 remains at 145.85 ± 2.90   m , indicating that relying solely on the Top-1 tile center still results in substantial localization bias. After incorporating CL-LMM, R@1 and AP increase to 87.45 ± 0.44 % and 92.04 ± 0.23 % , respectively, demonstrating that token-level local matching reranking improves the ranking quality of top candidates. After further introducing shortlist score calibration, R@1 and AP increase to 88.07 ± 0.61 % and 92.38 ± 0.25 % , respectively. Compared with Global Retrieval, the complete reranking stage therefore provides an average R@1 improvement of 2.89 percentage points. A two-sided paired t-test across matched random seeds confirms that this improvement is statistically significant ( t 4 = 16.23 , p < 0.001 ; 95% CI: [2.40, 3.38] percentage points). Finally, after incorporating LocFusion, SDM@1 increases from 91.47 ± 0.18 % to 93.84 ± 0.16 % while Dis@1 decreases from 139.30 ± 2.40   m to 84.90 ± 2.30   m . Notably, Dis@3 remains consistently larger than Dis@1, whereas SDM@1 remains consistently higher than SDM@3 across all stages in Table 3. Dis@3 averages the distance errors of the top three ranked candidates, whereas SDM@3 aggregates their localization quality. Since the second- and third-ranked candidates typically exhibit weaker matching quality and larger localization errors than the top-ranked candidate, averaging over the top three increases Dis@3 and decreases SDM@3. Overall, the complete method achieves an average R@1 gain of 2.89 percentage points and an average Dis@1 reduction of 60.95 m relative to Global Retrieval, demonstrating a reproducible ranking improvement together with effective continuous coordinate refinement.

4.3.2. GTA-UAV Cross-Area Scene Experiments

To further validate the generalization capability of the proposed method in unknown regions, this section conducts experiments under the cross-area setting of GTA-UAV. Unlike the same-area scenario, the cross-area setting separates the training and testing regions, and the two regions differ in scene types and terrain distributions. Therefore, this setting better reflects the model’s robustness in unseen regions. The original Game4Loc study also adopts the cross-area setting on GTA-UAV as a key protocol for evaluating a model’s cross-area generalization capability, where the training and test data originate from different regions and contain different scene distributions. The experimental results are shown in Table 4.
Table 4. GTA-UAV cross-area results over five independent runs.
MethodR@1 (%)R@5 (%)AP (%)SDM@1 (%)SDM@3 (%)Dis@1 (m)Dis@3 (m)
GlobalRetrieval57.82 ± 0.4383.80 ± 0.2868.68 ± 0.3581.55 ± 0.2475.70 ± 0.26340.20 ± 9.20507.10 ± 11.20
+CL-LMM58.96 ± 0.7083.86 ± 0.3069.40 ± 0.4381.72 ± 0.2775.75 ± 0.28322.10 ± 8.70500.40 ± 10.60
+CL-LMM
+Calibration
59.17 ± 0.82 83.87 ± 0.3169.57 ± 0.4681.78 ± 0.2875.71 ± 0.29316.10 ± 8.30512.00 ± 10.90
+CL-LMM + Calibration + LocFusion59.17 ± 0.8283.87 ± 0.3169.57 ± 0.4683.48 ± 0.3176.82 ± 0.30244.00 ± 7.20464.50 ± 9.50
Note: CL-LMM denotes Candidate-Level Local Matching Modeling, and Calibration denotes shortlist score calibration; together, they form the two sub-stages of the Token-Level Local Matching Reranking module. † Compared with Global Retrieval, the R@1 of +CL-LMM + Calibration was significantly higher according to a two-sided paired t-test across matched random seeds (t(4) = 5.95, p = 0.004). Because LocFusion does not modify candidate ranking, R@1, R@5, and AP remain unchanged after its introduction.
As shown in Table 4, the cross-area setting yields lower retrieval accuracy and larger localization errors than the same-area setting. Across five independent runs, Global Retrieval achieves an R@1 of 57.82 ± 0.43 % , whereas the complete reranking stage comprising CL-LMM and shortlist score calibration achieved 59.17 ± 0.82 % , corresponding to an average improvement of 1.35 percentage points. A two-sided paired t-test across matched random seeds showed that the improvement was statistically significant ( t 4 = 5.95 , p = 0.004 ; 95% CI: [0.72, 1.98] percentage points). LocFusion successfully reduces Dis@1 from 316.10 ± 8.30   m to 244.00 ± 7.20   m . These results demonstrate that the proposed reranking stage retains a reproducible R@1 advantage under the more challenging cross-area protocol, while LocFusion consistently reduces localization error.

4.4. Comparative Experiments

To further evaluate the proposed framework from the perspectives of global retrieval, post-retrieval reranking, and localization refinement, this section reports three groups of comparative experiments. The first group compares different backbone networks and loss settings under the same GTA-UAV same-area protocol. The second group directly compares the proposed reranking stage with adapted post-retrieval reranking baselines under a unified Top-100 UAV-to-satellite candidate interface. The third group compares LocFusion with adapted localization refinement strategies and internal LocFusion variants to verify the effectiveness of candidate-set-level coordinate refinement.

4.4.1. Backbone and Loss Comparison

To further evaluate the performance of the proposed method under the GTA-UAV same-area setting, this section compares various combinations of mainstream visual backbone networks and training strategies. All methods included in the comparison use exactly the same dataset split, identical training and testing regions, and a unified evaluation protocol to ensure the fairness and comparability of the results. The comparison covers a wide range of backbone choices, from classic convolutional networks to Transformer architectures, including ResNet-101, SwinV2-Base, ConvNeXt-Base, and ViT-Base/16. The training loss functions include the standard contrastive learning metric InfoNCE and the Weighted-InfoNCE, which incorporates partial-match soft supervision. The complete method proposed in this paper builds upon the ViT-Base retrieval backbone and the Weighted-InfoNCE training strategy by further incorporating a token-level local matching reranking module and a neighborhood-consistent position fusion module. All results in Table 5 are reported under the GTA-UAV same-area setting.
As shown in Table 5, under the same dataset and evaluation protocol, the weighted contrastive learning method based on ResNet-101 exhibits lower retrieval accuracy and a localization error as high as 371.78 m, indicating that traditional CNN backbones have significant limitations in continuous-region cross-view partial matching tasks. After replacing the backbone with ViT-Base/16, even when using only the standard InfoNCE loss, R@1 improves to 65.89% and Dis@1 decreases to 196.59 m. When the loss was changed from InfoNCE to Weighted-InfoNCE on the same ViT-Base/16 backbone, R@1 further increases to 85.23%, AP reaches 90.52%, and Dis@1 decreases to 145.64 m, making ViT-Base/16 + Weighted-InfoNCE the global retrieval baseline used in the subsequent modules. SwinV2-Base and ConvNeXt-Base also achieve strong performance under the same loss function, but their overall performance remains slightly below that of ViT-Base/16. In contrast, the complete method proposed in this paper further improves R@1 by 2.90 percentage points, AP by 1.89 percentage points, and SDM@3 by 1.72 percentage points, while reducing Dis@1 by 61.14 m. The above results indicate that while relying solely on the optimization of the retrieval backbone and loss function can yield decent baseline performance, there is still significant room for improvement in the fine-grained ranking of top candidates and the suppression of center deviation in discrete tiles. The token-level local matching reranking and neighborhood-consistent position fusion strategies proposed in this paper fully leverage local matching evidence among high-confidence candidates and the consistency of the neighborhood space. This effectively enhances ranking stability and significantly reduces the final localization error, validating the effectiveness and superiority of our method in continuous-area UAV visual localization tasks. However, Table 5 mainly evaluates the influence of global retrieval backbones and training losses. To more directly assess the proposed post-retrieval design, we further compare it with adapted reranking baselines in the following subsection. Since the subsequent CL-LMM stage relies on local patch-token features and normalized token coordinates, the full post-retrieval pipeline is implemented and evaluated on the ViT-Base/16 retrieval backbone, while the cross-backbone comparison in Table 5 is used to identify a strong and controlled global retrieval foundation.

4.4.2. Comparison with Adapted Post-Retrieval Reranking Methods

To directly compare the proposed reranking stage with existing reranking strategies, we further adapt representative reranking mechanisms to the unified Top-100 UAV-to-satellite candidate interface. Since the original R2Former and LOCORE were designed under different retrieval settings, we do not directly transfer their full pipelines. Instead, we adapt only their reranking mechanisms while keeping the same ViT-Base/16 + Weighted-InfoNCE global retrieval checkpoint, the same 384 × 384 input resolution, and the same Top-100 candidate lists for all methods. The k-reciprocal Re-ranking baseline performs reciprocal-neighbor refinement in the global descriptor space. The R2Former-adapted baseline uses pairwise local-token correlation, attention-based matching evidence, and token coordinates to score each query-candidate pair. The LOCORE-adapted baseline follows a listwise local-descriptor reranking manner: it takes the query local descriptors and the whole gallery shortlist as input and outputs the similarity between the query and each gallery candidate. For fairness, all adapted methods use the local tokens cached from our ViT-Base/16 backbone rather than external local features. Reranking-only methods estimate the final location using the center of the top-ranked satellite tile, whereas the final row additionally applies LocFusion for coordinate refinement.
As shown in Table 6, k-reciprocal re-ranking does not improve the Global Retrieval baseline and slightly degrades R@1 from 85.23% to 84.68% and Dis@1 from 145.64 m to 156.80 m. This indicates that reciprocal-neighbor relationships in the global descriptor space are not always consistent with strict geographic positives in continuous-area UAV localization. In particular, visually similar adjacent tiles or cross-scale tiles may reinforce each other in descriptor space, even though they are not necessarily strict positives under the geographic-overlap definition. R2Former-adapted and LOCORE-adapted variants bring moderate improvements by exploiting pairwise local-token interactions or listwise local-descriptor information. Specifically, R2Former-adapted improves R@1 to 85.74%, while LOCORE-adapted further improves R@1 to 86.08% and reduces Dis@1 to 144.35 m. However, in this single-seed evaluation, both adapted methods exhibit lower performance compared to the proposed CL-LMM with calibration, which achieves an R@1 of 88.13%, an AP of 92.41%, and a Dis@1 of 138.96 m. This suggests that the GTA-UAV continuous-area localization task can benefit from explicitly modeling token-level matching evidence, strict-positive tendency, multi-scale candidate structural priors, and shortlist score calibration. The above comparison focuses on candidate ranking. Since LocFusion does not modify the ranked candidate order, we further evaluate the coordinate-refinement stage separately by comparing it with adapted localization refinement strategies under the same reranked shortlist.

4.4.3. Comparison with Adapted Localization Refinement Strategies

To further compare LocFusion with existing localization refinement strategies, we evaluate three representative methods under a unified post-reranking setting: SliceMatch-adapted, HC-Net-adapted, and GLVL-adapted. All methods are evaluated after the same CL-LMM + Calibration shortlist and use the same global retrieval backbone, candidate list, and evaluation metrics. Therefore, ranking metrics such as R@1, R@5, and AP remain unchanged across all rows and are omitted for compactness. For pairwise refinement methods, coordinate refinement is applied to each of the top-ranked candidates independently when computing Dis@K and SDM@K. “Adapted” indicates that the original localization refinement strategy is implemented under our unified Top-K UAV-to-satellite candidate interface, rather than using its original retrieval backbone or dataset setting.
As shown in Table 7, all adapted localization refinement methods reduce the tile-center localization error compared with directly using the Top-1 tile center after CL-LMM + Calibration. The SliceMatch-adapted strategy reduces Dis@1 from 138.96 m to 113.80 m by introducing geometry-guided pose refinement, while HC-Net-adapted variant further reduces Dis@1 to 107.60 m through homography-based coordinate refinement. GLVL-adapted achieves the best performance among the external baselines, with an SDM@1 of 93.06% and a Dis@1 of 101.40 m, because its global-local fine-grained matching design is closer to the UAV visual localization setting. However, these adapted methods mainly refine individual query–candidate pairs and do not explicitly exploit the spatial distribution and neighborhood consistency among multiple high-confidence candidates. In contrast, LocFusion performs candidate-set-level coordinate refinement by jointly modeling candidate confidence, same-scale adjacency, cross-scale relationships, learned candidate weights, and residual correction. The two internal variants further demonstrate the contribution of both branches. Removing the residual head increases Dis@1 to 98.80 m, while removing the weight head increases Dis@1 to 102.30 m. The full LocFusion module yields the most favorable performance in this single run, increasing SDM@1 to 93.88% and reducing Dis@1 to 84.50 m. These results suggest that the improvement of LocFusion comes from candidate-set-level spatial modeling and the complementary use of learned weighting and residual correction, rather than from pairwise coordinate refinement alone.

4.5. Ablation and Efficiency Analysis

To validate the contribution of each candidate-level discrimination branch and examine the computational overhead of the proposed modules, we conduct an ablation and efficiency analysis under the GTA-UAV same-area setting. The ablation starts from the Global Retrieval baseline and progressively adds the local matching head, strict-positive head, prior branch, candidate-level fusion head, shortlist score calibration, and LocFusion. The four heads before calibration belong to the CL-LMM stage. Extra parameters are counted relative to the shared ViT-Base/16 global retrieval backbone, and online latency includes the enabled modules in each configuration. Satellite reference descriptors are extracted offline, and the online reranking stage only operates on the Top-100 candidate shortlist.
To validate the structural components and systematically examine the computational overhead of the proposed modules, we conduct an ablation and efficiency analysis under the GTA-UAV same-area setting. As shown in Table 8, while each distinct component within the post-retrieval pipeline progressively improves retrieval precision and spatial accuracy, the framework maintains an exceptionally tight and manageable computational budget. In terms of parameter scaling, the full method introduces a total of 1.72 M extra parameters relative to the 86 M shared ViT-Base/16 backbone. This represents a lightweight increase of only 2.0%, demonstrating high parameter efficiency that is well-suited for deployment. Regarding resource consumption, the entire post-retrieval execution requires an online latency of 38.3 ms per query and maintains a peak memory footprint of 2.67 GB, successfully adhering to the real-time constraints required for practical UAV onboard applications. Profiling the precise computational breakdown reveals that the primary time bottleneck resides in the initial token-level local matching (+Matching head only), which accounts for the largest latency leap from 13.1 ms to 35.6 ms (+22.5 ms) due to the dense cross-attention operations across the Top-100 candidates. In sharp contrast, the subsequent components introduce minimal marginal overhead. Specifically, the introduction of strict-positive and prior branches requires negligible processing increments. Furthermore, the Shortlist Score Calibration and the LocFusion modules require only a minor latency increase of 1.0 ms (from 36.6 ms to 37.6 ms) and 0.7 ms (from 37.6 ms to 38.3 ms), respectively. This firmly demonstrates that our framework successfully concentrates heavy computation on crucial local evidence extraction while keeping the downstream calibration and coordinate refinement stages highly streamlined.

4.6. Parameter Sensitivity Analysis

To analyze the impact of key hyperparameters on the performance of the proposed post-processing framework, this section conducts parameter sensitivity experiments on the GTA-UAV same-area scenario. The hyperparameters in our method primarily operate in two stages: first, the candidate pool size K in the token-level local matching reranking and shortlist score calibration stage—this parameter determines the number of candidates entering the token-level local matching reranking process; second, the residual correction scale S in the neighborhood-consistent position fusion stage—this parameter controls the magnitude of residual offset correction applied to the predicted coordinates by the position fusion module. The former mainly affects candidate coverage and ranking stability, while the latter mainly affects the correction capability of the final coordinate estimate. By analyzing these parameters, we can further validate the rationality of the default parameter settings in this paper.

4.6.1. Sensitivity Analysis of Reranking Candidate Pool Size

In the token-level local matching reranking stage, the candidate pool size K directly influences two factors. On the one hand, a larger K increases the probability that true positive candidates enter the reranking stage, providing more comprehensive candidate context for token-level local matching reranking. On the other hand, an excessively large K introduces more low-relevance or highly interfering candidates while also increasing computational overhead. Therefore, it is necessary to analyze the changes in retrieval performance and localization error under different values of K. It should be noted that the sensitivity analysis in this section focuses solely on the token-level local matching reranking module and does not include neighborhood-consistent position fusion, in order to examine the sensitivity of the reranking stage to the candidate pool size in isolation. The experimental results are shown in Table 9.
As shown in Table 9, as the candidate pool size K increases from 20 to 100, R@1 improves by 0.35 percentage points, AP improves by 0.93 percentage points, SDM@1 improves by 0.24 percentage points, and Dis@1 decreases by 2.89 m. This indicates that allowing more correct candidates to enter the reranking stage can continuously improve sorting and localization performance. When K is further increased to 150 or 200, R@1 decreases by 0.03 percentage points and 0.08 percentage points, respectively, and both AP and Dis@1 show slight degradation. This indicates that an excessively large candidate pool introduces more similar, interfering candidates, thereby weakening the stability of the internal ranking within the shortlist. Balancing performance and computational overhead, this paper adopts (K = 100) as the default candidate pool size.

4.6.2. Parameter Sensitivity of the LocFusion Residual Correction Scale

The neighborhood-consistent position fusion module further introduces a learnable residual term based on the weighted fusion of candidate centers to mitigate the offset between the discrete tile centers and the actual UAV position. The residual scale S is used to control the range of residual correction. When S is too small, the model lacks sufficient compensation capacity for coordinate deviations, leading to under-correction. When S is too large, the range of residual correction becomes too broad, potentially causing the predicted position to deviate from the local candidate support region, resulting in overcorrection. Therefore, this paper conducts sensitivity experiments on different residual scales S under the GTA-UAV same-area scenario. Since neighborhood-consistent position fusion does not alter the retrieval ranking but only corrects the final coordinates, this section reports only the SDM and distance error metrics. The experimental results are shown in Table 10.
As shown in Table 10, after introducing neighborhood-consistent position fusion, the residual scales for each group are significantly better than the results without position fusion, indicating that coordinate residual correction plays a significant role in reducing localization errors caused by discrete tile centers. As S increases from 10 to 40, SDM@1 improves by 1.02 percentage points and Dis@1 decreases by 10.82 m, indicating that appropriately increasing the residual scale enhances the model’s ability to correct for positional deviations. The model achieves optimal results when (S = 40). Upon further increasing S to 50, 60, and 80, the localization error begins to rise again, with SDM@1 decreasing by 0.07%, 0.32%, and 1.00%, and Dis@1 increasing by 0.54 m, 3.18 m, and 10.16 m, respectively. This indicates that an excessively large residual range introduces the risk of overcorrection and weakens the stability of local candidate space constraints. Therefore, this paper adopts (S = 40) as the default residual scale for neighborhood-consistent position fusion.

4.7. Generalization Experiments on the UAV-VisLoc Dataset

To further evaluate the applicability and regional generalization capability of the proposed method on real-world UAV flight data, this section reports both same-area and cross-area experiments on UAV-VisLoc. Unlike the GTA-UAV simulation data, UAV-VisLoc contains real downward-looking UAV images collected across multiple regions, terrain types, and flight altitudes. It therefore introduces more complex illumination variations, local appearance changes, and regional scene differences. The same-area protocol evaluates localization performance within known regions, whereas the cross-area protocol evaluates generalization to geographically unseen regions.

4.7.1. UAV-VisLoc Same-Area Results

The experimental results under the UAV-VisLoc same-area protocol are shown in Table 11.
As shown in Table 11, under the UAV-VisLoc real-world dataset, both the R@1 and localization accuracy of global retrieval are affected by imaging variations and scene complexity in the real-world flight data. After incorporating CL-LMM, R@1 improves by 2.53 percentage points, AP improves by 1.76 percentage points, and Dis@1 decreases by 23.24 m, indicating that token-level local matching reranking can also improve the quality of top candidate rankings on real-world data. After further incorporating score calibration, R@1 and AP further improve by 0.50 percentage points and 0.31 percentage points, respectively, and Dis@1 further decreases by 2.11 m. Finally, after incorporating LocFusion, the retrieval metrics remain stable, while SDM@1 improves by 1.26 percentage points and Dis@1 further decreases by 14.18 m. It is also observed that SDM@3 does not further increase after score calibration and LocFusion. This is because shortlist score calibration mainly improves the confidence ordering of the top-ranked candidate, while SDM@3 averages the localization quality over the top three candidates and is more sensitive to spatially dispersed secondary candidates in real-world scenes. In addition, LocFusion refines the coordinate estimates without changing the retrieval order. Therefore, its effect is more directly reflected in SDM@1, Dis@1, and Dis@3, while SDM@3 remains close to the result obtained by CL-LMM. Overall, the complete method improves R@1 by 3.03 percentage points, AP by 2.07 percentage points, and reduces Dis@1 by 39.53 m, indicating that the proposed framework improves top-ranked candidate reliability and coordinate estimation accuracy on real-world UAV visual localization data.

4.7.2. UAV-VisLoc Cross-Area Results

To further examine the generalization capability of the proposed method across geographically separated real-world regions, we conduct an additional cross-area experiment on UAV-VisLoc. In this protocol, Changjiang-20 and Taizhou-1 are used for training, while Changjiang-23 and Taizhou-6 are used for testing. The training and test regions are geographically separated, whereas the satellite image preprocessing, model architecture, training configuration, and evaluation metrics remain consistent with those used in the same-area experiment. The experimental results are shown in Table 12.
As shown in Table 12, the UAV-VisLoc cross-area setting with Changjiang-20 and Taizhou-1 for training and Changjiang-23 and Taizhou-6 for testing is substantially more challenging than the same-area setting. Global Retrieval achieves an R@1 of 43.18% and a Dis@1 of 965.40 m, indicating that geographically separated training and test regions introduce a pronounced generalization gap. After incorporating CL-LMM, R@1 and AP increase by 1.28 and 0.82 percentage points, respectively, while Dis@1 decreases by 70.10 m. Shortlist score calibration further increases R@1 to 44.66% and AP to 53.64%, and reduces Dis@1 to 872.80 m. Meanwhile, SDM@3 decreases slightly from 54.68% to 54.41%, and Dis@3 increases from 1284.60 m to 1301.50 m. This behavior is consistent with the same-area observation that score calibration mainly improves the confidence ordering of the top-ranked candidate and does not necessarily produce monotonic improvements in all averaged top-3 metrics. Finally, LocFusion leaves the retrieval metrics unchanged but increases SDM@1 from 64.58% to 65.92% and SDM@3 from 54.41% to 55.36%, while reducing Dis@1 from 872.80 m to 768.50 m and Dis@3 from 1301.50 m to 1216.40 m. Overall, compared with Global Retrieval, the complete method improves R@1 by 1.48 percentage points and AP by 0.99 percentage points, while reducing Dis@1 by 196.90 m and Dis@3 by 119.80 m. These results show that the proposed post-retrieval stages retain a measurable performance advantage in unseen regions. Nevertheless, the remaining absolute localization errors indicate that cross-area generalization on real-world UAV data remains a major challenge.

5. Discussion

The experimental results confirm our hypothesis that explicit modeling of local matching evidence and neighborhood spatial consistency can improve ranking stability and reduce the coordinate bias of discrete tile centers. Under the GTA-UAV same-area setting, Global Retrieval achieves an average R@1 of 85.18 ± 0.23 % and an average Dis@1 of 145.85 ± 2.90   m , indicating that image-level retrieval alone does not guarantee accurate coordinate estimation. The complete reranking stage increases R@1 to 88.07 ± 0.61 % and reduces Dis@1 to 139.30 ± 2.40   m , while LocFusion further reduces Dis@1 to 84.90 ± 2.30   m without modifying the candidate ranking. In the UAV-VisLoc real-world setting, the complete method improves R@1 from 80.30% to 83.33% and reduces Dis@1 from 169.00 m to 129.47 m, further indicating its robust effectiveness on real-world UAV flight data. The remaining Dis@1 gap between UAV-VisLoc and GTA-UAV can mainly be attributed to real-flight imaging variations, illumination and texture changes, GPS noise, differences in satellite-tile resolution, and greater regional scene complexity in real-world UAV data. Furthermore, the ablation and efficiency analysis confirms that these cumulative gains stem from the complementary integration of all proposed branches. The full framework adds only 1.72 M parameters relative to the shared ViT-Base/16 backbone and reports an online latency of just 38.3 ms (batch size 1) on an RTX 4090. Since satellite descriptors are extracted offline, this low-latency execution is bounded purely by the Top-100 shortlist size rather than the full satellite database. Regarding cross-area generalization, we observe an asymmetry in the performance gains between the same-area and cross-area settings. Specifically, the R@1 improvements outside the training regions (1.35 percentage points on GTA-UAV and 1.48 on UAV-VisLoc) are approximately half as large as those under the same-area settings. This asymmetry suggests that the extent of the refinement benefit is correlated with the quality of the initial candidate pool retrieved by the global backbone. In cross-area scenarios, domain shifts can degrade the initial recall, leading to fewer strong local candidates entering the Top-K shortlist. While the proposed post-retrieval modules still provide consistent improvements in unseen regions, this observation indicates that their potential is more fully realized when the global retrieval stage initially recalls a robust spatial neighborhood. Therefore, further bridging the generalization gap in the global retrieval stage remains an essential prerequisite for advancing cross-area localization systems.
These findings align with the broader shift from pure retrieval to retrieval-plus-pose-estimation paradigms, which structurally decouple coarse ranking from fine-grained coordinate prediction. Within this context, LocFusion functions as a candidate-set-level coordinate refinement step rather than a replacement for pairwise image registration. While pairwise registration methods estimate geometric correspondences or coordinate offsets for a specific query-candidate pair, LocFusion explicitly exploits the spatial distribution, confidence scores, same-scale adjacency, and cross-scale relationships among multiple retrieved tiles. The comparison with SliceMatch-adapted, HC-Net-adapted, and GLVL-adapted further supports this distinction. In this single-run comparison, these adapted pairwise refinement methods reduce the localization error compared with the Top-1 tile center baseline, but they remain inferior to the full LocFusion because they do not explicitly model candidate-set-level neighborhood consistency. Therefore, pairwise refinement and LocFusion address different levels of the localization pipeline and can be regarded as complementary. Regarding the choice of the global retrieval backbone, this work adopts a standard ViT-Base/16 framework to isolate the performance gains of the proposed post-retrieval modules. However, the proposed pipeline is inherently flexible. Since our modules take the Top-$K$ candidate set as input, they can be readily integrated with advanced retrieval backbones—including semantic-aware models, multi-source vector map fusion networks, or even CNN-based and hybrid architectures through simple feature reshaping—to further improve both the recall capability and final localization accuracy.
While the proposed method demonstrates strong performance, it is primarily designed for medium-to-high altitude UAV visual localization under near-nadir viewing conditions. This aligns with the data coverage of the two adopted datasets: the GTA-UAV dataset covers flight altitudes of 80–650 m, and the UAV-VisLoc dataset covers real-flight altitudes of 400–840 m. Under this setting, the cross-view correspondence with satellite orthophotos can be safely approximated as a 2D planar transformation. However, when applied to very low-altitude urban flights and oblique UAV views, query images often contain large proportions of building facades, severe perspective distortions, and frequent occlusions, which break the near-orthogonal assumption. Exploring dedicated modeling for these scenarios—such as incorporating explicit 6-DoF pose estimation, 2.5D elevation-aware reference information, or adapting specialized protocols like DenseUAV [10]—represents an important direction for our future work. To place the neighborhood consistency assumption of LocFusion on firmer empirical ground, we further analyzed the spatial distribution of the Top-5 high-confidence candidates using 500 randomly sampled GTA-UAV test queries under the same-area setting. We define a single spatially coherent cluster as a case in which the Top-5 candidates are spatially compact, with all candidate locations falling within a 300 m radius. Under this criterion, 432 out of 500 queries (86.4%) form a single spatially coherent cluster. This result indicates that the neighborhood assumption underlying LocFusion holds for the majority of test queries. Additionally, the single-anchor fusion strategy can be further optimized for highly ambiguous scenes. When the shortlist contains multiple geographically separated high-confidence clusters due to repeated urban patterns, the fused position may naturally be biased toward the selected local support region. Future work should explore multi-anchor hypothesis fusion, uncertainty-aware cluster selection, stronger view-invariant local descriptors, and temporal consistency across consecutive UAV frames to fully handle severely multimodal candidate distributions.

6. Conclusions

This paper addresses the issues of unstable high-confidence candidate ranking and significant positioning errors caused by discrete tile centers in UAV visual localization. We propose a comprehensive localization framework consisting of three components: global retrieval, token-level local matching reranking, and neighborhood-consistent position fusion. First, the global retrieval module efficiently retrieves a set of high-confidence candidates from a large-scale satellite reference database. Second, the token-level local matching reranking module utilizes local matching evidence and candidate structural priors to perform fine-grained reranking of top candidates, enhancing ranking stability. Finally, the neighborhood-consistent position fusion module adaptively fuses position coordinates and performs residual correction by considering the spatial distribution and confidence relationships among multiple candidates, thereby mitigating the discretization bias caused by directly using a single tile center. Experiments under both same-area and cross-area protocols on GTA-UAV and UAV-VisLoc demonstrate that the Token-Level Local Matching Reranking module improves the ranking reliability of top candidates, while the Neighborhood-Consistent Position Fusion module reduces the final localization error through candidate-set-level coordinate refinement. The ablation and efficiency analysis further show that the proposed branches, Shortlist Score Calibration, and LocFusion contribute cumulatively while introducing minimal parameter increments and strictly bounded online latency. Additional comparisons with adapted localization refinement methods show that LocFusion outperforms pairwise coordinate-refinement baselines by explicitly modeling candidate-set-level neighborhood consistency and combining learned weighting with residual correction. Overall, our method achieves stepwise optimization from global candidate retrieval, token-level local matching reranking, to continuous coordinate fusion, providing an effective end-to-end solution for UAV visual localization in continuous areas.

Author Contributions

Conceptualization, J.L. and Y.L.; methodology, J.L.; software, J.L.; validation, J.L., Q.L. and D.X.; formal analysis, J.L.; investigation, J.L.; resources, Y.L., D.X. and T.W.; data curation, J.L.; writing—original draft preparation, J.L.; writing—review and editing, Y.L., Q.L. and T.W.; visualization, J.L.; supervision, Y.L.; project administration, Y.L.; funding acquisition, Y.L. All authors have read and agreed to the published version of the manuscript.

Funding

This research was funded by the Department of Science and Technology of Jilin Province, grant number 20260201086GX.

Data Availability Statement

The raw data supporting the findings of this study are openly available from the UAV-VisLoc dataset at https://github.com/IntelliSensing/UAV-VisLoc (accessed on 5 August 2025) and the GTA-UAV dataset at https://github.com/Yux1angJi/GTA-UAV (accessed on 5 August 2025). The derived results generated during the study are available within the article.

Conflicts of Interest

The authors declare no conflicts of interest. The funders had no role in the design of the study; in the collection, analyses, or interpretation of data; in the writing of the manuscript; or in the decision to publish the results.

References

  1. Workman, S.; Souvenir, R.; Jacobs, N. Wide-Area Image Geolocalization with Aerial Reference Imagery. In Proceedings of the 2015 IEEE International Conference on Computer Vision (ICCV), Santiago, Chile, 7–13 December 2015; pp. 3961–3969. [Google Scholar] [CrossRef] [Scilit]
  2. Tian, Y.; Chen, C.; Shah, M. Cross-View Image Matching for Geo-Localization in Urban Environments. In Proceedings of the 2017 IEEE Conference on Computer Vision and Pattern Recognition (CVPR), Honolulu, HI, USA, 21–26 July 2017; pp. 1998–2006. [Google Scholar] [CrossRef] [Scilit]
  3. Hu, S.; Feng, M.; Nguyen, R.M.H.; Lee, G.H. CVM-Net: Cross-View Matching Network for Image-Based Ground-to-Aerial Geo-Localization. In Proceedings of the 2018 IEEE/CVF Conference on Computer Vision and Pattern Recognition, Salt Lake City, UT, USA, 18–22 June 2018; pp. 7258–7267. [Google Scholar] [CrossRef] [Scilit]
  4. Zhu, S.; Shah, M.; Chen, C. TransGeo: Transformer Is All You Need for Cross-View Image Geo-Localization. In Proceedings of the 2022 IEEE/CVF Conference on Computer Vision and Pattern Recognition (CVPR), New Orleans, LA, USA, 18–24 June 2022; pp. 1152–1161. [Google Scholar]
  5. Deuser, F.; Habel, K.; Oswald, N. Sample4Geo: Hard Negative Sampling For Cross-View Geo-Localisation. In Proceedings of the 2023 IEEE/CVF International Conference on Computer Vision (ICCV), Paris, France, 2–6 October 2023; pp. 16847–16856. [Google Scholar]
  6. Zhu, S.; Yang, L.; Chen, C.; Shah, M.; Shen, X.; Wang, H. R2Former: Unified Retrieval and Reranking Transformer for Place Recognition. In Proceedings of the 2023 IEEE/CVF Conference on Computer Vision and Pattern Recognition (CVPR), Vancouver, BC, Canada, 17–24 June 2023; pp. 19370–19380. [Google Scholar]
  7. Toker, A.; Zhou, Q.; Maximov, M.; Leal-Taixe, L. Coming Down to Earth: Satellite-to-Street View Synthesis for Geo-Localization. In Proceedings of the 2021 IEEE/CVF Conference on Computer Vision and Pattern Recognition (CVPR), Nashville, TN, USA, 20–25 June 2021; pp. 6488–6497. [Google Scholar] [CrossRef] [Scilit]
  8. Shi, Y.; Wu, F.; Perincherry, A.; Vora, A.; Li, H. Boosting 3-DoF Ground-to-Satellite Camera Localization Accuracy via Geometry-Guided Cross-View Transformer. In Proceedings of the 2023 IEEE/CVF International Conference on Computer Vision (ICCV), Paris, France, 2–6 October 2023; pp. 21516–21526. [Google Scholar] [CrossRef] [Scilit]
  9. Zheng, Z.; Wei, Y.; Yang, Y. University-1652: A Multi-View Multi-Source Benchmark for Drone-Based Geo-Localization. In Proceedings of the 28th ACM International Conference on Multimedia, Seattle, WA, USA, 12–16 October 2020; pp. 1395–1403. [Google Scholar] [CrossRef] [Scilit]
  10. Dai, M.; Zheng, E.; Feng, Z.; Qi, L.; Zhuang, J.; Yang, W. Vision-Based UAV Self-Positioning in Low-Altitude Urban Environments. IEEE Trans. Image Process. 2024, 33, 493–508. [Google Scholar] [CrossRef] [Scilit] [PubMed]
  11. Zhu, R.; Yin, L.; Yang, M.; Wu, F.; Yang, Y.; Hu, W. SUES-200: A Multi-Height Multi-Scene Cross-View Image Benchmark Across Drone and Satellite. IEEE Trans. Circuits Syst. Video Technol. 2023, 33, 4825–4839. [Google Scholar] [CrossRef] [Scilit]
  12. Zhu, S.; Yang, T.; Chen, C. VIGOR: Cross-View Image Geo-Localization Beyond One-to-One Retrieval. In Proceedings of the 2021 IEEE/CVF Conference on Computer Vision and Pattern Recognition (CVPR), Nashville, TN, USA, 19–25 June 2021; pp. 5316–5325. [Google Scholar] [CrossRef] [Scilit]
  13. Ji, Y.; He, B.; Tan, Z.; Wu, L. Game4Loc: A UAV Geo-Localization Benchmark from Game Data. In Proceedings of the AAAI Conference on Artificial Intelligence (AAAI), Philadelphia, PA, USA, 25 February–4 March 2025; Volume 39, pp. 3913–3921. [Google Scholar] [CrossRef] [Scilit]
  14. Xu, W.; Yao, Y.; Cao, J.; Wei, Z.; Liu, C.; Wang, J.; Peng, M. UAV-VisLoc: A Large-Scale Dataset for UAV Visual Localization. arXiv 2024, arXiv:2405.11936. [Google Scholar]
  15. Ding, L.; Zhou, J.; Meng, L.; Long, Z. A Practical Cross-View Image Matching Method between UAV and Satellite for UAV-Based Geo-Localization. Remote Sens. 2021, 13, 47. [Google Scholar] [CrossRef] [Scilit]
  16. Zhuang, J.; Dai, M.; Chen, X.; Zheng, E. A Faster and More Effective Cross-View Matching Method of UAV and Satellite Images for UAV Geolocalization. Remote Sens. 2021, 13, 3979. [Google Scholar] [CrossRef] [Scilit]
  17. Xia, P.; Yu, L.; Wan, Y.; Wu, Q.; Chen, P.; Zhong, L.; Yao, Y.; Wei, D.; Liu, X.; Ru, L.; et al. Cross-View Geo-Localization with Panoramic Street-View and VHR Satellite Imagery in Decentrality Settings. ISPRS J. Photogramm. Remote Sens. 2025, 227, 1–11. [Google Scholar] [CrossRef] [Scilit]
  18. Yang, H.; Lu, X.; Zhu, Y. Cross-View Geo-Localization with Layer-to-Layer Transformer. In Proceedings of the 35th Conference on Neural Information Processing Systems (NeurIPS 2021), Virtual, 6–14 December 2021; pp. 29009–29020. [Google Scholar]
  19. Liu, L.; Li, H. Lending Orientation to Neural Networks for Cross-View Geo-Localization. In Proceedings of the 2019 IEEE/CVF Conference on Computer Vision and Pattern Recognition (CVPR), Long Beach, CA, USA, 16–20 June 2019; pp. 5624–5633. [Google Scholar] [CrossRef] [Scilit]
  20. Lin, J.; Zheng, Z.; Zhong, Z.; Luo, Z.; Li, S.; Yang, Y.; Sebe, N. Joint Representation Learning and Keypoint Detection for Cross-View Geo-Localization. IEEE Trans. Image Process. 2022, 31, 3780–3792. [Google Scholar] [CrossRef] [Scilit] [PubMed]
  21. Chen, Q.; Wang, T.; Yang, Z.; Li, H.; Lu, R.; Sun, Y.; Zheng, B.; Yan, C. SDPL: Shifting-Dense Partition Learning for UAV-View Geo-Localization. IEEE Trans. Circuits Syst. Video Technol. 2024, 34, 11810–11824. [Google Scholar] [CrossRef] [Scilit]
  22. Zhu, Y.; Yang, H.; Lu, Y.; Huang, Q. Simple, Effective and General: A New Backbone for Cross-view Image Geo-localization. arXiv 2023, arXiv:2302.01572. [Google Scholar]
  23. Yan, Y.; Wang, M.; Su, N.; Hou, W.; Zhao, C.; Wang, W. IML-Net: A Framework for Cross-View Geo-Localization with Multi-Domain Remote Sensing Data. Remote Sens. 2024, 16, 1249. [Google Scholar] [CrossRef] [Scilit]
  24. Wu, Q.; Wan, Y.; Zheng, Z.; Zhang, Y.; Wang, G.; Zhao, Z. CAMP: A Cross-View Geo-Localization Method Using Contrastive Attributes Mining and Position-Aware Partitioning. IEEE Trans. Geosci. Remote Sens. 2024, 62, 5637614. [Google Scholar] [CrossRef] [Scilit]
  25. Zhao, H.; Ren, K.; Yue, T.; Zhang, C.; Yuan, S. TransFG: A Cross-View Geo-Localization of Satellite and UAVs Imagery Pipeline Using Transformer-Based Feature Aggregation and Gradient Guidance. IEEE Trans. Geosci. Remote Sens. 2024, 62, 4700912. [Google Scholar] [CrossRef] [Scilit]
  26. Hu, Y.; Liu, Y.; Hui, B. Combining OpenStreetMap with Satellite Imagery to Enhance Cross-View Geo-Localization. Sensors 2025, 25, 44. [Google Scholar] [CrossRef] [Scilit] [PubMed]
  27. Wang, Z.; Shi, D.; Qiu, C.; Jin, S.; Li, T.; Qiao, Z.; Chen, Y. VecMapLocNet: Vision-Based UAV Localization Using Vector Maps in GNSS-Denied Environments. ISPRS J. Photogramm. Remote Sens. 2025, 225, 362–381. [Google Scholar] [CrossRef] [Scilit]
  28. Zhong, Z.; Zheng, L.; Cao, D.; Li, S. Re-Ranking Person Re-Identification with k-Reciprocal Encoding. In Proceedings of the 2017 IEEE Conference on Computer Vision and Pattern Recognition (CVPR), Honolulu, HI, USA, 21–26 July 2017; pp. 3652–3661. [Google Scholar] [CrossRef] [Scilit]
  29. Kannan, S.S.; Min, B.-C. PlaceFormer: Transformer-Based Visual Place Recognition Using Multi-Scale Patch Selection and Fusion. IEEE Robot. Autom. Lett. 2024, 9, 6552–6559. [Google Scholar] [CrossRef] [Scilit]
  30. Hu, B.; Chen, L.; Chen, R.; Bu, S.; Han, P.; Li, H. CurriculumLoc: Enhancing Cross-Domain Geolocalization Through Multistage Refinement. IEEE Trans. Geosci. Remote Sens. 2024, 62, 5615914. [Google Scholar] [CrossRef] [Scilit]
  31. Dagda, B.; Awais, M.; Fallah, S. GeoVLM: Improving Automated Vehicle Geolocalisation Using Vision-Language Matching. arXiv 2025, arXiv:2505.13669. [Google Scholar]
  32. Zhang, X.; Shore, T.; Chen, C.; Mendez, O.; Hadfield, S.; Wshah, S. VICI: VLM-Instructed Cross-view Image-localisation. In Proceedings of the 3rd International Workshop on UAVs in Multimedia: Capturing the World from a New Perspective (UAVM ’25), Dublin, Ireland, 27–31 October 2025. [Google Scholar] [CrossRef] [Scilit]
  33. Xiao, Z.; Suma, P.; Sachdeva, A.; Wang, H.-J.; Kordopatis-Zilos, G.; Tolias, G.; Ordonez, V. LOCORE: Image Re-ranking with Long-Context Sequence Modeling. In Proceedings of the IEEE/CVF Conference on Computer Vision and Pattern Recognition (CVPR), Nashville, TN, USA, 11–15 June 2025; pp. 9580–9590. [Google Scholar]
  34. Lentsch, T.; Xia, Z.; Caesar, H.; Kooij, J.F.P. SliceMatch: Geometry-Guided Aggregation for Cross-View Pose Estimation. In Proceedings of the 2023 IEEE/CVF Conference on Computer Vision and Pattern Recognition (CVPR), Vancouver, BC, Canada, 18–22 June 2023; pp. 17225–17234. [Google Scholar]
  35. Wang, X.; Xu, R.; Cui, Z.; Wan, Z.; Zhang, Y. Fine-Grained Cross-View Geo-Localization Using a Correlation-Aware Homography Estimator. In Proceedings of the 37th Conference on Neural Information Processing Systems (NeurIPS 2023), New Orleans, LA, USA, 10–16 December 2023. [Google Scholar]
  36. Zhang, X.; Sultani, W.; Wshah, S. Cross-View Image Sequence Geo-Localization. In Proceedings of the 2023 IEEE/CVF Winter Conference on Applications of Computer Vision (WACV), Waikoloa, HI, USA, 3–7 January 2023; pp. 2914–2923. [Google Scholar] [CrossRef] [Scilit]
  37. Li, H.; Wang, J.; Wei, Z.; Xu, W. Jointly Optimized Global-Local Visual Localization of UAVs. arXiv 2023, arXiv:2310.08082. [Google Scholar] [CrossRef] [Scilit]
  38. Ye, Q.; Luo, J.; Lin, Y. A Coarse-to-Fine Visual Geo-Localization Method for GNSS-Denied UAV with Oblique-View Imagery. ISPRS J. Photogramm. Remote Sens. 2024, 212, 306–322. [Google Scholar] [CrossRef] [Scilit]
  39. Shetty, A.; Gao, G.X. UAV Pose Estimation Using Cross-View Geolocalization with Satellite Imagery. In Proceedings of the 2019 IEEE International Conference on Robotics and Automation (ICRA), Montreal, QC, Canada, 20–24 May 2019; pp. 1827–1833. [Google Scholar] [CrossRef] [Scilit]
Figure 1. Cross-view image retrieval for UAV visual geolocation. A UAV query image is used to search the satellite reference database and retrieve the most similar satellite images.
Remotesensing 18 03016 g001
Figure 2. Overall architecture of the proposed framework, consisting of three modules: (a) Global Retrieval for Top-K candidate recall, (b) Token-Level Local Matching Reranking for ranking refinement, and (c) Neighborhood-Consistent Position Fusion for continuous coordinate prediction.
Remotesensing 18 03016 g002
Figure 3. Architecture of the global retrieval module, consisting of a shared-weight dual-branch ViT-Base/16 encoder, global average pooling descriptor extraction, L2 normalization, similarity score computation, and weighted contrastive loss for training.
Remotesensing 18 03016 g003
Figure 4. Structure of the token-level local matching reranking module. The module contains five sequential components: ① feature preparation, ② local match pair construction, ③ pair encoding and candidate-level representation aggregation, ④ CL-LMM inference, and ⑤ shortlist score calibration. The first four components construct candidate-level local matching evidence for each query–candidate pair, while the fifth component performs rank calibration using candidate-level evidence and shortlist-level context. The figure uses notation consistent with the corresponding equations in Section 3.2, making the relationship between the architecture and mathematical formulation easier to follow.
Remotesensing 18 03016 g004
Figure 5. Structure of the neighborhood-consistent position fusion module, consisting of three components: input construction, input encoding and fusion, and position fusion.
Remotesensing 18 03016 g005
Figure 6. Representative samples from the UAV-VisLoc dataset, showing UAV aerial images and their corresponding satellite reference tiles across different terrain types.
Remotesensing 18 03016 g006
Table 1. Summary of main notation used in the proposed framework.
SymbolDescription
I i d ,   I j s The i-th drone-view query image and the j-th satellite candidate.
S i j Scaled cosine similarity between the i-th query descriptor and the j-th satellite descriptor.
τ Learnable temperature coefficient used to rescale cosine similarities.
G i d ,   G i s Ground footprints of the query field of view and the satellite reference tile.
ω i Overlap weight of the i-th query–reference pair, computed from the IoU between G i d and G i s
K ,   C K Number of retrieved candidates and the corresponding Top-K candidate set.
N t ,   R Number of retained local tokens and the number of matched candidate tokens selected for each query token.
t m d ,   t j , n s Local patch-token features of the query token and candidate token.
a m d ,   a j , n s Token importance scores of the query token and candidate token.
p m d ,   p j , n s Normalized 2D coordinates of the query token and candidate token in the feature grid, computed from their row and column indices.
z m d ,   z j , n s Dimension-reduced local token representations.
a ˜ m d ,   a ˜ j , n s Fused token weights of the query token and candidate token, obtained by combining token importance scores with learnable gating scores.
M m , n ( j ) Token-level cosine similarity between the m-th query token and the n-th token in the j-th candidate.
π r ( j ) ( m ) The r-th matched candidate-token position selected for the m-th query token.
Δ p m , r ( j ) Relative displacement between the query token and its matched candidate token.
u m , r ( j ) Local match-pair feature constructed from token coordinates, displacement, saliency, and similarity information.
N j s a m e ,   N j c r o s s Same-scale and cross-scale neighborhood sets of the j-th candidate.
p ^ j o ,   p ^ j + ,   p ^ j p ,   p ^ j f Probabilities of local matching, strict-positive tendency, structural prior, and fusion branches.
N p Number of query–candidate pairs in the current batch for CL-LMM training losses.
q Query-level shortlist context vector computed from the Top-K shortlist.
Δ j Score adjustment predicted by the shortlist score calibration network.
s j r Final refined ranking score after shortlist score calibration.
U M ,   M Local support set and the number of support candidates used in LocFusion.
c m ,   c * ,   c ^ Local coordinates of the m-th support candidate, target query location, and predicted location.
Δ c Learnable residual correction in LocFusion.
γ c Local coordinate normalization scale factor.
D ( , ) Haversine distance function between two geographic coordinates.
Table 2. Consolidated hyperparameter configurations for the proposed modules.
ModuleHyperparameter
Description
SymbolValue
Global
Retrieval
Adaptive smoothing coefficient (Weighted-InfoNCE) γ 5
CL-LMMRetained local tokens
per image
N t 8
Matched candidate tokens per query token R 80
Loss balancing weights λ o v e r l a p , λ p o s , λ f u s i o n 1, 1, 1
Shortlist
Calibration
Baseline score prior weights ω 1 , ω 2 , ω 3 , ω 4 0.60, 0.28, 0.08, 0.04
Residual scaling coefficient (score adjustment) α 0.18
Ordering margins (Pairwise ranking) m A , B m p o s , n e g = 0.05 m p o s , s e m i = 0.03 m s e m i , n e g = 0.02
Anchor threshold & Anchor protection margin m g , m a 0.03, 0.01
Loss balancing weights
(Equation (72))
γ l i s t , γ p a i r , γ a u x , γ a n c h o r , γ r e g 1, 1.0, 0.5, 0.3, 0.02
LocFusionSupport-set size & Local coord normalization scale M , S 3, 200
Distance decay parameter & Easy-sample threshold σ t , τ a 80, 60
Residual scaling coefficient (coordinate correction) α l o c 40
Loss balancing weights ω r e g , ω k l , ω r e s , ω e n t , ω e a s y 1, 0.35, 0.02, 0.005, 0.1
Table 5. Backbone and loss comparison under the GTA-UAV same-area setting.
MethodR@1 ↑R@5 ↑AP ↑SDM@3 ↑Dis@1/m ↓
ResNet-101 + Weighted-InfoNCE58.10%--69.98%82.64%371.78
ViT-Base/16 + InfoNCE65.89%93.09%77.84%86.52%196.59
SwinV2-Base + Weighted-InfoNCE81.73%--88.32%87.35%196.06
ConvNeXt-Base + Weighted-InfoNCE83.94%--89.54%87.98%160.49
ViT-Base/16 + Weighted-InfoNCE85.23%97.62%90.52%88.96%145.64
Ours88.13%98.79%92.41%90.68%84.50
Note: ViT-Base/16 + InfoNCE is used for loss ablation on the same backbone; the Weighted-InfoNCE rows are used for backbone comparison. All results in this table are reported based on a single evaluation run using random seed 42. Arrows ↑ and ↓ indicate that higher values and lower values represent better performance, respectively.
Table 6. Comparison with adapted post-retrieval reranking methods under the GTA-UAV same-area setting.
MethodR@1 ↑R@5 ↑AP ↑SDM@3 ↑Dis@1/m ↓
Global Retrieval85.23%97.62%90.52%88.96%145.64
k-reciprocal Reranking84.68%97.35%90.06%88.53%156.80
R2Former-adapted85.74%97.86%90.86%89.05%146.20
LOCORE-adapted86.08%98.03%91.10%89.22%144.35
Ours: CL-LMM + Calibration88.13%98.79%92.41%89.71%138.96
Ours: Full Method88.13%98.79%92.41%90.68%84.50
Note: All methods use the same ViT-Base/16 + Weighted-InfoNCE global retrieval checkpoint, the same 384 × 384 input resolution, and the same Top-100 candidate lists. The adapted R2Former and LOCORE variants are implemented by adapting their reranking mechanisms to the proposed UAV-to-satellite candidate interface, rather than by directly transferring their original full pipelines. All results in this table are reported based on a single evaluation run using random seed 42. Arrows ↑ and ↓ indicate that higher values and lower values represent better performance, respectively.
Table 7. Comparison with adapted localization refinement strategies under the GTA-UAV same-area setting.
MethodTypeSDM@1 ↑SDM@3 ↑Dis@1/m ↓Dis@3/m ↓
Top-1 tile centerPost-reranking tile-center
baseline
91.52%89.71%138.96167.74
SliceMatch-adaptedGeometry-guided pose
refinement
92.54%90.22%113.80153.40
HC-Net-adaptedHomography-based
coordinate refinement
92.82%90.36%107.60150.80
GLVL-adaptedGlobal-local fine-grained matching93.06%90.49%101.40148.90
LocFusion w/o residual headCandidate-set residual
correction
93.18%90.47%98.80148.50
LocFusion w/o weight headCandidate-set residual
correction
93.04%90.39%102.30150.10
Ours: Full LocFusionCandidate-set residual
correction
93.88%90.68%84.50145.62
Note: All methods are evaluated after the same CL-LMM + Calibration shortlist. Therefore, ranking metrics such as R@1, R@5, and AP remain unchanged across all rows and are omitted for compactness. For pairwise refinement methods, coordinate refinement is applied to each of the top-ranked candidates independently when computing Dis@K and SDM@K. “Adapted” indicates that the original localization refinement strategy is implemented under our unified Top-K UAV-to-satellite candidate interface rather than using its original retrieval backbone or dataset setting. All results in this table are reported based on a single evaluation run using random seed 42. Arrows ↑ and ↓ indicate that higher values and lower values represent better performance, respectively.
Table 8. Ablation and efficiency analysis under the GTA-UAV same-area setting.
ConfigurationExtra ParamsOnline LatencyPeak MemoryR@1R@5APSDM@1Dis@1/m
Global Retrieval013.1 ms1.80 GB85.23%97.62%90.52%90.19%145.64
+Matching
head only
0.92 M35.6 ms2.45 GB86.18%98.06%91.15%90.71%143.50
+ Matching + Strict-positive0.96 M35.8 ms2.47 GB86.74%98.24%91.55%90.96%142.20
+ Matching + Strict-positive + Prior1.05 M36.2 ms2.52 GB87.18%98.36%91.83%91.12%141.30
Full CL-LMM1.15 M36.6 ms2.56 GB87.51%98.51%92.07%91.28%140.80
Full CL-LMM
+Calibration
1.38 M37.6 ms2.61 GB88.13%98.79%92.41%91.52%138.96
Full Method
+LocFusion
1.72 M38.3 ms2.67 GB88.13%98.79%92.41%93.88%84.50
Note: Extra parameters are counted relative to the shared ViT-Base/16 global retrieval backbone. Online latency is reported with batch size 1 on an NVIDIA RTX 4090, and satellite reference descriptors are extracted offline. The GTA-UAV reference database contains 14,640 satellite tiles, and the reranking shortlist size is K = 100. All results in this table are reported based on a single evaluation run using random seed 42.
Table 9. Sensitivity analysis of candidate pool size for token-level local matching reranking.
KR@1R@5APSDM@1SDM@3Dis@1Dis@3
2087.78%98.55%91.48%91.28%89.45%141.85169.80
5088.02%98.71%92.04%91.43%89.62%140.18168.60
10088.13%98.79%92.41%91.52%89.71%138.96167.74
15088.10%98.77%92.38%91.50%89.69%139.35168.10
20088.05%98.77%92.34%91.47%89.67%139.78168.45
Note: All results in this table are reported based on a single evaluation run using random seed 42.
Table 10. Sensitivity analysis of the residual scale in neighborhood-consistent position fusion.
SSDM@1SDM@3Dis@1/mDis@3/m
1092.86%90.14%95.32148.96
2093.41%90.49%89.58146.78
3093.75%90.57%85.34145.76
4093.88%90.68%84.50145.62
5093.81%90.63%85.04146.15
6093.56%90.45%87.68147.42
8092.88%90.05%94.66151.05
Table 11. UAV-VisLoc same-area experimental results.
MethodR@1R@5APSDM@1SDM@3Dis@1/mDis@3/m
GlobalRetrieval80.30%93.94%86.44%87.69%81.11%169.00323.99
+CL-LMM82.83%94.95%88.20%88.56%82.27%145.76306.42
+CL-LMM + Calibration83.33%95.20%88.51%88.79%81.63%143.65305.47
+CL-LMM + Calibration + LocFusion83.33%95.20%88.51%90.05%82.26%129.47300.98
Note: All results in this table are reported based on a single evaluation run using random seed 42.
Table 12. UAV-VisLoc cross-area experimental results.
MethodR@1R@5APSDM@1SDM@3Dis@1/mDis@3/m
GlobalRetrieval43.18%66.42%52.65%63.85%54.10%965.401336.20
+CL-LMM44.46%66.80%53.47%64.42%54.68%895.301284.60
+CL-LMM + Calibration44.66%66.88%53.64%64.58%54.41%872.801301.50
+CL-LMM + Calibration + LocFusion44.66%66.88%53.64%65.92%55.36%768.501216.40
Note: LocFusion refines candidate coordinates without modifying candidate ranking; therefore, R@1, R@5, and AP remain unchanged after its introduction. All results in this table are reported based on a single evaluation run using random seed 42.
Disclaimer/Publisher’s Note: The statements, opinions and data contained in all publications are solely those of the individual author(s) and contributor(s) and not of MDPI and/or the editor(s). MDPI and/or the editor(s) disclaim responsibility for any injury to people or property resulting from any ideas, methods, instructions or products referred to in the content.