Article

Ambulance STARS: A Satellite-Driven Framework for Rapid Flood Impact Assessment and Time-Critical Ambulance Routing


1
Faculty of Space Technologies, AGH University of Krakow, 30-059 Kraków, Poland
2
Department of Geoinformatics and Applied Computer Science, Faculty of Geology, Geophysics and Environmental Protection, AGH University of Krakow, 30-059 Kraków, Poland
*
Author to whom correspondence should be addressed.
Remote Sens. 2026, 18(17), 3004; https://doi.org/10.3390/rs18173004
Submission received: 14 July 2026 / Revised: 26 August 2026 / Accepted: 29 August 2026 / Published: 4 September 2026
(This article belongs to the Section Earth Observation for Emergency Management)

Highlights

What are the main findings?
  • A satellite-driven, service-oriented framework was developed that transforms Earth observation data into flood extent, road passability layers, accessibility maps and dispatch-ready ambulance routes within minutes of a new acquisition.
  • Demonstrated on a real flood event, the framework showed that satellite-observed road barriers capture the highly localized nature of accessibility losses, and that the resulting products depend strongly on how barriers are derived from the flood mask.
What are the implications of the main findings?
  • Satellite observations of an ongoing flood can directly support emergency medical dispatch as a near-real-time decision-support layer, complementing approaches based on modelled flood scenarios.
  • Reliable accessibility products for emergency services require empirically calibrated travel-time models and transparent reporting of their sensitivity to the flood mask and barrier definition.

Abstract

Floods degrade road networks at the same time as demand for emergency medical services (EMSs) rises, yet national EMS command systems rarely receive any information on flood-induced road barriers. This paper presents Ambulance STARS (SaTellite-assisted Ambulance Routing System), a service-oriented framework that links satellite observation with ambulance dispatch. A cloud-based flood detection service derives flood extent from Sentinel-1 SAR amplitude change detection executed in a cloud-based Earth observation data and compute backend and translates it into road passability layers. A routing engine then maintains an in-memory road graph whose travel times are calibrated with empirical ambulance speed models built from four years (2020–2023) of GPS records of an EMS fleet in southern Poland, with separate speeds for driving with and without emergency signals (61.8 and 37.2 km/h, respectively). An API gateway with single-file tile delivery, a replicated relational data tier, and an observability stack complete the architecture, and a web client offers dispatchers live routing and multi-unit incident simulation. The framework was tested on the September 2024 flood in the Municipality of Nysa, Poland. The SAR module delineated 665 ha of inundation and marked 8.5 km of the 656.7 km routing network as impassable (508 barrier points), and the same procedure applied to a reference optical mask of 18 September yielded 17.3 km and 1006 points. Because the SAR and optical acquisitions captured different phases of the flood wave, agreement on the rare impassable-road class was low, and the two products were, therefore, used to bracket operational uncertainty rather than to define a single ground truth. Applied without local retuning to Lewin Brzeski, the same flood detection workflow showed consistent performance against the CEMS reference product. The routing module produced statutory 8/15/20 min accessibility maps in 12–34 s under warm-cache benchmark conditions. With SAR-derived barriers, the share of the network reachable within 15 min fell from 88% to 80%, and 2 villages with 938 inhabitants lost road access to EMS entirely. With barriers derived from the optical mask, the 15 min share fell to 39.8% and seventeen settlements lost road access entirely, underlining how strongly the barrier source shapes the operational picture. Post-acquisition processing completes in under one minute under warm-cache conditions with road data preloaded, and satellite-derived road passability is fast enough to support near-real-time decision-making, subject to the constellation revisit time and to integration with EMS command systems.

1. Introduction

Floods are among the most frequent natural hazards in Central Europe, and their societal cost extends far beyond direct material damage: they degrade or sever the road network at precisely the time when emergency medical services (EMSs) face increased demand [1,2]. In September 2024, torrential rainfall in the Odra basin caused severe flooding across southwestern Poland. The Municipality of Nysa was among the most affected areas, with the Nysa Kłodzka river exceeding the alarm level by 188 cm on 16 September 2024 [3]. Polish law requires that the monthly median response time of EMS teams not exceed 8 min in cities above 10,000 inhabitants and 15 min elsewhere, with maxima of 15 and 20 min, respectively [4]. Meeting these thresholds becomes questionable when road segments are inundated and dispatchers have no systematic, up-to-date information on which routes remain passable.
Previous studies consistently show that flooding drastically reduces EMS accessibility. Green et al. [5] reported that the share of Leicester reachable within 10 min fell from 100% to 26.2% under a 1-in-1000-year flood, while Yu et al. [6] estimated that the English population covered within 7 min drops from 84% to 70% and 61% under 30- and 100-year scenarios. Yang et al. [7] optimized EMS facility locations in Shanghai under fluvial flood scenarios, treating water depths above 30 cm as impassable. What these works have in common is that flood extent enters the analysis as a modeled scenario. Operationally, however, dispatchers need the observed extent of an ongoing event. Synthetic aperture radar (SAR) satellites offer such observations: they image the surface regardless of cloud cover and daylight, and open Sentinel-1 data have proven suitable for near-real-time flood mapping [8,9,10]. Recent work has extended this line with deep learning detectors applied to decade-scale Sentinel-1 archives [11] and systematic comparisons of detection approaches for rapid mapping [12]. In parallel, spatiotemporal analyses have quantified how flood-induced road disruptions degrade access to emergency medical care [13], probabilistic formulations have linked inundation to the functionality of roads for medical emergency vehicles [14], and system-level studies have shown that disaster-induced supply–demand mismatch substantially deteriorates prehospital emergency services [15]. Meanwhile, research on EMS accessibility mapping has produced efficient methods for computing dynamic arrival-time coverage [16,17,18], including empirical evidence that ambulance speeds correlate with spatial characteristics of the operating region and with the use of emergency signals [17]. Few operational frameworks, however, couple SAR-derived road barriers with empirically calibrated ambulance accessibility computation in a single, low-latency processing chain. Recent web-based decision-support prototypes address parts of this chain [19], but without fleet-calibrated travel times or an end-to-end demonstration on an observed event. The Polish national EMS command support system (SWD PRM) currently offers no module reacting to flood-induced changes in road passability [20], a gap also identified by practitioners surveyed after the 2024 flood, who explicitly called for real-time tools integrating satellite observation into crisis coordination [21].
This paper addresses that gap. The contribution is not a new flood detection algorithm but the design and end-to-end demonstration of an operational chain, with three specific elements. First, we propose Ambulance STARS, a service-oriented architecture that transforms raw Sentinel-1 scenes into routing products usable by dispatchers: flood extent, road passability layers, barrier points, isochrone (accessibility) maps, and point-to-point routes. Second, we describe two analytical modules underpinning the framework: an automatic SAR change detection algorithm executed within a cloud-based geospatial processing environment, and an accessibility engine whose travel-time model is calibrated with four years of GPS trajectories of an operational ambulance fleet, differentiated by day of week and emergency signal status. Third, we demonstrate the framework end-to-end on a real event, the September 2024 flood in Nysa, quantifying the thematic quality of the products and the computational latency of every stage, and we demonstrate the operator-facing web application in live and simulation modes.
The remainder of the paper is organized as follows. Section 2 describes the study areas, data, framework architecture, and analytical modules. Section 3 presents the complete Nysa case study, an additional transferability assessment for Lewin Brzeski, the computational benchmarks, and the operator-facing application. Section 4 discusses implications, limitations, and comparisons with previous work, and Section 5 concludes.

2. Materials and Methods

2.1. Study Areas and the September 2024 Flood

2.1.1. Municipality of Nysa

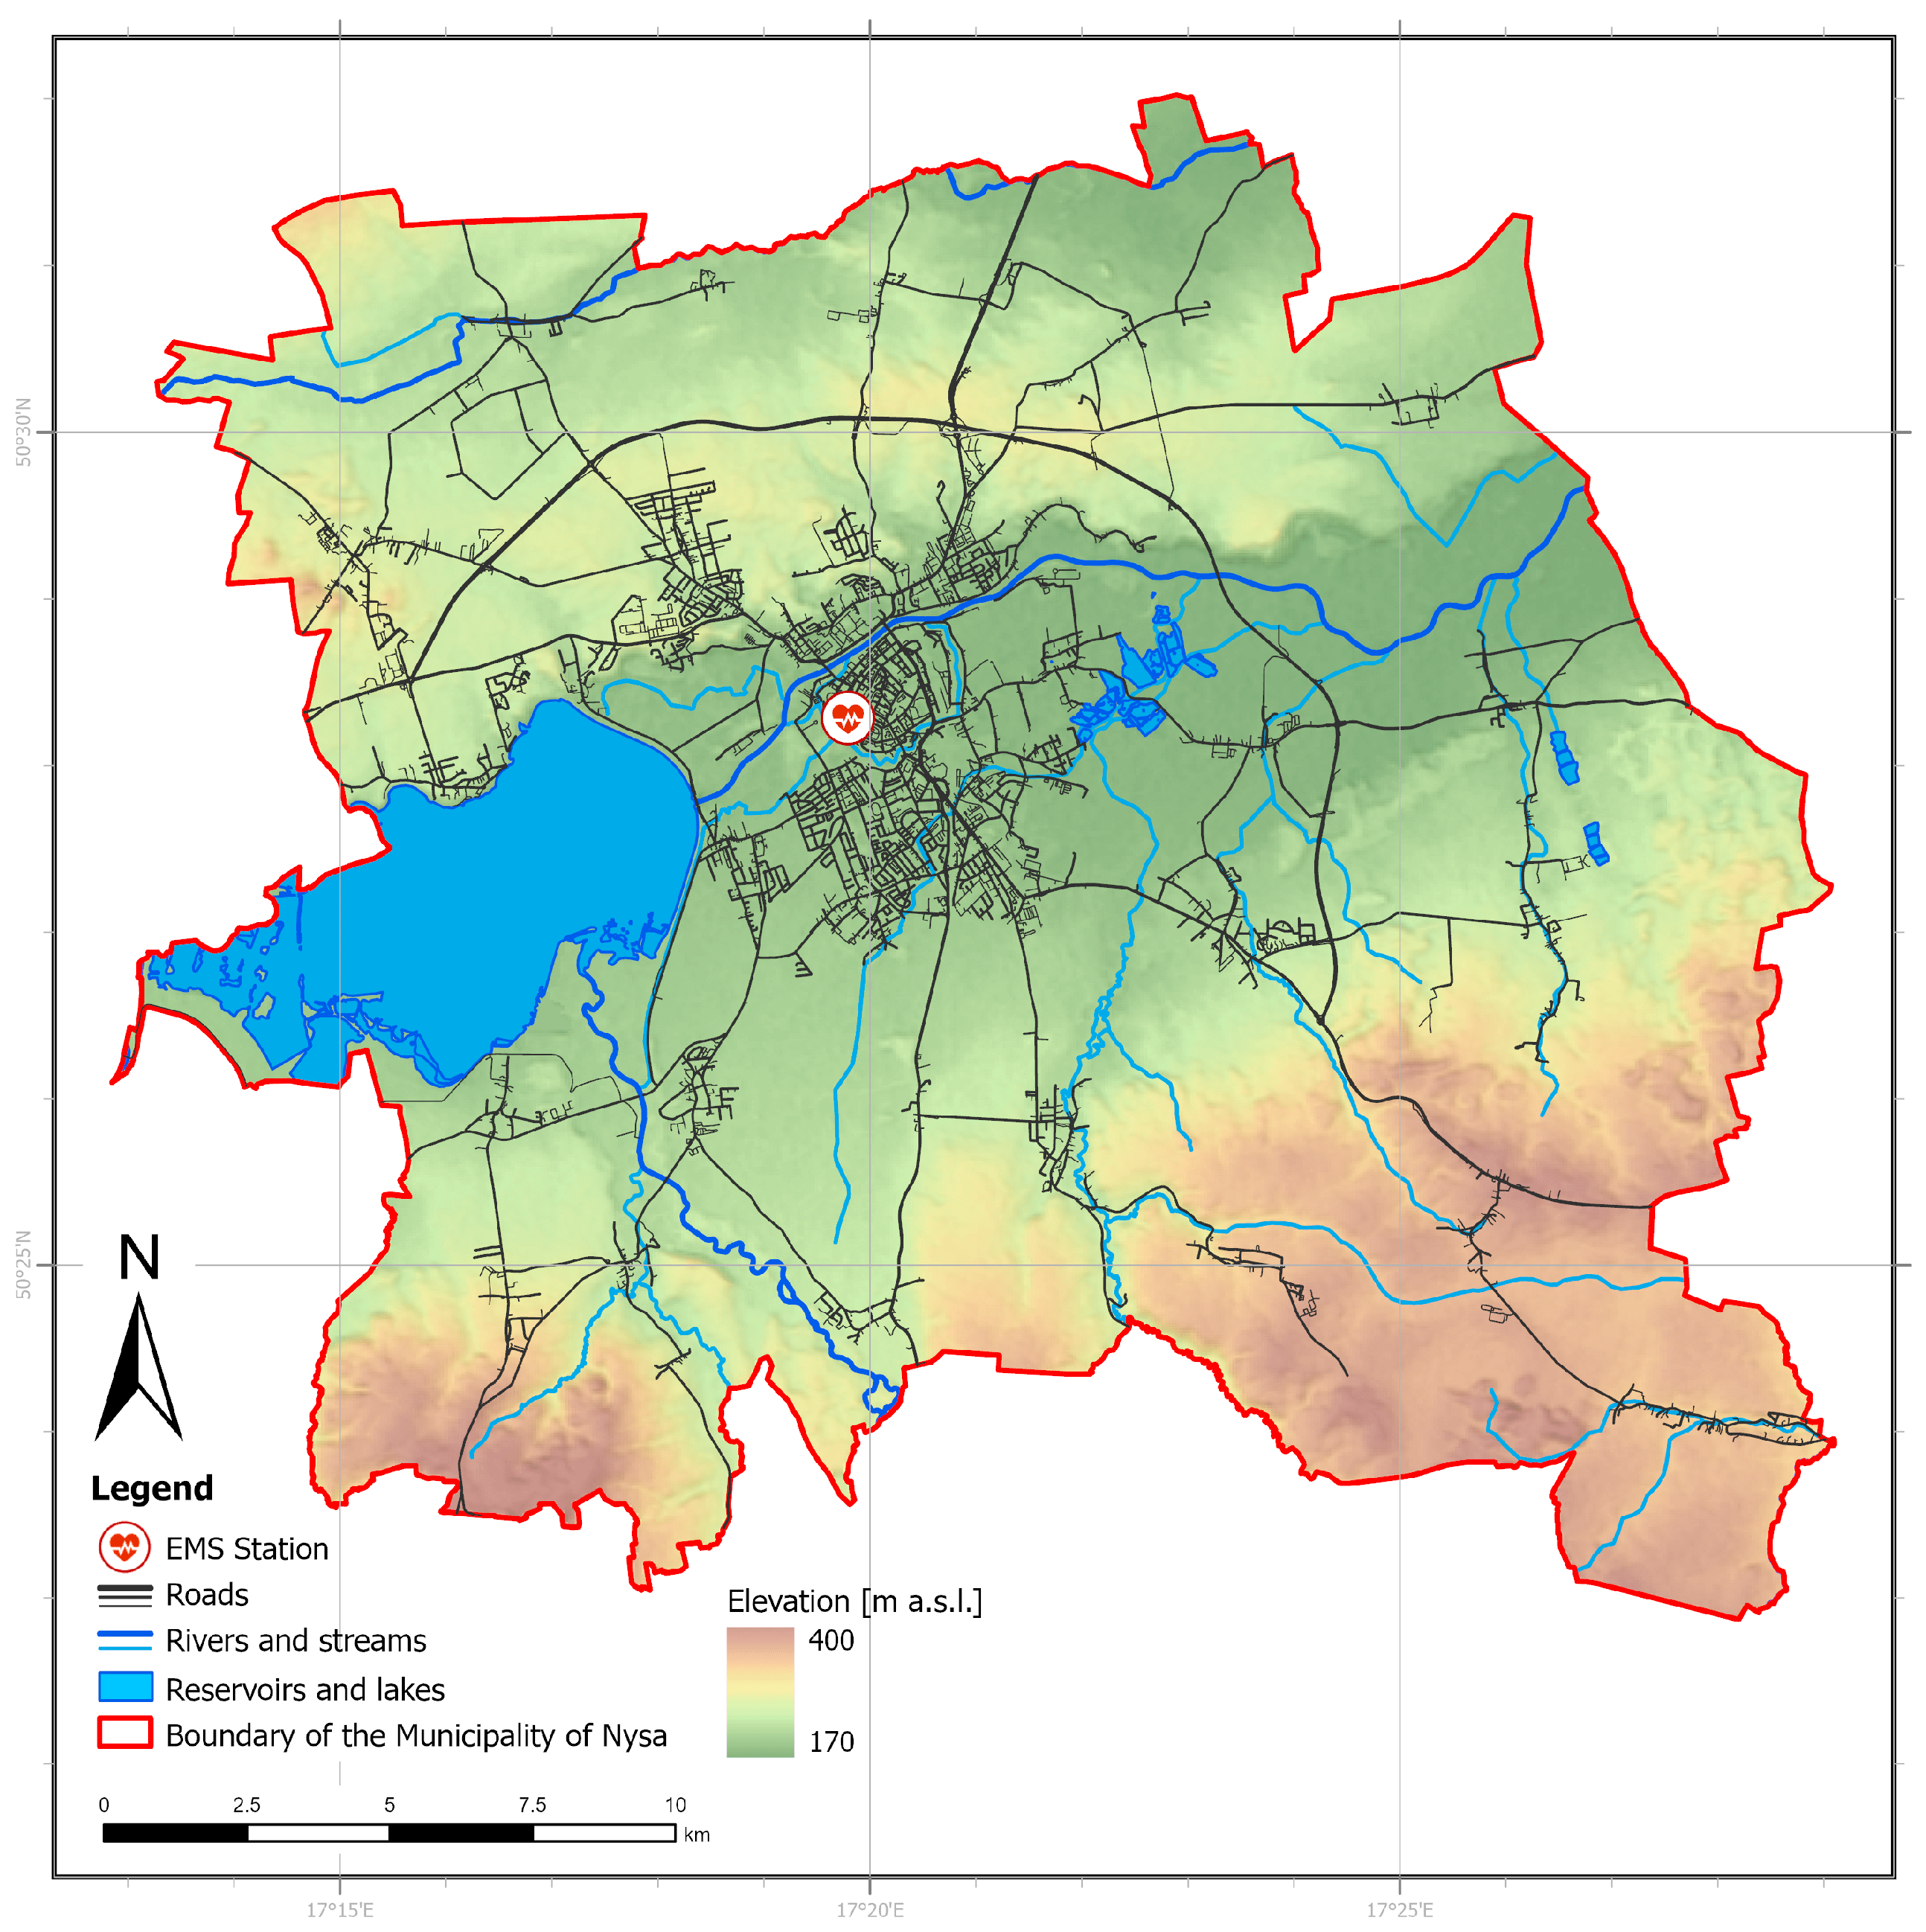
The Municipality of Nysa (Opole Voivodeship, southwestern Poland) covers 218 km2 and has approximately 53,300 inhabitants (as of 2024, the year of the analyzed flood event) concentrated in a dominant central town surrounded by dispersed rural settlements. The municipality lies in the catchment of the Nysa Kłodzka river, a major tributary of the Odra, and its flood exposure is shaped by the Nysa Lake retention reservoir west of the town. Major flood events affected the area in 1997 and 2010, and most recently in September 2024 [3,22]. The road network comprises national, voivodeship, county, and local roads with a density of 2.79 km/km2, which makes the municipality a suitable testbed for analyzing flood impact on transport infrastructure of varied function. The area is served by a single EMS station, so the loss of individual road segments directly translates into accessibility loss for peripheral villages. The spatial context of the Nysa study area, including its topography, main hydrography, road network, and EMS station location, is shown in Figure 1.

2.1.2. Municipality of Lewin Brzeski

The Municipality of Lewin Brzeski is located in the western part of Opole Voivodeship, between Opole and Wrocław. It covers approximately 160 km2 and had 11,808 inhabitants at the end of 2024, including 5165 inhabitants in the centrally located town of Lewin Brzeski [23,24]. The municipality has a mixed urban–rural settlement structure and occupies a broad, predominantly lowland area at the downstream end of the Nysa Kłodzka catchment. The northern boundary follows the Odra, while the Nysa Kłodzka crosses the municipality before joining the Odra. This confluence setting and the wide, low-gradient floodplain expose a large part of the municipality to extensive fluvial inundation. The road system includes the national road 94, regional and local roads, and the A4 motorway running along the southern edge of the municipality [24].
Lewin Brzeski was severely affected during the September 2024 flood. The town and the surrounding settlements experienced rapid inundation from 17 September, while high-water conditions continued to propagate through the lower Nysa Kłodzka and Odra floodplain on 18 September. At the Nysa Kłodzka–Odra confluence, the peak water level was recorded on 18 September and exceeded the alarm level by 173 cm, with an estimated peak discharge of approximately 2000 m3/s [25]. Lewin Brzeski was selected as an independent transferability case because it was affected by the same regional event as Nysa but represents a substantially different geomorphological setting: a broad lowland floodplain with extensive agricultural areas and multiple river corridors rather than a municipality structured around a reservoir and a single dominant river valley. The case, therefore, tests whether the same automatic SAR workflow can produce coherent flood and road impact products without local recalibration.
Figure 1. Municipality of Nysa (Opole Voivodeship, Poland): hypsometry, main hydrography, OpenStreetMap roads, and EMS station location.
Remotesensing 18 03004 g001

2.2. Data

Three independent data sources feed the framework: (1) Sentinel-1 IW GRD scenes (C-band, 10 m resolution, VV + VH polarization) were accessed through a cloud-based Earth observation data and compute backend providing catalog-style (STAC) access to the Sentinel-1 archive. The reference mosaic was acquired on 3 September 2024 and the during-flood mosaic on 15 September 2024, both by Sentinel-1A on the same descending track (relative orbit 124), each composed of two consecutive slices covering the study area. Using a single track guarantees identical imaging geometry between the compared acquisitions. A cloud-free Sentinel-2 optical acquisition of 18 September 2024, the first available after the event, served as an independent reference for product-level comparison. (2) The road network was retrieved from OpenStreetMap via the Overpass API and restricted to vehicular roads [26,27]. (3) Ambulance telemetry: GPS records and dispatch logs of the EMS fleet operating in Bochnia County (Lesser Poland Voivodeship) in 2020–2023, extracted from the archive of the national SWD PRM system. Each GPS record contains position, speed, timestamps, ignition state, and the status of visual and acoustic emergency signals. Dispatch records contain call and return timestamps, urgency codes, and vehicle identifiers. All data were fully anonymized and provided under a formal agreement with the Health Department of the Lesser Poland Voivodeship Office (Agreement No. WZ-III.63143.12.2023). Under Polish law, retrospective analyses of anonymized administrative data require neither institutional review board approval nor informed consent. For independent flood extent evaluation, Copernicus Emergency Management Service (CEMS) Rapid Mapping flood delineations for the September 2024 event were used as reference products for Nysa and Lewin Brzeski [28]. ESA WorldCover v200 at 10 m resolution [29] was additionally used for a post hoc decomposition of false-positive and false-negative flood areas by land-cover class. Neither CEMS nor WorldCover entered the flood detection chain or parameter selection.
Because no ambulance GPS data were available for the Nysa area itself, we transferred the speed models from Bochnia County, justified by a comparative analysis of the two regions (Table 1): both exhibit a mixed urban–rural settlement structure, with one dominant, centrally located town, comparable road network density (2.79 vs. 2.24 km/km2), and natural barriers flanking the main settlement (Nysa Lake and the Niepołomice Forest, respectively). Prior work has shown that ambulance speed characteristics correlate with precisely such spatial features [17]. The comparison is, nevertheless, imperfect: the urbanization rate differs substantially (75.5% versus 32.2%), partly because the indicator aggregates differently at the municipal and county levels, and differences in road class composition, traffic, and driving behavior cannot be excluded. Two safeguards address this. First, Section 3.4 varies the transferred speeds by ±20%, a range that spans such differences without changing any qualitative conclusion. Second, a static model built from OpenStreetMap speed limits and road classes for Nysa itself yields travel times that fall between the two empirical variants (Section 3.4), indicating that the transferred envelope brackets locally plausible values. Absolute travel times should, nevertheless, be read as scenario estimates. It is important to note that while this OSM-based comparison provides crucial indirect support for the transferred speed parameters, direct validation against local ambulance dispatch records remains a gold standard that should be pursued when such data become accessible.

2.3. Framework Architecture

Ambulance STARS is designed as a set of loosely coupled services organized in tiers (Figure 2). The client tier is a web application used by dispatchers and analysts. The edge/gateway tier exposes a single API gateway with request routing and an edge cache for PMTiles map tiles, so that heavy cartographic products (flood masks and passability layers) are served as static, cacheable tile archives rather than rendered on demand. Two domain services form the analytical core. The flood detection service wraps the SAR processing chain: it ingests Sentinel-1 scenes from the Earth observation backend and road data from a vector map provider, performs SAR scene analysis and processing (Section 2.4), and emits vector products and pre-rendered tiles. The routing engine service is a horizontally scalable set of replicas, each holding the road graph in memory behind a routing API service. Keeping the graph resident in RAM eliminates repeated graph construction, which our module-level benchmarks identify as the dominant latency component. A shared data tier, configured with a primary database and a streaming-replicated read replica, stores road graphs, speed models, missions, and incident data, while object storage holds PMTiles archives and large artifacts. An observability stack, comprising a metrics collector, a log aggregator, and a visualization dashboard, instruments all services, which is essential for a system intended to operate during crises. The separation of the slowly varying components (road network and speed models) from the rapidly varying component (flood mask) is the key architectural decision: the expensive inputs are precomputed and cached, so a new satellite acquisition triggers only the incremental work of change detection and graph re-weighting, which keeps end-to-end latency below one minute.

2.4. Flood Detection and Road Passability Module

Flood extent is derived by amplitude change detection between a pre-flood reference acquisition and a during-flood acquisition. Scene selection is automatic: the algorithm inspects both ascending and descending passes within configurable windows around the event date, requires the reference and flood images to share the same relative orbit (identical imaging geometry), scores candidate pairs by their joint temporal distance from the event, and mosaics all slices of the selected date and track to avoid footprint truncation over the area of interest. After conversion from dB to linear scale, speckle is suppressed with a directional Refined Lee filter [30]. Detection uses the ratio approach on VH polarization, which is most sensitive to surface water [31,32]: the ratio R of the reference to the flood image backscatter is thresholded at R > 1.35, a value consistent with established SAR flood mapping practice [33] and with UN-SPIDER recommended procedures [34]. This value was fixed a priori, before any site-specific analysis, and was not tuned to the study areas. The sensitivity analysis in Section 3.4 is, therefore, a post hoc robustness check rather than a selection procedure. A fixed empirical threshold was chosen deliberately: it is deterministic, requires no training data or event-specific tuning, and its behavior is easy to audit, which we consider essential for a chain that must run unattended during a crisis. Adaptive split-based thresholding is one such alternative [35]. It adjusts the decision boundary to the backscatter statistics of the individual SAR scene. Learning-based methods form a second group. These include convolutional segmentation networks [36], trained and evaluated on public benchmarks such as Sen1Floods11 [37], and large-scale deep-learning detectors [11,12]. Such approaches may improve flood delineation, particularly for shallow, vegetated, and urban flooding. The flood detection service was designed with this modularity in mind: alternative detectors can replace the ratio test without changes to the downstream road-overlay and routing components. False positives are reduced by masking slopes above 5° (radar shadow and layover artifacts) and permanent water bodies identified from the JRC Global Surface Water seasonality layer (water present ≥ 6 months per year). Morphological opening and closing with a 20 m radius remove speckle-scale artifacts and consolidate flood patches, after which polygons smaller than 800 m2 are discarded. The resulting flood layer is intersected with the OpenStreetMap road network using geometric overlay: road segments intersecting flood polygons are split, flooded fragments are extracted into an impassable-road layer, and the entry/exit points of each flooded fragment are emitted as barrier points, directly interpretable as locations where a vehicle must stop or reroute [38,39]. The module outputs three vector layers (flood extent, impassable roads, and barrier points) together with tiled visualizations for the client. The current implementation of this service executes on Google Earth Engine (Google LLC, Mountain View, CA, USA) [40]. The workflow itself assumes only catalog-based access to calibrated GRD scenes and a raster compute engine, and is, therefore, portable to other cloud or on-premises environments. The implementation is openly available on GitHub.
Geographical transferability was evaluated by applying the complete flood detection workflow to Lewin Brzeski without case-specific modification. The same VH ratio threshold (R > 1.35), directional Refined Lee filter, slope limit, permanent water mask, morphological opening and closing radius, minimum polygon area, and road-overlay procedure were retained. Only the administrative area and automatically selected Sentinel-1 acquisition pair changed. No local threshold adjustment, manual editing, or use of the Copernicus reference delineation was permitted during detection. The Lewin Brzeski result, therefore, constitutes an independent test of the deterministic operational workflow rather than a locally optimized reconstruction of the event.

2.5. Evaluation and Robustness Analysis

To benchmark the fixed-threshold design against a representative adaptive approach, Otsu thresholding [41] was evaluated post hoc on the same filtered VH change image while retaining all other processing stages. Three variants of the same Otsu method were considered to assess its sensitivity to the representation and domain of the change histogram: (i) global Otsu on the linear ratio R, (ii) global Otsu on the logarithmic ratio L = 10log10 (R), and (iii) Otsu on the logarithmic ratio restricted to R > 1 (L > 0 dB), corresponding to the direction of backscatter change targeted by the amplitude-decrease detector. The permanent-water and slope masks, 20 m morphological opening and closing, and 800 m2 minimum polygon area were identical to the fixed-threshold workflow. No Otsu threshold was calibrated against the CEMS reference product.
Agreement with the CEMS reference product was quantified within the common evaluation domain using precision, recall, F1-score, and intersection-over-union. To account for spatial autocorrelation, 95% confidence intervals for these metrics were estimated using spatial block bootstrap with 1 km blocks and 1000 replicates. False-positive areas (SAR-only) and false-negative areas (CEMS-only) were additionally intersected with ESA WorldCover v200 [29] to quantify the contribution of individual land-cover classes to the observed disagreement.

2.6. Ambulance Speed Model

GPS records of ambulances dispatched in Bochnia County were migrated to a relational database and filtered to mission intervals (between dispatch departure and return). Consecutive fixes were converted to segment speeds and cleaned with plausibility filters (time gap > 3 s, distance < 1000 m, speed 0–150 km/h). Mean speeds were then aggregated by day of week and emergency signal status. The resulting model exhibits a stable, large offset between driving with and without signals and a systematic weekly pattern with a Friday minimum. For the case study we adopted the Tuesday model, representing the peak of the flood event and used as the basis for the visualizations: 37.2 km/h without signals and 61.8 km/h with signals—for map legibility these are referred to as the 38 and 62 km/h variants. The model is empirical but transferred from another region and applied uniformly to all road classes, so absolute travel times should be read as scenario estimates rather than site-specific predictions. Section 3.4 examines how sensitive the results are to this choice.

2.7. Accessibility and Routing Module

The road network (with or without flood barriers) is transformed into a weighted graph whose nodes are endpoints and vertices of road segments and whose edge weights are traversal times, i.e., segment length divided by the model speed. From any ambulance position, Dijkstra’s algorithm computes minimum travel times to all reachable nodes, and segments satisfying the statutory thresholds (8, 15, and 20 min) are buffered (75 m) and merged into isochrone corridors. In the interactive client these corridors are rendered over a basemap together with the vehicle position and administrative boundaries. The print figures in Section 3.3 use a simplified line rendering without a basemap for reproduction clarity. Four scenario variants are produced by crossing network state (pre-flood, NOR; during-flood with barriers, BAR) with speed model (38 and 62 km/h). The same in-memory graph serves point-to-point routing in the web client, where the dispatcher selects ambulance and patient locations and conditions (day of week, weather, and signals) and receives the route with distance and estimated arrival time. All accessibility results in this paper describe a single-station scenario with one ambulance position at a time—mutual aid from stations in neighboring districts is not modeled.

3. Results

3.1. Flood Extent and Comparison with Reference Products

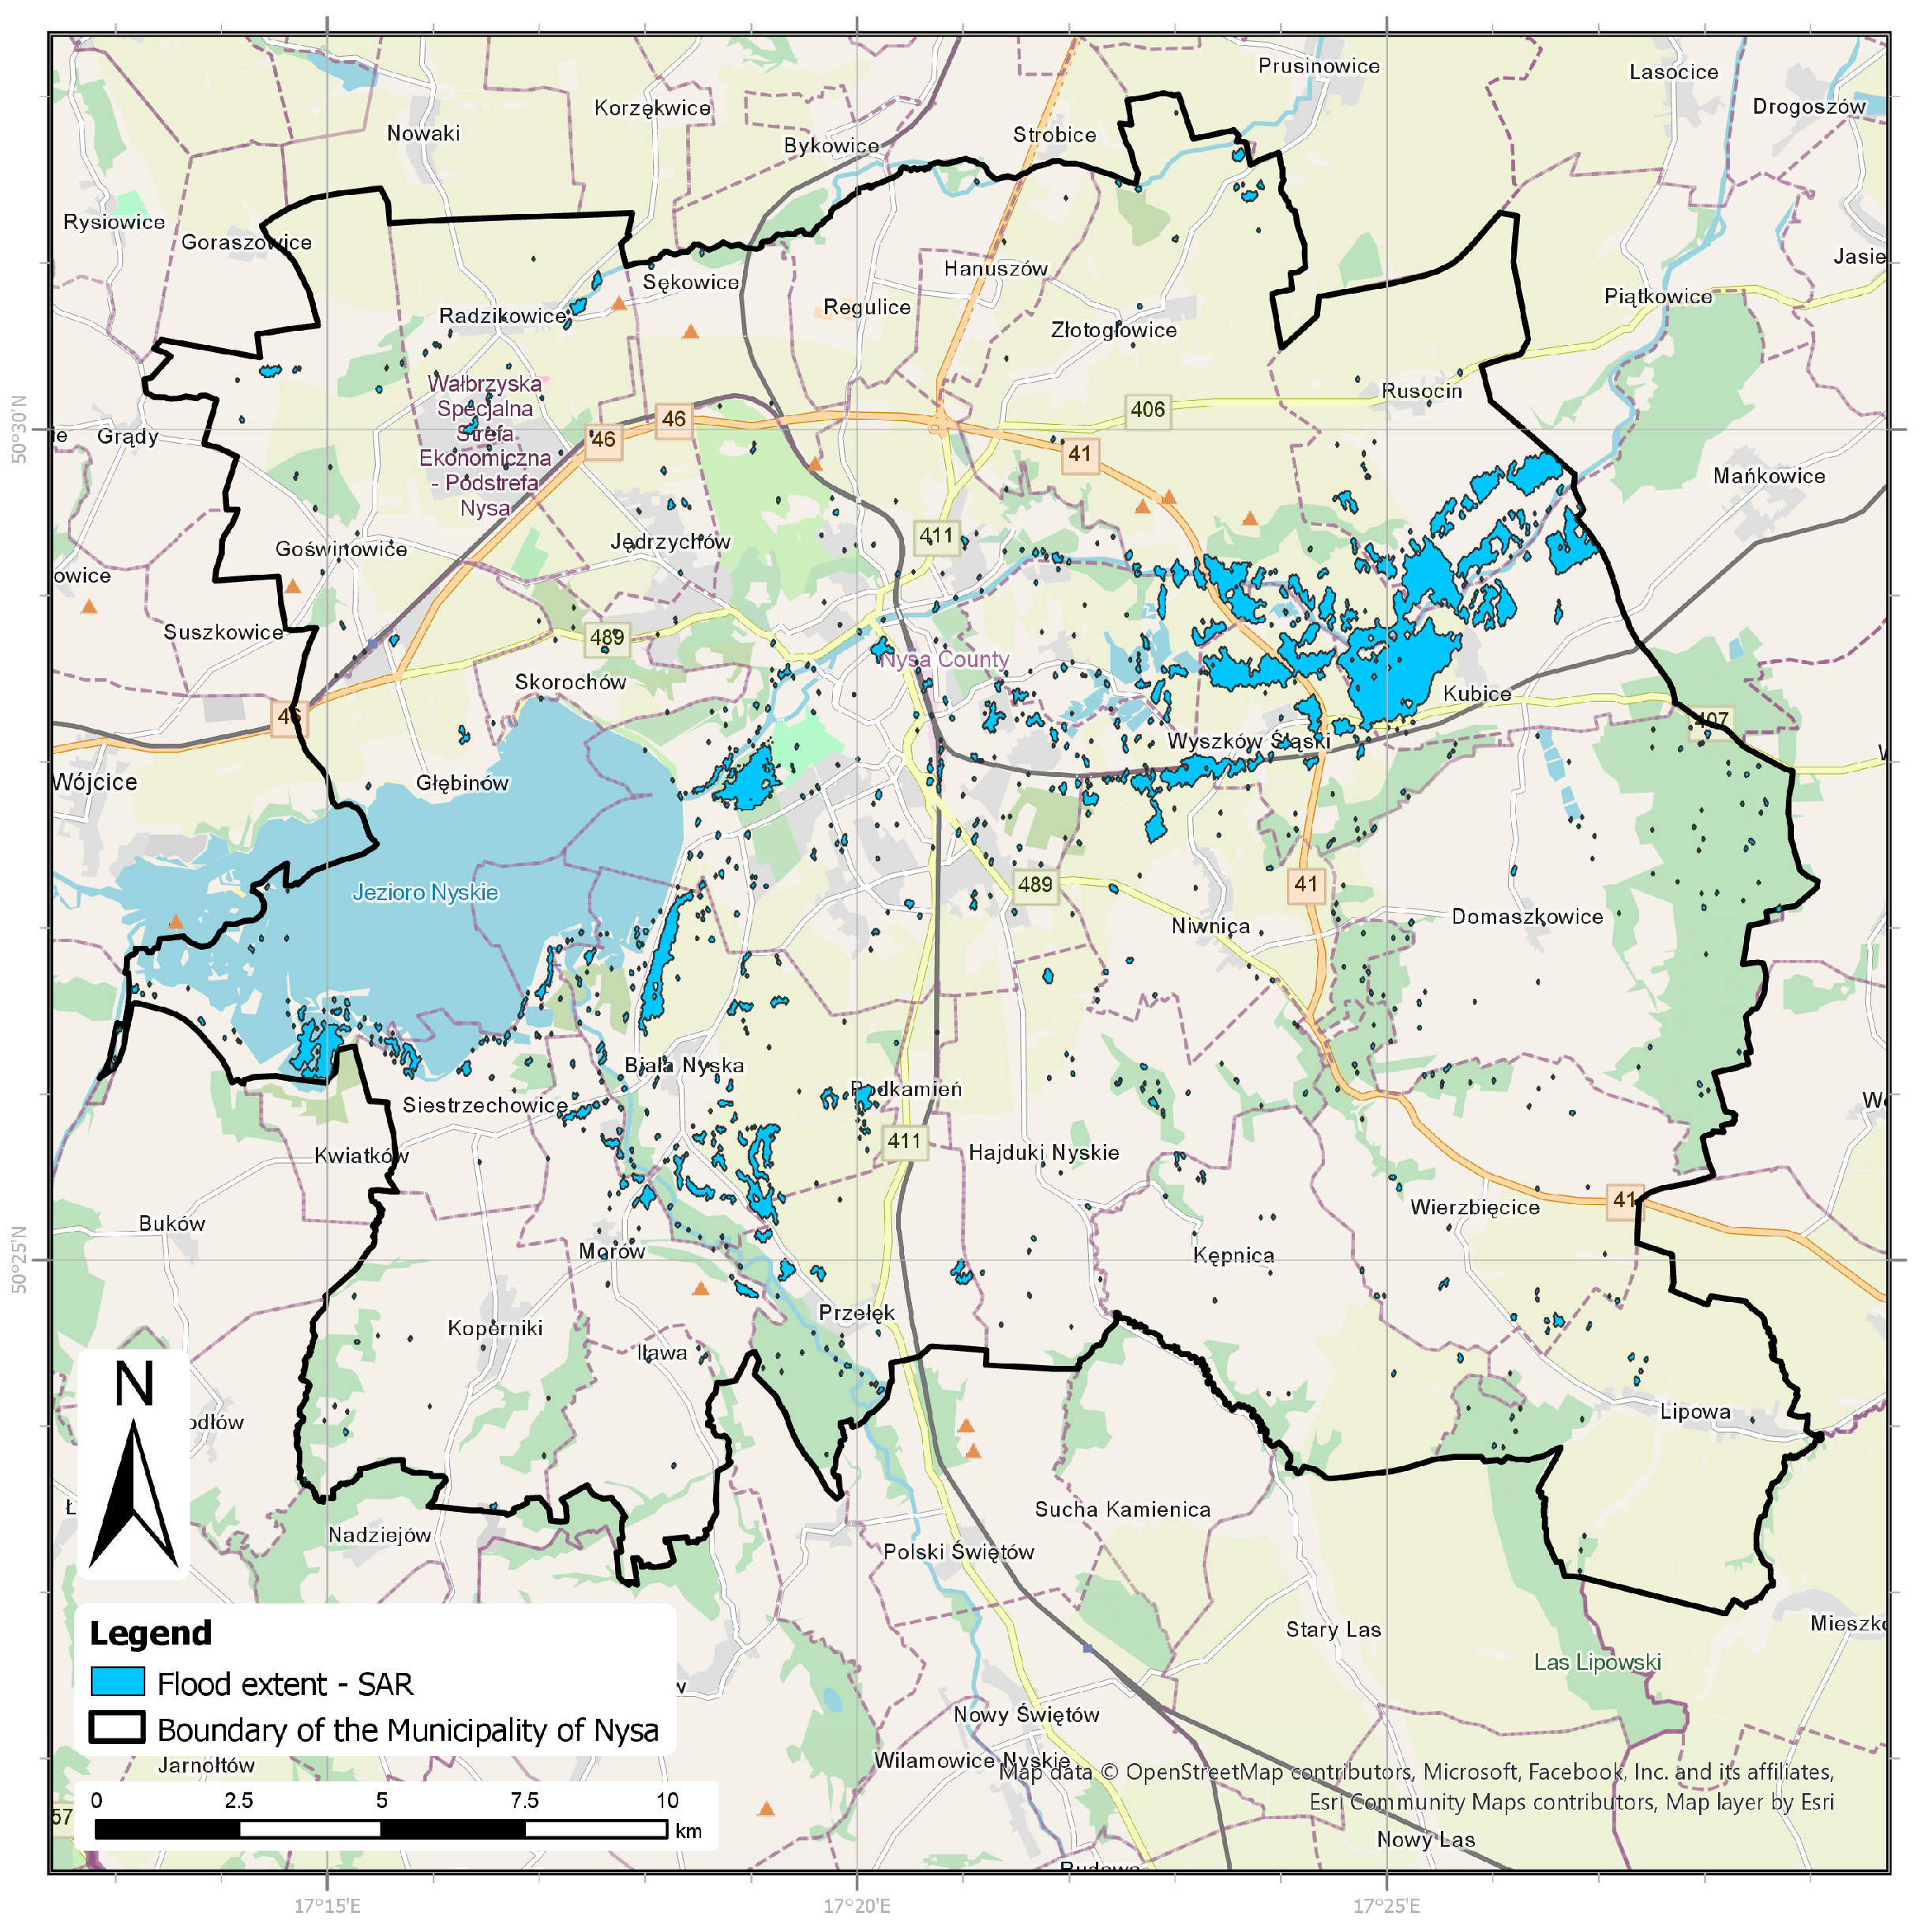
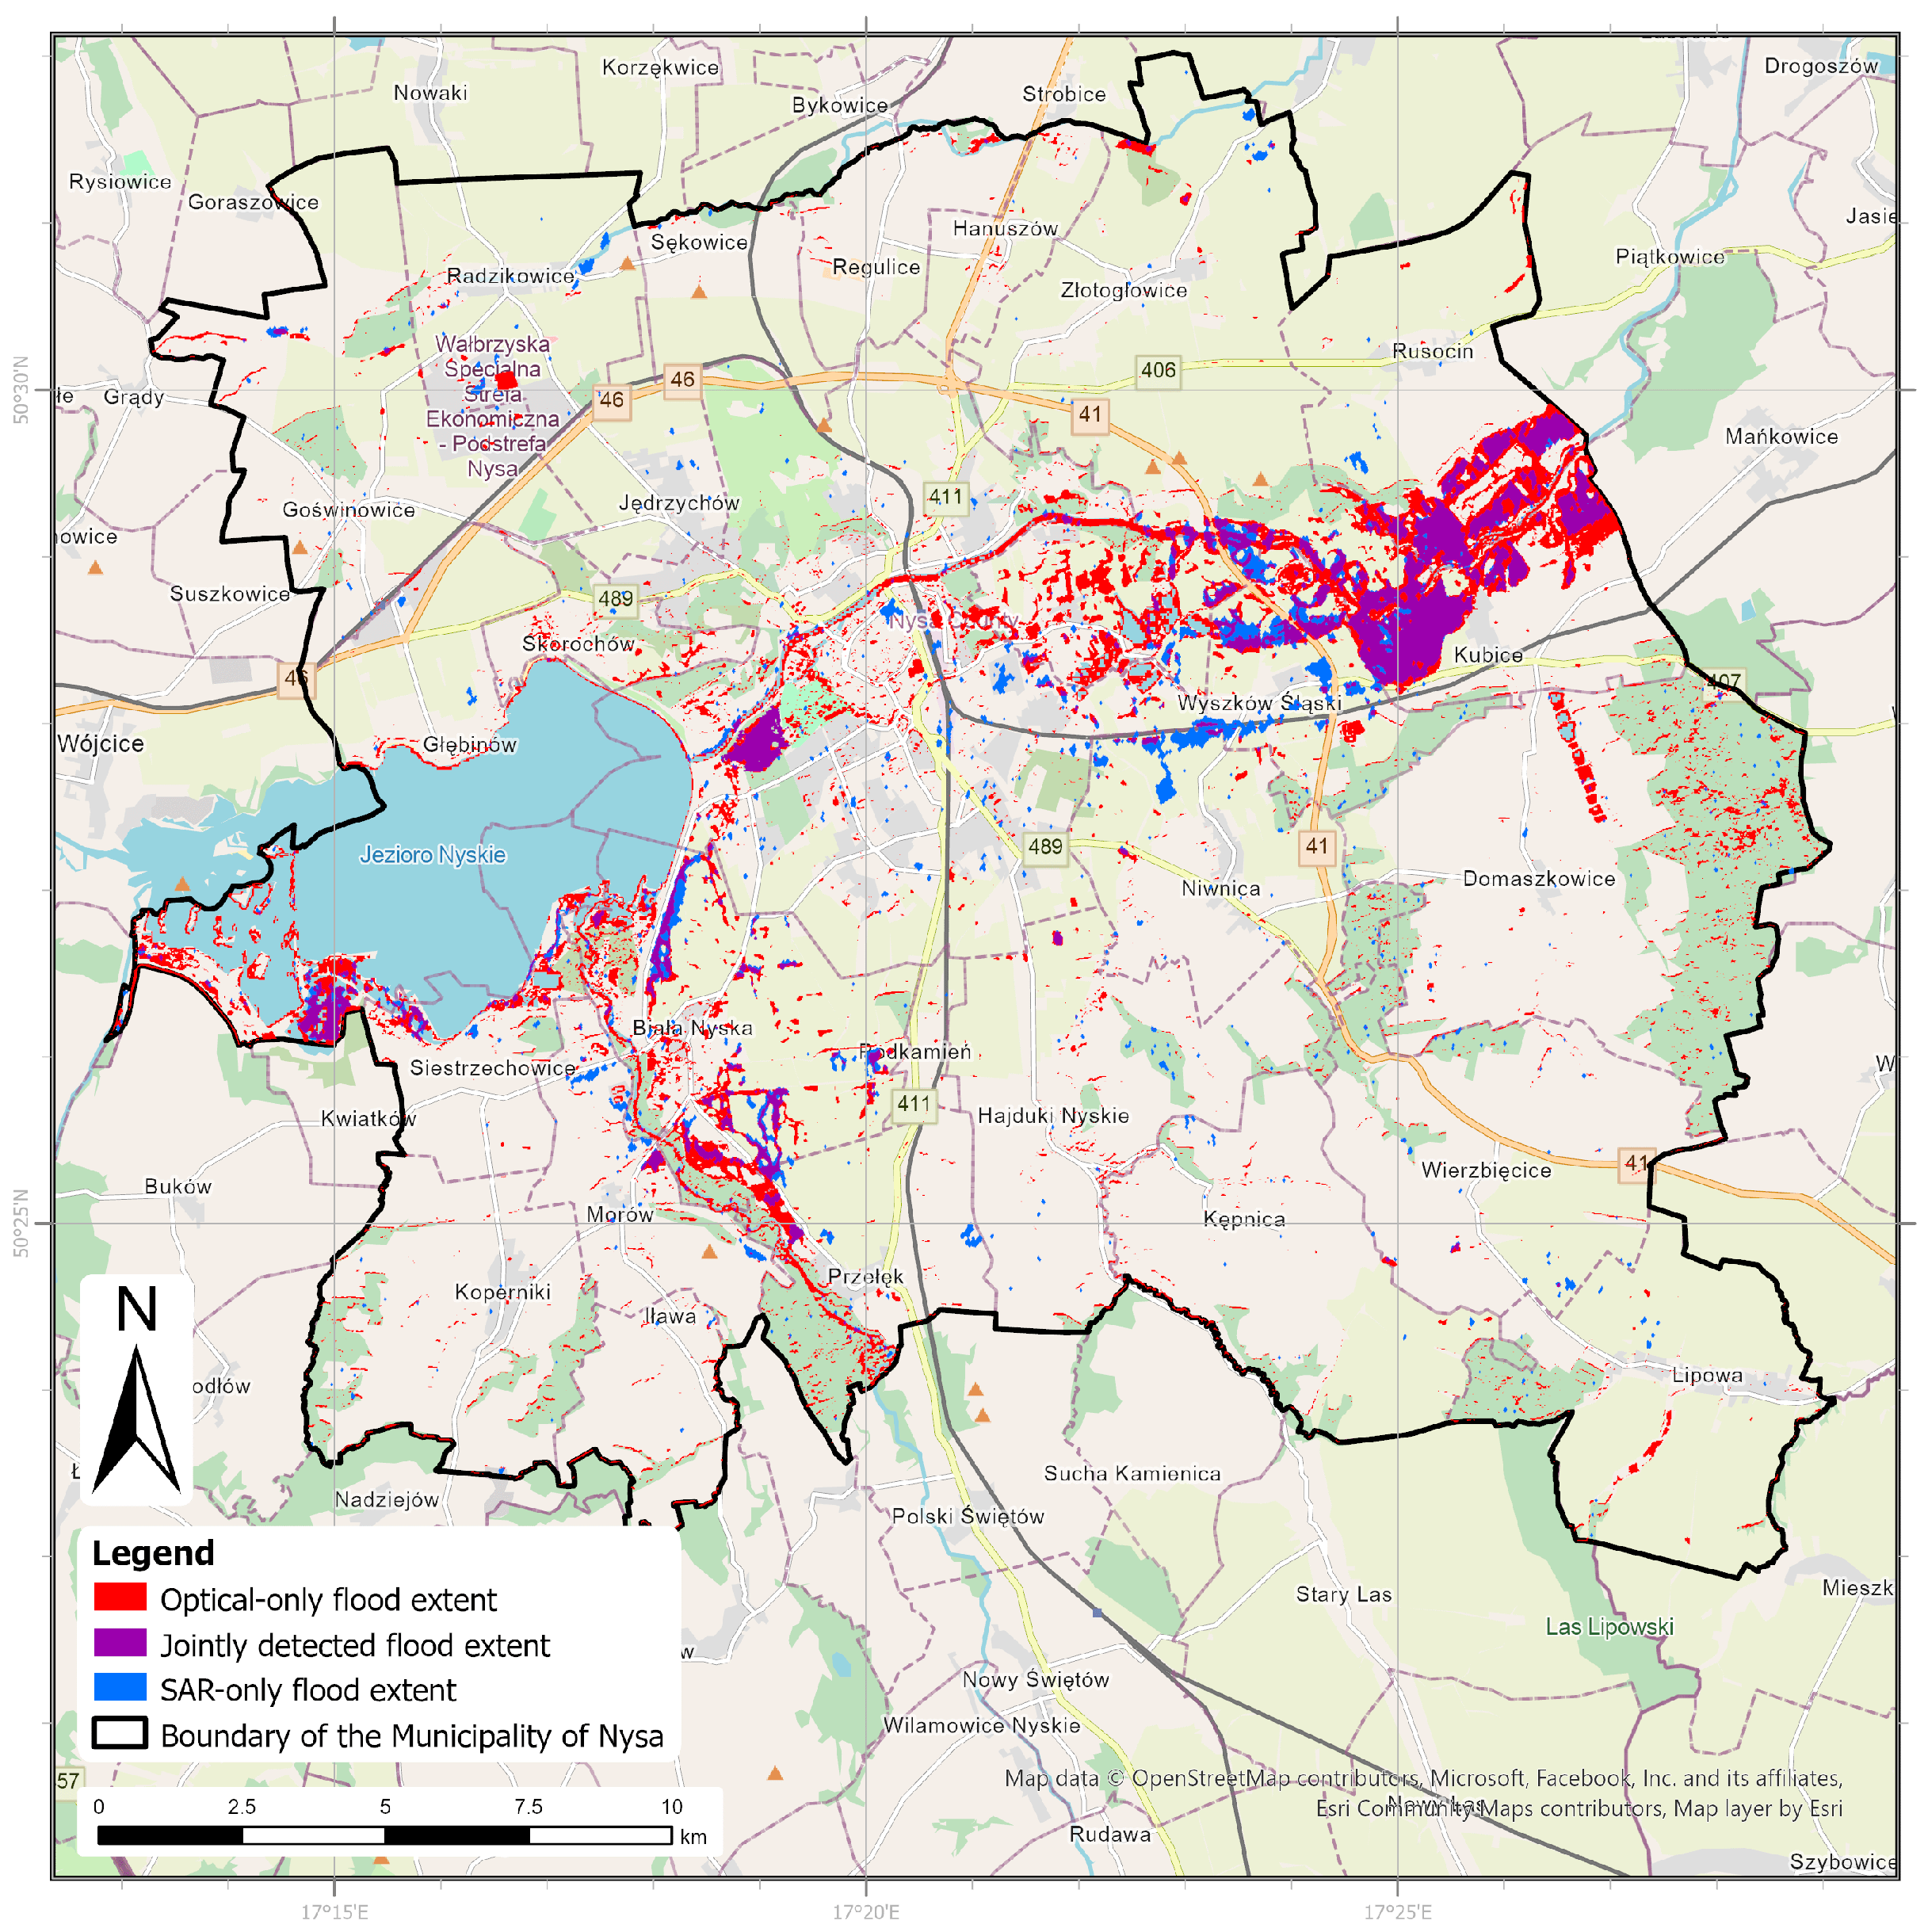
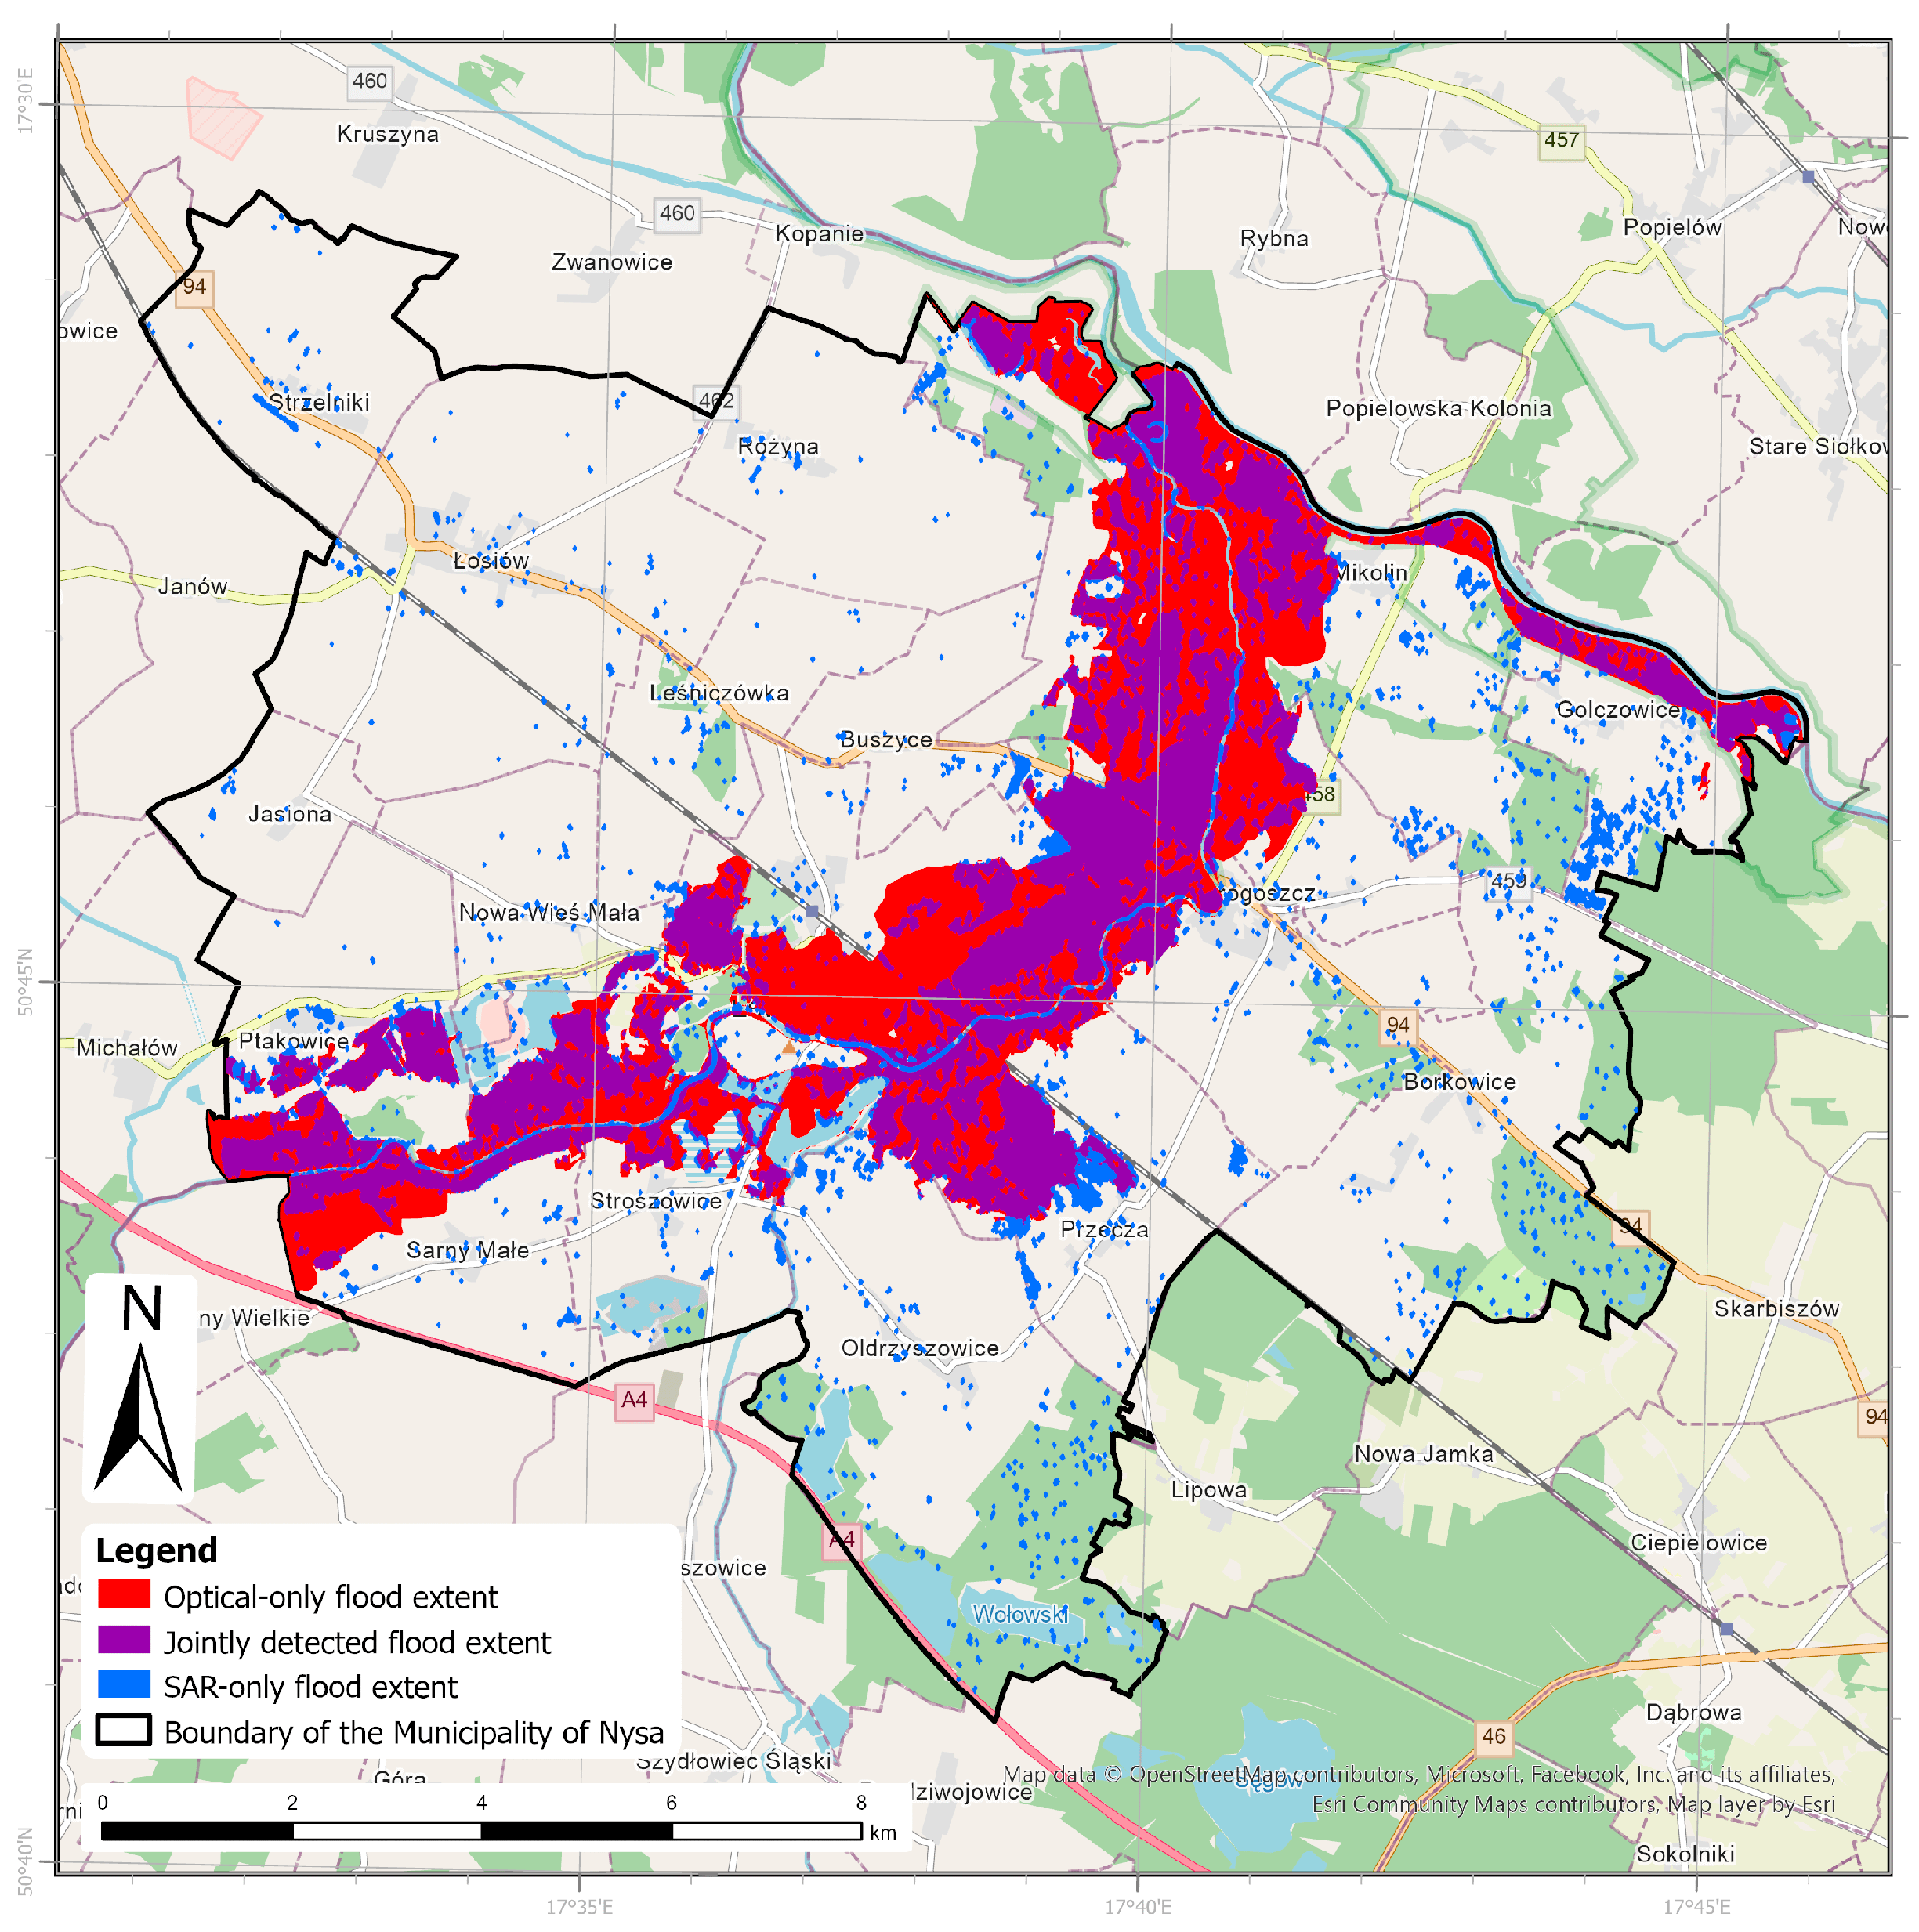
From the 15 September 2024 acquisition, the SAR module delineated 665 ha of inundation, i.e., 3.1% of the municipality (Figure 3). The mapped extent concentrates along the river valleys and around the Nysa Lake reservoir, with additional scattered patches on agricultural and built-up land. Comparison with the first cloud-free Sentinel-2 optical acquisition of 18 September shows substantial spatial overlap along the main river corridors (Figure 4). The optically derived extent is more than twice as large, covering 1434 ha, i.e., 6.6% of the municipality (Table 2). Because the two acquisitions represent different phases of the flood event, the optical comparison is used primarily as a complementary product-level assessment, while the quantitative flood extent evaluation is based on the independent CEMS reference product.
To provide an independent quantitative assessment of the SAR-derived flood extent, the operational mask was evaluated against the Copernicus Emergency Management Service (CEMS) Rapid Mapping reference delineation for the September 2024 event (activation EMSR756, based on an 18 September 2024 acquisition and published on 21 September 2024). The CEMS area of interest footprint was intersected with the administrative boundary of the Municipality of Nysa to define the common evaluation domain, and both the Sentinel-1 SAR flood mask and the CEMS delineation were clipped to this extent prior to the confusion matrix analysis. Within this common domain, the comparison yielded a precision of 0.5151, recall of 0.5824, F1-score of 0.5467, and intersection-over-union (IoU) of 0.3762. Spatial block bootstrap using 1 km blocks and 1000 replicates yielded 95% confidence intervals of 0.339–0.635 for precision, 0.459–0.672 for recall, 0.396–0.646 for F1-score, and 0.247–0.477 for IoU.
The land-cover decomposition of the disagreement showed that both omission and commission errors occurred predominantly over agricultural land. Cropland accounted for 54.2% of the SAR-only area (false positives) and 64.4% of the CEMS-only area (false negatives). Tree cover represented 17.1% of false positives and 12.3% of false negatives, while grassland accounted for 6.5% and 11.5%, respectively. Built-up areas represented 8.8% of false positives and 3.0% of false negatives. Cropland also accounted for 87.8% of the jointly detected inundation.

3.2. Road Passability and Communication Barriers

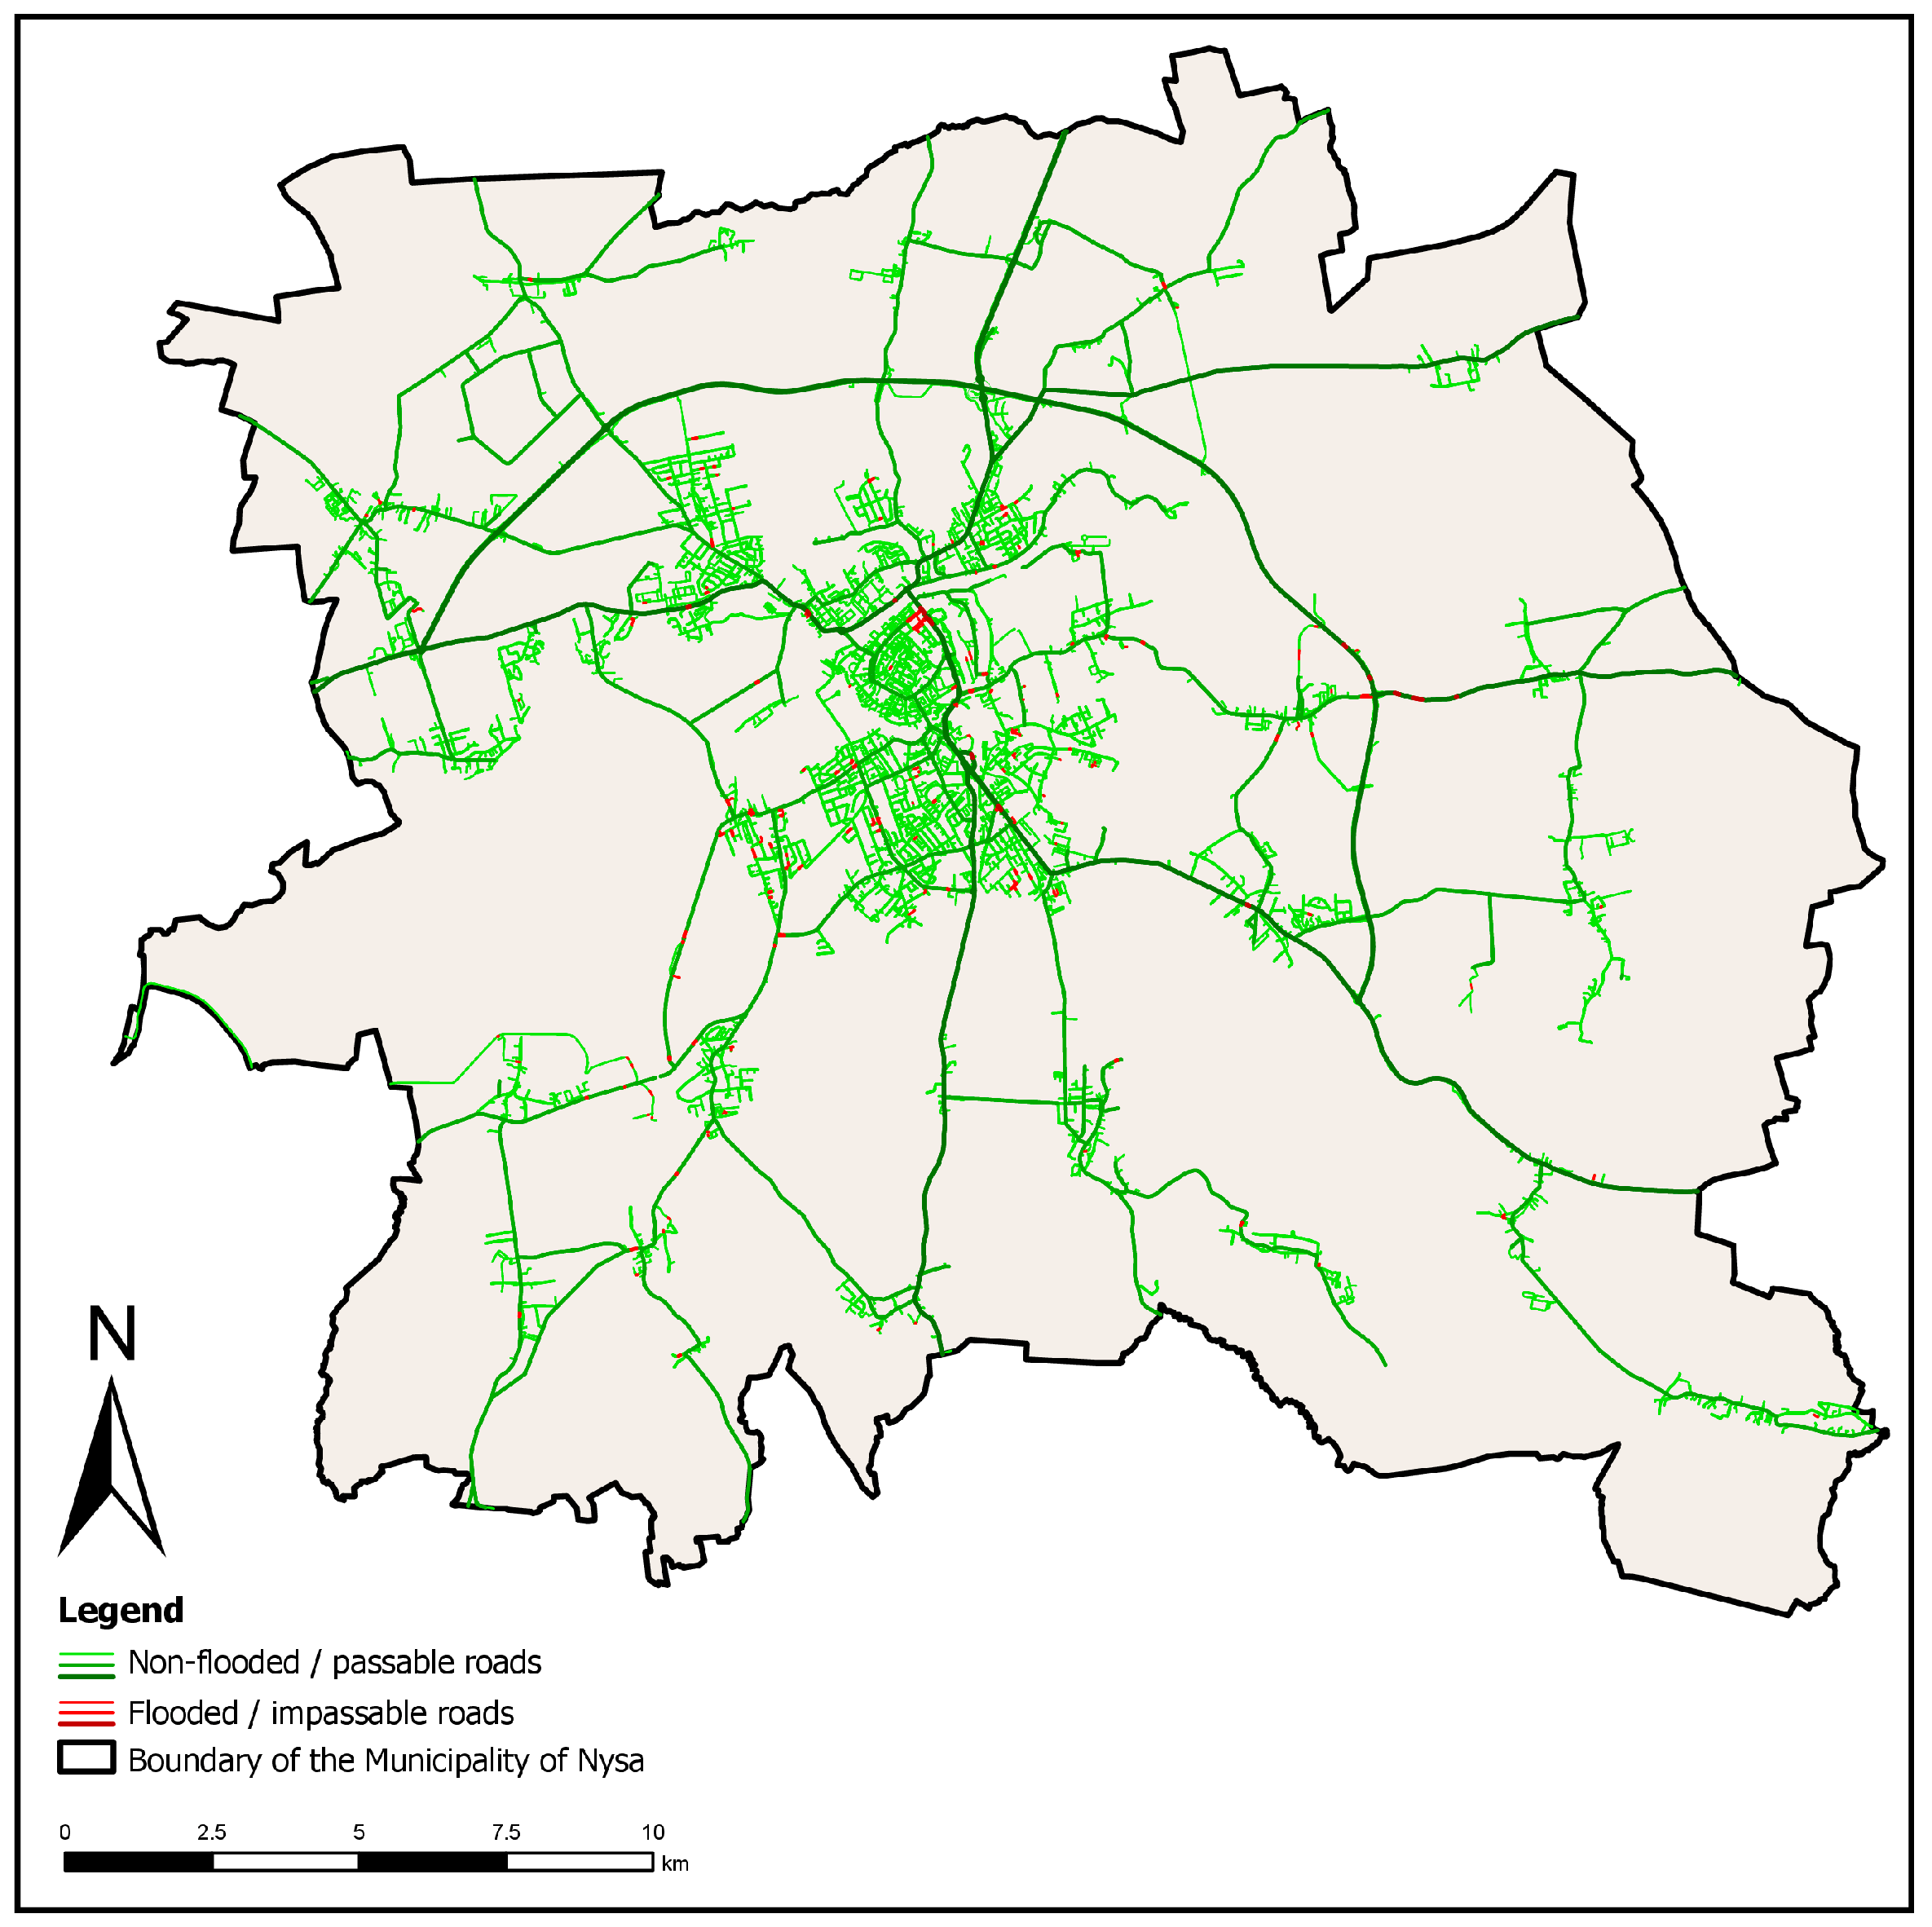
Intersecting the SAR flood mask with the 656.7 km routing network classified 8.51 km as impassable and produced 508 barrier points—the same overlay with the reference optical mask yielded 17.32 km and 1006 points (Table 3; Figure 5). For reference, applying the SAR overlay to the full OpenStreetMap network of the municipality (about 1800 km, including service and internal roads and dual carriageways represented as separate line objects) marked 18.9 km as impassable. All statistics reported in the subsequent accessibility analysis refer to the cleaned 656.7 km routing network so that passability and accessibility remain directly comparable. In both products, the identified barriers were concentrated along the river corridors and around the Nysa Lake reservoir, with several clusters affecting connections between the town of Nysa and settlements to the west and southwest.
As a fit-for-purpose comparison, the two passability classifications were evaluated segment by segment. Length-weighted agreement was 96.2%, whereas class-specific measures for the impassable-road class were substantially lower: precision was 0.036, recall 0.018, and IoU 0.012, with only 0.31 km of road segments classified as impassable by both products (Table 3). Way-level bootstrap with 1000 replicates, resampling entire road objects to account for spatial dependence along roads, yielded 95% confidence intervals of 0.015–0.062 for precision, 0.008–0.030 for recall, 0.005–0.021 for IoU, and 95.7–96.5% for length-weighted agreement.

3.3. Accessibility Under Flood Conditions

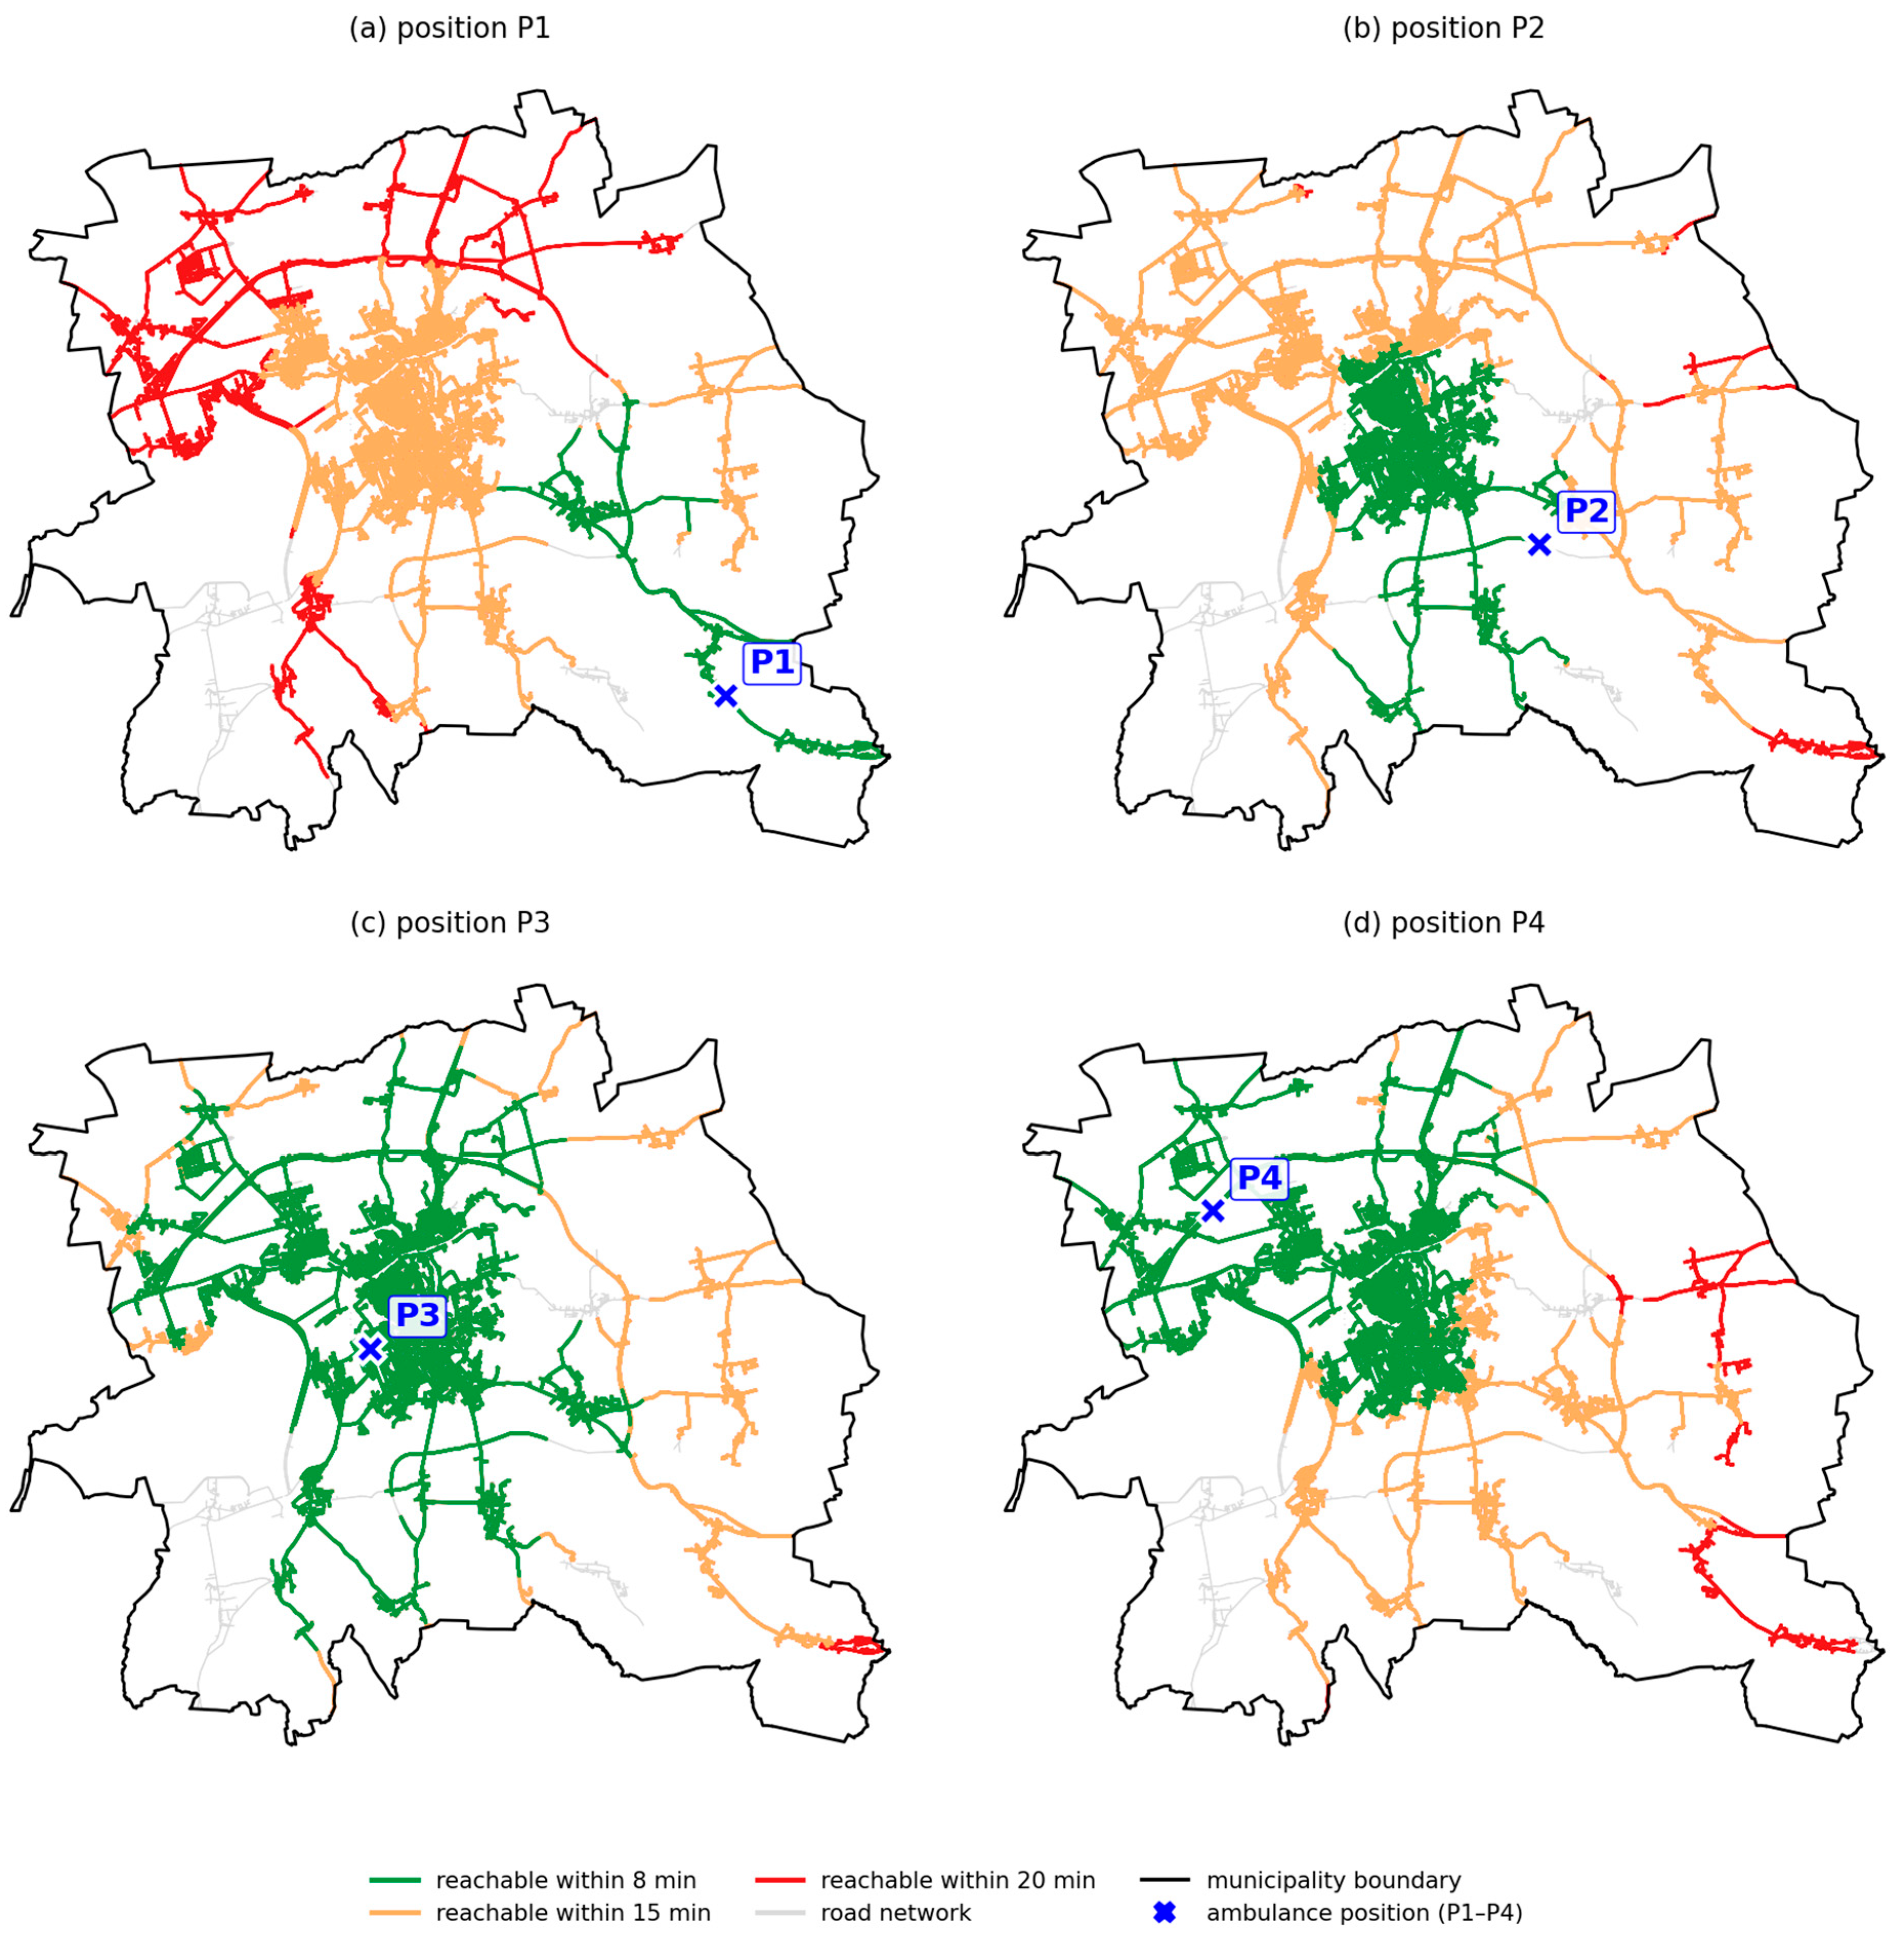
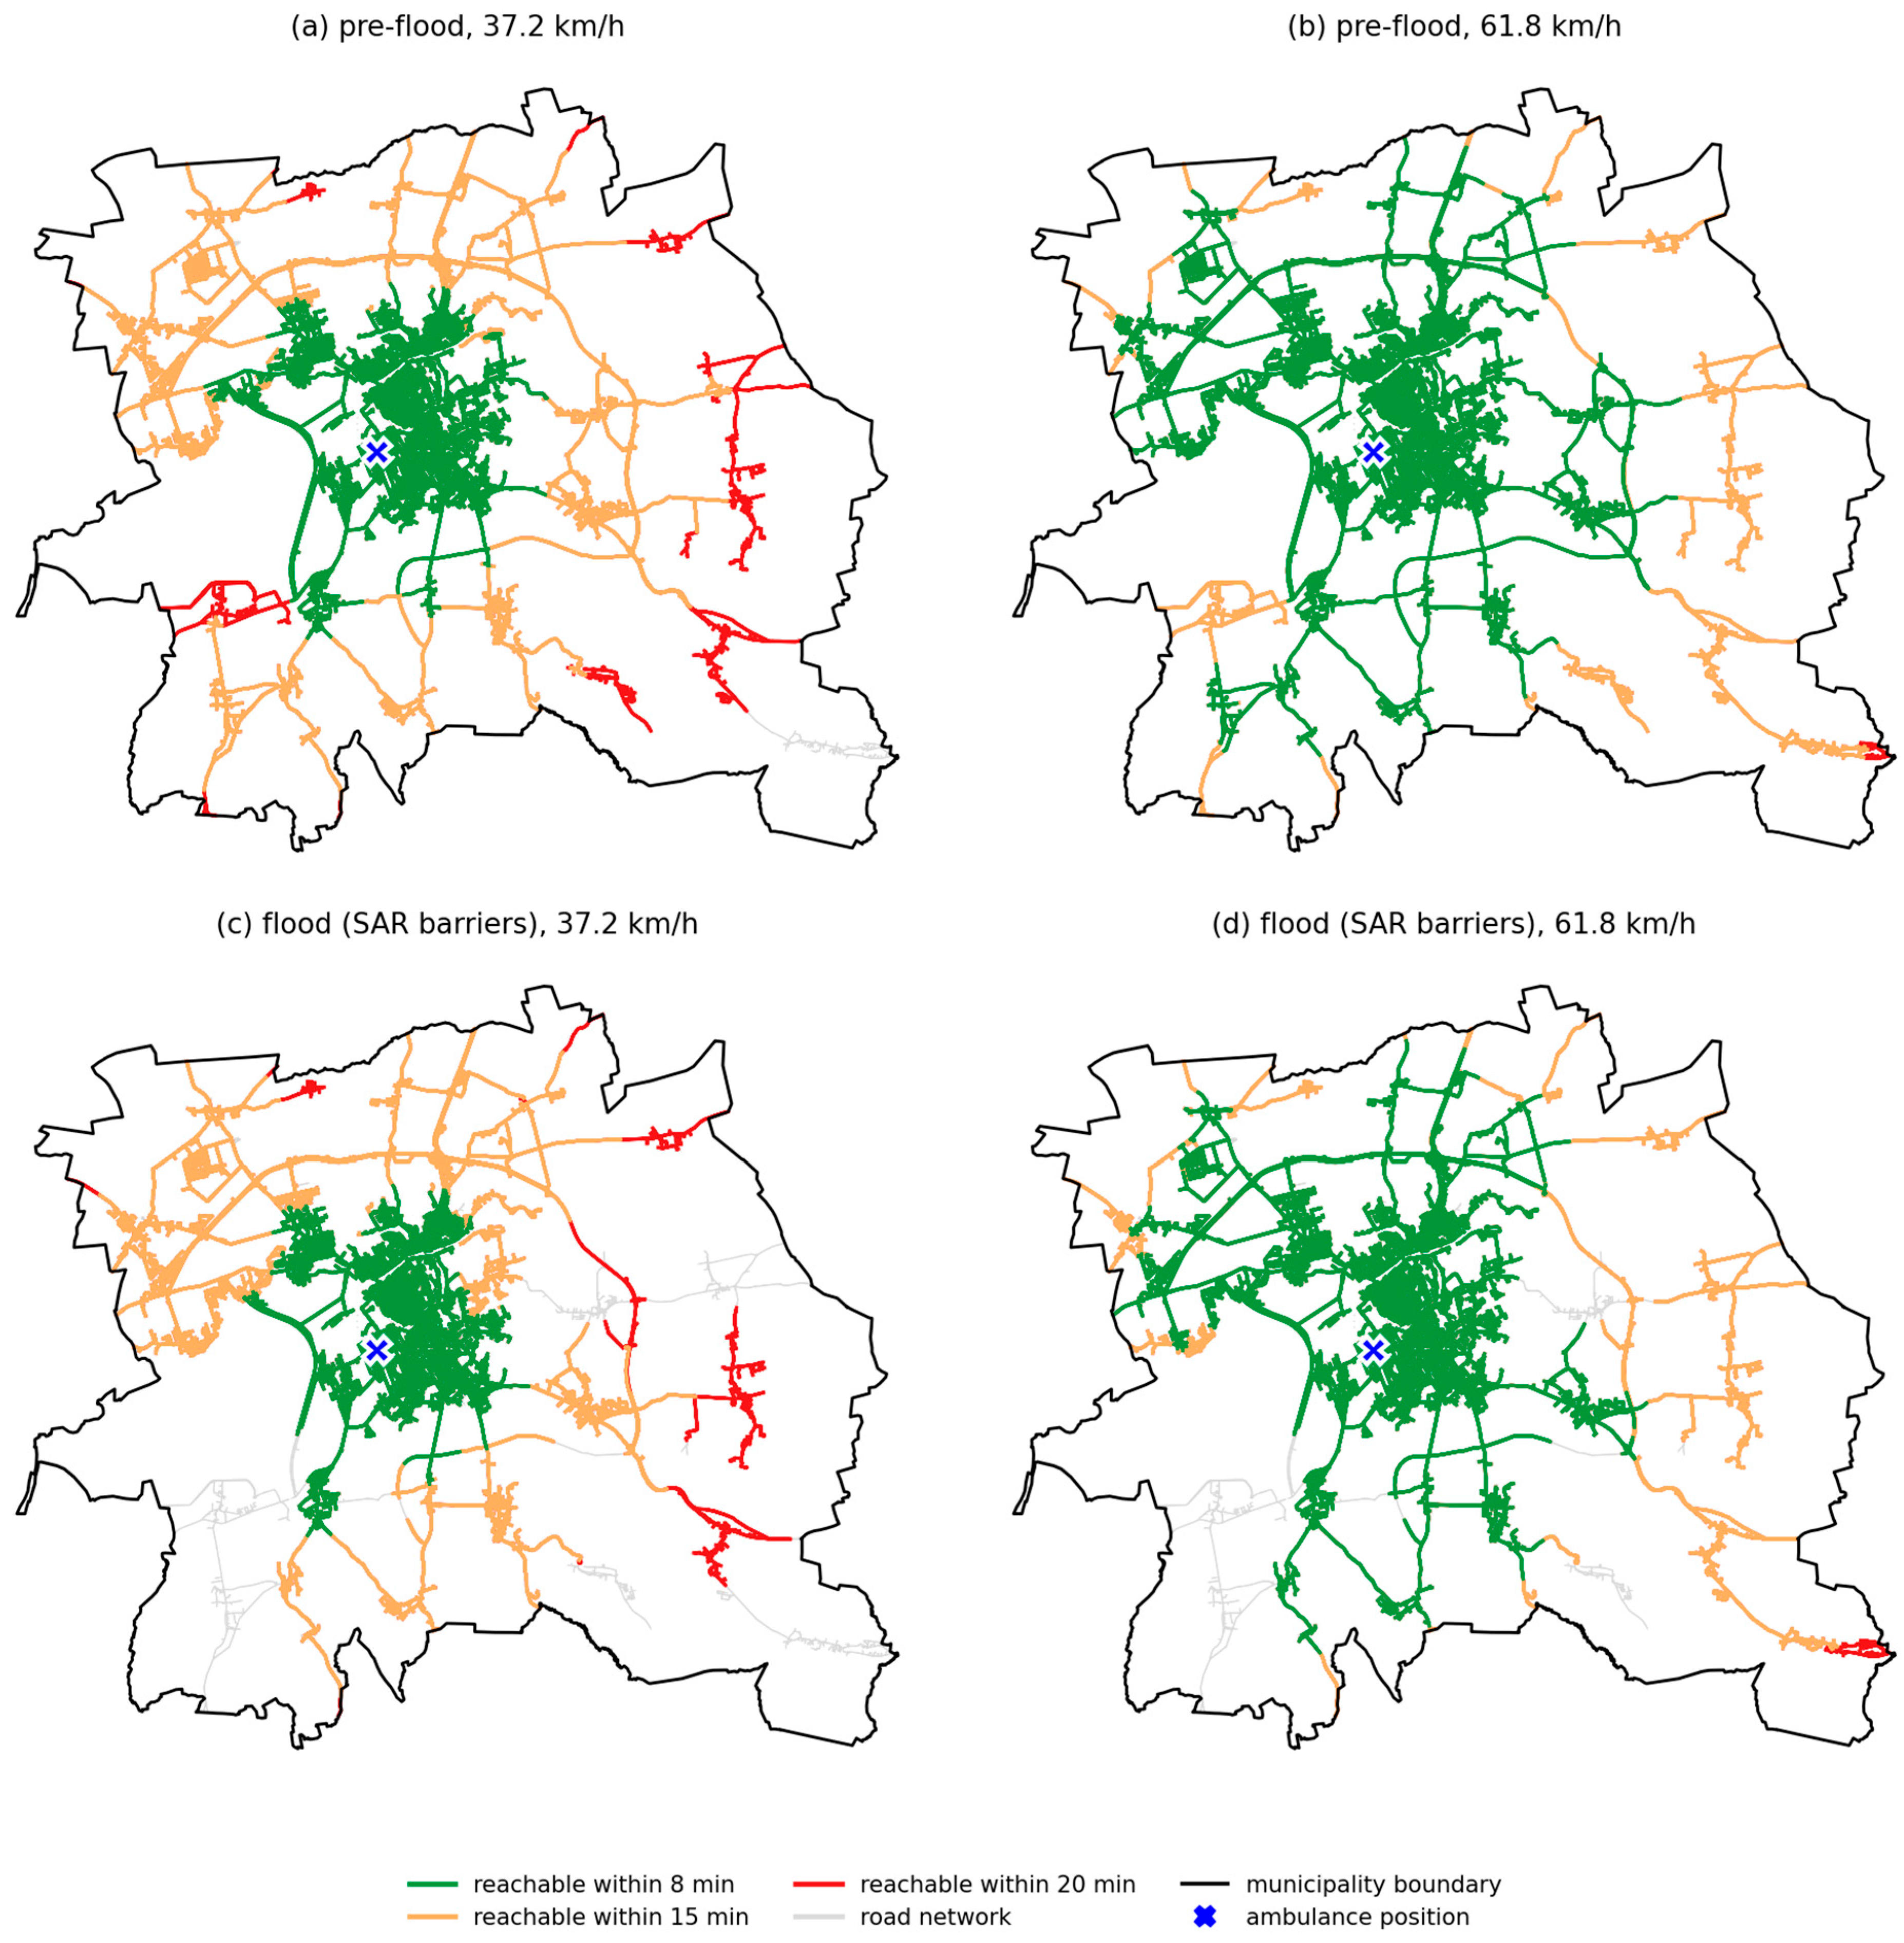
Figure 6 shows the four accessibility variants for an ambulance located centrally in the town of Nysa, and Table 4 quantifies them as the share of the routing network length reachable within each statutory threshold (all percentages relative to the 656.7 km pre-flood routing network). All statistics refer to the cleaned 656.7 km routing network, and the passability visualization in Figure 5 (Section 3.2) additionally shows minor service roads present in the raw OpenStreetMap data. Under normal conditions (NOR), the 37.2 km/h model reaches 49.4% of the network within 8 min and 97.8% within 20 min, while the 61.8 km/h model extends this to 83.5% and 99.3%. With the SAR-derived barriers the loss is moderate in aggregate terms: 8 min coverage drops to 42.5% and 15 min coverage from 88.3% to 79.6% without signals, and emergency signals restore 8 min coverage to 73.6%. The aggregate figures are, however, spatially uneven. The barriers concentrate in the southwest, where the severed crossings of the Biała Głuchołaska leave the villages of Koperniki and Siestrzechowice without any available route from the EMS station at either modeled speed, whereas the dense urban grid of Nysa remains fully reachable. Table 5 translates the coverage into inhabitants using the 2021 census populations of the municipality’s localities. Figure 7 reports coverage for four ambulance positions (P1–P4) along a simulated southeast to northwest transect during the flood. The modeled arrival times change markedly between the four positions.

3.4. Sensitivity of the Accessibility Estimates

Two assumptions with the greatest potential to bias the results were varied: the transferred vehicle speeds and the definition of a road barrier. Varying both speed models by ±20% does not change the qualitative picture. Without signals, the 8 min share of the pre-flood network ranges from 37.4% to 56.3% around the central 49.4%, and with SAR-derived barriers from 30.3% to 50.1% around 42.5%. The gap between driving with and without signals persists in every speed scenario, and the villages cut off in Table 5 remain cut off, since no speed helps where no road exists. The ordering of the scenarios in Table 4 is unchanged in all cases. As an additional local plausibility check, a static speed model was built for Nysa from OpenStreetMap speed limits and road classes (ambulance speed equal to the legal limit, with class defaults where no limit is mapped—limits are mapped for 23% of segments). On the pre-flood network this model reaches 67.7% of the network within 8 min, between the 49.4% of the 37.2 km/h model and the 83.5% of the 61.8 km/h model, and its settlement travel times are likewise bracketed by the two empirical variants (for Koperniki, 7.1 min against 11.0 and 6.6 min).
Table 6 contrasts the operational SAR-derived barriers with four ways of deriving the impassable set from the reference optical mask (61.8 km/h model throughout). Blocking every segment that touches the optical mask removes 17.3 km of roads but collapses 15 min coverage to 39.8%, because severed bridges disconnect whole subnetworks. The corresponding population beyond the 20 min statutory maximum grows from 938 to more than 8000 (Table 5). Preserving segments tagged as bridges in OpenStreetMap restores 15 min coverage to 76.2% at almost identical removed length and ignoring flooded stretches shorter than 50 m raises it further to 90.7%—the same ordering holds for the 37.2 km/h model.
Finally, the detection threshold itself was varied from R = 1.15 to R = 1.55 in steps of 0.10, with the flood detection service rerun end-to-end for each value (Table 7). The response is monotonic and free of abrupt regime changes: lowering the threshold to 1.15 inflates the mapped extent to 883 ha and the impassable set to 17.3 km (968 barrier points), pushing 2548 inhabitants in 7 villages beyond the statutory maximum, while raising it to 1.55 shrinks the extent to 511 ha and dissolves nearly all barriers. The operational default R = 1.35 lies on the plateau of this response: across 1.25–1.45 the same two villages (Koperniki and Siestrzechowice) remain cut off and the population beyond 20 min stays within 938–1509. Coverage refers to the 61.8 km/h model. Flood areas come from the rerun of the detection service and differ from the Section 3.1 baseline by a few percent owing to re-vectorization.
To complement the downstream sensitivity analysis, the corresponding end-to-end rerun masks were additionally compared with the CEMS reference product. Within the central R = 1.25–1.45 range, agreement changed gradually rather than abruptly. At R = 1.25, precision, recall, F1-score, and IoU were 0.4488, 0.5670, 0.5010, and 0.3342, respectively. At R = 1.35, the corresponding values were 0.4979, 0.5415, 0.5188, and 0.3502, while at R = 1.45 they were 0.5399, 0.5191, 0.5293, and 0.3599. Thus, increasing the threshold within this range progressively increased precision while reducing recall, with only moderate changes in F1-score and IoU.

3.5. Transferability Assessment: Lewin Brzeski Case Study

To assess whether the operational flood detection chain can be transferred to another municipality without local calibration, the same workflow was applied to Lewin Brzeski. The additional case focuses on flood extent detection, independent verification, and identification of road segments intersecting the detected inundation. The complete ambulance accessibility and routing analysis remains demonstrated for Nysa, while the Lewin Brzeski case independently evaluates the portability of the event-driven flood and road impact components.

3.5.1. SAR-Derived Flood Extent

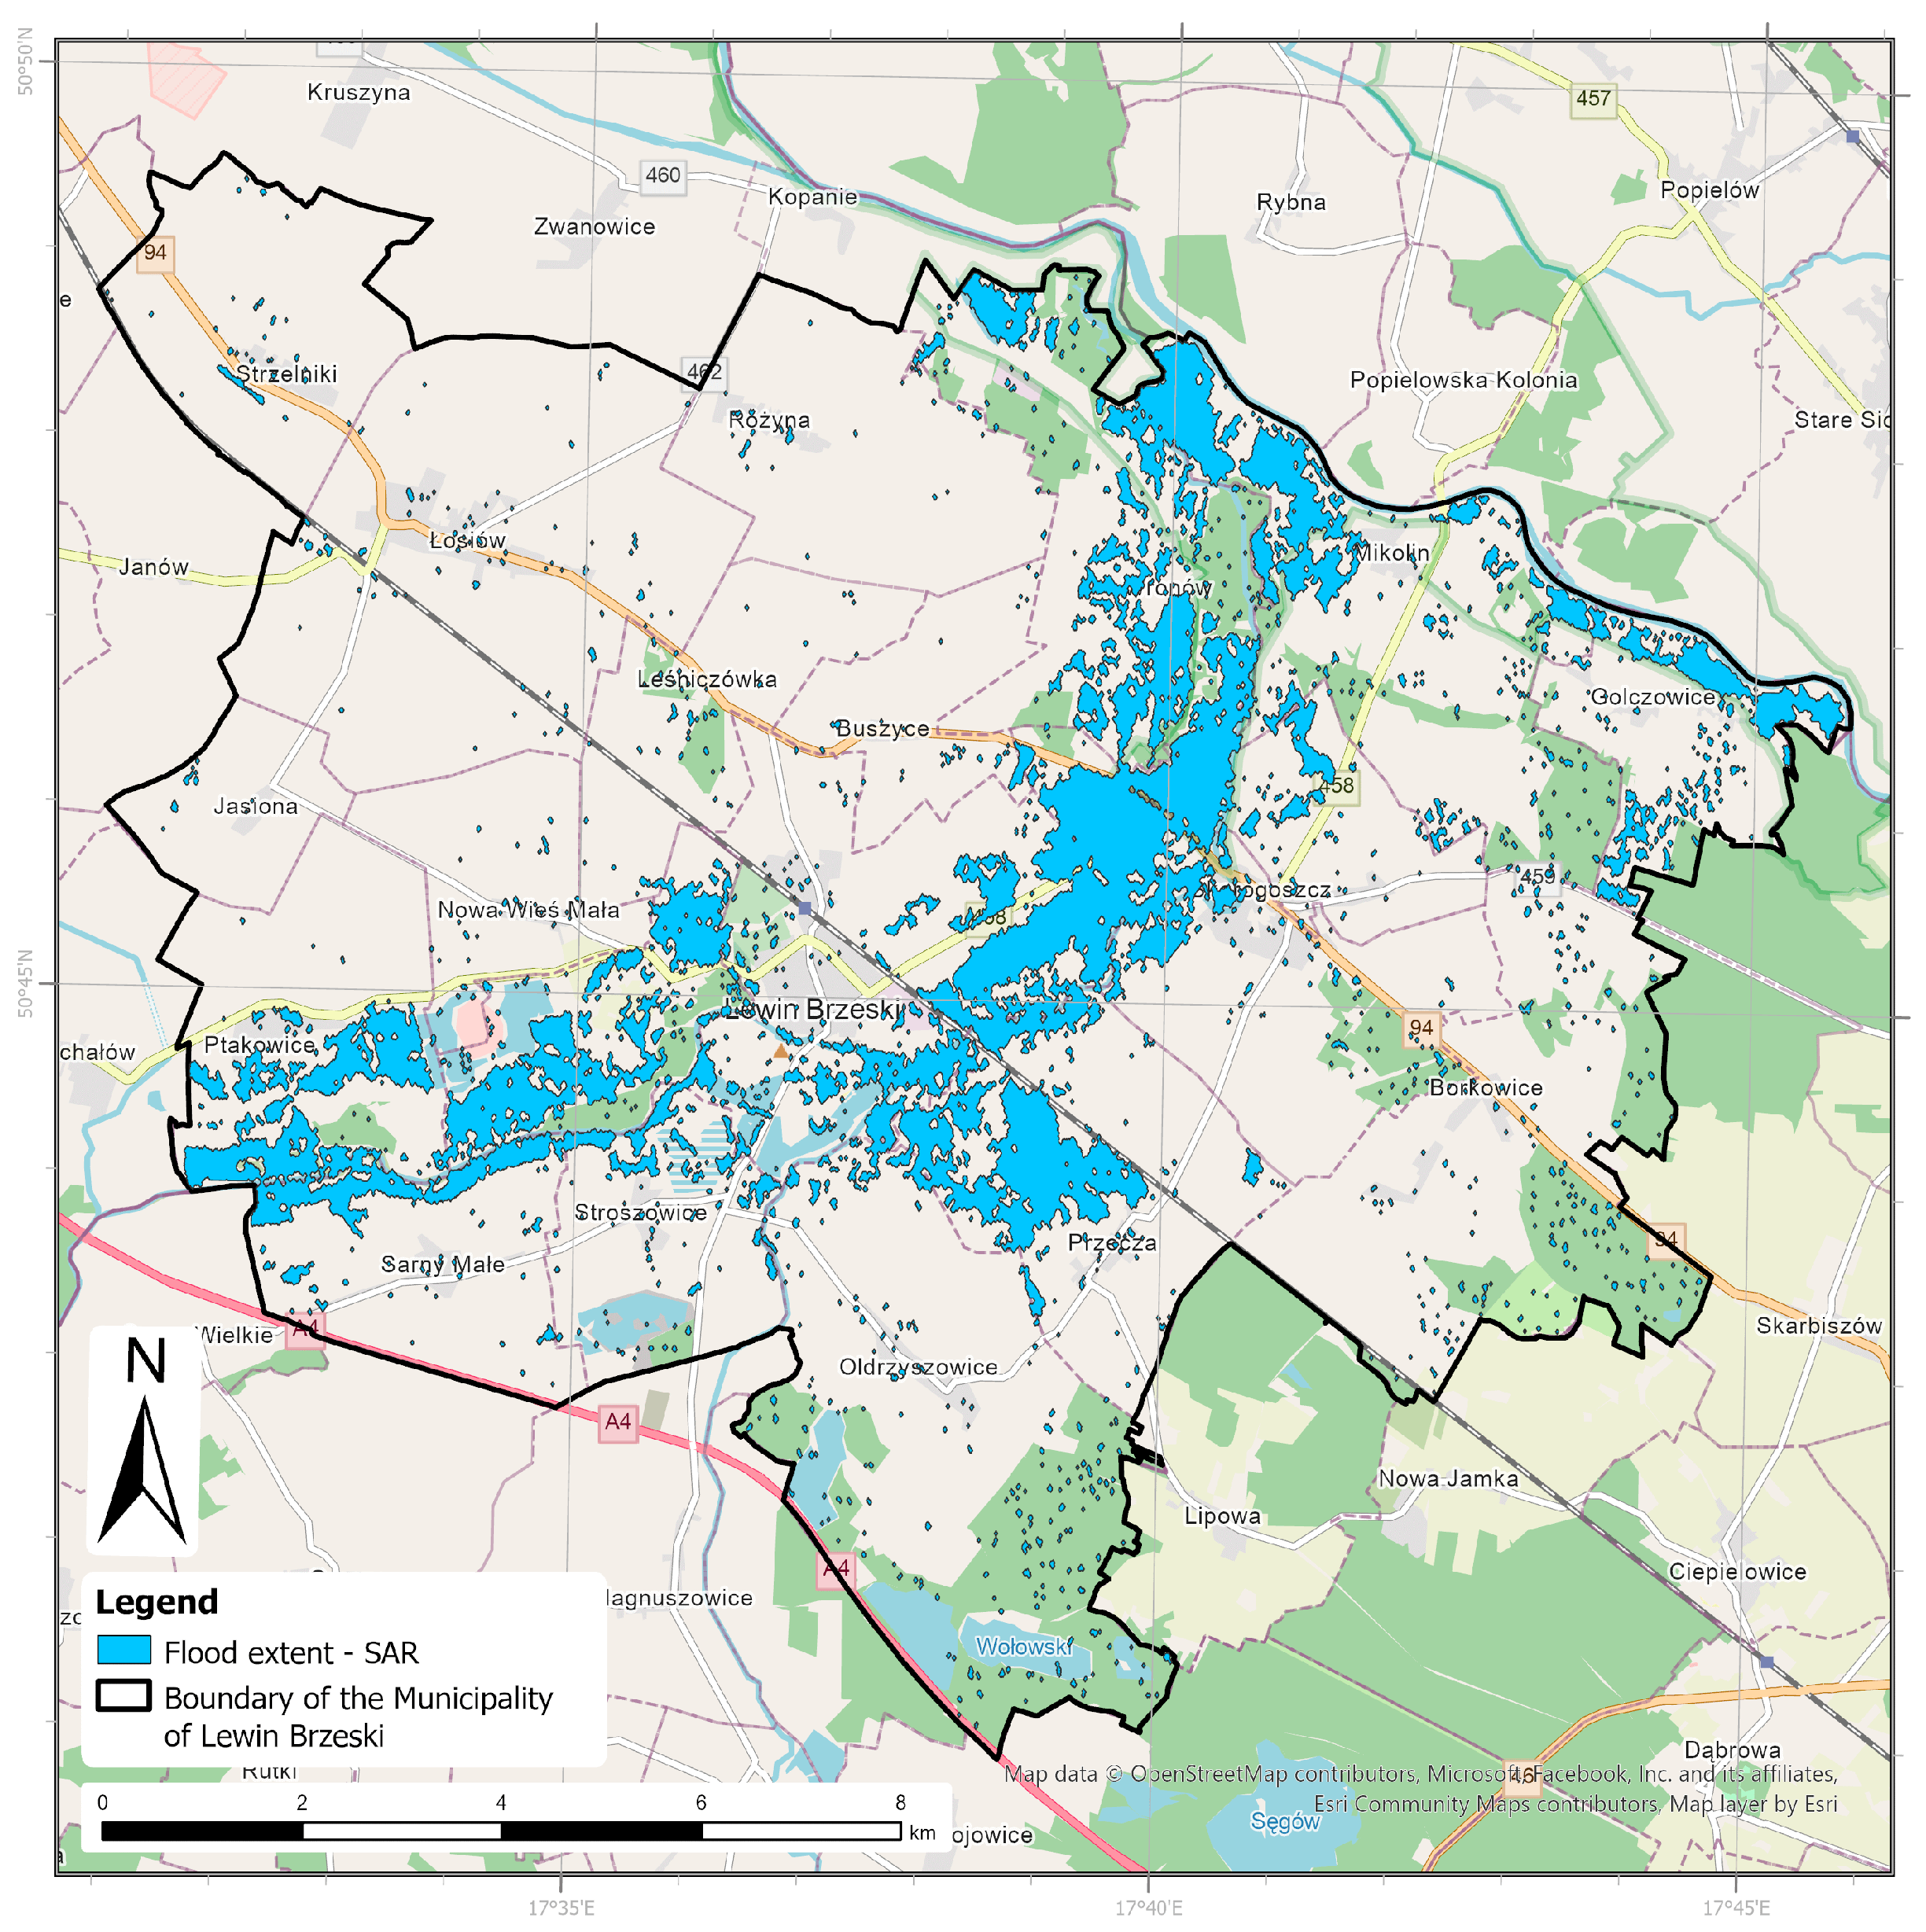
The automatic scene selection procedure paired the Sentinel-1A acquisition of 6 September 2024 with the acquisition of 18 September 2024, both from ascending relative orbit 175. Application of the unchanged processing chain delineated 1995.04 ha of inundation, equivalent to approximately 12.5% of the 15,970 ha municipality (Figure 8; Table 8).
The detected inundation forms a spatially coherent corridor corresponding to the broad Nysa Kłodzka floodplain. The largest continuous areas extend from Ptakowice and the western boundary through the town of Lewin Brzeski and toward Skorogoszcz, before continuing north through the Wronów–Mikolin area toward the Odra. Additional flood patches occur around the eastern floodplain near Golczowice and Borkowice and in low-lying agricultural areas south of the main river corridor. The mapped pattern corresponds to the municipality’s hydrographic structure. The workflow was applied with unchanged parameters, from a different orbit direction and over a different land-cover composition and valley geometry.

3.5.2. Comparison Against CEMS Reference Product

The SAR-derived extent was quantitatively evaluated against the independent CEMS Rapid Mapping reference delineation. Within the common evaluation domain, the SAR workflow mapped 1995.04 ha, while the CEMS product delineated 3164.28 ha. The two products jointly identified 1620.39 ha as inundated: 374.65 ha were mapped only by the SAR workflow and 1543.89 ha only by CEMS (Figure 9; Table 9). The resulting precision was 0.8122, recall 0.5121, F1-score 0.6281, and IoU 0.4579. Spatial block bootstrap using 1 km blocks and 1000 replicates yielded 95% confidence intervals of 0.763–0.852 for precision, 0.449–0.570 for recall, 0.573–0.672 for F1-score, and 0.402–0.506 for IoU.
The land-cover composition of the disagreement differed from that observed in Nysa. In Lewin Brzeski, cropland accounted for 49.4% of the SAR-only area and 52.7% of the CEMS-only area, while tree cover represented 29.3% and 28.1%, respectively. Grassland contributed 10.6% of false positives and 12.4% of false negatives, whereas built-up land accounted for 3.2% and 5.4%. Cropland also dominated the jointly detected inundation, representing 86.1% of the true-positive area.
The two products differ in acquisition timing. Lewin Brzeski experienced rapid inundation on 17 September. High-water conditions continued through 18 September, and the peak near the Nysa Kłodzka–Odra confluence was recorded on that day [25]. The Copernicus delineation is based on an optical acquisition from the morning of 18 September, whereas Sentinel-1A observed the municipality at 16:35 UTC on the same day. Spatially, the strongest agreement occurs along the central Nysa Kłodzka corridor and the northern floodplain, whereas Copernicus-only areas mainly expand the margins of the broad inundation zone and SAR-only detections occur primarily as smaller peripheral patches.
A post hoc adaptive-threshold benchmark was additionally performed using three variants of Otsu thresholding. Global Otsu applied directly to the linear ratio selected R = 5.622 for Nysa and R = 20.333 for Lewin Brzeski, resulting in F1-scores of 0.144 and 0.033, respectively. Applying Otsu to the logarithmic ratio produced thresholds equivalent to R = 0.413 and R = 1.076, with corresponding F1-scores of 0.108 and 0.635. Restricting the log-ratio histogram to the physically consistent R > 1 domain yielded equivalent thresholds of R = 2.512 and R = 3.837, with F1-scores of 0.449 and 0.372. For comparison, the R = 1.35 workflow achieved F1-scores of 0.519 and 0.628 in the corresponding end-to-end reruns. The small difference from the Nysa value reported in Section 3.1 (F1 = 0.547) arises because the benchmark and plateau comparisons use freshly recomputed end-to-end masks, whereas Section 3.1 evaluates the operational mask used throughout the paper. Re-vectorization of the rerun accounts for the residual discrepancy.

3.5.3. Flood-Affected Road Segments

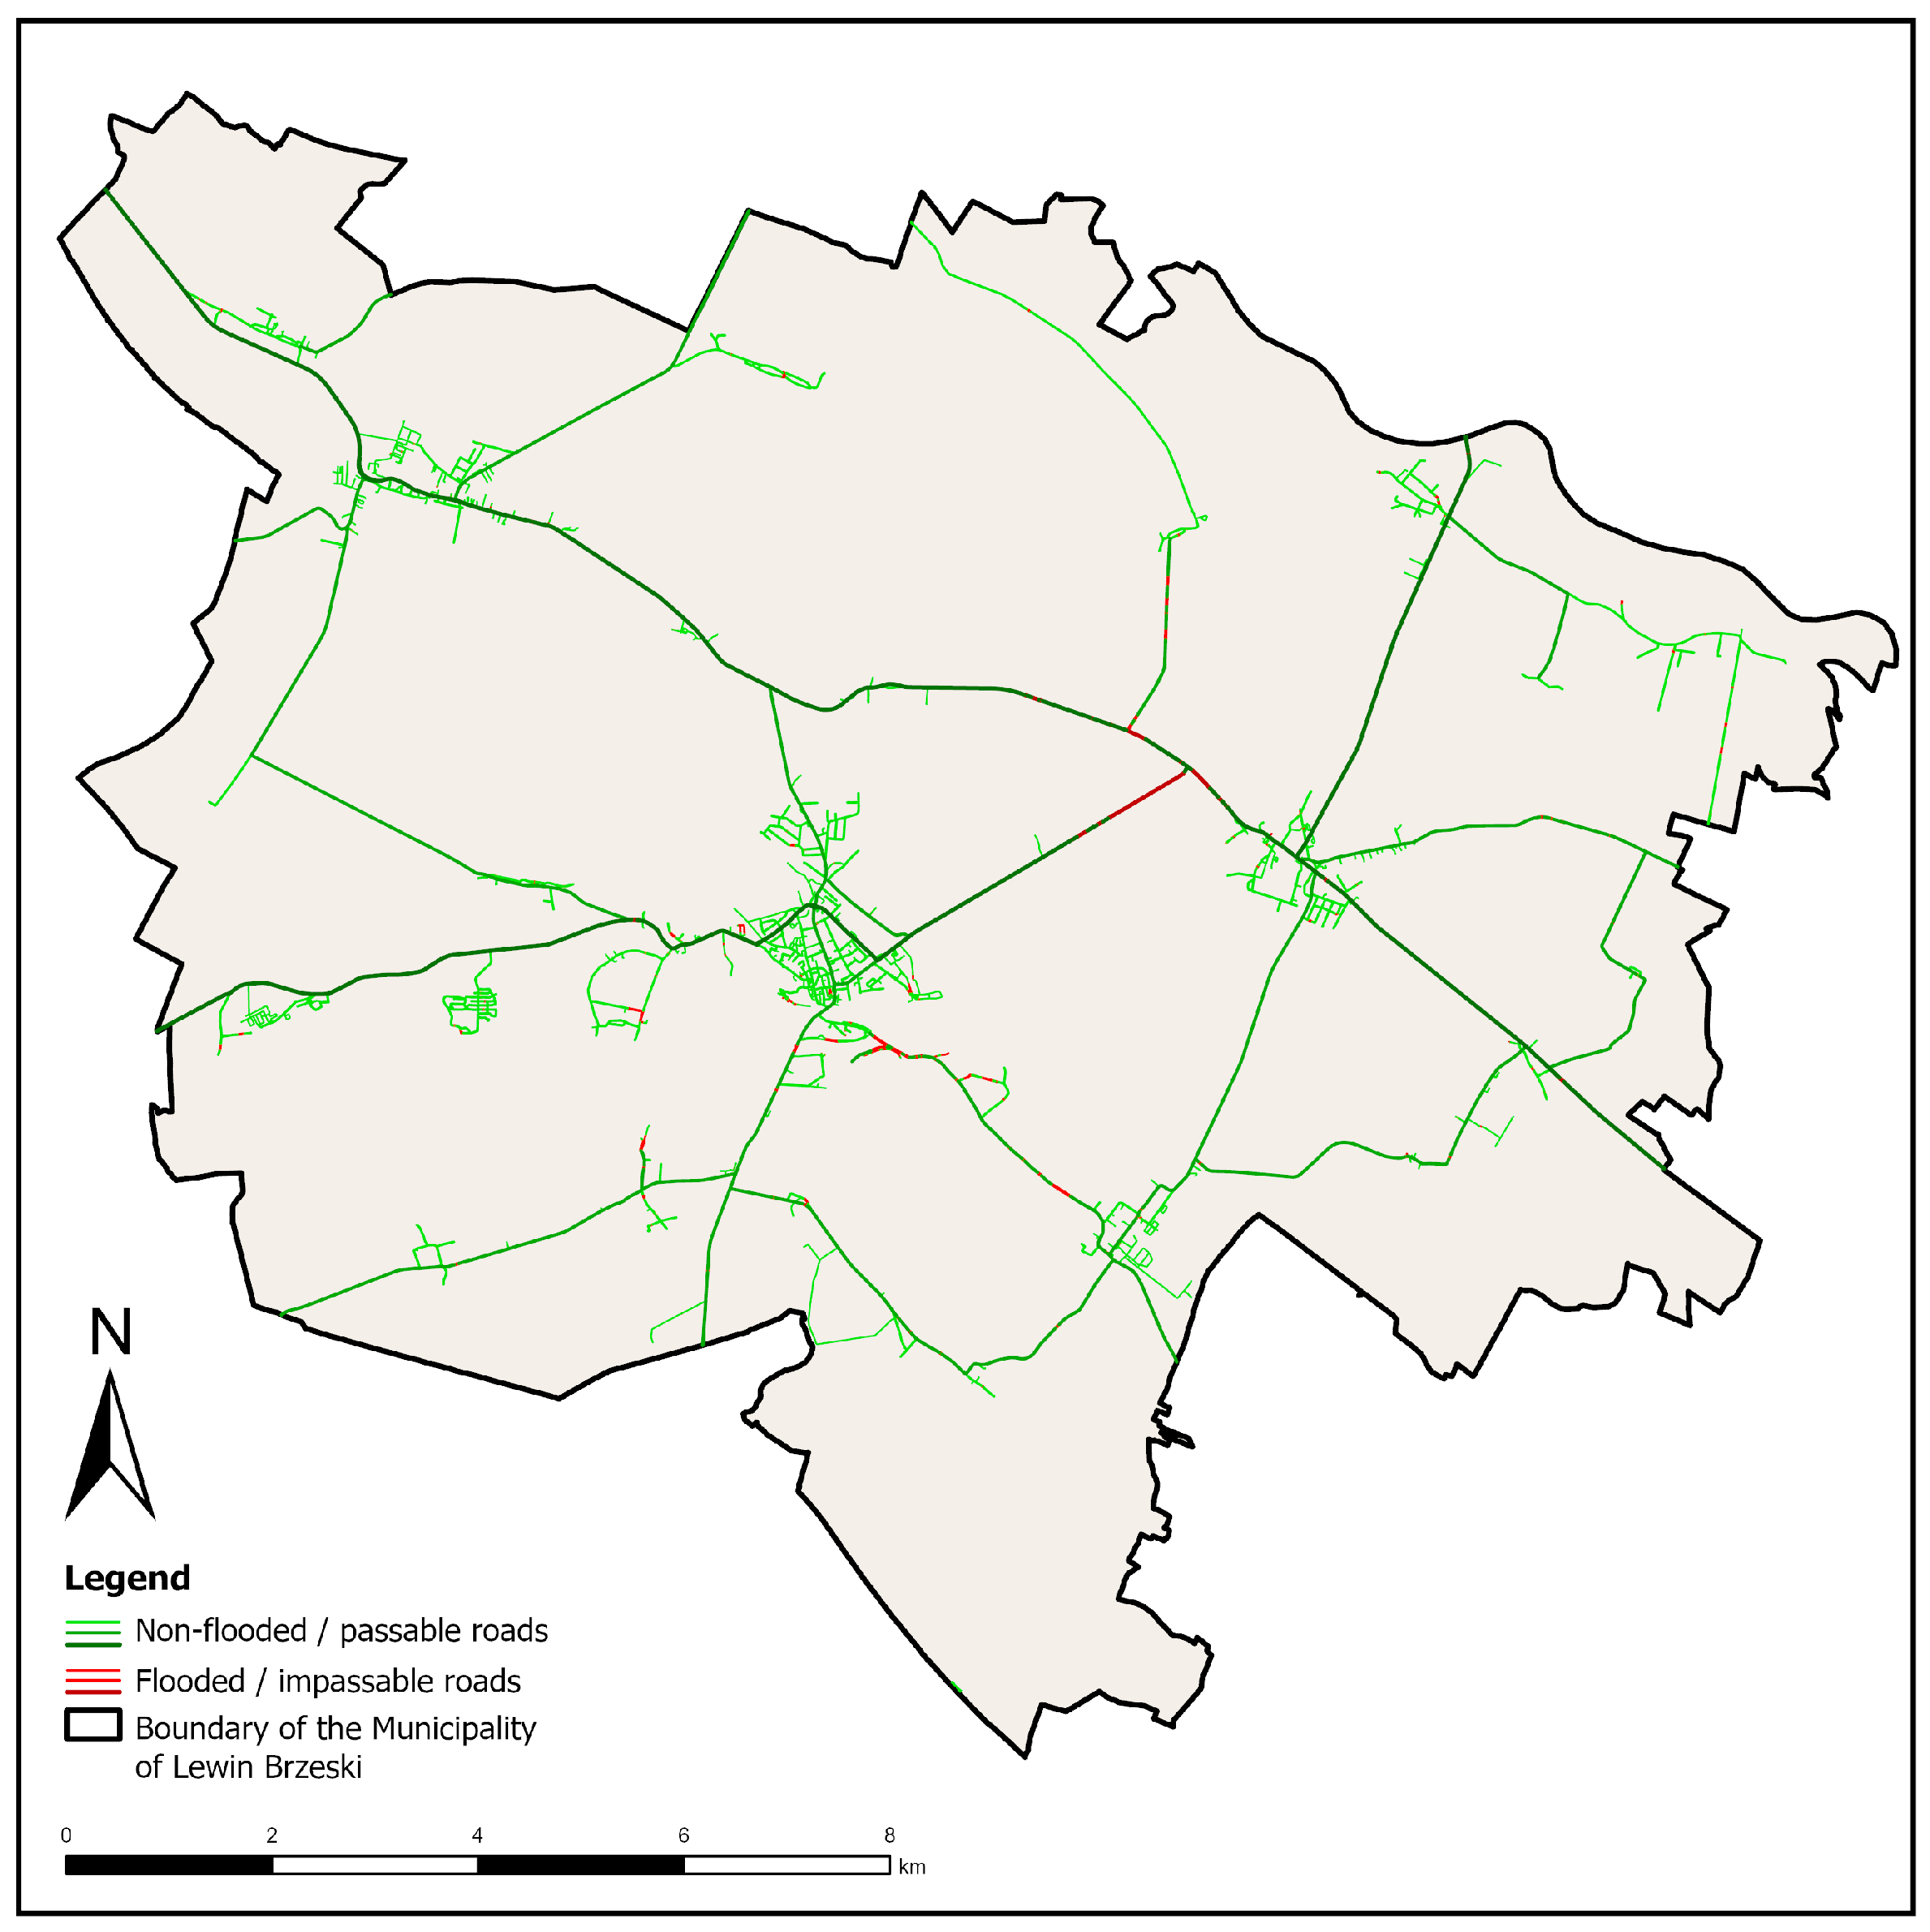
Intersecting the SAR-derived flood mask with the 619.26 km road network identified 35.45 km of potentially flood-affected road segments, while 583.82 km remained outside the detected extent (Figure 10; Table 10). The affected length represents 5.72% of the analyzed network. Although this percentage is smaller than the flooded share of the municipality, the intersecting segments are spatially concentrated along the central flood corridor, where roads cross or run parallel to the Nysa Kłodzka and its inundated floodplain.
The largest clusters occur within and immediately around the town of Lewin Brzeski, along the west–east corridor toward Ptakowice and Skorogoszcz, and on local connections crossing the central and northern floodplains. Most of the remaining network, including extensive sections in the western, eastern, and southern parts of the municipality, remained outside the SAR-derived mask. No field observations of water depth or carriageway passability were available for this case. The identified sections are, therefore, reported as potentially flood-affected rather than as confirmed impassable.

3.6. Computational Performance

Both analytical modules were benchmarked under cold- and warm-cache conditions (Table 11). Under cold-cache conditions, the flood detection chain completes in 28.6 s on average when the road network is downloaded on the fly, and in 20.3 s (a 29% reduction) when the network is preloaded. The framework adopts this variant and treats the road graph as a cached, slowly varying asset. Accessibility map generation on consumer hardware (AMD Ryzen 5 7600, 32 GB RAM) takes 11.8–34.2 s under warm-cache conditions, depending on the variant—flood variants are consistently faster because barriers reduce the searchable graph. In the deployed architecture, the graph is memory-resident in the routing service, removing graph construction from the critical path, so a fresh Sentinel-1 acquisition can be turned into updated passability tiles and isochrones in under one minute end-to-end. This latency refers to processing once a scene is available; in practice, the dominant delay is acquisition itself, bounded by the constellation revisit cycle discussed in Section 4. These figures are single-machine benchmarks based on 25 repetitions per configuration on the hardware stated above. The flood detection times cover cloud-side processing and vector retrieval within an interactive session. Absolute runtimes may vary across platforms and runtime conditions, and the reported values, therefore, characterize the tested system rather than provide platform-independent performance guarantees. Table 11 reports the mean latency and standard deviation for both cold- and warm-cache conditions, along with median (p50) and 95th-percentile (p95) latency under warm-cache conditions for each configuration.

3.7. Operator-Facing Web Application

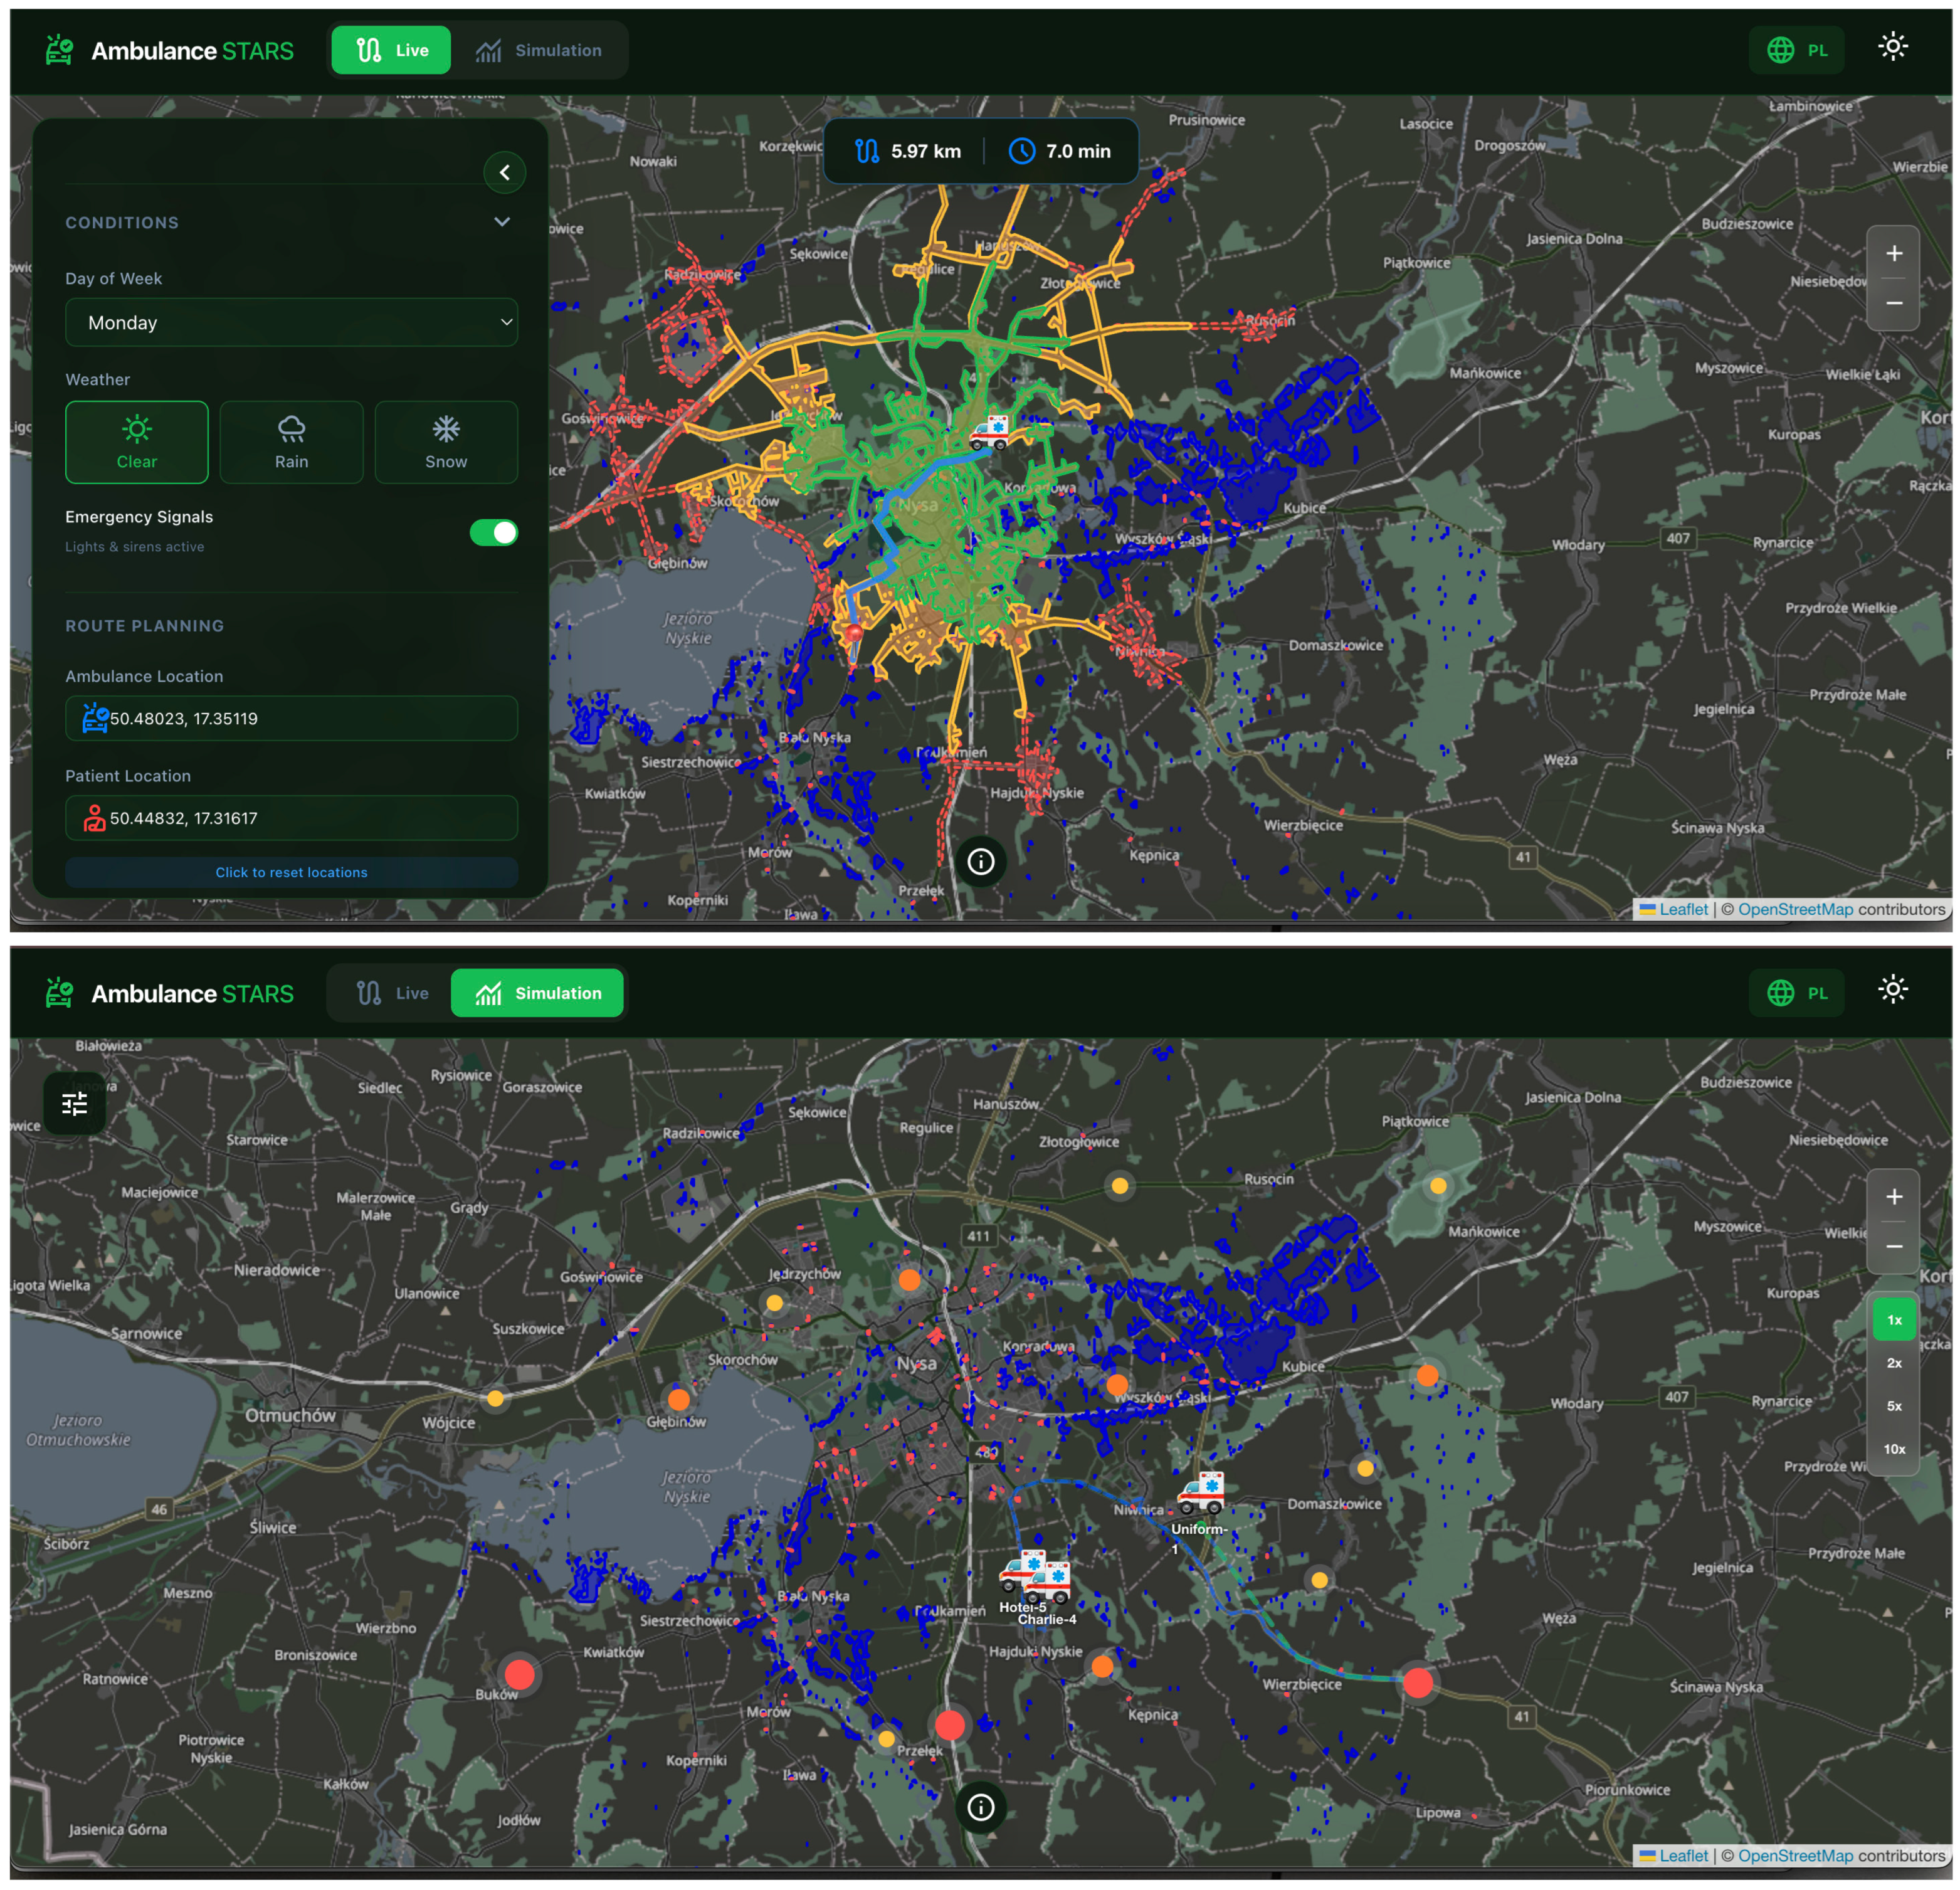
Figure 11 presents the web client operating on the Nysa dataset. In live mode, understood as interactive routing on the most recent available satellite products rather than a real-time feed, the dispatcher sets the dispatch point, patient location, day of week, weather and signal status, and obtains the recommended route with distance and estimated arrival time (e.g., 5.97 km, 7.0 min) computed on the barrier-aware graph, with the SAR flood mask, isochrone corridors, and barrier warnings rendered as tile overlays. In simulation mode the system spawns a configurable fleet and an incident generator with severity classes, allowing training and stress testing of dispatch strategies under the observed flood scenario. Incident states (pending, responding, and resolved) are tracked per unit in real time. The interface uses a responsive layout and was tested on mobile devices.

4. Discussion

The case study supports the central premise of the framework: flood extent observed from satellites can be converted into products that reach the dispatcher while the event is still ongoing. The collapse of accessibility in western Nysa reproduces, for a real event, the pattern reported in scenario-based studies. Green et al. [5] and Yu et al. [6] found losses of statutory coverage for modeled floods in the UK that fall between our SAR-derived and optical-derived estimates, and Coles et al. [42] reached similar conclusions for York by coupling hydrodynamic simulations with network analysis of ambulance and fire service areas. The present results differ in one respect: the barriers entering the network analysis were observed by Sentinel-1 rather than simulated, which removes the dependence on hydraulic model assumptions but ties the analysis to the satellite revisit schedule. The recovery of northern coverage under the higher-speed model adds a further observation: the benefit of emergency signals is not uniform across the municipality but concentrates where longer alternative routes exist. Models based on nominal speed limits cannot reproduce this interaction between network redundancy and vehicle speed, which argues for calibrating EMS accessibility analyses with fleet telemetry [17]. Modeled arrival times also depend strongly on the current vehicle position (Figure 7). Under flood conditions, static station-based coverage maps, therefore, lose reliability, and dynamic per-vehicle coverage maps are required. The strong clustering of barriers along the river corridor also matches the observation of Sohn [43] that the criticality of individual road links under flood damage is highly uneven, so monitoring a small set of links can yield a disproportionate accessibility benefit. The sensitivity analysis in Section 3.4 makes this concrete: preserving bridge segments, which amount to a few hundred meters of deck length, raises 15 min coverage by roughly 36 percentage points relative to blocking every intersection with the flood mask. The definition of what constitutes a barrier, therefore, dominates the uncertainty of the accessibility estimates, well ahead of the assumed vehicle speed. This argues for enriching the barrier extraction with structure tags and, ultimately, with water depth.
Several limitations qualify the results. First, the SAR analysis relies on a single during-flood acquisition (15 September). The six-day Sentinel-1 revisit (temporarily degraded after the Sentinel-1B failure) cannot guarantee imagery at the flood peak, when barriers are most extensive. The constellation context is improving: Sentinel-1C, launched in December 2024, restores the nominal revisit capacity, the upcoming L-band NISAR mission will add an independent observation stream, and commercial X-band constellations such as ICEYE already offer sub-daily revisit. Fusion with weather-independent modeled inundation is a further mitigation. Second, amplitude thresholding at a fixed R = 1.35 underestimates shallow and urban flooding, and Section 3.2 quantifies the consequence on the road network: only 0.31 km of segments are flagged impassable by both the SAR and the optical product. In our assessment, the moderate agreement with the CEMS reference (F1 = 0.547) is acceptable for a rapid, fully automatic operational layer, but it confirms that the SAR product should be read as a conservative, time-specific snapshot rather than a definitive flood boundary. The land-cover decomposition further shows that the disagreement cannot be attributed to a single problematic surface class. In Nysa, cropland accounted for 54.2% of false positives and 64.4% of false negatives, but also for 87.8% of the jointly detected inundation, indicating that its dominance largely reflects the agricultural character of the affected floodplain. Tree cover represented a larger share of omission errors in Lewin Brzeski (28.1%), where attenuation beneath vegetation may, therefore, contribute more strongly to the observed disagreement. Complex scattering in built-up areas remains another plausible local source of uncertainty, although built-up land represented only a small fraction of the total omission area in both cases.
The post hoc adaptive-threshold benchmark provides additional context for the use of the fixed threshold. Global Otsu applied directly to the linear ratio was strongly affected by the long upper tail of the change distribution, selecting R = 5.622 in Nysa and R = 20.333 in Lewin Brzeski and consequently producing severe omission. Applying Otsu to the logarithmic ratio reduced this effect but introduced substantial scene dependence: the selected thresholds were equivalent to R = 0.413 in Nysa and R = 1.076 in Lewin Brzeski. In the latter case, log-ratio Otsu achieved a slightly higher F1-score and IoU than the fixed threshold, whereas in Nysa it produced extensive overclassification. Restricting the log-ratio histogram to the physically consistent R > 1 domain yielded more conservative thresholds of R = 2.512 and R = 3.837, respectively. These results do not indicate that adaptive thresholding is intrinsically inferior; rather, they show that global Otsu is highly sensitive to the statistical distribution and representation of the individual SAR scene. The R = 1.35 threshold was not selected because it maximized agreement with CEMS, but because it was defined a priori and provides a deterministic and auditable decision rule without event-specific calibration. Consistently, the fixed-threshold sensitivity analysis showed only gradual changes in precision, recall, F1-score, and IoU across the central R = 1.25–1.45 range, while the main downstream accessibility conclusions remained unchanged. Retuning the operational threshold after observing reference product performance would, therefore, replace the intended a priori rule with event-specific optimization. More context-aware adaptive or split-based thresholding, interferometric coherence, and learning-based segmentation remain natural upgrades, and DeVries et al. [44] showed that combining SAR with historical optical water class probabilities on Google Earth Engine improves robustness at comparable processing speed, an approach that would fit the proposed architecture without modification.
We deliberately refrain from interpreting pixel-level agreement against the three-day-offset Sentinel-2 optical mask as algorithmic accuracy, as the temporal offset between acquisitions would confound algorithm error with genuine flood dynamics. The product-level passability comparison in Section 3.2 is, therefore, used as a complementary assessment of the framework’s operational output. The same temporal limitation applies, although over a shorter interval, to the Lewin Brzeski comparison with CEMS. The CEMS delineation represents an optical acquisition from the morning of 18 September, whereas Sentinel-1A observed the municipality at 16:35 UTC. Recession and drainage during this interval may, therefore, account for part of the CEMS-only area and should be considered together with detector-related omission when interpreting the lower recall. Third, passability remains binary at the level of an individual segment. The variants in Section 3.4 bound the effect of this simplification, but a depth-aware criterion (e.g., the 30 cm threshold used by Yang et al. [7]) or a probabilistic passability formulation [14] would refine the barrier definition further. Fourth, the operational routing engine is currently not validated against local observed ambulance response times for Nysa, as GPS trajectory records for this specific region during the flood event were unavailable. Consequently, the speed model is transferred from a demographically similar but distinct region (Bochnia) and does not account for local driving behavior or flood-induced congestion under crisis conditions. While our OpenStreetMap plausibility analysis (Section 3.4) provides indirect support by showing that empirical speeds bound the local navigation-style estimates, we acknowledge that this cannot fully substitute for direct validation using local historical dispatch data. Therefore, the absolute travel times presented should be interpreted as robust scenario estimates bounding the operational uncertainty, rather than site-specific predictions. Fifth, the additional Lewin Brzeski case extends the evaluation beyond a single municipality: the unchanged flood detection parameterization generated a coherent flood product and a selective road impact layer from a different Sentinel-1 orbit and over a spatially distinct floodplain. The transferred chain, therefore, returns not only a flood polygon but also a selective road impact layer that can be passed directly to the downstream routing and dispatcher support services. This supports the geographical portability of the flood detection and road-overlay components within the September 2024 regional event. It does not, however, establish broader transferability of the complete Ambulance STARS framework across different climatic regions, flood mechanisms, or EMS systems. Finally, the population figures in Table 5 rest on locality-level 2021 census counts assigned to settlement centroids. A gridded population layer would refine the intra-urban picture, although at the settlement scale relevant for rural EMS coverage the centroid approximation is adequate.
From the systems perspective, the benchmarks support the main architectural claim, namely, that separating slowly varying assets (graphs, speed models, and basemap tiles) from rapidly varying observations (flood masks) keeps the critical path short: in both modules the dominant cost lies in acquiring and preparing static data, not in the event-driven computation. The service decomposition also makes the framework portable: the flood detection service is designed to be area-agnostic within the availability of suitable Sentinel-1 acquisitions, and the routing service only requires a road graph and, optionally, a regional speed model. The framework also inherits the strengths and weaknesses of volunteered road data: OpenStreetMap completeness in Poland is high for the public network but variable for service roads and for attributes such as speed limits, and errors in geometry or connectivity propagate directly into the routing graph [27]. Periodic conflation with authoritative road registers would mitigate this risk in an operational deployment. A degradation experiment quantifies this sensitivity: randomly removing 25% of minor-class roads (service, residential, unclassified, living street, and track) from the flood-affected graph reduces the 15 min coverage of the remaining network from 90.2% to 68.5–76.3% across replicates. Completeness, therefore, matters primarily through the redundancy of minor roads that supply detours around flood barriers, so incomplete mapping biases the framework toward underestimating accessibility, a conservative failure mode for dispatching. Integration with the national SWD PRM system would primarily require an interface for pushing barrier layers and per-vehicle isochrones to dispatcher consoles [20,21]. In any such deployment the framework acts as a decision support layer: passability products indicate where verification is needed and are not intended to exclude roads automatically without dispatcher confirmation.

5. Conclusions

We presented Ambulance STARS, a service-oriented framework linking SAR-based flood mapping with ambulance routing calibrated from fleet telemetry, and we demonstrated it end-to-end on the September 2024 flood in Nysa, Poland. With preloaded road data, the framework detects flood extent from Sentinel-1 in approximately 20 s, identifies 8.5 km of impassable roads and 508 barrier points in the case study, and generates statutory accessibility maps and barrier-aware routes in 12–34 s under warm-cache benchmark conditions, all exposed to dispatchers through a web application with live and simulation modes. The case study showed that aggregate coverage losses under SAR-derived barriers are moderate (15 min coverage fell from 88.3% to 79.6% without signals) but sharply local: two villages with 938 inhabitants lost road access entirely. It also showed that the barrier source dominates the uncertainty, with 15 min coverage of 89.0% under SAR-derived barriers against 39.8% under optical-derived ones at 61.8 km/h, a spread that brackets scenario-based results reported in the literature. Future work includes multi-temporal SAR monitoring across the full flood wave, depth-aware passability, population-weighted coverage metrics, adaptive thresholding, and pilot integration with the national EMS command system.

Author Contributions

Conceptualization, M.L.; methodology, M.L., A.B. and J.N.; software, A.B., J.N. and S.S.; validation, A.B. and J.N.; writing—original draft preparation, M.L., A.B., J.N. and S.S.; writing—review and editing, M.L.; visualization, A.B., J.N. and S.S.; supervision, M.L. All authors have read and agreed to the published version of the manuscript.

Funding

This research was funded by the statutory research funds of the Faculty of Space Technologies, AGH University of Krakow, Poland. This project is partially funded by the European High-Performance Computing Joint Undertaking (EuroHPC JU) under Grant Agreement No. 101314359, with support from the European Union’s Horizon Europe Programme and participating countries. The content reflects the views of the authors only. The European Union and EuroHPC JU are not responsible for how the information is used.

Institutional Review Board Statement

Ethical review and approval were waived for this study because it involved retrospective analysis of fully anonymized administrative data, which under Polish law does not require IRB approval or informed consent.

Data Availability Statement

Ambulance GPS and dispatch data were provided by the Lesser Poland Voivodeship Office under Agreement No. WZ-III.63143.12.2023 and cannot be shared publicly. Sentinel-1 data are openly available through the Copernicus program, and road data are available from OpenStreetMap under ODbL. The flood detection code is available at: https://github.com/JakubNiedzwiedz/SAR-Flood-Detection (accessed on 3 July 2026).

Acknowledgments

The authors thank Piotr Kubik (Health Department, Lesser Poland Voivodeship Office) for substantive support in data analysis and interpretation.

Conflicts of Interest

The authors declare no conflicts of interest.

References

  1. Kundzewicz, Z.W. Zmiany klimatu, ich przyczyny i skutki—Obserwacje i projekcje. Landf. Anal. 2011, 15, 39–49. [Google Scholar]
  2. Koks, E.E.; Rozenberg, J.; Zorn, C.; Tariverdi, M.; Vousdoukas, M.; Fraser, S.A.; Hall, J.W.; Hallegatte, S. A global multi-hazard risk analysis of road and railway infrastructure assets. Nat. Commun. 2019, 10, 2677. [Google Scholar] [CrossRef] [Scilit] [PubMed]
  3. PGW Wody Polskie. Raport z Przeglądu i Aktualizacji Wstępnej Oceny Ryzyka Powodziowego w 3. Cyklu Planistycznym. Załącznik nr 7: Powódź We Wrześniu 2024; PGW Wody Polskie: Warsaw, Poland, 2025. [Google Scholar]
  4. Marszałek Sejmu. Ustawa z Dnia 8 Września 2006 r. o Państwowym Ratownictwie Medycznym; Dz.U. 2025 poz. 91; Marszałek Sejmu: Warsaw, Poland, 2025. [Google Scholar]
  5. Green, D.; Yu, D.; Pattison, I.; Wilby, R.; Bosher, L.; Patel, R.; Thompson, P.; Trowell, K.; Draycon, J.; Halse, M.; et al. City-scale accessibility of emergency responders operating during flood events. Nat. Hazards Earth Syst. Sci. 2017, 17, 1–16. [Google Scholar] [CrossRef] [Scilit]
  6. Yu, D.; Yin, J.; Wilby, R.L.; Lane, S.N.; Aerts, J.C.J.H.; Lin, N.; Liu, M.; Yuan, H.; Chen, J.; Prudhomme, C.; et al. Disruption of emergency response to vulnerable populations during floods. Nat. Sustain. 2020, 3, 728–736. [Google Scholar] [CrossRef] [Scilit]
  7. Yang, Y.; Yin, J.; Ye, M.; She, D.; Yu, J. Multi-coverage optimal location model for emergency medical service (EMS) facilities under various disaster scenarios: A case study of urban fluvial floods in the Minhang district of Shanghai, China. Nat. Hazards Earth Syst. Sci. 2020, 20, 181–195. [Google Scholar] [CrossRef] [Scilit]
  8. Twele, A.; Cao, W.; Plank, S.; Martinis, S. Sentinel-1-based flood mapping: A fully automated processing chain. Int. J. Remote Sens. 2016, 37, 2990–3004. [Google Scholar] [CrossRef] [Scilit]
  9. Schumann, G.J.-P.; Bates, P.D.; Horritt, M.S.; Matgen, P.; Pappenberger, F. Progress in integration of remote sensing-derived flood extent and stage data and hydraulic models. Rev. Geophys. 2009, 47, RG4001. [Google Scholar] [CrossRef] [Scilit]
  10. Bamler, R.; Hartl, P. Synthetic aperture radar interferometry. Inverse Probl. 1998, 14, R1–R54. [Google Scholar] [CrossRef] [Scilit]
  11. Misra, A.; White, K.; Nsutezo, S.F.; Straka, W., III; Lavista, J. Mapping global floods with 10 years of satellite radar data. Nat. Commun. 2025, 16, 5762. [Google Scholar] [CrossRef] [Scilit] [PubMed]
  12. Toma, A.; Șandric, I.; Mihai, B.-A. Flooded area detection and mapping from Sentinel-1 imagery: Complementary approaches and comparative performance evaluation. Eur. J. Remote Sens. 2024, 57, 2414004. [Google Scholar] [CrossRef] [Scilit]
  13. Papilloud, T.; Steiner, A.; Zischg, A.P.; Keiler, M. Road network disruptions during extreme flooding events and their impact on the access to emergency medical services: A spatiotemporal vulnerability analysis. Sci. Total Environ. 2024, 956, 177140. [Google Scholar] [CrossRef] [Scilit] [PubMed]
  14. He, K.; Carhart, N.; Pregnolato, M.; Neal, J.; De Risi, R. Probabilistic functionality assessment of road networks for medical emergency vehicles during flooding. Nat. Hazards 2026, 122, 233. [Google Scholar] [CrossRef] [Scilit] [PubMed]
  15. Chen, W.; Qian, H.; Zhang, L.; Pan, Y.; Li, Z.; Gardoni, P. Supply-demand mismatch causes substantial deterioration in prehospital emergency medical service under disasters. Commun. Eng. 2025, 4, 145. [Google Scholar] [CrossRef] [Scilit] [PubMed]
  16. Piórkowski, A. Construction of a dynamic arrival time coverage map for emergency medical services. Open Geosci. 2018, 10, 167–173. [Google Scholar] [CrossRef] [Scilit]
  17. Lupa, M.; Chuchro, M.; Sarlej, W.; Adamek, K. Emergency ambulance speed characteristics: A case study of Lesser Poland voivodeship, southern Poland. GeoInformatica 2021, 25, 775–798. [Google Scholar] [CrossRef] [Scilit]
  18. Lupa, M.; Naziemiec, W.; Adamek, K.; Zawadzki, M. Methodology for creating dynamic emergency vehicle availability maps. Pol. Cartogr. Rev. 2023, 55, 24–37. [Google Scholar] [CrossRef] [Scilit]
  19. Alabbad, Y.; Mount, J.; Campbell, A.M.; Demir, I. A web-based decision support framework for optimizing road network accessibility and emergency facility allocation during flooding. Urban Inform. 2024, 3, 10. [Google Scholar] [CrossRef] [Scilit]
  20. Ministerstwo Zdrowia. System Wspomagania Dowodzenia Państwowego Ratownictwa Medycznego (SWD PRM). Available online: https://www.gov.pl/web/zdrowie/system-wspomagania-dowodzenia-panstwowego-ratownictwa-medycznego-swd-prm- (accessed on 28 November 2025).
  21. Świtała, M.; Bohatkiewicz, J.; Wasilewski, G.; Gut, R. Activities of civil-military services during floods: Identification of technical, organizational, and legal issues related to the natural disaster that occurred in Poland in 2024. Roads Bridges-Drog. I Mosty 2025, 24, 245–252. [Google Scholar]
  22. Główny Urząd Statystyczny. Charakterystyka Gmin Województwa Opolskiego; GUS: Warsaw, Poland, 2023. [Google Scholar]
  23. Urząd Miejski w Lewinie Brzeskim. Raport o Stanie Gminy Lewin Brzeski za 2024 Rok; Urząd Miejski w Lewinie Brzeskim: Lewin Brzeski, Poland, 2025. [Google Scholar]
  24. Urząd Miejski w Lewinie Brzeskim. Położenie Gminy Lewin Brzeski. Available online: https://lewin-brzeski.pl/3304/polozenie-gminy-lewin-brzeski.html (accessed on 29 July 2026).
  25. Kałmykow-Piwińska, A.; Witkowska, K. Impact of the 2024 flood event on trace elements contamination in floodplain sediments at the mouth of the Nysa Kłodzka river into the Odra valley. Environ. Geochem. Health 2026, 48, 396. [Google Scholar] [CrossRef] [Scilit] [PubMed]
  26. OpenStreetMap Contributors. OpenStreetMap. Available online: https://www.openstreetmap.org/copyright (accessed on 15 May 2025).
  27. Haklay, M. How good is volunteered geographical information? A comparative study of OpenStreetMap and Ordnance Survey datasets. Environ. Plan. B 2010, 37, 682–703. [Google Scholar] [CrossRef] [Scilit]
  28. Copernicus Emergency Management Service. Flood in South West Poland (EMSR756); European Commission, Joint Research Centre: Ispra, Italy, 2024; Available online: https://mapping.emergency.copernicus.eu/activations/EMSR756/ (accessed on 29 July 2026).
  29. Zanaga, D.; Van De Kerchove, R.; Daems, D.; De Keersmaecker, W.; Brockmann, C.; Kirches, G.; Wevers, J.; Cartus, O.; Santoro, M.; Fritz, S.; et al. ESA WorldCover 10 m 2021 v200; Zenodo: Genève, Switzerland, 2022. [Google Scholar] [CrossRef]
  30. Lopes, A.; Touzi, R.; Nezry, E. Adaptive speckle filters and scene heterogeneity. IEEE Trans. Geosci. Remote Sens. 1990, 28, 992–1000. [Google Scholar] [CrossRef] [Scilit]
  31. Martinis, S.; Rieke, C. Backscatter analysis using multi-temporal and multi-frequency SAR data in the context of flood mapping at River Saale, Germany. Remote Sens. 2015, 7, 7732–7752. [Google Scholar] [CrossRef] [Scilit]
  32. Brisco, B.; Shelat, Y.; Murnaghan, K.; Montgomery, J.; Fuss, C.; Olthof, I.; Hopkinson, C.; Millard, K.; Behnamian, A.; White, L.; et al. Evaluation of C-band SAR for identification of flooded vegetation in emergency response products. Can. J. Remote Sens. 2019, 45, 73–87. [Google Scholar] [CrossRef] [Scilit]
  33. Martinis, S.; Twele, A.; Voigt, S. Towards operational near real-time flood detection using a split-based automatic thresholding procedure on high resolution TerraSAR-X data. Nat. Hazards Earth Syst. Sci. 2009, 9, 303–314. [Google Scholar] [CrossRef] [Scilit]
  34. UN-SPIDER. Recommended Practice: Flood Mapping and Damage Assessment Using Sentinel-1 SAR Data; UN Office for Outer Space Affairs: Vienna, Austria, 2013. [Google Scholar]
  35. Chini, M.; Hostache, R.; Giustarini, L.; Matgen, P. A hierarchical split-based approach for parametric thresholding of SAR images: Flood inundation as a test case. IEEE Trans. Geosci. Remote Sens. 2017, 55, 6975–6988. [Google Scholar] [CrossRef] [Scilit]
  36. Nemni, E.; Bullock, J.; Belabbes, S.; Bromley, L. Fully convolutional neural network for rapid flood segmentation in synthetic aperture radar imagery. Remote Sens. 2020, 12, 2532. [Google Scholar] [CrossRef] [Scilit]
  37. Bonafilia, D.; Tellman, B.; Anderson, T.; Issenberg, E. Sen1Floods11: A georeferenced dataset to train and test deep learning flood algorithms for Sentinel-1. In Proceedings of the IEEE/CVF Conference on Computer Vision and Pattern Recognition Workshops (CVPRW), Seattle, WA, USA, 14–19 June 2020; pp. 835–845. [Google Scholar] [CrossRef] [Scilit]
  38. Pregnolato, M.; Ford, A.; Wilkinson, S.M.; Dawson, R.J. The impact of flooding on road transport: A depth-disruption function. Transp. Res. D 2017, 55, 67–81. [Google Scholar] [CrossRef] [Scilit]
  39. Jordahl, K.; Van den Bossche, J.; Fleischmann, M.; Wasserman, J.; McBride, J.; Gerard, J.; Tratner, J.; Perry, M.; Badaracco, A.G.; Farmer, C.; et al. Geopandas/Geopandas: V0.8.1; Zenodo: Genève, Switzerland, 2020. [Google Scholar] [CrossRef]
  40. Gorelick, N.; Hancher, M.; Dixon, M.; Ilyushchenko, S.; Thau, D.; Moore, R. Google Earth Engine: Planetary-scale geospatial analysis for everyone. Remote Sens. Environ. 2017, 202, 18–27. [Google Scholar] [CrossRef] [Scilit]
  41. Otsu, N. A threshold selection method from gray-level histograms. IEEE Trans. Syst. Man Cybern. 1979, 9, 62–66. [Google Scholar] [CrossRef] [Scilit]
  42. Coles, D.; Yu, D.; Wilby, R.L.; Green, D.; Herring, Z. Beyond ‘flood hotspots’: Modelling emergency service accessibility during flooding in York, UK. J. Hydrol. 2017, 546, 419–436. [Google Scholar] [CrossRef] [Scilit]
  43. Sohn, J. Evaluating the significance of highway network links under the flood damage: An accessibility approach. Transp. Res. A 2006, 40, 491–506. [Google Scholar] [CrossRef] [Scilit]
  44. DeVries, B.; Huang, C.; Armston, J.; Huang, W.; Jones, J.W.; Lang, M.W. Rapid and robust monitoring of flood events using Sentinel-1 and Landsat data on the Google Earth Engine. Remote Sens. Environ. 2020, 240, 111664. [Google Scholar] [CrossRef] [Scilit]
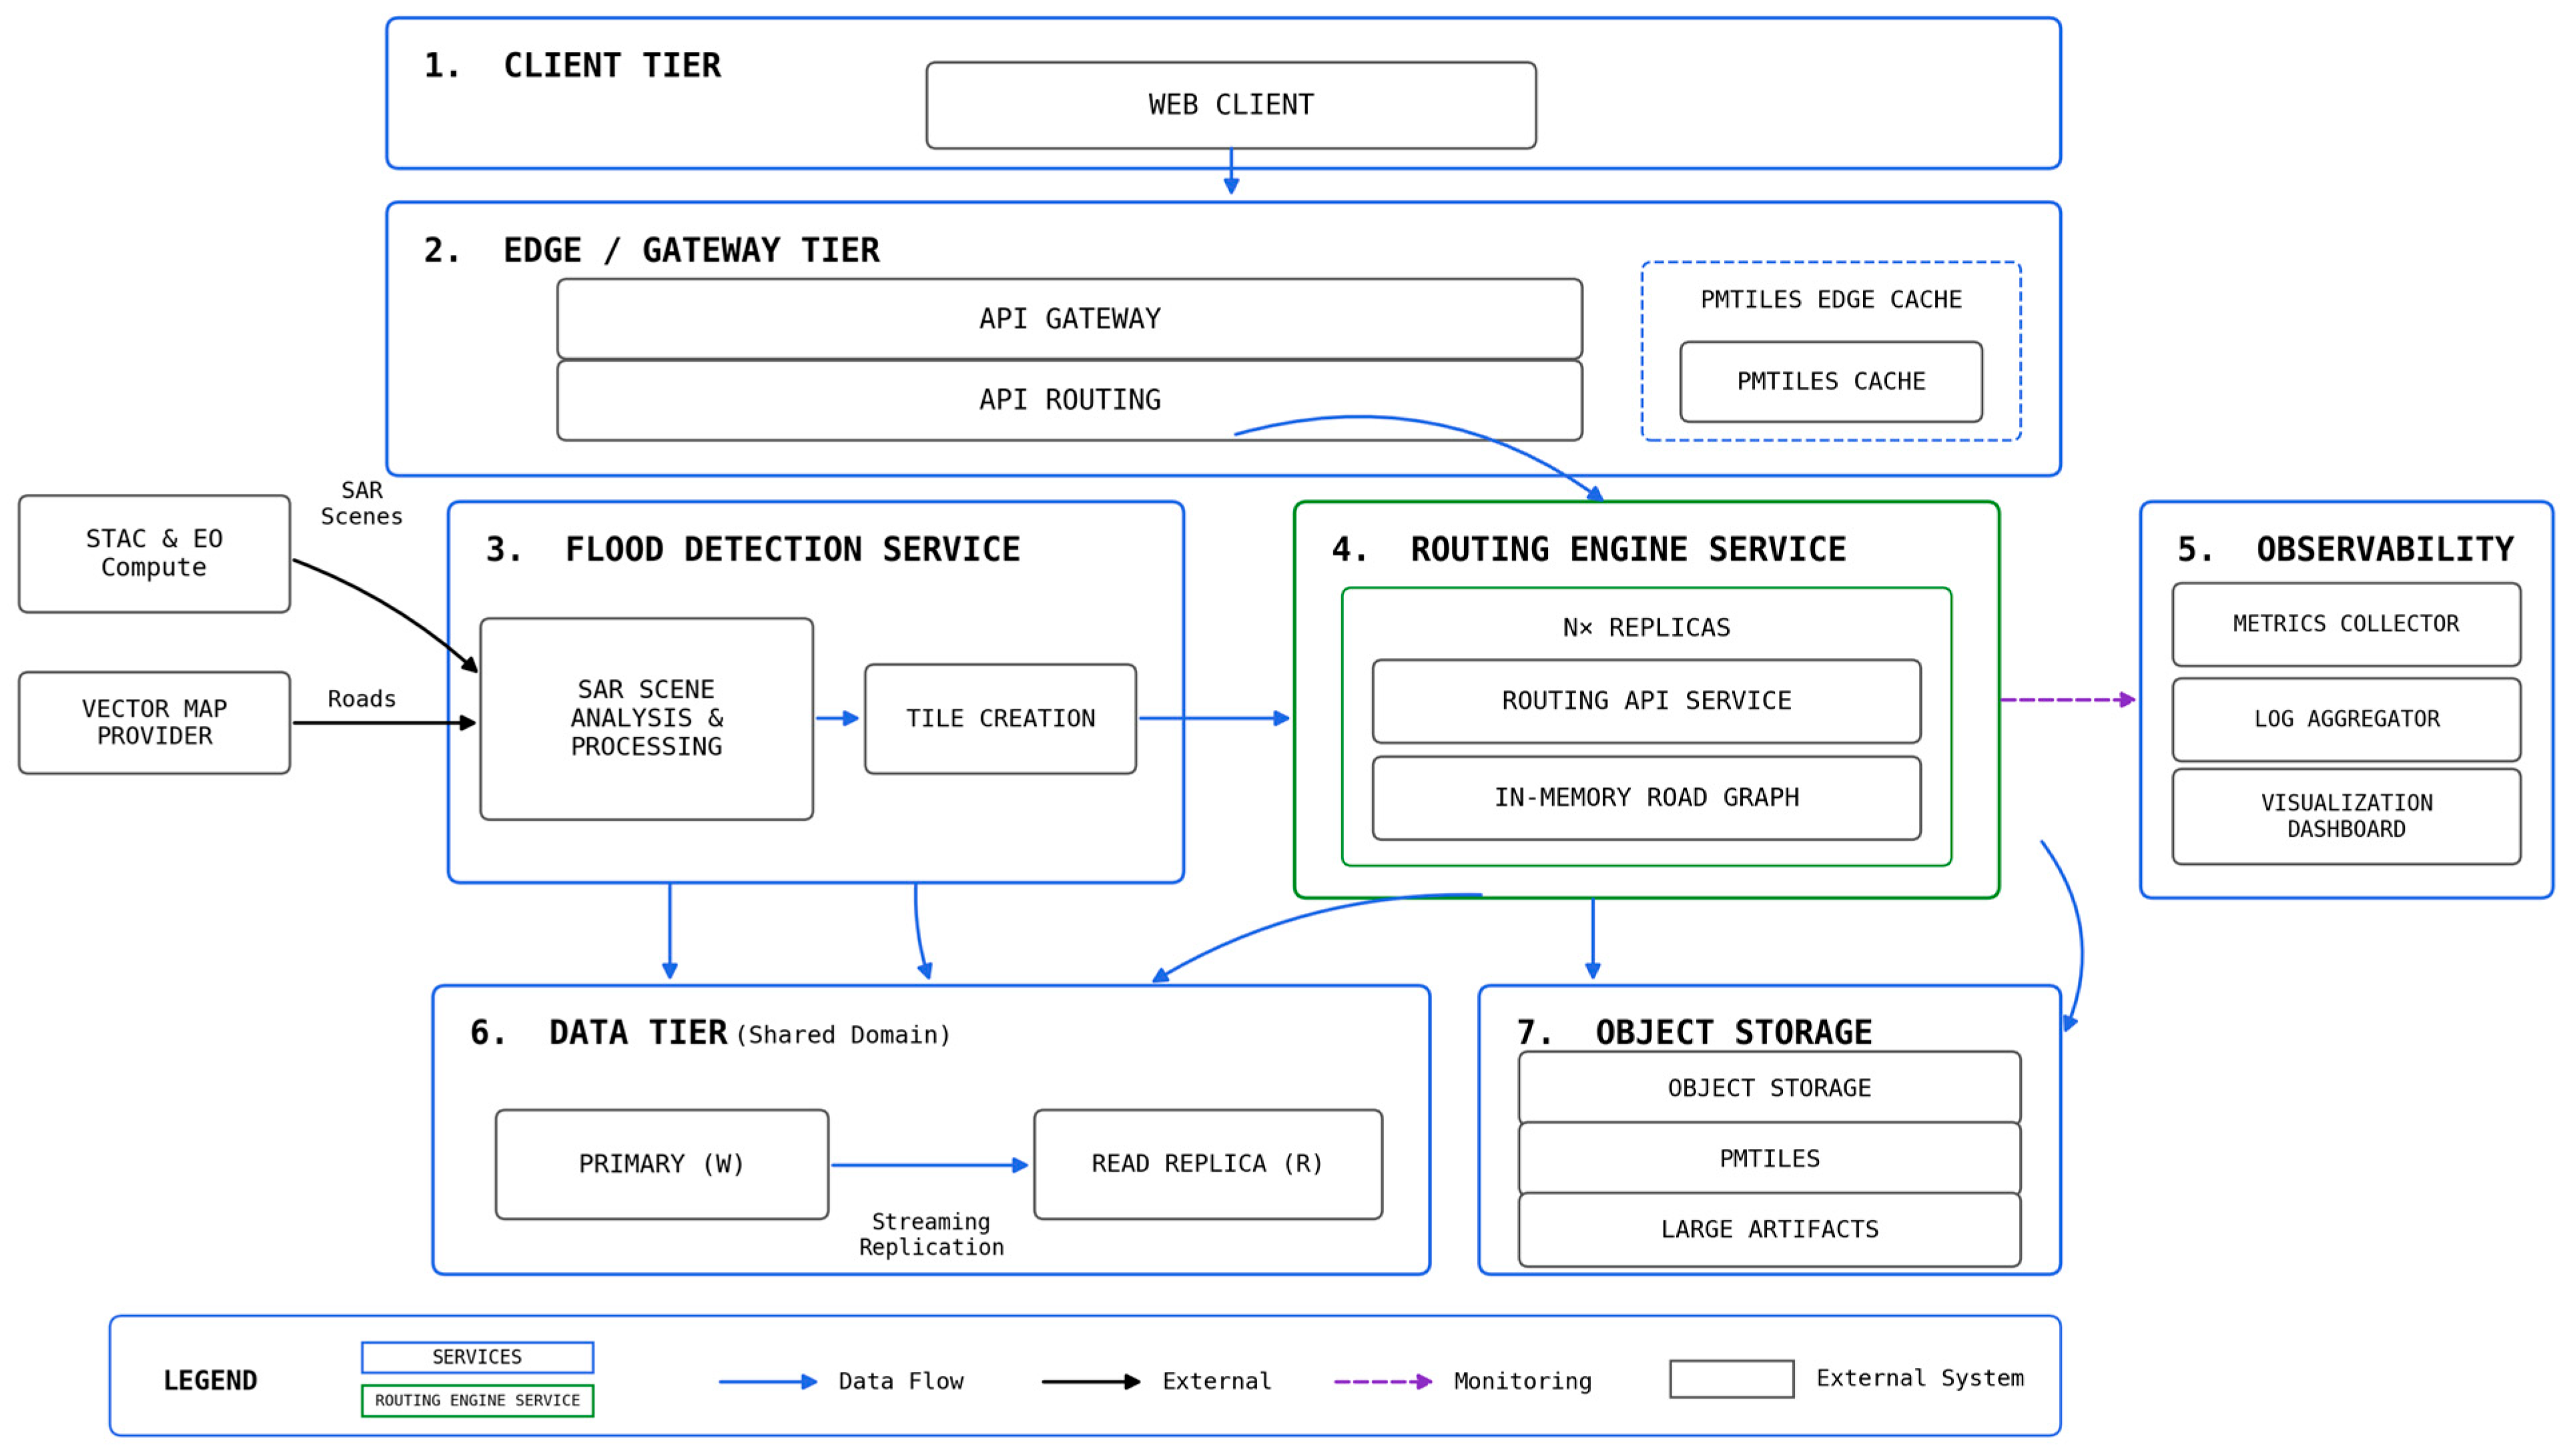
Figure 2. Architecture of the Ambulance STARS framework: client, edge/gateway, domain services (flood detection and routing engine), data tier, object storage, and observability.
Remotesensing 18 03004 g002
Figure 3. Flood extent in the Municipality of Nysa derived from Sentinel-1 SAR (acquisition of 15 September 2024). Blue indicates the SAR-derived flood extent, and the black line denotes the municipality boundary.
Remotesensing 18 03004 g003
Figure 4. Visual comparison of SAR- and optical-derived flood extents, showing SAR-only, optical-only, and jointly detected inundation. Red indicates areas detected only in the optical product, blue indicates areas detected only by SAR, and purple indicates inundation detected by both products; the black line denotes the municipality boundary.
Remotesensing 18 03004 g004
Figure 5. Road passability in the Municipality of Nysa during the September 2024 flood: passable roads (green) and SAR-derived impassable segments (red).
Remotesensing 18 03004 g005
Figure 6. Accessibility maps (8/15/20 min) computed on the routing network for a central ambulance position: (a) pre-flood, 37.2 km/h; (b) pre-flood, 61.8 km/h; (c) flood with SAR-derived barriers, 37.2 km/h; (d) flood with SAR-derived barriers, 61.8 km/h. Green, orange, and red road segments indicate areas reachable within 8, 15, and 20 min, respectively; gray roads are unreachable within 20 min. The ambulance position is marked in blue.
Remotesensing 18 03004 g006
Figure 7. Sensitivity of flood condition accessibility (SAR-derived barriers, 61.8 km/h) to the ambulance position: four positions, P1–P4 (panels (ad)), along a southeast to northwest transect of the municipality—each position is marked and labeled on the map. Green, orange, and red road segments indicate areas reachable within 8, 15, and 20 min, respectively; gray roads are unreachable within 20 min. Ambulance positions P1–P4 are marked and labeled in blue.
Remotesensing 18 03004 g007
Figure 8. Flood extent in the Municipality of Lewin Brzeski derived from Sentinel-1 SAR using the reference acquisition of 6 September and the during-flood acquisition of 18 September 2024.
Remotesensing 18 03004 g008
Figure 9. Spatial comparison of the Sentinel-1 SAR-derived flood extent and the CEMS reference delineation in the Municipality of Lewin Brzeski, showing jointly detected inundation and areas identified by only one of the products.
Remotesensing 18 03004 g009
Figure 10. Road segments intersecting the SAR-derived flood extent in the Municipality of Lewin Brzeski during the September 2024 flood.
Remotesensing 18 03004 g010
Figure 11. Ambulance STARS web client on the Nysa 2024 dataset: (top) live routing with the SAR flood overlay, isochrone corridors, and the recommended route, and (bottom) multi-unit incident simulation mode.
Remotesensing 18 03004 g011
Table 1. Comparison of the study area (Nysa) and the speed model source region (Bochnia County).
IndicatorMunicipality of NysaBochnia County
Population53,340106,990
Area (km2)218649
Population density (people/km2)245164
Total road length (km)6091456
Road network density (km/km2)2.792.24
Urbanization rate (%)75.532.2
EMS stations14
Area per EMS station (km2)218162
Settlement structureUrban–ruralUrban–rural
Table 2. Flooded area derived from SAR (15 September) and optical (18 September) data.
LayerArea (ha)
Municipality of Nysa21,760
Flooded area (SAR)665
Flooded area (optical)1434
Table 3. Road passability on the 656.7 km routing network derived from the SAR and the reference optical flood masks. The last four rows are agreement measures, and class-specific metrics use the optical product as a reference.
MetricSAR MaskOptical Mask
Impassable length (km)8.5117.32
Barrier points5081006
Jointly impassable length (km)0.310.31
Length classified identically (%)96.296.2
Impassable-class IoU (–)0.0120.012
Impassable-class precision/recall (–)0.036/0.018reference
Table 4. Share of the routing network length reachable within statutory time thresholds (percentages relative to the 656.7 km pre-flood network, central ambulance position, and flood barriers derived from the Sentinel-1 mask).
Scenario≤8 min≤15 min≤20 min
Pre-flood, 37.2 km/h49.4%88.3%97.8%
Pre-flood, 61.8 km/h83.5%98.9%99.3%
Flood (SAR barriers), 37.2 km/h42.5%79.6%86.4%
Flood (SAR barriers), 61.8 km/h73.6%89.0%89.8%
Table 5. Locality-level accessibility from the central ambulance position. Populations are locality counts from the 2021 national census. The town of Nysa (40,417 inhabitants) remains reachable in all scenarios, and one small village (Skorochów) is excluded for lack of a census count. “Without road access” means no route exists regardless of speed.
ScenarioSettlements Without Road AccessPopulation Beyond 15 minPopulation Beyond 20 min
Pre-flood, 37.2 km/hnone1303431
Pre-flood, 61.8 km/hnone00
SAR barriers, 37.2 km/hKoperniki, Siestrzechowice26051733
SAR barriers, 61.8 km/hKoperniki, Siestrzechowice938938
Optical barriers, 37.2 km/h17 settlements96689668
Optical barriers, 61.8 km/h17 settlements85968232
Table 6. Accessibility under alternative barrier sources and definitions: share of the pre-flood routing network (656.7 km) reachable from the central ambulance position at 61.8 km/h. Rows 2–5 derive barriers from the reference optical mask.
Barrier Source/DefinitionRemoved (km)≤8 min≤15 min≤20 min
SAR-derived barriers (operational)8.573.6%89.0%89.8%
All intersections blocked17.334.6%39.8%43.8%
Flooded stretches ≥ 10 m17.034.7%39.9%43.9%
Bridge-preserving17.048.3%76.2%80.1%
Flooded stretches ≥ 50 m10.968.9%90.7%91.0%
Table 7. Sensitivity of the flood and accessibility products to the detection threshold R (routing network, central ambulance position, 61.8 km/h model, and population beyond the 20 min statutory maximum).
Threshold RFlood Extent (ha)Impassable Length (km)Barrier Points15 min Coverage (%)Population Beyond 20 min
1.1588317.2596878.32548
1.2574312.1069881.31509
1.356408.5150889.0938
1.455666.5439692.6938
1.555114.6228096.70
Table 8. Flood extent for the Lewin Brzeski case study.
MetricValue
Municipality area (ha)15,970
SAR-derived flood extent (ha)1995.04
SAR-derived flooded share (%)12.5
Table 9. Comparison against CEMS reference product for the Lewin Brzeski case study.
MetricValue
CEMS flood extent (ha)3164.28
Jointly detected flood extent (TP) (ha)1620.39
SAR-only flood extent (FP) (ha)
CEMS-only flood extent (FN) (ha)
Geometric union (ha)
Precision (–)
Recall (–)
F1-score (–)
Intersection-over-union (–)
374.65
1543.89
3538.93
0.8122
0.5121
0.6281
0.4579
Table 10. Road impact statistics for the Lewin Brzeski case study.
MetricValue
Analyzed road network (km)619.26
Road segments intersecting the SAR flood mask (km)35.45
Road segments outside the SAR flood mask (km)
Share of road network intersecting the flood mask (%)
583.82
5.72
Table 11. Processing latency of the analytical modules over 25 runs per configuration, reported as cold- and warm-cache mean ± SD with warm-cache median and 95th percentile.
Module/VariantCold-Cache Mean ± SD (s)Warm-Cache Mean ± SD (s)Warm-Cache Median (s)Warm-Cache p95 (s)
Flood detection including OSM download28.58 ± 2.0219.56 ± 2.0119.4323.45
Flood detection, preloaded roads20.28 ± 2.3620.25 ± 2.7419.5423.01
Accessibility: flood barriers, no signals14.54 ± 0.5511.81 ± 0.2811.7312.22
Accessibility: pre-flood, no signals29.17 ± 1.5425.73 ± 0.9925.3828.03
Accessibility: flood barriers, signals18.82 ± 0.1716.43 ± 0.1216.4116.61
Accessibility: pre-flood, signals37.18 ± 0.3034.17 ± 0.2234.1034.68
Disclaimer/Publisher’s Note: The statements, opinions and data contained in all publications are solely those of the individual author(s) and contributor(s) and not of MDPI and/or the editor(s). MDPI and/or the editor(s) disclaim responsibility for any injury to people or property resulting from any ideas, methods, instructions or products referred to in the content.