Technical Note

YOLO-ROSS: A Robust Small Object Detection Model for UAV Aerial Imagery in Complex Interference Environments

1
School of Electronic and Information Engineering, Nanjing University of Information Science and Technology, Nanjing 210044, China
2
Key Laboratory of Intelligent Support Technology for Complex Environments, Ministry of Education, Nanjing 210044, China
3
School of Electronic Information and Integrated Circuits, Anqing Normal University, Anqing 246133, China
*
Author to whom correspondence should be addressed.
Remote Sens. 2026, 18(17), 2997; https://doi.org/10.3390/rs18172997
Submission received: 12 July 2026 / Revised: 29 August 2026 / Accepted: 31 August 2026 / Published: 3 September 2026

Highlights

What are the main findings?
  • YOLO-ROSS improves UAV small-object detection robustness through anti-interference feature extraction, progressive multi-scale feature fusion, and consistency-based dual label assignment.
  • YOLO-ROSS achieves 30.9% mAP@50 on the robustness dataset, outperforming YOLOv11n by 4.2 percentage points under mixed interference conditions.
What are the implications of the main findings?
  • The proposed model reduces missed and false detections of small objects under noise, adverse weather, illumination variation, and complex backgrounds.
  • The NMS-free detection strategy enables efficient end-to-end inference, supporting the practical deployment of UAV object detectors in complex environments.

Abstract

Small objects in UAV imagery are easily obscured by sensor noise, adverse illumination, and weather-like appearance degradation. To address this problem, this paper proposes YOLO-ROSS, a lightweight detector built on YOLOv11. Its two architectural contributions are a C3k2_DTAB feature-extraction block, which combines grouped channel self-attention and masked-window self-attention to protect weak local evidence while adding non-local context, and an AFPN-P2 neck, which preserves high-resolution geometry and progressively aligns shallow detail with deep semantics. For end-to-end deployment, the detector also adopts the rank-consistent one-to-many/one-to-one assignment used by YOLOv10; this adopted component is evaluated separately but is not claimed as a new label-assignment algorithm. On the mixed-corruption VisDrone benchmark, YOLO-ROSS obtains 0.309 mean mAP@0.5 over eight runs, an absolute improvement of 0.042 over YOLOv11n. Its all-class peak F1 is approximately 0.40, compared with 0.36 for YOLOv11n, although the optimal confidence threshold shifts from 0.146 to 0.186. A direct-transfer evaluation on SODA-D-Robustness provides an additional check under a combined driving-domain and appearance-corruption shift. These results support improved accuracy under the specified controlled RGB corruptions, while not establishing universal real-weather or cross-modal robustness.

1. Introduction

In modern battlefield surveillance, small-object detection in UAV aerial imagery has become essential for intelligence acquisition, reconnaissance, target localization, and tactical decision-making. Compared with traditional satellite reconnaissance, UAVs can operate at low altitudes and transmit high-resolution images in real time, thereby reducing latency and improving the capture of fine-grained target details [1]. In addition, UAVs can flexibly adjust their flight altitude and viewing angle to obtain battlefield information from multiple perspectives and at multiple scales, significantly enhancing surveillance coverage and accuracy. Equipped with high-definition cameras as well as multispectral, infrared, and thermal imaging sensors, UAVs can perform target detection and continuous tracking not only under daytime visible-light conditions but also at night and in adverse environments such as smoke, rain, fog, and haze [2]. These advantages enable all-time and all-domain perception, providing reliable visual intelligence support for precision strikes and rapid decision-making.
However, small-object detection in UAV aerial imagery still faces significant challenges in practical applications. Due to the high-speed movement and flexibility of UAV platforms, captured images are often degraded by motion blur, which weakens the edges and details of small objects and thus reduces detection accuracy [3]. At the same time, complex weather and illumination conditions, such as rain, snow, haze, and strong light, further reduce target-to-background contrast, making small objects harder to distinguish from cluttered backgrounds. Moreover, variations in flight altitude, viewing angle, and field of view cause substantial scale changes in targets. At high altitudes, objects may occupy only a few pixels, resulting in sparse features and a high risk of missed detection. In addition, UAV datasets often contain large variations in weather, illumination, and viewpoints, making comprehensive scene coverage difficult [4]. Annotation errors or inaccurate bounding boxes may further mislead model learning and weaken robustness in unseen scenarios.

1.1. Related Work

UAV small-object detectors primarily focus on high-resolution feature retention, stronger multi-scale fusion, and context modeling. VistrongerDet [5] enhances visual information at the FPN, RoI, and prediction-head levels for VisDrone images. QueryDet [6] sparsely activates high-resolution features at queried locations to reduce background computation, whereas TPH-YOLOv5 [7] combines an additional small-object head, Transformer prediction heads, and attention for drone-captured scenes. These methods enhance the representation of tiny objects, but dense high-resolution processing or heavy prediction heads can increase computational cost, and they do not jointly address confidence calibration and dependence on NMS under compound image degradation.
Remote-sensing detectors additionally exploit target orientation and long-range scene context. Oriented R-CNN [8] generates oriented proposals efficiently, whereas LSKNet [9] uses large selective kernels to adapt the receptive field to object-dependent contextual cues. For SAR ship detection, SLA-Net [10] injects sea-land priors through hierarchical attention in the backbone, FPN, and detection head. Such scene- or modality-specific priors are effective in their intended domains, but they are not directly available for monocular RGB UAV imagery with heterogeneous object categories. In contrast, YOLO-ROSS learns degradation-resistant local and global features from RGB imagery without requiring orientation labels, sea-land masks, or modality-specific auxiliary inputs.
Adverse weather and sensor degradation create a domain shift between clean training images and operational data. Gupta et al. [11] showed that real all-weather training data and explicit adaptation are important for robust detection, while denoising alone may not recover task-relevant information. Separately, lightweight UAV detectors pursue onboard feasibility: SlimYOLOv3 [12] uses channel pruning, and UAV-YOLO [13] enlarges the effective receptive field while retaining a one-stage design. Together, these studies expose an accuracy–efficiency–robustness trade-off: aggressive lightweighting can weaken small-object localization, whereas weather-specific pipelines may require additional real data, preprocessing, or model capacity.
The 2021–2026 evolution of the YOLO family has improved real-time detection through efficient re-parameterized backbones, compound scaling, gradient-path design, and end-to-end heads. YOLOv6 emphasizes deployment-oriented re-parameterization and quantization [14]; YOLOv7 introduces trainable bag-of-freebies and compound scaling [15]; YOLOv8 and YOLO11 provide lightweight C2f/C3k2-based model families through the official Ultralytics implementation, Version 8.0.0 and Version 11.0.0, respectively [16,17]; and YOLOv9 uses programmable gradient information and GELAN to reduce information loss in deep networks [18]. In parallel, conventional NMS suppresses duplicate predictions through score-based post-processing [19], whereas DETR-style set prediction, RT-DETR, and YOLOv10 remove or reduce this dependence through one-to-one matching or consistent dual assignment [20,21,22,23]. Recent robustness studies use real adverse-weather data, synthetic weather fine-tuning, or distortion-aware augmentation [11,24,25]. These advances address efficiency, optimization, post-processing, or training-data robustness, but they do not explicitly co-design a corruption-aware backbone block with progressive P2 fusion for tiny UAV targets. C3k2_DTAB differs by reconstructing grouped-channel and center-masked window attention inside the lightweight C3k2 bottleneck to suppress locally corrupted responses while retaining non-local support; AFPN-P2 differs from simply adding a small-object head by progressively aligning the stride-4 P2 geometry with P3–P5 semantics through normalized adaptive fusion. The proposed architectural contribution is therefore the jointly optimized feature-extraction/fusion pathway; the YOLOv10-style dual-assignment head remains an adopted deployment mechanism.

1.2. Research Gap and Contributions

Existing studies tend to optimize one dimension—resolution, contextual reasoning, adverse-weather adaptation, or computational efficiency—rather than jointly address two representation failures in lightweight UAV detection: noise-sensitive weak local features and the loss of shallow detail during cross-scale fusion. YOLO-ROSS addresses these failures through a task-specific redesign of the backbone and neck. An established rank-consistent dual-assignment head is retained as an end-to-end deployment mechanism, not presented as an independent methodological contribution. The scope of the claimed robustness is limited to the controlled appearance corruptions and cross-domain protocol defined in Section 3.1.
Accordingly, the main contributions are summarized as follows:
1.
A C3k2_DTAB feature-extraction block is designed to counter the loss of weak edges and textures under noise, blur, and low contrast. Grouped channel self-attention supplies long-range channel context, whereas masked-window attention preserves localized evidence without allowing individual corrupted pixels to dominate the response.
2.
A progressive AFPN-P2 neck is introduced because the P3–P5 pathway of a lightweight baseline can suppress objects occupying only a few pixels after repeated downsampling. The P2 branch retains high-resolution geometry, and progressive adaptive fusion reduces the semantic gap between shallow details and deep features.
3.
The two proposed architectural modules are integrated with an established rank-consistent one-to-many/one-to-one head to retain dense training supervision and permit NMS-free inference. The label-assignment formulation is explicitly identified as the YOLOv10-style implementation adopted for deployment; the contribution claimed here is its controlled integration and ablation within YOLO-ROSS, rather than a new assignment rule.
4.
The evaluation is broadened to include lightweight YOLO models, two-stage detectors, Transformer-based detectors, and the UAV-specific TPH-YOLOv5 baseline. In addition to the VisDrone corruption benchmark, direct VisDrone-to-SODA-D-Robustness transfer is evaluated on the mixed-corruption split over four harmonized meta-classes without target-domain fine-tuning. The mean and sample standard deviation over eight runs, computational cost, and a candid discussion of F1 and domain limitations are reported to separate controlled corruption robustness, preliminary cross-dataset evidence, and general real-world robustness.
The benchmark design separates detector-family effects from the contribution of the proposed method. Table 3 therefore includes conventional two-stage, Transformer-based, real-time end-to-end, and UAV-specific small-object detectors in addition to lightweight YOLO baselines, and it appends one direct SODA-D-Robustness mixed-corruption row. Unlike TPH-YOLOv5, QueryDet, and VistrongerDet, which primarily strengthen high-resolution or drone-specific representation, YOLO-ROSS introduces degradation-resistant local/global feature extraction and progressive P2 fusion, and combines them with an established NMS-free prediction head. Table 5 isolates the corresponding module and internal design choices, Table 6 evaluates the principal ablation chain across VisDrone interference conditions, and Table 7 reports computational cost; SODA-D-Robustness is not used in these ablation or efficiency analyses.

2. Method

2.1. YOLOv11

Ultralytics YOLO11, Version 11.0.0 [17], released by Ultralytics in September 2024, is a real-time computer-vision model family comprising a backbone, neck, and detection head. YOLO11n was selected as the principal baseline not because it was assumed to be the most accurate detector, but because it provides a reproducible lightweight reference for resource-constrained UAV deployment. Under the common protocol in Table 7, it contains 2.58 M parameters, requires 6.5 GFLOPs, and reaches 286 FPS on the RTX 4090, allowing the marginal cost of each robustness-oriented modification to be measured.
This choice also makes the accuracy–efficiency trade-off explicit. The lightweight YOLO11n baseline attains only 0.267 mean mAP@0.5 on the mixed-corruption subset, whereas larger or specialized models can improve representation at substantially higher computational cost. Its modular C3k2 backbone, feature-pyramid neck, and decoupled head permit controlled replacement of feature extraction, fusion, and label assignment while keeping the remaining pipeline fixed. Larger YOLO11 variants are therefore evaluated separately in Table 4 rather than used as the sole baseline.

2.2. Anti-Interference Feature Extraction Module

2.2.1. Self-Attention-Based Feature Extraction Module

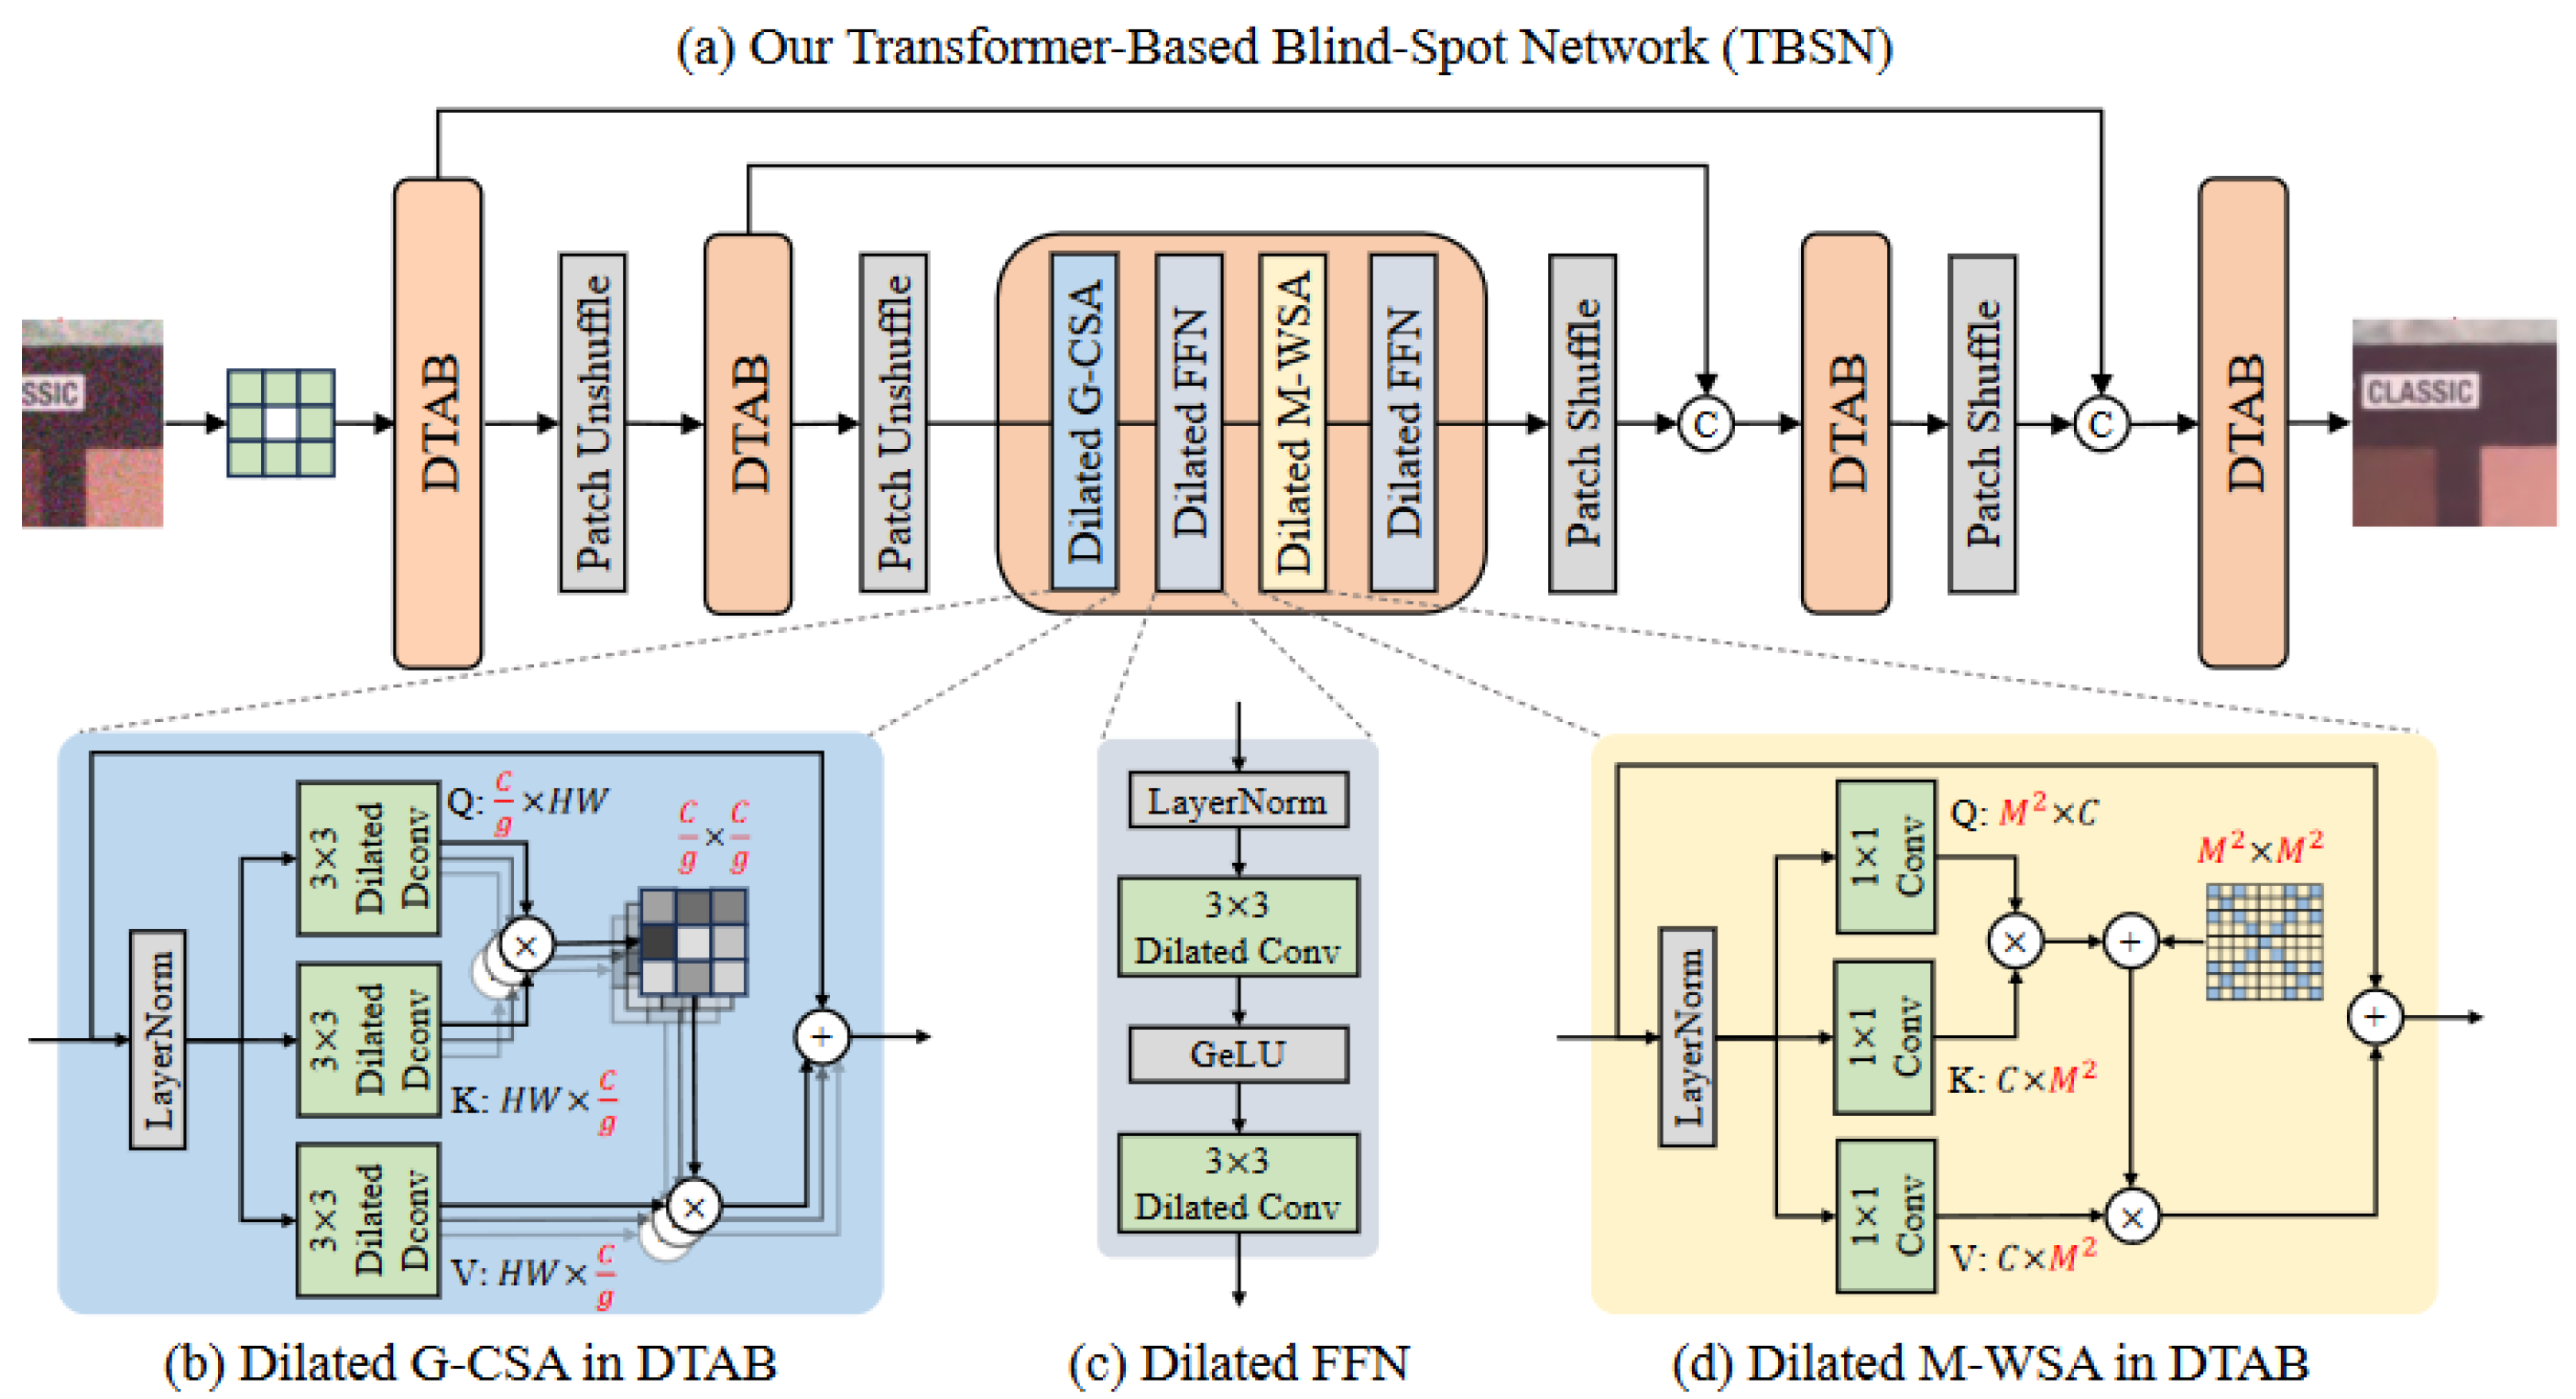
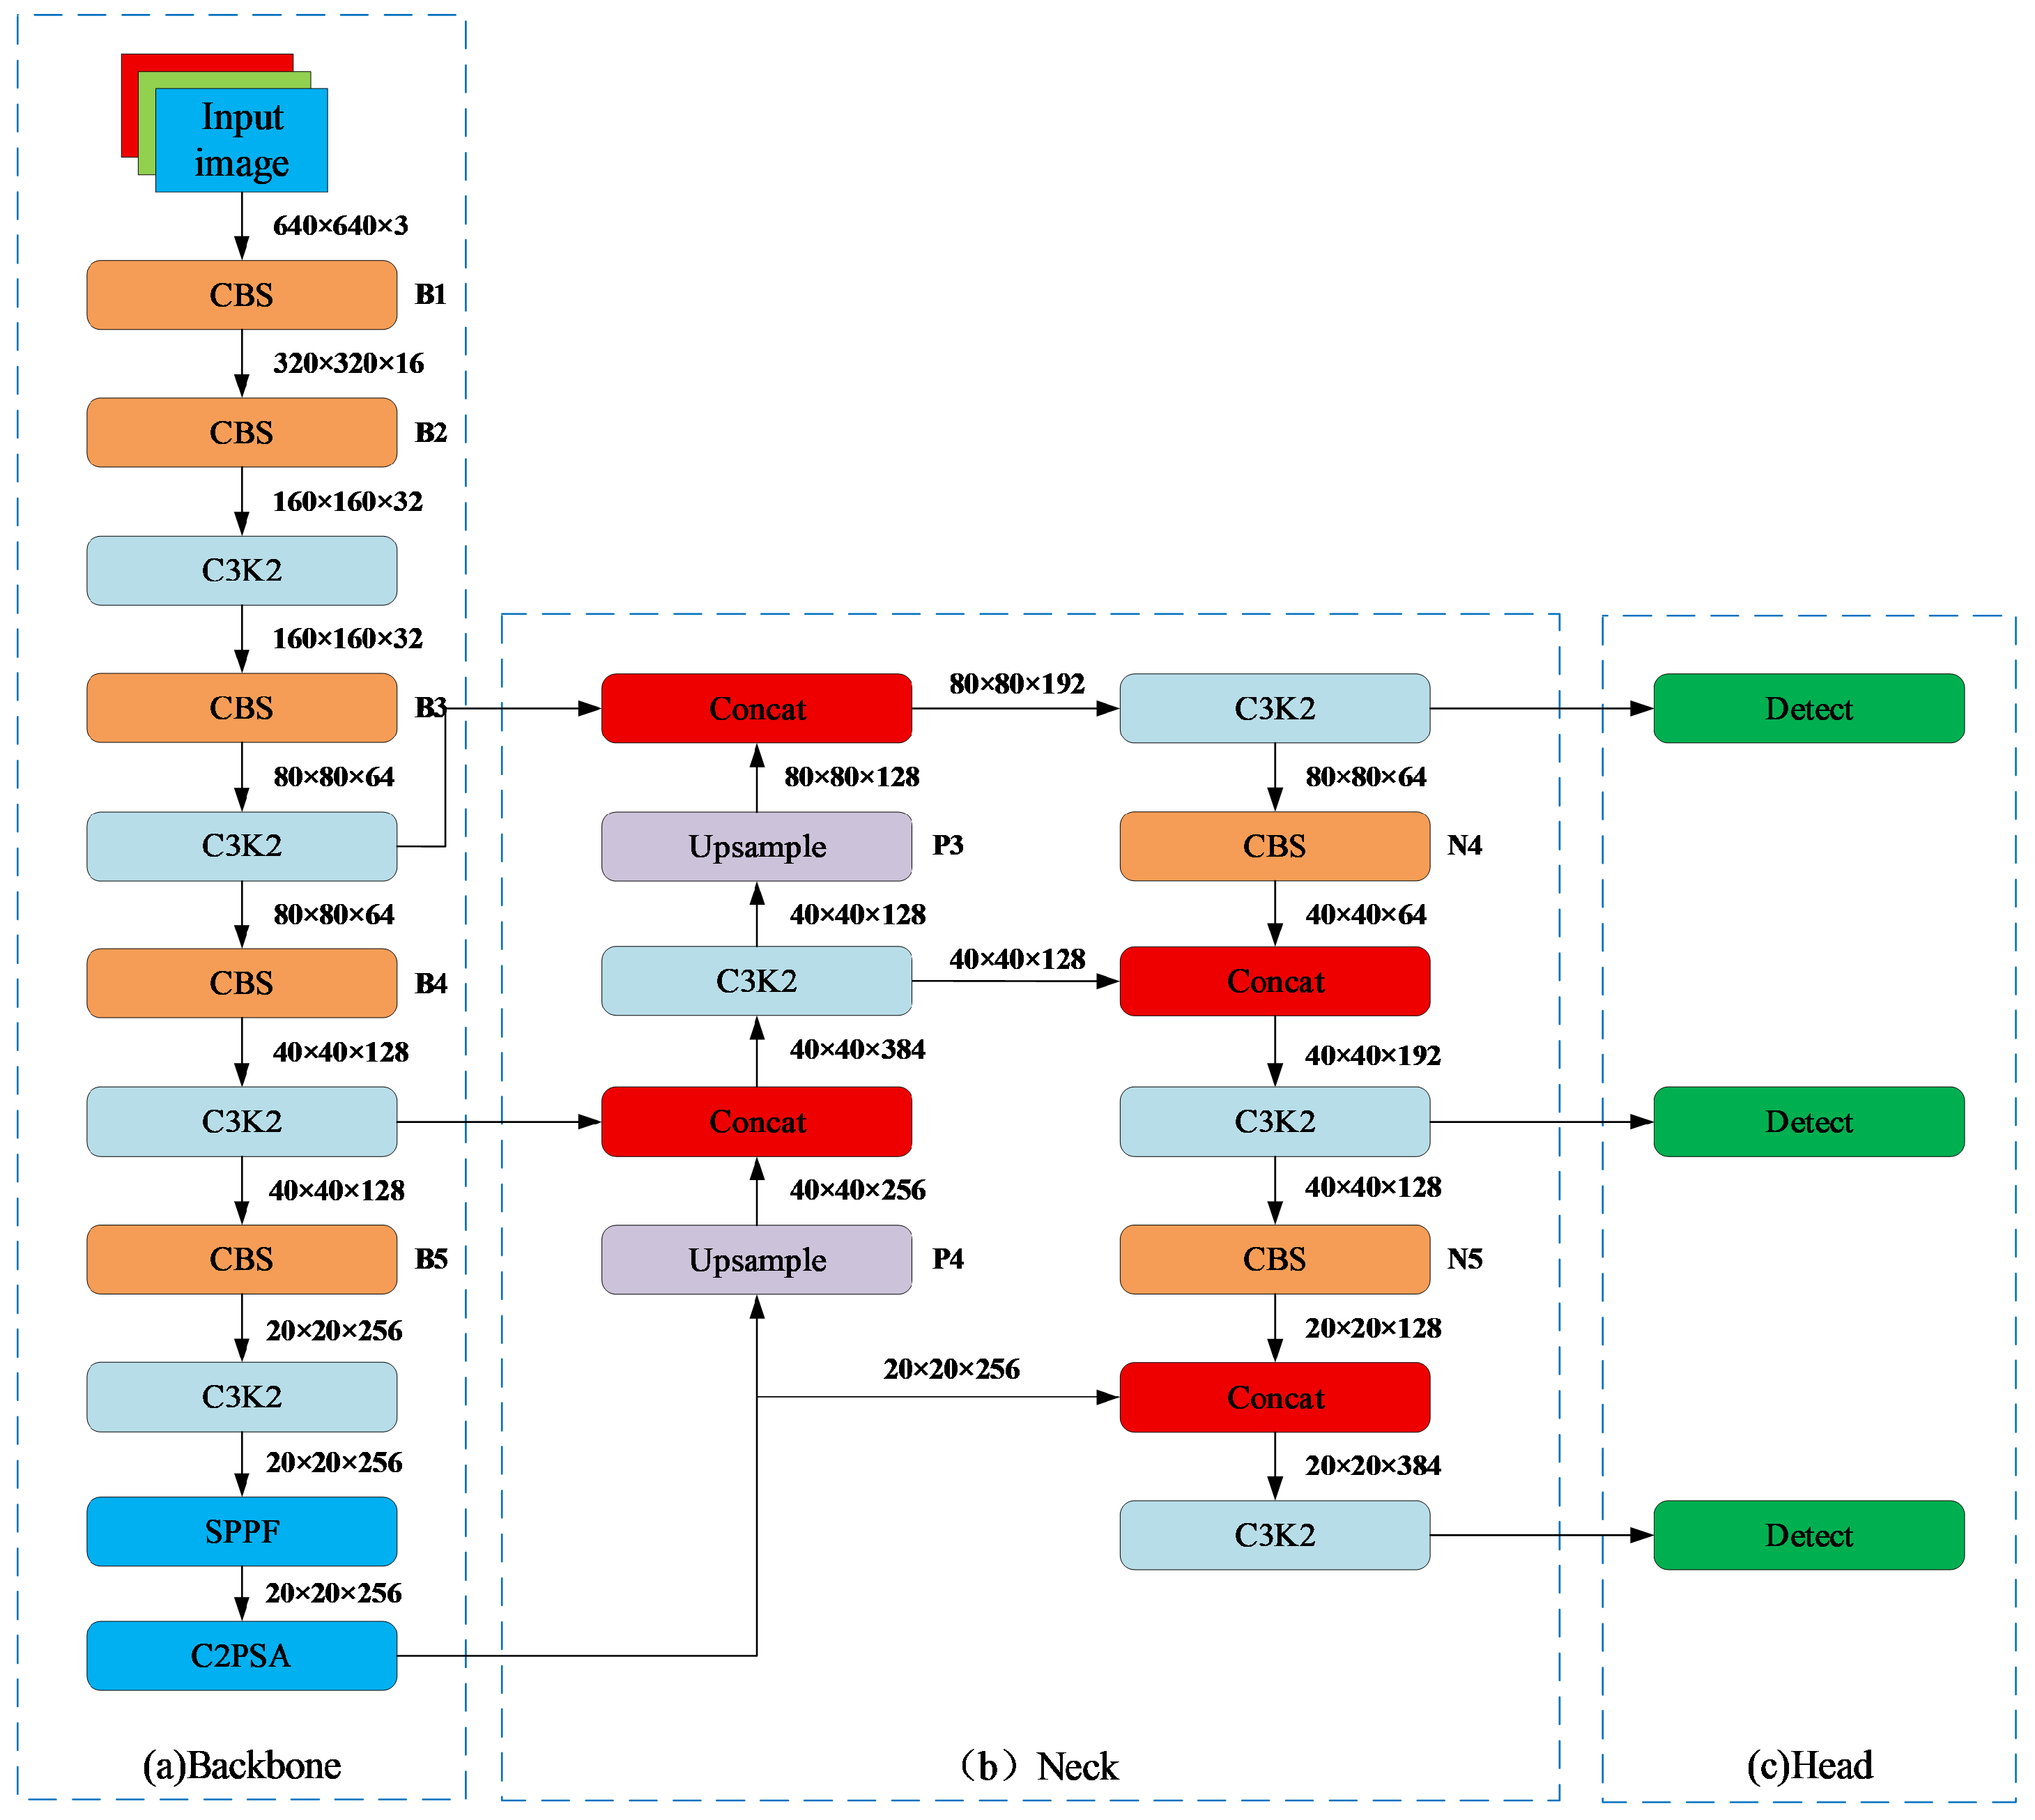
DTAB (Dilated Transformer Attention Blocks) is the attention block introduced in TBSN [26] for Transformer-based blind-spot denoising. It redesigns channel and spatial attention to combine local fitting with non-local context while preventing direct center-pixel leakage. The network architecture of YOLOv11 is shown in Figure 1.
DTAB mainly consists of three components: Grouped Channel Self-Attention (G-CSA), Masked Window Self-Attention (M-WSA), and a Feed-Forward Network (FFN). By combining local adaptation with global interaction, the module can effectively capture both local and global image features, leading to improved denoising performance. The overall structure of DTAB is shown in Figure 2.

2.2.2. Design of the Anti-Interference Feature Extraction Module

The baseline C3k2 block relies mainly on local convolution. When a small object is represented by only a few weak edge or texture responses, noise, blur, and low contrast can make those responses indistinguishable from the background; subsequent downsampling cannot recover information that has already been suppressed. This motivates introducing DTAB at the feature-extraction stage rather than relying only on image preprocessing. Its grouped channel attention aggregates non-local context at a controlled computational cost, while masked-window attention protects local structure and limits direct propagation from a potentially corrupted center pixel.
DTAB follows the Transformer-based blind-spot design of TBSN [26], which provides the direct source for its masked-window and grouped-channel attention primitives. We reconstruct these primitives inside the lightweight C3k2 bottleneck for UAV small-object detection: M-WSA blocks direct center-pixel leakage within a local window, while G-CSA supplies cross-channel context without full global spatial attention. This reconstruction targets the specific failure of weak object evidence being overwhelmed by corrupted local responses.
The effectiveness of DTAB is mainly reflected in three aspects. First, M-WSA constrains attention to local regions, which helps the model capture fine-grained details and improves the localization of tiny objects in complex backgrounds. Second, G-CSA models feature dependencies from a global perspective, providing richer contextual information while mitigating the information leakage caused by channel attention. Third, the combination of dilated convolution and masked attention enlarges the effective receptive field, which strengthens the representation of small objects near image boundaries or under partial occlusion. As a result, DTAB enables the model to learn more discriminative and stable features under noisy and occluded conditions.
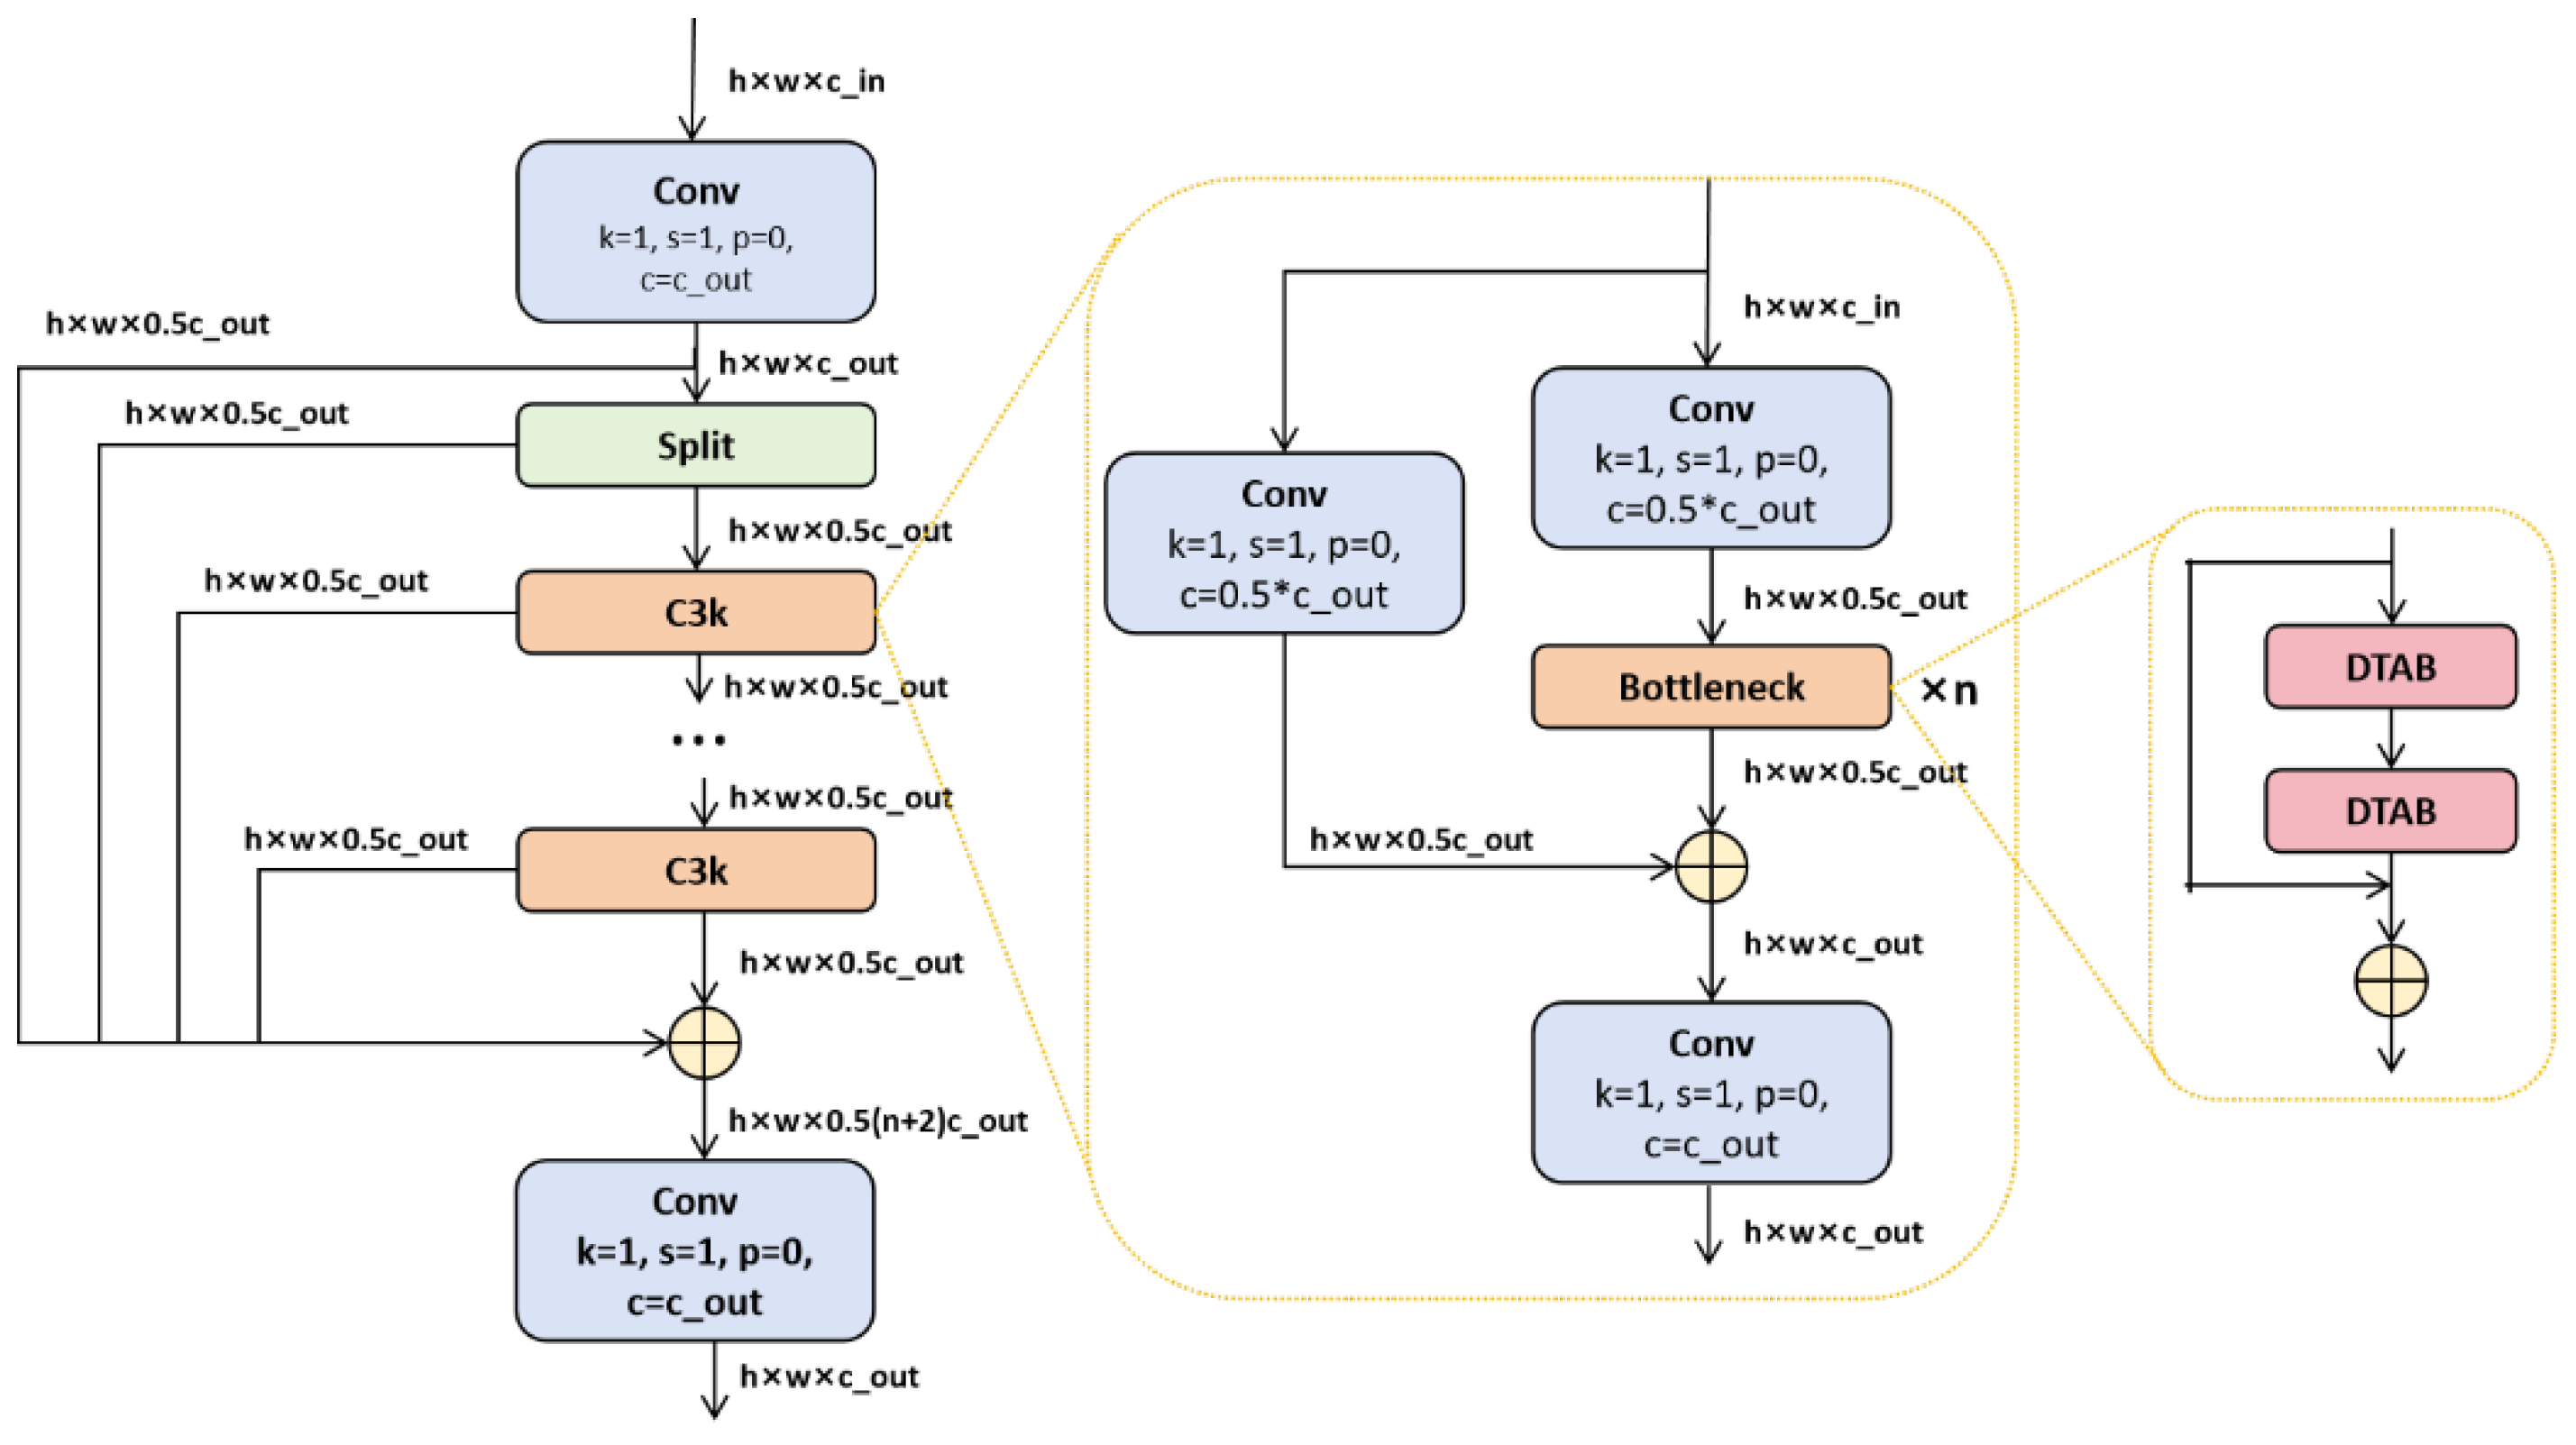
Motivated by these advantages, this paper introduces DTAB into the C3k2 module of YOLOv11. Following a plug-and-play design, DTAB can be integrated into the network without altering the overall architecture. Specifically, the internal Bottleneck in C3k2 is reconstructed by replacing its convolutional components with DTAB, resulting in a new C3k2_DTAB module. The structure of C3k2_DTAB is shown in Figure 3.
For reproducibility, let X R H × W × C be the input to one DTAB unit and N = H W . G-CSA first divides the channel dimension into G = C / d g groups of width d g . After flattening the spatial dimensions, the gth group is X g R N × d g . With the learned projections Q g = X g W g Q , K g = X g W g K , and V g = X g W g V , grouped channel attention is
A g = softmax Q g T K g N , Y G CSA = W O Concat g = 1 G V g A g T .
The softmax is applied row-wise within each d g × d g channel-affinity matrix. Grouping prevents the C × C attention map from becoming the dominant computational cost while allowing non-local spatial evidence to influence the channel response.
M-WSA partitions the feature map into non-overlapping M × M windows. For window w and attention head h, let Q w h , K w h , V w h R M 2 × d h and let r u be the relative coordinate of token u. The fixed center-exclusion mask is
B u v = 0 , u v and r u r v M 1 , , u = v , Y w h = softmax Q w h K w h T d h + B V w h .
Thus, a query cannot copy its own potentially corrupted response, but it can aggregate the remaining tokens within its window. In the second attention layer, a dilated 3 × 3 depthwise convolution with dilation δ = 2 exchanges information across neighboring windows. The complete residual unit is X 1 = X + Y G CSA , X 2 = X 1 + Y M WSA , and X out = X 2 + FFN ( X 2 ) . Unless otherwise specified, d g = 32 , M = 8 , four attention heads are used, the FFN expansion ratio is 2, and LayerNorm uses ϵ = 10 6 .

2.3. Robust Progressive Pyramid Feature Fusion Structure

2.3.1. Progressive Feature Pyramid

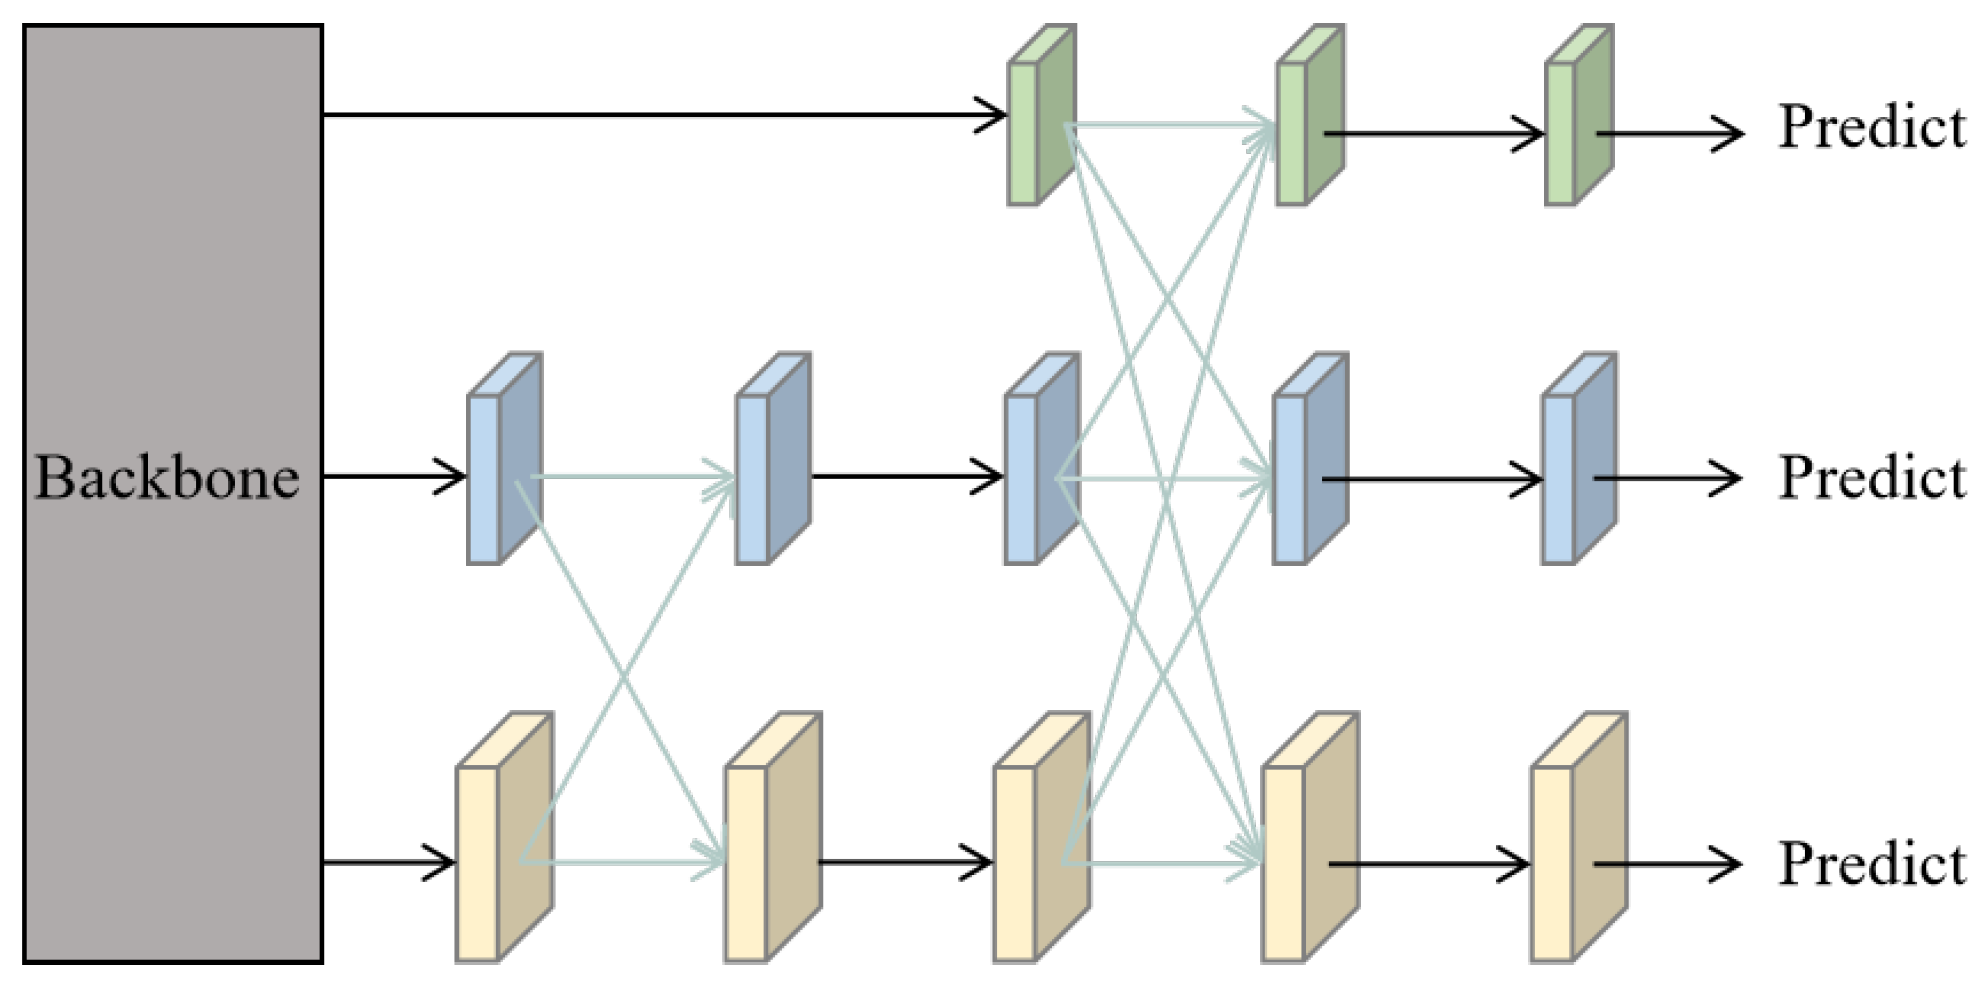
The Asymptotic Feature Pyramid Network (AFPN) [27] is proposed to alleviate the loss of low-level details and the difficulty of small-object detection caused by feature fusion in traditional FPNs. Inspired by the multi-resolution parallelism and cross-stage fusion strategy of HRNet [28], AFPN preserves and progressively integrates low-level and high-level features during feature extraction, thereby providing richer detailed information and stronger semantic representations, which are particularly beneficial for bounding box regression and small object recognition.
Starting from low-level features at two different resolutions, AFPN progressively incorporates higher-level features in a layer-by-layer manner until reaching the top layer of the backbone. This design alleviates the semantic gap between non-adjacent layers and promotes the joint enhancement of low-level details and high-level semantics. In addition, instead of using simple summation, AFPN adopts adaptive weighting and spatial fusion to selectively aggregate multi-level features, thereby improving the effectiveness and robustness of cross-scale information interaction. The overall architecture of AFPN is shown in Figure 4.

2.3.2. Robustness-Oriented Optimization Design of the AFPN Feature Fusion Structure

The original lightweight neck begins prediction from P3-level features. For COCO-defined small objects, repeated stride-2 downsampling can reduce the target footprint to only a few feature cells, so a one-pixel localization error produces a large relative displacement and a sharp IoU decrease. Directly adding a P2 head without controlled cross-scale alignment may retain detail but also introduce background noise into the fused features. AFPN-P2 is therefore used to preserve high-resolution geometry and to progressively align it with deeper semantic features before prediction.
An improved AFPN is introduced into the neck of YOLOv11 to address the loss of small-object details, such as edges and contours, as well as localization errors caused by repeated downsampling of high-level features. Specifically, adaptive weights dynamically fuse multi-scale features, while a progressive bottom-up alignment strategy is adopted to reduce the semantic gap between non-adjacent layers. This design effectively preserves low-level fine-grained information while enhancing the semantic representation of high-level features, thereby improving the flow of multi-scale information within the feature pyramid and improving the perception and regression accuracy of small objects.
On this basis, a new P2 layer is introduced to provide high-resolution shallow features for capturing target edges and shape information, which are then fully fused with high-level semantic features. As a result, the detection head can simultaneously exploit fine-grained details and rich semantic information. Compared with the original neck of YOLOv11, the proposed AFPN-P2 reduces localization errors caused by low-resolution features and significantly improves multi-scale detection performance and small-object recognition capability. It also demonstrates stronger robustness under complex backgrounds, occlusion, and noisy scenarios.
Let X k denote the backbone feature at level k { 2 , 3 , 4 , 5 } , with strides { 4 , 8 , 16 , 32 } . For a target level l, A l k ( · ) first projects X k to the common width C f = 128 by a 1 × 1 convolution and then aligns its resolution: bilinear interpolation is used when k > l , whereas repeated stride-2 3 × 3 convolutions are used when k < l . The normalized fusion coefficient and aligned feature are
ω l k ( t ) = exp ( θ l k ( t ) / τ ) q S t exp ( θ l q ( t ) / τ ) , Z l k = A l k ( X k ) , τ = 1 ,
where θ l k ( t ) is learned and S t is the set of levels available at progressive stage t. AFPN-P2 introduces levels gradually, S 1 = { 2 , 3 } , S 2 = { 2 , 3 , 4 } , and S 3 = { 2 , 3 , 4 , 5 } , and computes
F l ( t ) = ϕ l ( t ) k S t ω l k ( t ) Z l k , t { 1 , 2 , 3 } ,
where ϕ l ( t ) is a 3 × 3 convolution followed by batch normalization and SiLU activation. The staged sets make the design different from a direct four-level summation: adjacent shallow/detail features are aligned first, and more distant semantic levels are introduced only after the preceding fusion has been refined.
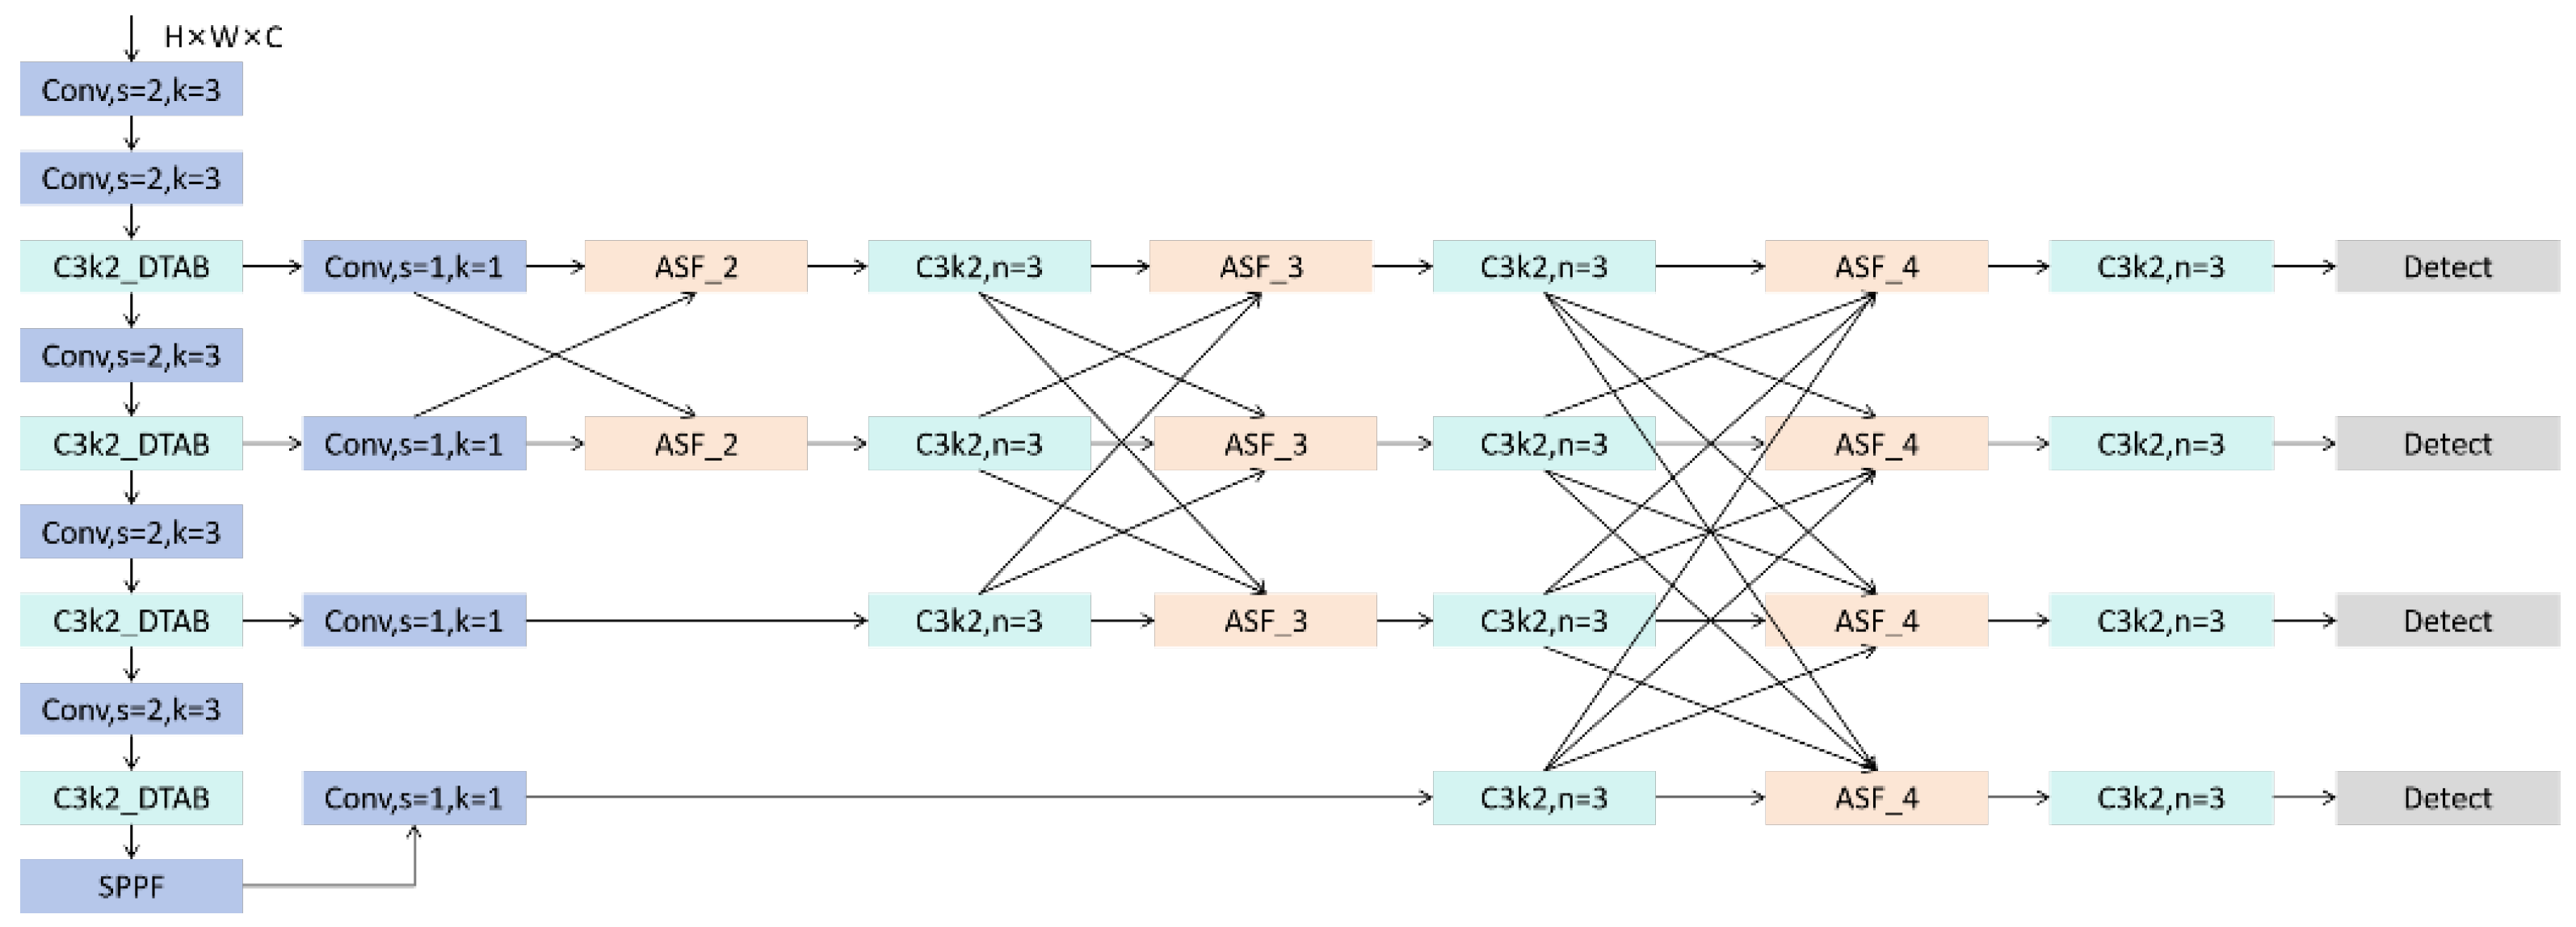
The overall architecture of YOLO-ROSS after incorporating C3k2_DTAB and AFPN-P2 is shown in Figure 5.

2.4. Adopted Rank-Consistent Dual Assignment for NMS-Free Inference

Dense UAV scenes generate overlapping candidates around adjacent small objects. One-to-many (O2M) supervision supports optimization and recall, but its outputs require NMS; one-to-one (O2O) supervision produces unique predictions but provides fewer positive samples. YOLO-ROSS therefore adopts the dual-assignment head and consistent task-aligned metric of YOLOv10 [23]. This subsection makes the adopted mechanism explicit so that it is not confused with the two proposed architectural modules.
Let i index a prediction point and j a ground-truth instance of class y j . For a candidate pair ( i , j ) , the task-aligned score is
m i j ( α , β ) = s i j p i j α IoU ( b ^ i , b j ) β , α > 0 , β > 0 ,
where p i j is the predicted probability of class y j , b ^ i and b j are the predicted and ground-truth boxes, and s i j = I ( x i b j ) is a binary spatial-feasibility mask. The exponent α weights semantic confidence, whereas β weights localization quality.
The O2M and O2O branches use m i j o 2 m = m i j ( α o 2 m , β o 2 m ) and m i j o 2 o = m i j ( α o 2 o , β o 2 o ) . Their exponents can be written as
α o 2 o = γ α o 2 m , β o 2 o = γ β o 2 m m i j o 2 o = m i j o 2 m γ , γ > 0 .
For every γ > 0 , the power function is strictly increasing on nonnegative scores. It therefore preserves the ranking and the O2O argmax; changing γ alone does not define a different positive candidate except in numerical tie cases. In our implementation, γ = 1 , so the two matching scores are numerically identical. Equation (6) is thus an analytical statement of the adopted YOLOv10 consistency condition, not an additional tunable mechanism or a novel assignment rule.
For the valid set C j = { i s i j = 1 } , positives are selected by
Ω j o 2 m = TopK i C j m i j o 2 m , 10 , Ω j o 2 o = arg max i C j m i j o 2 o .
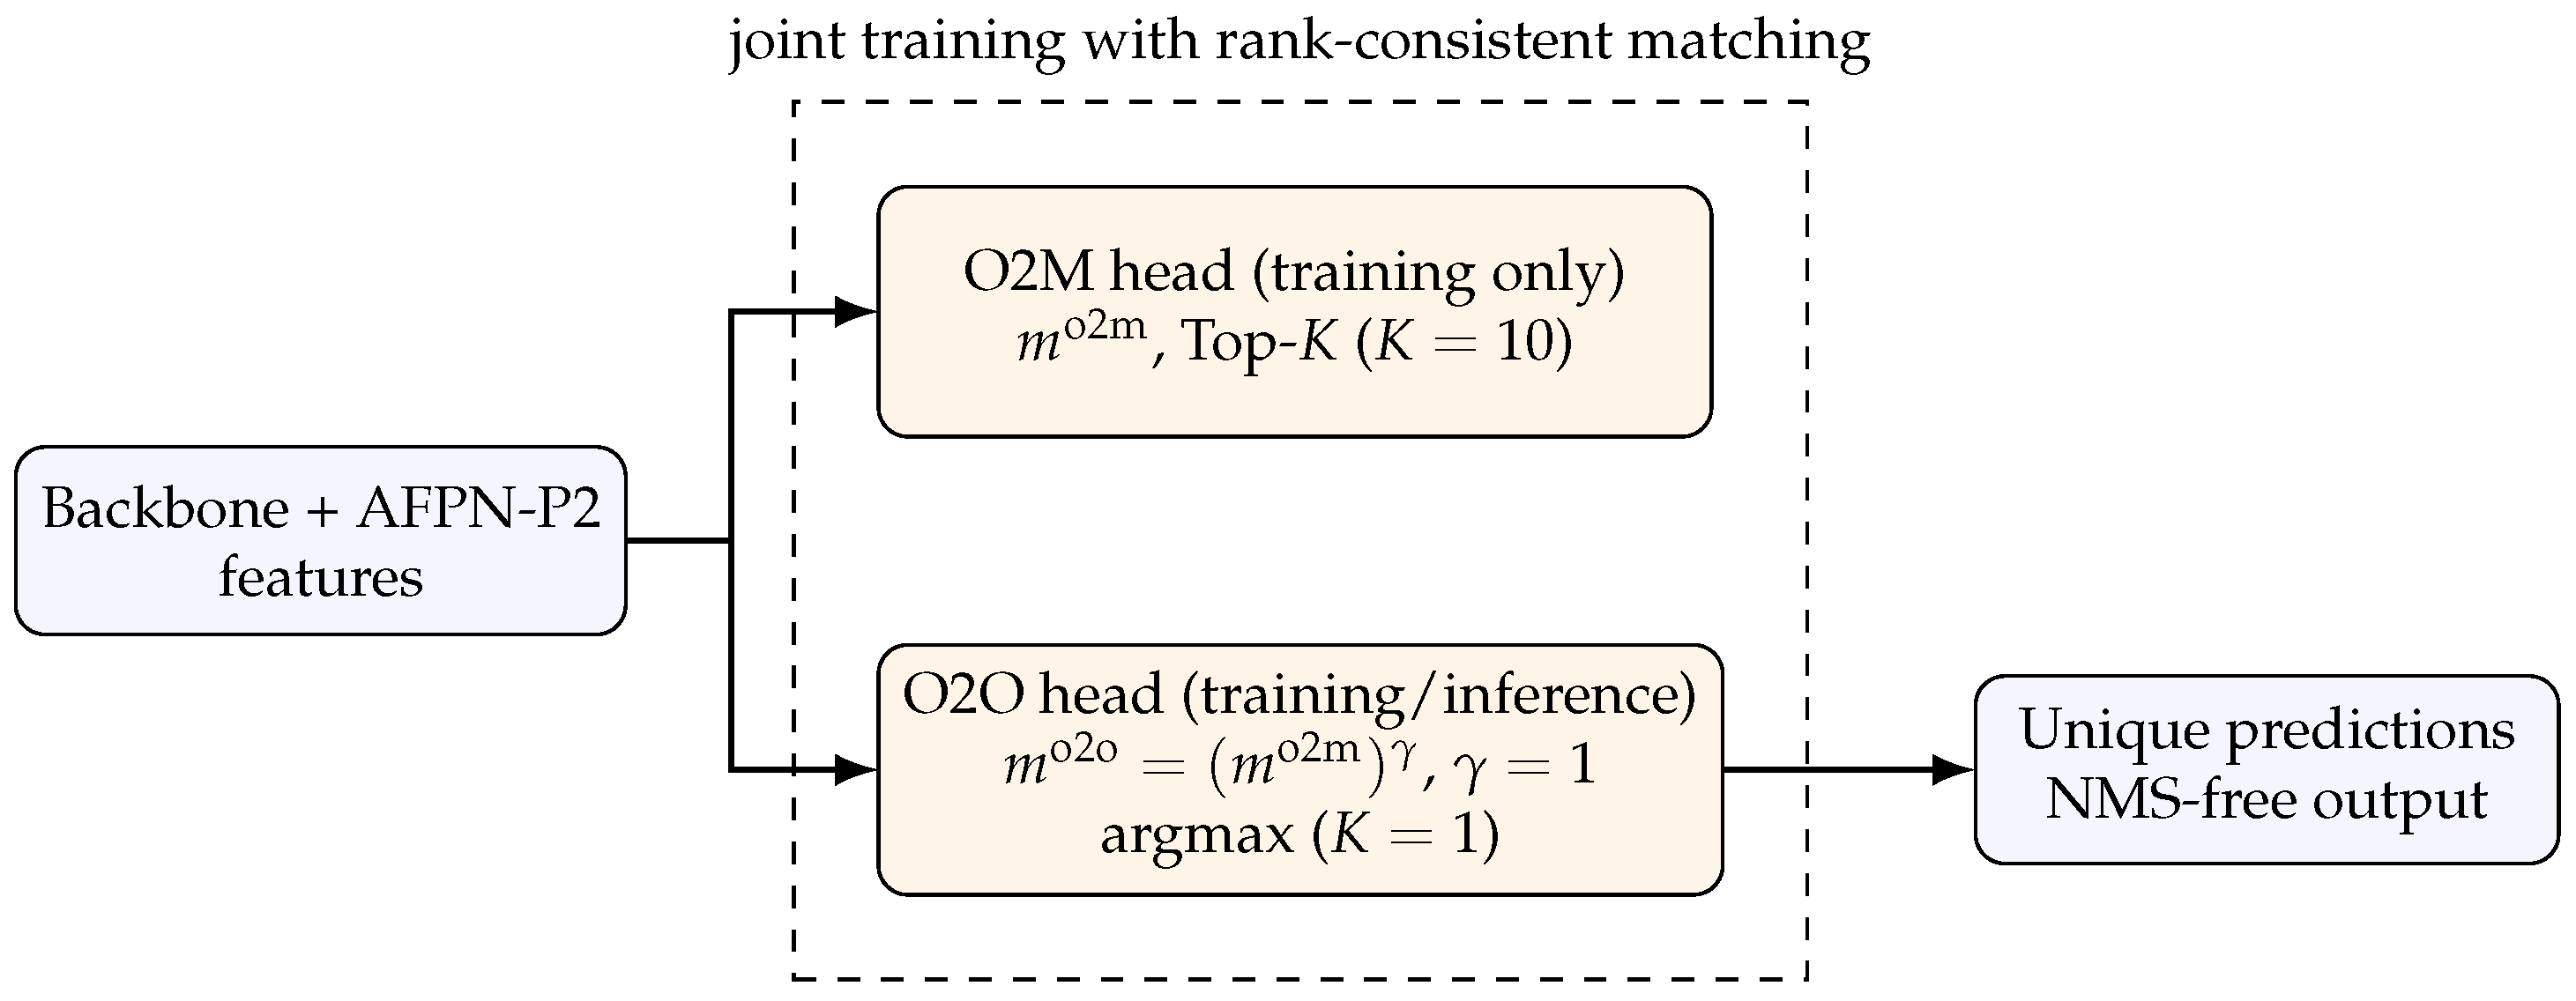
Both branches are optimized during training, and only the O2O branch is retained at inference. We use α o 2 m = α o 2 o = 0.5 and β o 2 m = β o 2 o = 6.0 , following YOLOv10 [23]; these values were fixed before robustness evaluation. Table 5 isolates the adopted head (M3) and its effect after integration with the proposed C3k2_DTAB and AFPN-P2 modules (M4 versus M5). The block diagram is shown in Figure 6.

3. Experimental Data and Environment

3.1. Dataset, Small-Object Definition, and Robustness Protocol

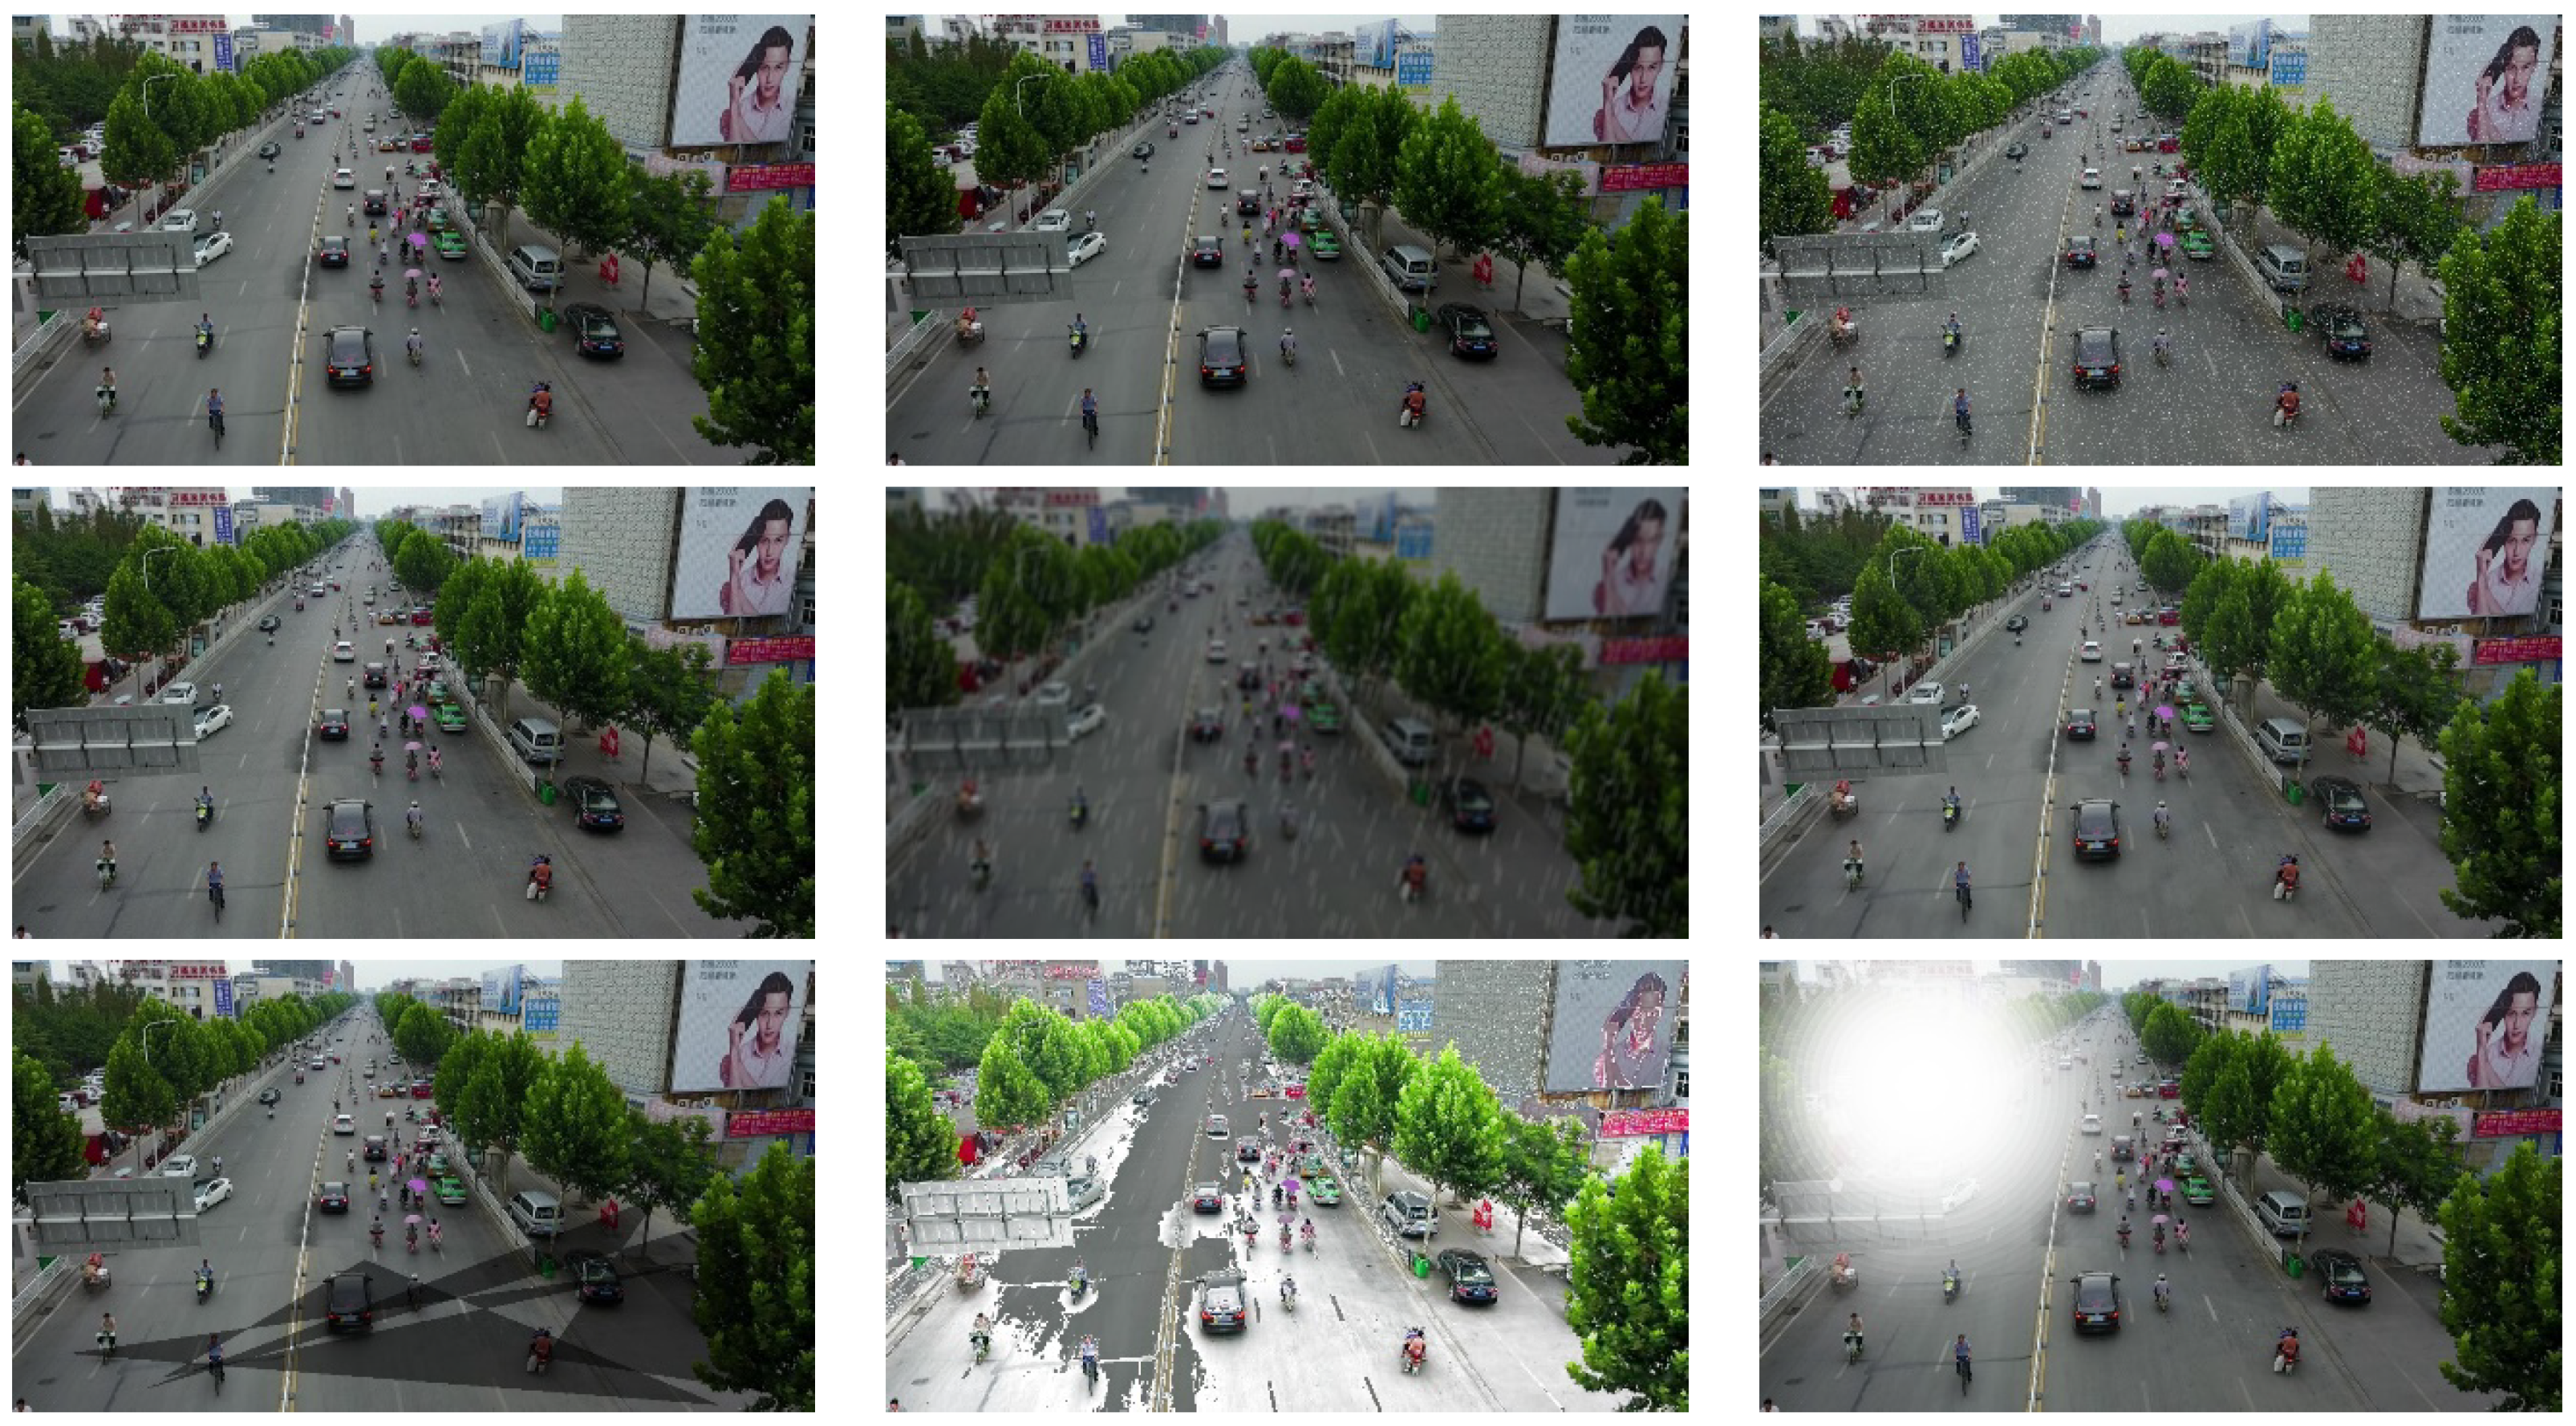
Two complementary benchmarks were used. In this paper, corruption robustness refers specifically to performance under the controlled photometric transformations defined below; it does not by itself imply robustness to real weather or unseen sensing modalities. The VisDrone2021-based benchmark retains the UAV source-domain scene distribution, whereas SODA-D-Robustness adds a ground-view driving-domain shift. Both use Gaussian noise [29], camera-pipeline/ISO-like noise [30], brightness and contrast variation, rain, fog, shadow, snow, and sunlight flare; random combinations form the mixed-corruption condition. These transformations do not alter geometry, so the original boxes remain valid. The VisDrone protocol yields 3584 derived images, with the unmodified images used as the Original control subset.
Following the COCO convention [31], object size is defined by the area of each ground-truth bounding box in the original VisDrone annotation coordinates before network resizing: small below 1024 pixels2, medium from 1024 to below 9216 pixels2, and large at or above 9216 pixels2, corresponding to square-side thresholds of 32 and 96 pixels. Annotation-level statistics for the 3584-image benchmark comprise 251,376 instances, including 157,104 small objects (62.50%), 82,032 medium objects (32.63%), and 12,240 large objects (4.87%). This strong small-object dominance is consistent with the dataset-wide analysis of VisDrone2021 [5].
The cross-dataset benchmark is derived from the official SODA-D test split [32]. SODA-D is a large-scale small-object detection dataset for driving scenes, containing 24,828 high-resolution traffic images and 278,433 valid horizontally annotated instances from nine categories: people, rider, bicycle, motor, vehicle, traffic sign, traffic light, traffic camera, and warning cone. Its test split contains 7428 images covering diverse locations, weather conditions, time periods, viewpoints, and road scenes, with an average resolution of approximately 3407 × 2470 pixels [32]. Relative to VisDrone, the ground-level or vehicle-borne viewpoint, scene composition, category taxonomy, and sensor platform introduce a substantial domain shift.
Applying the shared corruption pipeline to every SODA-D test image produces SODA-D-Robustness, which contains eight single-corruption variants and one mixed-corruption variant per source image. The mixed variant combines two or three randomly selected transformations at a strength of 0.55. Generation uses the fixed seed 20,260,807, and transformed images are stored at JPEG quality 92. In total, the dataset contains 66,852 corrupted images across nine conditions, together with 7428 unmodified control images and unchanged bounding-box annotations. To avoid treating correlated variants of the same scene as independent samples, Table 3 uses only the 7428-image mixed-corruption split for the cross-dataset comparison.
For Table 3, the eight VisDrone-trained checkpoints of each detector were evaluated directly on the SODA-D-Robustness mixed-corruption split, without target-domain training, fine-tuning, augmentation, model selection, or confidence-threshold recalibration. To align the two label spaces, predictions and ground truth were mapped to four shared meta-classes: person (VisDrone pedestrian and people ↔ SODA-D people), vehicle (VisDrone car, van, truck, and bus ↔ SODA-D vehicle), bicycle, and motor. VisDrone’s tricycle and awning-tricycle categories and the unmatched SODA-D categories were excluded. The final row of Table 3 reports mAP@0.5 as mean ± sample standard deviation across the same eight source-domain runs.example of the interference effect is shown in Figure 7.

3.2. Experimental Environment and Training Configuration

The experiments were conducted using Python 3.10.15 on Ubuntu 18.04 LTS. The hardware platform comprised an Intel(R) Xeon(R) Gold 5117 CPU @ 2.00 GHz and an NVIDIA RTX 4090 GPU with 24 GB of memory. All models were implemented in PyTorch 1.12.1 with CUDA 11.4. The complete software, hardware, optimization, augmentation, and initialization settings are reported in Table 1.
Table 1. Training environment and complete optimization configuration.
Experimental SettingConfiguration Parameters
Operating systemUbuntu 18.04 LTS
Programming languagePython 3.10.15
Deep-learning frameworkPyTorch 1.12.1
CUDA versionCUDA 11.4
CPUIntel(R) Xeon(R) Gold 5117 CPU @ 2.00 GHz
GPUNVIDIA RTX 4090, 24 GB
Input resolution640 × 640 pixels
YOLO-family epochs/batch size200/16
Data-loader workers8
Optimizer (YOLO family)SGD
Initial/final learning rate0.01/0.0001 (lrf = 0.01)
Learning-rate scheduleCosine annealing
Momentum/weight decay0.937/5 × 10−4
Warm-up/early-stopping patience3/100 epochs
Mixed-precision trainingEnabled (AMP)
YOLO-family augmentationHSV 0.015/0.70/0.40; translate 0.10; scale 0.50; horizontal flip 0.50
Mosaic/close-Mosaic1.0/disabled during the final 10 epochs
Disabled augmentationRotation, shear, perspective, vertical flip, and MixUp (all 0)
Pretrained weightsOfficial COCO-pretrained weights
New-layer initializationKaiming normal; Conv bias 0; BN gamma/beta 1/0
Faster R-CNN-R50-FPN36 epochs; batch 8; SGD; lr 0.02; momentum 0.9; wd 1 × 10⁻⁴; steps 27/33
Deformable DETR-R5050 epochs; batch 4; AdamW; lr 2 × 10⁻⁴; backbone lr 2 × 10⁻⁵; wd 1 × 10⁻⁴; drop 40
RT-DETR-R1872 epochs; batch 8; AdamW; lr 1 × 10⁻⁴; backbone lr 1 × 10⁻⁵; wd 1 × 10⁻⁴; cosine
TPH-YOLOv5 [7]65 epochs; batch 8; SGD; lr 0.01; wd 5 × 10⁻⁴; 2-epoch warm-up
Random seeds0–7 for Table 3; seed 0 for Tables 4–6; Table 7 uses the corresponding fixed checkpoints
EvaluationSame dataset split and 640 × 640 input; no test-time augmentation
Cross-domain evaluationSODA-D-Robustness mixed-corruption split (7428 images); four harmonized meta-classes; VisDrone-trained checkpoints only; no target-domain training, fine-tuning, model selection, augmentation, or confidence-threshold recalibration
Unless otherwise specified, all YOLO-based models were trained using the common configuration in Table 1. Official COCO-pretrained weights were loaded for compatible layers. The newly introduced C3k2_DTAB, AFPN-P2, and additional detection layers were initialized using Kaiming-normal initialization for convolutional weights, zero biases for convolutional layers, and batch-normalization gamma/beta values of 1/0. No test-time augmentation was used.
Training-time augmentation for the YOLO-based models comprised HSV perturbation, random translation and scaling, horizontal flipping, and Mosaic augmentation using the probabilities and amplitudes in Table 1; Mosaic was disabled during the final 10 epochs to stabilize convergence. Rotation, shear, perspective transformation, vertical flipping, and MixUp were disabled. The Faster R-CNN, Deformable DETR, and RT-DETR baselines used the model-specific optimizers and schedules reported in Table 1, while the dataset split, input resolution, and evaluation protocol were held constant.
To quantify the variability caused by stochastic training in the primary comparative experiment, each detector reported in Table 3 was independently trained eight times on VisDrone using random seeds 0–7. For each detector, the source dataset split, training schedule, hyperparameters, and evaluation protocol were kept identical across its eight runs, while seed-dependent parameter initialization, data shuffling, and stochastic data augmentation were allowed to vary. Each trained checkpoint was evaluated on the same ten VisDrone test subsets and, without target-domain adaptation, on the harmonized 7428-image SODA-D-Robustness mixed-corruption split. Table 3 reports mAP@0.5 as the arithmetic mean ± sample standard deviation across the eight independent source-domain runs.
The condition-wise M0–M5 ablation in Table 6 is a seed-0 diagnostic experiment, as are the results presented in Table 4 and Table 5. M0 and M5 use exactly the YOLOv11n and YOLO-ROSS architectures, respectively, while M1–M4 are intermediate configurations evaluated with the same seed-0 data split, training schedule, and condition-wise pipeline. Their values are not forced to equal the eight-run means in Table 3: a seed-0 observation and an arithmetic mean over seeds 0–7 are different statistics. Accordingly, Table 3 provides the uncertainty-aware comparative evidence, whereas Table 4, Table 5 and Table 6 are used for controlled architectural diagnosis rather than significance testing.

4. Experimental Results and Analysis

4.1. Evaluation of Classification Accuracy

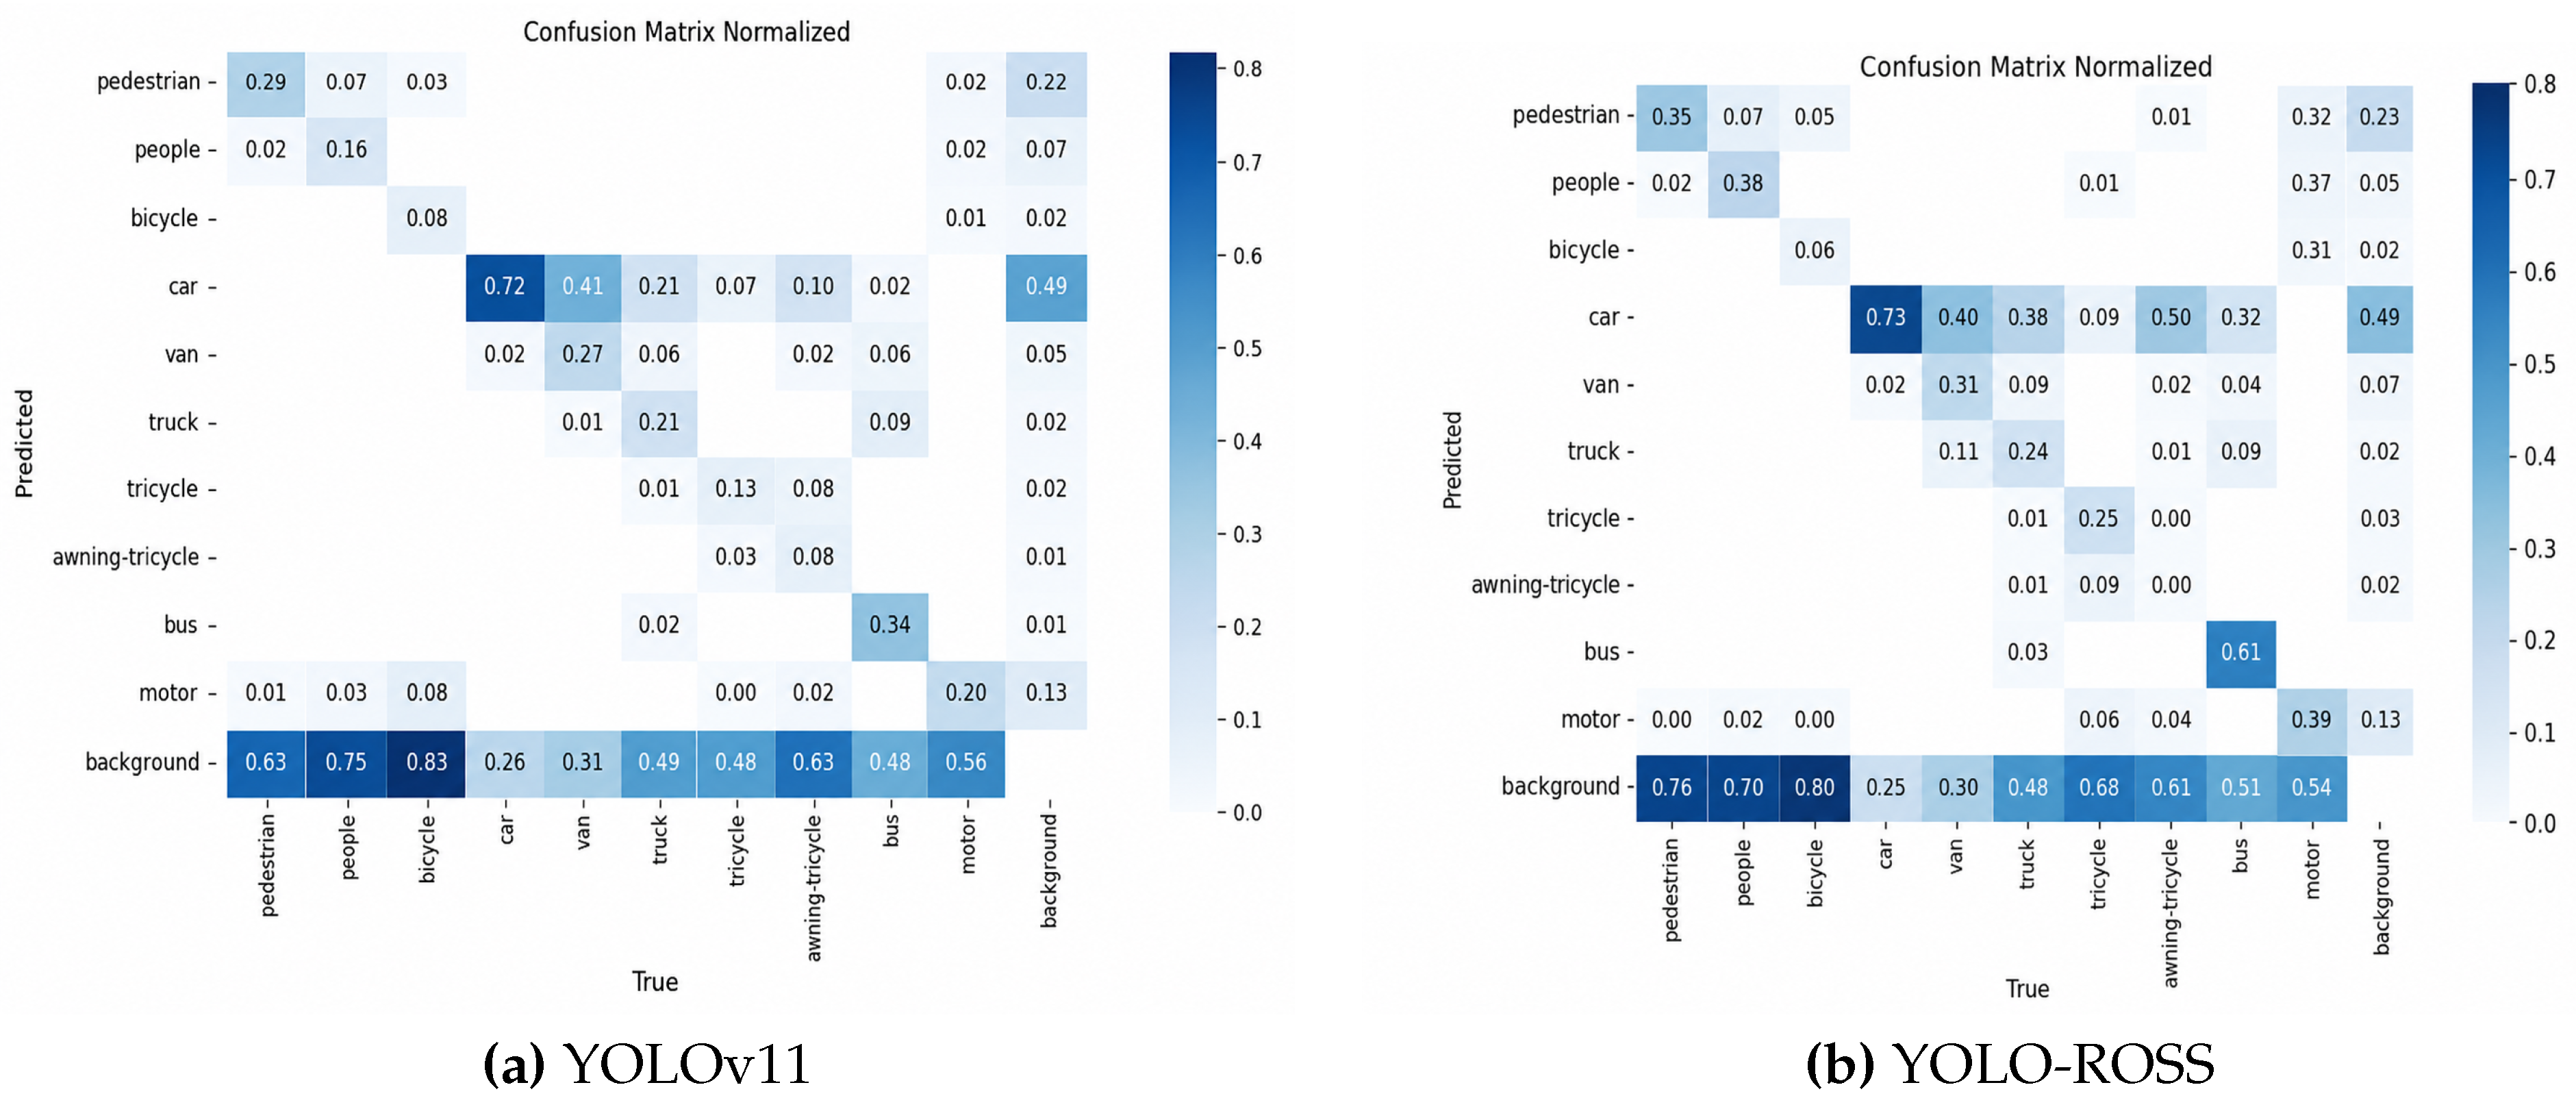
To evaluate robustness under controlled environmental and sensor-like perturbations, YOLOv11n and the proposed YOLO-ROSS were tested on the corruption benchmark derived from VisDrone2021. Their normalized confusion matrices are presented together in Figure 8 for comparison.
The normalized confusion matrices in Figure 8 show consistent, although generally modest, improvements for YOLO-ROSS across the evaluated categories. The diagonal value increases from 0.29 to 0.33 for pedestrian and from 0.16 to 0.18 for people. For vehicle categories, it rises from 0.72 to 0.73 for car, from 0.27 to 0.31 for van, from 0.21 to 0.24 for truck, and from 0.34 to 0.41 for bus. Improvements are also observed for bicycle (0.06 to 0.08), motor (0.28 to 0.30), tricycle (0.13 to 0.16), and awning-tricycle (0.08 to 0.09). In parallel, the proportion of instances classified as background decreases from 0.68 to 0.65 for pedestrian, from 0.75 to 0.73 for people, from 0.26 to 0.25 for car, from 0.31 to 0.28 for van, from 0.49 to 0.48 for truck, from 0.48 to 0.41 for bus, and from 0.66 to 0.64 for motor. These results indicate improved category discrimination and reduced background confusion on the evaluated UAV imagery.

4.2. F1–Confidence and Operating-Point Analysis

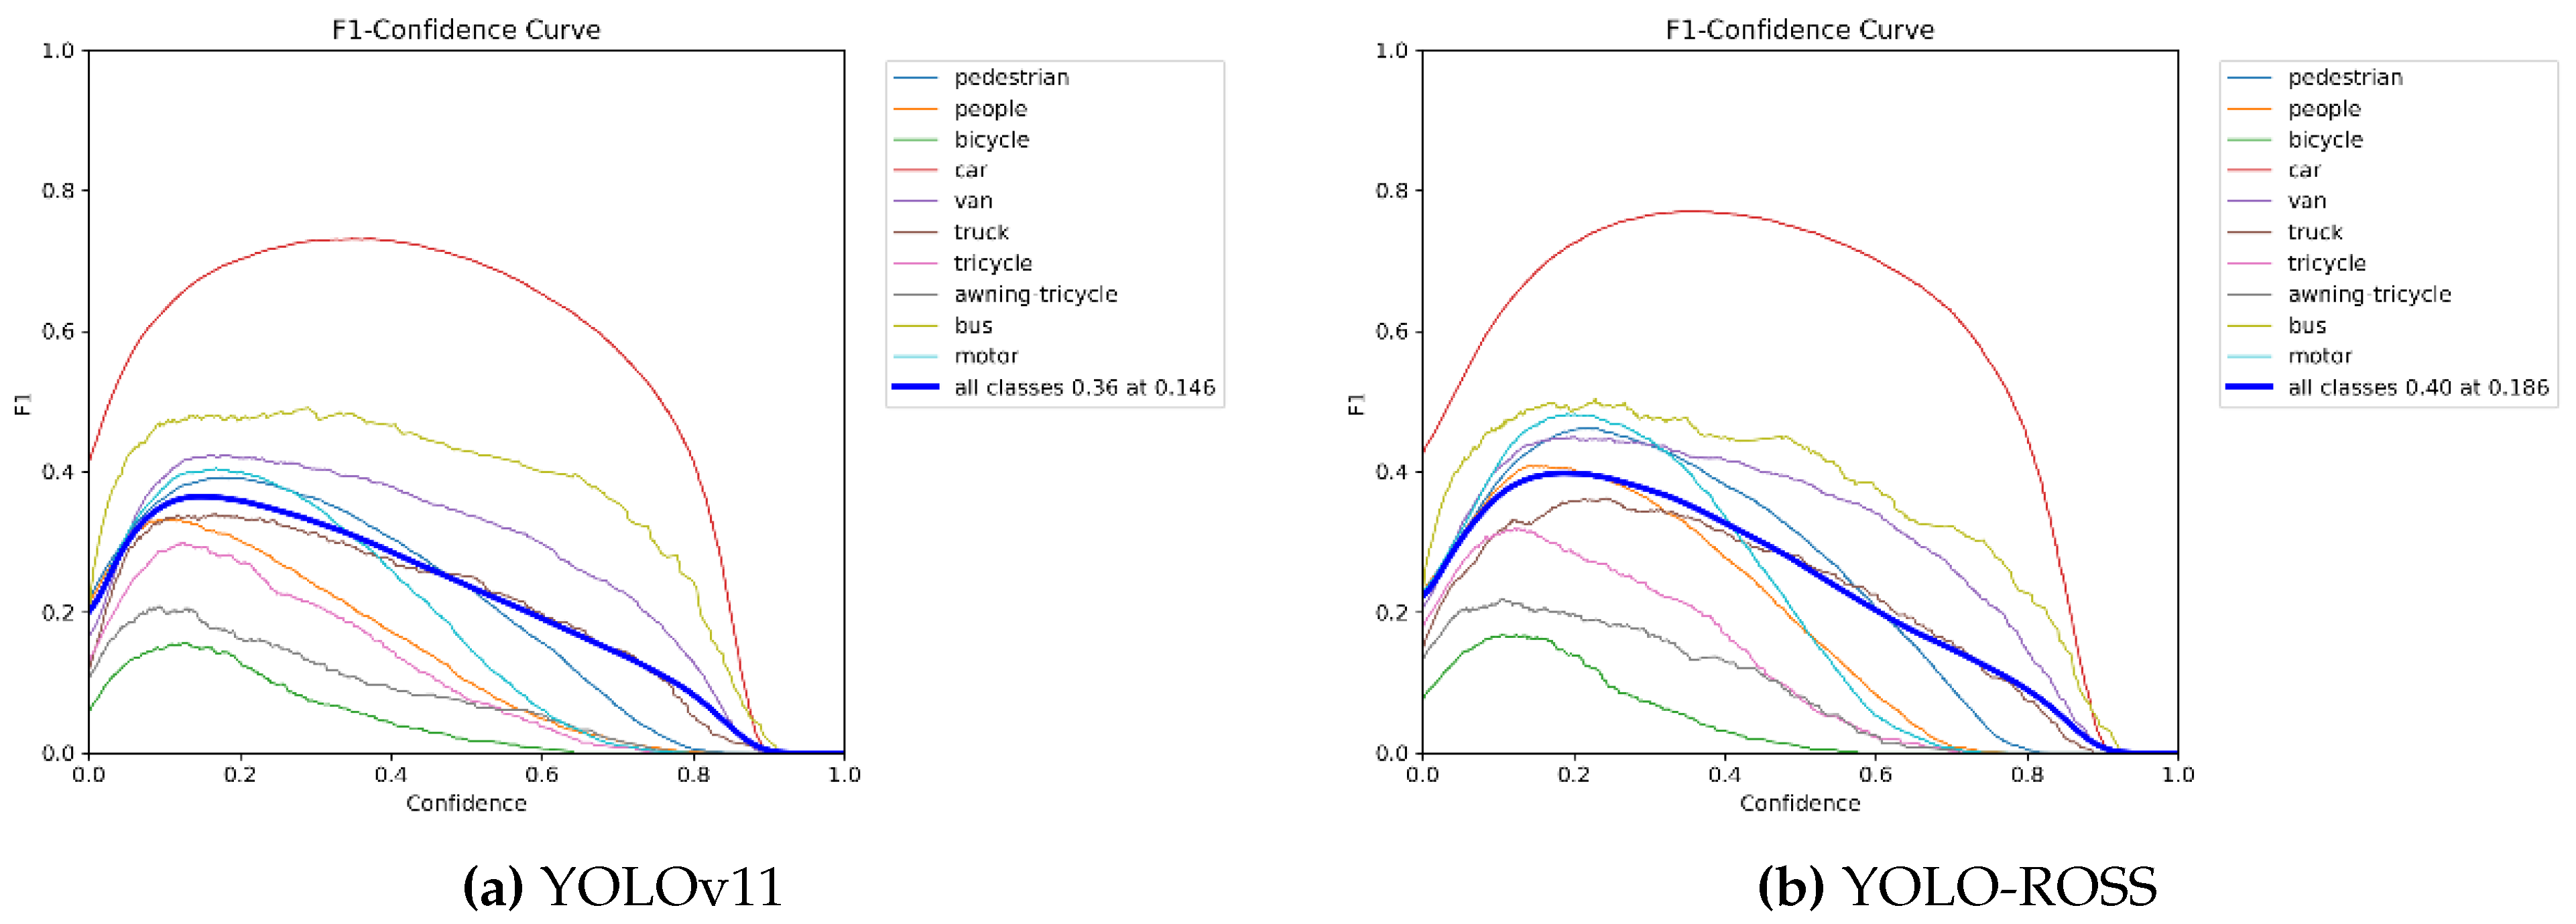
Figure 9 reports class-wise and all-class F1 as the confidence threshold varies. The plotted legends show that the YOLOv11 all-class peak is approximately 0.36 at a threshold of 0.146, whereas YOLO-ROSS reaches approximately 0.40 at 0.186. The result is therefore an approximate 0.04 increase in peak F1 together with a 0.040 shift in the maximizing threshold.
Table 2 summarizes the approximate class-wise maxima read from the plotted curves (rounded to two decimals). YOLO-ROSS improves or retains the peak F1 for all ten classes, with the most visible gains for pedestrian, people, and motor; bicycle and awning-tricycle remain difficult for both detectors.
Table 2. Approximate class-wise peak F1 values read from Figure 9 (rounded to two decimals).
ModelPedestrianPeopleBicycleCarVanTruckTricycleAwning-TricycleBusMotorAll
YOLOv110.390.330.160.730.420.340.300.210.490.400.36
YOLO-ROSS0.460.410.170.770.450.360.320.220.500.480.40
At the fixed evaluation operating point used in Table 5, precision/recall changes from 0.379/0.285 for YOLOv11 to 0.412/0.318 for YOLO-ROSS; the corresponding harmonic means are 0.325 and 0.359. The detector therefore gains both precision and recall at that point, rather than trading one entirely for the other. Nevertheless, the threshold shift indicates that the models are not identically calibrated. Deployment thresholds should be selected on a mission-representative validation set: higher thresholds reduce false alarms at the expense of missed targets, whereas lower thresholds favor recall but increase review or tracking load. The F1–confidence curves alone do not establish the cause of this shift; causal calibration analysis requires the underlying prediction traces and remains future work.

4.3. Comparative Experiments

To broaden the architectural and task-specific coverage of the comparison, eight detectors were evaluated on the same ten VisDrone test subsets and on the SODA-D-Robustness mixed-corruption direct-transfer target. The baselines include YOLOv11n, YOLOv10n, and YOLOv8n; Faster R-CNN-R50-FPN [33] as a two-stage CNN detector; Deformable DETR-R50 [20] and RT-DETR-R18 [21] as Transformer-based detectors; and TPH-YOLOv5 [7] as a detector specifically designed for small objects in drone-captured scenes. All detectors were trained on the same VisDrone training split and evaluated at 640 × 640 resolution. Architecture-specific optimization settings are listed in Table 1. Each detector was trained eight times with seeds 0–7. The ten VisDrone rows use the original class taxonomy, whereas the SODA-D-Robustness row uses the four-class harmonization defined in Section 3.1, with no target-domain fine-tuning.
Table 3 summarizes the performance of YOLO-ROSS and seven representative detectors over eight independent training runs. YOLO-ROSS achieved the highest mean mAP@0.5 in each VisDrone condition. On the Original subset, it reached 0.373 ± 0.0017, slightly above TPH-YOLOv5 (0.368 ± 0.0016) and RT-DETR-R18 (0.365 ± 0.0018), showing that the robustness-oriented modifications did not reduce performance on uncorrupted images. The distinction became clearer when degradations were combined: on the mixed-corruption subset, YOLO-ROSS achieved 0.309 ± 0.0023, whereas the best competing result was 0.283 ± 0.0024 from RT-DETR-R18. Thus, the margin over the strongest baseline increased from 0.005 on Original to 0.026 under mixed corruption, highlighting the benefit of the proposed design in the more demanding evaluation setting.
Table 3. Comparative mAP@0.5 results for general and UAV-specific detectors on the VisDrone corruption benchmark and the direct SODA-D-Robustness mixed-corruption test (mean ± standard deviation over eight independent VisDrone training runs).
YOLOv11nYOLOv10nYOLOv8n [34]Faster R-CNN [33]Deformable DETR [20]RT-DETR-R18 [21]TPH-YOLOv5 [7]YOLO-ROSS
Brightness0.330 ± 0.00210.325 ± 0.00190.317 ± 0.00240.342 ± 0.00270.354 ± 0.00220.363 ± 0.00200.366 ± 0.00180.371 ± 0.0019
Fog0.318 ± 0.00250.310 ± 0.00230.295 ± 0.00270.329 ± 0.00280.343 ± 0.00240.354 ± 0.00220.358 ± 0.00210.365 ± 0.0020
Gaussian noise0.334 ± 0.00220.331 ± 0.00200.323 ± 0.00250.338 ± 0.00260.346 ± 0.00230.347 ± 0.00210.346 ± 0.00190.357 ± 0.0020
ISO noise0.287 ± 0.00270.281 ± 0.00250.279 ± 0.00280.279 ± 0.00290.276 ± 0.00260.274 ± 0.00240.287 ± 0.00230.306 ± 0.0024
Rain0.224 ± 0.00280.222 ± 0.00260.198 ± 0.00290.225 ± 0.00270.207 ± 0.00250.212 ± 0.00240.211 ± 0.00230.234 ± 0.0025
Shadow0.313 ± 0.00230.310 ± 0.00220.307 ± 0.00260.322 ± 0.00270.341 ± 0.00240.344 ± 0.00210.343 ± 0.00200.360 ± 0.0019
Snow0.174 ± 0.00290.171 ± 0.00280.168 ± 0.00290.179 ± 0.00280.184 ± 0.00270.187 ± 0.00250.191 ± 0.00260.200 ± 0.0027
Sunlight flare0.265 ± 0.00260.262 ± 0.00240.257 ± 0.00280.272 ± 0.00290.281 ± 0.00250.281 ± 0.00230.280 ± 0.00220.310 ± 0.0021
Original0.324 ± 0.00180.321 ± 0.00170.317 ± 0.00200.342 ± 0.00220.357 ± 0.00190.365 ± 0.00180.368 ± 0.00160.373 ± 0.0017
Mixed corruption0.267 ± 0.00280.262 ± 0.00270.258 ± 0.00290.276 ± 0.00280.280 ± 0.00260.283 ± 0.00240.281 ± 0.00250.309 ± 0.0023
SODA-D-Robustness0.270 ± 0.00210.263 ± 0.00180.261 ± 0.00180.274 ± 0.00200.277 ± 0.00240.271 ± 0.00230.284 ± 0.00160.312 ± 0.0024
Corruption-specific results provide further insight into this behavior. Relative to the strongest competing detector in each row, YOLO-ROSS improved mAP@0.5 by 0.005 under brightness variation, 0.007 under fog, 0.010 under Gaussian noise, 0.019 under ISO noise, 0.016 under shadow, and 0.029 under sunlight flare. Rain and snow were the most destructive conditions overall, reducing the absolute accuracy of every detector; even so, YOLO-ROSS remained ahead by 0.009 in both cases. The leading comparison model changed with the corruption type, including TPH-YOLOv5, RT-DETR-R18, and Faster R-CNN, while YOLO-ROSS maintained its advantage. This pattern indicates that the result is not tied to one particular baseline family or a single favorable corruption. Rather, it is consistent with improved preservation of small-object features under different forms of appearance degradation. The contribution of each architectural component is evaluated separately in the ablation study.
Cross-domain performance was assessed by applying the VisDrone-trained checkpoints directly to the SODA-D-Robustness mixed-corruption split. Without target-domain training, fine-tuning, or threshold recalibration, YOLO-ROSS obtained 0.312 ± 0.0024 mAP@0.5. TPH-YOLOv5 was the closest baseline at 0.284 ± 0.0016, while the remaining CNN- and Transformer-based detectors ranged from 0.261 to 0.277. The 0.028 advantage over the strongest baseline was considerably larger than the observed run-to-run variation (standard deviations of 0.0016–0.0024), supporting a stable improvement under the combined domain and corruption shift.
To further verify the effectiveness and robustness of the proposed method at different model scales, additional comparative experiments were conducted on the s and x variants. The corresponding results are reported in Table 4.
Table 4. Comparative analysis of models at different scales.
ConditionYOLOv11nYOLO-ROSS(n)YOLOv11sYOLO-ROSS(s)YOLOv11xYOLO-ROSS(x)
Brightness0.330.3710.3890.4250.4680.509
Fog0.3180.3650.3800.4190.4560.503
Gaussian noise0.3340.3570.3920.4140.4720.495
ISO noise0.2870.3060.3420.3630.4260.444
Rain0.2240.2340.2770.2880.3630.372
Shadow0.3130.3600.3690.4160.4490.498
Snow0.1740.2000.2330.2530.3090.338
Sunlight flare0.2650.3100.3190.3660.4030.448
Original0.3240.3730.3840.4280.4620.511
Mixed corruption0.2670.3090.3210.3650.4040.447
The scale comparison shows the expected accuracy–efficiency trade-off. YOLOv11n requires fewer computational resources and is therefore the most suitable baseline for resource-constrained deployment, but its robustness is limited under several challenging conditions. YOLOv11x provides stronger representation and higher robustness at the cost of substantially greater computation and lower throughput. Consequently, model scale should be selected according to the required balance among accuracy, latency, memory, and power rather than accuracy alone.

4.4. Ablation Experiments

To verify both the contribution of each complete module and the necessity of its internal design without fragmenting the ablation study, Table 5 expands the original M0–M5 chain with six diagnostic variants. FE1 and FE2 isolate G-CSA and M-WSA, FF1 and FF2 isolate AFPN and the P2 branch, and LA1 and LA2 test pure one-to-one and uncoupled dual assignment. All variants use the same dataset split, 640 × 640 input, training configuration, random seed, and evaluation protocol.
The unified table preserves the original module-level comparison while making the internal validation directly traceable to the same baseline and metrics. This avoids treating the design-level analysis as a separate experiment and keeps the M0–M5 identifiers consistent with the condition-wise and computational analyses.
Within feature extraction, FE1 and FE2 reach 0.269 and 0.271 mAP@0.5, whereas the complete C3k2_DTAB block (M1) reaches 0.273, supporting the complementary roles of G-CSA and M-WSA. For feature fusion, FF1 reaches 0.282, while FF2 and M2 both reach 0.285 mAP@0.5; M2 additionally improves mAP@0.5:0.95, precision, and recall to 0.167, 0.401, and 0.298. The value 0.285 for M2 is the confirmed result from the condition-wise evaluation log and replaces the former transcription 0.290.
Table 5. Unified module- and design-level ablation results on the mixed-corruption test subset (single seed-0 diagnostic run).
VariantFeature ExtractionFeature FusionLabel Assignment/InferencemAP@0.5mAP@0.5:0.95PrecisionRecall
M0C3k2Baseline neckO2M + NMS0.2670.1490.3790.285
FE1G-CSA onlyBaseline neckO2M + NMS0.2690.1510.3820.285
FE2M-WSA onlyBaseline neckO2M + NMS0.2710.1530.3840.286
M1C3k2_DTABBaseline neckO2M + NMS0.2730.1550.3870.287
FF1C3k2AFPN without P2O2M + NMS0.2820.1610.3950.293
FF2C3k2P2 + conventional fusionO2M + NMS0.2850.1640.3980.295
M2C3k2AFPN-P2O2M + NMS0.2850.1670.4010.298
LA1C3k2Baseline neckO2O only0.2620.1460.3940.268
LA2C3k2Baseline neckUncoupled dual, NMS-free0.2700.1520.3850.289
M3C3k2Baseline neckYOLOv10-style dual, NMS-free0.2740.1560.3890.292
M4C3k2_DTABAFPN-P2O2M + NMS0.3040.1790.4080.315
M5C3k2_DTABAFPN-P2YOLOv10-style dual, NMS-free0.3090.1830.4120.318
Note: FE, FF, and LA denote feature extraction, feature fusion, and label assignment, respectively; O2M and O2O denote one-to-many and one-to-one assignment. All entries in this table are seed-0 diagnostic results. M0–M5 retain the same architectural definitions used in Table 6 and Table 7, whereas FE1–FE2, FF1–FF2, and LA1–LA2 are internal design-diagnostic variants.
The label-assignment variants evaluate an adopted deployment component rather than a new matching rule. O2O-only training (LA1) raises precision to 0.394 but lowers recall to 0.268. The YOLOv10-style dual head (M3) reaches 0.274 mAP@0.5 and 0.292 recall while permitting NMS-free inference. With the proposed C3k2_DTAB and AFPN-P2 modules fixed, replacing O2M + NMS (M4) with the dual head (M5) changes mAP@0.5 from 0.304 to 0.309. This ablation quantifies the deployment contribution of the adopted head but is not used to claim a distinct label-assignment algorithm.
To evaluate whether the principal ablation chain remains robust across interference types, the six original configurations M0–M5 were further tested under brightness variation, fog, Gaussian noise, ISO noise, rain, shadow, snow, sunlight flare, mixed-corruption, and the unmodified Original control condition. The diagnostic FE, FF, and LA variants are used only to validate internal design choices in Table 5; the corresponding M0–M5 results are reported in Table 6.
Table 6. Module-level ablation results under different interference conditions (single seed-0 diagnostic run).
ConditionYOLOv11nM1M2M3M4M5
Brightness0.3300.3190.3300.3170.3610.371
Fog0.3180.3230.3380.3250.3650.372
Gaussian noise0.3340.3210.3340.3230.3570.361
ISO noise0.2870.2780.2870.2780.3060.309
Rain0.2240.2300.2340.2200.2340.238
Shadow0.3130.3180.3330.3200.3600.365
Snow0.1740.1830.1950.1810.1900.220
Sunlight flare0.2650.2690.2830.2760.3100.312
Original0.3240.3290.3450.3330.3710.373
Mixed corruption0.2670.2730.2850.2740.3040.309
Note: All entries are from the same single seed-0 run and are reported for architectural diagnosis. M0 and M5 denote the YOLOv11n and YOLO-ROSS architectures, respectively. Table 3, rather than this table, reports the eight-run mean and standard deviation used for uncertainty-aware model comparison.
Table 6 is intentionally separated from the eight-run comparison in Table 3. Within this seed-0 diagnostic run, M0 and M5 are architecturally identical to YOLOv11n and YOLO-ROSS, respectively, but their entries are single-run observations rather than eight-run means. The internally controlled comparison shows a counter-intuitive pattern: relative to M0, M1 decreases from 0.334 to 0.321 under Gaussian noise and from 0.287 to 0.278 under ISO noise, while M3 decreases to 0.323 and 0.278. This pattern motivates a mechanistic interaction analysis; it is not presented as a statistically significant condition-level effect.
Mechanistically, Gaussian and ISO noise introduce dense high-frequency responses that compete with the sparse edges of tiny objects. In M1, channel and window reweighting is applied before the baseline neck has a high-resolution alignment path; the attention block can therefore assign context to corruption-dominated responses even though the center mask prevents direct self-copying. In M3, rank-consistent dual assignment changes supervision and removes NMS, but it cannot restore geometry that has already been attenuated by the P3–P5 pathway. AFPN-P2 supplies the missing complement: its stride-4 branch retains fine localization cues, and progressive normalized fusion requires a shallow response to agree with deeper semantic evidence before it dominates the fused representation. Consistent with this proposed mechanism, the combined M4 reverses the isolated seed-0 losses and reaches 0.357 under Gaussian noise and 0.306 under ISO noise; M5 further reaches 0.361 and 0.309. Thus, the controlled ablation pattern is compatible with functional dependence between the modules rather than with either module being independently noise robust.
The same seed-0 run provides an internally controlled interaction diagnostic on mixed corruption. C3k2_DTAB alone adds 0.273 0.267 = 0.006 , and AFPN-P2 alone adds 0.285 0.267 = 0.018 , so the sum of isolated gains is 0.024. Their joint M4 configuration adds 0.304 0.267 = 0.037 , and hence 0.037 > 0.024 with a positive interaction residual of 0.013. This super-additive pattern is consistent with the co-designed pathway: corruption-aware contextual extraction becomes most useful when the P2 branch preserves the spatial evidence to which that context is attached, while progressive fusion prevents high-resolution noise from being passed unfiltered. The adopted dual-assignment head then increases M4 from 0.304 to 0.309 without changing this architectural interpretation. Because Table 6 is single-seed, the interaction is treated as mechanistic diagnostic evidence rather than a population-level significance estimate.
Within the reported seed-0 ablation chain, M5 has the highest value in all ten conditions, reaching 0.309 mAP@0.5 on mixed corruption versus 0.267 for M0 and 0.373 on Original images versus 0.324 for M0. These condition-wise values are descriptive and are not used to claim statistical significance. The principal uncertainty-aware comparison remains Table 3, where the complete YOLO-ROSS model is evaluated over eight independent runs.

4.5. Computational Cost and Deployment Efficiency

To evaluate deployment efficiency, parameters, floating-point operations (FLOPs), and inference speed were measured for all comparison models, including the UAV-specific TPH-YOLOv5, all scale variants, and all ablation variants. Parameters and FLOPs were calculated from the inference graph at 640 × 640 resolution. FPS was measured on the RTX 4090 platform in Table 1 using PyTorch 1.12.1, CUDA 11.4, FP32 precision, and batch size 1. After 200 warm-up iterations, inference time was measured over 1000 images with GPU synchronization. Model inference and required post-processing were included, whereas image decoding and disk I/O were excluded.
Table 7 shows the deployment trade-off more clearly. The specialized TPH-YOLOv5 baseline provides competitive small-object accuracy but is substantially heavier than YOLO-ROSS under the reported computational profile. YOLO-ROSS(n) retains 4.83 M parameters, 15.7 GFLOPs, and 207 FPS, while its C3k2_DTAB and AFPN-P2 modules improve corruption robustness at a measurable cost relative to YOLOv11n. AFPN-P2 accounts for the largest share of the added computation, whereas NMS-free inference recovers part of the throughput by removing post-processing.
Table 7. Computational cost and inference efficiency of all comparison and ablation models.
GroupModel/variantParameters (M)FLOPs (G)FPS
ComparisonYOLOv11n2.586.5286
ComparisonYOLOv10n2.306.7302
ComparisonYOLOv8n3.168.7263
ComparisonFaster R-CNN-R50-FPN41.35180.034
ComparisonDeformable DETR-R5039.83173.226
ComparisonRT-DETR-R1820.0060.0118
ComparisonYOLO-ROSS(n)4.8315.7207
ComparisonTPH-YOLOv547.90157.235.5
ScaleYOLOv11s9.4321.5166
ScaleYOLO-ROSS(s)12.3134.8132
ScaleYOLOv11x56.91194.958
ScaleYOLO-ROSS(x)66.74236.846
AblationM0 (YOLOv11n)2.586.5286
AblationM1 (C3k2_DTAB)3.128.1247
AblationM2 (AFPN-P2)4.2813.8219
AblationM3 (NMS-free)2.626.6305
AblationM4 (DTAB + AFPN-P2)4.7915.5194
AblationM5 (full YOLO-ROSS)4.8315.7207
Relative to YOLOv11n, the full YOLO-ROSS increases the parameter count by 2.25 M (87.2%) and the computational load by 9.2 GFLOPs (141.5%), while throughput decreases from 286 to 207 FPS (a 27.6% reduction). Module-wise, C3k2_DTAB adds 0.54 M parameters and 1.6 GFLOPs, whereas AFPN-P2 adds 1.70 M parameters and 7.3 GFLOPs and therefore dominates the added cost. This is expected because the P2 feature map doubles both spatial dimensions relative to P3 and contains approximately four times as many spatial locations. By contrast, the NMS-free branch adds only 0.04 M parameters and 0.1 GFLOPs and increases end-to-end throughput from 286 to 305 FPS when used alone. It also increases the throughput of the combined model from 194 FPS (M4) to 207 FPS (M5) by eliminating NMS. These measurements quantify the trade-off: AFPN-P2 provides the largest accuracy gain and the largest computational increase, while NMS-free inference partially offsets the latency penalty.
The scale comparison further illustrates the expected accuracy–efficiency trade-off: the n-scale configuration is the most suitable proposed variant for resource-constrained deployment, whereas the s- and x-scale configurations require progressively greater computation. Because the reported FPS was measured on a desktop RTX 4090 GPU, the absolute throughput should not be directly extrapolated to an embedded UAV processor. The controlled same-platform result nevertheless provides two useful relative indicators: YOLO-ROSS(n) retains 207 / 286 = 72.4 % of the YOLOv11n throughput, and removing NMS increases the combined M4 configuration from 194 to 207 FPS, a 6.7% gain. These ratios describe the tested PyTorch/CUDA implementation, not guaranteed Jetson throughput.
On an onboard platform such as Jetson AGX Orin or Orin NX, the P2 activation map and the availability of optimized kernels for grouped attention are expected to have a larger latency and memory effect than the parameter count alone suggests. The 4.83 M weights correspond to approximately 19.3 MB in FP32, 9.7 MB in FP16, or 4.8 MB in INT8, excluding activations and runtime workspace; AFPN-P2 is expected to dominate activation memory because its stride-4 map has four times the spatial locations of P3. Conversely, the NMS-free head removes CPU/GPU post-processing and should remain advantageous in dense scenes if the backend fuses the required operators. A defensible deployment claim therefore requires TensorRT FP16/INT8 profiling of end-to-end latency, peak memory, and energy per frame on the target board. We report the RTX 4090 numbers as controlled comparative throughput and reserve absolute onboard real-time claims until that device-specific evaluation is completed.

4.6. Visualization Analysis

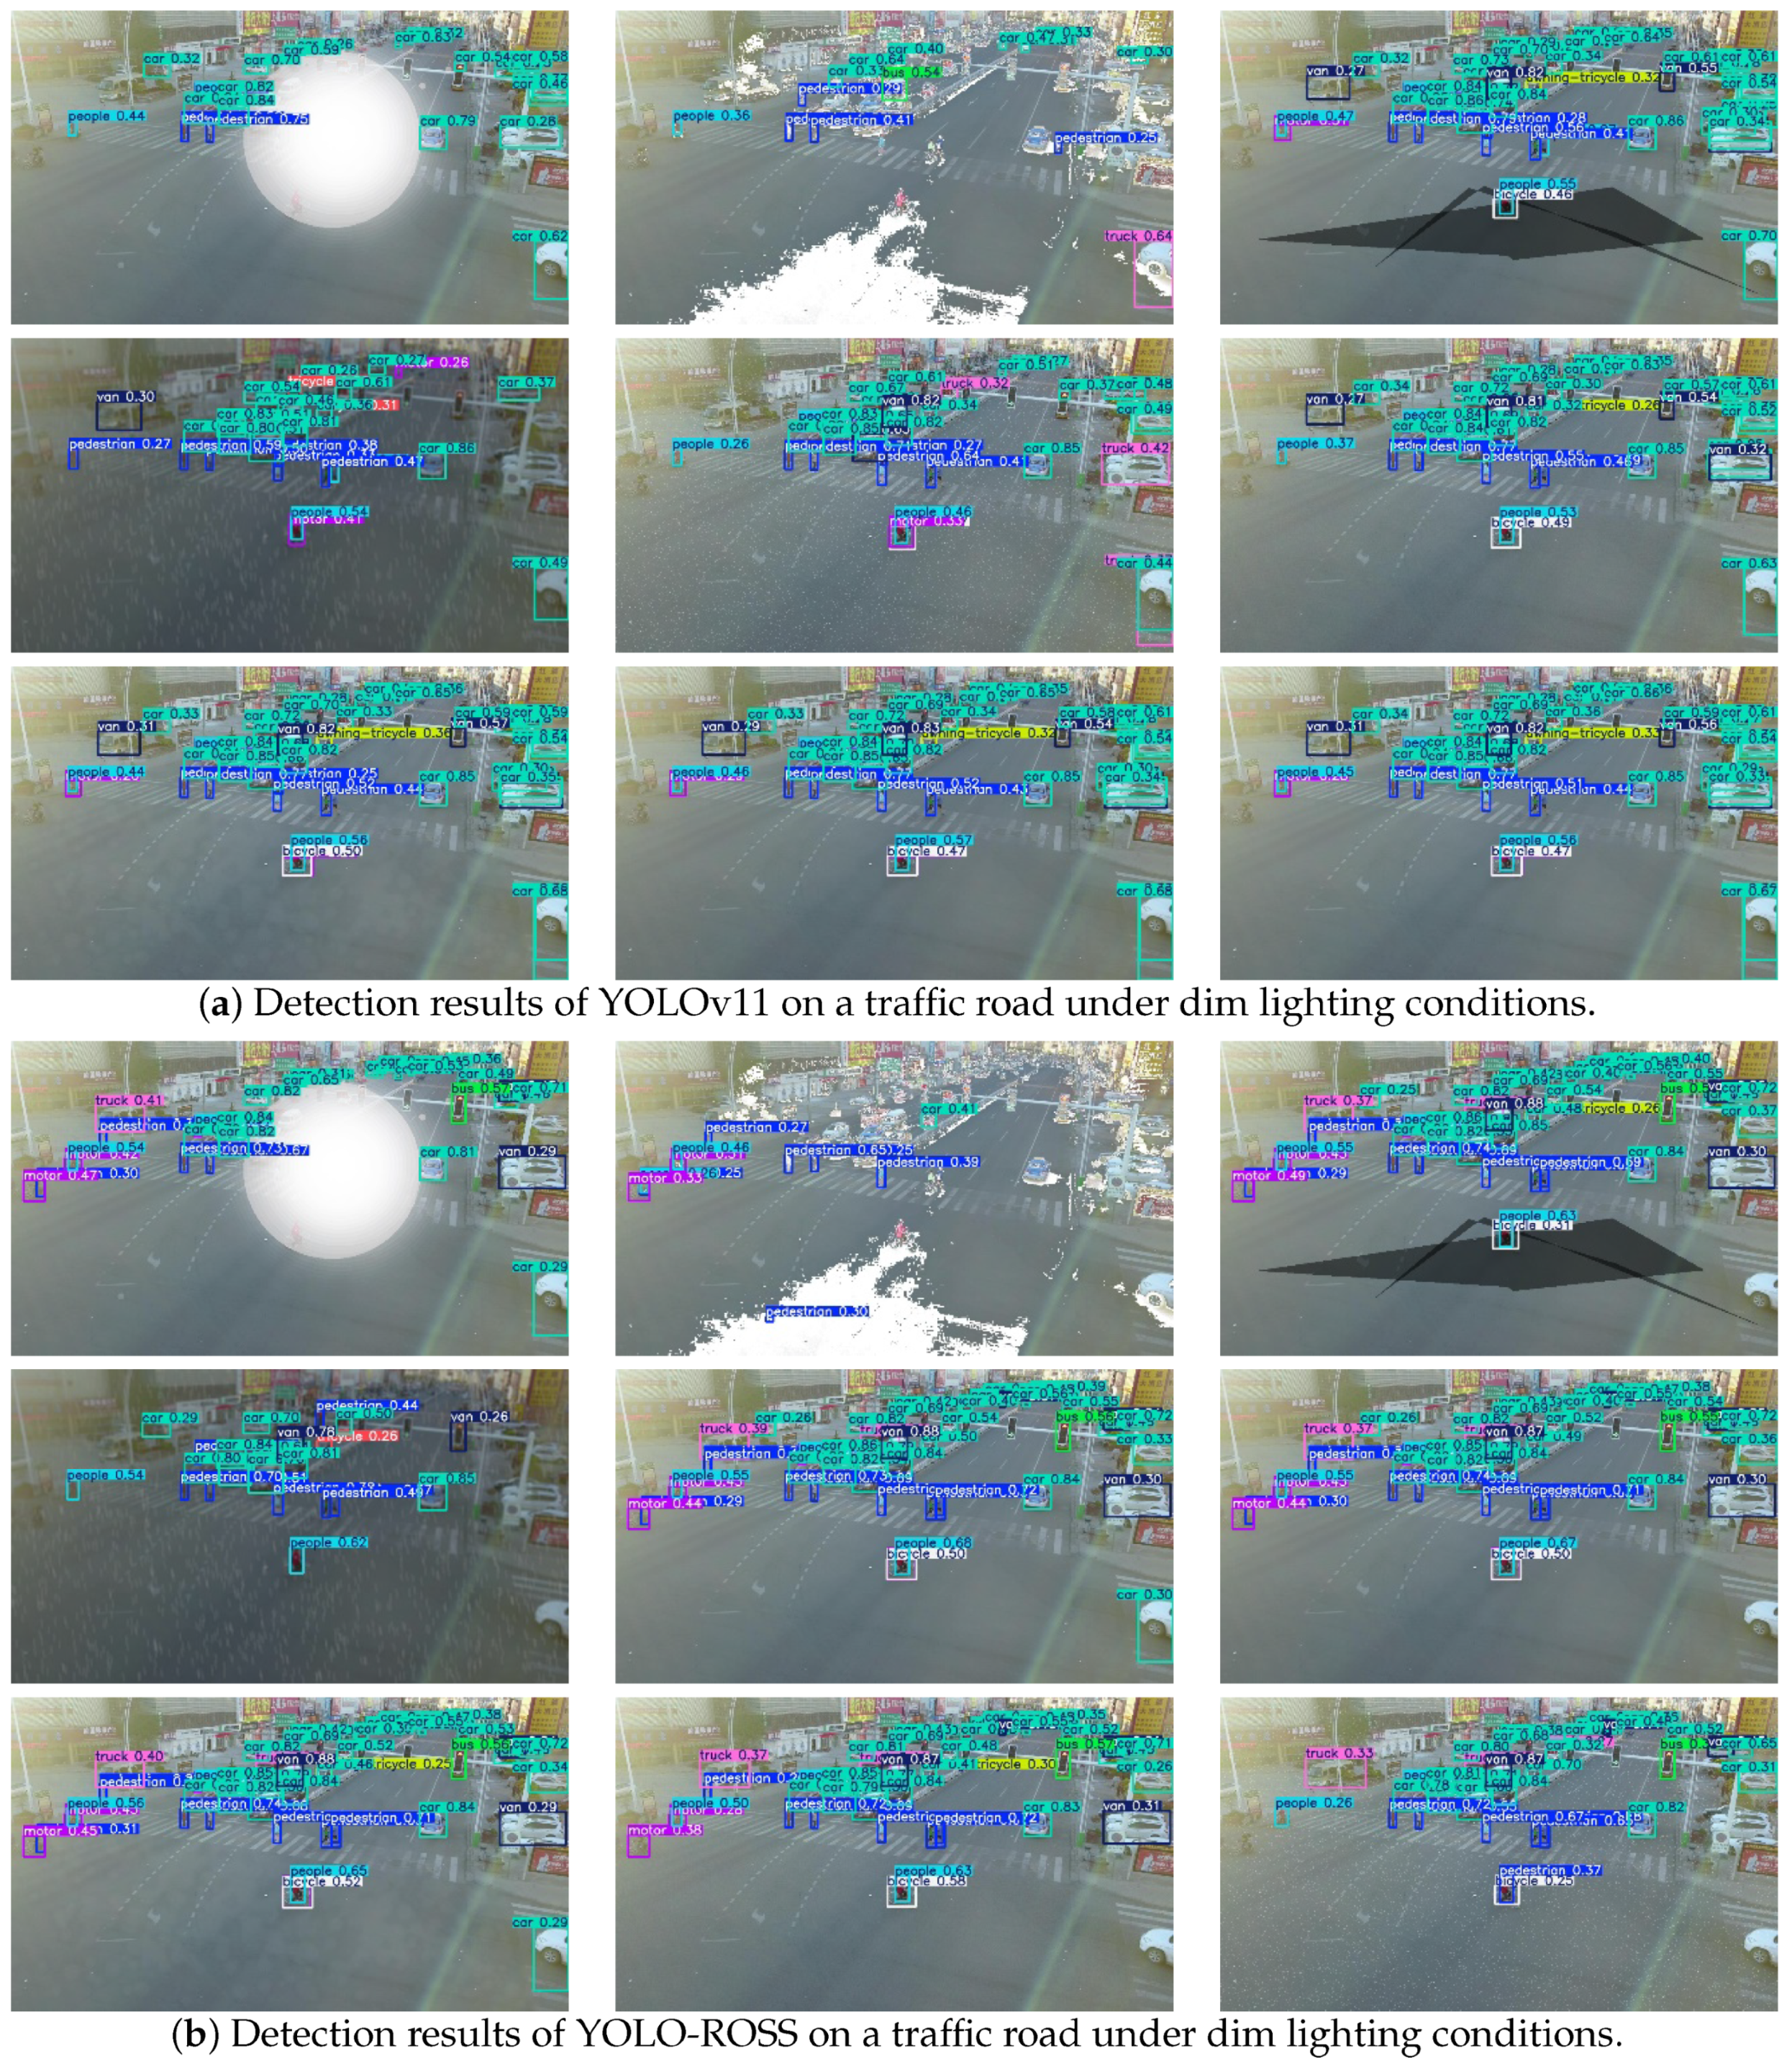
To further illustrate the detection performance of the model under different types of interference, visual comparisons were conducted.
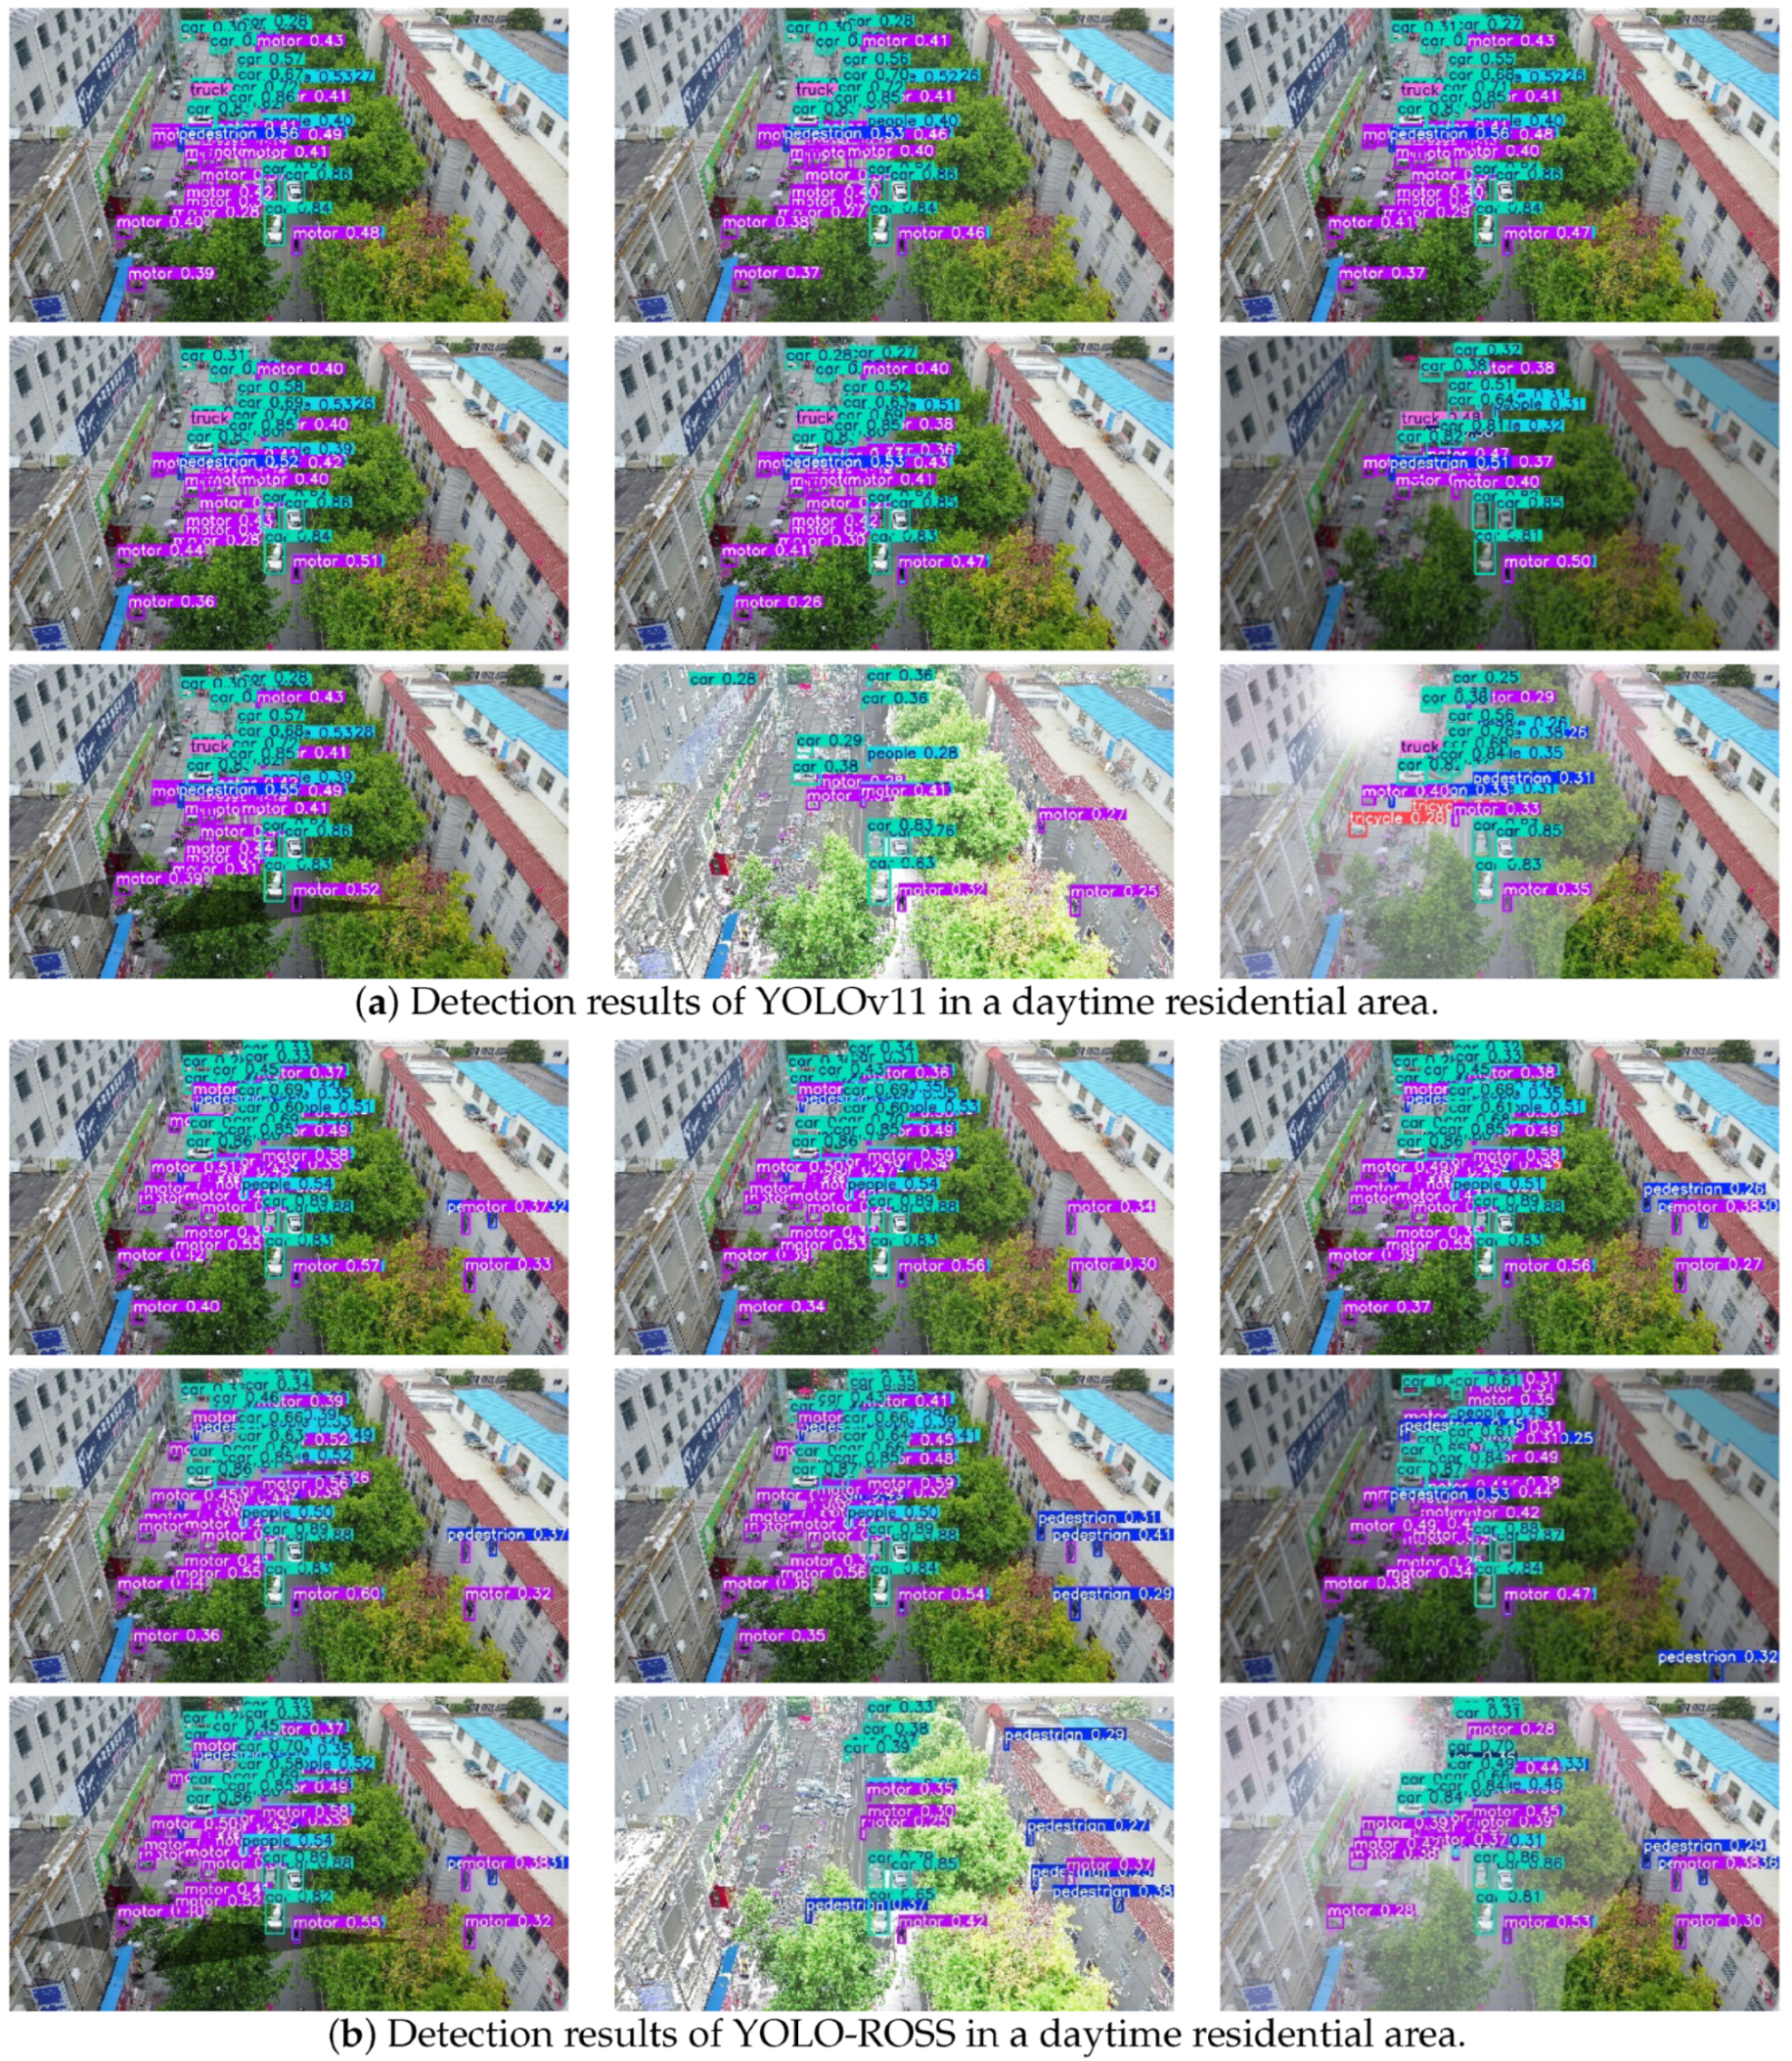
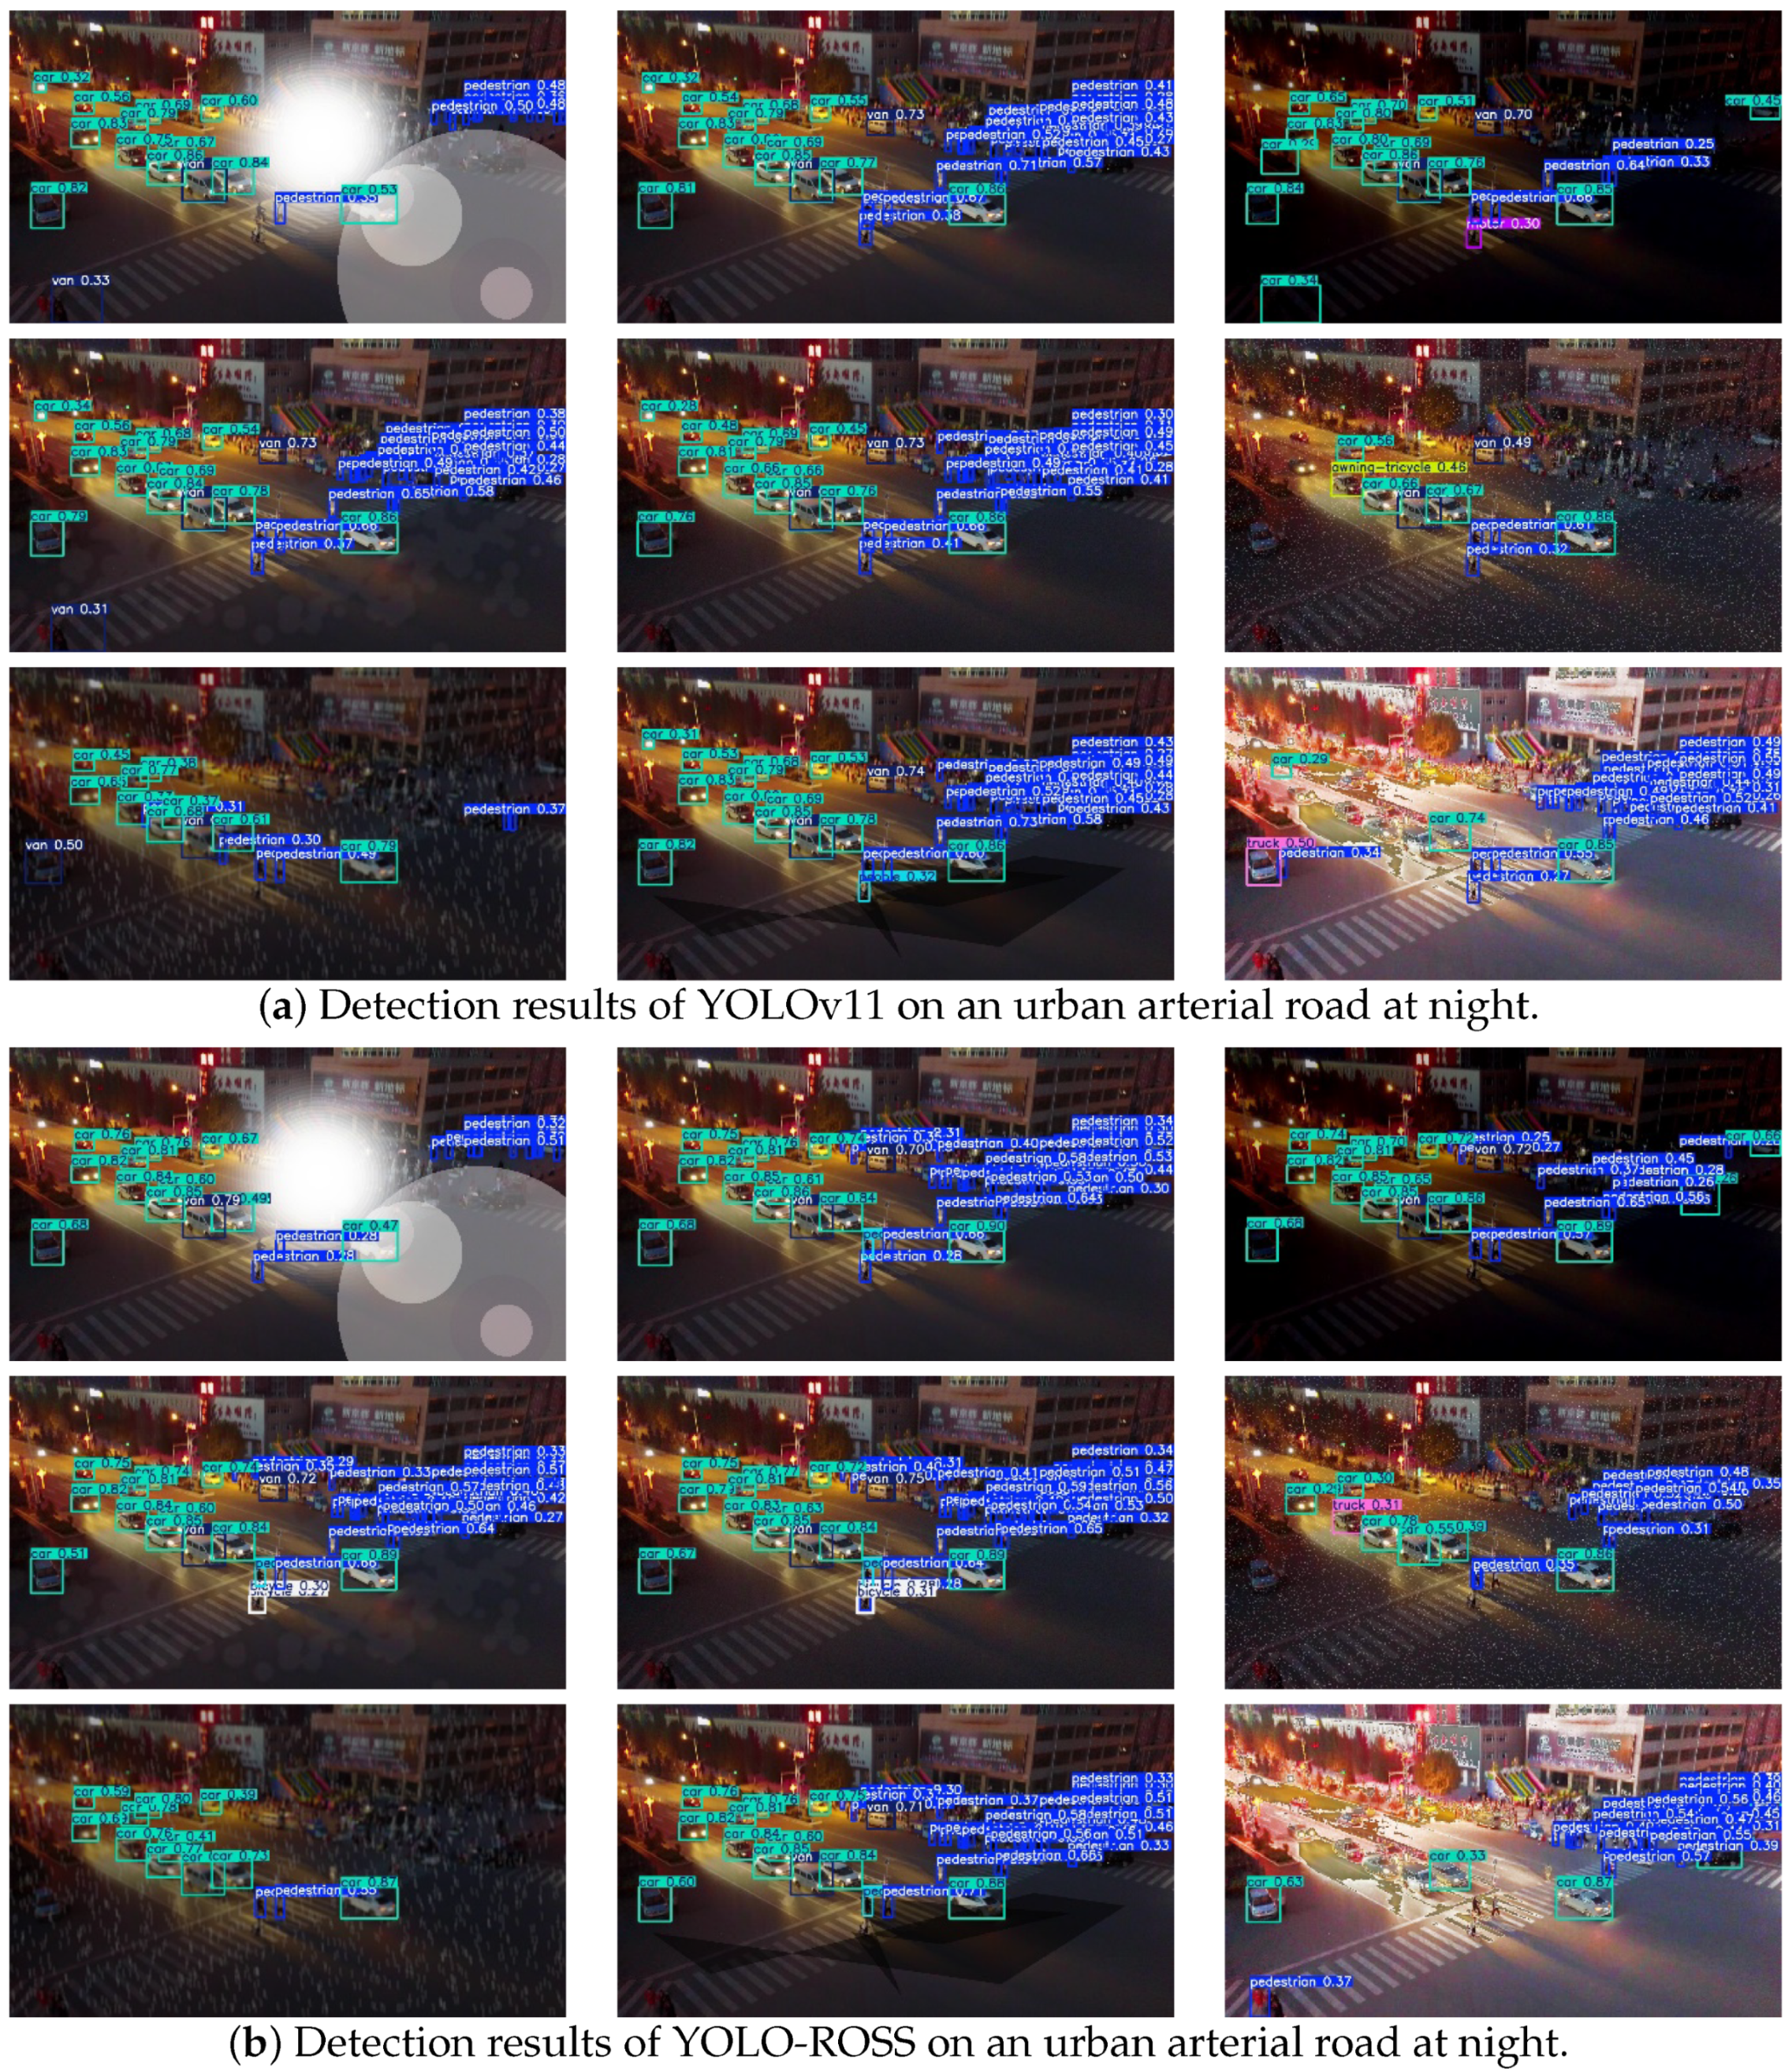
In this study, three representative images were selected and compared with their corresponding versions under eight different interference conditions, together with the original images. YOLOv11 and the proposed model were then applied to each group of nine images for detection, as shown in Figure 10, Figure 11 and Figure 12.
The proposed YOLO-ROSS demonstrates clear advantages under various interference conditions. The three image groups represent a target-dense scene under normal illumination, a scene with uneven target distribution under dim background conditions, and a nighttime scene with non-uniform lighting. As shown in the visual comparison results, YOLO-ROSS not only detects more small objects under different interference conditions, but also effectively reduces false detections and missed detections. These results indicate that the proposed model exhibits stronger robustness against complex environmental interference.
Within the evaluated visible-light corruption subsets, YOLO-ROSS detects more small objects and reduces false detections or missed detections in several low-contrast and cluttered examples. These visualizations support the quantitative within-domain corruption results; however, they are qualitative examples from the same VisDrone source domain and do not by themselves demonstrate robustness to real adverse weather or unseen sensors.
A major limitation is that both robustness benchmarks rely on synthetic appearance transformations. SODA-D-Robustness adds a substantial change in viewpoint, scene structure, location, sensor platform, and label taxonomy, but its adverse conditions are still generated from a single RGB driving dataset and evaluated through four harmonized meta-classes. It therefore does not cover independent UAV datasets with matched taxonomies; real rain, fog, or snow; sensor aging; or modality changes to infrared and SAR. Consequently, the paper claims improved robustness only for the specified controlled perturbations and reports preliminary evidence under a joint cross-dataset-and-corruption shift. Future work will evaluate multiple independent UAV datasets, collect real adverse-weather sequences, and extend the study to infrared/SAR sources. Modality-specific strategies, including sea-land priors such as SLA-Net [10] and handcrafted Laplacian or ELBP feature guidance, will be tested empirically rather than assumed to transfer directly.


5. Conclusions

This paper presents YOLO-ROSS for UAV RGB small-object detection under controlled appearance corruption. The proposed C3k2_DTAB block reconstructs masked-window and grouped-channel attention inside a lightweight backbone to preserve weak local evidence while adding contextual support. The proposed AFPN-P2 neck retains high-resolution geometry and progressively aligns shallow detail with deep semantics. An established YOLOv10-style dual-assignment head is adopted for NMS-free inference; it is not claimed as a new assignment algorithm.
Across eight runs, YOLO-ROSS obtains 0.309 mean mAP@0.5 on mixed corruption, compared with 0.267 for YOLOv11n and 0.373 versus 0.324 on Original images. The larger clean-image gain (0.049 versus 0.042) and the close mixed/Original retention ratios (0.828 versus 0.824) show that the model’s main advantage is improved detection accuracy that persists under corruption, while the reduction in normalized corruption sensitivity is modest. The corrected F1 analysis reports peaks of approximately 0.40 for YOLO-ROSS and 0.36 for YOLOv11, with optimal thresholds of 0.186 and 0.146; mission-specific threshold validation is therefore still required.
The conclusions are limited to the specified synthetic RGB transformations and the four-meta-class SODA-D direct-transfer protocol. They do not establish broad real-weather, multi-dataset, infrared, or SAR robustness. Future work will retain raw prediction traces for precision–recall and calibration analysis and will evaluate independent UAV datasets, real adverse-weather sequences, and additional sensing modalities.

Author Contributions

Conceptualization, Y.Z.; methodology, Y.Z.; software, Y.Z.; validation, Y.S. and X.Z.; formal analysis, X.Z.; investigation, Y.S.; resources, J.J.; data curation, Y.Z.; writing—original draft preparation, Y.Z.; writing—review and editing, Y.Z.; visualization, Y.Z.; supervision, X.Z.; project administration, J.J.; funding acquisition, J.J. All authors have read and agreed to the published version of the manuscript.

Funding

This research was funded by the Industry-Sponsored Project of Anqing Normal University (No. H20250128), “Design and Development of BMS (Battery Management System)”, and the Industry–University–Research Cooperation Project of Anhui Province (No. 2025AHGXZK60296). The APC was funded by Nanjing University of Information Science and Technology.

Institutional Review Board Statement

Not applicable.

Informed Consent Statement

Not applicable.

Data Availability Statement

VisDrone2021 and SODA-D are publicly available from their official project pages. The corruption-generation seed, transformation settings, label-harmonization rule, model hyperparameters, and evaluation protocol are specified in the manuscript. The implementation, configuration files, and evaluation scripts will be released in a public repository upon publication; an anonymous repository can be provided during review if permitted by the editorial system.

Conflicts of Interest

The authors declare no conflicts of interest.

References

  1. Motlagh, N.H.; Taleb, T.; Arouk, O. Low-altitude unmanned aerial vehicles-based Internet of Things services: Comprehensive survey and future perspectives. IEEE Internet Things J. 2016, 3, 899–922. [Google Scholar] [CrossRef] [Scilit]
  2. Song, Y.; Lu, Y. A review of unmanned visual target detection in adverse weather. Electronics 2025, 14, 2582. [Google Scholar] [CrossRef] [Scilit]
  3. Sieberth, T.; Wackrow, R.; Chandler, J.H. Automatic detection of blurred images in UAV image sets. ISPRS J. Photogramm. Remote Sens. 2016, 122, 1–16. [Google Scholar] [CrossRef] [Scilit]
  4. Yao, H.; Qin, R.; Chen, X. Unmanned aerial vehicle for remote sensing applications—A review. Remote Sens. 2019, 11, 1443. [Google Scholar] [CrossRef] [Scilit]
  5. Wan, J.; Zhang, B.; Zhao, Y.; Du, Y.; Tong, Z. VistrongerDet: Stronger visual information for object detection in VisDrone images. In Proceedings of the IEEE/CVF International Conference on Computer Vision Workshops, Montreal, QC, Canada, 11–17 October 2021; pp. 2820–2829. [Google Scholar]
  6. Yang, C.; Huang, Z.; Wang, N. QueryDet: Cascaded sparse query for accelerating high-resolution small object detection. In Proceedings of the IEEE/CVF Conference on Computer Vision and Pattern Recognition, New Orleans, LA, USA, 18–24 June 2022; pp. 13668–13677. [Google Scholar]
  7. Zhu, X.; Lyu, S.; Wang, X.; Zhao, Q. TPH-YOLOv5: Improved YOLOv5 based on Transformer prediction head for object detection on drone-captured scenarios. In Proceedings of the IEEE/CVF International Conference on Computer Vision Workshops, Montreal, QC, Canada, 11–17 October 2021; pp. 2778–2788. [Google Scholar] [CrossRef] [Scilit]
  8. Xie, X.; Cheng, G.; Wang, J.; Yao, X.; Han, J. Oriented R-CNN for object detection. In Proceedings of the IEEE/CVF International Conference on Computer Vision, Montreal, QC, Canada, 11–17 October 2021; pp. 3520–3529. [Google Scholar]
  9. Li, Y.; Hou, Q.; Zheng, Z.; Cheng, M.-M.; Yang, J.; Li, X. Large selective kernel network for remote sensing object detection. In Proceedings of the IEEE/CVF International Conference on Computer Vision, Paris, France, 1–6 October 2023; pp. 16794–16805. [Google Scholar] [CrossRef] [Scilit]
  10. Ke, H.; Ke, X.; Zhang, Z.; Chen, X.; Xu, X.; Zhang, T. SLA-Net: A novel sea–land aware network for accurate SAR ship detection guided by hierarchical attention mechanism. Remote Sens. 2025, 17, 3576. [Google Scholar] [CrossRef] [Scilit]
  11. Gupta, H.; Kotlyar, O.; Andreasson, H.; Lilienthal, A.J. Robust object detection in challenging weather conditions. In Proceedings of the IEEE/CVF Winter Conference on Applications of Computer Vision, Waikoloa, HI, USA, 3–8 January 2024; pp. 7508–7517. [Google Scholar] [CrossRef] [Scilit]
  12. Zhang, P.; Zhong, Y.; Li, X. SlimYOLOv3: Narrower, faster and better for real-time UAV applications. In Proceedings of the IEEE/CVF International Conference on Computer Vision Workshops, Seoul, Republic of Korea, 27–28 October 2019; pp. 37–45. [Google Scholar] [CrossRef] [Scilit]
  13. Liu, M.; Wang, X.; Zhou, A.; Fu, X.; Ma, Y.; Piao, C. UAV-YOLO: Small object detection on unmanned aerial vehicle perspective. Sensors 2020, 20, 2238. [Google Scholar] [CrossRef] [Scilit]
  14. Li, C.; Li, L.; Jiang, H.; Weng, K.; Geng, Y.; Li, L.; Ke, Z.; Li, Q.; Cheng, M.; Nie, W.; et al. YOLOv6: A single-stage object detection framework for industrial applications. arXiv 2022, arXiv:2209.02976. [Google Scholar]
  15. Wang, C.Y.; Bochkovskiy, A.; Liao, H.Y.M. YOLOv7: Trainable bag-of-freebies sets new state-of-the-art for real-time object detectors. In Proceedings of the 2023 IEEE/CVF Conference on Computer Vision and Pattern Recognition (CVPR); IEEE: New York, NY, USA, 2023; pp. 7464–7475. [Google Scholar]
  16. Jocher, G.; Chaurasia, A.; Qiu, J. Ultralytics YOLO, Version 8.0.0. 2023. Available online: https://github.com/ultralytics/ultralytics (accessed on 28 August 2026).
  17. Jocher, G.; Qiu, J. Ultralytics YOLO11, Version 11.0.0. 2024. Available online: https://docs.ultralytics.com/models/yolo11/ (accessed on 5 August 2026).
  18. Wang, C.Y.; Yeh, I.H.; Mark; Liao, H.Y. Yolov9: Learning what you want to learn using programmable gradient information. In Proceedings of the European Conference on Computer Vision; Springer Nature: Cham, Switzerland, 2024; pp. 1–21. [Google Scholar]
  19. Neubeck, A.; Van Gool, L. Efficient non-maximum suppression. In Proceedings of the 18th International Conference on Pattern Recognition, Hong Kong, China, 20–24 August 2006; Volume 3, pp. 850–855. [Google Scholar]
  20. Zhu, X.; Su, W.; Lu, L.; Li, B.; Wang, X.; Dai, J. Deformable DETR: Deformable Transformers for end-to-end object detection. In Proceedings of the International Conference on Learning Representations, Virtual Event, 3–7 May 2021. [Google Scholar]
  21. Zhao, Y.; Lv, W.; Xu, S.; Wei, J.; Wang, G.; Dang, Q.; Liu, Y.; Chen, J. DETRs beat YOLOs on real-time object detection. In Proceedings of the IEEE/CVF Conference on Computer Vision and Pattern Recognition, Seattle, WA, USA, 16–22 June 2024; pp. 16965–16974. [Google Scholar]
  22. Chen, Y.; Chen, Q.; Hu, Q.; Cheng, J. Dual assignment of labels for end-to-end fully convolutional object detection. Pattern Recognit. 2026, 169, 111877. [Google Scholar] [CrossRef] [Scilit]
  23. Wang, A.; Chen, H.; Liu, L.; Chen, K.; Lin, Z.; Han, J.; Ding, G. YOLOv10: Real-time end-to-end object detection. Adv. Neural Inf. Process. Syst. 2024, 37, 107984–108011. [Google Scholar] [CrossRef] [Scilit]
  24. Ofori-Oduro, M.; Amer, M. Defending object detection models against image distortions. In Proceedings of the 2024 IEEE/CVF Winter Conference on Applications of Computer Vision (WACV); IEEE: New York, NY, USA, 2024; pp. 3842–3851. [Google Scholar]
  25. Rothmeier, T.; Huber, W.; Knoll, A.C. Time to shine: Fine-tuning object detection models with synthetic adverse weather images. In Proceedings of the 2024 IEEE/CVF Winter Conference on Applications of Computer Vision (WACV); IEEE: New York, NY, USA, 2024; pp. 4435–4444. [Google Scholar]
  26. Li, J.; Zhang, Z.; Zuo, W. Rethinking Transformer-based blind-spot networks for self-supervised image denoising. In Proceedings of the AAAI Conference on Artificial Intelligence, Philadelphia, PA, USA, 25 February–4 March 2025. [Google Scholar]
  27. Yang, G.; Lei, J.; Zhu, Z.; Cheng, S.; Feng, Z.; Liang, R. AFPN: Asymptotic feature pyramid network for object detection. In Proceedings of the 2023 IEEE International Conference on Systems, Man, and Cybernetics, Honolulu, HI, USA, 1–4 October 2023; pp. 2184–2189. [Google Scholar]
  28. Sun, K.; Xiao, B.; Liu, D.; Wang, J. Deep high-resolution representation learning for human pose estimation. In Proceedings of the IEEE/CVF Conference on Computer Vision and Pattern Recognition, Long Beach, CA, USA, 15–20 June 2019; pp. 5693–5703. [Google Scholar]
  29. Hendrycks, D.; Dietterich, T. Benchmarking neural network robustness to common corruptions and perturbations. In Proceedings of the International Conference on Learning Representations, New Orleans, LA, USA, 6–9 May 2019. [Google Scholar]
  30. Abdelhamed, A.; Lin, S.; Brown, M.S. A high-quality denoising dataset for smartphone cameras. In Proceedings of the IEEE/CVF Conference on Computer Vision and Pattern Recognition, Salt Lake City, UT, USA, 18–22 June 2018; pp. 1692–1700. [Google Scholar]
  31. Lin, T.; Maire, M.; Belongie, S.; Hays, J.; Perona, P.; Ramanan, D.; Dollár, P.; Zitnick, C.L. Microsoft COCO: Common objects in context. In Proceedings of the European Conference on Computer Vision, Zurich, Switzerland, 6–12 September 2014; pp. 740–755. [Google Scholar]
  32. Cheng, G.; Yuan, X.; Yao, X.; Yan, K.; Zeng, Q.; Xie, X.; Han, J. Towards large-scale small object detection: Survey and benchmarks. IEEE Trans. Pattern Anal. Mach. Intell. 2023, 45, 13467–13488. [Google Scholar] [CrossRef] [Scilit]
  33. Ren, S.; He, K.; Girshick, R.; Sun, J. Faster R-CNN: Towards real-time object detection with region proposal networks. In Proceedings of the Advances in Neural Information Processing Systems, Montreal, QC, Canada, 7–12 December 2015; Volume 28. [Google Scholar]
  34. Sohan, M.; Sai Ram, T.; Rami Reddy, C.V. A review on YOLOv8 and its advancements. In Proceedings of the International Conference on Data Intelligence and Cognitive Informatics; Springer: Singapore, 2024; pp. 529–545. [Google Scholar]
Figure 1. Architecture of the YOLOv11 network.
Remotesensing 18 02997 g001
Figure 2. Structure of the DTAB module.
Remotesensing 18 02997 g002
Figure 3. Structure of the C3k2_DTAB module.
Remotesensing 18 02997 g003
Figure 4. Architecture of the AFPN network.
Remotesensing 18 02997 g004
Figure 5. Architecture of YOLO-ROSS. Each Detect block contains the one-to-many (O2M) training head and the one-to-one (O2O) training/inference head defined in Section 2.4.
Remotesensing 18 02997 g005
Figure 6. Adopted dual-assignment head. O2M and O2O denote one-to-many and one-to-one assignment; both heads are trained, whereas only the O2O head is retained for NMS-free inference.
Remotesensing 18 02997 g006
Figure 7. Examples of interference effects.
Remotesensing 18 02997 g007
Figure 8. Comparison of confusion matrices.
Remotesensing 18 02997 g008
Figure 9. Class-wise F1–confidence curves. The bold curves peak at approximately 0.36 (threshold 0.146) for YOLOv11 and 0.40 (threshold 0.186) for YOLO-ROSS.
Remotesensing 18 02997 g009
Figure 10. Visual comparison of robustness detection results in a daytime residential area.
Remotesensing 18 02997 g010
Figure 11. Visual comparison of robustness detection results on a traffic road under dim lighting conditions.
Remotesensing 18 02997 g011
Figure 12. Visual comparison of robustness detection results on an urban arterial road at night.
Remotesensing 18 02997 g012
Disclaimer/Publisher’s Note: The statements, opinions and data contained in all publications are solely those of the individual author(s) and contributor(s) and not of MDPI and/or the editor(s). MDPI and/or the editor(s) disclaim responsibility for any injury to people or property resulting from any ideas, methods, instructions or products referred to in the content.