Article

Joint Interpretation of Archaeological, Geological, Geophysical and Remotely Sensed Data for Fluvial Geomorphology: The Case of the Calore River Meander North of Benevento (Italy)


1
Department of Biosciences and Territory, University of Molise, Via Fonte Lappone, 86179 Pesche, Italy
2
Department of Agriculture, Environment and Food, University of Molise, Via De Sanctis Snc, 86100 Campobasso, Italy
*
Author to whom correspondence should be addressed.
Remote Sens. 2026, 18(15), 2629; https://doi.org/10.3390/rs18152629
Submission received: 9 June 2026 / Revised: 20 July 2026 / Accepted: 29 July 2026 / Published: 6 August 2026
(This article belongs to the Special Issue Recent Achievements in Remote Sensing-Based Archaeological Research)

Highlights

What are the main findings?
  • New information about the archaeofluvial geomorphological evolution of the northern meander of the Calore River was obtained using archaeological, geological and geomorphological data, historical cartography, remote sensing imagery and geophysical surveys.
  • The reconstruction of channel migration patterns and the identification of abandoned meanders and paleochannel traces of the Calore River were achieved.
What are the implications of the main findings?
  • An integrated, multi-scale, and multi-method approach improves the effectiveness of the reconstruction of fluvial landscape evolution.
  • The multi-method approach allows for more realistic and valid management of complex floodplain environments.

Abstract

This study presents a multidisciplinary investigation of the fluvial evolution of the northern meander of the Calore River at Cellarulo locality, near Benevento (southern Italy). The research integrates archaeological evidence, geological and geomorphological data, historical cartography, remote sensing imagery and geophysical surveys in a Geographic Information System (GIS) environment. Multi-temporal analysis of historical maps, aerial photographs and satellite images from 1824 to 2022 allowed the reconstruction of channel migration patterns and the identification of abandoned meanders and paleochannel traces. Stratigraphic data derived from boreholes revealed the presence of a channel of the Calore River dated at least in the Bronze Age (3900 years ago), abandoned in the nineteenth century. Geoelectrical investigations provided detailed information on subsurface resistivity anomalies, highlighting the presence of buried structures and possible ancient anthropogenic features located at shallow depths between 1 and 1.5 m. The combined interpretation of geomorphological, archaeological and geophysical data demonstrates significant data on the unveiling of an ancient river channel and its abandonment during the last 150 years, suggesting a strong interaction between natural fluvial dynamics and human occupation. The results confirm the effectiveness of an integrated multidisciplinary approach for reconstructing fluvial landscape evolution and for identifying buried archaeological and geomorphological features in complex floodplain environments.

1. Introduction

River morphodynamics reflects the combined effects of climatic variability, hydrological forcing, sediment transport, tectonic activity, and human intervention [1]. Reconstructing the evolution of fluvial systems is therefore fundamental for understanding landscape development, floodplain evolution, sedimentary processes, and the interactions between river dynamics and human settlements. In particular, meandering rivers preserve a complex geomorphological record, including abandoned channels, paleochannels, point bars, and fluvial terraces, which document both gradual lateral migration and rapid channel adjustments associated with extreme flood events. The reconstruction of these landforms provides valuable information on the spatial and temporal evolution of river corridors and on the relative contribution of natural and anthropogenic processes to channel evolution.
Traditionally, investigations of fluvial geomorphology have relied on detailed field surveys aimed at documenting channel geometry, floodplain morphology, and topographic variations. Although conventional surveying remains fundamental, field investigations may be limited by poor accessibility, dense vegetation, steep riverbanks, or the complex morphology of active meanders, often reducing the spatial continuity of the acquired data.
During the last decades, significant advances in geospatial technologies have considerably improved the investigation of river systems. Global Positioning Systems (GPS) and Terrestrial Laser Scanning (TLS) provide accurate topographic measurements and high-resolution three-dimensional representations of channel morphology, although TLS surveys may require considerable acquisition and processing time due to multiple scan registrations and georeferencing procedures [2,3,4]. Likewise, airborne remote sensing techniques, including Airborne Laser Scanning (ALS), Synthetic Aperture Radar (SAR), and LiDAR, have greatly enhanced the capability to detect subtle geomorphological features over large areas. High-resolution Digital Terrain Models derived from LiDAR data allow the identification of paleochannels, abandoned meanders, floodplain microtopography, river terraces, and sedimentary environments, offering unprecedented opportunities for reconstructing channel migration and landscape evolution [5,6,7,8,9,10,11,12,13].
Historical cartography represents another fundamental source of information for reconstructing long-term channel evolution. Sequential topographic maps, historical aerial photographs, and iconographic documents have been successfully employed to identify planform changes and river migration over the last two centuries [14,15,16,17,18,19,20,21,22,23]. When integrated with borehole information and subsurface stratigraphy, these datasets allow detailed reconstructions of floodplain evolution and the chronology of abandoned channels. Numerous studies have shown that meandering river systems commonly preserve evidence of both gradual lateral migration and episodic channel adjustments triggered by extreme flood events [24,25].
Surface observations can be further complemented by near-surface geophysical investigations, including electrical resistivity tomography (ERT), ground penetrating radar (GPR), and electromagnetic methods. These techniques provide valuable information on alluvial architecture, channel fills, buried geomorphic features, and floodplain stratigraphy, particularly when validated by borehole data and field observations [5,26,27,28,29]. Archaeological evidence also represents an important source of information for reconstructing river evolution over historical timescales, as human settlements have traditionally developed close to freshwater resources. Consequently, the distribution of archaeological remains frequently reflects past channel positions, floodplain evolution, and landscape changes [5,30,31,32,33].
The increasing availability of heterogeneous spatial datasets has made Geographic Information Systems (GIS) an indispensable framework for integrating, managing, and analyzing geomorphological, geological, geophysical, archaeological, and remotely sensed information within a common georeferenced environment [34,35,36].
Despite the remarkable progress achieved by these individual techniques, relatively few studies have combined historical cartography, remote sensing, geomorphological mapping, archaeological evidence, and geophysical investigations within a single multidisciplinary framework to reconstruct the recent evolution of individual meandering river systems. Such an integrated approach is particularly valuable in floodplains where surface geomorphic evidence has been partially modified or obscured by anthropogenic activities and recent sedimentation.
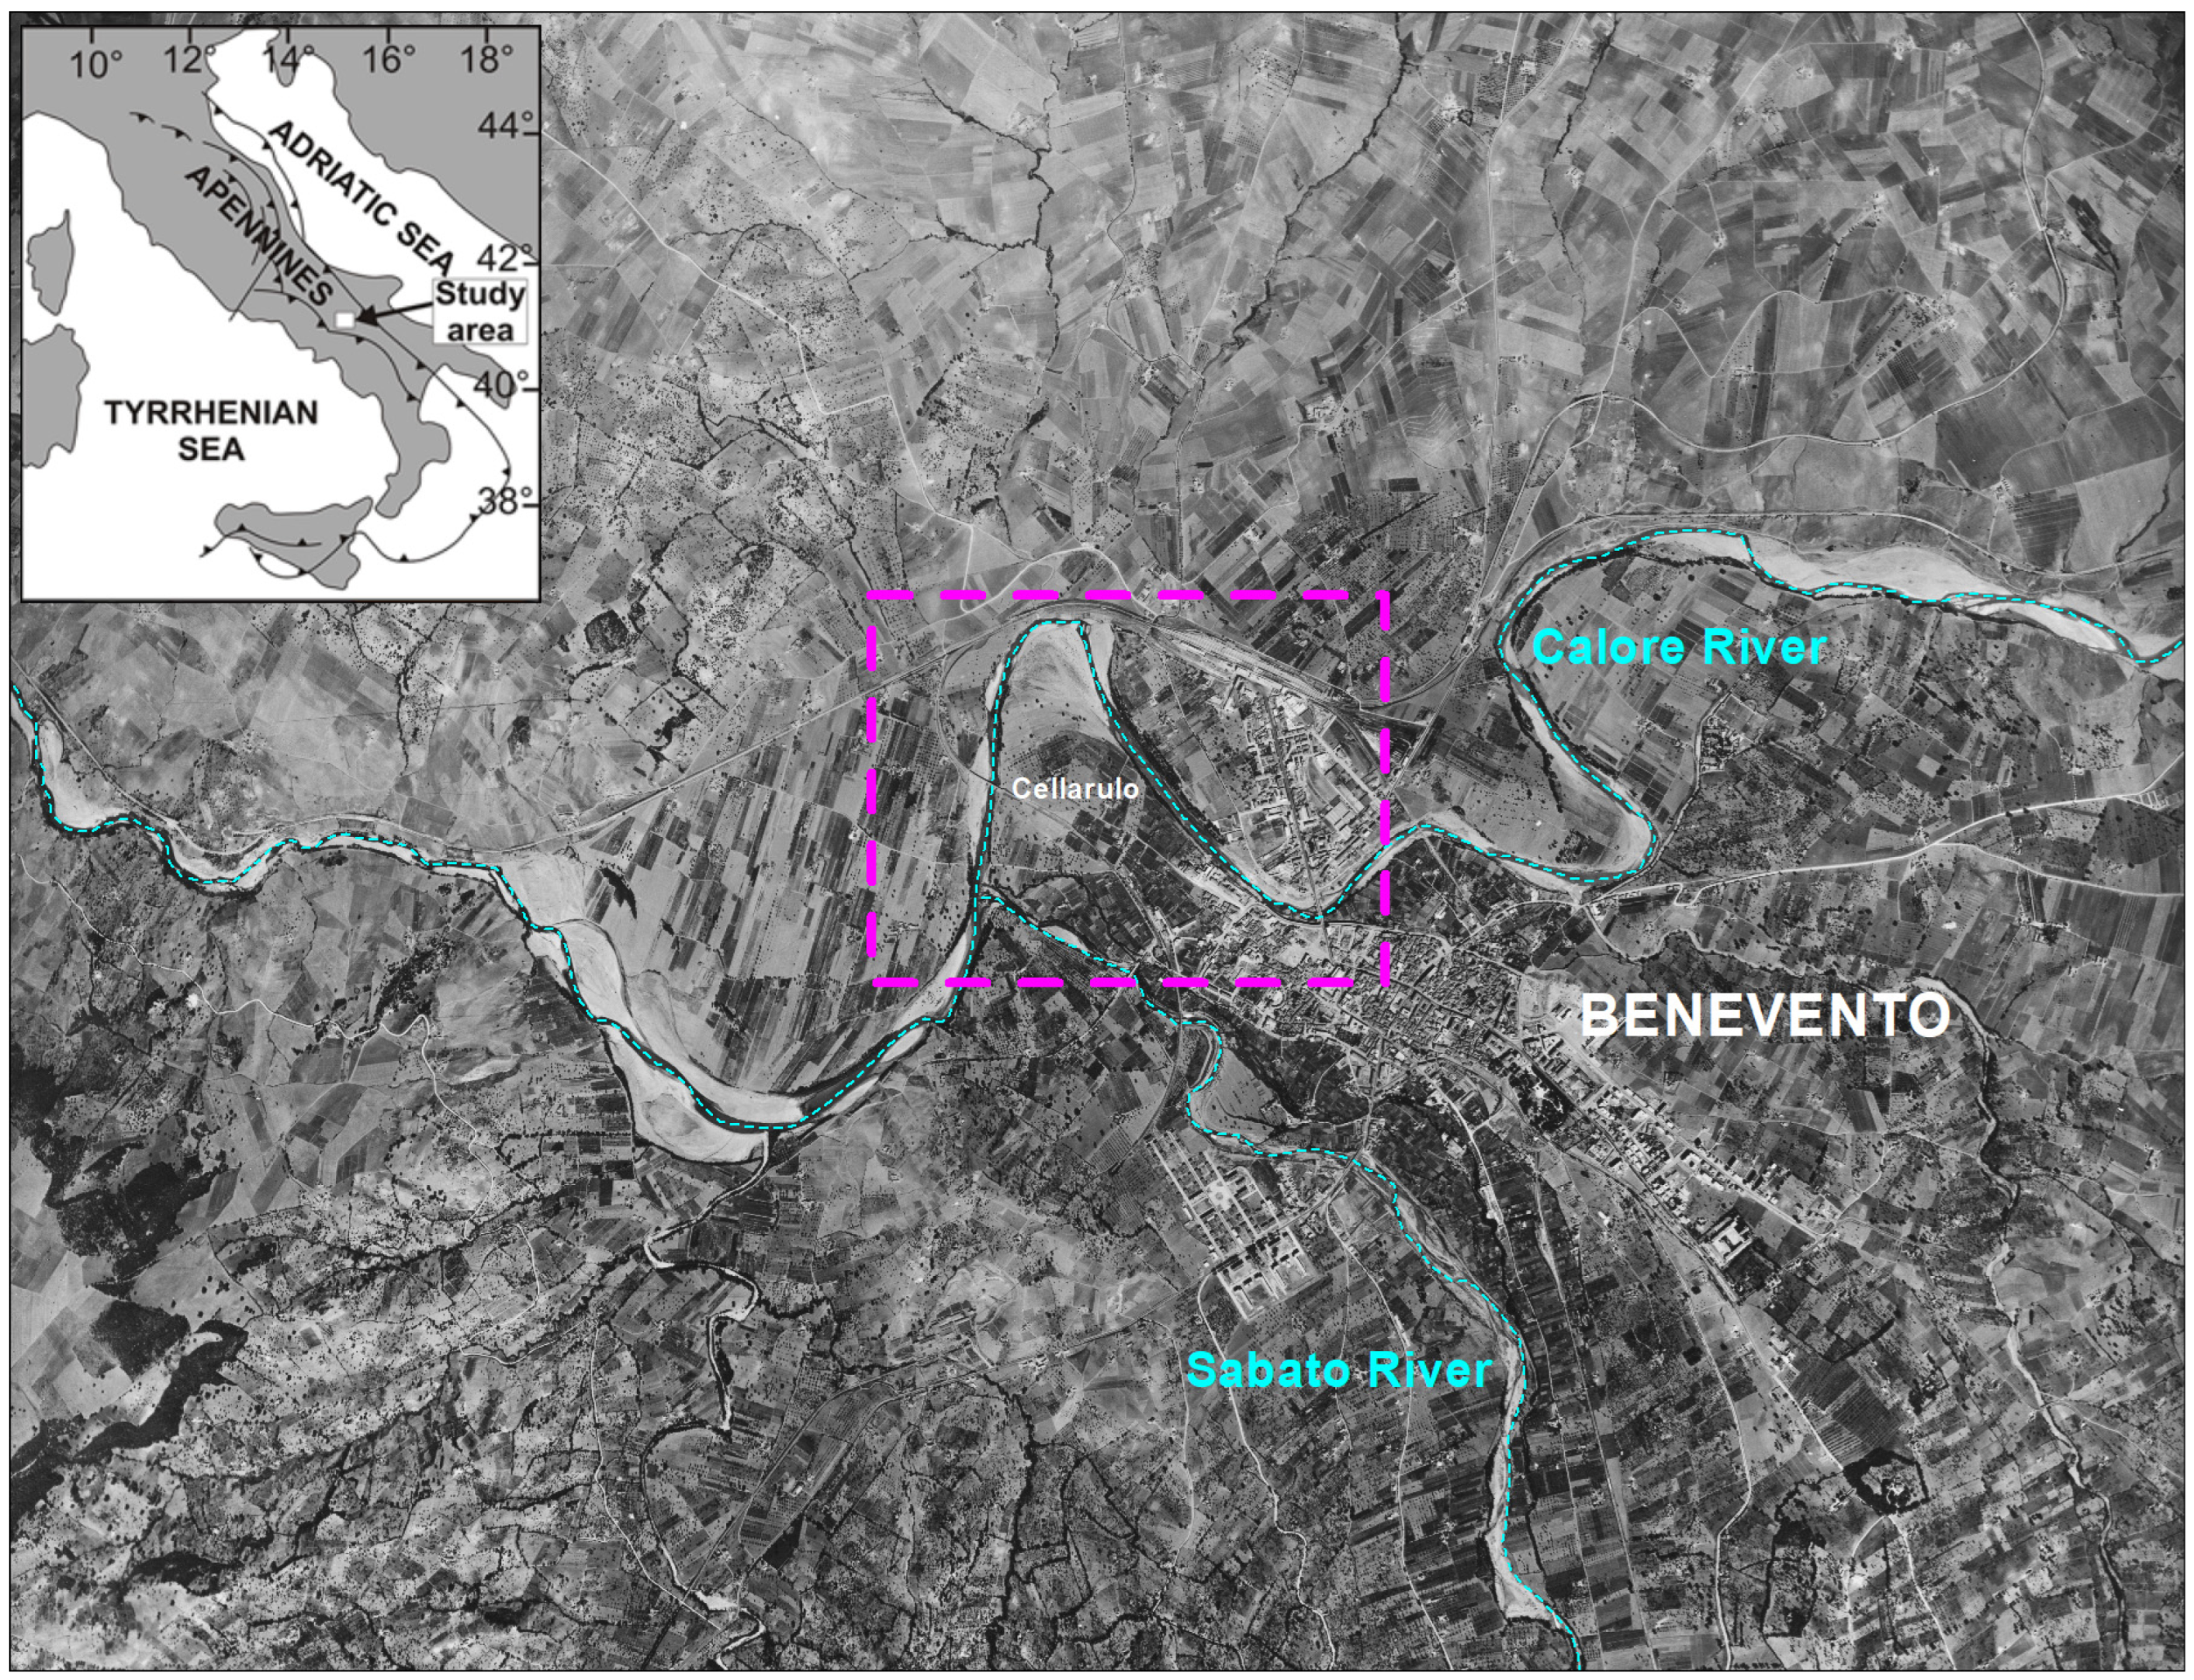
The present study focuses on the Cellarulo meander of the Calore River, located near its confluence with the Sabato River in the southern Apennines (Italy) (Figure 1). The city of Benevento occupies a Pleistocene fluvial terrace bounded by the Calore River to the north and the Sabato River to the south, while the Cellarulo area lies within a large meander that has experienced significant geomorphological changes over the last century. The study area has been repeatedly affected by major flood events, including the exceptional flood of 15 October 2015, during which the Calore River experienced a water-level increase of approximately 10 m. Previous investigations documented the presence of abandoned channels, anthropogenic landforms, and a sequence of five orders of recent river terraces across the Calore floodplain using historical cartography, orthophotos, satellite imagery, and geomorphological mapping [23,37,38,39,40]. However, the morphodynamic evolution of the Cellarulo meander and the relationships between channel migration, subsurface architecture, and human activities have not yet been comprehensively investigated.
This study addresses this gap through an integrated multidisciplinary approach combining historical cartography, remote sensing, geomorphological mapping, archaeological information, and newly acquired geophysical data. The objectives are to (i) reconstruct the morphodynamic evolution of the Cellarulo meander over approximately the last 150 years, (ii) identify abandoned channels and characterize their subsurface geometry through integrated geomorphological and geophysical analyses, (iii) evaluate the relative influence of natural fluvial processes and anthropogenic modifications on channel evolution, and (iv) demonstrate the effectiveness of integrating complementary datasets for reconstructing the recent evolution of meandering river systems.

2. Materials and Methods

2.1. Study Area

2.1.1. Geological Background

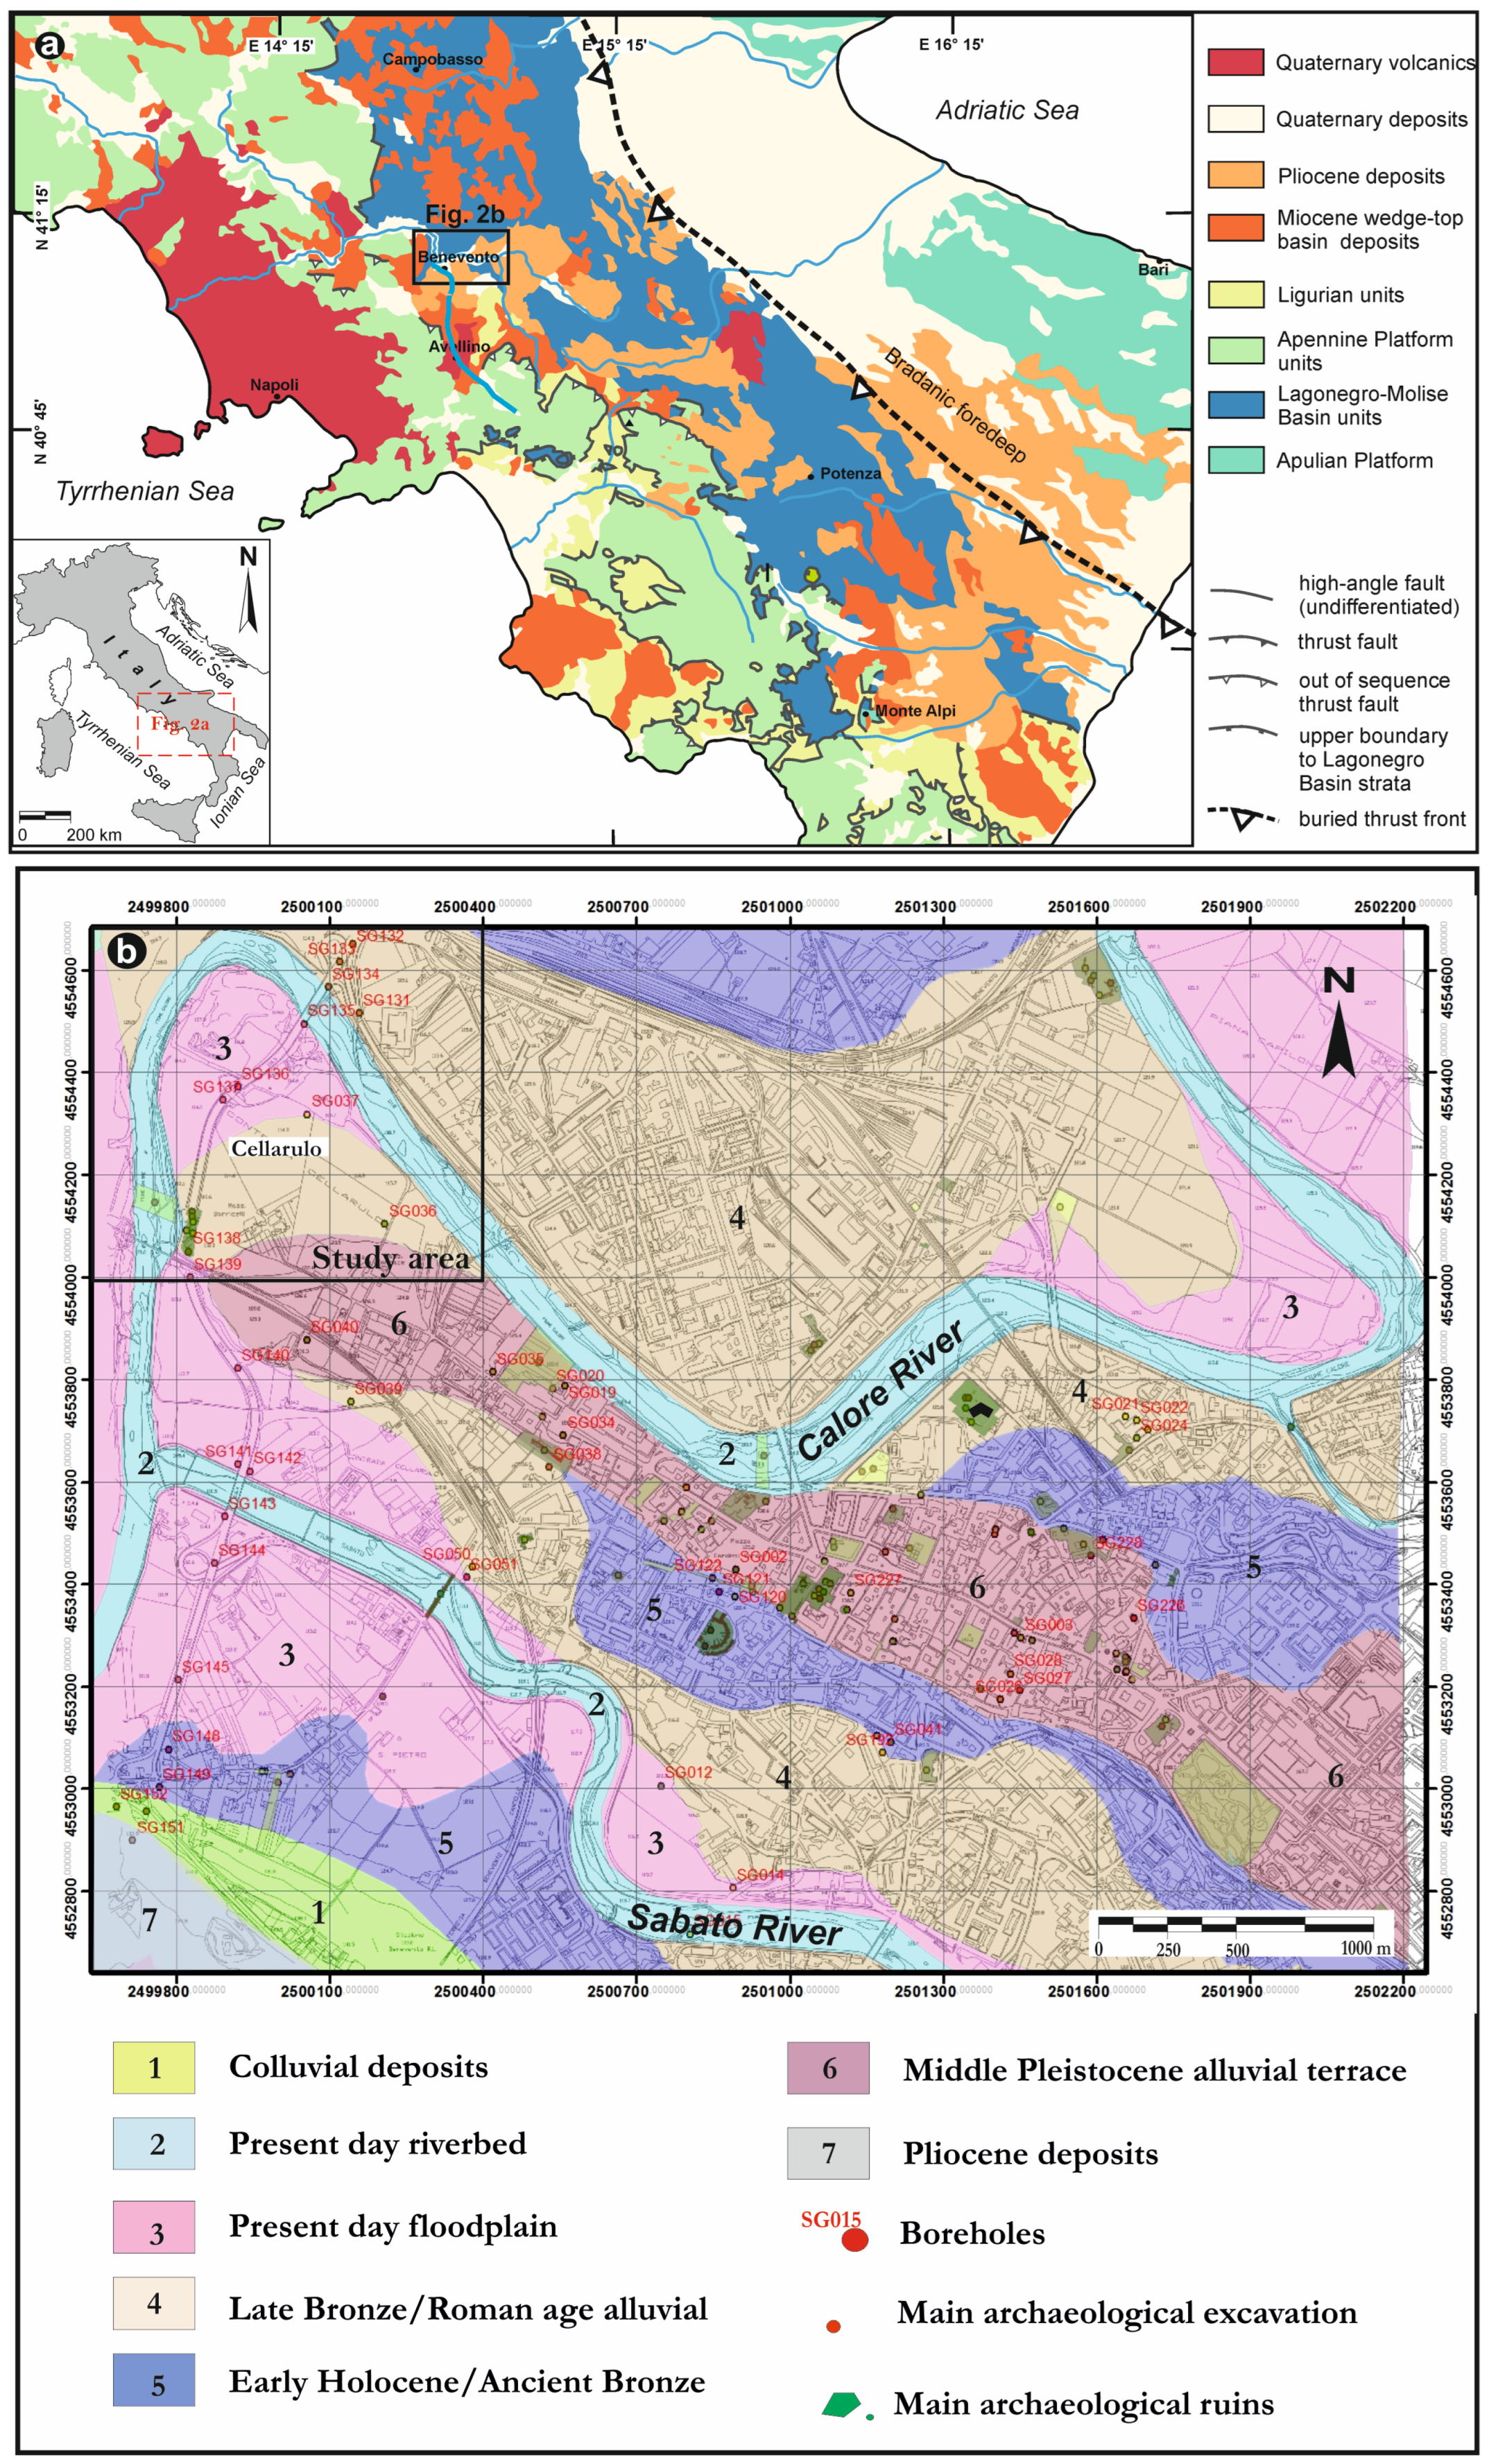
Benevento is located in a tectonic depression inside the southern Apennine Mountain range. The outcropping lithologies mainly consist of clastic Quaternary deposits and subordinately of Pliocene clays and sands and Meso-Cenozoic clay marls and limestones (Figure 2a). Quaternary sediments unconformably cover Neogene bedrock, comprising siliciclastic and carbonatic rocks made of deep-sea successions related to the Cretaceous to early Miocene Lagonegro and Molise basins (FYR in Figure 2b) [40,41,42]. During the lower Pliocene, tectonics produced the Benevento depression that was progressively filled with marine wedge-top basin sediments (BNA in Figure 2b) [41] and, subsequently, by Quaternary continental deposits (SFL in Figure 2b) [43,44]. The tectonic depression of the Benevento basin was developed by ENE–WSW and NNW–SSE trending normal faults [45,46]. These faults, generally due to an extensional tectonic regime, active in the southern Apennine chain since the Pliocene, controlled the deposition of Quaternary sedimentary successions within the intermontane basins (Figure 2b) [40,47,48] and were also responsible for historical seismicity [45]. The latter is well documented within the Benevento area by several strong earthquakes [49,50,51].
The Benevento urban area lies on top of a Middle Pleistocene alluvial terrace, 60 m high above the base level of the Calore and Sabato Rivers (Figure 2b). The terrace, narrow and elongated NNW-SSE, is made of well lithified gravelly and sandy layers. The conglomerates are polygenic (mostly carbonate clasts), heterometric (from pebbles up to boulder in size), well rounded and typically cemented by calcareous crusts. Clasts are embedded in a reddish or brownish sandy matrix probably due to post depositional precipitation of iron minerals. Sandy and silty intercalations commonly occur within the conglomerates [43]. The thickness of these deposits exceeds 100 m. The top of this terrace generally contains a thick dark brown paleosol [46].
The terrace is surrounded by two large alluvial plains composed of very loose gravelly and sandy layers deposited by the Calore River to the N-NE and the Sabato River to the S-SW (Figure 2b). The alluvial plains present two Holocene alluvial terraces situated several meters above the modern floodplain. The first terrace, 10–15 m high, is composed of loose gravelly and sandy layers capped by a thick paleosol and contains the Avellino tephra layer of the 3945 ± 10 cal. yr BCE Vesuvian eruption [52], isolated to more extensive prehistoric and protohistoric artifacts and settlements dated to the Neolithic to Bronze Age (third–first millennia BCE) [53]. The age of the terrace is constrained at Late-Pleistocene–Early Holocene age. The second terrace, late Holocene constrained, is 3–5 m high and also characterized by very loose gravelly and sandy layers, hosting artifacts and settlements from the Bronze (20th–10th centuries BCE) to Roman Ages (third century BCE–sixth century CE). Both terraces were repeatedly flooded during the Late Roman and Middle Ages (4th–12th centuries CE) [54] and more recently during the disastrous floods of 1949 and 2015. These flooding events did not reach the Middle Pleistocene terrace, where Samnitic Age (fifth–third centuries BCE) and Roman Age settlements were established, although the urban areas were repeatedly rebuilt after destructive earthquakes [49,50,51].

2.1.2. Archaeological Background

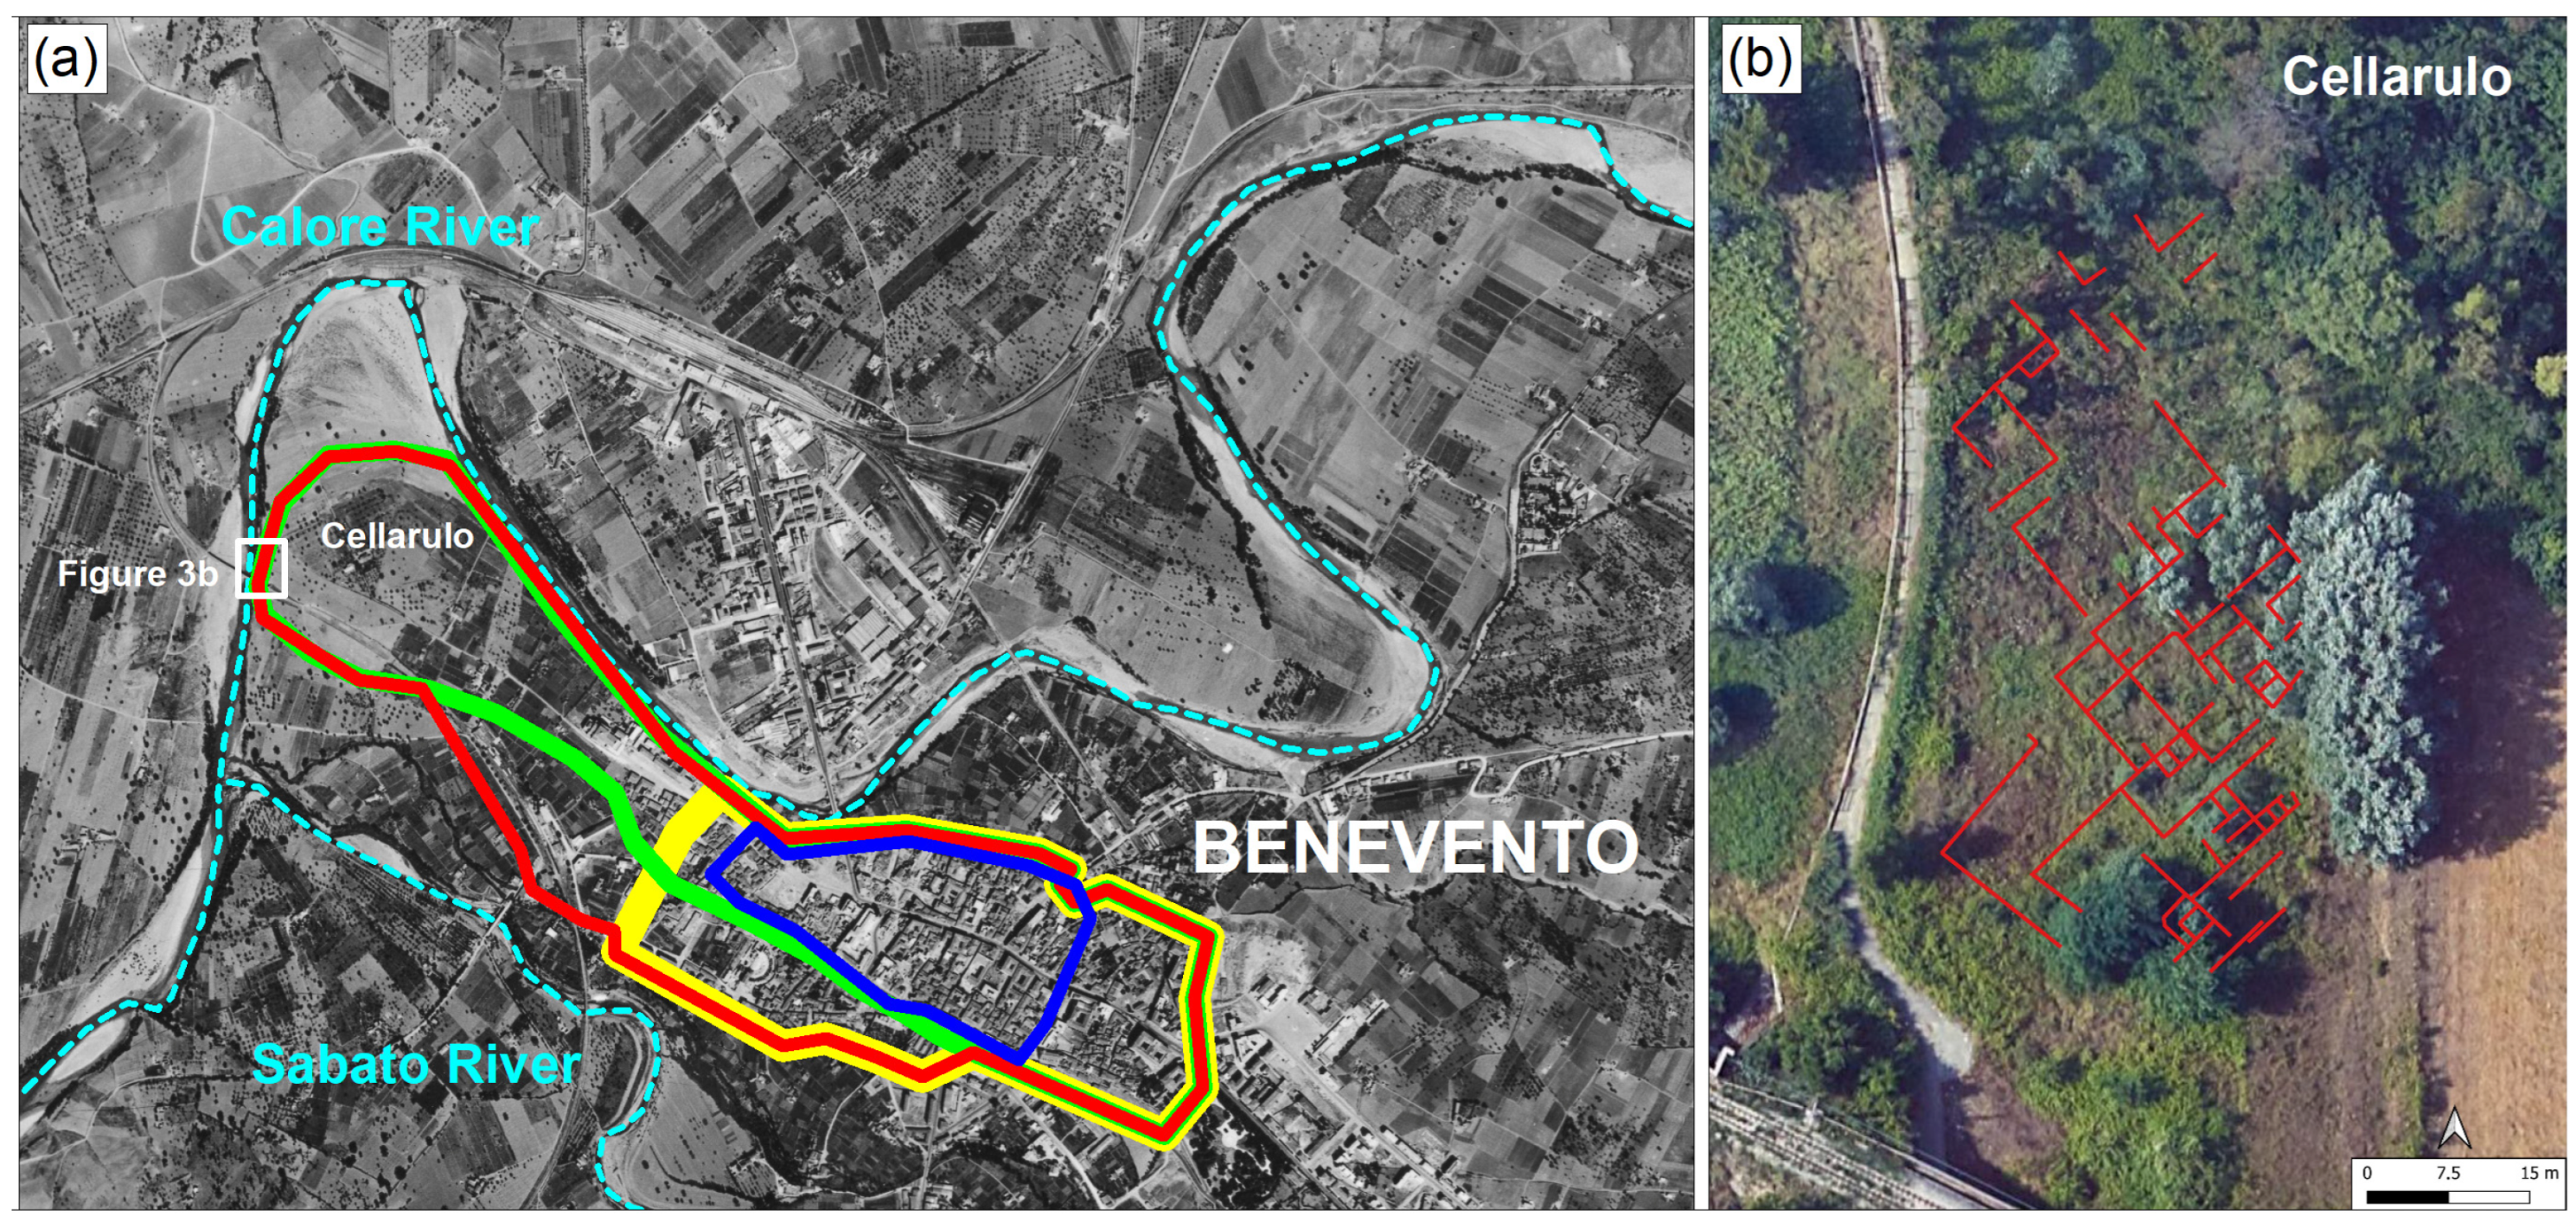
Benevento has a rich history dating back to the prehistoric period as evidenced by findings mainly from the Neolithic and Bronze Age distributed mainly along parts of the early and late Holocene terraces [53]. On the elongated terrace of the Middle Pleistocene, after a pre-urban phase between the Iron Age and the Archaic and Classical Age (10th–5th century BCE), the Samnite city (5th–3rd century BCE) and the Roman colony (268 BCE) developed [55,56,57] (Figure 3). In the Roman period, the city expanded across the entire Middle Pleistocene terrace to include some areas of the alluvial plain, as evidenced by structures such as bridges, roads, aqueducts, villae, theatres, houses and a necropolis [57]. During the Lombard and medieval periods (6th–12th century CE), the city shrank again [58]. Recent comprehensive research is presented in [40], which produced a map of the buried archaeological potential of the urban area of Benevento starting from archaeo-stratigraphic data integrated with geomorphological data.
Cellarulo locality, the study area of this paper, is located in the northwest part of the city, at the confluence of the Sabato and Calore rivers. In the 1990s, during the work of an inter-district road axis designed by the Municipality, some remains from the Roman–Late Ancient periods were discovered. Archaeological research was subsequently conducted by the Superintendence in the years 1990–1992, followed by smaller-scale interventions until 2001 when excavation activities were conducted by the University of Campania “Luigi Vanvitelli” [56]. As part of the project for the creation of the Cellarulo archaeological park and greenery, in 2008 and 2009, systematic excavations were finally carried out, which deepened previous knowledge.
The toponym Cellarulo is documented by Iscla de Cellarulo cum posta (fishing station along the Calore River) and by a Vineam de Cellarulo, evidence that seems to refer to the function of Cellarium for the stowage of goods and therefore a place linked to production and trade [56]. The archaeological material found attributes the site to the period from the 3rd century BCE to the 4th century AD. Here, there were production plants, located in the peripheral area, along the river, for the necessary supply of water and to benefit river transport. Together with the furnaces, service areas covered by simple wooden structures and fenced spaces with the function of dumping processing waste were identified [56].

2.2. Methodology

For a multi-temporal comparison of the fluvial morphodynamic evolution of the Calore River active channel of Cellarulo, a thorough literature search regarding remotely sensed data and topographic maps was undertaken.
As regards topographic maps and historical aerial photos dated before 1980, those included in [56] were considered, most of them deriving from the archives of the Italian Military Geographic Institute (IGMI). Significant traces that were countered in GIS are discussed in the Results section. In detail, the following data have been collected:
  • Historical cartography (drawing) of Monte S. Pietro, 1824, State Archive of Rome, Gregorian Cadastre, 277 n. 12 (Figure 4);
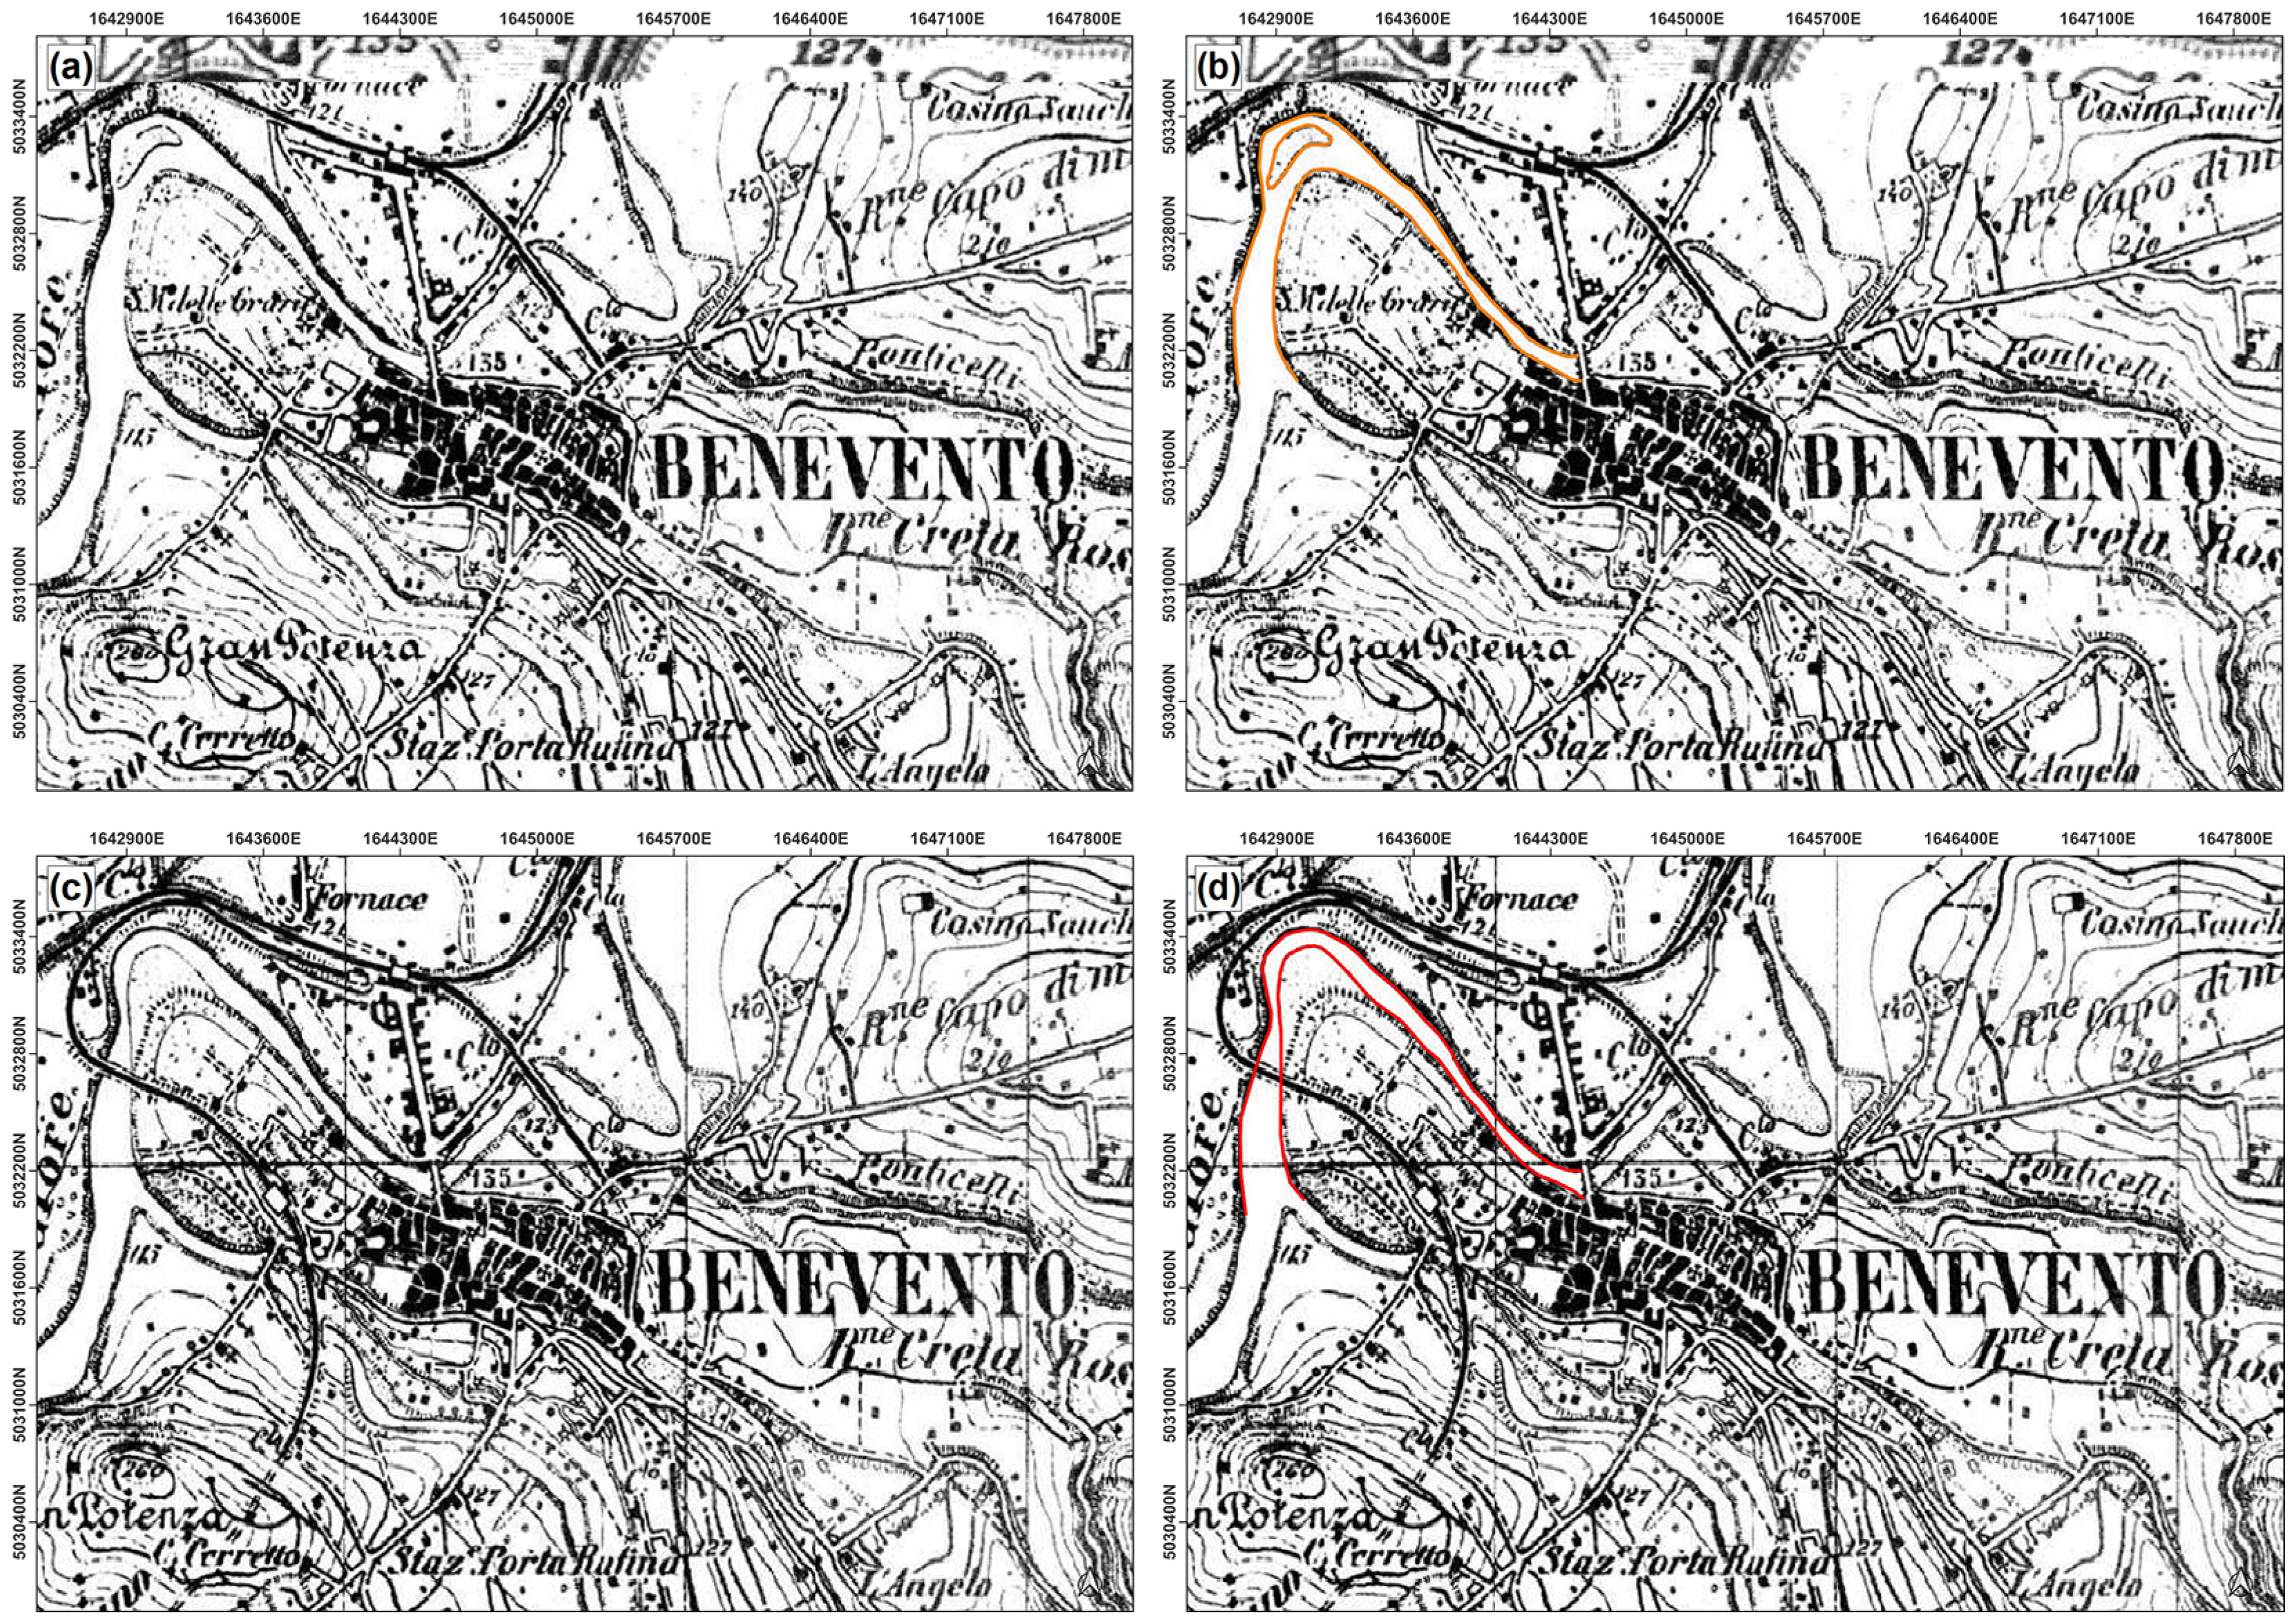
  • Topographic map, sheet 173 II, 1870, (1:50,000), «with general reconnaissance of November 1909 and with handwritten notes of 29 August 1911», IGMI (Figure 5a);
  • Topographic map, sheet 173 II, 1870, (1:50,000), «with general reconnaissance of November 1909 and partial reconnaissance of November 1919» and with handwritten notes of 20 October 1928, IGMI (Figure 5b);
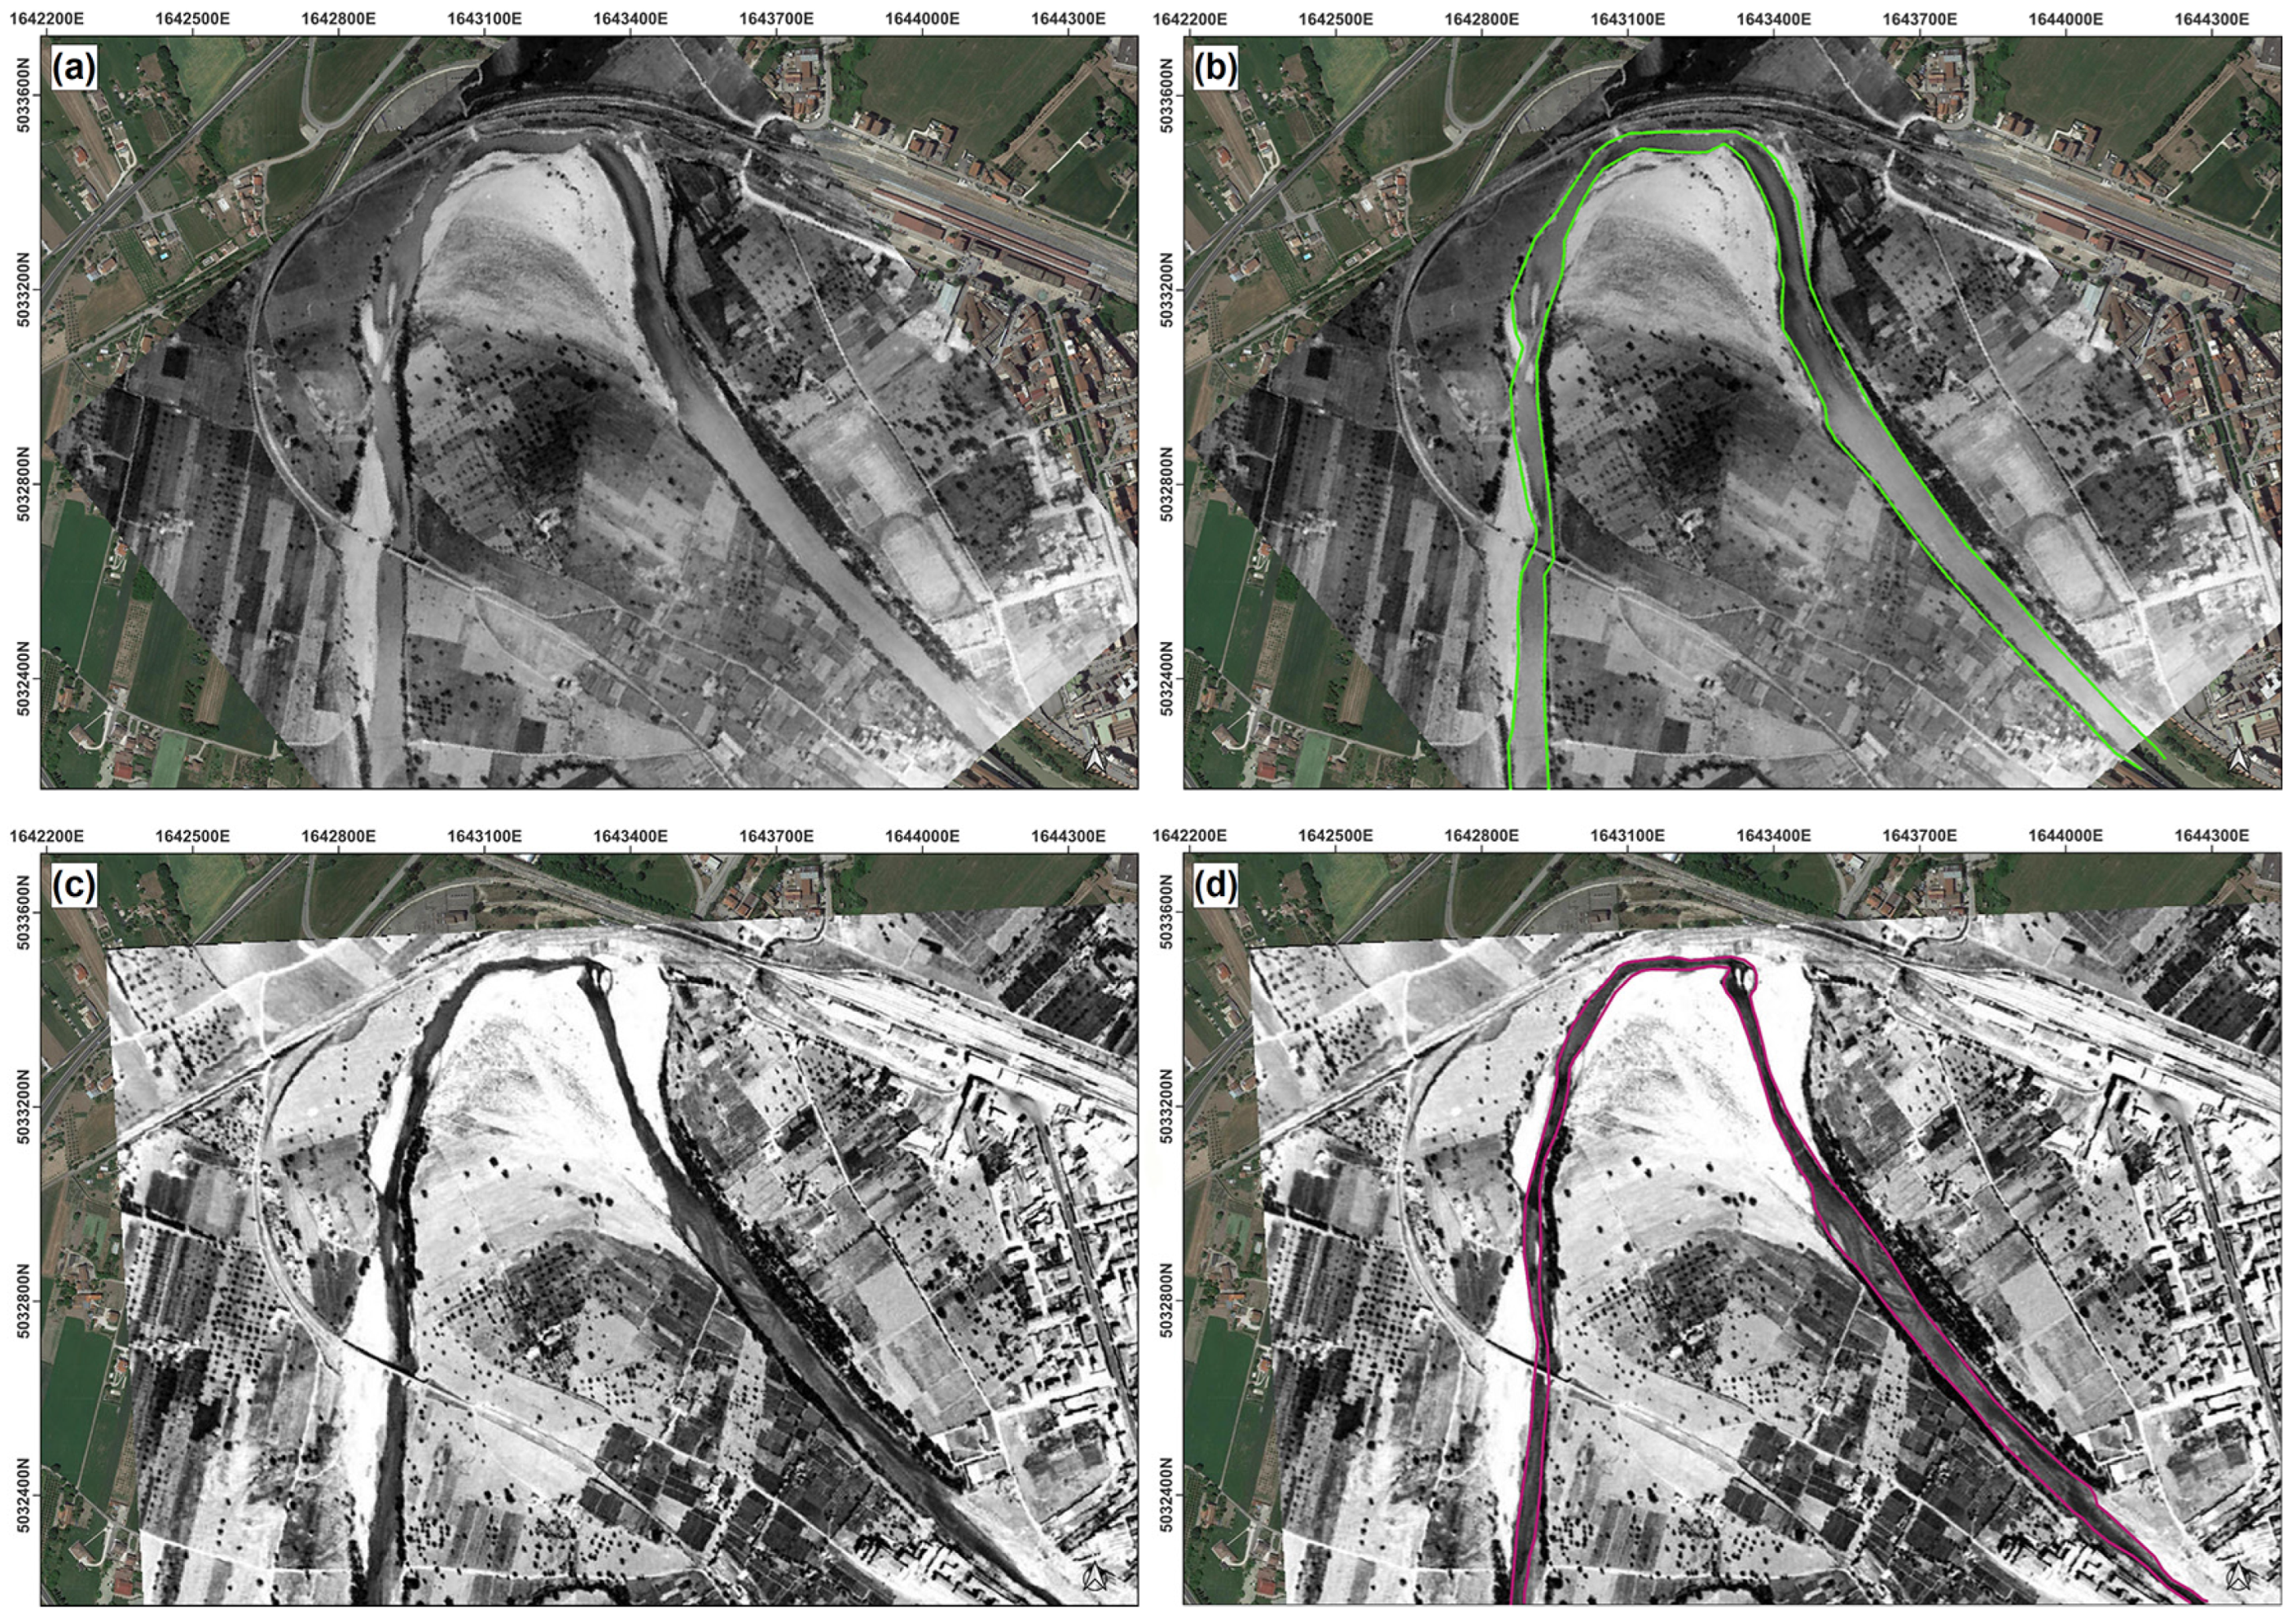
  • Aerial view, 22 May 1945 (Figure 6a);
  • Aerial view, 14 September 1954, IGMI (Figure 6b);
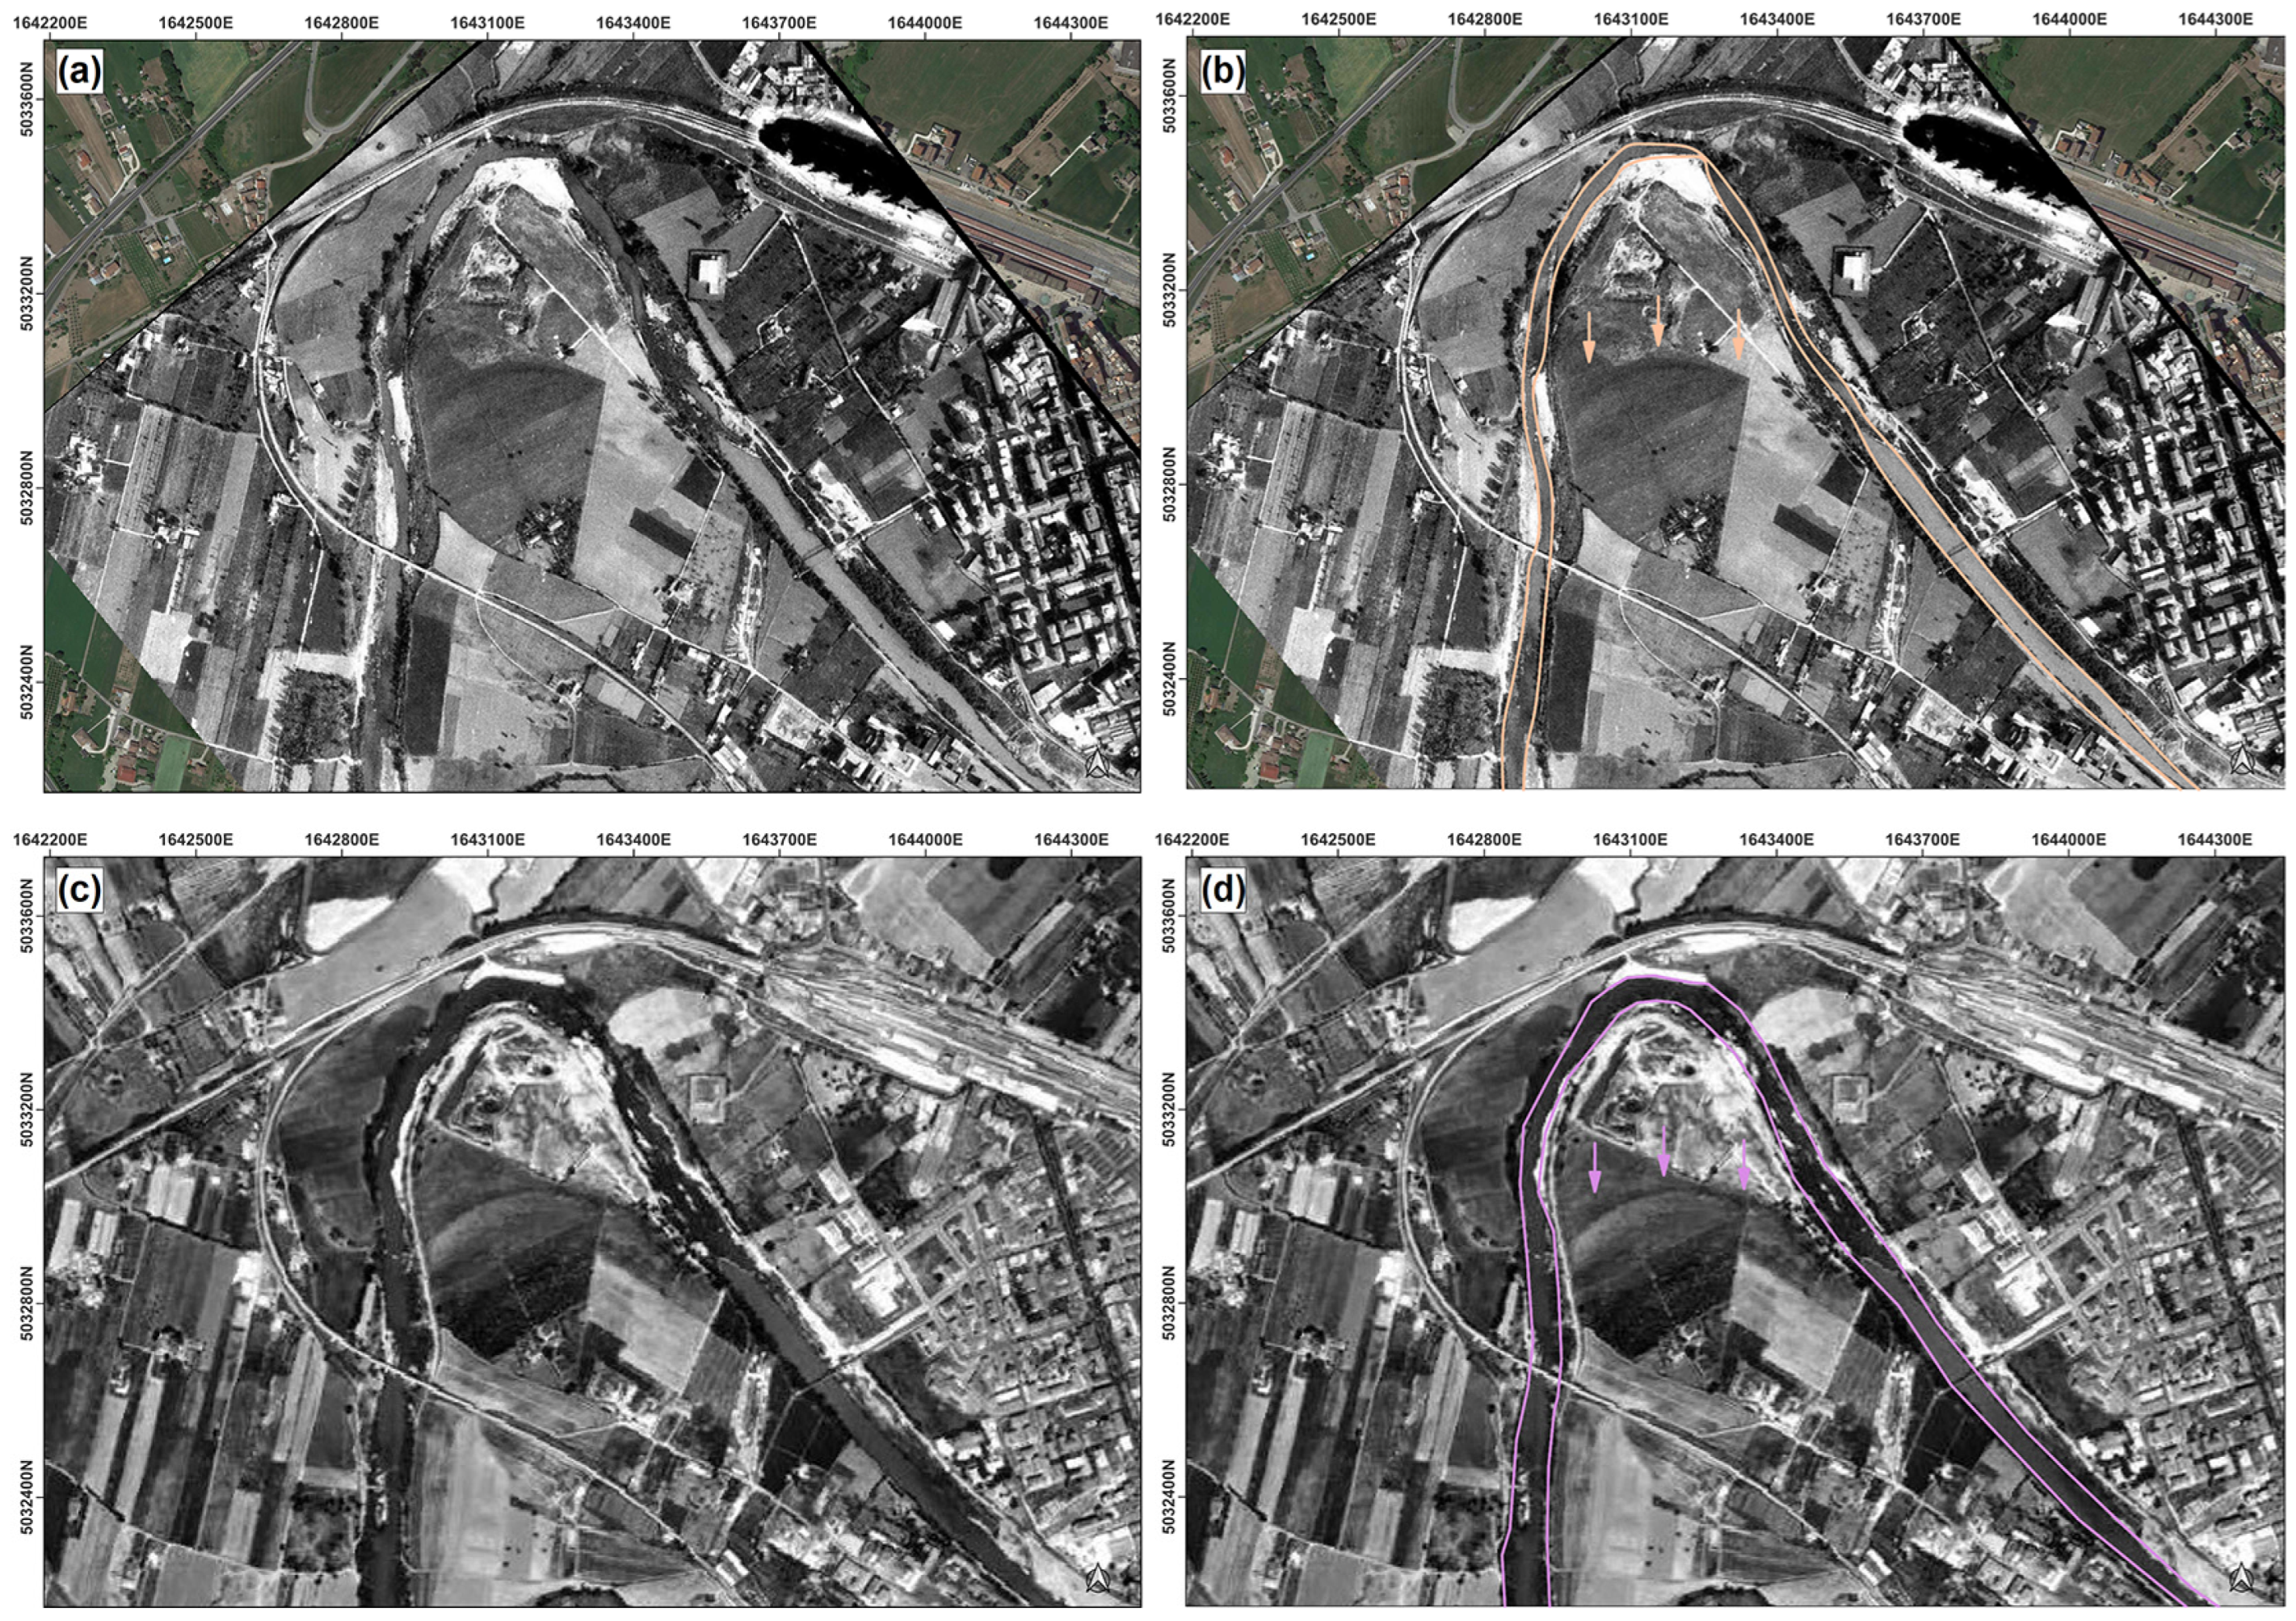
  • Aerial view, 15 September 1977 (Figure 7a).
To this dataset, the most recent aerial photographs, satellite images and WMS arranged by Campania Region (CR) Authority, National Geoportal (NG), Google Earth (GE) and Standard Web Map Service (WMS) were added:
  • Aerial photo, 1985 (1:14,000), CR (Figure 7b);
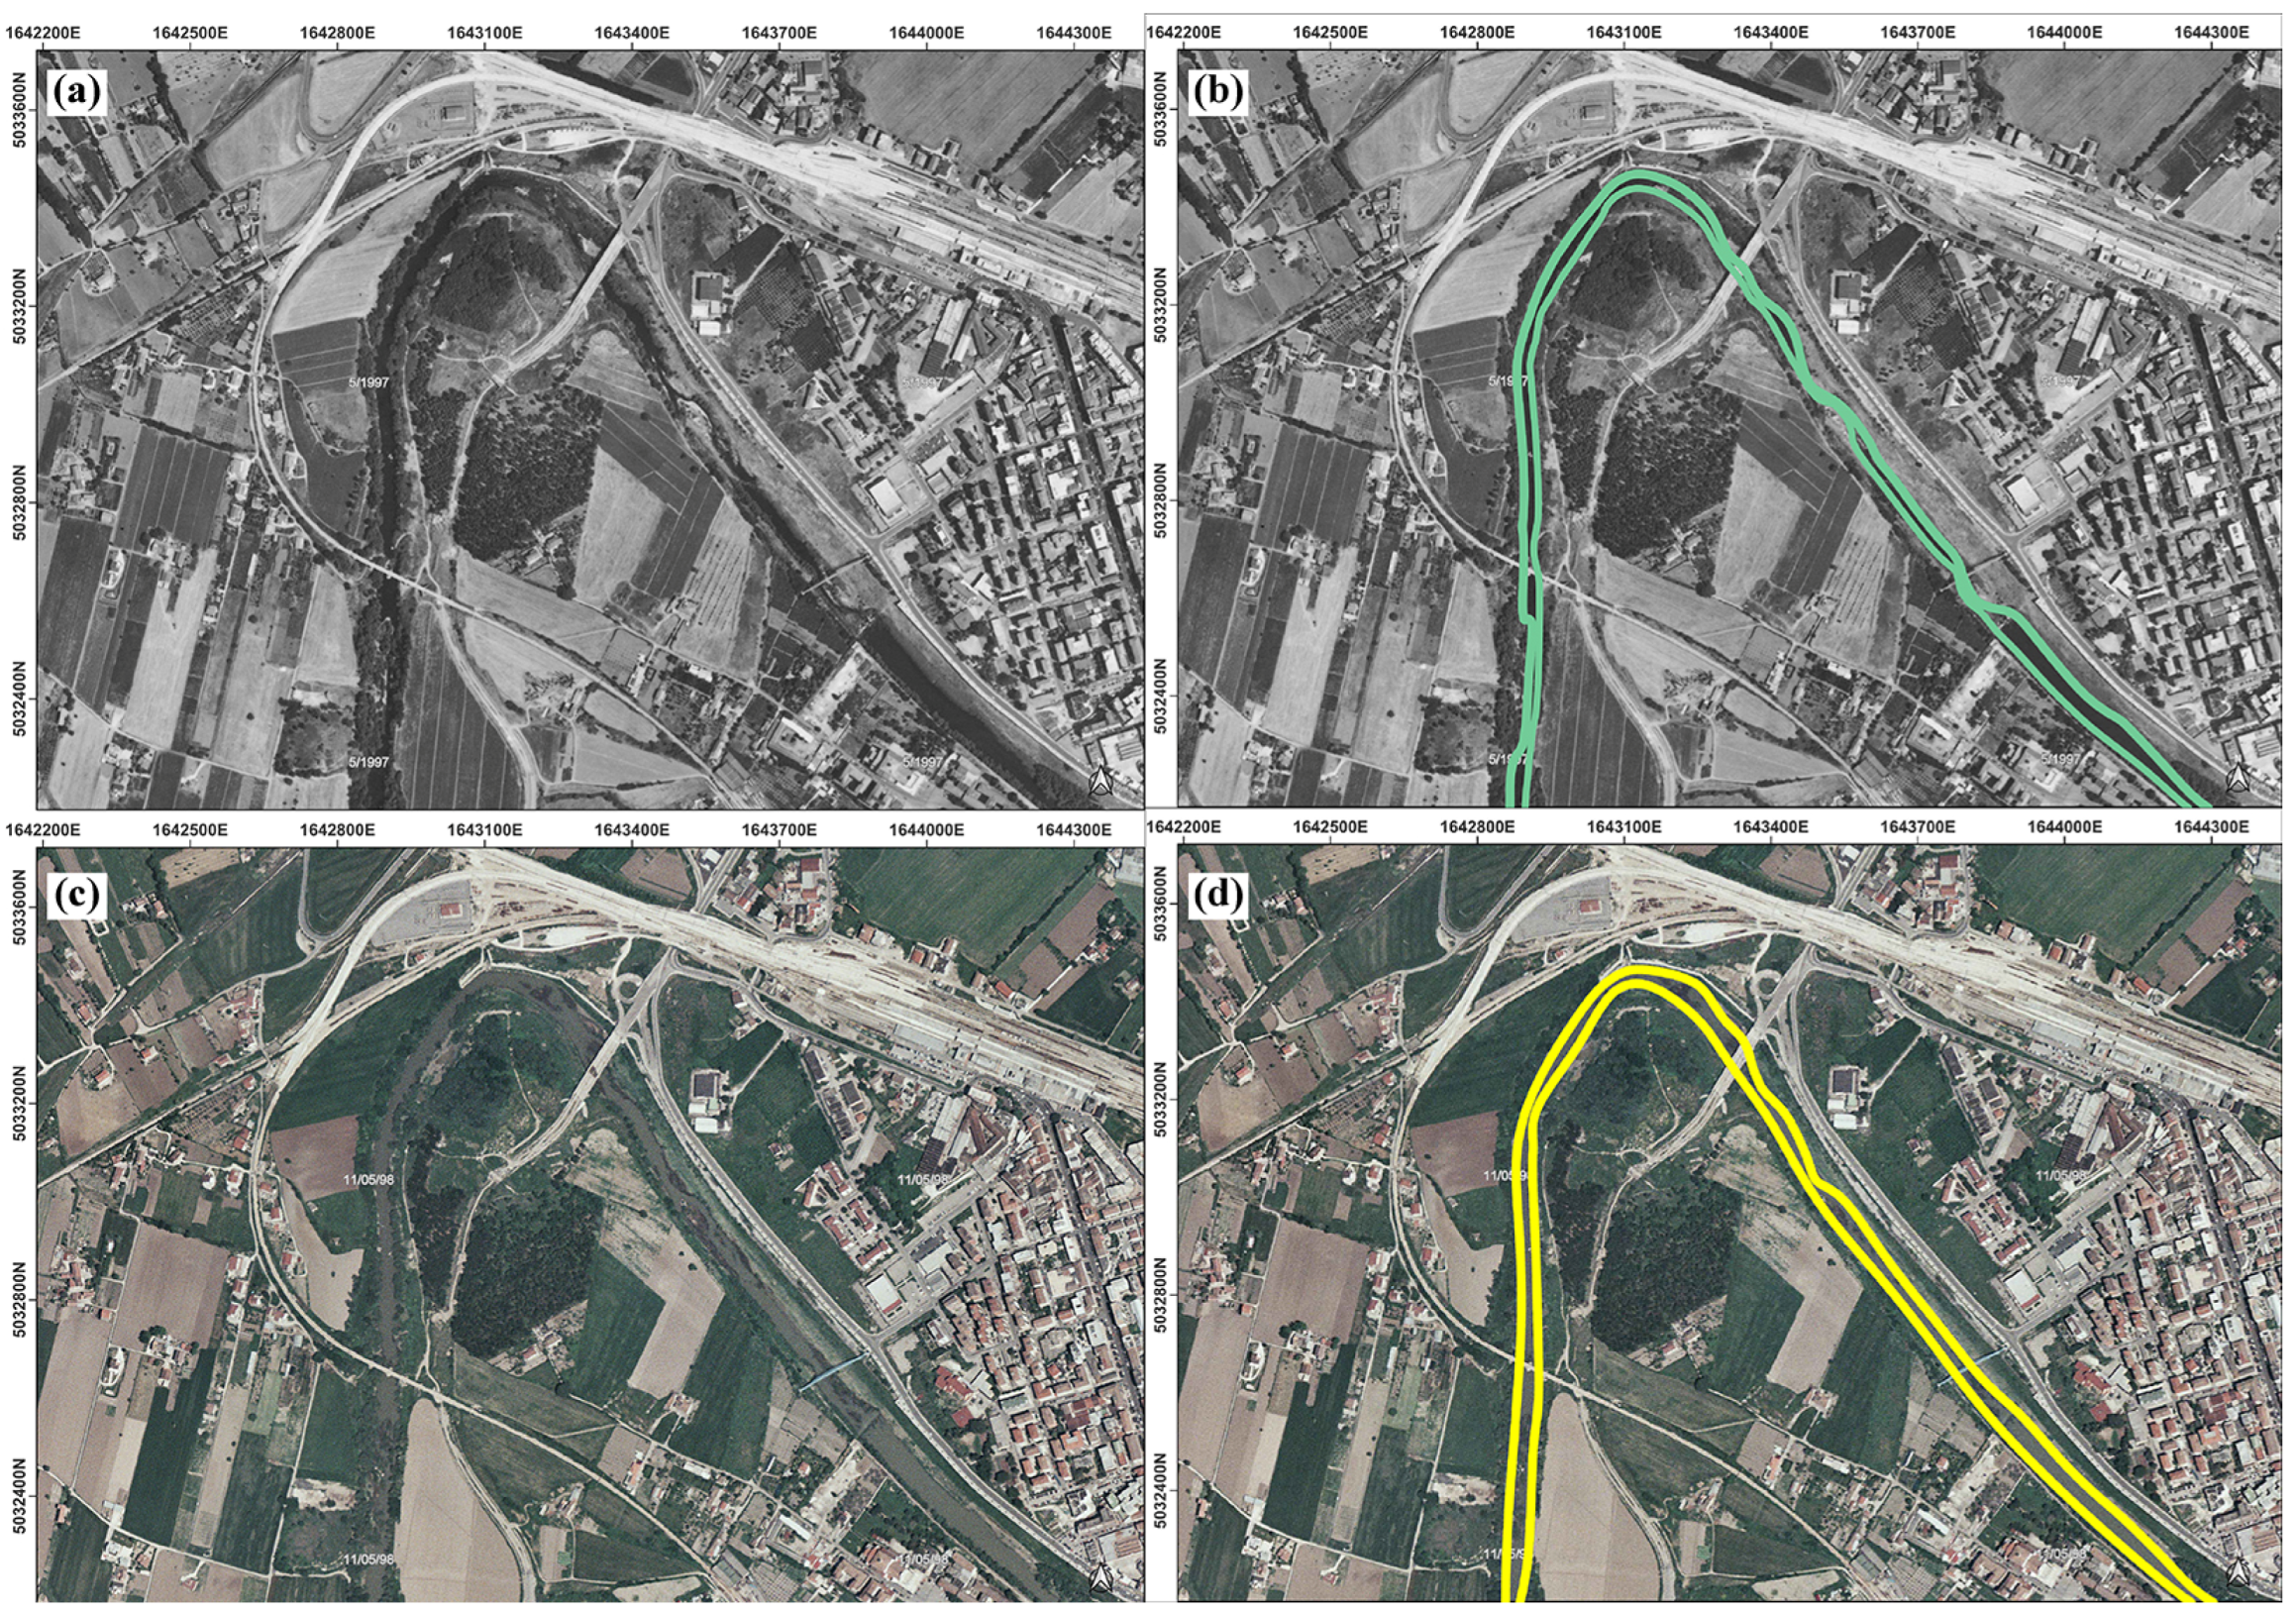
  • Aerial photo, 1994–1996 (1:10,000), NG-WMS (Figure 8a);
  • Aerial photo, 2000 (1:10,000), NG-WMS (Figure 8c);
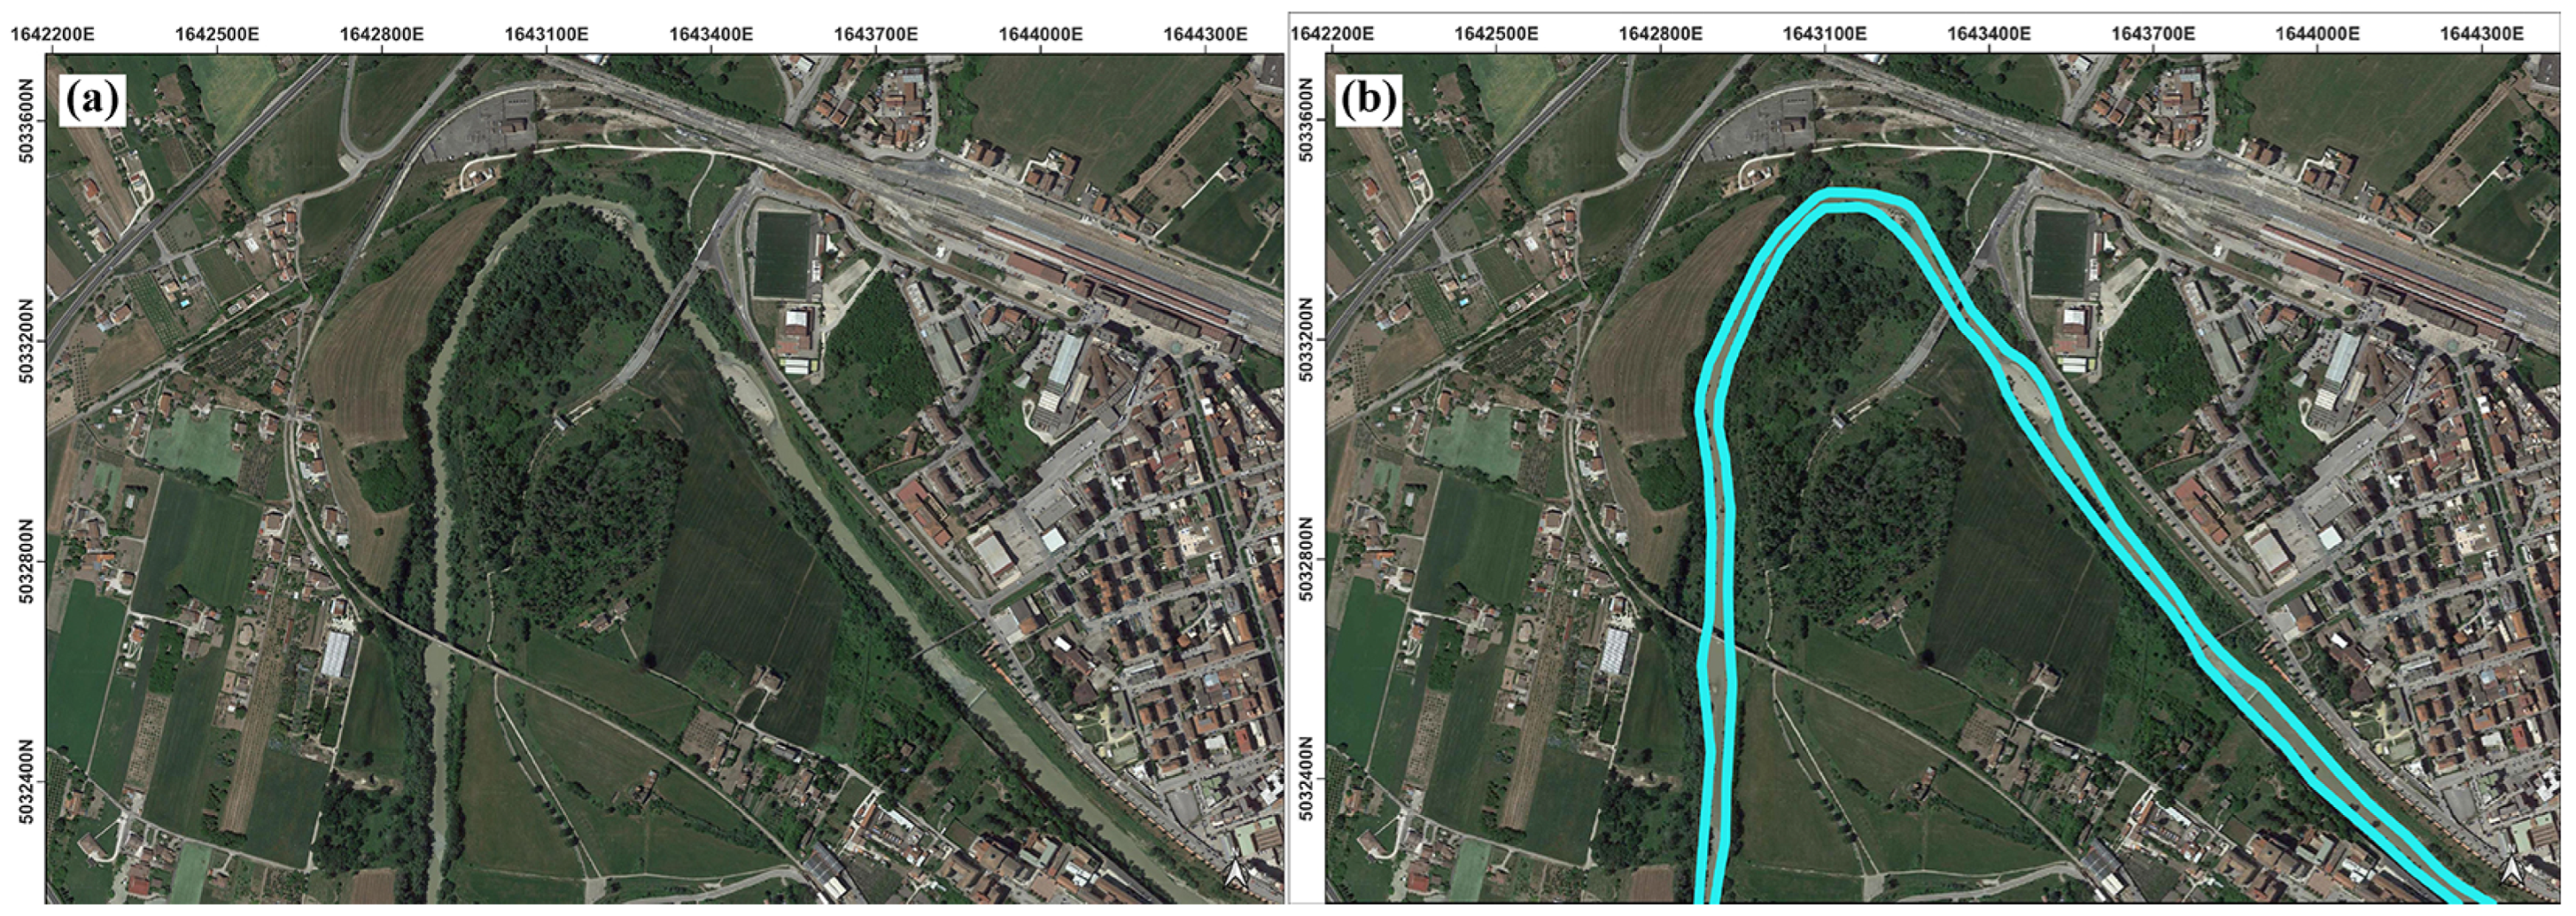
  • Satellite Image, 2022, GE (Figure 9).
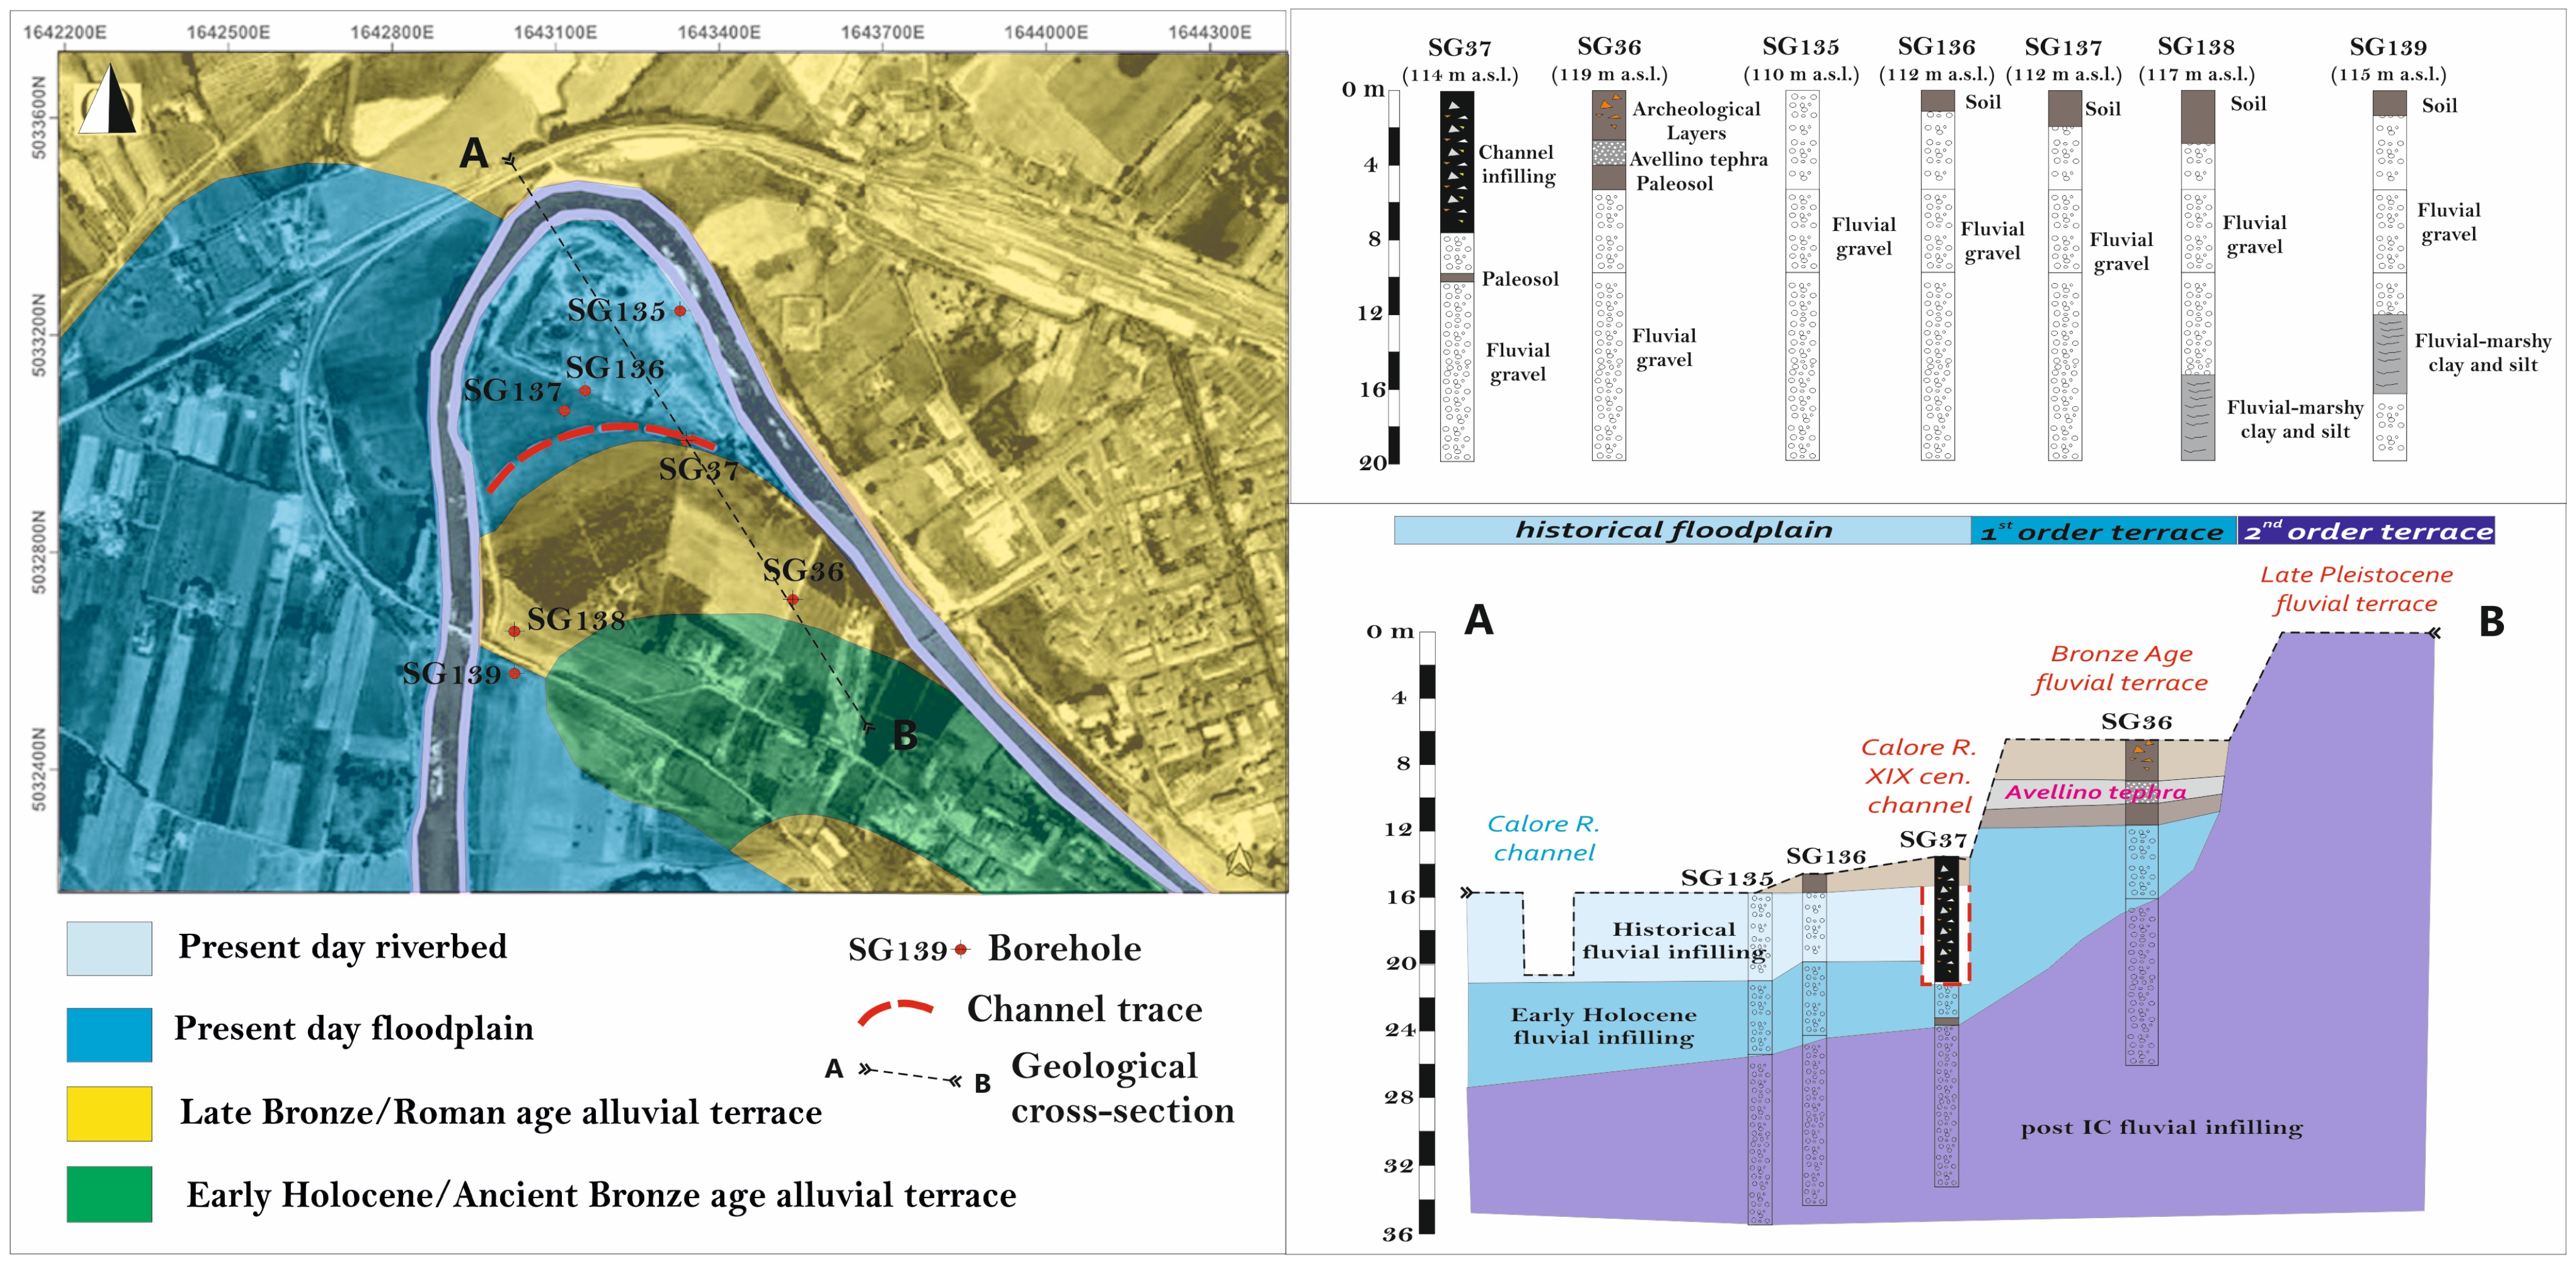
A direct interpretation of the morphology of the riverbed in proximity of the meander was carried out in a GIS environment (QGIS Geographic Information System (QGIS Development Team, 2024), Open Source Geospatial Foundation Project, V3.40.15, https://www.osgeo.org/, accessed on 25 April 2026)) through visual analysis and manually drawing its shape. The GIS database was enhanced and improved by stratigraphic data derived from approximately 250 boreholes, available at the Benevento City municipality [59]. Seven boreholes, located in the Cellarulo area, were used to support the stratigraphical framework of the study area (Figure 10).
Furthermore, geophysical prospections were planned around the archaeological site of Cellarulo in order to image buried structures using an indicator of a caesura, considered as a break in their distribution where one phase ends and another phase begins or as a border sign of an anthropization zone. This can provide details on the location of the riverbed in ancient times. To this end, electrical resistivity tomography (ERT) was applied over an area of 5.2 hectares. It experimentally determines the resistivity distribution, characterizing the electrical structure of the subsoil. In general, geoelectrical prospecting is less rapid than ground penetrating radar and magnetometric prospecting, but it has a considerably greater depth of investigation and a great ability to adapt to topographically difficult situations, as is precisely the case in some areas of Cellarulo, due to the presence of a dense and extensive pine forest.
To overcome the problem of the limited acquisition speed, in the prospecting in question, a data acquisition system, the ADD-01, specifically designed for archaeological prospections was used. It consists of two separate, light, portable boxes containing the measuring and control unit and the current generator, respectively, interconnected via a wireless radio frequency device. Designed primarily for archaeological investigation down to a few ten meters of depth, at most, it is characterized by a 50 W low power generator. A current sine wave is generated at a frequency selectable between 8 and 33 Hz in order to avoid any disturbance due to power lines and to obtain very rapid measurement times. The intensity of the exciting current can be selected on the control unit in the range 1 to 400 mA. To eliminate unwanted noise, the acquisition board contains a bandpass filter.
Approximately 500 dipolar geoelectrical profiles were carried out for an investigation depth of 3 m, vertical resolution of 0.5 m and horizontal resolution between 1 m and 3 m. The profiles, due to the difficult logistical conditions in which they operated, were located almost randomly within the area and geometrically detected by the topographical total station; the results were then subjected to a comparative analysis in order to obtain the so-called apparent resistivity maps, which are normally used in the analysis of geoelectric data. These, while providing a detailed representation of the distribution of resistivity anomalies, are only an indication of the real electrical situation of the investigated areas. To obtain, therefore, more rigorous information on the real depths and locations of the anomalies found, the data were subjected to a 3D tomographic inversion procedure. In this research, archaeological buried features have been imaged using Extended data-adaptive Probability-based Electrical Resistivity Tomography Inversion (E-PERTI) [60]. It is the latest development in the probability tomography approach, created specifically for geoelectric methods. The theory was initially created for the self-potential method [61] and then adjusted for the resistivity approach [62]. The basic technique did not estimate the intrinsic resistivities of the source bodies, but it was able to distinguish between high and low resistivities in the field datasets by considering a reference background resistivity. The method has been successfully used to map buried ancient structures [63] and identify faults [64].
A data-adaptive probability-based ERT inversion approach (PERTI) [65], which was directly derived from the concepts of probability tomography, was then used to estimate the genuine resistivities. From a probabilistic standpoint, the method, which takes a nonlinear approach, determines which of the set of possible solutions is most likely to be compatible with the dataset gathering technique. The literature has documented numerous uses of the PERTI technique in near-surface prospecting to address issues related to archaeological research [66,67].
Lastly, the E-PERTI method was developed to enhance robustness to noise and optimize resistivity estimates in comparison to the original PERTI. The PERTI technique uses both random and sequential vertical scanning and horizontal windowing inside the datum space to recover numerous different subsets of data from the apparent resistivity dataset [60]. Ultimately, the most likely resistivity in the same point, a more or less dense cluster of resistivity values in each point of the surveyed region, is predicted using an intrinsic linear regression model that employs ordinary least squares techniques. The E-PERTI technique was originally used to the characterization of a fortress wall [68] and a sunken ditch [69].

3. Results

3.1. Historical Map Analyses

The analysis and reinterpretation of the available data extracted from the literature and historical geographic maps, integrated with some new observations and data, highlighted a multi-temporal variation in the northern meander of Calore from 1824 to today.
As highlighted in [46], the analysis of the historical map of Monte S. Pietro with the date 1824, belonging to the Gregorian Cadastre, shows an islet at the top of the meander, and the latter seems to be located further south with respect to the following maps (Figure 4). It can also be identified in the topographic map, sheet IGMI 173 II (1870) (Figure 5a), with the general reconnaissance of November 1909 and with handwritten notes from 1911, while it disappears in the topographic map of 1870 (Figure 5b), with the general reconnaissance of November 1909 and partial reconnaissance of 1919. This means that, over the course of 10 years, a shift in the riverbed and in the parallel accumulation of debris brought by the waters occurred towards the northwest.
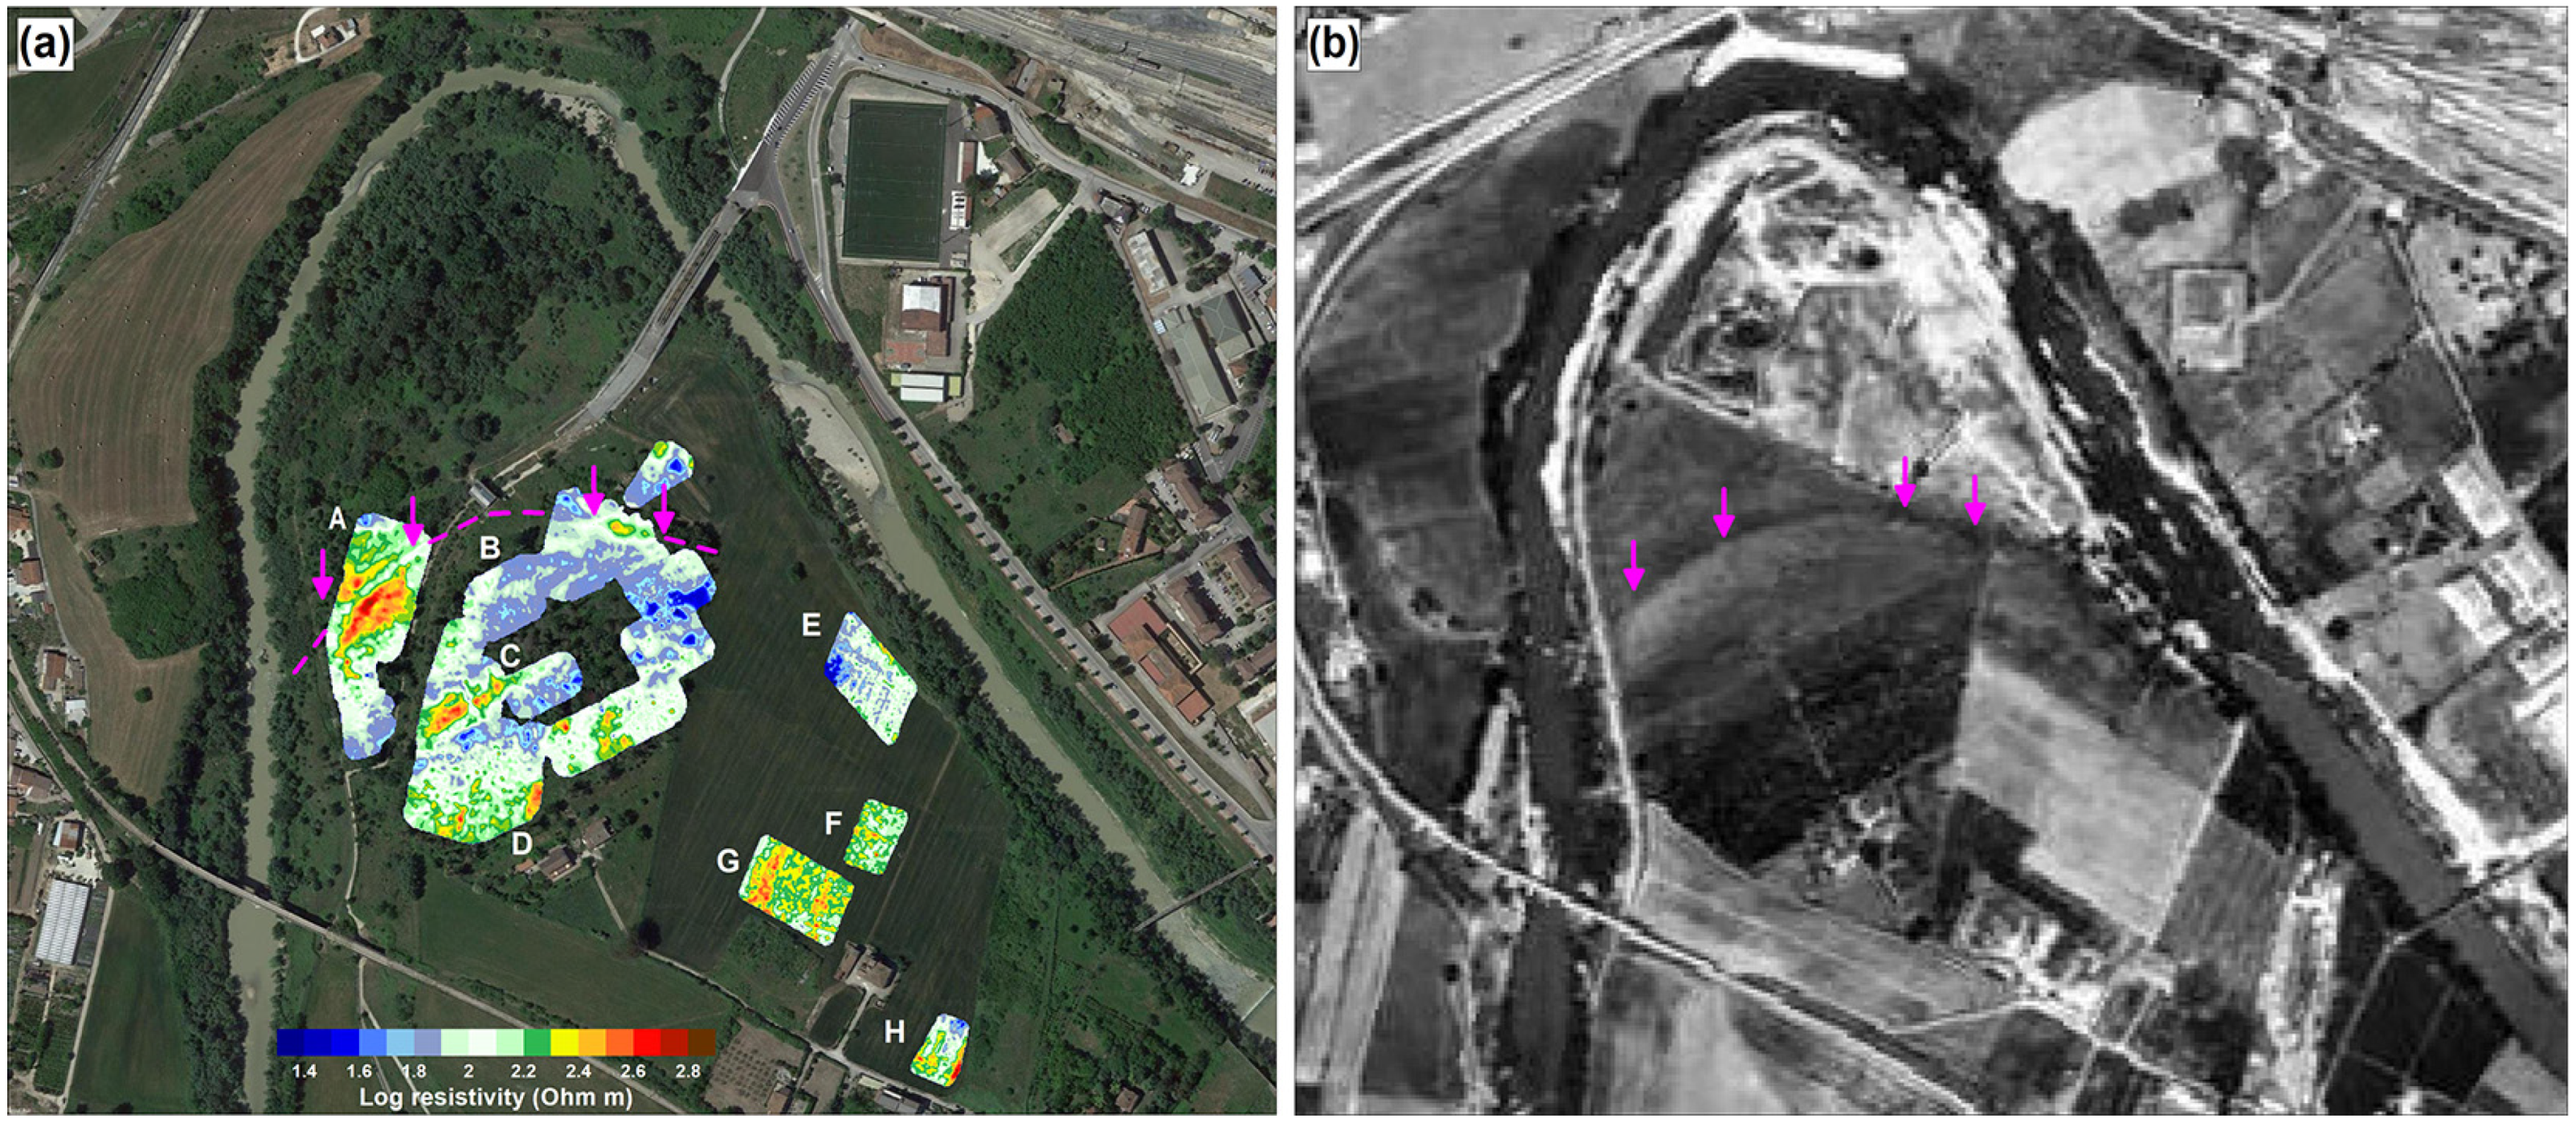
Aerial photos from 1945 and 1954 show a light-colored trace attributable to a terrace of alluvial deposits. The aerial photos of 1977 and 1985 highlight a dark trace of a semicircular shape with a diameter of approximately 275 m, which can be interpreted as a fossil meander of the river Calore or as an embankment along the course of the water. It is located immediately north of the archaeological area of Cellarulo.

3.2. Stratigraphical Features of the Area

Stratigraphical features of the area were established using borehole data. Figure 10 shows that the subsoil from the bottom to the top is made mainly of gravelly and sandy layers of fluvial environments with intercalation of thin clayey and silty layers of fluvial–marshy environments. In the upper part of the fluvial succession paleosols and volcanic layers are also present, such as Avellino tephra dated at ca. 3900 years ago [35], and archaeological layers dated between prehistoric time and the Late Ancient age (Borehole SG36 in Figure 10). Only in the SG37 boreholes, to the top of the fluvial succession is a thick layer made of anthropogenic infilling present. This borehole is located perfectly on the trace of ancient riverbed highlighted on the historical cartography. For this reason, it can be considered as infilling of the ancient channel. From a geomorphological point of view, the trace marks the boundary between the late Bronze Age alluvial terrace and present-day floodplain, confirming that the latter was generated after the Bronze Age (Figure 10).

3.3. Geophysical Surveys

For the geophysical results, the highest values of probability of occurrence of resistivity anomalies are present in the sections at depths of 1 m and 1.5 m. It is therefore presumable that structures are present in this depth interval. It is also noted that the probability of the presence of structures in the depth range between 2.5 m and 3 m is modest. Figure 11 shows the horizontal map relative to 1.5 m in depth of the apparent resistivities obtained with 1 m dipoles placed 2 m apart. This geometric configuration, among all those adopted, provided a good lateral resolution of the resistivity anomalies. To facilitate consultation of the resistivity maps, letters from A to H have been assigned to the most interesting areas found therein, which will be referred to in the following text.
Zone A shows an anomaly with high apparent resistivity containing an arc-shaped pattern inside. This trend manifests itself very clearly as an interruption of the high resistivity area, which can therefore be interpreted as the trace of a set of two circular-shaped structures parallel to each other. Corresponding to the continuation of the structures of the modern bridge, this circular anomaly seems to be interrupted, and instead, another high resistivity anomaly is noted approximately perpendicular to the lower side of the previously discussed area. This new anomaly then seems to continue and align with another resistive trend shown in area D. In zone B, in the westernmost part, we note the continuation of the high resistivity zone characterizing sector A. In the northernmost part, high resistivity anomalies are evident, which, especially for the lower part and as can also be deduced from the analysis of the zone E, are probably related to the traces of the circular structure described previously. In the easternmost part, however, we note the presence of a large low resistivity anomaly, which takes on a very regular and squared shape, the possible interpretation of which is the presence of humidity inside an excavation or much fractured wall structures.
Zone C shows the clearest resistivity anomaly. In fact, a set of two high resistivity anomalies with an almost rectangular shape is clearly evident. The main alignment is SW–NE. Of particular note is the low resistivity cut between the two sectors, whose extension towards the N coincides very clearly with the easternmost squared side of the high resistivity part of zone A.
The analysis of the western part of the surface investigated by geoelectric prospecting concludes with zone D. In this sector, especially in the southern part, numerous high resistivity anomalies are evident, which suggest the presence of a large number of buried structures. The most interesting feature of this area, however, is the set of three well-defined alignments with high resistivity and perfectly parallel to each other. The distance between the alignments is approximately 40–42 m.
In zone E, the main evidence is, in the northernmost part, a large high resistivity anomaly, which borders the river course. This anomaly can be interpreted as the effect of a wall structure or a road or even as one of the traces of the circular structure including the anomalies of areas A and B. Furthermore, a series of alignments between them are also clearly evident approximately perpendicular, which suggests the presence of a good number of buried structures.
Zone F is also characterized by relatively high resistivities. However, a high resistive trend is clearly visible in a central position and in a SE–NW direction. On the westernmost edge of the map, an alignment is just mentioned, also with high resistivity, which seems to be a continuation of an important anomaly present in sector G.
In the G sector, there is evidence of very important anomalies. In fact, two high resistivity alignments parallel to each other and having a direction of approximately 23°N are very evident. As in the case of the anomalies found in area D, despite small variations in direction, the distance between the axes of these alignments is approximately 40–42 m. It is also noted that the distance between the easternmost of these alignments and the intermediate of zone D is approximately 220 m, i.e., a distance comparable with a multiple of 5 of the fundamental element of 40–42 m. Other alignments are present perpendicularly, especially in the SE area, where the anomaly takes the direction of that found in zone F.
The last area investigated is zone H, where a very well-defined structure can be seen. In fact, wall intersections and voids between high resistivity segments are evident. The sharpness of the image suggests the presence of a very well preserved structure. In the easternmost part of the sector, a very high resistivity alignment is noted in the 23°N direction, the same as those described previously. We can therefore conclude that we are in the presence of a regular network of high resistivity anomalies, whose cadence is very clear from the general resistivity image.

4. Discussion

A thorough reconstruction of the morphodynamic evolution of the northern meander of the Calore River at the Cellarulo site was achieved through the interdisciplinary integration of historical cartography, aerial imagery, geological data, archaeological records, borehole stratigraphy, and geophysical investigations. The findings verify that throughout the past 150 years, the studied area has experienced substantial morphodynamic changes. The ancient river channel, formed after the Ancient Bronze Age (post-3.9 ka), migrated from its nineteenth-century position to its present-day location, as revealed by the diachronic cartographic analysis. An important geomorphological indicator of previous channel morphology and hydraulic circumstances is the existence of an islet shown on early historical maps. Its absence in later cartographic records points to a period of lateral migration and sediment infilling after channel stability. However, it should be mentioned that surveying constraints and scale-related distortions might lead to positioning errors in historical maps. However, in this work, we would like to highlight the existence of such a significant variation that is useful in the interpretation of early channel placements.
The morphodynamic evolution of the Calore River system was confirmed by remote sensing research, which was especially successful in locating paleochannel traces and abandoned meander loops. These paleochannels’ spatial continuity points to many migration episodes, which are probably related to changes in the sediment load and discharge regime.
The subsurface architecture of the floodplain was crucially constrained by geophysical research, especially electrical resistivity tomography. Heterogeneous alluvial deposits connected to subsurface channel bodies are compatible with the observed resistivity contrasts. The geophysical data represent complementary information used to support the interpretation of buried fluvial features and the subsurface architecture of the floodplain, rather than as an independent proof of the geomorphological reconstruction.
The incorporation of archaeological data into the geomorphological framework is another noteworthy result of this investigation. The construction of solid fluvial terraces and the gradual migration of the river channel appear to have had an impact on the spatial distribution of archaeological artifacts. However, the limited spatial coverage of current excavation data, which might not accurately reflect the original distribution of archaeological elements, continues to hinder the understanding of archaeological patterns.
The reconstructed channel movement patterns seen between 1985 and 2022 show persistent morphodynamic activity in the research area from a geomorphological standpoint. The meander system’s long-term mobility is confirmed by the cumulative representation of channel traces, which shows a steady migration tendency. These findings imply that the Calore River still has a considerable capacity for lateral adjustment, which could have consequences for infrastructure development, floodplain management, and the preservation of archaeological sites.

5. Conclusions

The multidisciplinary workflow adopted in this study enabled a detailed reconstruction of the morphodynamic evolution of the Calore River northern meander at the Cellarulo locality. The integration of historical cartography, multi-temporal remote sensing data, borehole stratigraphy and electrical resistivity investigations within a GIS framework proved effective in identifying both surface and subsurface signatures of channel migration and anthropogenic occupation.
The multi-temporal geomorphological reconstruction indicates a migration of the Calore River channel from at least the nineteenth century to the present day, characterized by localized shifts toward the northwest and northeast sectors of the meander apex. The recognition of semicircular and arcuate features from aerial photographs and LiDAR-derived datasets allowed the identification of fossil meanders and paleochannel remnants, confirming the high morphodynamic variability of the system during the late Holocene and historical period. The spatial correspondence between cartographic evidence and geomorphological boundaries supports the interpretation of terrace margins and abandoned channel belts.
Stratigraphic data derived from boreholes highlight a typical fluvial architecture composed of coarse gravelly and sandy channel deposits alternating with finer-grained overbank and marshy facies. The occurrence of paleosols, volcanic layers (including the Avellino tephra) and archaeological horizons constrains the chronological framework of floodplain development. In particular, the identification of anthropogenic infilling within boreholes located along mapped paleochannel traces confirms phases of channel abandonment followed by progressive sedimentation and anthropic reworking likely occurred during the nineteenth century. These observations also suggest that the present-day floodplain configuration developed after the Bronze Age, in agreement with regional geomorphological models.
Electrical resistivity tomography provided high-resolution subsurface imaging, revealing a complex pattern of resistivity anomalies concentrated mainly within the shallow depth interval between 1 m and 1.5 m. The geometry, continuity and regular spacing of several high-resistivity alignments suggest the presence of buried structural remains, likely related to organized anthropogenic layouts. In addition, the spatial coherence between resistivity anomalies and geomorphological features indicates a strong interaction between fluvial processes and human settlement dynamics.
Overall, this study proves that fluvial geomorphological and sedimentological methods are suitable approaches for reconstructing fluvial landscape evolution in archaeologically significant floodplain areas The approach adopted here not only improves the understanding of channel dynamics and paleogeographic evolution but also provides a reliable basis for predicting the location of buried archaeological features and for supporting future land-use planning and risk assessment in fluvial settings.

Author Contributions

Conceptualization, V.A., M.C., V.G. and P.M.; methodology, V.A., M.C., V.G. and P.M.; formal analysis, V.A., M.C., V.G. and P.M.; data curation, V.A., M.C., V.G. and P.M.; writing—original draft preparation, V.A., M.C., V.G. and P.M.; writing—review and editing, V.A., M.C., V.G. and P.M. All authors have read and agreed to the published version of the manuscript.

Funding

This research received no external funding.

Data Availability Statement

The original contributions presented in this study are included in the article. Further inquiries can be directed to the corresponding author.

Conflicts of Interest

The authors declare no conflicts of interest.

References

  1. Kondolf, G.M.; Piégay, H. Tools in fluvial geomorphology: Problem statement and recent practice. In Tools in Fluvial Geomorphology; Wiley: Chichester, UK, 2016; pp. 1–12. [Google Scholar]
  2. Brasington, J.; Rumsby, B.T.; McVey, R.A. Monitoring and modeling morphological change in a braided gravel-bed river using high resolution GPS-based survey. Earth Surf. Process. Landf. 2000, 25, 973–990. [Google Scholar] [CrossRef]
  3. Heritage, G.; Hetherington, D. Towards a protocol for laser scanning in fluvial geomorphology. Earth Surf. Process. Landf. 2007, 32, 66–74. [Google Scholar] [CrossRef]
  4. Alho, P.; Vaaja, M.; Kukko, A.; Kasvi, E.; Kurkela, M.; Hyyppä, J.; Hyyppä, H.; Kaartinen, H. Mobile laser scanning in fluvial geomorphology: Mapping and change detection of point bars. Z. Geomorphol. Suppl. Issues 2011, 55, 31–50. [Google Scholar] [CrossRef]
  5. Thorndycraft, V.R.; Benito, G.; Gregory, K.J. Fluvial geomorphology: A perspective on current status and methods. Geomorphology 2008, 98, 2–12. [Google Scholar] [CrossRef]
  6. Muller, E.; Decamps, H.; Dobson, M.K. Contribution of space remote sensing to river studies. Freshw. Biol. 1993, 29, 301–312. [Google Scholar] [CrossRef]
  7. Malthus, T.J.; Place, C.J.; Bennet, S.; North, S. An evaluation of the Airborne Thematic Mapper sensor for monitoring inland waters. In Proceedings of the Remote Sensing Society Meeting, Southampton, UK, 11–14 September 1995. [Google Scholar]
  8. Milton, E.J.; Gilvear, D.J.; Hooper, I.D. Investigating river channel changes using remotely sensed data. In Changing River Channels; Gurnell, A., Petts, G.E., Eds.; John Wiley & Sons: Chichester, UK, 1995; pp. 277–301. [Google Scholar]
  9. Lane, S.N.; Westaway, R.M.; Hicks, D.M.; Duncan, M.J. High resolution digital photogrammetry and image analysis for the measurement of large gravel-bed rivers. In Proceedings of the Annual Conference of the Remote Sensing Society, University of Leicester, Leicester, UK, 12–14 September 2000. [Google Scholar]
  10. Wealands, S.; Stewardson, M.; Gilvear, D.; Hacker, J.; Walker, J.; Downes, B.; Rutherford, I. Remote Sensing of Rivers: A Potential Contribution to the Murray–Darling Basin Sustainable Rivers Audit; University of Melbourne: Melbourne, Australia, 2008. [Google Scholar]
  11. Marcus, W.A.; Fonstad, M.A. Optical remote mapping of rivers at sub-meter resolutions and watershed extents. Earth Surf. Process. Landf. 2008, 33, 4–24. [Google Scholar]
  12. Carbonneau, P.E.; Bergeron, N.E.; Lane, S.N. Automated grain size measurements from airborne remote sensing for long profile measurements of fluvial grain sizes. Water Resour. Res. 2005, 41, W11426. [Google Scholar] [CrossRef]
  13. Carey, C.J.; Brown, A.G.; Challis, K.C.; Howard, A.J.; Cooper, L. Predictive modelling of multi-period geoarchaeological resources at a river confluence: A case study from the Trent–Soar, UK. Archaeol. Prospect. 2006, 13, 241–250. [Google Scholar] [CrossRef]
  14. Scorpio, V.; Surian, N.; Cucato, M.; Dai Prá, E.; Zolezzi, G.; Comiti, F. Channel changes of the Adige River (Eastern Italian Alps) over the last 1000 years and identification of the historical fluvial corridor. J. Maps 2018, 14, 680–691. [Google Scholar] [CrossRef]
  15. Arnaud, F.; Piégay, H.; Schmitt, L.; Rollet, A.J.; Ferrier, V.; Beal, D. Historical geomorphic analysis (1932–2011) of a by-passed river reach in process-based restoration perspectives: The Old Rhine downstream of the Kembs diversion dam (France/Germany). Geomorphology 2015, 236, 163–177. [Google Scholar] [CrossRef]
  16. Aucelli, P.P.C.; Fortini, P.; Rosskopf, C.M.; Scorpio, V.; Viscosi, V. Recent channel adjustments and riparian vegetation: Some examples from Molise (Italy). Geogr. Fis. Dinam. Quat. 2011, 34, 161–173. [Google Scholar]
  17. Comiti, F. How natural are Alpine mountain rivers? Evidence from the Italian Alps. Earth Surf. Process. Landf. 2012, 37, 693–707. [Google Scholar]
  18. Kiss, T.; Blanka, V. River channel response to climate- and human-induced hydrological changes: Case study on the meandering Hernád River, Hungary. Geomorphology 2012, 175–176, 115–125. [Google Scholar] [CrossRef]
  19. Latapie, A.; Camenen, B.; Rodrigues, S.; Paquier, A.; Bouchard, J.P.; Moatar, F. Assessing channel response of a long river influenced by human disturbance. Catena 2014, 121, 1–12. [Google Scholar] [CrossRef]
  20. Ollero, A. Channel changes and floodplain management in the meandering middle Ebro River, Spain. Geomorphology 2010, 117, 247–260. [Google Scholar] [CrossRef]
  21. Provansal, M.; Dufour, S.; Sabatier, F.; Anthony, E.J.; Raccasi, G.; Robresco, S. The geomorphic evolution and sediment balance of the lower Rhône River (southern France) over the last 130 years: Hydropower dams versus other control factors. Geomorphology 2014, 219, 27–41. [Google Scholar] [CrossRef]
  22. Rădoane, M.; Obreja, F.; Cristea, I.; Mihailă, D. Changes in the channel-bed level of the eastern Carpathian rivers: Climatic vs. human control over the last 50 years. Geomorphology 2013, 193, 91–111. [Google Scholar] [CrossRef]
  23. Magliulo, P.; Valente, A.; Cartojan, E. Recent geomorphological changes of the middle and lower Calore River (Campania, Southern Italy). Environ. Earth Sci. 2013, 70, 2785–2805. [Google Scholar] [CrossRef]
  24. Schwendel, A.C.; Milan, D.J.; Pope, R.J.J.; Williams, R.; Thompson, W. Using geophysical subsurface data for the reconstruction of valley-scale spatio-temporal floodplain evolution: Implications for upland river restoration. Geomorphology 2024, 466, 109459. [Google Scholar] [CrossRef]
  25. Nicholas, A.P. Modelling river and floodplain evolution using physics-based and reduced-complexity approaches. Earth Surf. Processes Landf. 2025, 50, e70008. [Google Scholar] [CrossRef]
  26. Birkhead, A.L.; Heritage, G.L.; White, H.; van Niekerk, A.W. Ground-penetrating radar as a tool for mapping the phreatic surface, bedrock profile, and alluvial stratigraphy in the Sabie River, Kruger National Park. J. Soil Water Conserv. 1996, 51, 234–241. [Google Scholar] [CrossRef]
  27. Corbeanu, R.M.; Soegaard, K.; Szerbiak, R.B.; Thurmond, J.B.; McMechan, G.A.; Wang, D.; Snelgrove, S.H.; Forster, C.B.; Menitove, A. Detailed internal architecture of a fluvial channel sandstone determined from outcrop, cores, and 3-D ground-penetrating radar: Example from the middle Cretaceous Ferron Sandstone, east-central Utah. AAPG Bull. 2001, 85, 1583–1608. [Google Scholar] [CrossRef]
  28. Gaswirth, S.B.; Ashley, G.M.; Sheridan, R.E. Use of seismic stratigraphy to identify conduits for saltwater intrusion in the vicinity of Raritan Bay, New Jersey. Environ. Eng. Geosci. 2002, 8, 209–218. [Google Scholar] [CrossRef]
  29. Brown, A.G. The Late Pleistocene sediment geometry of confluence migration: A major process of floodplain formation. In Proceedings of the GLOCOPH-IGCP 518 Meeting on Present and Past Fluvial Systems: Methods and Applications, Guarulhos/Maringá, Brazil, 25 August–2 September 2006; p. 30. [Google Scholar]
  30. Davidson, D.A. Geomorphology and archaeology. In Archaeological Geology; Rapp, G., Jr., Gifford, J.A., Eds.; Yale University Press: New Haven, CT, USA, 1985; pp. 25–55. [Google Scholar]
  31. Zhang, N.; Fryirs, K. A hierarchical method and workflow for the semi-automated mapping of valley bottom geomorphic units using publicly available remote sensing datasets. Earth Surf. Processes Landf. 2024, 49, 3524–3540. [Google Scholar] [CrossRef]
  32. Kemp, J.; Pietsch, T.J. Death of a palaeochannel: Slow abandonment of an avulsed channel on the Riverine Plains, SE Australia. Earth Surf. Processes Landf. 2024, 49, 567–581. [Google Scholar]
  33. Scorpio, V.; Comiti, F.; Liébault, F.; Piégay, H.; Rinaldi, M.; Surian, N. Channel changes over the last 200 years: A meta-analysis on European rivers. Earth Surf. Processes Landf. 2024, 49, 2651–2676. [Google Scholar] [CrossRef]
  34. Burrough, P.A.; McDonnell, R.A. Principles of Geographical Information Systems; Oxford University Press: Oxford, UK, 1998; p. 333. [Google Scholar]
  35. Vitek, J.D.; Giardino, J.R.; Fitzgerald, J.W. Mapping geomorphology: A journey from paper maps through computer mapping to GIS and virtual reality. Geomorphology 2008, 16, 233–249. [Google Scholar]
  36. Bishop, M.P.; James, L.A.; Shroder, J.F., Jr.; Walsh, S.J. Geospatial technologies and digital geomorphological mapping: Concepts, issues and research. Geomorphology 2012, 137, 5–26. [Google Scholar] [CrossRef]
  37. Magliulo, P.; Valente, A. GIS-based geomorphological map of the Calore River floodplain near Benevento (Southern Italy) overflooded by the 15th October 2015 event. Water 2020, 12, 148. [Google Scholar] [CrossRef]
  38. Angelone, F.; D’Onofrio, E.G.; Russo, F.; Valente, A.; Magliulo, P. Channel pattern medium-term changes in four rivers of Southern Italy: A summary. Geogr. Fis. Dinam. Quat. 2025, 48, 133–148. [Google Scholar] [CrossRef]
  39. Valente, A.; Iscaro, C.; Magliulo, P.; Russo, F. The flood event in Benevento on 14 th -15 th October 2015: A short report. Rend. Online Soc. Geol. It. 2016, 38, 105–108. [Google Scholar] [CrossRef]
  40. Amato, V.; Ciarcia, S.; Rossi, A.; Santoriello, A. The urban geoarchaeology of Benevento, southern Italy: Evaluating archaeological potential. Geoarchaeology 2018, 33, 100–111. [Google Scholar] [CrossRef]
  41. Ciarcia, S.; Vitale, S. Sedimentology, stratigraphy and tectonics of evolving wedge-top depozone: Ariano basin, southern Apennines, Italy. Sediment. Geol. 2013, 290, 27–46. [Google Scholar] [CrossRef]
  42. Senatore, M.R.; Boscaino, M.; Pinto, F. The Quaternary geology of the Benevento urban area (southern Italy) for seismic microzonation purposes. Ital. J. Geosci. 2019, 138, 66–87. [Google Scholar] [CrossRef]
  43. Chiocchini, U. Note Illustrative Della Carta Geologica D’italia Alla Scala 1:50.000. In Foglio 432 Benevento; Servizio Geologico d’Italia: Rome, Italy, 2007. Available online: https://www.isprambiente.gov.it/Media/carg/note_illustrative/432_Benevento.pdf (accessed on 9 June 2026).
  44. ISPRA. Carta Geologica D’italia Alla Scala 1:50.000. Foglio 432 Benevento e Note Illustrative; Chiocchini, U., Ed.; Servizio Geologico d’Italia: Rome, Italy, 2009. [Google Scholar]
  45. Amato, V.; Ciarcia, S.; Galli, P.; Cicchella, D.; Galderisi, A.; Monaco, L.; Fernandez, G.; Isaia, R.; Nomade, S.; Pereira, A.; et al. Unveiling the hidden source of major historical earthquakes: A multi-scale, trans-disciplinary approach to the 1456 and 1688 Sannio earthquakes (Mw 7.0, southern Italian Apennines). Quat. Sci. Rev. 2025, 356, 109282. [Google Scholar] [CrossRef]
  46. Pescatore, T.; Improta, L.; Romeo, R.; Iannaccone, G. Geologia della città di Benevento: Caratteristiche litostratigrafiche di base per una microzonazione sismica. Boll. Soc. Geol. Ital. 1996, 115, 307–324. [Google Scholar]
  47. Amato, V.; Aucelli, P.P.C.; Capozzi, A.; De Benedittis, G.F.; Pappone, G.; Rosskopf, C.M. Environmental changes in the Boiano intramontane basin (Molise, Italy) since the times of ancient Bovianum (IVth century BC). Alp. Mediterr. Quat. 2013, 26, 15–29. [Google Scholar]
  48. Amato, V.; Aucelli, P.P.C.; Cesarano, M.; Jicha, B.; Lebreton, V.; Orain, R.; Russo-Ermolli, E. Quaternary evolution of the largest intermontane basin of the Molise Apennine (central-southern Italy). Rend. Fis. Acc. Lincei 2014, 25, 197–216. [Google Scholar] [CrossRef]
  49. CPTI Working Group. Catalogo Parametrico dei Terremoti Italiani, Versione 2004 (CPTI04); INGV: Bologna, Italy, 2004. [Google Scholar] [CrossRef]
  50. Galli, P.; Galadini, F. Disruptive earthquakes revealed by faulted archaeological relics in Samnium (Molise, southern Italy). Geophys. Res. Lett. 2003, 30, 1266. [Google Scholar] [CrossRef]
  51. Pescatore, T.S.; Cinque, A.; Senatore, M.R.; Rosskopf, C. Historical-geological events and their impact on man. In Proceedings of the 32nd International Geological Congress, Florence, Italy, 29 August–2 September 2004. [Google Scholar]
  52. Sevink, J.; van Bergen, M.J.; van der Plicht, J.; Feiken, H.; Anastasia, C.; Huizinga, A. Robust date for the Bronze Age Avellino eruption (Somma-Vesuvius): 3945 ± 10 cal. B.P. (1995 ± 10 cal. B.C.). Quat. Sci. Rev. 2011, 30, 1035–1046. [Google Scholar] [CrossRef]
  53. Paradiso, S.; Tomay, L.; Amato, V. Reconstructing the ancient landscapes and environments along the Sabato River (Benevento, Southern Italy) since the Bronze Age: New geoarchaeological measurements. In Proceedings of the 1st International Conference on Metrology for Archaeology, Benevento, Italy, 22–23 October 2015. [Google Scholar]
  54. D’Argenio, A.; Pescatore, T.; Senatore, M.R.; Bisogno, G.; Tocco, G. Effects of natural events on ancient Benevento, Southern Italy. Rend. Accad. Sci. Fis. Mat. Napoli 2002, 69, 13–26. [Google Scholar]
  55. Senatore, M.R.; Boscaino, M. The history of Benevento and natural catastrophic events: Evidences from the sedimentary succession of Cellarulo. In Scienze Naturali e Archeologia; Aracne Editrice: Rome, Italy, 2010; pp. 221–225. [Google Scholar]
  56. Giampaola, D. Benevento: Dal centro indigeno alla colonia latina. In Studi sull’Italia dei Sanniti; La Regina, A., Ed.; Electa: Milano, Italy, 2000; pp. 36–46. [Google Scholar]
  57. Rotili, M.R. Benevento nella Tarda Antichità. In Dalla Diagnostica Archeologica in Contrada Cellarulo Alla Ricostruzione Dell’assetto Urbano; Pigna Editore: Naples, Italy, 2006. [Google Scholar]
  58. Tagliamonte, G. I Sanniti: Caudini, Irpini, Pentri, Carricini, Frentani; Longanesi Editore: Milan, Italy, 1996. [Google Scholar]
  59. Tomay, L. Benevento longobarda: Dinamiche insediative e processi di trasformazione. In Il Popolo dei Longobardi Meridionali (570–1076): Testimonianze Storiche e Monumentali; D’Henry, G., Lambert, C., Eds.; Gruppo Archeologico Salernitano: Salerno, Italy, 2009; pp. 119–151. [Google Scholar]
  60. Cozzolino, M.; Mauriello, P.; Patella, D. An extension of the data-adaptive probability-based electrical resistivity tomography inversion method (E-PERTI). Geosciences 2020, 10, 380. [Google Scholar] [CrossRef]
  61. Patella, D. Introduction to ground surface self-potential tomography. Geophys. Prospect. 1997, 45, 653–681. [Google Scholar] [CrossRef]
  62. Mauriello, P.; Patella, D. Resistivity anomaly imaging by probability tomography. Geophys. Prospect. 1999, 47, 411–429. [Google Scholar] [CrossRef]
  63. Minelli, A.; Cozzolino, M.; Di Nucci, A.; Guglielmi, S.; Giannantonio, M.; D’Amore, D.; Pittoni, E.; Groot, A.M. The prehistory of the Colombian territory: The results of the Italian archaeological investigation on the Checua site (Municipality of Nemocón, Cundinamarca Department). J. Biol. Res. 2012, 85, 94–97. [Google Scholar] [CrossRef]
  64. Valente, E.; Ascione, A.; Ciotoli, G.; Cozzolino, M.; Porfido, S.; Sciarra, A. Do moderate magnitude earthquakes generate seismically induced ground effects? The case study of the Mw = 5.16, 29 December 2013 Matese earthquake (southern Apennines, Italy). Int. J. Earth Sci. 2018, 107, 517–537. [Google Scholar] [CrossRef]
  65. Mauriello, P.; Patella, D. A data-adaptive probability-based fast ERT inversion method. Prog. Electromagn. Res. 2009, 97, 275–290. [Google Scholar] [CrossRef]
  66. Cozzolino, M.; Baković, M.; Borovinić, N.; Galli, G.; Gentile, V.; Jabučanin, M.; Mauriello, P.; Merola, P.; Živanović, M. The contribution of geophysics to the knowledge of the hidden archaeological heritage of Montenegro. Geosciences 2020, 10, 187. [Google Scholar] [CrossRef]
  67. Cozzolino, M.; Gentile, V.; Mauriello, P.; Peditrou, A. Non-destructive techniques for building evaluation in urban areas: The case study of the redesigning project of Eleftheria Square (Nicosia, Cyprus). Appl. Sci. 2020, 10, 4296. [Google Scholar] [CrossRef]
  68. Cozzolino, M.; Mauriello, P.; Patella, D. The extended data-adaptive probability-based electrical resistivity tomography inversion method (E-PERTI) for the characterization of the buried ditch of the ancient Egnazia (Puglia, Italy). Appl. Sci. 2022, 12, 2690. [Google Scholar] [CrossRef]
  69. Balossi Restelli, F.; Cozzolino, M.; Manuelli, F.; Mauriello, P. The characterization of the lower town of the UNESCO archaeological site of Arslantepe (Malatya, Türkiye) using the geophysical E-PERTI method (extended data-adaptive probability-based electrical resistivity tomography inversion method). Heritage 2025, 8, 37. [Google Scholar] [CrossRef]
Figure 1. Location of the Calore River in Cellarulo locality, indicated with the magenta dotted rectangle, northwest of Benevento, in the southern Apennines in Italy (top, left). Rivers are indicated with dashed light blue lines and the overlapping content represent the location of the study area on the map of Italy.
Remotesensing 18 02629 g001
Figure 2. Geology of Benevento: (a) in the geological map of southern Apennine, modified from [41]; (b) in the new geological map 1:50,000 in scale modified from [42].
Remotesensing 18 02629 g002
Figure 3. Anthropic occupation of the territory of Benevento over time (a) and a focus of archaeological finds in the area of Cellarulo (b). In (a) the blue polygon marks the Samnitic town (5th–3rd century BCE), green polygon the Roman town (3rd–1st century BCE), red polygon the Roman town (1st–4th century CE), and the yellow polygon the Longobard town (8th century CE), following [40].
Remotesensing 18 02629 g003
Figure 4. Historical cartography (drawing) of Monte San Pietro (Mount San Pietro), Città di Benevento (City of Benevento), 1824 (a) and indication of the trace of the river channel with blue (b). Source: State Archives of Rome, Pre-Unitary Bodies and Offices, General Presidency of Census 1816–1870, Archive of Maps and Census Cartography, Pio-Gregrorian Land Register, Room Instrument N. 277, Benevento Delegation 1823–1824, Monte San Pietro, N. 12, Authorization 2883-A of 20/05/2026.
Remotesensing 18 02629 g004
Figure 5. Topographic map, sheet 173 II, 1870, (1:50,000), «with general reconnaissance of November 1909 and with handwritten notes of 29 August 1911», IGMI (a) Topographic map, sheet 173 II, 1870, (1:50,000), «with general reconnaissance of November 1909 and partial reconnaissance of November 1919» and with handwritten notes of 20 October 1928, IGMI (c). Indication of the trace of the river channel with orange (b) and red (d) lines. Maps from the Italian Military Geographical Institute (Authorization n. 7276 of 24 April 2026).
Remotesensing 18 02629 g005
Figure 6. Aerial view, 22 May 1945, IGMI (a), and aerial view, 14 September 1954, from the Italian Military Geographical Institute (Authorization n. 7276 of 24 April 2026) (c). Indication of the trace of the river channel with green (b) and purple (d) lines.
Remotesensing 18 02629 g006
Figure 7. Aerial view, 15 September 1977 (a) and aerial photo, 1985 (1:14,000), CR (c). Indication of the trace of the river channel with pink (b) and magenta (d) lines. The arrows put in evidence the trace of the paleochannel.
Remotesensing 18 02629 g007
Figure 8. Aerial photos from 1994–1996 (1:10,000) (a) and 2000 (1:10,000) (c). Indication of the trace of the river channel with green (b) and yellow (d) lines.
Remotesensing 18 02629 g008
Figure 9. 2022 satellite image (1:10,000) (a) and indication of the trace of the river channel with light blue lines (b).
Remotesensing 18 02629 g009
Figure 10. Geology and geomorphology of Cellarulo area: borehole stratigraphy and geological cross-section.
Remotesensing 18 02629 g010
Figure 11. Resistivity map relative to 1.5 m in depth on the 2022 satellite image with the arc-shaped anomalies (indicated with the magenta dot line and arrows) (a) and comparison with the same trace on the 1985 aerial view (b). A–H letters indicate the investigated areas through geophysical prospections.
Remotesensing 18 02629 g011
Disclaimer/Publisher’s Note: The statements, opinions and data contained in all publications are solely those of the individual author(s) and contributor(s) and not of MDPI and/or the editor(s). MDPI and/or the editor(s) disclaim responsibility for any injury to people or property resulting from any ideas, methods, instructions or products referred to in the content.