Article

Remote Sensing-Based Identification of Sensitive Environmental Intervals Controlling Drought Propagation Time Across China

1
College of Earth and Environmental Science, Lanzhou University, Lanzhou 730000, China
2
State Key Laboratory of Frozen Soil Engineering, Northwest Institute of Eco-Environment and Resources, Chinese Academy of Sciences, Lanzhou 730000, China
*
Author to whom correspondence should be addressed.
Remote Sens. 2026, 18(15), 2615; https://doi.org/10.3390/rs18152615
Submission received: 29 June 2026 / Revised: 28 July 2026 / Accepted: 30 July 2026 / Published: 6 August 2026

Highlights

What are the main findings?
  • A multi-stage meteorological framework for drought–soil drought–groundwater drought propagation across China is constructed.
  • Cross-method RF, PDP/LOWESS, and SHAP analyses identify important factors and robust sensitive intervals of drought propagation time.
What are the implications of the main findings?
  • The results reveal sensitive intervals in which drought propagation time changes rapidly when important factors enter high-sensitivity ranges.
  • State-dependent sensitive intervals of important factors are incorporated into a drought early warning framework to better identify rapid changes in propagation time.

Abstract

Drought early warning is important for reducing agricultural production risks and ensuring regional water security. However, existing warning systems often focus on drought propagation probabilities and average propagation times, with insufficient attention to the identification of changes in propagation time. This study constructs a meteorological drought–soil drought–groundwater drought propagation chain and uses both Granger causality and the maximum positive correlation coefficient method to quantify stage-specific propagation time. Random forest, PDP/LOWESS, and SHAP analyses are then applied to identify important environmental factors and determine their cross-method sensitive intervals. The results show that PET, NDVI, mean annual precipitation, and temperature exhibit high importance across multiple regions and stages. Additionally, sensitive intervals in which important environmental factors significantly affect propagation time were found. In Stage 1 in North China, the effect of the NDVI on propagation time decreases after it exceeds about 0.1. In Stage 2 in Southeast China, temperatures around 17–18 °C are associated with shortened propagation times. The changes are inconsistent across regions and stages. When important factors enter or approach sensitive intervals, propagation time is more likely to change. The propagation time–important factor–sensitive interval analysis framework proposed in this study provides supplementary evidence for determining whether drought propagation time exhibits nonlinear sensitivity to important environmental factors. This framework provides a new perspective for assessing drought early warning needs. The identified sensitive intervals can help recognize environmental conditions associated with rapid changes in drought propagation time, providing additional information for drought risk assessment and region-specific early warning strategies.

1. Introduction

Droughts are one of the most destructive and widespread natural disasters globally [1]. Their high frequency, long duration, and various cascading effects not only seriously threaten agricultural production and food security but also have sustained negative impacts on water resource management and ecosystem stability [2,3]. In the context of global warming, extremely high temperatures and abnormal precipitation synergistically intensify the risks of drought and flooding [4,5,6,7]. The impacts of droughts often do not stay within a single system, but are continuously amplified through the compound process of propagation from meteorological drought to soil and hydrological drought [8]. Large-scale climate modes significantly regulate the global water–heat balance through atmospheric teleconnections, which in turn affect the occurrence and evolution of droughts [9,10]. At the same time, environmental conditions such as vegetation cover, soil properties, evapotranspiration demand, groundwater depth, and human activities also influence the transmission efficiency of drought across different stages [11,12,13]. Due to significant differences in the water–heat background and underlying surface conditions across different climate zones, the dominant factors of drought propagation and their effects often show notable regional differences [14].
Current drought early warning systems mainly focus on two aspects: first, the probability of occurrence between different types of droughts, and second, the average time required for droughts to propagate through stages. Existing studies typically estimate propagation probability and average propagation time based on different drought levels [15,16,17]. These studies [18,19,20] can reflect whether drought is likely to develop further and the approximate time it will take to reach the next stage, which is highly useful. However, for actual disaster prevention and mitigation, knowing only whether propagation will occur and the average propagation time is not enough. A more critical scientific question is why the propagation of meteorological drought sometimes proceeds slowly or even stops after it has occurred, while at other times, it accelerates significantly, causing soil drought or groundwater drought to arrive earlier than expected. Existing research has pointed out that in real propagation processes, the propagation time itself is uncertain and not fixed [21]. From a process perspective, drought propagation is essentially a nonlinear hydrological process regulated by underlying surface characteristics (such as vegetation, soil properties, and groundwater depth). Different underlying surfaces and ecological hydrological conditions can change the efficiency of drought signal transmission [12,22,23]. A slight change in certain environmental factors may significantly speed up the transmission of drought signals [24], shortening the propagation time and causing soil drought to occur earlier than originally expected, thus disrupting existing warning and control systems and increasing socio-economic and ecological losses.
China is vast, spanning multiple climate zones, including arid, semi-arid, semi-humid, and humid regions. There are significant differences in precipitation conditions, evapotranspiration intensity, vegetation cover, soil water storage capacity, and groundwater utilization across different regions. These differences make the drought propagation process highly regionally complex [16,25,26]. Previous studies have shown that drought propagation time in most basins in northern China is generally longer than in the south [27]. In North China and the central–eastern regions, extreme groundwater droughts are often influenced by factors beyond just precipitation deficits [28]. Drought propagation in different regions of China does not follow a unified or stable time rhythm [27,29]. If early warning still primarily relies on average propagation times, it may be difficult to timely identify the risk of propagation time suddenly shortening or an earlier shift in drought stages in certain regions. This is especially true in agriculture-intensive areas, monsoon fringe regions, and areas with higher groundwater dependence [30]. Once meteorological drought propagates more rapidly to the soil drought or groundwater drought stage, it could directly affect soil water supply, crop growth processes, irrigation arrangements, and regional water supply security [31,32]. Since soil drought is an important intermediary between meteorological drought and agricultural drought, its development speed is often directly related to the worsening of soil moisture conditions and the timing of crop water stress. Therefore, an earlier propagation time not only means an accelerated drought impact chain but also indicates a shortened time for agricultural production to respond. Considering that major grain-producing regions face long-term groundwater over-extraction and the combined pressure of drought [33], analyzing changes in drought time is crucial for agricultural production and regional water resource stability in such regions with significant regional differences and high water pressure [34].
Therefore, an important issue in current research is which important factors during the drought propagation process reach certain sensitive intervals that significantly change the propagation time. Identifying these important factors and their sensitive intervals would enable drought early warning systems to not only determine whether propagation will occur and its average duration, but also further assess whether propagation time could be shortened under current environmental conditions. This would provide more direct evidence for the urgency of early warning. In light of this, this study focuses on the two-stage drought propagation time in China. Using multi-source data from 2003 to 2024, a meteorological drought–soil drought–groundwater drought propagation chain is constructed. The main questions addressed are as follows: (1) Which environmental factors are most important for the speed of propagation in different regions? (2) Do these important factors have sensitive intervals that significantly shorten or lengthen the propagation time? This study aims to provide new perspectives for understanding regional differences in drought propagation time and improving drought risk monitoring, rather than identifying universally fixed physical thresholds.

2. Materials and Methods

2.1. Study Area

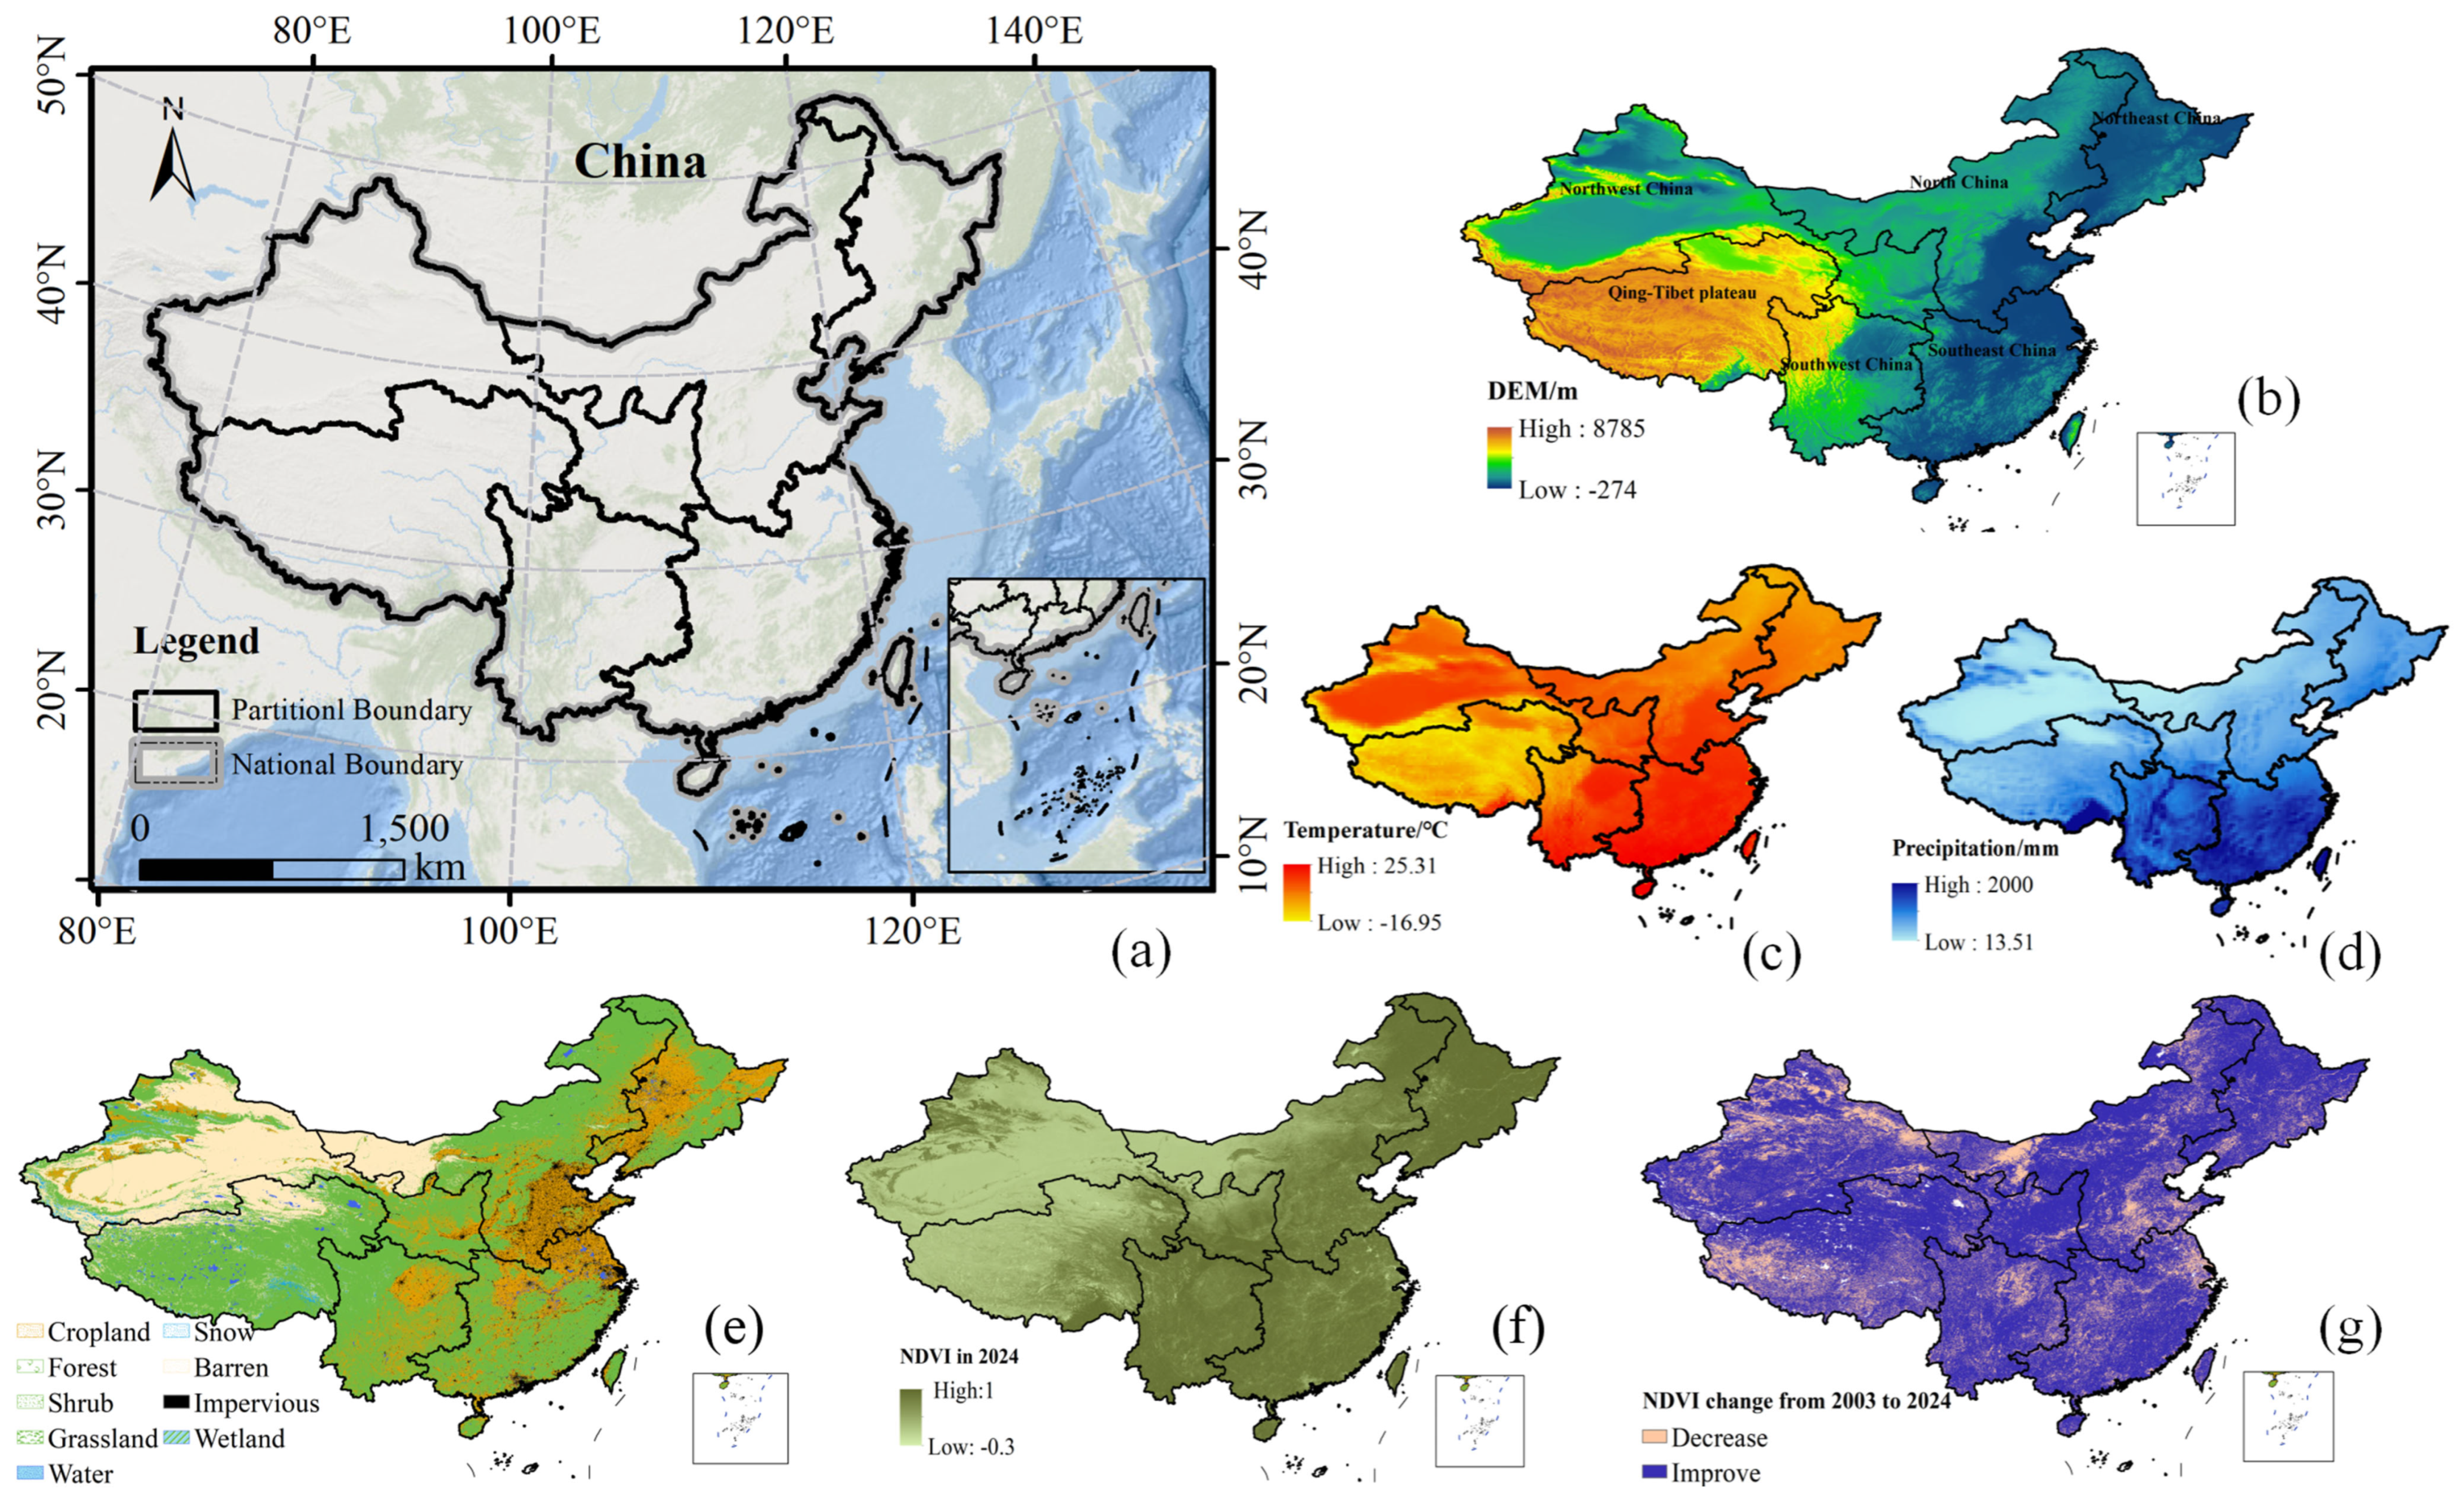
This study focuses on mainland China, which features complex terrain, diverse land cover types, and pronounced spatial heterogeneity in climate. Topographically, the country generally exhibits a northwest high–southeast low pattern (Figure 1b). In terms of land cover, croplands dominate the eastern and northeastern regions, forests are concentrated in the southern and northeastern mountainous areas, grasslands are widespread in the north and west, and deserts or sparsely vegetated areas prevail in the arid northwest and the Tibetan Plateau (Figure 1e). Climatic conditions also display clear spatial differentiation, with notable variations in mean temperature and precipitation across regions during 2003–2024 (Figure 1c,d). Vegetation coverage shows marked regional differences as well: the 2024 NDVI indicates higher vegetation coverage in the humid southeastern regions and lower coverage in the arid northwest (Figure 1f). Furthermore, the NDVI difference between 2024 and 2003 shows that vegetation has generally increased nationwide, although some areas experienced degradation (Figure 1g). These variations in topography, climate, land cover, and vegetation collectively provide an important environmental context for the study of drought propagation in China.
Based on natural geographic and climatic characteristics, China is divided into six major regions (Figure 1a), collectively covering humid monsoon zones, semi-arid transition zones, arid inland regions, and high-cold environments. Northeast China (NE) lies within the eastern monsoonal belt. North China (NC) is semi-arid, characterized by concentrated precipitation events and severe groundwater over-extraction. Southeast China (SE) is subtropical humid, with rapid soil–groundwater exchange processes. Northwest China (NW) comprises arid and semi-arid zones, while Southwest China (SW) features highly complex terrain and heterogeneous climatic conditions. Finally, the Tibetan Plateau (TP) represents a high-cold environment in which unique meltwater recharge and “storage–delayed release” processes exert a profound influence on drought propagation patterns [10,35].

2.2. Data Sources

This study uses a combination of multi-source reanalysis products and satellite-derived datasets. To ensure spatial comparability across all datasets, all data are resampled to a unified spatial resolution of 0.25° × 0.25° using bilinear interpolation, and all data are converted to monthly scale series. The study period selected is from 2003 to 2024, mainly because it covers the common time range of multi-source high-precision observation and reanalysis products (such as GRACE groundwater, GLDAS soil moisture, ERA5 precipitation, etc.), ensuring data consistency and comparable accuracy, while avoiding interference from non-climate signals caused by early observational errors and processing differences. The data sources are listed in Table 1 below.

2.3. Drought Index Calculation

The standardized indices (SPI, SSI, GWSA-DSI) are calculated by determining the relative deviation from the multi-year monthly values of different data sources. This method effectively eliminates differences in physical dimensions between variables, as well as seasonal and climate background interference, making the abnormal signals of meteorological, soil moisture, and groundwater processes statistically comparable. The Standardized Precipitation Index (SPI) [15] characterizes meteorological drought based on precipitation anomalies. The calculation formula is as follows:
S P I n =   ϕ 1 [ F Γ , m i = 0 n 1 p t i ]
where S P I n : denotes the SPI at a time scale of n months; ϕ 1 denotes the inverse standard normal CDF (probit transformation); F Γ , m denotes the Gamma cumulative distribution function fitted to the precipitation series for month m; and p t i is the precipitation in month ti.
The SSI is based on soil moisture anomalies [36] and is suitable for characterizing soil drought. The calculation formula is as follows:
S S I n =   ϕ 1 [ F m 1 n S M ]
where S S I n denotes the standardized soil moisture index at a time scale of n months; ϕ 1 the inverse cumulative distribution function of the standard normal distribution; F m the empirical cumulative distribution function of month m based on the climate reference period; and 1 n S M the average soil moisture of the previous n months.
The GWSA-DSI [15] characterizes groundwater drought conditions. The calculation formula is as follows:
G W S A - D S I n =   ϕ 1 ( F m 1 n i = 0 n 1 [ T W S A t i S W S A t i S W E A t i ) ) , m = m o n t h ( t )
where G W S A - D S I n is the standardized groundwater drought index at a time scale of n months; F m the empirical cumulative distribution function for month m; ϕ 1 the inverse cumulative distribution function of the standard normal distribution; T W S A t i the total water storage anomaly in month ti; S W S A t i the soil water storage anomaly (sum of four soil layers) in month ti; and S W E A t i snow water equivalent anomaly in month ti.

2.4. Quantification of Drought Propagation Time and Robustness Assessment

2.4.1. GC-Based Propagation Time

To identify the propagation time between different drought stages, this study uses a Granger causality test [26] to analyze the propagation time between meteorological drought–soil drought and soil drought–groundwater drought stages. The results of augmented Dickey–Fuller (ADF) tests, which assess the stationarity of the input time series, are provided in the Supplementary Materials. In the main analysis, however, the original, non-detrended series were used to ensure that the input data reflect the physically meaningful, real-world variability of each drought index. Let Xt and Yt represent the drought index time series of two adjacent drought stages. For a given lag order p, the unrestricted Granger causality model is expressed as
Y t = c + i = 1 p α i Y t i + i = 1 p β i X t i + ε t
where c is the intercept term, p is the lag order, Y t i and X t i are the i-month lagged values of Y t and X t , respectively, α i and β i are the corresponding regression coefficients, and ε t is the residual term. In this study, the lag order p was set from 1 to 12 months. Because the objective of this study was to identify the most significant drought propagation time within a physically meaningful hydrological response window, the Granger causality test was conducted separately for each lag order from 1 to 12 months. The lag order with the smallest SSR F-test p-value among those passing the significance level of α = 0.05 was selected as the main propagation time of the drought signal between adjacent stages. To reduce the risk of false positive causal detections caused by multiple grid cell-level tests, Benjamini–Hochberg false discovery rate (FDR) correction was applied to the p-values of all valid grid cells for each propagation stage, and only grid cells with FDR-adjusted p-values less than 0.05 were considered significant. The Granger causality framework was used to identify lagged statistical connections between adjacent drought types. Stage 1 represents the propagation from meteorological drought to soil drought, where the SPI is used as the driving drought signal and the SSI is used as the responding drought signal. Stage 2 represents the propagation from soil drought to groundwater drought, where the SSI is used as the driving drought signal and the GWSA-DSI is used as the responding drought signal. The propagation time identified by GC reflects the time lag required for upstream drought signals to be statistically transmitted to downstream drought types.

2.4.2. Correlation-Based Propagation Time

Calculating drought propagation time using the maximum correlation coefficient method involves identifying the lag month when the statistical relationship between the two is the strongest and defining that as the drought propagation time. Based on this, this article uses the maximum positive correlation coefficient, and the formula is as follows:
r k = t = 1 n k X t X ¯ k Y t + k Y ¯ k t = 1 n k X t X ¯ k 2 t = 1 n k Y t + k Y ¯ k 2
In the formula, r k represents the Pearson correlation coefficient between the upstream drought index and the downstream drought index with a lag of k months; k is the lag time in months; n is the length of the monthly time series; X ¯ k and Y ¯ k are the means of Xt and Yt used in the paired calculation at a lag of k months. In this study, the lag window was set to 1–12 months. Because the drought indices were analyzed monthly, a common 1–12-month lag window was used for both methods to cover an annual hydrological cycle while limiting longer-term low-frequency interference and preserving sample availability, estimation stability, and cross-method comparability. The correlation coefficient was calculated month by month within this window. The drought propagation time is defined as the lag month corresponding to the peak positive correlation coefficient:
T c o r r = a r g m a x k 1 , 12 r k , r k > 0
Here, Tcorr represents the drought propagation time calculated based on the maximum correlation coefficient method. For each valid grid point, we calculate the Pearson correlation coefficient for lags of 1–12 months and pick the lag month corresponding to the highest positive correlation as the drought propagation time for that grid point. If no positive correlation was identified within the 1–12-month lag window, the grid cell was excluded from the correlation-based propagation time results. Grid points with insufficient valid months are also not included in the calculation. After calculating the lagged correlations and deriving a grid-cell-level significance (p)-value for the maximum positive correlation, the Benjamini–Hochberg false discovery rate correction was applied separately for each propagation stage, and only grid cells with FDR-adjusted (p)-values below 0.05 were retained.
To quantify the difference between the two propagation time definitions, we calculated regional and stage-specific statistics based on paired valid grid cells, including mean difference, median difference, mean absolute difference, RMSE, Pearson and Spearman correlations, and the proportions of grid cells with absolute differences exceeding 2, 4, and 6 months (Supplementary Table S3).

2.5. Analysis of Important Factors Influencing Drought Propagation Time

RF attribution analyses were conducted separately using the GC-derived and correlation-derived propagation times as response variables. The same predictors, regional divisions, model settings, and validation procedures were used for both analyses, allowing direct comparison of factor-importance rankings under the two propagation time definitions. Within this framework, random forests (RFs), Partial Dependence Plots (PDPs), and SHAP were used to identify the statistical associations between environmental factors and the spatial variation in drought propagation time. Random forests are used to represent the relative explanatory contribution of different environmental factor groups to the spatial variation in propagation time [37]. Given the potential correlation between regional-scale environmental variables, the interpretation of variable importance in this study is limited to the relative dominance within the model framework, rather than being equivalent to a strict causal effect decomposition. A regression model is used to identify the important influencing factors of drought propagation. For each study zone propagation stage Sj, the following nonlinear mapping function is constructed:
P r o p a g a t i o n   t i m e S i = f X c l i m a t e , X l a n d , X h u m a n + ε
where P r o p a g a t i o n   t i m e S i represents the drought propagation time; X is the vector of meteorological, underlying surface, and human activity factors; and ε represents the residual error term, which captures the random variation and unobserved factors affecting drought propagation time that cannot be explained by the selected predictors. The model uses Bootstrap sampling and Out-of-Bag validation mechanisms. The permutation importance index is used to quantify the contribution of each factor to the spatial variation in lag time, thereby selecting the important factors for each region.

2.6. Analysis of Sensitive Intervals for Important Factors

Standard Partial Dependence Plots (PDPs) visualize the marginal effects of features on prediction targets. However, they often overlook heterogeneity caused by feature interactions. To verify the robustness of the identified thresholds, SHAP [38] values were introduced. These values characterized the contribution of individual samples to the prediction results. Locally Weighted Scatter Plot Smoothing (LOWESS) curves were superimposed on the SHAP scatter plots. Subsequently, a comparative analysis was conducted with centered PDPs. The SHAP formula is expressed as follows:
f x = ϕ 0 + j = l M ϕ j
where ϕ 0 represents the baseline value of the model, which is the expected value of the prediction results for all samples; M denotes the total number of input features; and ϕ j is the SHAP contribution value of the j feature to the prediction result.
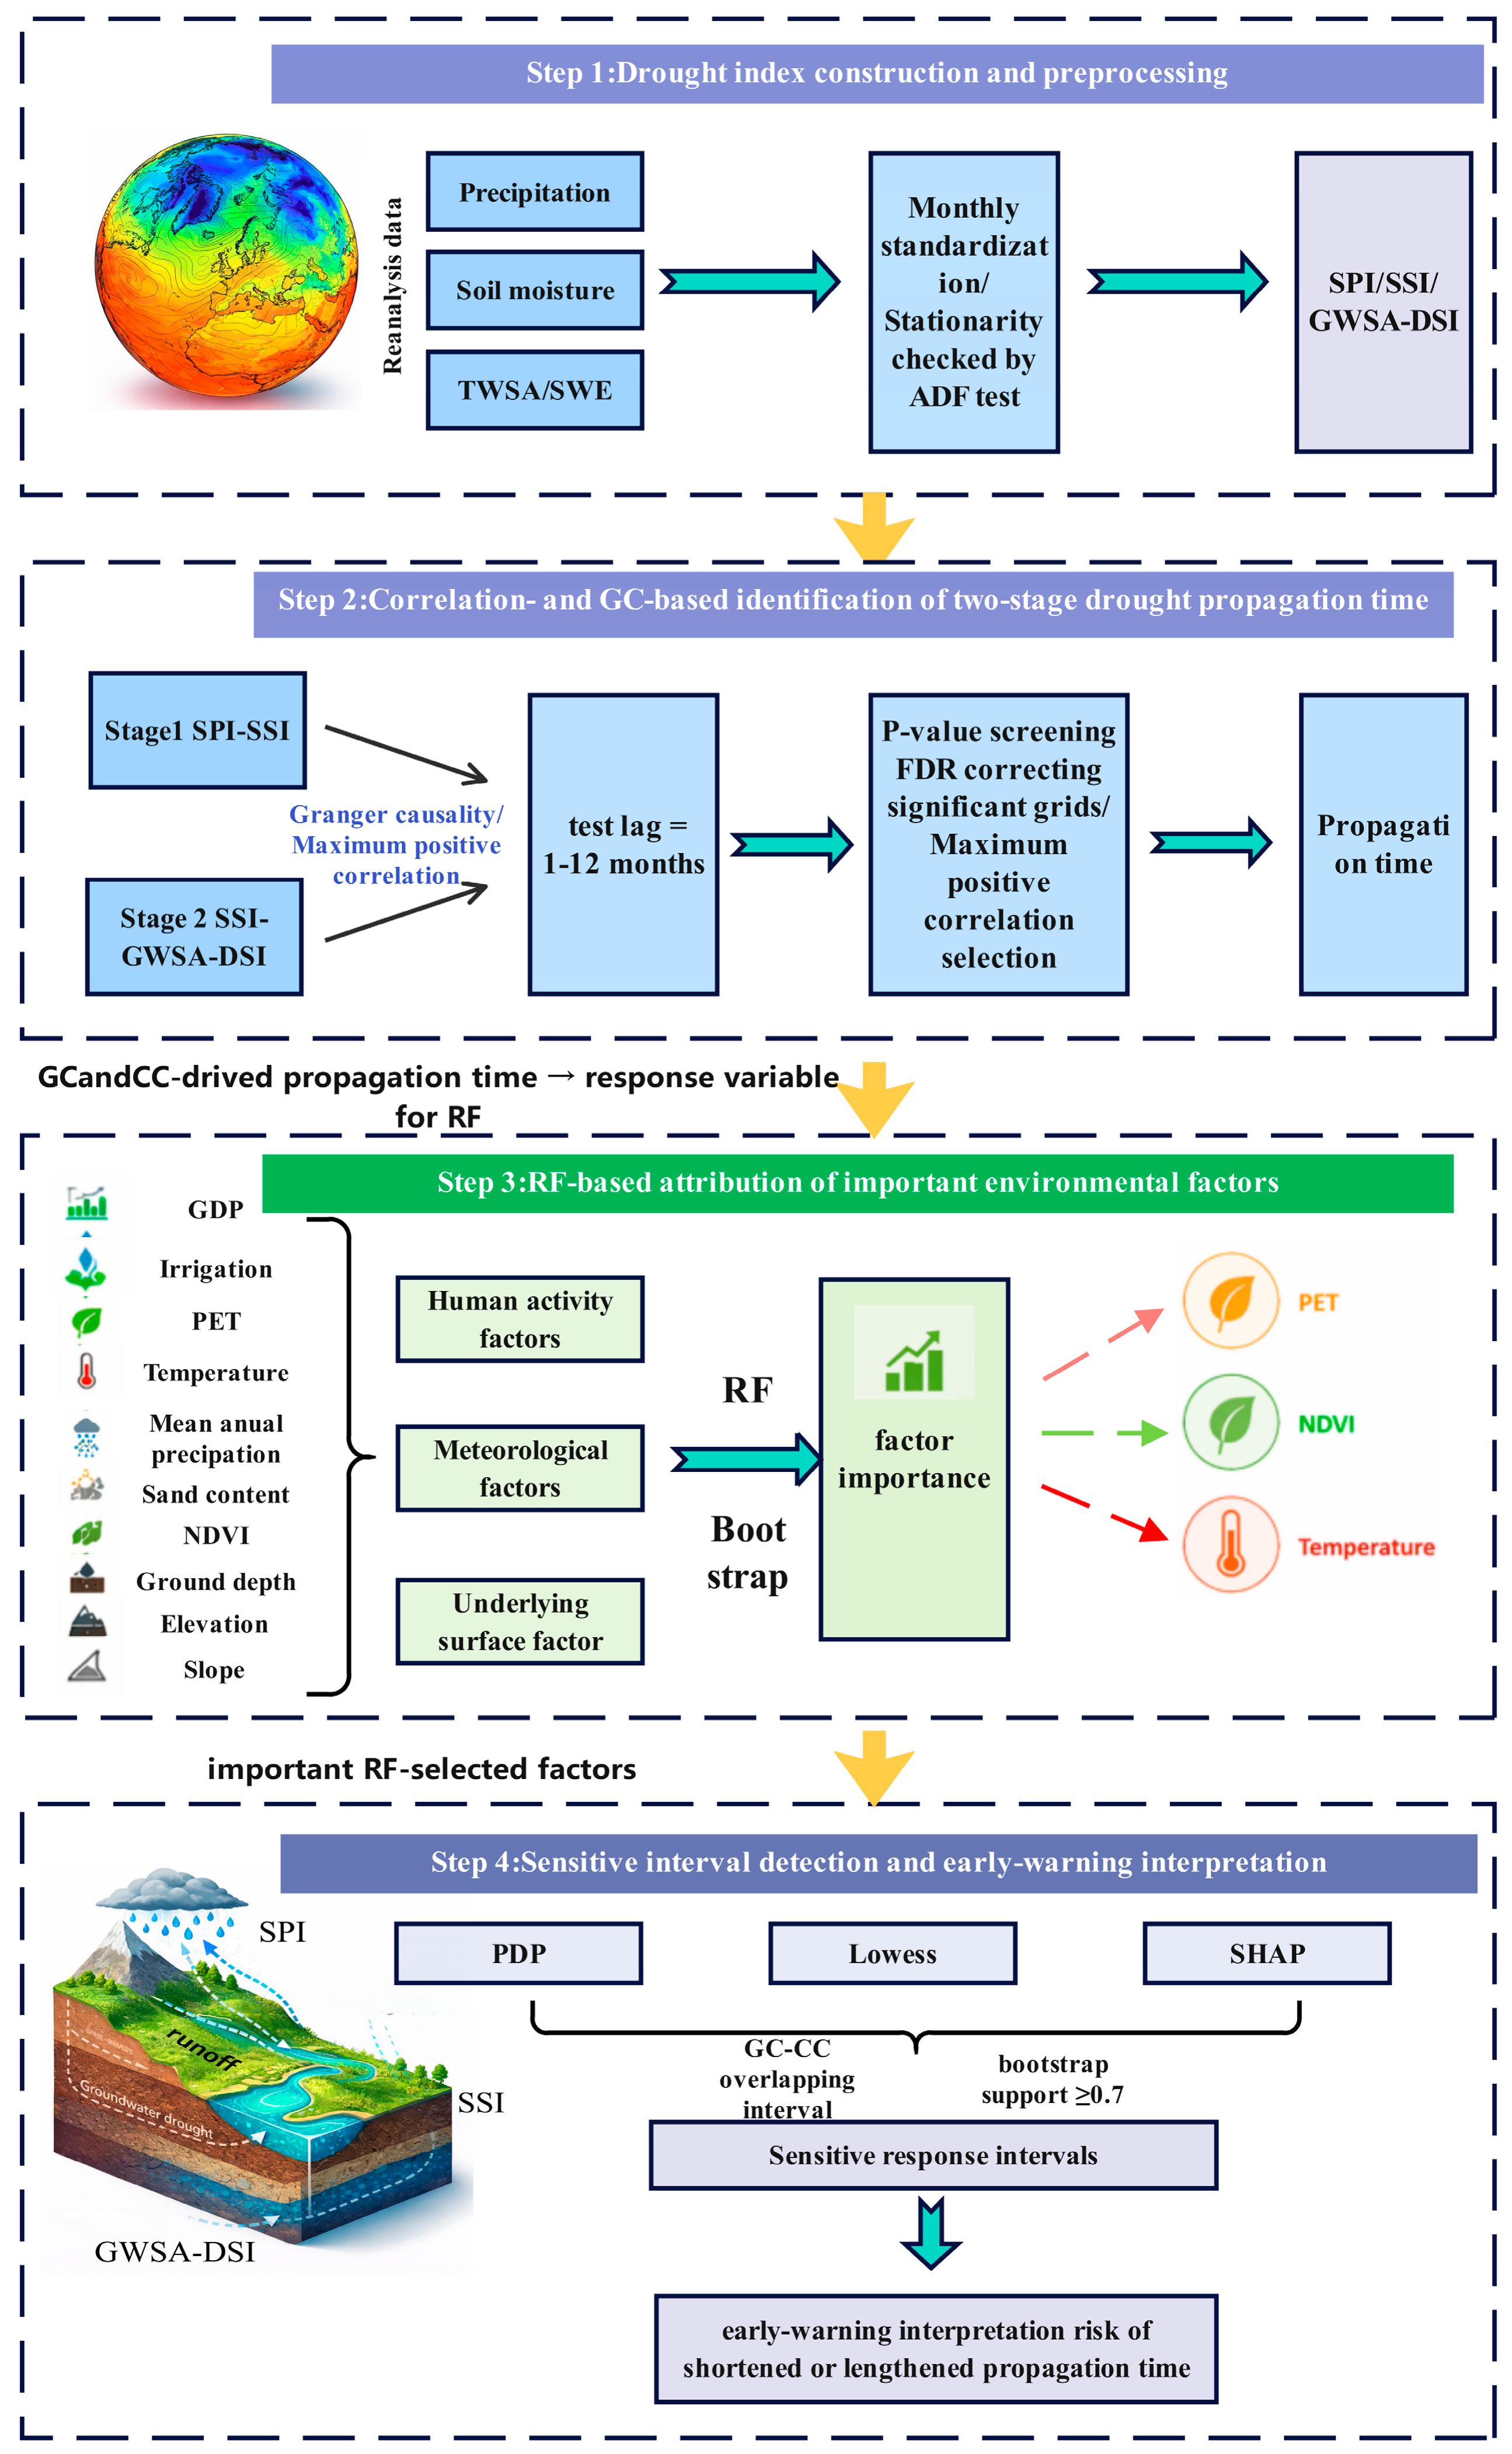
This study combines SHAP scatter plots, LOWESS smoothed curves, and centered partial dependence curves to test the response trends and consistency of turning points for important factors. To further improve the stability of sensitive interval identification, the Bootstrap resampling method is used to repeatedly test the identified sensitive intervals over 200 iterations and calculate the support rate for each feature value being recognized as a sensitive interval. At the same time, a sensitivity analysis was conducted on different support rates to determine their thresholds (see Figures S2–S5). When the Bootstrap support rate ≥0.7, the interval is considered to have good repeatability and stability, and it is represented as a shaded area in the figure. Additionally, the stability of sensitive intervals is further tested using the slope method based on the LOWESS curve. The stability analysis results for relevant sensitive intervals are provided in the Supplementary Materials. We performed PDP/SHAP analysis on the repeated key factors identified by both the GC-based and correlation-based RF models. For each selected factor, sensitive intervals were determined according to the two definitions of propagation time and then compared. Only intervals that were supported by both methods, overlapped numerically, and exhibited broadly consistent response directions were retained as cross-method empirical sensitive intervals. Data processing, statistical analyses, and part of the figure preparation were performed using Python version 3.9.13 (Python Software Foundation, Wilmington, DE, USA). Spatial data processing, mapping, and visualization were conducted using ArcGIS version 10.8 (Environmental Systems Research Institute, Inc. [Esri], Redlands, CA, USA). A brief display of the flowchart of the research methodology is presented in Figure 2.

3. Results

3.1. Spatial Characteristics of Propagation Time

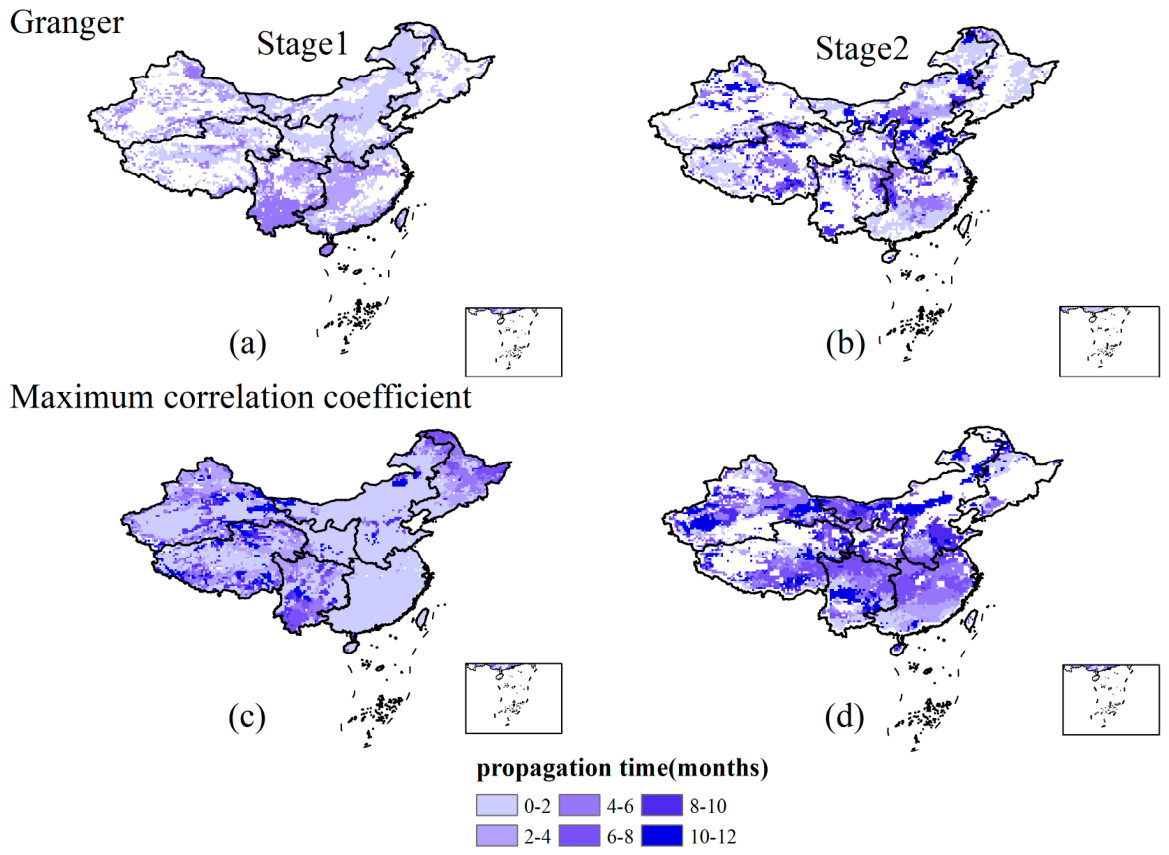
Granger causality analysis is used to identify the direction and lag time of drought propagation between successive drought stages. After FDR correction, 5205 grid points in Stage 1 remain significant, indicating that 78.36% of the area in the effective region shows a significant directional predictive relationship of meteorological drought on soil moisture drought; in Stage 2, 3636 grid points remain significant, indicating that 76.10% of the area in the effective region shows a significant directional predictive relationship of soil moisture drought on groundwater drought (Table 2). To ensure consistent control of spatial multiple testing, the Benjamini–Hochberg FDR correction was also applied to the correlation-based results. In Stage 1, 6404 of the 7010 raw significant grid cells were retained after FDR correction, corresponding to a retention rate of 91.36%. In Stage 2, 3638 of the 3998 raw significant grid cells were retained, with a retention rate of 91.00%. These results indicate that most correlation-based propagation relationships remained statistically significant after FDR correction.
Through spatial comparison, most areas of the country show that drought primarily propagates in Stage 1 with a short response time. In Northeast China, North China, and parts of the Northwest Oasis region, the propagation time is mainly less than 4 months. This indicates that meteorological drought has a high transmission efficiency to soil drought and responds quickly. In contrast, the propagation time in the Southwest region is generally longer. In Stage 2, the propagation time increases, with areas where the time exceeds 6 months significantly expanding in the Northwest region and the Tibetan Plateau. In the North China Plain, Huang–Huai–Hai Plain, Southern Songnen Plain, Sichuan Basin, and Central Yunnan Plateau, the propagation time often reaches 8 to 12 months (Figure 3b). Overall, there are significant differences in the propagation time of the two drought stages across different regions.
The propagation times obtained using the maximum correlation coefficient method show a more continuous spatial pattern. In Stage 1, unlike the spatial pattern identified by the GC method, which mainly had short responses of 1–4 months, the areas with 2–4 months propagation times are significantly larger under the maximum correlation coefficient method, especially in parts of North China and the Southwest. In Stage 2, the propagation time in the Northwest, North China, and some southern regions mostly falls within 4–8 months, with some local areas even reaching 8–12 months. Compared with the GC-derived results, the long-lag areas identified by the CC method in Stage 2 are more spatially continuous.
Both methods show that, overall, Stage 2 takes longer to spread than Stage 1, but there are obvious differences at the specific grid scale. On a national level, the average differences for Stage 1 and Stage 2 are −0.3 months and −1.0 months, with RMSE of 3.2 months and 4.3 months (Table S3). This means that while the two methods do not differ much in terms of regional average propagation time, their spatial details are not exactly the same. The differences are especially noticeable in Stage 2, suggesting that the estimated propagation time from soil drought to groundwater drought is more sensitive to the statistical definition used. Relying solely on a single definition of propagation time may affect the identification of subsequent impact factors and the determination of sensitive intervals, so RF attribution is carried out separately for the two methods to identify important factors.

3.2. Important Factors Under GC and CC-Based Propagation Time

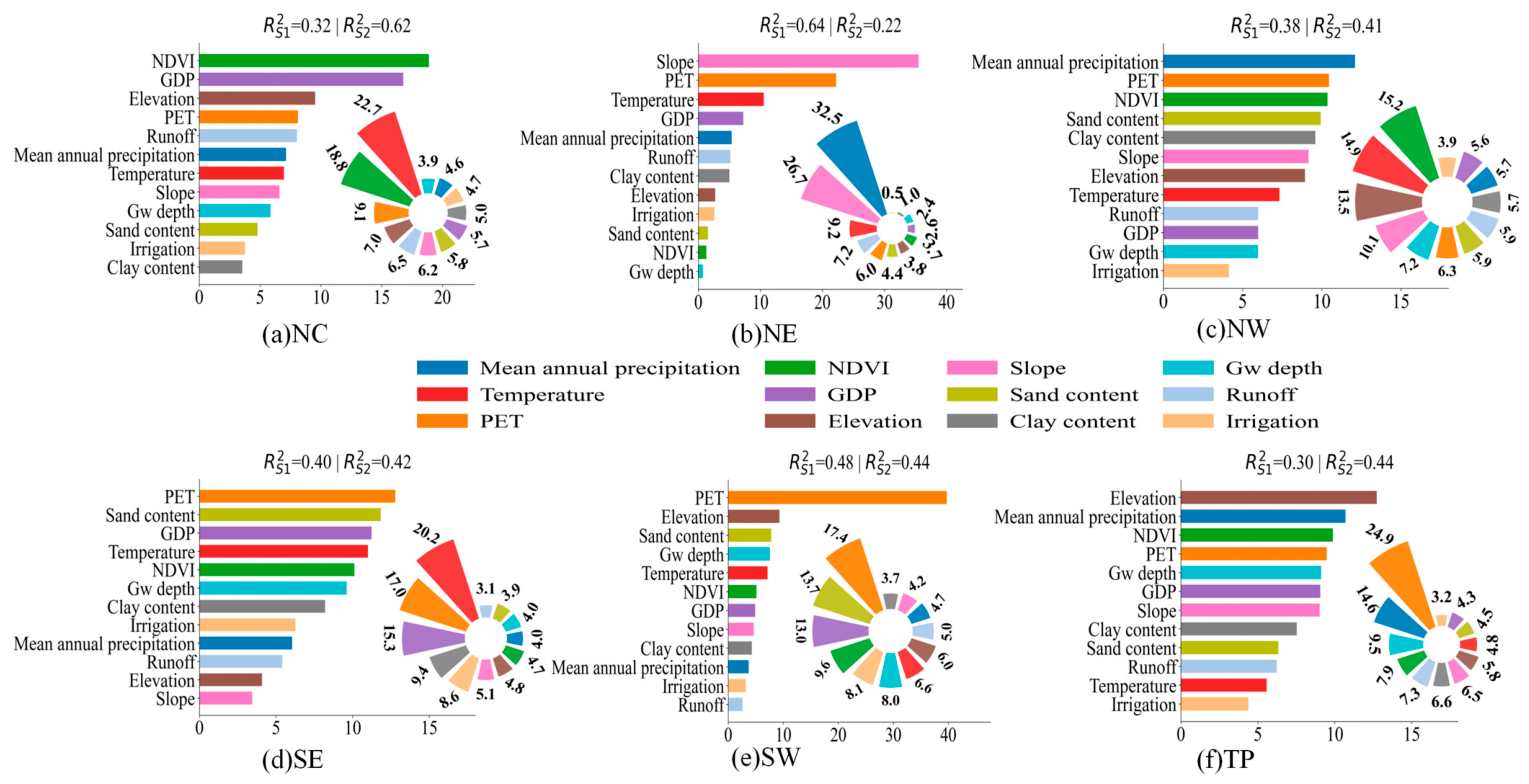
The importance of each environmental factor reflects its contribution to explaining the regional differences in drought propagation timing. The results of the random forest model analysis show that the important factors influencing drought propagation time exhibit significant spatial and stage differences. Figure 4 reveals the heterogeneity of the factors affecting drought propagation time based on the random forest model (R2 ranging from 0.22 to 0.64). In northern regions, the drought propagation time in North China in Stage 1 is significantly influenced by vegetation (NDVI) and human activity (GDP), while in Stage 2, Temperature shows higher statistical importance in explaining the spatial variation in propagation time. In Northeast China, the two stages are mainly influenced by topography (slope) and precipitation. In the Northwest region, the response characteristics are related to water constraints. In contrast, southern regions and the Tibetan Plateau show a stronger dependence on atmospheric moisture demand, with PET being particularly important in the Southwest region in both stages (as high as 39.7% in Stage 1). The Southeast and Tibetan Plateau are also influenced by PET and mean annual precipitation in Stage 2. Overall, PET, NDVI, and temperature frequently appear across different stages.
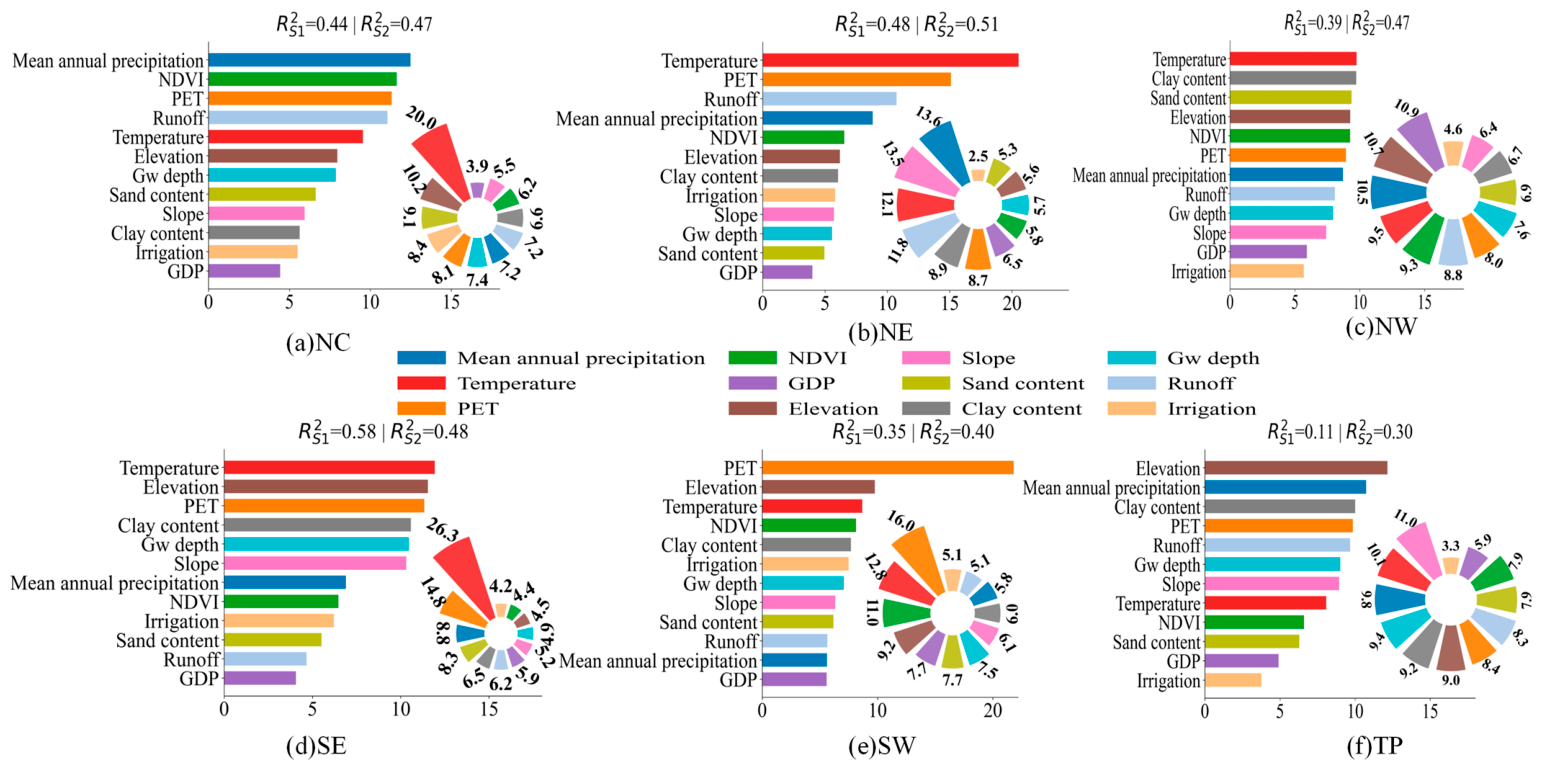
After attributing propagation time calculated by CC through RF, except for the relatively weak explanatory power of the Stage 1 model on the Qinghai–Tibet Plateau, the R2 values for other regions and stages overall range from 0.30 to 0.58 (Figure 5). In northern regions, drought propagation time in Stage 1 in North China is mainly influenced by mean annual precipitation, NDVI, and PET, while in Stage 2, temperature becomes the most critical factor. In Northeast China, Stage 1 is primarily affected by temperature, PET, and runoff, whereas Stage 2 is mainly influenced by mean annual precipitation. In Northwest China, Stage 1 is mostly associated with temperature and soil texture factors, while Stage 2 is more closely related to GDP, elevation, and mean annual precipitation. In contrast, southern regions show a strong dependence on temperature and atmospheric water demand. In Southeast China, both stages are significantly influenced by temperature and PET, with the importance of temperature reaching 26.3%, whereas in Southwest China, PET dominates Stage 1 and continues to hold high importance in Stage 2. On the Qinghai–Tibet Plateau, Stage 1 is mainly influenced by elevation and mean annual precipitation, while in Stage 2, slope, temperature, and mean annual precipitation are more important. Overall, temperature, PET, and mean annual precipitation frequently appear across different regions and stages.
To further identify the relatively stable influencing factors under the two definitions of propagation time, we compared the top three most important RF predictors for each region and stage based on GC propagation time and the maximum positive correlation propagation time (Table 3). Except for NW in Stage 1, at least one common top-three factor was identified in each region–stage combination. This suggests that, although the specific rankings of environmental factors differ between the two methods, several key factors are consistently identified. Therefore, the subsequent sensitive interval analysis mainly focuses on these repeatedly identified important factors, rather than just the top-ranked factor in each method.
At the same time, in Northwest China, elevation was the only common dominant factor identified by both propagation time definitions in Stage 2. However, elevation is a static physiographic variable that primarily explains spatial differences in drought propagation rather than temporal changes in propagation time. Because it cannot serve as a dynamically varying indicator in an operational early warning framework, no further sensitive interval analysis was conducted for Northwest China. Elevation was nevertheless retained in the RF attribution results to represent its contribution to regional spatial heterogeneity.

3.3. Sensitive Response Intervals of Important Factors

The centered PDP curves of most regions are generally consistent with the LOWESS trend lines in the main direction of change, indicating that the average marginal response relationships identified by the model can be validated by the smooth trends of actual samples (Figures S6–S9).
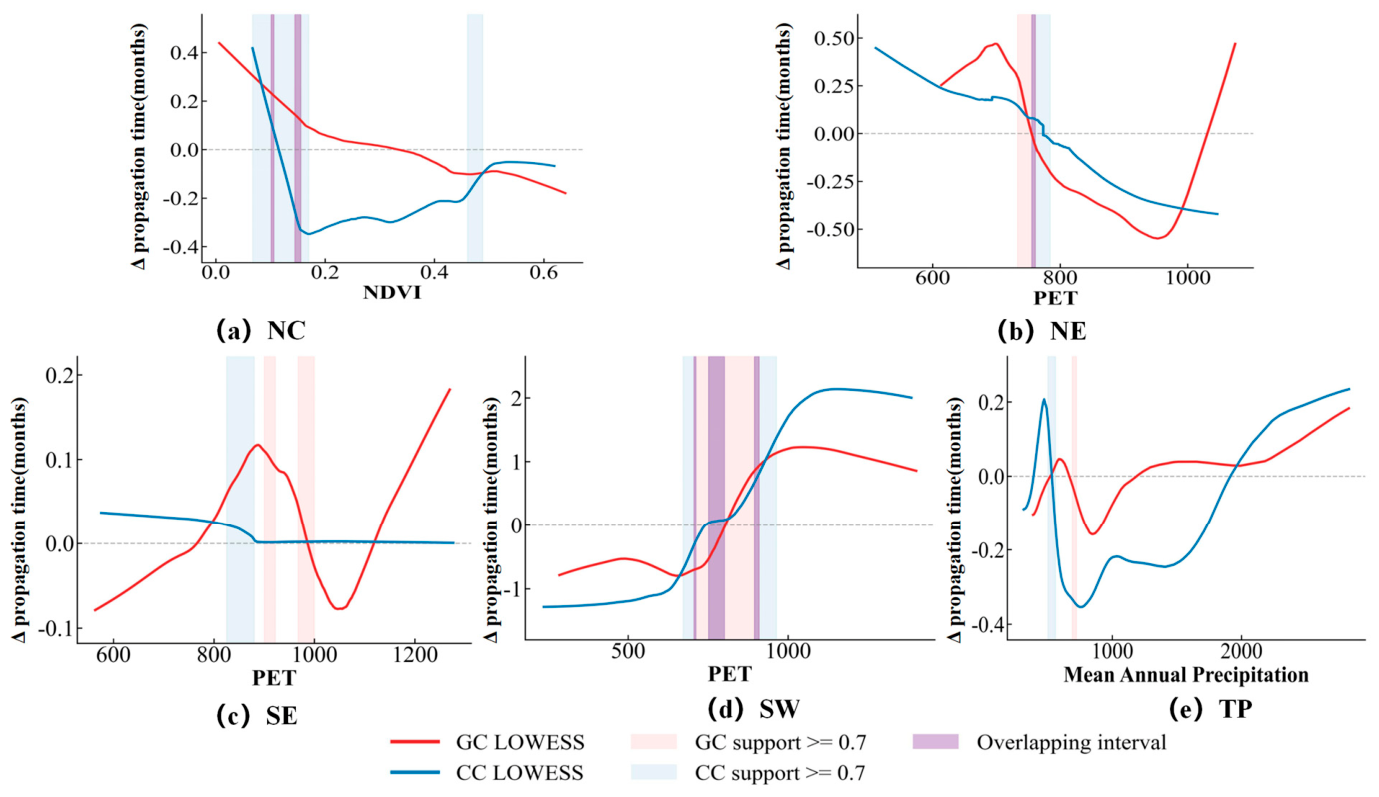
In Stage 1 (Figure 6), the response patterns of important factors in different regions show variations. In North China, NDVI shows some local fluctuations when values are low, but when NDVI exceeds about 0.1, both the GC and CC methods show that drought propagation time generally trends downward, with overlapping sensitive intervals, and the changes then gradually level off. In Northeast China, both methods found that PET drops noticeably around 750–800 mm, and there is an overlapping sensitive range, which suggests that when potential evapotranspiration enters this sensitive range, the propagation time shortens quickly. In the Southwest and Southeast regions, PET responses exhibit more concentrated sensitive intervals. In the Southwest, drought propagation time rapidly increases as PET enters the sensitive interval around 700–800 mm.
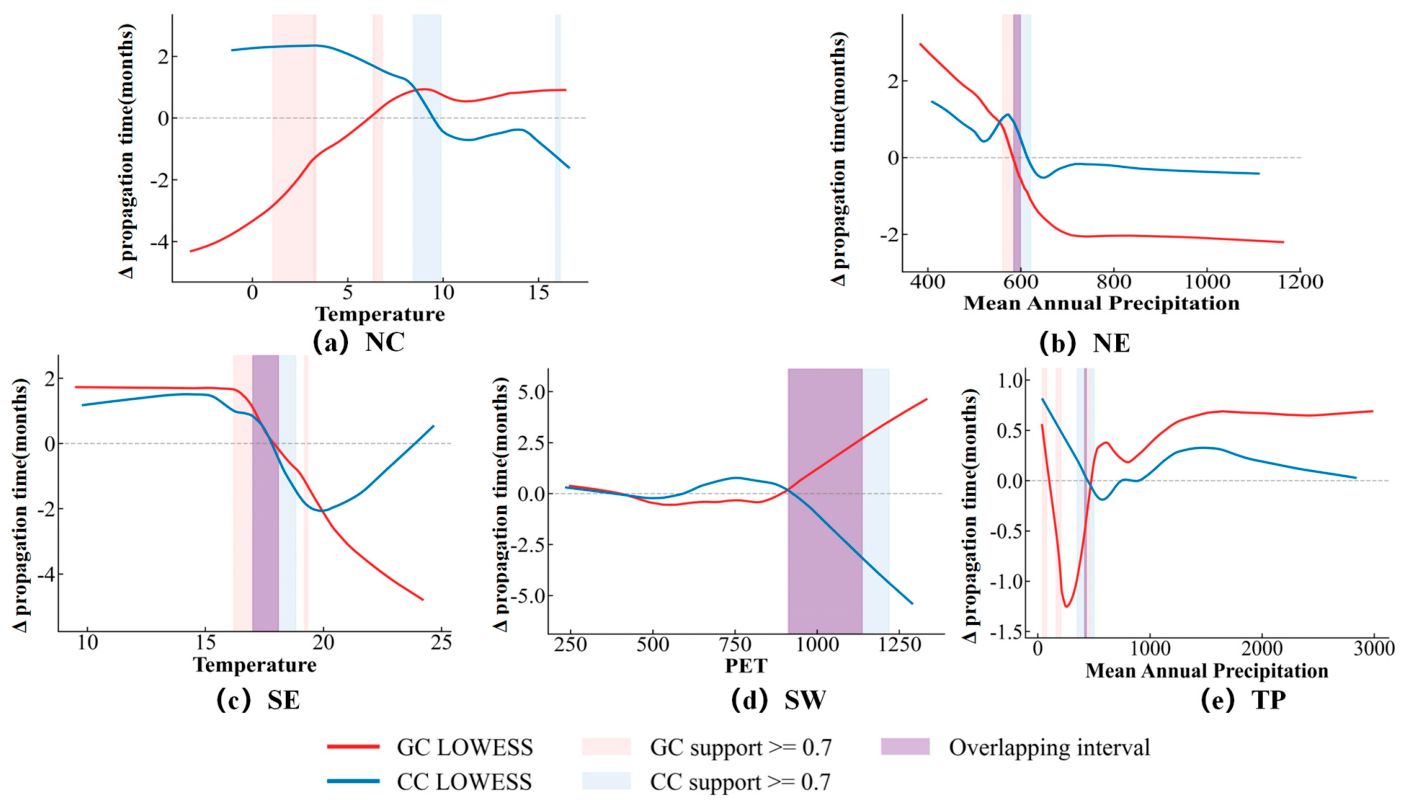
In Stage 2 (Figure 7), the impact of important factors on the propagation time from soil drought to groundwater drought also shows regional differences. In North China, the two methods show different variations. The two methods have different stable sensitivity ranges. In Northeast China, drought propagation time shortens as mean annual precipitation increases, with the most notable decrease occurring around 600 mm of mean annual precipitation. This suggests that higher precipitation conditions may enhance the moisture replenishment process, thereby shortening the transfer time from soil drought to groundwater drought. In the Southeast region, there is a clear negative response between temperature and propagation time, with a sensitive interval appearing around 17–18 °C. In the Southwest, PET shows strong nonlinear characteristics. In the Tibetan Plateau, when the annual average precipitation is slightly more than about 500 mm, the duration of drought tends to be longer.
From the comparison of the two stages, in Stage 1, the sensitive intervals of important factors mainly reflect the regulatory effects of vegetation, precipitation, and potential evapotranspiration on the meteorological-to-soil drought propagation process. In Stage 2, the influence of temperature, precipitation, NDVI, and PET on the soil-to-groundwater drought propagation time becomes more complex, with some regions showing stronger responses. Although the SHAP scatter plots exhibit some dispersion across regions (Figures S6–S9), indicating local differences and potential interaction effects between samples, the main distribution trends are generally consistent with the centered PDP and LOWESS curves.
Outside the cross-method overlapping intervals, however, the GC- and CC-derived LOWESS curves showed evident divergence in some regions, particularly in the Southeast China panel. Within some method-specific ranges, the two curves even exhibited opposite response directions. These differences indicate that the fitted relationship between an environmental predictor and propagation time is sensitive to the definition of propagation time. Therefore, trends identified by only one method, or ranges in which the two methods exhibit inconsistent response directions, were not interpreted as robust sensitive responses or as evidence of opposite physical effects. Only intervals that received high Bootstrap support from both methods, overlapped numerically, and showed broadly consistent response directions were retained as cross-method empirical sensitive intervals.
Accordingly, these cross-method empirical sensitive intervals provide a more robust statistical basis for identifying potential changes in drought propagation time. When important environmental factors enter these intervals, propagation time is more likely to exhibit a marked change, although the direction of the response may vary among factors, regions, and propagation stages.

4. Discussion

4.1. Method Differences and Analysis of Sensitive Intervals for Important Factors

The GC method and the maximum positive correlation method describe different statistical aspects of the drought propagation process. The former focuses on the directional predictive relationship of upstream drought signals for downstream drought conditions, while the latter identifies the lag corresponding to the maximum positive correlation between adjacent drought indices [39]. Granger causality and the maximum positive correlation method can describe the propagation time between different drought types from distinct perspectives. The differences between these two methods are relatively minor in terms of national average propagation time, but they remain evident at regional and grid scales, particularly pronounced during Stage 2.
The choice of propagation time estimator affects not only the spatial pattern of propagation time but also the RF-based attribution results, indicating that factor-importance rankings are sensitive to the definition of the response variable [40]. This sensitivity should be interpreted as estimator dependence rather than as evidence that different physical processes operate under the two methods. Although previous studies have shown that the actual propagation of soil drought into groundwater or hydrological drought may be influenced by catchment memory, topography, groundwater conditions, and human activities [41], these processes were not independently quantified in the present GC–CC comparison and therefore cannot be invoked here to explain the disagreement between the two estimates. Nevertheless, at least one common important factor was identified in most region–stage combinations, indicating that several important environmental predictors are relatively stable across the two propagation time definitions.
Further comparison of the cross-method response curves showed that local disagreement between the GC- and CC-derived propagation times was transmitted to the subsequent modeling results because the two lag estimates were separately used as the response variables of the RF models. Consequently, the same environmental predictor could exhibit different fitted slopes or even opposite response directions under the two propagation time definitions. Regional differences in drought-index persistence, autocorrelation structure, predictor distributions, covariate dependence, and sample heterogeneity may further contribute to this divergence, although these possible statistical sources were not independently tested in the present study. Therefore, method-specific or directionally inconsistent responses were not assigned robust physical or early warning interpretations. Only intervals jointly supported by both methods and exhibiting broadly consistent response directions were retained as cross-method empirical sensitive intervals. The stronger GC–CC disagreement over the Tibetan Plateau and Southwest China may be related to the pronounced hydroclimatic and topographic heterogeneity of these regions. On the Tibetan Plateau, strong elevation gradients, seasonal snow accumulation and melt, freeze–thaw processes, and spatially variable precipitation can introduce discontinuous and multi-timescale responses into the drought-index series [42]. In Southwest China, complex terrain, monsoon-dominated precipitation, and heterogeneous runoff and subsurface-recharge pathways may similarly produce a mixture of rapid and delayed drought responses [43]. Under such conditions, the cross-lag dependence structure may become broad or multi-peaked, allowing the maximum-correlation method and the conditional predictive framework of GC to select different lag months. These regional characteristics provide plausible explanations for the greater estimator disagreement, but their individual contributions were not explicitly quantified and should not be regarded as independently verified mechanisms.
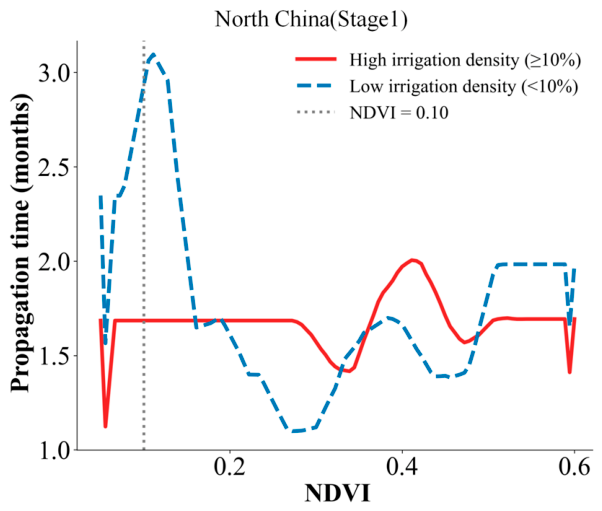
Vegetation-related factors show strong stage-specific effects in arid and semi-arid regions. In Stage 1 in North China, NDVI exhibits relatively high importance. The GC- and CC-based analyses show that the response of propagation time changes when NDVI exceeds approximately 0.1. Combined with the stratified comparison between high- and low-irrigation-density areas (Figure 8), this pattern may reflect a shift in the relative importance of different vegetation–water processes. Under low-NDVI conditions, the shading and interception effects of sparse vegetation may partly buffer short-term soil–water loss [44]. As NDVI increases, however, vegetation transpiration and root-zone water uptake may become stronger, making soil moisture more responsive to meteorological deficits. In addition, intensive farmland irrigation in North China can sustain relatively high NDVI [45], and areas with a relatively high long-term irrigation density generally exhibit shorter propagation times than areas with a lower irrigation density. This pattern suggests that long-term irrigation density, used here as an auxiliary indicator of human water regulation background, may be associated with variations in the coupling among precipitation supply, vegetation water use, and soil moisture, and thus with regional differences in drought-propagation response. Irrigation may sustain relatively high NDVI under conditions where precipitation alone would be insufficient to meet vegetation water demand. Previous research in arid regions has similarly suggested that artificially enhanced vegetation may increase ecosystem water demand and vulnerability under water-limited conditions [46]. Once meteorological drought occurs, enhanced root-zone water uptake and transpiration may accelerate soil–water depletion and thereby shorten the propagation from meteorological drought to soil drought [47,48]. Because the stratification was based on a static 2003–2024 mean irrigation-density layer, Figure 8 captures spatial differences in the NDVI–propagation time relationship between areas with relatively high and low long-term irrigation density. Seasonal irrigation timing, actual irrigation amount, and crop phenology were not explicitly represented. Therefore, this comparison is used only as supporting statistical evidence that long-term irrigation background may modify the coupling among vegetation condition, precipitation supply, and soil moisture, rather than as direct causal evidence that irrigation shortened propagation time or caused the NDVI response transition.
In Stage 1 in Northeast China, the propagation time decreases markedly when PET enters the cross-method sensitive interval of approximately 750–800 mm. This interval may represent a shift from soil–water buffering to atmospheric-demand limitation. Under relatively low PET conditions, seasonal snow accumulation and melt, freeze–thaw processes, and the water storage capacity of the root-zone soil may partly buffer short-term precipitation deficits [49]. When PET approaches 750–800 mm, increasing evaporative and transpiration demand may cause soil–water depletion to outpace precipitation replenishment, thereby allowing meteorological drought anomalies to be expressed more rapidly as soil drought [50]. This range should therefore be interpreted as a regional empirical transition between stronger soil–water buffering and stronger atmospheric water demand control, rather than as a universal PET threshold.
Temperature and PET have higher importance in Stage 2, indicating that thermal conditions play a more significant role in the propagation process from soil drought to groundwater drought. In North China, temperature shows a complex fluctuating impact on Stage 2 propagation time (Figure 7a). Zhang’s study on drought factors across China also shows that temperature is extremely important for drought in North China [51]. Further research by Li on snowmelt found that winter snowmelt has a short stay time in the soil, weakening water replenishment [52], with more snowmelt water replenishing groundwater. Qian’s research on drought atmospheric circulation patterns in the Yangtze River Basin from 1961 to 2022 also found that the overlapping of two abnormal circulation patterns in recent years caused severe heatwaves over the Yangtze River Basin, indirectly supporting the rationality of this statistical turning point [53]. Overall, Stage 2 is more easily influenced by thermal conditions, indicating that groundwater-related propagation is not only affected by previous moisture deficits but also constrained by changes in evapotranspiration demand and water replenishment efficiency.
In addition, on the Qinghai–Tibet Plateau, the first-stage GC curve and CC curve show that in areas with lower precipitation, the drought propagation time fluctuates as precipitation increases (Figure 6e). This suggests that in water-limited areas, small increments in precipitation may not effectively enhance the system’s buffering capacity. The impact may primarily remain at the surface evaporation, vegetation interception, or shallow soil recharge levels [54], and is not sufficient to alter deep hydrological processes. Qin’s research on the contribution of surface drought in the Tibetan Plateau also found that precipitation only significantly affects drought propagation time during winter and summer, but the total amount is relatively low [55]. The ecosystem is overall fragile, and elevation also has a significant impact on drought (Table 3). The importance of elevation and precipitation in the model attribution results for the TP region further suggests that the combined effect of topography and precipitation processes may influence runoff generation and recharge efficiency in high-altitude areas, as also noted in Cao’s study [56].
Overall, the sensitive intervals of important factors affecting drought propagation time differ across regions. In North China, the response of drought propagation time to the NDVI more clearly reflects the combined regulation of vegetation condition and human irrigation on propagation time. In Southeast and Southwest China, the sensitive intervals of temperature and PET reflect the important role of thermal conditions in the propagation process. In the Tibetan Plateau, the changes in the sensitive intervals of precipitation and vegetation indicate that the propagation process has more complex nonlinear characteristics under a strongly water-limited background.

4.2. Implications for Early Warning of Changes in Drought Propagation Time

Existing studies on drought propagation mainly focus on whether propagation occurs and its average propagation time. They usually describe propagation characteristics from the perspectives of propagation probability, correlation analysis, or static threshold determination [14,27,57,58]. However, this study shows that when important factors affecting propagation time approach sensitive intervals, even small changes may cause rapid changes in propagation time. Therefore, in drought early warning, it is not enough to focus only on propagation probability and average propagation time. It is also necessary to consider whether the states of important environmental factors enter the sensitive intervals, so as to judge whether propagation time may change. This is especially important during Stage 2, as its propagation process is generally slower and it is also more strongly affected by temperature, evapotranspiration demand, and underlying surface conditions. Therefore, it is more necessary to combine the sensitive intervals of important factors to further identify the risk of changes in propagation time. Although this is similar to the meteorological thresholds mentioned by Liu in grassland disaster research [59], this study further extends the idea to early warning of nonlinear changes in drought propagation time.
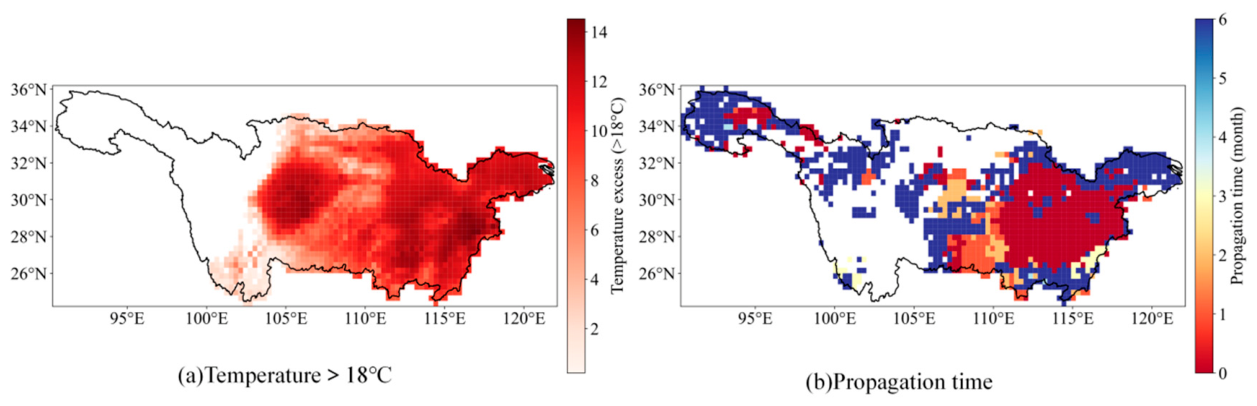
Using the 2022 drought event in the Yangtze River Basin as an example, this study analyzes temperature, which was identified as an important factor in Southeast China (Figure 9). In the middle and lower reaches of the Yangtze River, when temperature entered the currently identified sensitive interval of 17–18 °C, drought propagation time shifted from lengthening to shortening (Figure 7c). The propagation time then shortened rapidly, and groundwater drought may occur earlier. This indicates that the buffering effect of the soil layer was weakened during the compound hot drought event in the Yangtze River Basin in 2022. In contrast, in the upper reaches of the Yangtze River, areas where the temperature stays below the sensitive range are still in the low sensitivity zone. As a result, the system buffering capacity remained relatively stable, and drought propagation time was relatively longer. This also suggests that the longer propagation times or relatively stable index changes observed in some previous studies [44,45] may not only be jointly affected by climate and underlying surface conditions, but may also be related to the fact that important factors did not enter the sensitive intervals. When the system remains in a non-sensitive interval for a long time, the propagation time is usually less likely to show an abrupt change. This result provides a new perspective for understanding early drought warning in these specific regions.
Based on the above results, future monitoring of drought propagation risk should not only focus on the probability of propagation and its average propagation time, but also further pay attention to whether important environmental factors are approaching their sensitive intervals. Compared with the traditional approach that judges risk only according to the intensity of meteorological anomalies, this method can more directly reflect whether propagation time may change significantly under the current environmental background, thus providing supplementary information for assessing the urgency of early warning.

4.3. Limitations and Prospects

Although this study identifies the important environmental factors associated with drought propagation time and their sensitive response intervals from the perspective of changes in propagation time and provides a new analytical perspective for drought early warning, some limitations still remain. First, this study conducts a nationwide analysis based on multi-source reanalysis, remote sensing, and statistical data from 2003 to 2024. Different data products differ in spatial resolution, retrieval accuracy, and physical meaning. Although reanalysis precipitation and land surface moisture data are suitable for large-scale regional drought studies, they may still contain systematic biases in areas with complex terrain and sparse observations, which brings uncertainty [60,61]. Similarly, the GRACE-derived groundwater storage anomaly used in this study represents an approximation based on the residual between TWSA and major modeled water storage components, and the residual signal may still contain contributions from other water storage components, such as surface water storage, reservoir regulation, canopy interception, and glacier storage changes. This uncertainty needs special attention in nationwide comparisons, because, as shown in Figure 3, the study area covers humid monsoon regions, arid inland regions, and alpine cold regions at the same time, and the climate background and underlying surface conditions differ greatly among regions. In the Tibetan Plateau, the mountainous areas of Southwest China, and regions with active groundwater processes, input data errors are more likely to be further transmitted into the identification of propagation time and the subsequent attribution results, thus affecting the stability of propagation time identification and later attribution results.
Second, this study uses both Granger causality and the maximum positive correlation coefficient method to quantify two-stage drought propagation time. The propagation times derived from the two methods are separately analyzed using random forest models, PDP/LOWESS, and SHAP to compare factor importance and nonlinear response patterns. Sensitive intervals consistently supported by both methods are interpreted as cross-method empirical response ranges affecting drought propagation time. It should be noted that this analytical framework is more suitable for identifying statistically significant propagation relationships, relatively important factors, and response turning point characteristics, but it is not equivalent to a strict decomposition of physical causal mechanisms. Existing studies have shown that the drought propagation process has obvious nonlinearity, lag effects, and complex feedback. Statistical methods can improve the identification of propagation direction and propagation rhythm, but they still cannot fully replace process-based mechanism interpretation [62,63,64]. This methodological boundary is also reflected in the results of this study. In Figures S6–S9, although the centered PDP and LOWESS curves show relatively consistent trends in most regions, the SHAP scatter plots still show some dispersion. This suggests that local sample heterogeneity and potential interaction effects have not been fully removed. Therefore, the results of this study are more suitable to be understood as an empirical identification of the variation pattern of propagation time, rather than a strict quantification of the independent physical effect of a single environmental factor. Nevertheless, the primary relationships identified in this study are physically reasonable. The NDVI, temperature, and potential evapotranspiration can influence drought propagation time by regulating vegetation water use, transpiration, soil moisture consumption, and recharge efficiency. Therefore, although the current framework does not directly simulate hydrological processes, the observed nonlinear responses are relatively consistent with known ecohydrological processes.
Future studies should integrate period-specific environmental datasets, longer-term observations, independent in situ soil moisture and groundwater-level measurements, basin-scale hydrological records, and process-based model simulations to evaluate the temporal evolution of key environmental controls and to validate the temporal stability of drought propagation times and the regional transferability of their sensitive response intervals. They also need to further combine land surface hydrological or groundwater process models to reveal, at the mechanism level, the pathways through which vegetation, energy conditions, and precipitation processes affect changes in propagation time. At the same time, research should expand from the national grid scale to the basin scale and typical event scale, and combine extreme drought cases to assess whether the propagation rhythm is more likely to undergo abrupt changes after important factors enter sensitive response intervals. Overall, although this study still has limitations in data, methods, and interpretation, the proposed “propagation time–important factor–sensitive response interval” analytical framework still provides a new research basis for understanding why the rhythm of drought propagation changes and how this change can be incorporated into early warning systems.

5. Conclusions

Based on multi-source data from 2003 to 2024, this study constructs a two-stage drought propagation chain from meteorological drought to soil drought and then to groundwater drought. Granger causality and the maximum positive correlation coefficient method are used to identify stage-specific propagation times, while random forest, PDP/LOWESS, and SHAP analyses are further applied to examine the stability of environmental factor importance and nonlinear sensitive response intervals under the two propagation time definitions. The results indicate that drought propagation time is not fixed, but varies with propagation stage, regional ecological–hydrological conditions, and the method used to define lagged drought response. By distinguishing method-dependent responses from cross-method overlapping sensitive intervals, this study provides a more robust basis for extending drought early warning from average propagation time to changes in propagation rhythm.
(1) There are significant differences in the important environmental factors influencing the speed of drought propagation across different regions and stages in China. Overall, PET, NDVI, mean annual precipitation, and temperature repeatedly show high importance in multiple regions and stages. In North China, Stage 1 is more influenced by vegetation factors such as the NDVI, while in Stage 2, temperature plays a more prominent role. In the Southeast and Southwest regions, the response to temperature and potential evapotranspiration is more significant, indicating that energy conditions play an important regulatory role in the propagation process in humid and transition zones. In the Tibetan Plateau regions, precipitation factors have a greater influence on propagation time.
(2) There are sensitive intervals in important environmental factors that lead to significant changes in drought propagation time. In North China, in Stage 1, when the NDVI is between approximately 0.1 and 0.16, the effect of extending propagation time gradually weakens. In the Southeast region, after exceeding approximately 18 °C, a more pronounced acceleration in propagation is observed.
(3) The response of drought propagation time to important environmental factors shows clear nonlinear characteristics. Sensitive intervals can provide empirical evidence for identifying when propagation time may shorten or lengthen significantly. Incorporating important factors and their sensitive intervals into the early warning framework can help more accurately assess the urgency of event propagation, rather than relying only on traditional estimates of average propagation time and occurrence probability.
Overall, by combining statistical detection with process understanding, the proposed framework based on propagation time, important factors, and sensitive intervals advances the development of drought early warning systems. Future research should test the temporal stability of these intervals and explore their integration with hydrological process models to apply the research findings across different regions.

Supplementary Materials

The following supporting information can be downloaded at: https://www.mdpi.com/article/10.3390/rs18152615/s1, Figure S1: Spatial Distribution of GC-CC Propagation Time Differences.; Figure S2: Bootstrap support-rate analysis for validating turning-point identification and the 0.70 threshold used to define sensitive intervals in Stage 1(GC). The black curves represent the proportion of 200 Bootstrap resampling iterations in which each factor value was identified as part of a sensitive interval based on the slope of the LOWESS-smoothed SHAP response. The dashed lines denote support-rate thresholds of 0.60, 0.70, and 0.80, and the shaded areas show the intervals exceeding each threshold.; Figure S3: Bootstrap support-rate analysis for validating turning-point identification and the 0.70 threshold used to define sensitive intervals in Stage 2(GC); Figure S4: Bootstrap support-rate analysis for validating turning-point identification and the 0.70 threshold used to define sensitive intervals in Stage 1(CC). The black curves represent the proportion of 200 Bootstrap resampling iterations in which each factor value was identified as part of a sensitive interval based on the slope of the LOWESS-smoothed SHAP response. The dashed lines denote support-rate thresholds of 0.60, 0.70, and 0.80, and the shaded areas show the intervals exceeding each threshold; Figure S5: Bootstrap support-rate analysis for validating turning-point identification and the 0.70 threshold used to define sensitive intervals in Stage 2(CC).; Figure S6: Cross-validation using multiple methods of the non-linear sensitivity across the five regions in Stage 1 of the drought propagation process(GC). Critically, the Partial Dependence Plot (PDP, red line) is derived directly from the model’s internal prediction function by marginalizing out other features; it is mathematically independent of and not a regression fit to the SHAP values (gray dots), which represent game-theoretic local attributions. The convergence between the global marginal effect (PDP) and the local trend (LOWESS-smoothed SHAP) validates the consistency of the model’s logic. Furthermore, the Sensitive Range (orange area) is objectively determined by Bootstrap-supported stability (support ≥ 0.7), ensuring that the identified thresholds are robust empirical response features rather than artifacts of a single method or specific data subsamples; Figure S7: Cross-validation using multiple methods of the non-linear sensitivity across the five regions in Stage 2 of the drought propagation process(GC).; Figure S8: Cross-validation using multiple methods of the non-linear sensitivity across the five regions in Stage 1 of the drought propagation process(CC); Figure S9: Cross-validation using multiple methods of the non-linear sensitivity across the five regions in Stage 2 of the drought propagation process(CC).; Table S1: ADF test; Table S2: Comparison of drought propagation time before and after detrending GWSA-DSI; Table S3: Regional and stage-specific differences between GC-based and maximum-correlation-based propagation times.

Author Contributions

H.T.: Conceptualization, Methodology, Software, Resources, Investigation, Formal analysis, Data curation, Writing—original draft. Y.W.: Visualization, Validation, Supervision, Funding acquisition, Conceptualization. Z.Z.: Software, Resources, Methodology, Investigation. Z.G.: Methodology, Investigation. All authors have read and agreed to the published version of the manuscript.

Funding

This research was funded by the National Natural Science Foundation of China Key Program, grant number U2240226; the National Natural Science Foundation of China, grant number 42371150; and the Science Fund for Distinguished Young Scholars of Gansu Province, grant number 25JRRA489. The APC was funded by the authors.

Data Availability Statement

The datasets analyzed in this study are publicly available from their respective official repositories. The processed regional drought indicators and multi-stage propagation datasets generated during this study are available from the corresponding author upon reasonable request.

Conflicts of Interest

The authors declare that they have no known competing financial interests or personal relationships that could have appeared to influence the work reported in this paper.

References

  1. Li, N.; Li, S.; Zhao, B.; Yuan, X.; Zhu, J. Global Agricultural Drought Crisis: Synergistic Impacts of Climate Change and Human Activities and Their Feedback Mechanisms. Water 2026, 18, 732. [Google Scholar] [CrossRef]
  2. Lee, J.-W.; Hong, E.-M.; Jang, W.-J.; Kim, S.-J. Assessment of socio-economic drought information using drought-related Internet news data (Part A: Socio-economic drought data construct and evaluation socio-economic drought information). Int. J. Disaster Risk Reduct. 2022, 75, 102961. [Google Scholar] [CrossRef]
  3. Shi, J.; Sang, Y.-F.; Sun, S.; Aghakouchak, A.; Hu, S.; Dash, S.S. Development of a leaf area index-based relative threshold method for identifying agricultural drought areas. J. Hydrol. 2024, 641, 131846. [Google Scholar] [CrossRef]
  4. Fang, P.; Wang, T.; Yang, D.; Tang, L.; Yang, Y. Substantial increases in compound climate extremes and associated socio-economic exposure across China under future climate change. Clim. Atmos. Sci. 2025, 8, 17. [Google Scholar] [CrossRef]
  5. Wu, H.; Su, X.; Singh, V.P. Increasing risks of future compound climate extremes with warming over global land masses. Earth’s Future 2023, 11, e2022EF003466. [Google Scholar] [CrossRef]
  6. Gupta, N.; Gond, S.; Patel, J.; Omar, P.J.; Tripathi, R.P. Observed Interannual Variability and Projected Scenarios of Drought using Drought Indicators. J. Water Manag. Model. 2025, 33, H536. [Google Scholar]
  7. Gupta, N.; Banerjee, A.; Gupta, S. Spatio-temporal trend analysis of climatic variables over Jharkhand. Earth Syst. Environ. 2021, 5, 71–86. [Google Scholar] [CrossRef]
  8. Nigatu, Z.M.; You, W.; Melesse, A. Drought dynamics in the Nile River basin: Meteorological, agricultural, and groundwater drought propagation. Remote Sens. 2024, 16, 919. [Google Scholar] [CrossRef]
  9. Dhankhar, A.; Darssan, D.; Dey, S.; Lampugnani, E.R.; Haberle, S.; Katelaris, C.; Burton, P.; Nattala, U.; Osborne, N.J. Influence of ENSO, droughts, and temperature rise on pollen and pollen seasons in Australia. Sci. Total Environ. 2025, 975, 179326. [Google Scholar] [CrossRef] [PubMed]
  10. Jing, H.; Sun, J.; Zeng, Z. Inter-decadal shift of spring drought over China around the late 1990s and the possible mechanisms. Atmos. Res. 2024, 299, 107197. [Google Scholar] [CrossRef]
  11. Zhou, Z.; Wang, P.; Li, L.; Fu, Q.; Ding, Y.; Chen, P.; Xue, P.; Wang, T.; Shi, H. Recent development on drought propagation: A comprehensive review. J. Hydrol. 2024, 645, 132196. [Google Scholar] [CrossRef]
  12. Zhang, X.; Hao, Z.; Singh, V.P.; Zhang, Y.; Feng, S.; Xu, Y.; Hao, F. Drought propagation under global warming: Characteristics, approaches, processes, and controlling factors. Sci. Total Environ. 2022, 838, 156021. [Google Scholar] [CrossRef] [PubMed]
  13. Gao, Z.; Yin, G.; Niu, F.; Wang, Y.; Luo, J.; Lin, Z.; Shang, Y.; Zhang, C.; Liu, W. Dynamics and Drivers of Suprapermafrost Groundwater on the Qinghai–Tibet Plateau Under Climate Change. Water Resour. Res. 2026, 61, 104920. [Google Scholar]
  14. Yang, C.; Liu, C.; Xing, X.; Ma, X. Predicting the risk and trigger thresholds for propagation of meteorological droughts to agricultural droughts in China based on Copula-Bayesian model. Agric. Water Manag. 2025, 313, 109468. [Google Scholar] [CrossRef]
  15. Han, Z.; Huang, S.; Zhao, J.; Leng, G.; Huang, Q.; Zhang, H.; Li, Z. Long-chain propagation pathways from meteorological to hydrological, agricultural and groundwater drought and their dynamics in China. J. Hydrol. 2023, 625, 130131. [Google Scholar] [CrossRef]
  16. Li, Y.; Huang, S.; Wang, H.; Zheng, X.; Huang, Q.; Deng, M.; Peng, J. High-resolution propagation time from meteorological to agricultural drought at multiple levels and spatiotemporal scales. Agric. Water Manag. 2022, 262, 107428. [Google Scholar] [CrossRef]
  17. Xu, Z.; Wu, Z.; Shao, Q.; He, H.; Guo, X. From meteorological to agricultural drought: Propagation time and probabilistic linkages. J. Hydrol. Reg. Stud. 2023, 46, 101329. [Google Scholar] [CrossRef]
  18. Ho, S.; Tian, L.; Disse, M.; Tuo, Y. A new approach to quantify propagation time from meteorological to hydrological drought. J. Hydrol. 2021, 603, 127056. [Google Scholar] [CrossRef]
  19. Odongo, R.A.; De Moel, H.; Van Loon, A.F. Propagation from meteorological to hydrological drought in the Horn of Africa using both standardized and threshold-based indices. Nat. Hazards Earth Syst. Sci. 2023, 23, 2365–2386. [Google Scholar] [CrossRef]
  20. You, Z.; Sun, X.; Sun, H.; Chen, L.; Lu, M.; Xue, J.; Ban, X.; Yan, B.; Tuo, Y.; Qin, H. Mechanisms of meteorological drought propagation to agricultural drought in China: Insights from causality chain. Nat. Hazards 2025, 2, 24. [Google Scholar] [CrossRef]
  21. Zhang, Q.; Li, Y.; Huang, G.; Wang, H.; Shen, Z. Copula function with Variational Bayesian Monte Carlo for unveiling uncertainty impacts on meteorological and agricultural drought propagation. J. Hydrol. 2023, 622, 129669. [Google Scholar] [CrossRef]
  22. Ni, Y.; Qiu, B.; Miao, X.; Li, L.; Chen, J.; Tian, X.; Zhao, S.; Guo, W. Shift of soil moisture-temperature coupling exacerbated 2022 compound hot-dry event in eastern China. Environ. Res. Lett. 2024, 19, 014059. [Google Scholar] [CrossRef]
  23. Yang, F.; Duan, X.; Guo, Q.; Lu, S.; Hsu, K. The spatiotemporal variations and propagation of droughts in Plateau Mountains of China. Sci. Total Environ. 2022, 805, 150257. [Google Scholar] [CrossRef] [PubMed]
  24. Wu, J.; Chen, X.; Yao, H.; Gao, L.; Chen, Y.; Liu, M. Non-linear relationship of hydrological drought responding to meteorological drought and impact of a large reservoir. J. Hydrol. 2017, 551, 495–507. [Google Scholar] [CrossRef]
  25. Ding, Y.; Gong, X.; Xing, Z.; Cai, H.; Zhou, Z.; Zhang, D.; Sun, P.; Shi, H. Attribution of meteorological, hydrological and agricultural drought propagation in different climatic regions of China. Agric. Water Manag. 2021, 255, 106996. [Google Scholar] [CrossRef]
  26. Zhang, Q.; Miao, C.; Gou, J.; Wu, J.; Jiao, W.; Song, Y.; Xu, D. Spatiotemporal characteristics of meteorological to hydrological drought propagation under natural conditions in China. Weather Clim. Extrem. 2022, 38, 100505. [Google Scholar] [CrossRef]
  27. Geng, G.; Zhang, B.; Gu, Q.; He, Z.; Zheng, R. Drought propagation characteristics across China: Time, probability, and threshold. J. Hydrol. 2024, 631, 130805. [Google Scholar] [CrossRef]
  28. Zhao, A.; Xiang, K.; Zhang, A.; Zhang, X. Spatial-temporal evolution of meteorological and groundwater droughts and their relationship in the North China Plain. J. Hydrol. 2022, 610, 127903. [Google Scholar] [CrossRef]
  29. Fan, J.; Wang, T.; Feng, Y.; Wei, S.; Liu, W. Analysis of Meteorological-to-Hydrological Drought Propagation and Influencing Factors Across Arid and Humid Climate Regions in China. Atmosphere 2026, 17, 478. [Google Scholar] [CrossRef]
  30. Cheng, X.; Xu, Y.; Chen, J.; Liu, Q. The impact of climatic conditions, human activities, and catchment characteristics on the propagation from meteorological to agricultural and hydrological droughts in China. J. Geophys. Res. Atmos. 2023, 128, e2023JD039735. [Google Scholar] [CrossRef]
  31. Fawen, L.; Manjing, Z.; Yong, Z.; Rengui, J. Influence of irrigation and groundwater on the propagation of meteorological drought to agricultural drought. Agric. Water Manag. 2023, 277, 108099. [Google Scholar] [CrossRef]
  32. Xu, Y.; Lü, H.; Yagci, A.L.; Zhu, Y.; Liu, D.; Wang, Q.; Xu, H.; Pan, Y.; Su, J. Influence of groundwater on the propagation of meteorological drought to agricultural drought during crop growth periods: A case study in Huaibei Plain. Agric. Water Manag. 2024, 305, 109122. [Google Scholar] [CrossRef]
  33. Shi, W.; Wang, M.; Tao, F.; Xu, X.; Deng, X.; Liu, L.; Kong, X.; Zuo, L.; Lei, M.; Shi, X. Wheat redistribution in Huang-Huai-Hai, China, could reduce groundwater depletion and environmental footprints without compromising production. Commun. Earth Environ. 2024, 5, 380. [Google Scholar] [CrossRef]
  34. Liu, W.; Zhang, Y. Temporal and spatial variations in drought and its impact on agriculture in China. Water 2024, 16, 1713. [Google Scholar] [CrossRef]
  35. Liu, Q.; Yang, Y.; Liang, L.; Jun, H.; Yan, D.; Wang, X.; Li, C.; Sun, T. Thresholds for triggering the propagation of meteorological drought to hydrological drought in water-limited regions of China. Sci. Total Environ. 2023, 876, 162771. [Google Scholar] [CrossRef] [PubMed]
  36. Fu, D.; Jin, X.; Jin, Y.; Mao, X.; Yao, N. Remote sensing-based monitoring of compound drought-waterlogging stress in groundwater-sensitive agroecosystems in arid regions. Agric. Water Manag. 2025, 319, 109826. [Google Scholar] [CrossRef]
  37. Wahla, S.S.; Kazmi, J.H.; Sharifi, A.; Shirazi, S.A.; Tariq, A.; Joyell Smith, H. Assessing spatio-temporal mapping and monitoring of climatic variability using SPEI and RF machine learning models. Geocarto Int. 2022, 37, 14963–14982. [Google Scholar] [CrossRef]
  38. Molnar, C.; König, G.; Herbinger, J.; Freiesleben, T.; Dandl, S.; Scholbeck, C.A.; Casalicchio, G.; Grosse-Wentrup, M.; Bischl, B. General pitfalls of model-agnostic interpretation methods for machine learning models. In Proceedings of the International Workshop on Extending Explainable AI Beyond Deep Models and Classifiers; Springer: Cham, Switzerland, 2020; pp. 39–68. [Google Scholar]
  39. Gu, X.; Li, Y.; Zhang, Y.; Hussain, A.; Jamshidi, S.; Gu, L.; Wang, D. Evaluating the propagation process of meteorological, hydrological, and agricultural drought dynamics in the Yellow river basin. Sci. Rep. 2026, 16, 14564. [Google Scholar] [CrossRef] [PubMed]
  40. Houmma, I.H.; Hadri, A.; Boudhar, A.; Karaoui, I.; Oussaoui, S.; El Khalki, E.M.; Chehbouni, A.; Kinnard, C. Analysis of the propagation characteristics of meteorological drought to hydrological drought and their joint effects on low-flow drought variability in the Oum Er Rbia Watershed, Morocco. Remote Sens. 2025, 17, 281. [Google Scholar] [CrossRef]
  41. Feng, K.; Yuan, H.; Wang, Y.; Li, Y.; Wang, X.; Wang, F.; Su, X.; Zhang, Z. Propagation dynamics from meteorological to agricultural drought in Northwestern China: Key influencing factors. Agronomy 2024, 14, 1987. [Google Scholar] [CrossRef]
  42. Wu, D.; Hu, Z. Characterization of drought propagation over the Tibetan Plateau. J. Hydrol. Reg. Stud. 2024, 56, 102035. [Google Scholar] [CrossRef]
  43. Shi, P.; Tang, H.; Qu, S.; Zhao, L.; Li, Q. Drought propagation in karst and non-karst regions in Southwest China compared on a daily scale. J. Hydrol. Reg. Stud. 2024, 51, 101628. [Google Scholar] [CrossRef]
  44. Tan, X.; Luo, S.; Li, H.; Hao, X.; Wang, J.; Dong, Q.; Chen, Z. Investigating the effects of snow cover and vegetation on soil temperature using remote sensing indicators in the three river source region, China. Remote Sens. 2022, 14, 4114. [Google Scholar] [CrossRef]
  45. Lin, X.; Niu, J.; Berndtsson, R.; Yu, X.; Zhang, L.; Chen, X. NDVI dynamics and its response to climate change and reforestation in northern China. Remote Sens. 2020, 12, 4138. [Google Scholar] [CrossRef]
  46. Zhang, X.; Wang, N.a.; Xie, Z.; Ma, X.; Huete, A. Water loss due to increasing planted vegetation over the Badain Jaran Desert, China. Remote Sens. 2018, 10, 134. [Google Scholar] [CrossRef]
  47. Bodner, G.; Nakhforoosh, A.; Kaul, H.-P. Management of crop water under drought: A review. Agron. Sustain. Dev. 2015, 35, 401–442. [Google Scholar]
  48. Lloret, F.; Batllori, E. Climate-induced global forest shifts due to heatwave-drought. In Ecosystem Collapse and Climate Change; Springer: Cham, Switzerland, 2021; pp. 155–186. [Google Scholar]
  49. Li, Y.; Liu, D.; Li, T.; Fu, Q.; Liu, D.; Hou, R.; Meng, F.; Li, M.; Li, Q. Responses of spring soil moisture of different land use types to snow cover in Northeast China under climate change background. J. Hydrol. 2022, 608, 127610. [Google Scholar] [CrossRef]
  50. Qing, Y.; Wang, S.; Yang, Z.L.; Gentine, P.; Zhang, B.; Alexander, J. Accelerated soil drying linked to increasing evaporative demand in wet regions. npj Clim. Atmos. Sci. 2023, 6, 205. [Google Scholar] [CrossRef]
  51. Zhang, Q.; Shi, R.; Singh, V.P.; Xu, C.-Y.; Yu, H.; Fan, K.; Wu, Z. Droughts across China: Drought factors, prediction and impacts. Sci. Total Environ. 2022, 803, 150018. [Google Scholar] [CrossRef] [PubMed]
  52. Li, D.; Ouyang, W.; Wang, L.; Chen, J.; Zhang, H.; Sharkhuu, A.; Tseren-Ochir, S.-E.; Yang, Y. Revisiting snowmelt dynamics and its impact on soil moisture and vegetation in mid-high latitude watershed over four decades. Agric. For. Meteorol. 2025, 362, 110353. [Google Scholar] [CrossRef]
  53. Qian, Z.; Sun, Y.; Ma, Q.; Gu, Y.; Feng, T.; Feng, G. Understanding changes in heat waves, droughts, and compound events in Yangtze River Valley and the corresponding atmospheric circulation patterns. Clim. Dyn. 2024, 62, 539–553. [Google Scholar] [CrossRef]
  54. Chen, J.; Yan, F.; Lu, Q. Spatiotemporal variation of vegetation on the Qinghai–Tibet Plateau and the influence of climatic factors and human activities on vegetation trend (2000–2019). Remote Sens. 2020, 12, 3150. [Google Scholar] [CrossRef]
  55. Qin, G.; Wang, N.; Wu, Y.; Zhou, S.; Meng, Z. Quantifying the contribution of climate change and human activities to surface drought in Qinghai, northeastern Qinghai-Tibetan Plateau. Theor. Appl. Climatol. 2024, 155, 6099–6117. [Google Scholar] [CrossRef]
  56. Cao, S.; Cao, G.; Wang, Z.; Hou, Y.; Wang, Y.; Kang, L. Isotopic hydrological links among precipitation, river water and groundwater in an alpine mountain basin, NE Qinghai–Tibet Plateau in warm seasons. Environ. Earth Sci. 2022, 81, 366. [Google Scholar] [CrossRef]
  57. Liu, Y.; Huang, S.; Guo, Y.; Liu, Y.; Li, Z.; Huang, Q. Propagation threshold of meteorological drought to different levels of hydrological drought. A case study of Qinhe River basin. J. Hydroelectr. Eng. 2022, 41, 9–19. [Google Scholar]
  58. Xu, Z.; Guo, X.; Wu, Z.; Li, G. Spatiotemporal dynamic characteristics and influencing factors of propagation time from meteorological drought to agricultural drought. J. Hydrol. Reg. Stud. 2025, 62, 102806. [Google Scholar] [CrossRef]
  59. Liu, X.; Zhu, Z.; Liu, X.; Yu, M. Thresholds of key disaster-inducing factors and drought simulation in the Xilinguole Grassland. Ecol. Inform. 2021, 64, 101380. [Google Scholar] [CrossRef]
  60. Hassler, B.; Lauer, A. Comparison of reanalysis and observational precipitation datasets including ERA5 and WFDE5. Atmosphere 2021, 12, 1462. [Google Scholar] [CrossRef]
  61. Xu, J.; Ma, Z.; Yan, S.; Peng, J. Do ERA5 and ERA5-land precipitation estimates outperform satellite-based precipitation products? A comprehensive comparison between state-of-the-art model-based and satellite-based precipitation products over mainland China. J. Hydrol. 2022, 605, 127353. [Google Scholar] [CrossRef]
  62. Chen, T.; Castellarin, A.; Zhu, Y.; Lyu, H.; Magnini, A.; Fu, Y.; Li, Y.; Lin, Y.; Ding, Z.; Liu, J. The attribution of subseasonal extreme precipitation in arid and semi-arid regions based on extended convergent cross mapping. J. Hydrol. 2025, 663, 134128. [Google Scholar] [CrossRef]
  63. Shi, H.; Zhao, Y.; Liu, S.; Cai, H.; Zhou, Z. A new perspective on drought propagation: Causality. Geophys. Res. Lett. 2022, 49, e2021GL096758. [Google Scholar] [CrossRef]
  64. Sugihara, G.; May, R.; Ye, H.; Hsieh, C.-h.; Deyle, E.; Fogarty, M.; Munch, S. Detecting causality in complex ecosystems. Science 2012, 338, 496–500. [Google Scholar] [CrossRef] [PubMed]
Figure 1. Overview of the study area and environmental background: (a) location of the study area and six regional divisions in China; (b) digital elevation model (DEM); (c) mean annual temperature during 2003–2024; (d) mean annual precipitation during 2003–2024; (e) land cover types in 2024; (f) NDVI in 2024; and (g) NDVI change from 2003 to 2024.
Remotesensing 18 02615 g001
Figure 2. Flowchart of research methodology.
Remotesensing 18 02615 g002
Figure 3. Spatial distribution of drought propagation times estimated using the Granger causality (GC) and maximum positive correlation coefficient (CC) methods: (a) Stage 1 propagation from meteorological drought to soil drought estimated using the GC method; (b) Stage 2 propagation from soil drought to groundwater drought estimated using the GC method; (c) Stage 1 propagation from meteorological drought to soil drought estimated using the CC method; and (d) Stage 2 propagation from soil drought to groundwater drought estimated using the CC method.
Remotesensing 18 02615 g003
Figure 4. Relative importance of environmental factors identified via random forest in Stage 1 (bar) and Stage 2 (polar) across six regions (GC).
Remotesensing 18 02615 g004
Figure 5. Relative importance of environmental factors identified via random forest in Stage 1 (bar) and Stage 2 (polar) across six regions (CC).
Remotesensing 18 02615 g005
Figure 6. Cross-method sensitive intervals of recurrent important factors in Stage1. Red and blue lines represent the LOWESS-smoothed responses derived from the GC-based and maximum-positive-correlation-based propagation times, respectively. Pink and light-blue shading indicate Bootstrap-supported sensitive intervals with support ≥0.7 for the GC-based and correlation-based results. Purple shading indicates the numerical overlap between the two method-specific Bootstrap-supported intervals. An overlapping interval was interpreted as a cross-method empirical sensitive interval only when the corresponding response directions were broadly consistent. Divergence or opposite response directions outside the cross-method overlapping interval indicate method dependence in the fitted predictor–propagation time relationship and should not be interpreted as evidence of opposite physical effects. Method-specific or directionally inconsistent ranges were not retained as cross-method empirical sensitive intervals.
Remotesensing 18 02615 g006
Figure 7. Cross-method sensitive intervals of recurrent important factors in Stage 2. The caption is consistent with the caption of Figure 6.
Remotesensing 18 02615 g007
Figure 8. Stratified comparison of the NDVI–propagation time relationship under different long-term irrigation-density conditions in North China during Stage 1. High irrigation density denotes grid cells with a 2003–2024 mean irrigated-cropland proportion of ≥10%, whereas low irrigation density denotes grid cells with a mean proportion of <10%. Irrigation density represents the spatial proportion of irrigated cropland rather than irrigation water level or irrigation amount. The curves show RF-fitted NDVI–propagation time relationships for the two groups.
Remotesensing 18 02615 g008
Figure 9. Spatial correspondence between temperature-sensitive areas and drought propagation time in Southeast China. Panel (a) shows areas where temperature exceeded approximately 18 °C, representing conditions beyond the upper part of the identified sensitive transition interval. Panel (b) shows the corresponding soil-to-groundwater drought propagation time. Their spatial correspondence indicates that temperatures above this transition range are associated with shorter propagation times.
Remotesensing 18 02615 g009
Table 1. A summary of the datasets used in this study.
Data VariableData SourceTime RangeTemporal ResolutionSpatial Resolution
PrecipitationERA5-LAND2003–2024Monthly0.1° × 0.1°
Potential evapotranspirationERA5-LAND2003–2024Monthly0.1° × 0.1°
RunoffERA5-LAND2003–2024Monthly0.1° × 0.1°
TemperatureERA5-LAND2003–2024Monthly0.1° × 0.1°
Root zone soil moistureGLEAMv3.7 dataset2003–2024Monthly0.1° × 0.1°
Total soil moistureGLDAS Noah Land Surface Model2003–2024Monthly0.25° × 0.25°
Snow water equivalentGLDAS Noah Land Surface Model2003–2024Monthly0.25° × 0.25°
Total water storage anomalyGRACE RL06 Mascon2003–2024Monthly0.25° × 0.25°
NDVINational Tibetan Plateau Scientific Data Center2003–2024Monthly250 m
DEMGEBCO Compilation GroupStaticStatic500 m
GDPChina City Statistical Yearbook2003–2024Monthly0.25° × 0.25°
IrrigationAnnual maps of China’s irrigated cropland2003–2024Annual250 m
Sand/clayCSDLv2StaticStatic1 km
Groundwater levelChina Geological Environment Monitoring Groundwater Level Yearbook2005–2024Monthly1 km
Table 2. Significance-screening results for GC- and CC-based lagged drought relationships.
PhaseTested Lagged RelationshipRaw_Significant_GridsFDR_Significant_GridsRemoved_By_FDRRetention_Rate_%Removed_Rate_%
GC-Stage1SPI–SSI66465205144178.3621.64
GC-Stage2SSI–GWSA-DSI47783636114276.1023.90
CC-Stage1SPI–SSI7010640460691.368.64
CC-Stage2SSI–GWSA-DSI3998363836091.009.00
Table 3. Comparison of RF-derived dominant factors between GC-based and maximum-correlation-based propagation time definitions.
RegionStageTop Three Factors Based on GCTop Three Factors Based on CC
NCStage1NDVI, GDP, ElevationMean annual precipitation, NDVI, PET
Stage2Temperature, NDVI, PETTemperature, Elevation, Sand content
NEStage1Slope, PET, TemperatureTemperature, PET, Runoff
Stage2Mean annual precipitation, Slope, TemperatureMean annual precipitation, Slope, Temperature
NWStage1Mean annual precipitation, PET, NDVITemperature, Clay content, Sand content
Stage2NDVI, Elevation, TemperatureGDP, Elevation, Mean annual precipitation
SEStage1PET, Sand content, GDPTemperature, Elevation, PET
Stage2Temperature, PET, Mean annual precipitationTemperature, PET, Mean annual precipitation
SWStage1PET, Elevation, Sand contentPET, Elevation, Temperature
Stage2PET, Sand content, GW depthPET, Temperature, NDVI
TPStage1Elevation, Mean annual precipitation, NDVIElevation, Mean annual precipitation, Clay content
Stage2PET, Mean annual precipitation, ElevationSlope, Temperature, Mean annual precipitation
Disclaimer/Publisher’s Note: The statements, opinions and data contained in all publications are solely those of the individual author(s) and contributor(s) and not of MDPI and/or the editor(s). MDPI and/or the editor(s) disclaim responsibility for any injury to people or property resulting from any ideas, methods, instructions or products referred to in the content.