1. Introduction
Dynamic assessment of the Ecological Security Pattern (ESP) at national and regional scales, coupled with future scenario simulations, is essential for enhancing ecological early-warning capacity, promoting spatial optimization, and supporting regional sustainable development [
1,
2]. In China, intensive human activities and large-scale development strategies have profoundly reshaped regional land-use structures, exacerbating the spatial conflict between urban expansion and ecosystem conservation [
3]. To mitigate these conflicts and achieve adaptive environmental governance, quantitatively modeling and optimizing the spatial topology of ecosystems is crucial. ESP, which represents the potential spatial network of ecosystems shaped by the distribution and interactions of key ecological elements across the landscape, has become an important basis for decision support in regional ecological management and spatial planning [
4,
5,
6].
In recent years, as the concept of ecosystem services (ES) has been increasingly incorporated into ESP research, ESP research has gradually shifted from structure-oriented analyses to function-oriented assessments [
7,
8,
9]. Early ES research was largely centered on monetary valuation and macro-level natural capital accounting, primarily to enhance public and policymakers’ recognition of ecological value [
10]. However, growing evidence suggests that uniform approaches based on static estimates often obscure the spatial heterogeneity of ecological processes in complex geographical settings, thereby constraining their applicability to land-use optimization and meso- and micro-scale spatial management [
11]. Recent advances in geospatial analysis have shifted ES research from conventional economic valuation toward dynamic, multidimensional analyses of spatial trade-offs. This methodological shift helps overcome the limitations of traditional approaches that rely on static land-cover patterns and provide limited insight into underlying driving mechanisms. It also creates new opportunities to integrate ESs into ESP research. By combining ecosystem service assessment with ESP analysis, researchers can identify key geographical factors that support regional ecosystem stability and provide a scientific basis for refined, cross-regional ecological conservation policies.
As research on this coupled framework has advanced, ESP construction has shifted from subjective, qualitative approaches to more objective, quantitative methods. This transition has contributed to a research paradigm centered on the identification of ecological sources, the delineation of ecological barriers, and the construction of ecological corridors [
12]. The identification of ecological sources is fundamental to understanding landscape dynamics and constructing ESP. Two main approaches are commonly used to identify ecological sources. The first approach is based on Morphological Spatial Pattern Analysis (MSPA). This approach applies morphological operations to land-use/land-cover change (LUCC) data to extract core landscape areas, which are then identified as ecological sources [
13,
14]. However, MSPA is primarily suited to spatial-structure analysis and has limited applicability to policy-oriented tasks, such as delineating ecological conservation redlines or functional zones [
15]. The second approach identifies ecological sources by assessing ES using the Integrated Valuation of ESs and Tradeoffs (InVEST) model. This approach quantitatively identifies hotspots of multiple ESs as ecological source areas. The InVEST model is well aligned with contemporary goals of ecological civilization construction, and its outputs have been widely applied in ecological compensation and spatial decision-support systems [
16,
17]. For ecological corridor identification, an integrated approach combining the Minimum Cumulative Resistance (MCR) model and Circuit Theory (CT) has become increasingly common [
18,
19]. The MCR model identifies potential corridors by calculating least-cost paths between ecological sources, whereas circuit theory simulates ecological flows as random walks across a resistance surface [
20]. CT uses current-density patterns to identify multiple potential pathways and ecological pinch points while accounting for landscape permeability and corridor width [
21]. This combined approach more realistically captures dispersal barriers in heterogeneous landscapes and helps overcome the limitation of the standalone MCR model, which tends to represent connectivity through a single optimal pathway [
22]. Although the research framework for ESP has become increasingly sophisticated, its application remains largely limited to static evaluation, with gaps still existing in dynamic simulation and prediction.
In response to increasingly complex regional environmental changes, scholars have recognized that static assessments of ESs are no longer sufficient to meet the needs of sustainable development. Accordingly, dynamic modeling and prediction of regional ecosystem service trajectories under multi-scenario frameworks have become increasingly important [
23]. LUCC strongly shapes interactions between human activities and the natural environment, thereby influencing regional development patterns and ecosystem evolution [
24]. Therefore, accurate simulation of LUCC under different development scenarios is essential for effectively managing future regional ESP. Commonly used models for LUCC simulation include traditional Cellular Automata (CA) [
25], Conversion of Land Use and its Effects at Small Regional Extent (CLUE-S), and the Future Land Use Simulation (FLUS) model [
26]. However, these models remain limited in simulating complex land-surface processes. As a result, they may not fully capture the nonlinear evolution of land-use patches or the competition between natural vegetation and artificial landscapes under multiple drivers.
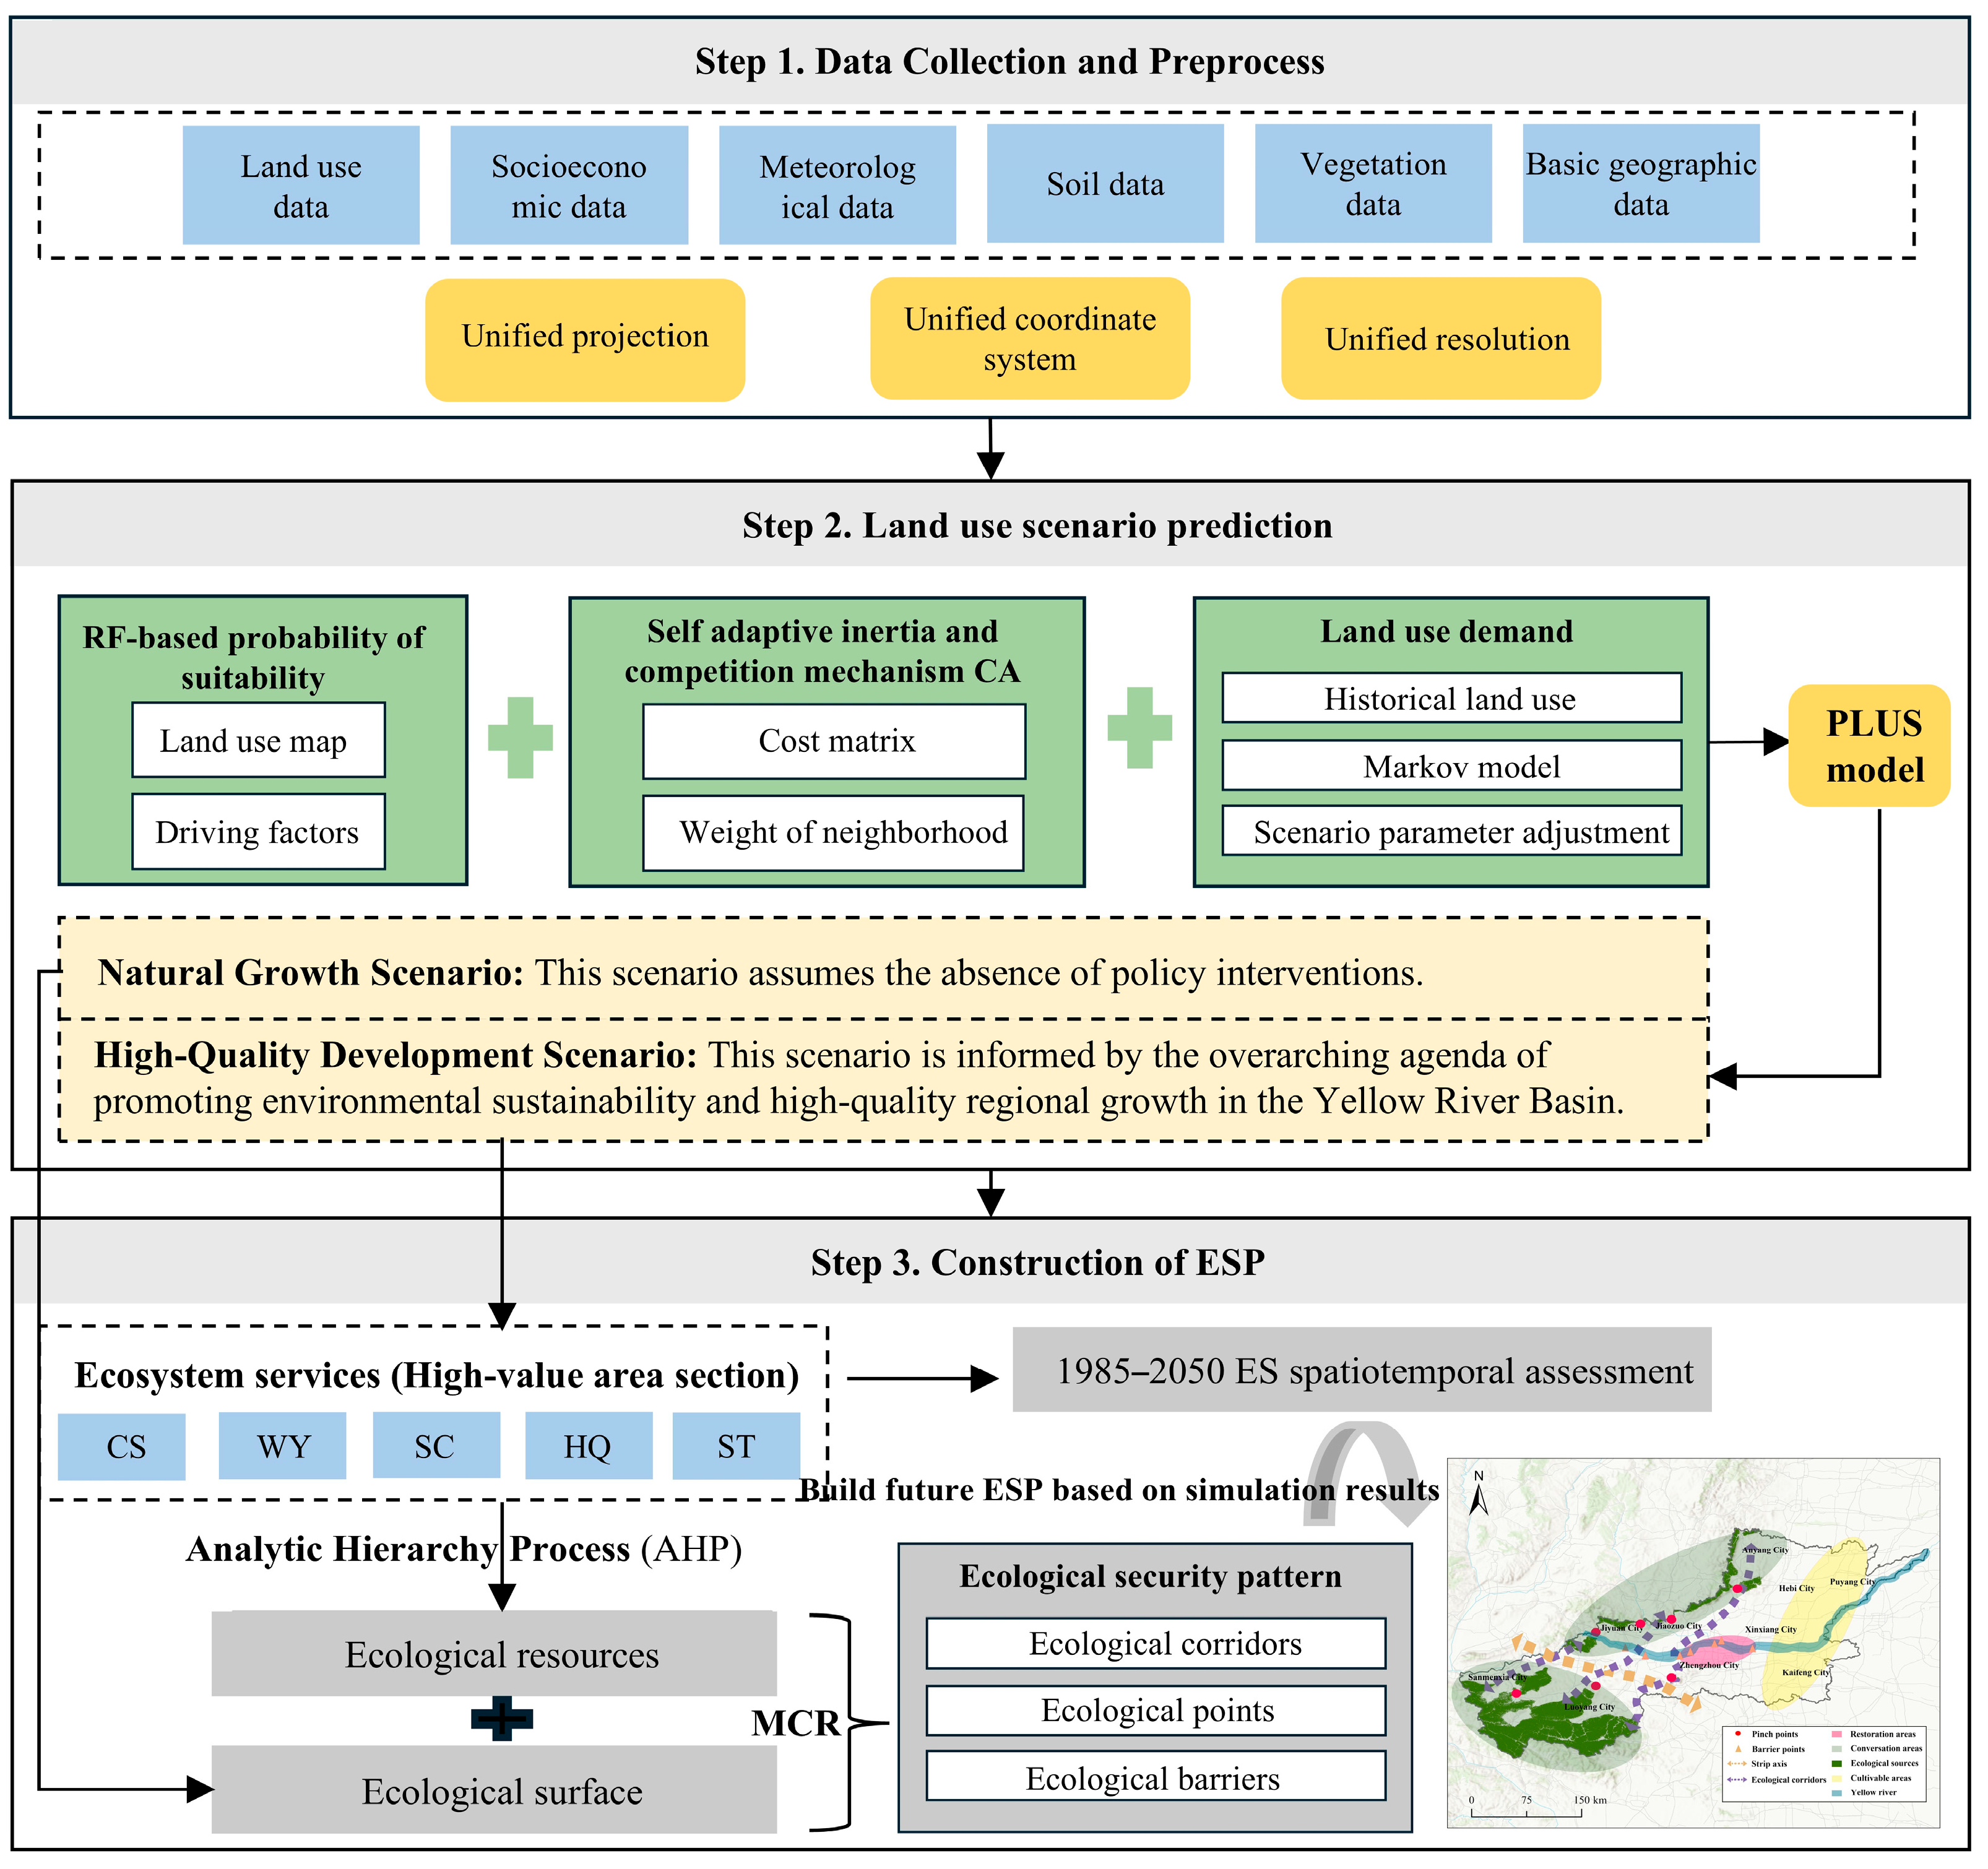
To address these technical challenges, the Patch-generating Land Use Simulation (PLUS) model has been developed. By integrating the Land Expansion Analysis Strategy (LEAS) with a cellular automata model based on multi-type random patch seeds (CARS), PLUS improves the simulation of patch-level changes across multiple land-use types. Therefore, it has been widely used to predict future land-use scenarios and support the optimization of regional ecological spaces [
27]. Despite its advantages in patch-based spatial simulation, several limitations remain in the application of PLUS to policy-informed LUCC simulation and subsequent ecosystem-service and ecological-security assessments [
28]. Policy constraints, including ecological conservation redlines, protected areas, permanent basic farmland, and urban development boundaries, have increasingly been incorporated into land-use scenario simulations through restricted-conversion zones or land-transition rules. These approaches are effective in preventing ecologically important areas from being converted into incompatible land-use types. However, many existing ecological conservation scenarios still represent policy intervention primarily through static spatial masks or generalized adjustments to future land-use demand. Region-specific policy objectives are therefore not always systematically translated into coordinated adjustments to land-use demand, conversion direction, transition probability, and spatial allocation.
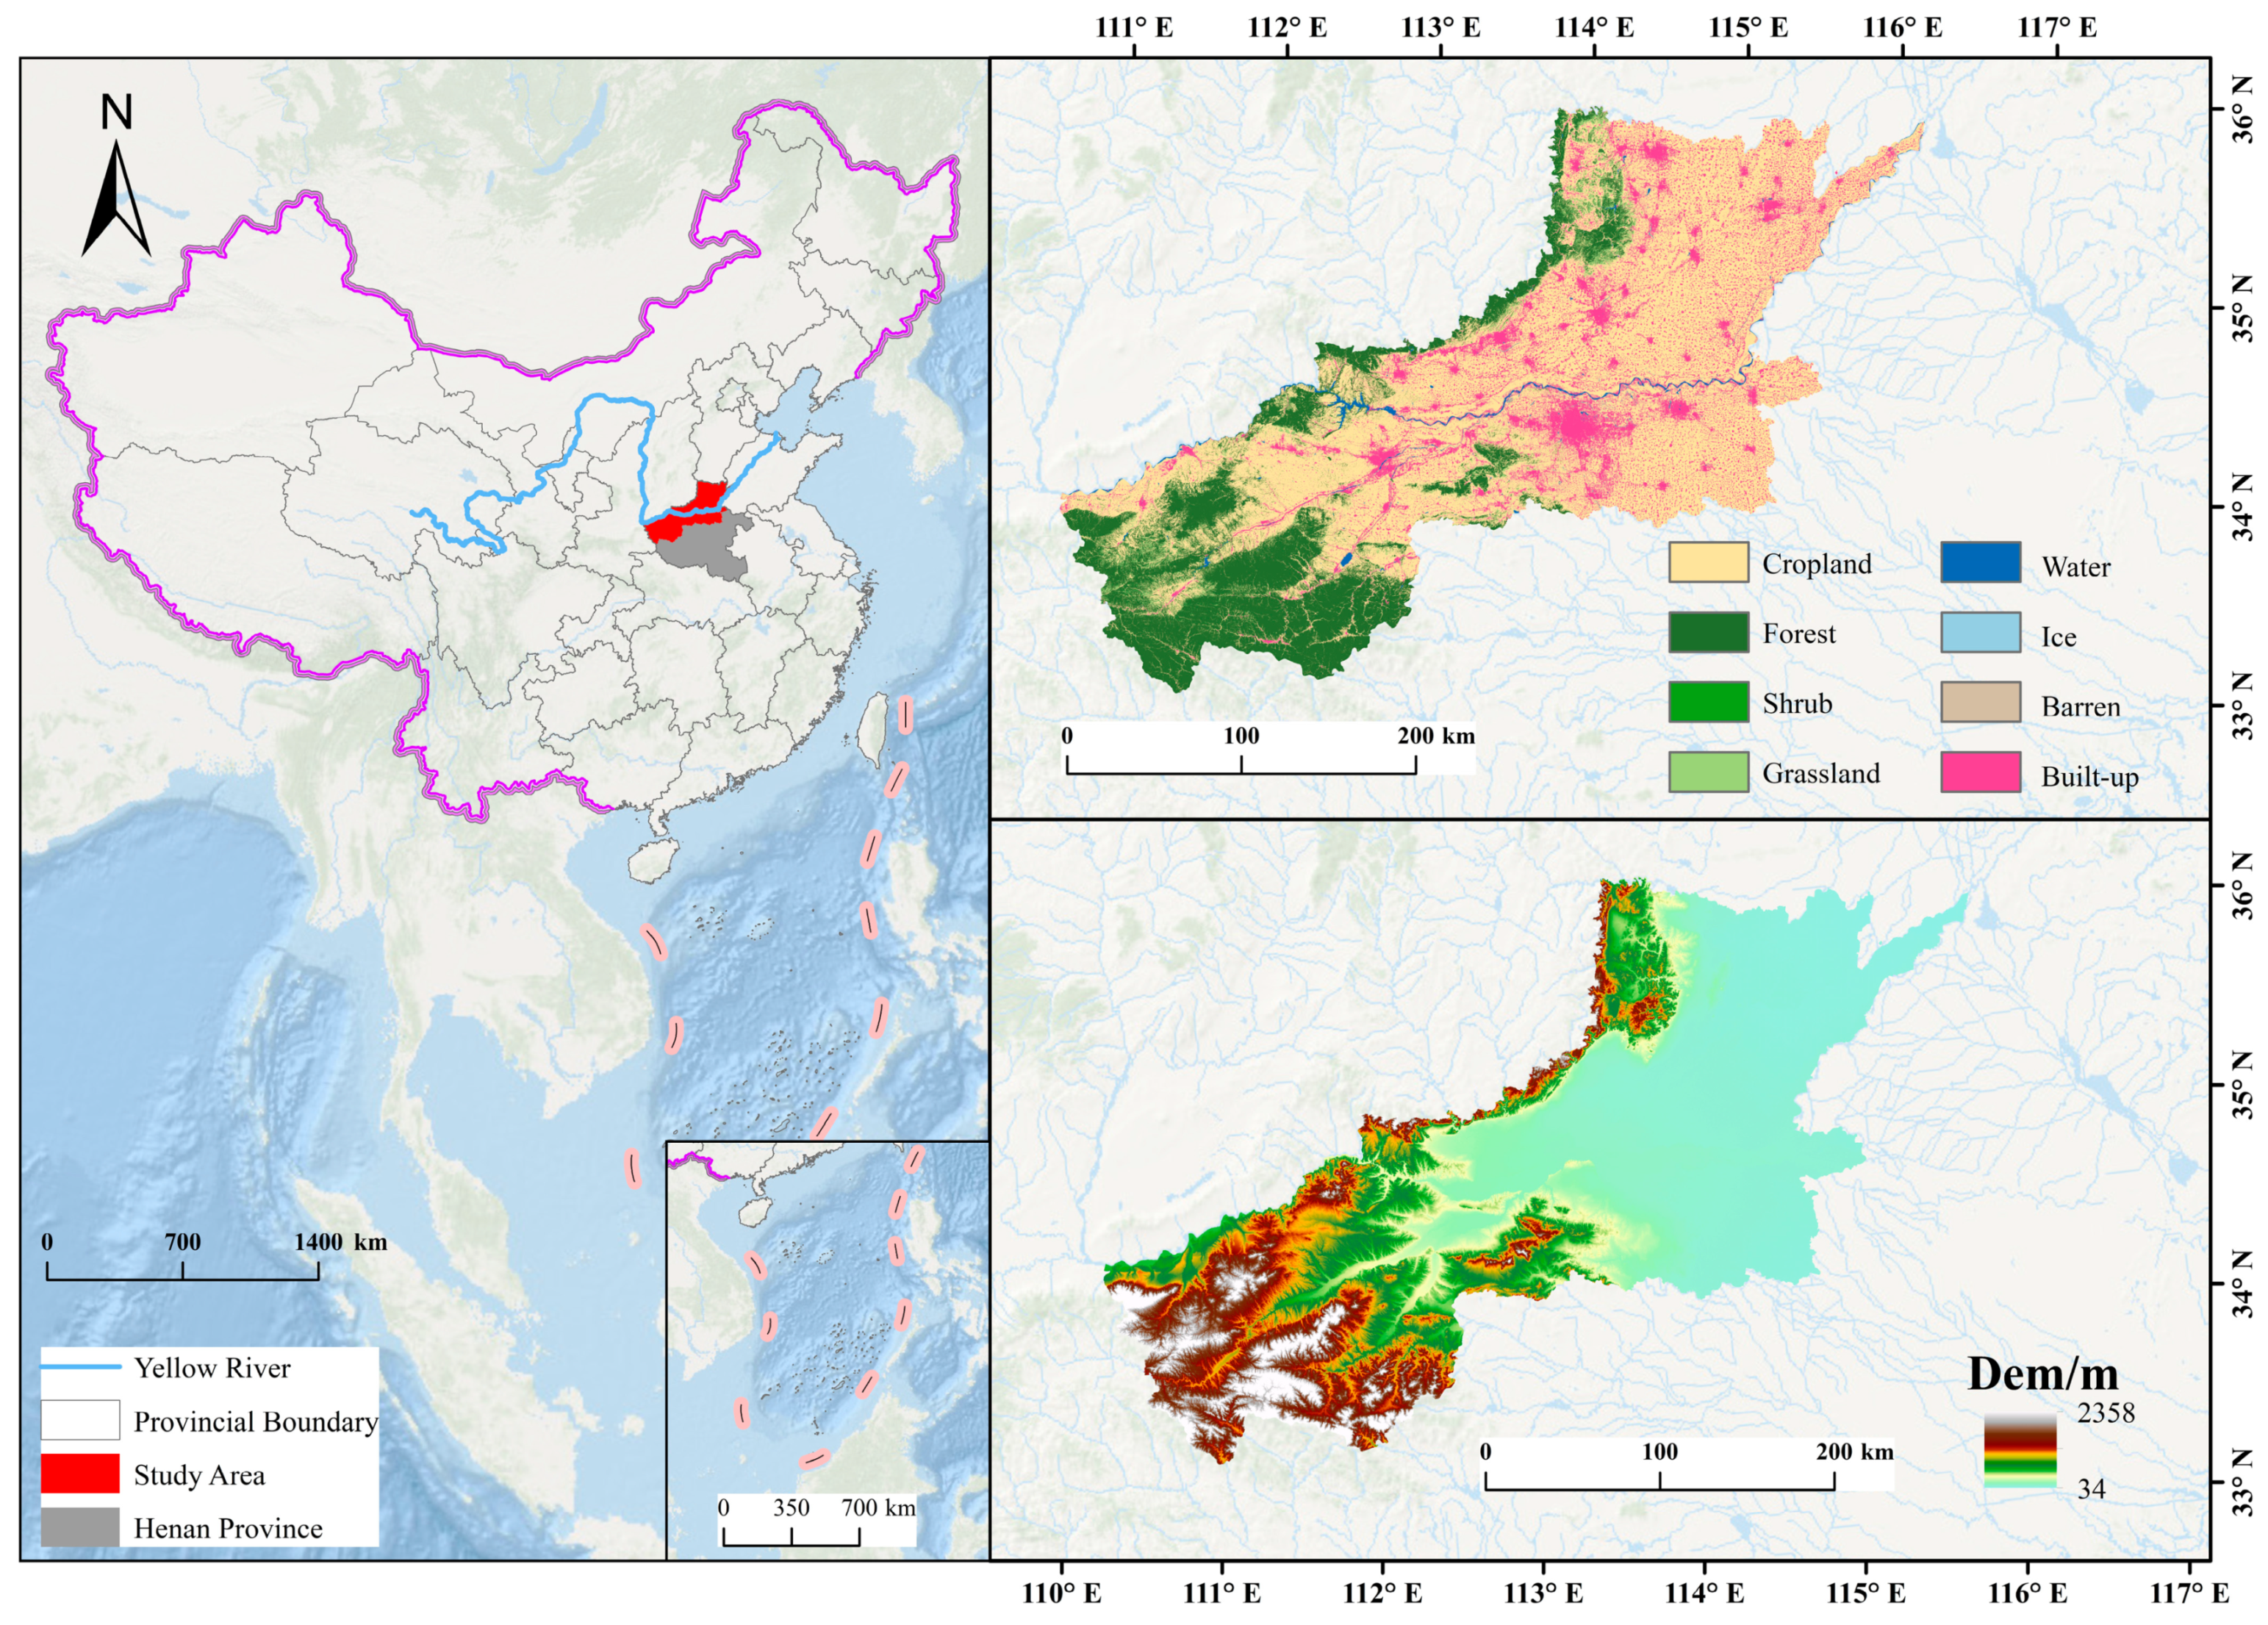
The Henan section of the Yellow River Basin (HYRB) is both an important national grain-producing region and a major development area of the Central Plains Urban Agglomeration. It is characterized by distinctive water–sediment interactions and pronounced ecological fragility, while facing increasing pressures from water scarcity, soil erosion, and urban expansion [
29]. In 2019, ecological protection and high-quality development in the Yellow River Basin were elevated to a major national strategy, providing an overarching framework for coordinating ecological conservation and regional development. Against this background, 2035 corresponds to China’s national objective of basically achieving socialist modernization and coincides with the planning horizon of the Henan Provincial Territorial Spatial Plan (2021–2035) [
30], whereas 2050 represents the mid-century vision of building a strong modern socialist country and provides a long-term horizon for evaluating policy effects [
31]. Accordingly, this study translated HYRB-specific policy mechanisms into spatial constraints and land-use transition rules within the PLUS model, established a High-Quality Development Scenario (HQDS), and compared it with a Natural Growth Scenario (NGS). Historical LUCC from 1985 to 2022 and future projections for 2035 and 2050 were simulated to assess the spatiotemporal responses of multiple ESs and construct ESP. The specific objectives are as follows: (1) develop a spatial modeling framework that translates macro-level policy objectives into explicit land-use constraints and transition rules; (2) simulate the spatiotemporal dynamics of multiple ESs and compare the spatially heterogeneous effects of the HQDS and NGS; and (3) construct an ecological network optimization framework to support policy-responsive ecological management and territorial spatial planning in the basin.
3. Results
3.1. Spatiotemporal Evolution of LUCC During 1985–2050
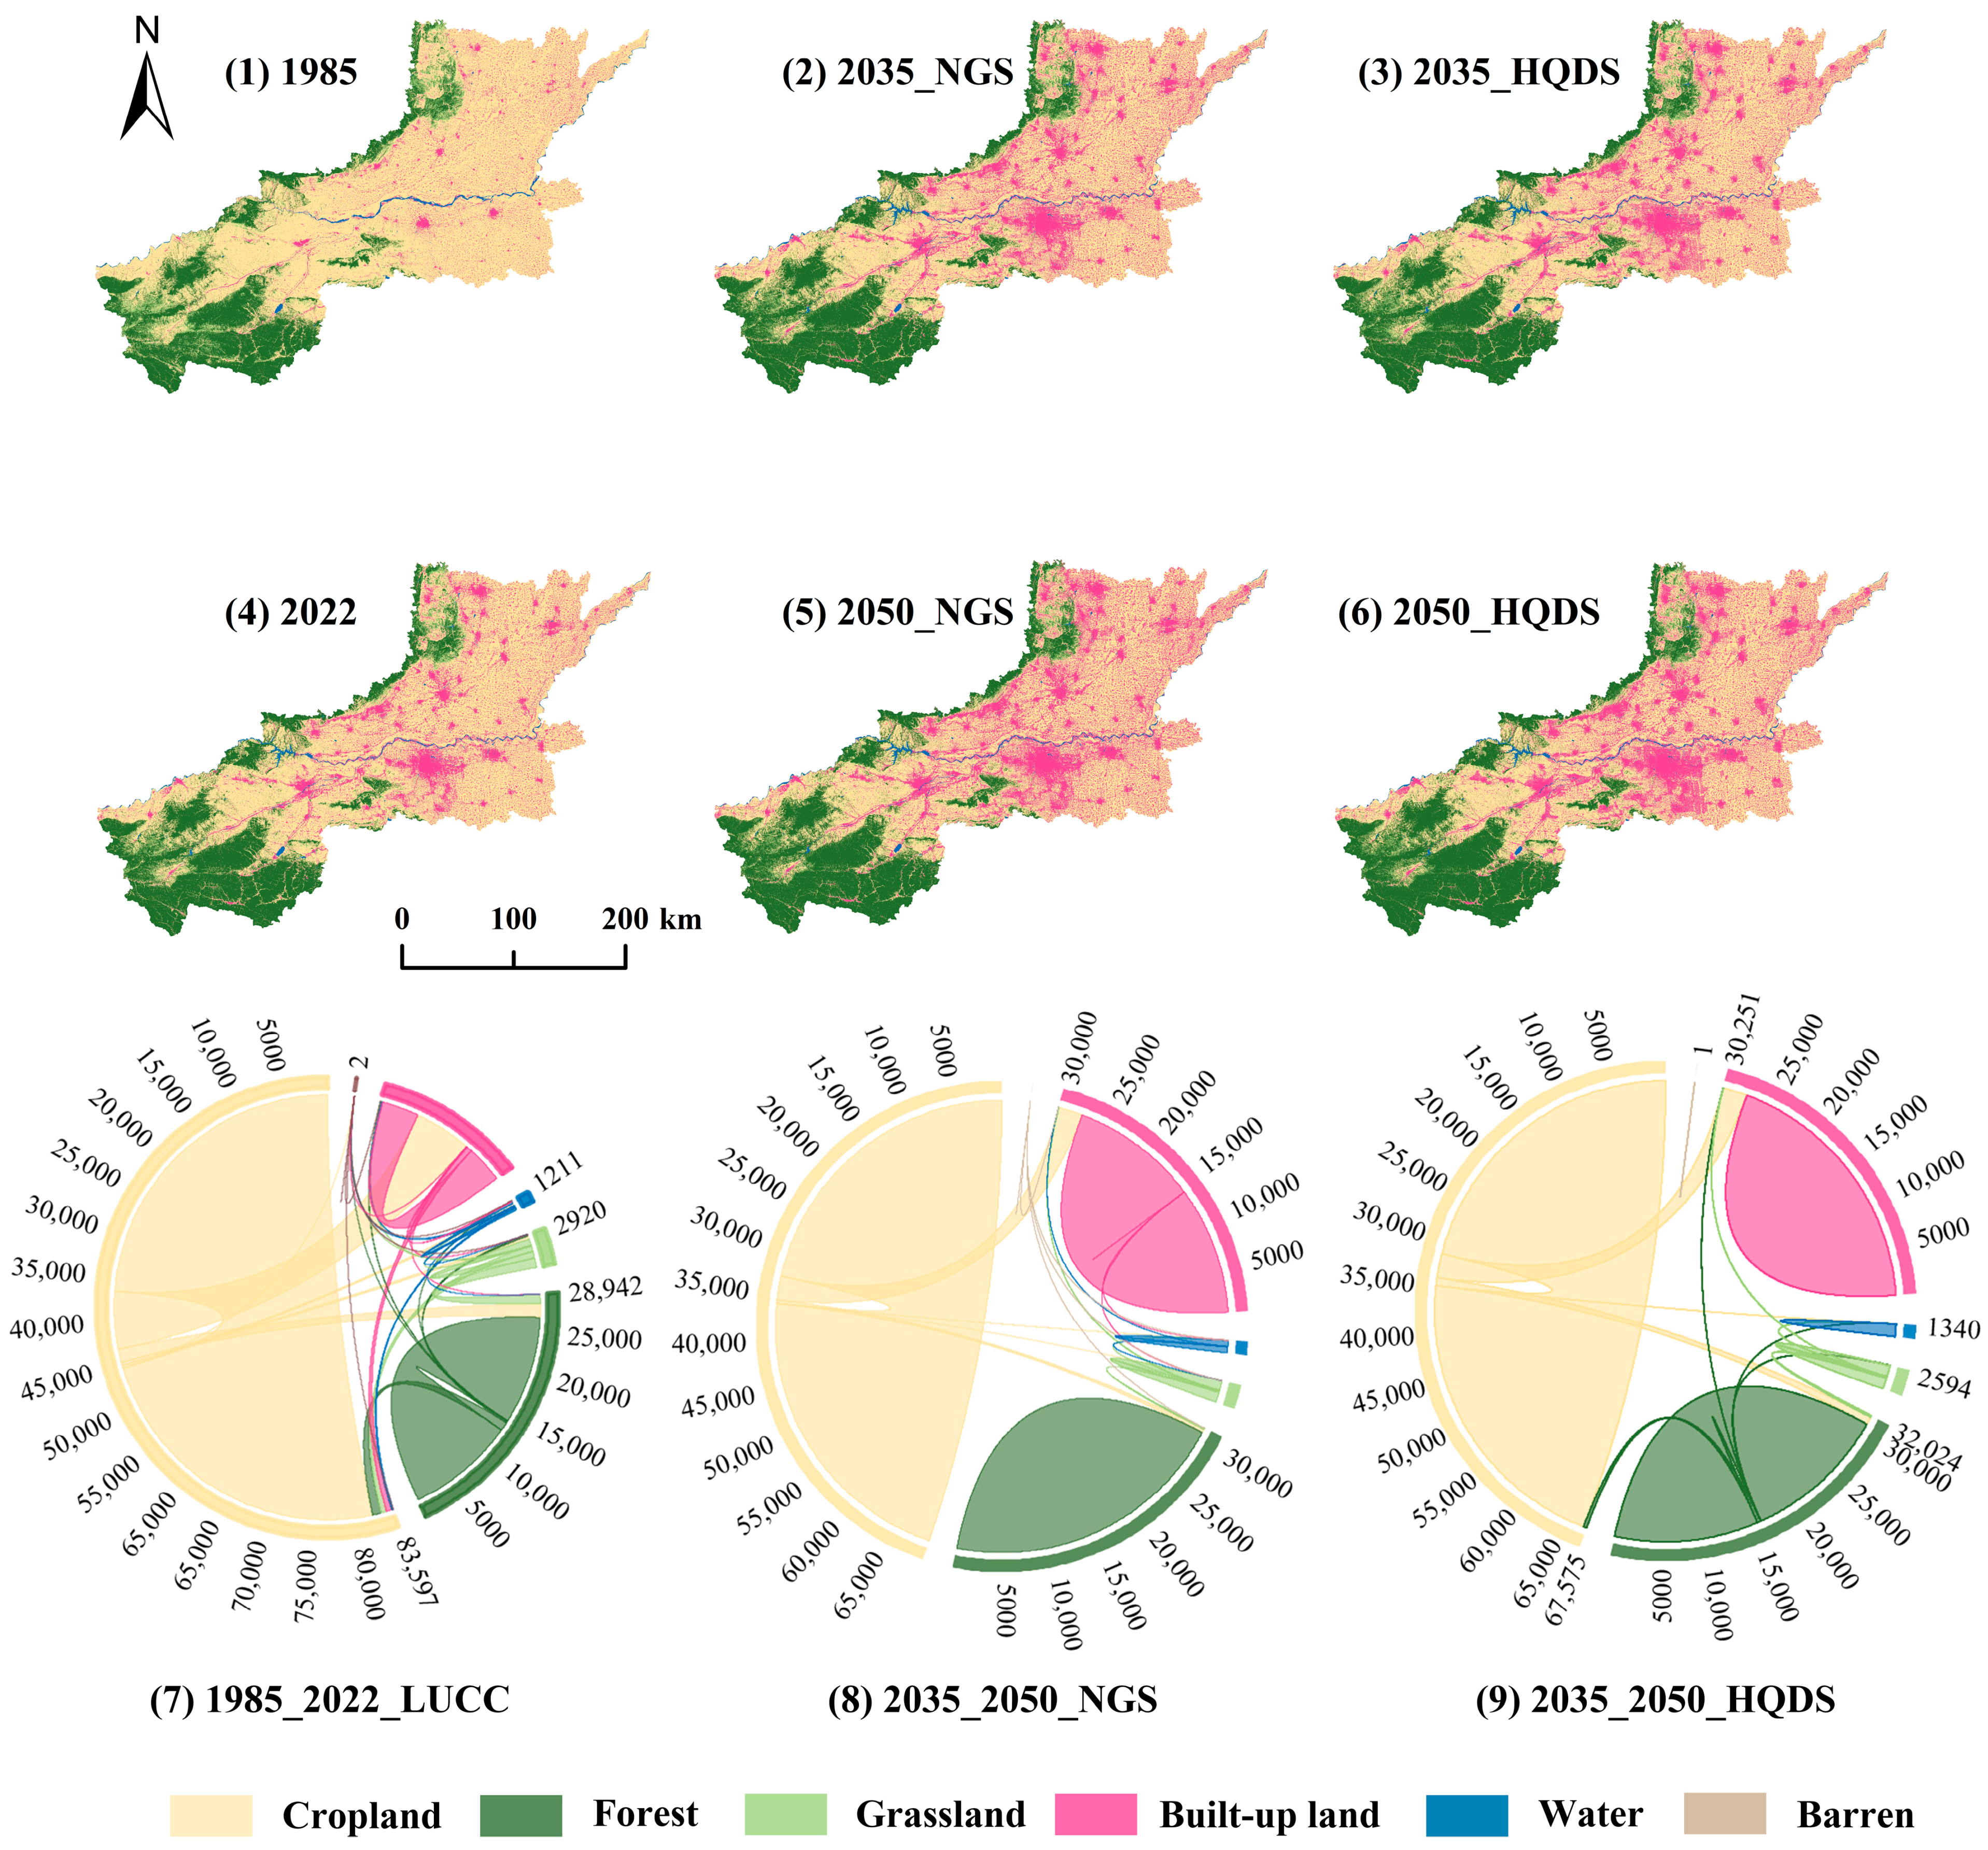
In summary, under both scenarios, cropland is projected to decline continuously from 1985 to 2050, whereas built-up land is expected to expand steadily, with most converted cropland transitioning into built-up land. Spatially, the study area is dominated by cropland, followed by forest and built-up land (
Figure 3). Cropland is predominantly distributed across the central and eastern plains, where abundant solar radiation and favorable hydrothermal conditions support intensive agricultural production. Forest is mainly distributed in the southern Funiu Mountains and northern Taihang Mountains, where relatively humid conditions and stable precipitation support montane forest ecosystems.
Historical LUCC data indicate that from 1985 to 2022, land-cover change in the region was primarily driven by urbanization and followed a clear pattern of “three increases and two decreases”—namely, increases in built-up land, forest, and water bodies, and decreases in cropland and grassland (
Table 3). During this period, cropland area declined steadily, with most cropland converted to built-up land (6643.34 km
2), followed by grassland (1536.11 km
2). Grassland area also declined overall, decreasing by 1271.57 km
2, mainly due to forest conversion (1128.54 km
2). Forest area fluctuated but increased overall, expanding by 1427.95 km
2, primarily through cropland conversion. The area of water bodies increased slightly by 110.91 km
2. Built-up land expanded steadily under continuous urbanization and became the land-cover type with the largest absolute change, increasing by 6162.03 km
2 over the 37 years. The expansion of built-up land was primarily driven by conversion from cropland (6643.34 km
2). Notably, a small portion of built-up land (618.99 km
2) was also converted back to cropland, indicating limited land-use reversals. Barren land accounted for only a marginal proportion of the study area and had limited influence on the overall land-use structure. Although barren land showed a relatively high rate of change, its absolute area remained minimal. Due to initial reclamation for forest and grassland, followed by rapid conversion to built-up land, barren land increased by only 0.61 km
2 during the study period. Under the HQDS, projected LUCC changes include losses of 3102.44 km
2 of cropland and 175.64 km
2 of grassland. Most converted cropland is expected to transition to built-up land (2596.81 km
2), whereas grassland is projected to be primarily converted to forest (193.40 km
2). No substantial changes are projected for water bodies or barren land.
3.2. Spatiotemporal Evolution of ESs During 1985–2050
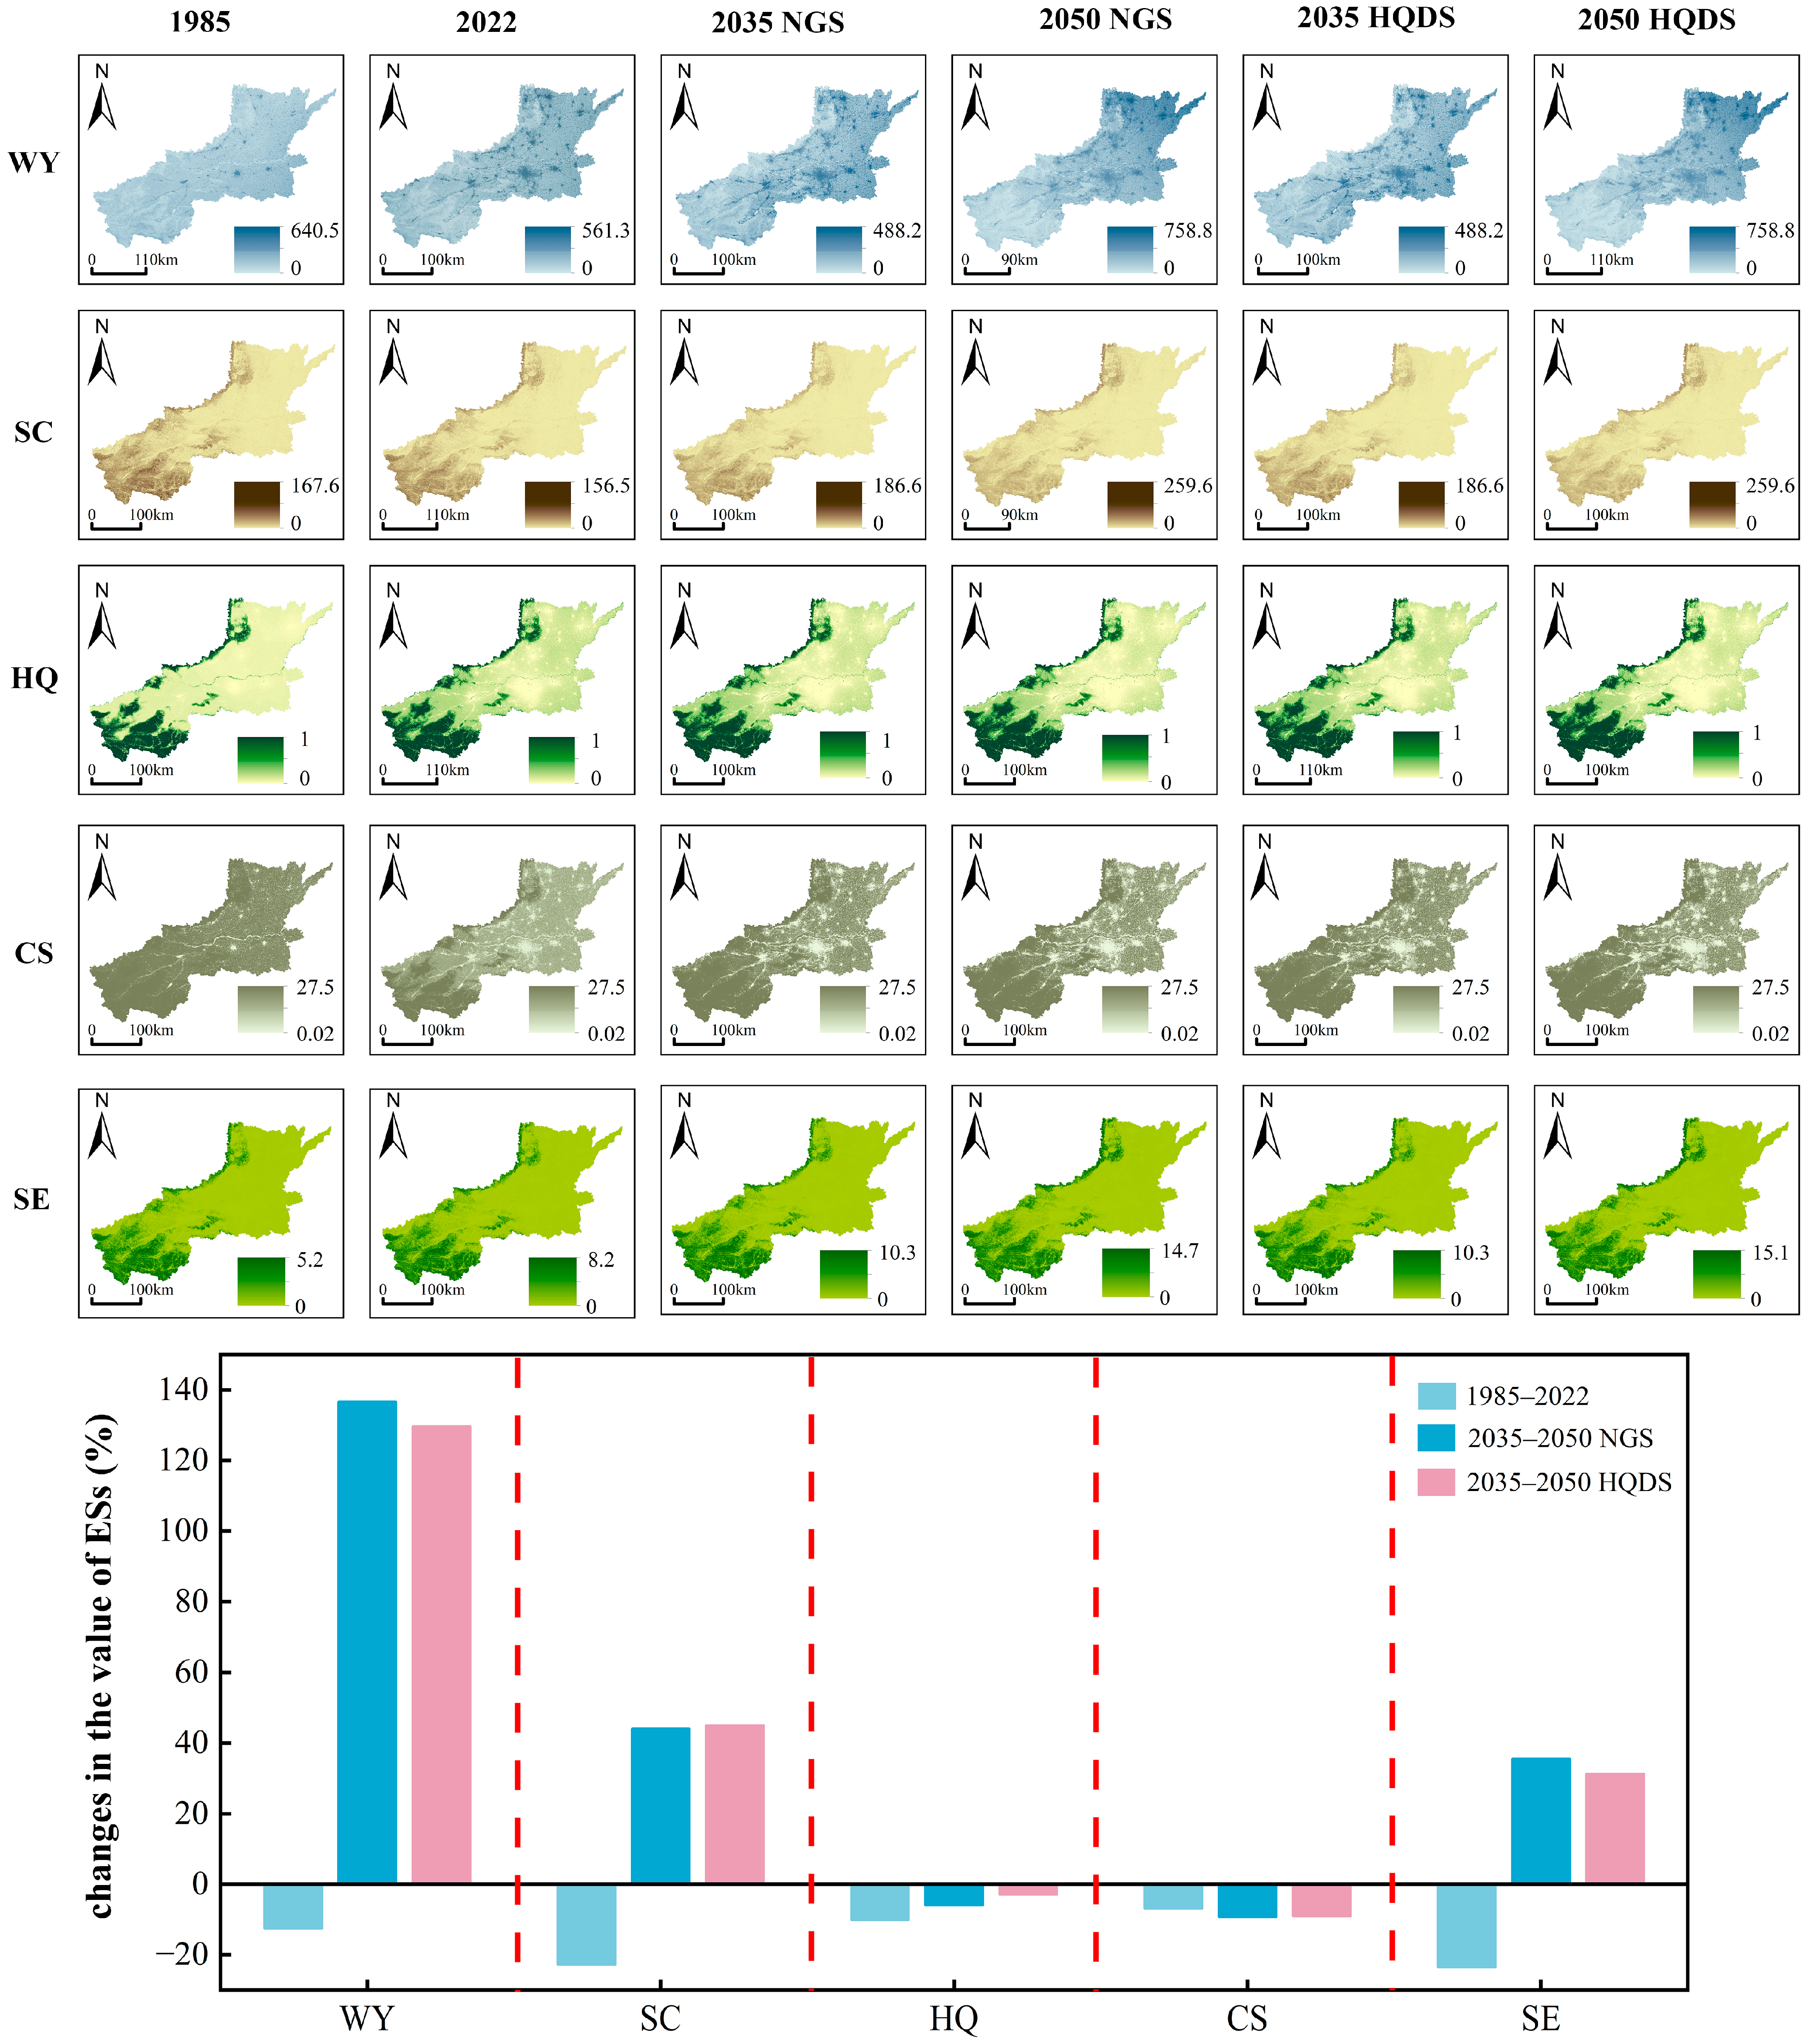
Overall, the four ESs and the raw sediment export output (SE) exhibited pronounced spatial heterogeneity during 1985–2050 (
Figure 4). WY showed a clear southwest–northeast gradient, with relatively low values in the southwest and progressively higher values toward the northeast. SC, HQ, and CS were generally higher in the mountainous and forested areas, particularly in the southwestern Funiu Mountains and the northern mountainous region, and lower in the central and eastern plains. These spatial patterns were consistent with the effects of topography, vegetation cover, and land-use structure. In contrast, SE was mainly concentrated in mountainous areas with relatively high erosion and sediment-delivery potential, whereas lower values were generally observed in the plain areas.
The temporal changes differed among the indicators and periods. From 1985 to 2022, WY, SC, HQ, and CS decreased to varying degrees, while SE also declined. During 2035–2050, WY and SC increased under both the NGS and HQDS, with WY showing the most pronounced increase. In contrast, HQ and CS decreased slightly under both scenarios. SE increased during the same period under both scenarios, but the magnitude of the increase was slightly lower under the HQDS than under the NGS.
3.3. Ecological Source Area Identification and Modeling
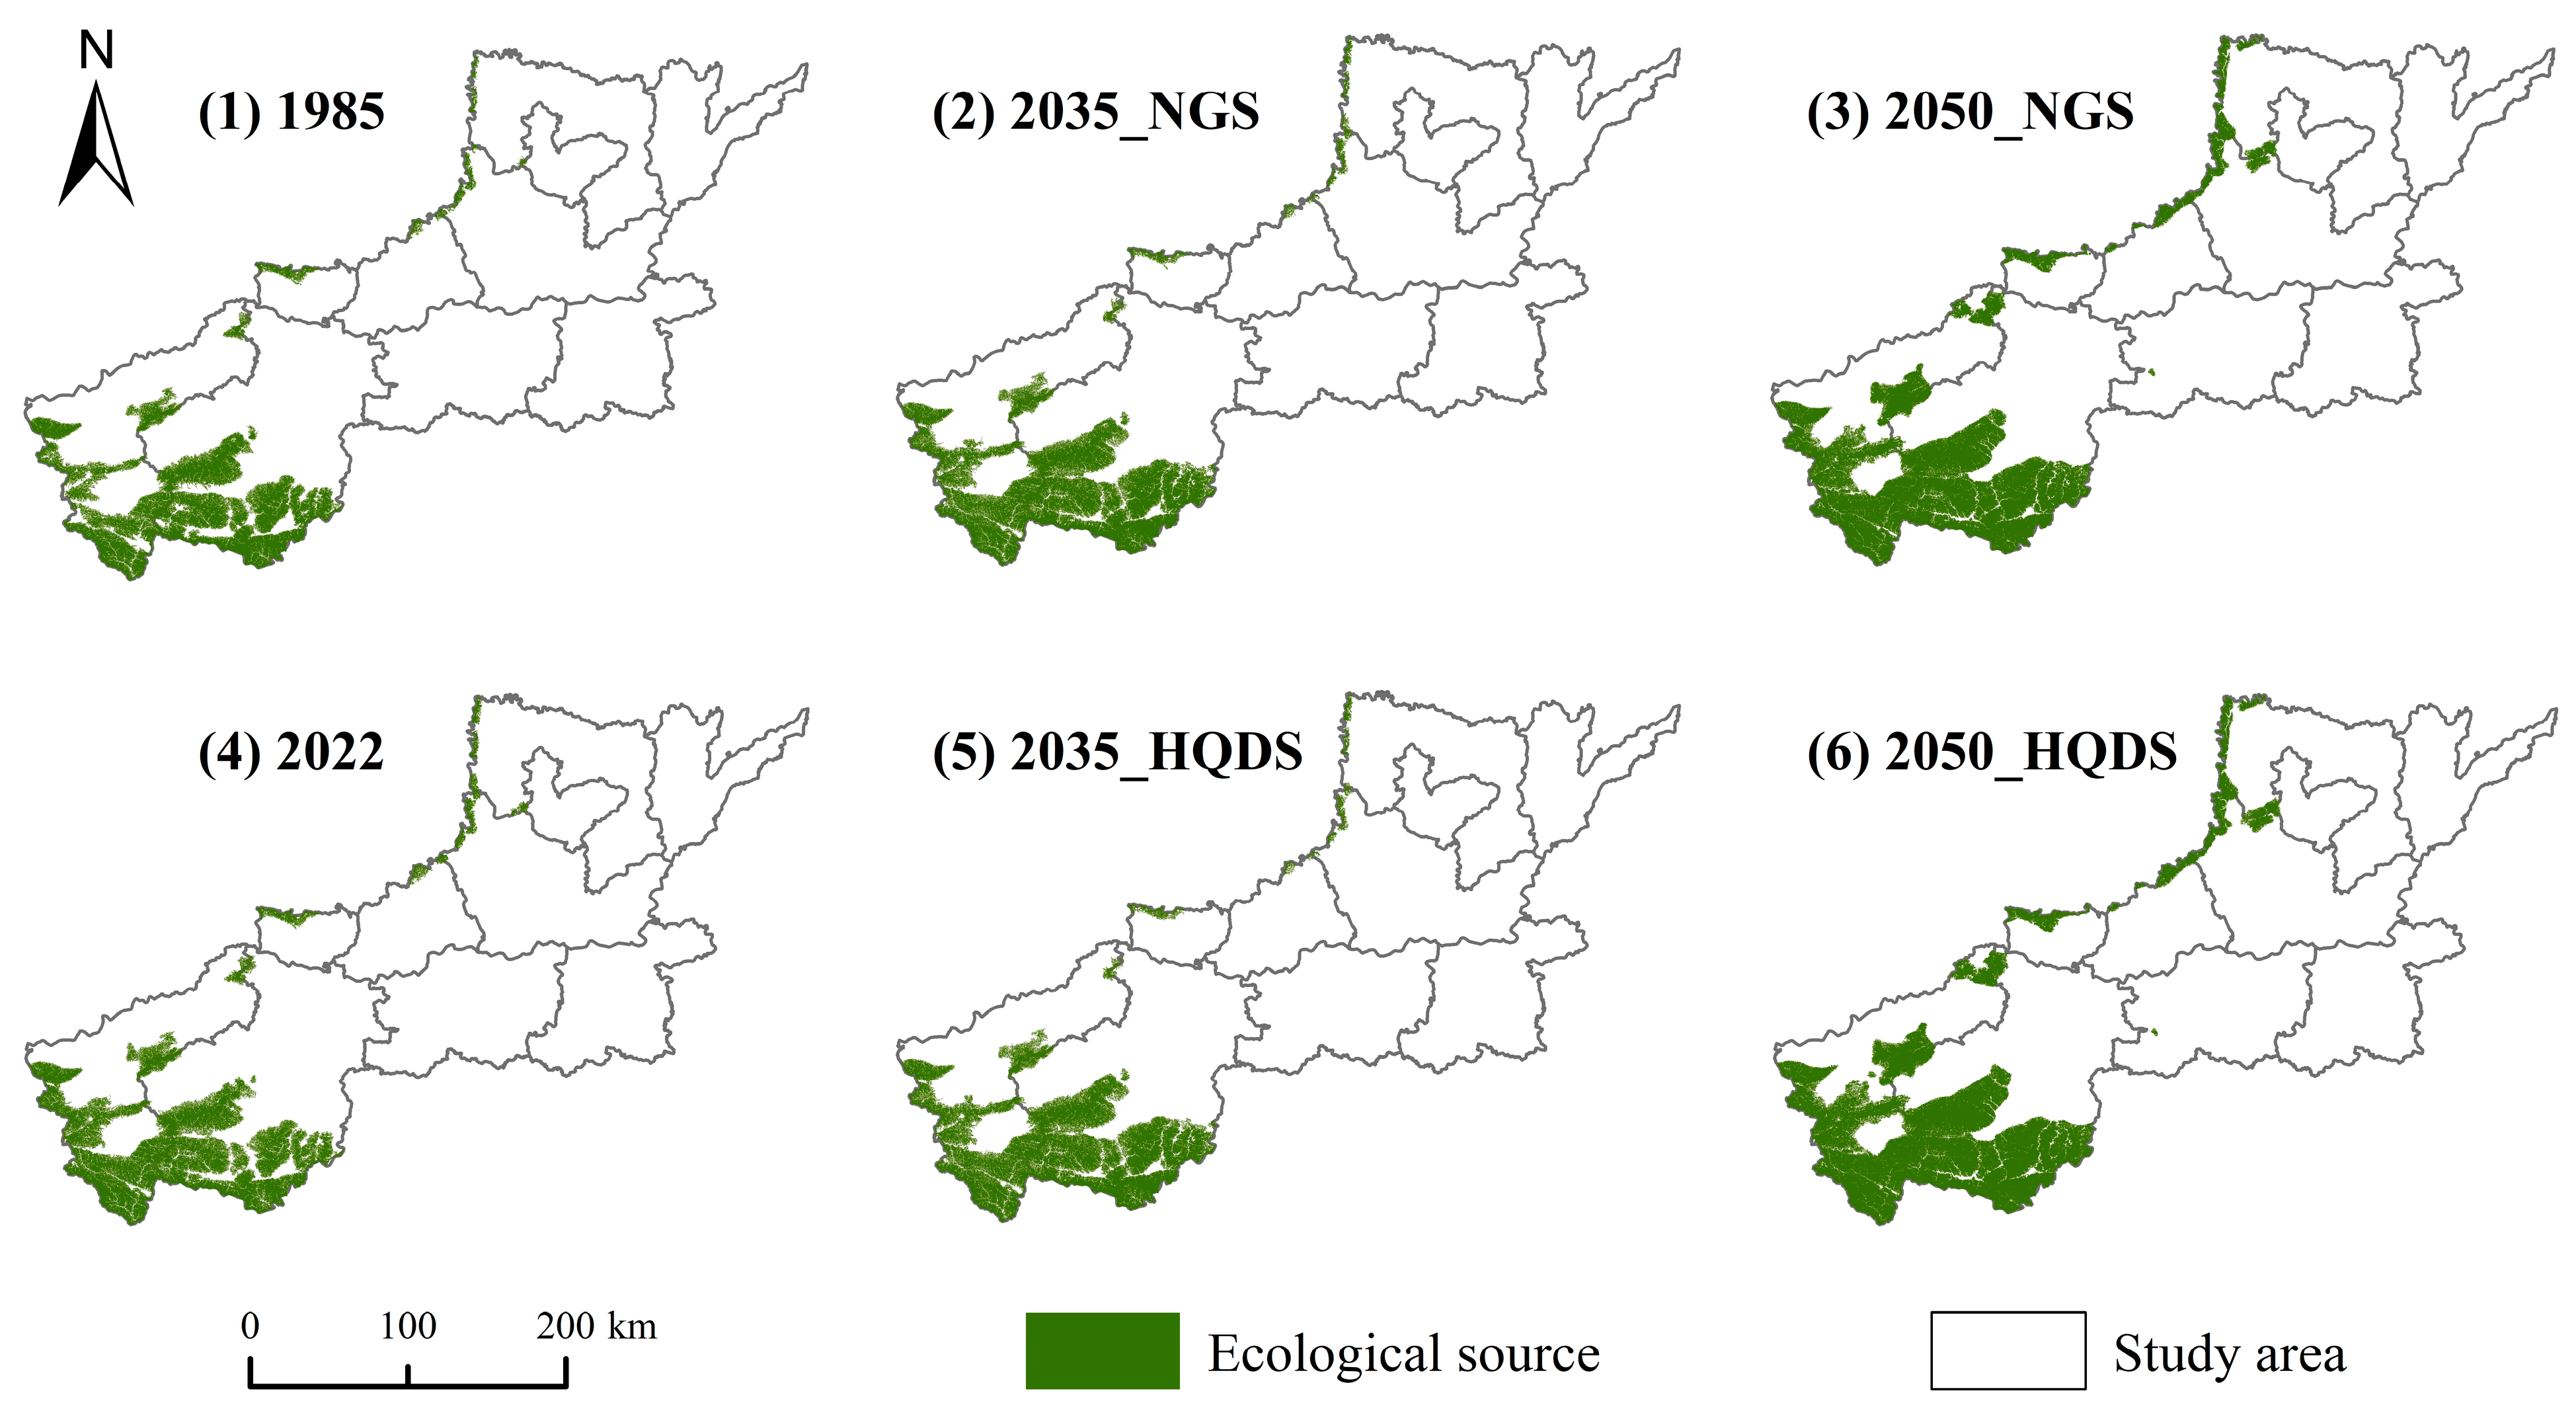
Overall, the area of the ecological source regions in the HYRB demonstrated a steadily increasing trend from 1985 to 2050, reaching a maximum in 2050 (
Figure 5). The ecological source area increased from 7140.54 km
2 in 1985 to 7821.99 km
2 in 2022, corresponding to a growth of 681.45 km
2. The scenario simulations further projected that the ecological source area would reach its highest value within the study period by 2050, reflecting the continuous spatial expansion of regional ecological functions. Under the future scenarios, the ecological source area is projected to reach 8691.76 km
2 under the NGS and 8857.68 km
2 under the HQDS by 2035. Compared with 2022, these values represent increases of 869.77 km
2 under the NGS and 1035.69 km
2 under the HQDS. By 2050, the ecological source area is projected to reach its peak. Specifically, the ecological source area is projected to reach 11,476.75 km
2 under the NGS and 12,039.17 km
2 under the HQDS (
Table 4). The number of ecological source patches decreases steadily over the study period, from 38 in 1985 to 35 in 2022 and further to 15 by 2050.
Spatially, ecological source areas were primarily concentrated in the southwestern Funiu Mountains and northern Taihang Mountains. Newly added ecological source areas were largely situated near the northern Taihang Mountains, whereas ecological connectivity in the southwestern Funiu Mountains continued to improve. This pattern suggests that high ecological quality in these regions extends into surrounding areas, thereby enhancing overall regional ecological functions.
3.4. Resistance Surface Construction and Modeling
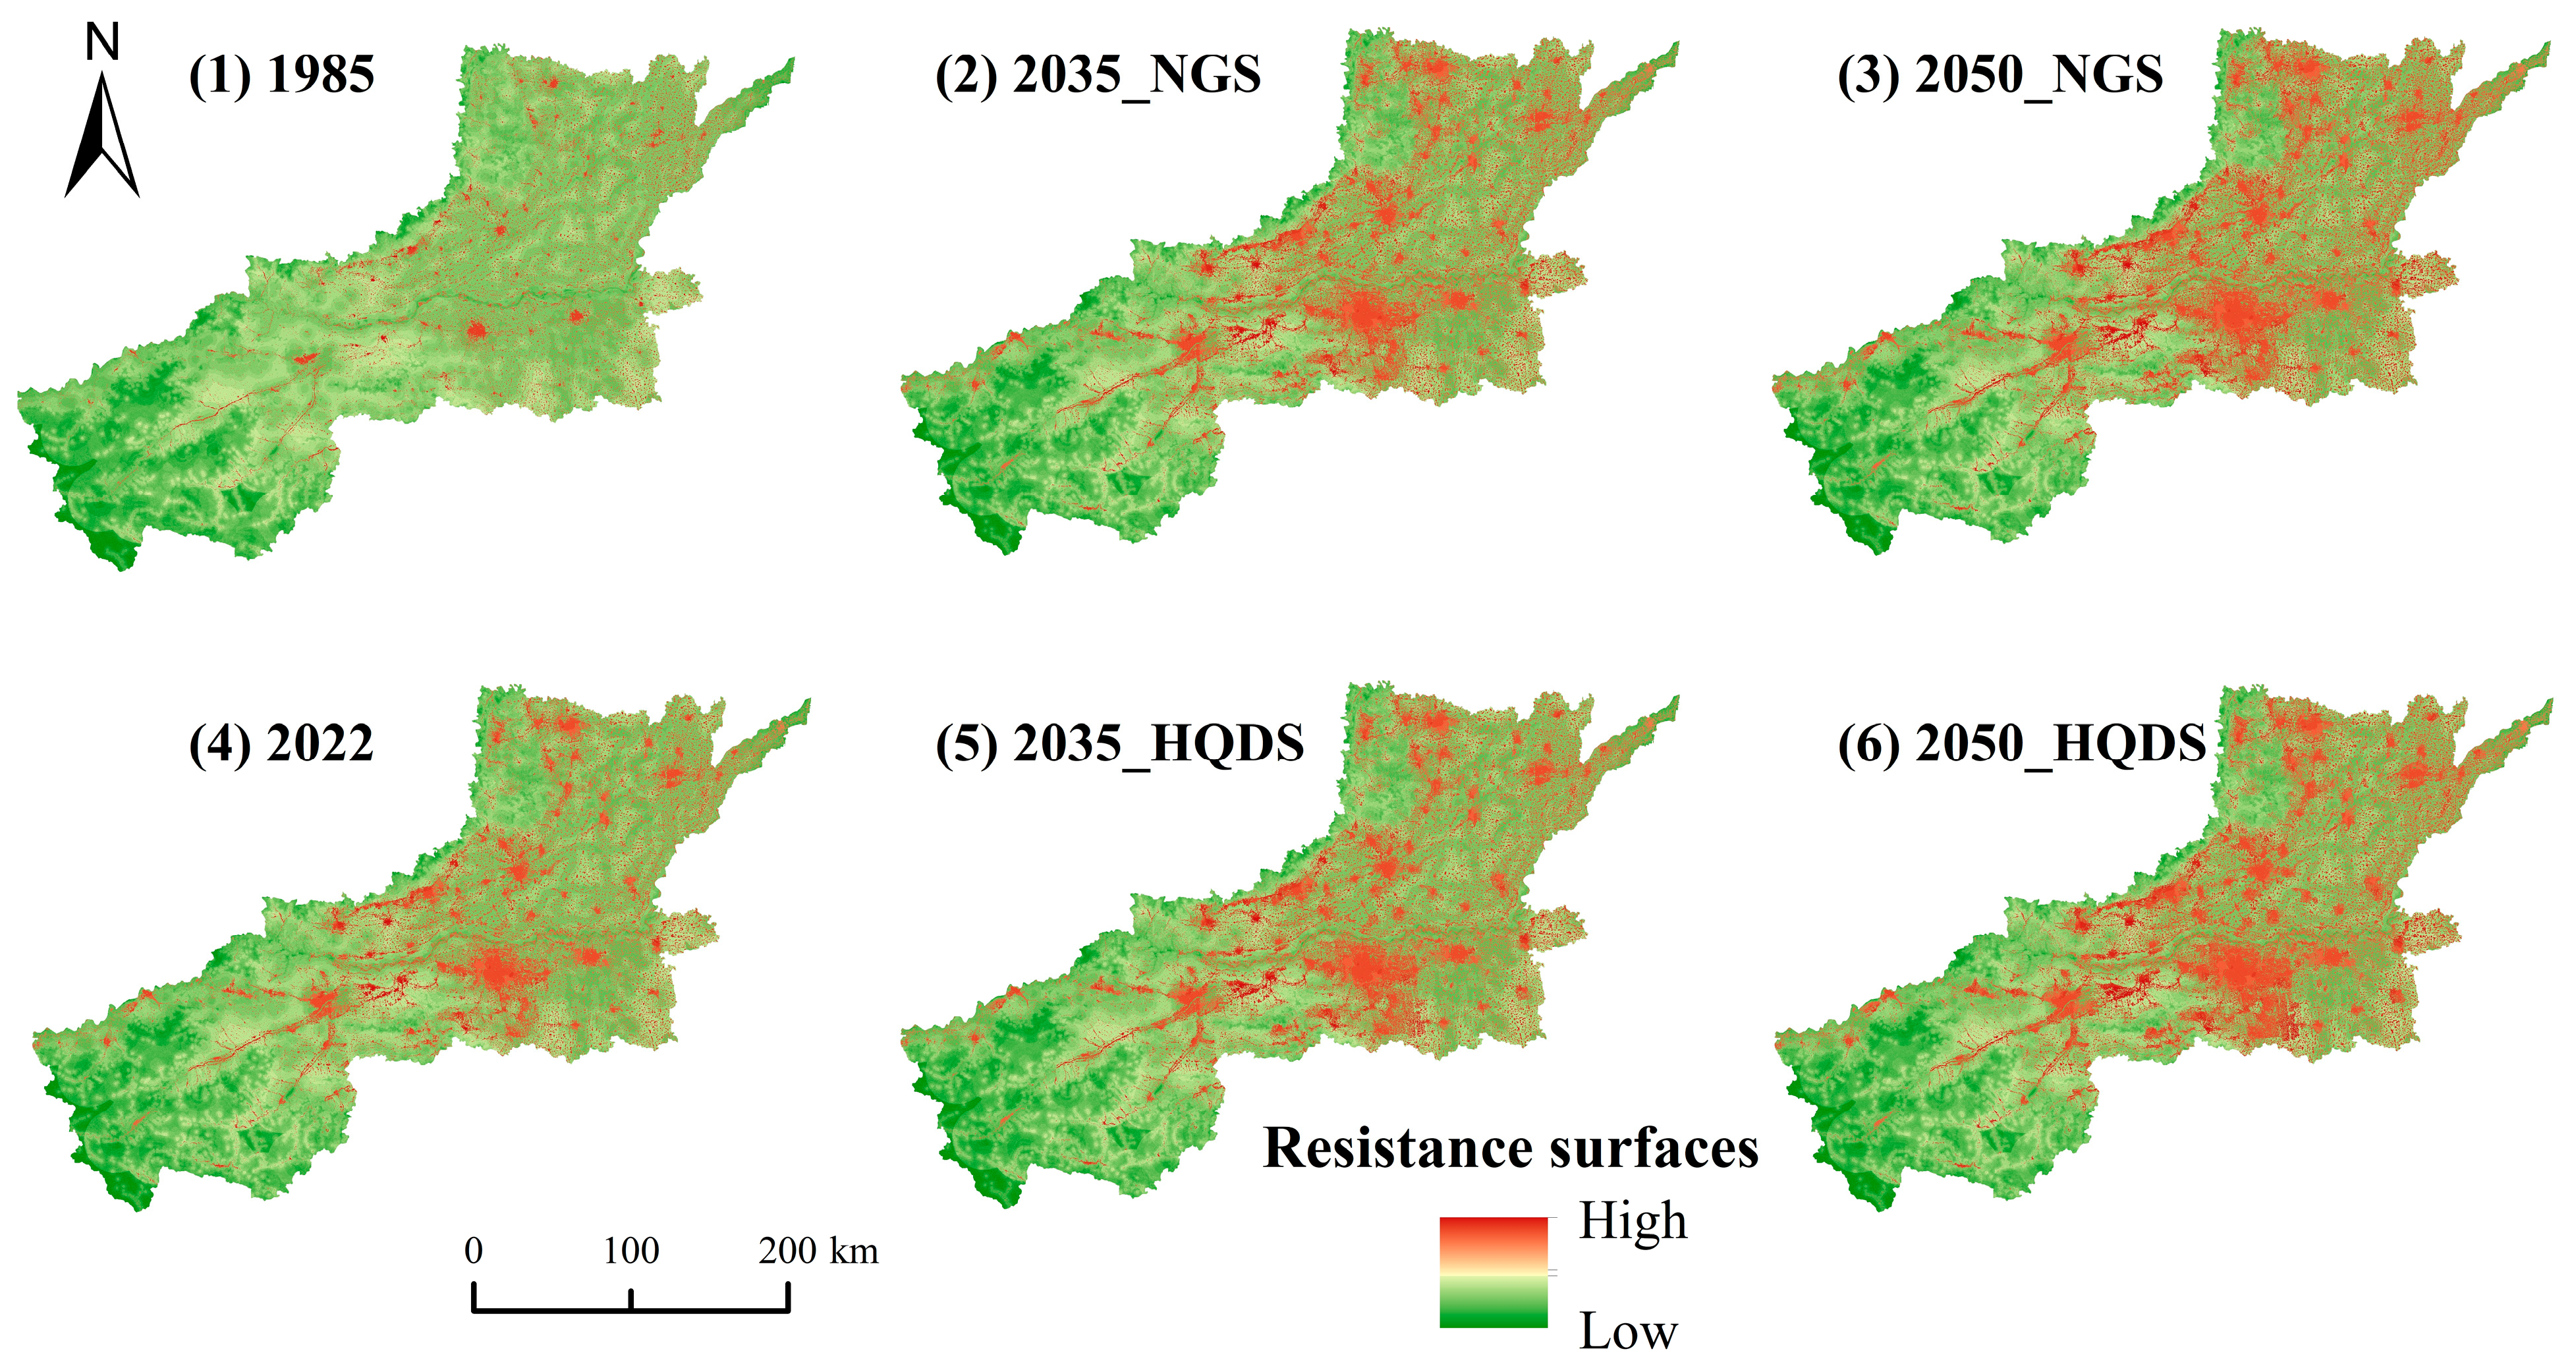
Overall, the regional resistance surface exhibited pronounced spatial heterogeneity (
Figure 6). Low-resistance areas were concentrated in the southwestern Funiu Mountains, whereas high-resistance areas were mainly clustered around built-up areas in the central, eastern, and northern parts of the study area. Over time, these high-resistance zones gradually expanded outward from urban centers. Specifically, the regional resistance values extended from 13.67 up to 786.22. Under the NGS, the average resistance was lowest in 1985 (245.61) and highest in 2050 (318.65) (
Table 5). From 1985 to 2050, the mean resistance increased steadily under both scenarios.
Spatially, resistance values showed marked heterogeneity. Low resistance zones were predominantly distributed in the southwestern Funiu Mountains, where abundant rainfall, dense vegetation, and high biodiversity support species migration and ecological processes, leading to reduced ecological resistance. The areas with higher resistance levels were mainly located in various cities, and they have gradually spread to nearby regions over time.
3.5. Ecological Corridor Construction
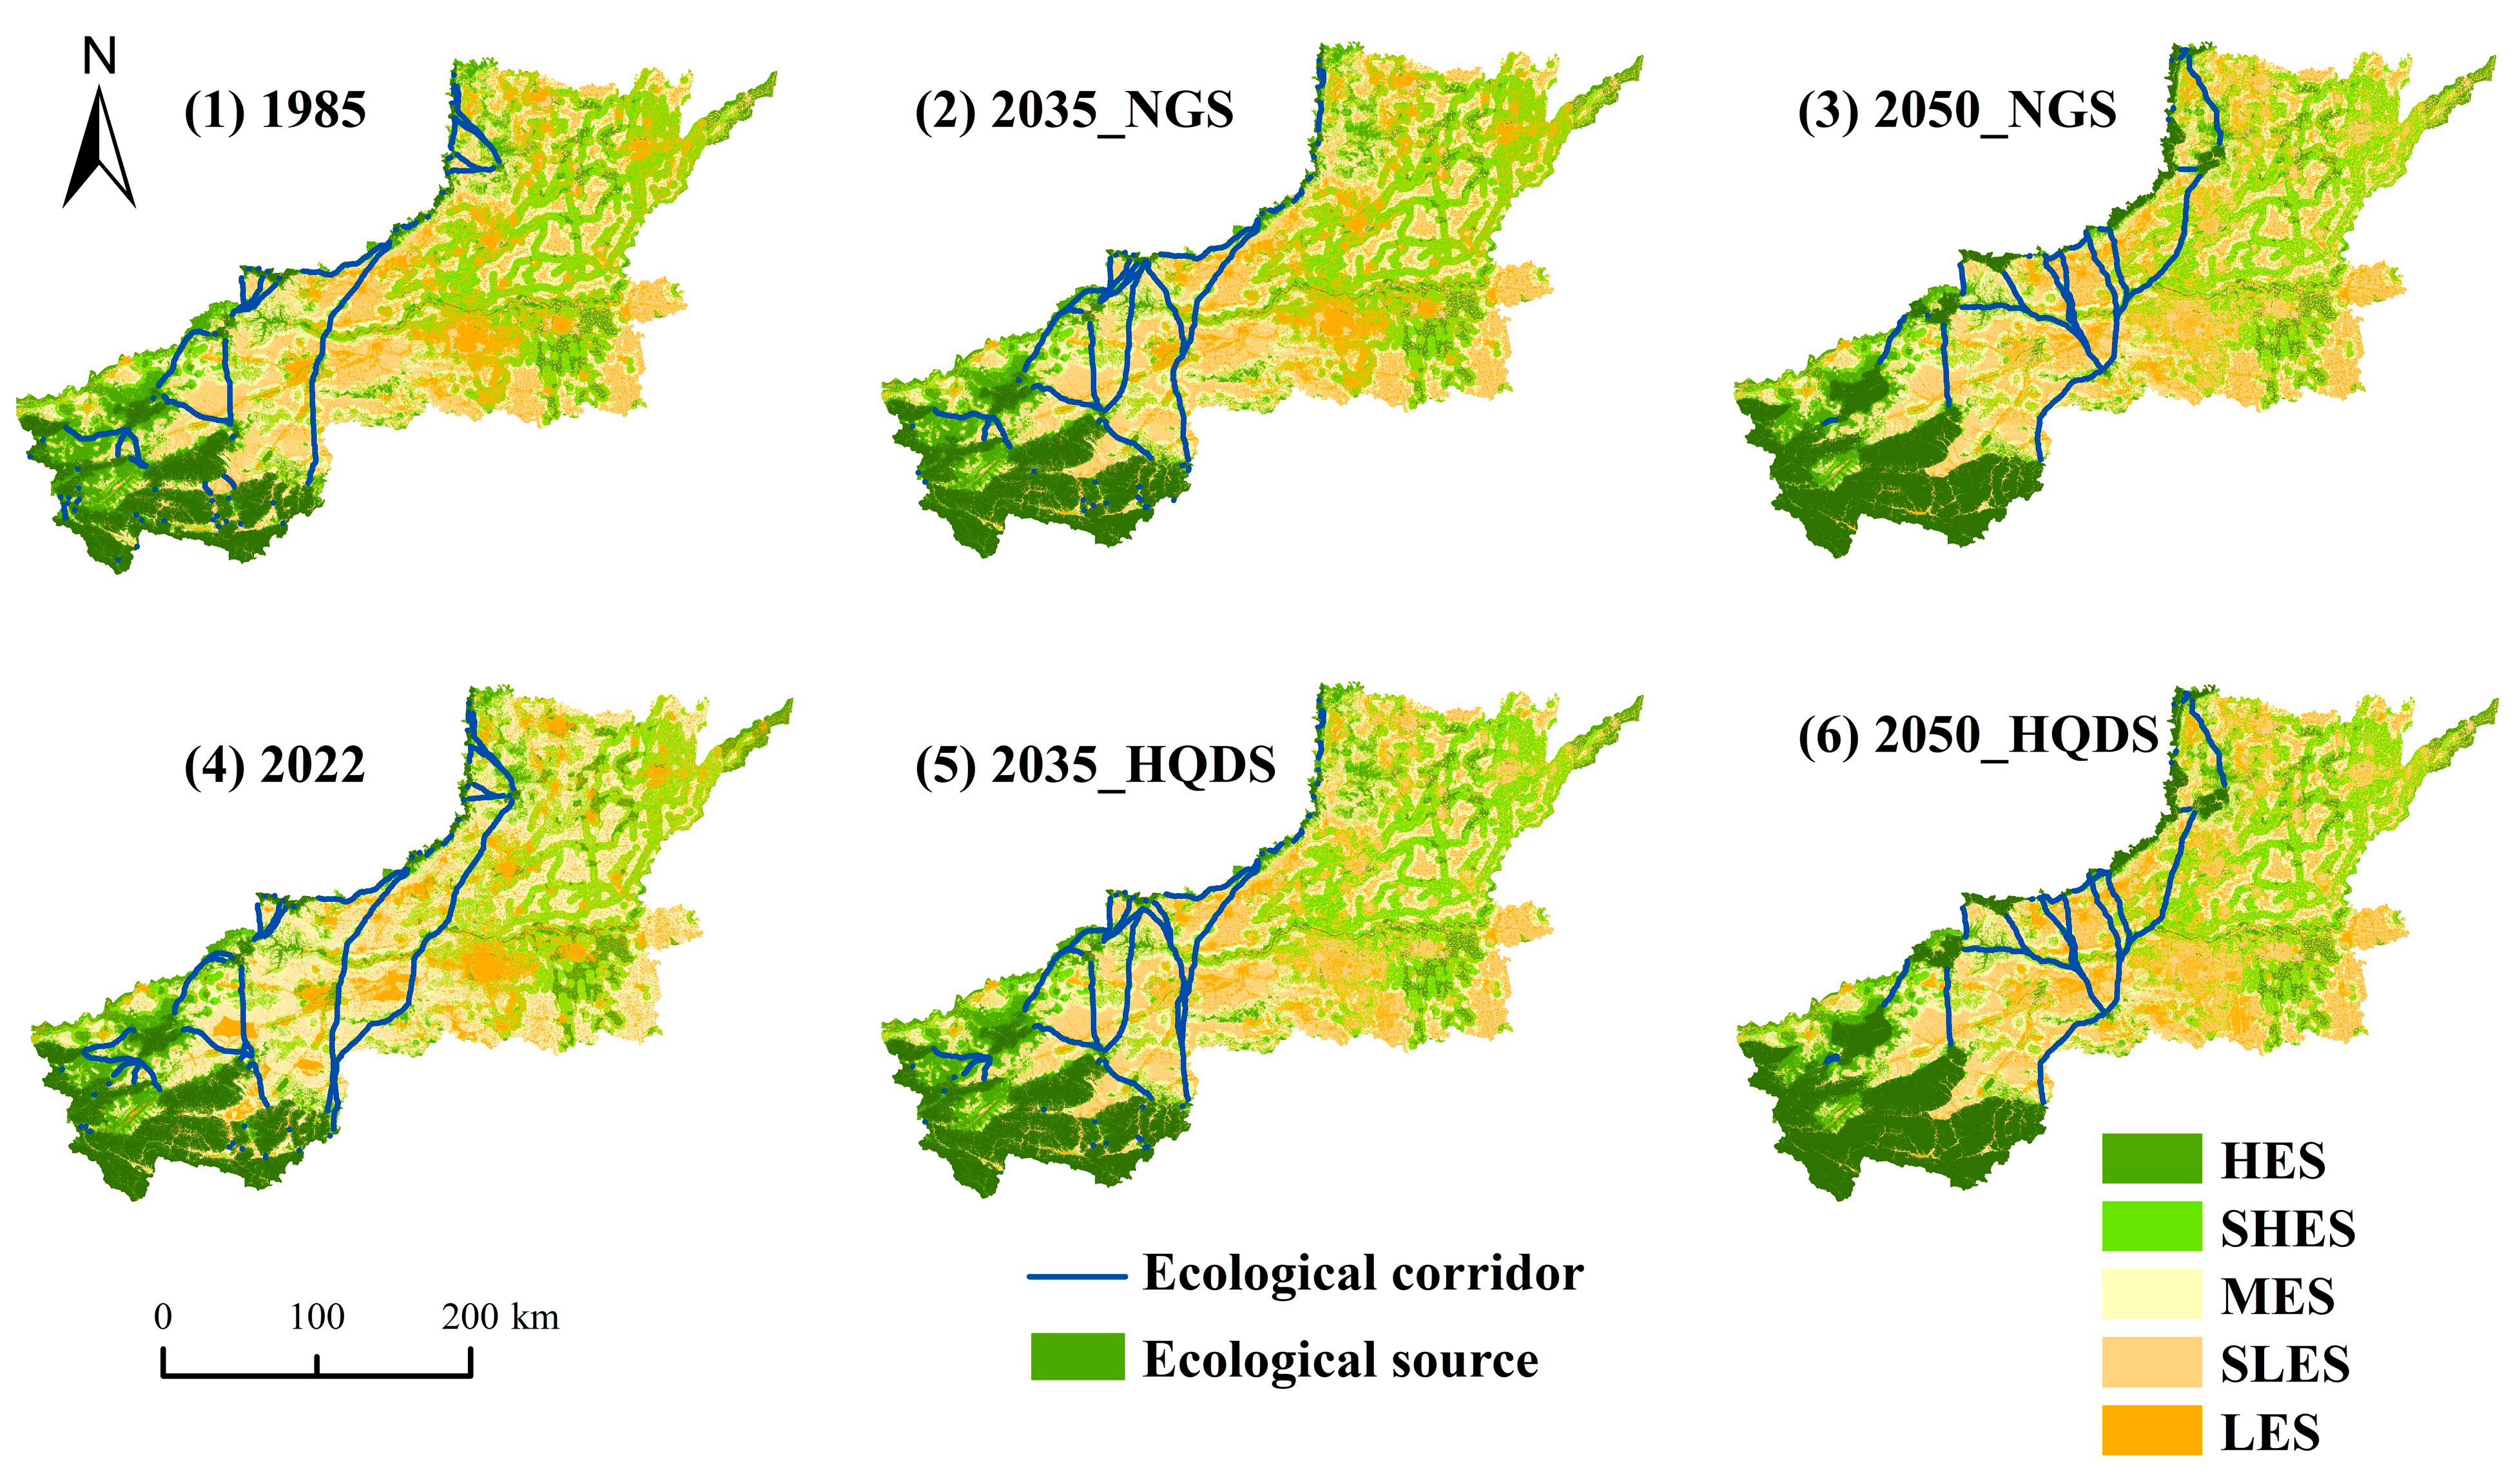
Based on the identified ecological sources and barriers, an ecological corridor network was constructed. The results showed that the ecological corridors in the HYRB region display clear spatial clustering and directionality (
Figure 7). These corridors were primarily located between concentrated ecological sources in the southwest and the ecological patches in the north, extending along low-resistance zones, river valleys, and mountain edges. This configuration formed an ecological network centered on the source areas in the southwest, linking to the ecological patches in the north and center.
Between 1985 and 2022, the ecological safety rating of HYRB declined. The area classified as HES decreased from 13,741.30 km
2 to 13,529.23 km
2, while the area classified as SHES decreased from 15,668.62 km
2 to 13,612.02 km
2 (
Table 6). In contrast, the area categorized as LES increased from 10,913.37 km
2 to 12,668.46 km
2. Future scenario simulations revealed that different development pathways significantly impacted the structure of ecological security levels. By 2035, under the HQDS, the areas of HES and SHES were projected to be 13,552.68 km
2 and 15,692.59 km
2, respectively, which were slightly higher than those under the NGS. By 2050, the areas of HES and SHES under the HQDS were projected to reach 13,529.84 km
2 and 14,501.30 km
2, respectively, remaining higher than the corresponding NGS values of 13,391.30 km
2 and 14,447.47 km
2.
In terms of ecological network characteristics, 62 ecological corridors were identified in 1985, with a total length of 909.15 km. By 2022, the number of ecological corridors had decreased to 56, while their total length had increased to 1457.43 km. Under the NGS, the number of ecological corridors is projected to decrease to 50 by 2035 and further to 26 by 2050. Under the HQDS, 47 corridors are projected by 2035, with a total length of 1186.31 km. By 2050, the number of corridors is projected to decrease to 24, with a total length of 1099.61 km.
4. Discussion
4.1. Innovative Application of HQDS in ESP Construction
The main contribution of this study is the development of a policy-to-rule framework that translates regional ecological conservation and territorial spatial planning objectives into explicit spatial constraints and land-use transition rules within the PLUS model. This approach provides quantitative evidence that implementing a series of policies, including the Yellow River Basin ecological protection policy, has positively contributed to ecological conservation in the HYRB region. In contrast, previous studies have primarily relied on Shared Socioeconomic Pathways (SSPs) or historical trends to simulate LUCC, assuming that land-use change follows a gradual and linear process driven by natural and economic factors, while overlooking the strong intervention effects of national and regional macro-policies on LUCC dynamics [
45]. In regions subject to strict planning and management controls, LUCC is driven not only by natural and economic factors but also strongly regulated by policy constraints. Traditional LUCC simulation methods fail to capture the large-scale structural land transformations induced by policy interventions, thereby limiting the policy relevance and practical applicability of the resulting assessments [
46,
47]. Our approach was specifically designed to address this gap. We explicitly and quantitatively incorporated policy constraints relevant to the HYRB into the LUCC transition rules of the PLUS model. For instance, we imposed strict limits on urban expansion within designated urban development boundaries and incorporated policy-driven ecological restoration measures (e.g., the conversion of steep-slope cropland to forestland) as key controls on spatial dynamics. This approach transforms LUCC simulation from a purely predictive model into a spatially explicit policy assessment framework, enabling the quantification of the long-term cumulative environmental benefits of the HQDS relative to the NGS under explicit policy interventions.
Under these assumptions, the modeled ecological source area under the HQDS was 562.42 km2 larger than that under the NGS by 2050. The mean raw sediment export under the HQDS was also 11.9% lower than that under the NGS over the simulated period. These differences reflect the modeled ecological implications of the specified policy constraints and indicate how policy-oriented land-use regulation may affect ecological sources, sediment-delivery pressure, and landscape connectivity. At the LUCC level, the HQDS–NGS contrast also suggests a reallocation of land-use transitions rather than a uniform improvement in all ecological indicators. During 2035–2050, forest area increased by 649.31 km2 under the HQDS, compared with 513.75 km2 under the NGS, while built-up land expanded by 2622.06 km2 under the HQDS, compared with 2664.07 km2 under the NGS. However, cropland declined by 3102.44 km2 under the HQDS, compared with 2961.10 km2 under the NGS.
These results suggest that the specified policy rules redirected part of the projected land-use change toward ecological restoration and moderately constrained built-up expansion, but they also involved potential trade-offs related to cropland retention and socioeconomic development. Accordingly, the HQDS should be interpreted as an ecology-prioritized development pathway under the specified assumptions rather than as a universally optimal development scenario. In this conditional sense, the framework provides a useful tool for ex ante policy screening, spatial prioritization, and comparison of alternative policy pathways.
4.2. Attribution of Ecological Differences Under Policy-Driven Spatial Regulation
This study designed two scenarios—the NGS and the HQDS—and constructed ESP for two key milestone years in China’s modernization process: 2035 and 2050. The results indicate that the ecological source area under the HQDS reaches 8857.68 km2 in 2035 and 12,039.17 km2 in 2050. These values are higher than the corresponding NGS values of 8691.76 km2 in 2035 and 11,476.75 km2 in 2050. In addition, the areas classified as HES and SHES under the HQDS are larger than those under the NGS. These results indicate that HQDS produced larger ecological source areas and higher modeled HES and SHES areas than the NGS.
The fundamental reason for the difference lies in the mandatory policy interventions and the spatial restructuring of regional LUCC under the HQDS. This is primarily reflected in two aspects. First, there is the mandatory restriction on built-up land expansion. Under the NGS, built-up land expansion is mainly driven by economic growth and historical inertia, leading to uncontrolled urban sprawl that encroaches on high-quality farmland and potential ecological source areas. In contrast, under the HQDS, macro-level policy constraints, such as urban planning regulations, are explicitly embedded and enforced within the PLUS model’s transition probability matrix (transition rules). This top-down spatial regulation effectively suppresses urban expansion into core ecological sources and corridors, thereby mitigating the risks of habitat fragmentation and ecological network degradation. Second, policy-driven ecological land transformation plays a critical role. Under the HQDS, mandatory ecological restoration projects, such as the conversion of cropland to forest or grassland, are explicitly implemented, particularly for croplands with slopes exceeding 25°. In the model, this intervention was represented by increasing the transition probability from cropland to forestland/grassland while reducing the probability of conversion from cropland to built-up land, thereby simulating policy-enforced land-use transformation. These rules altered the projected land-use composition and spatial configuration, which subsequently affected the InVEST-derived ES indicators, ESI, ecological-source identification, and ecological-security classification.
Therefore, the comparison demonstrates the sensitivity of the modeled ecological system to policy-oriented land-use constraints and quantifies their projected spatial implications relative to the NGS. In this conditional sense, the HQDS generated a more conservation-oriented projected configuration than the NGS.
4.3. Future ESP Planning Strategies Under the HQDS Framework
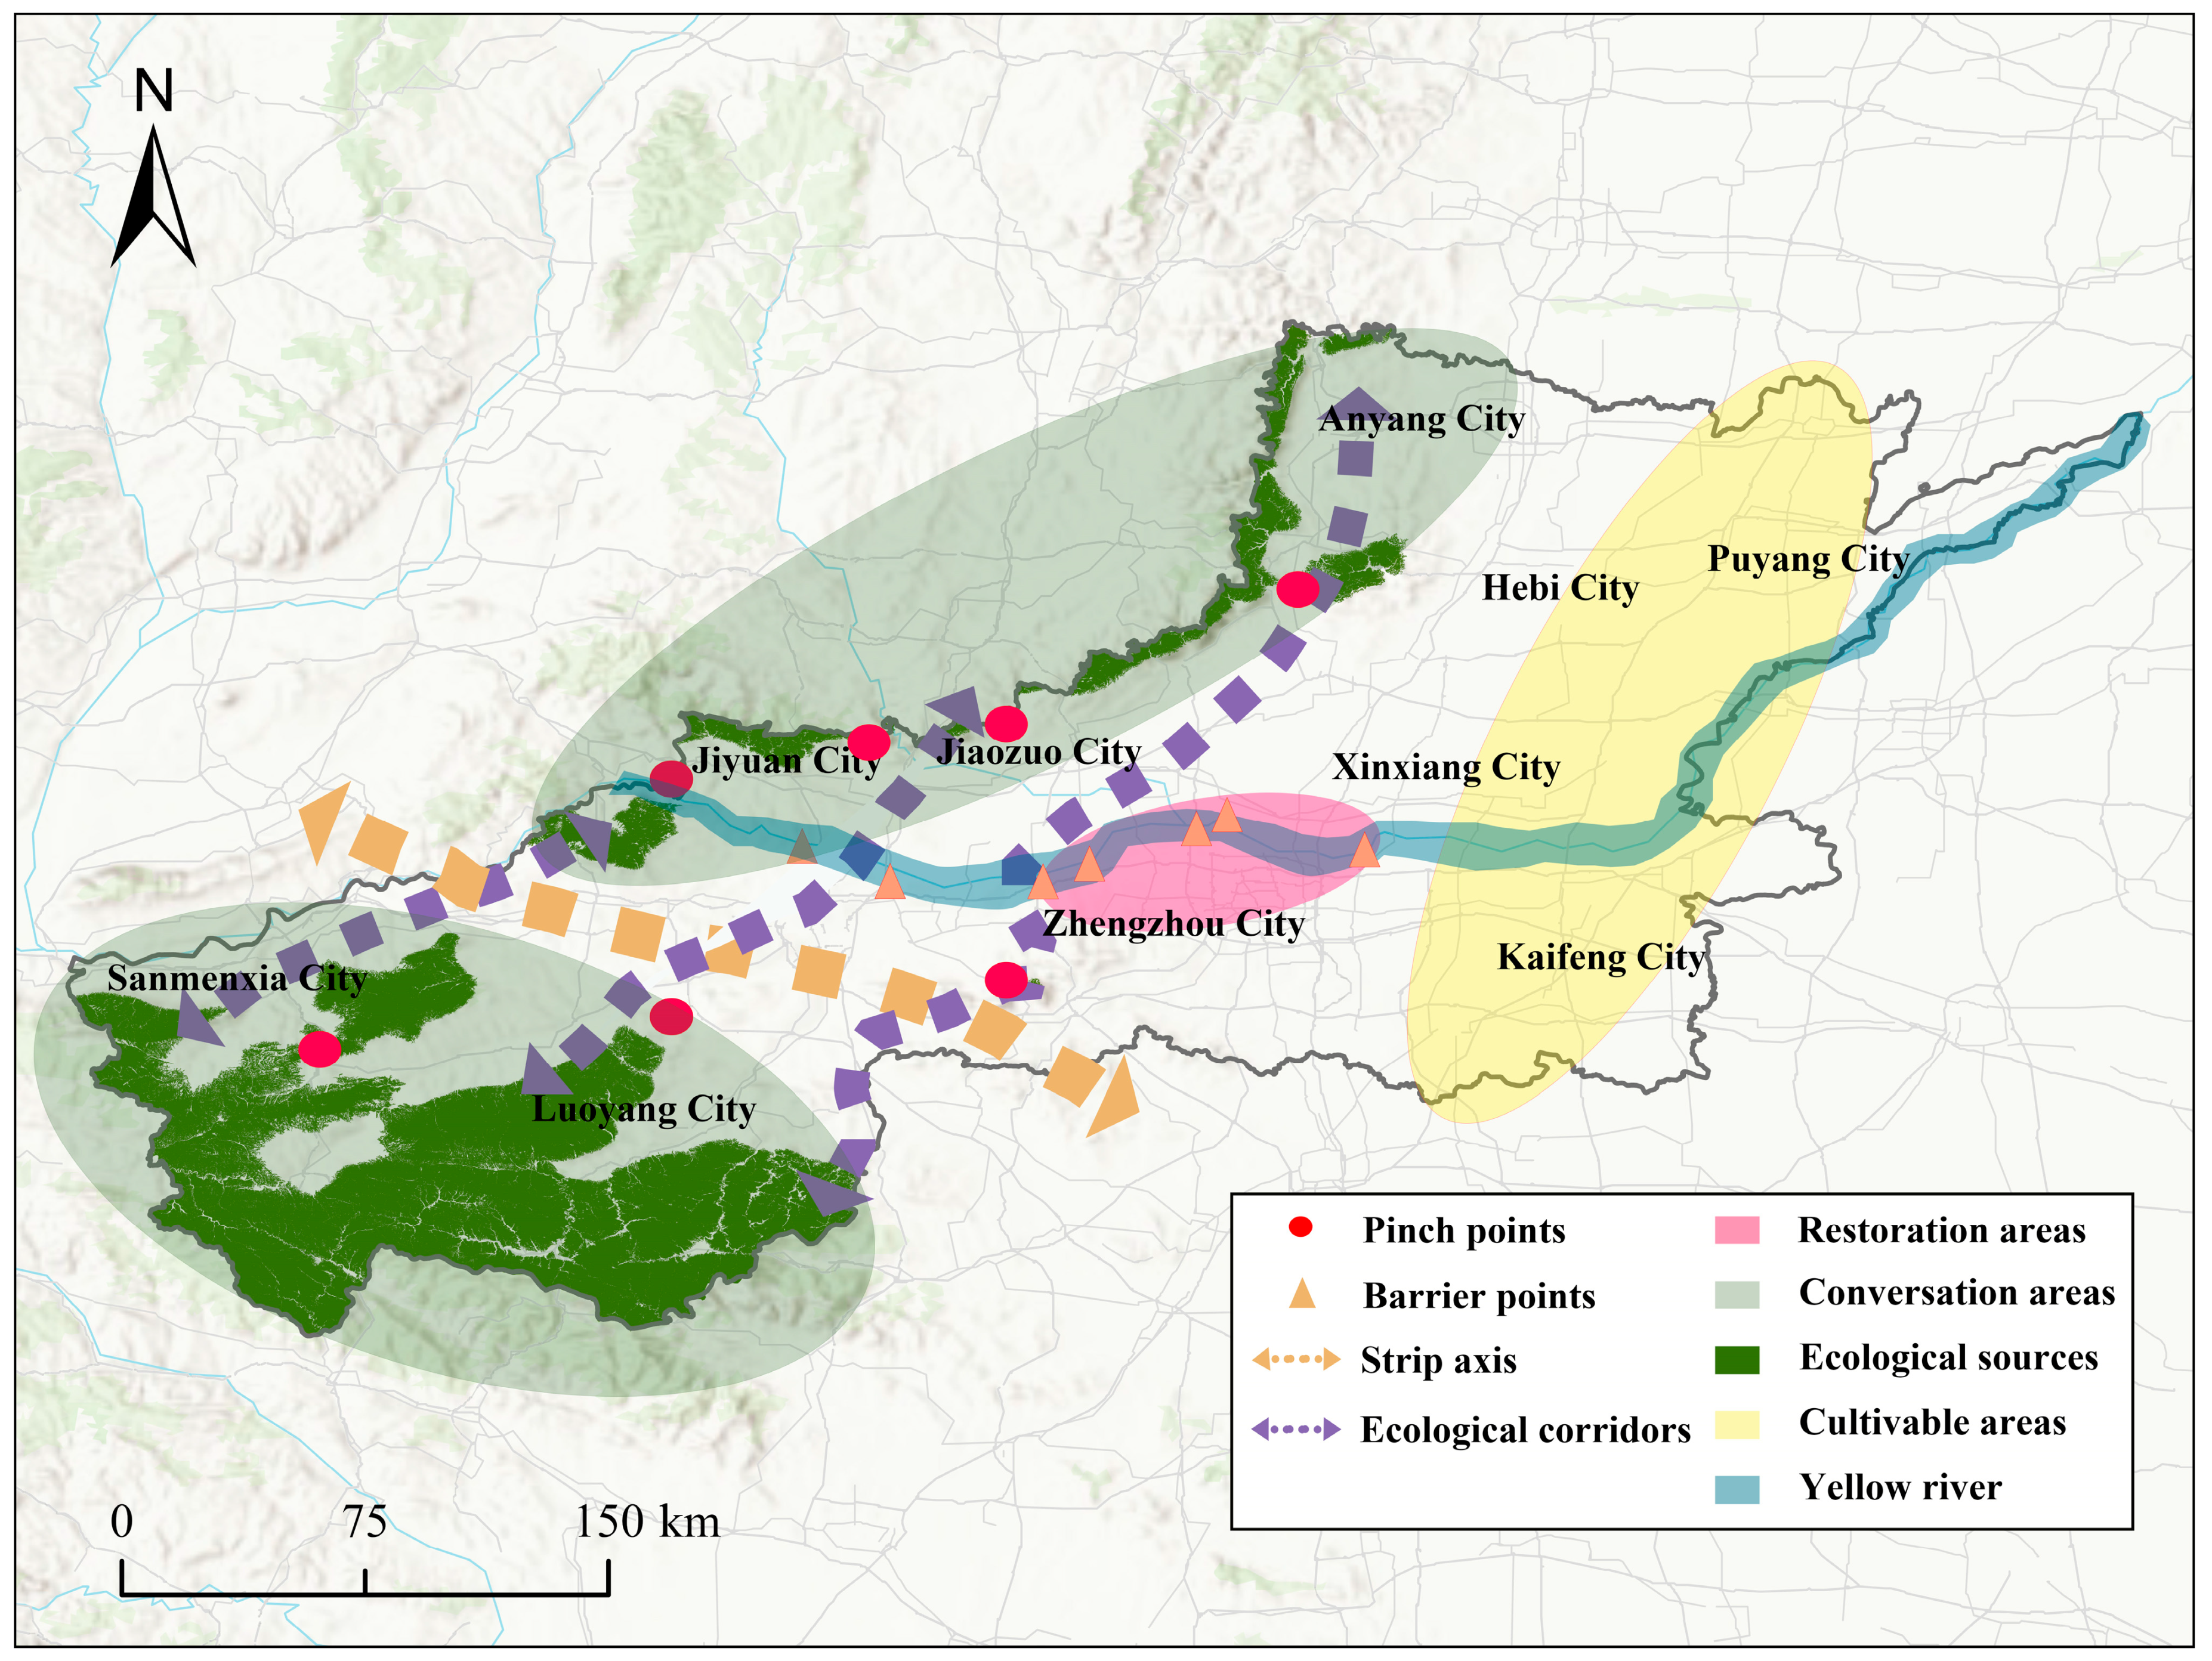
Based on the future ESP simulations, this study proposes a scenario-based framework comprising “four zones, one ecological belt, three ecological corridors, and multiple nodes.” (
Figure 8) The framework was developed by weighting the five ESs using AHP, identifying ecological sources from the resulting ESI, and integrating the sources with the resistance surface through the MCR and circuit-theory approaches.
Because expert-derived AHP weights introduce uncertainty into the ESI and ecological-source identification, an equal-weight sensitivity analysis was conducted. The five ESs were assigned equal weights of 0.20, while the normalization procedure, source-identification threshold, minimum patch-area criterion, and other processing steps were kept unchanged (
Figure S10). Under the equal-weight scheme, ecological sources remained mainly concentrated in the southwestern Funiu Mountains and northern Taihang Mountains, broadly consistent with the baseline AHP-weighted result. This result suggests that the broad regional distribution of the main ecological sources is not solely determined by the higher weights assigned to HQ and SC. However, differences may occur along source boundaries and in peripheral patches.
The conservation zones are mainly located in the southwestern and northern forested regions, where multiple ESs show relatively high modeled values. These areas may be considered candidate priority areas for ecological conservation. Restoration zones are concentrated in the built-up areas surrounding Zhengzhou, where ecological restoration and functional recovery could be prioritized after field verification and detailed planning assessment. Cultivable zones are mainly distributed across the low-elevation eastern plains and could be managed in coordination with permanent basic farmland protection and ecological buffer measures. The ecological belt along the Yellow River represents a modeled regional ecological axis. The three ecological corridors indicate potential pathways connecting major ecological sources, while the multiple nodes identify potential ecological bottlenecks and barrier locations. These features may provide useful references for ecological management, but their detailed spatial boundaries and connectivity functions may vary under alternative weighting schemes.
Corresponding planning recommendations were developed based on the proposed future ESP framework. First, relevant planning authorities should identify and delineate ecological source areas and core conservation zones prior to policy formulation, incorporating them into the regional planning system and designating them as “no-development zones.” For example, protected areas should be established in the southwestern and northern forest regions of the HYRB, where land development activities should be strictly restricted. This mechanism ensures strict protection of ecologically important areas, reflecting a development strategy that prioritizes ecological integrity. Second, ecological corridors and ecological nodes should be designated as environmentally sensitive areas. Any project that may pose threats to these areas should be subject to strict spatial regulation, with the implementation of mandatory ecological compensation measures. Such measures help maintain the integrity and connectivity of the ecological network while preventing disruption caused by localized development activities. Finally, areas along the Zhengzhou section of the Yellow River, characterized by dense ecological barriers and high sediment output risks, should be prioritized for ecological restoration investment and spatial governance, ensuring the efficient allocation of limited management resources.
4.4. Limitations and Prospects
Although this study provides a scenario-based geospatial assessment of future ecological dynamics in the HYRB, several limitations should be acknowledged. First, the selection of ESs was primarily oriented toward the core objectives of the Ecological Protection and High-Quality Development Strategy. Accordingly, this study focused on five regulating services (WY, CS, SC, ST, and HQ) that are highly relevant to ecological vulnerability in the HYRB. Although provisioning services, such as grain production, were not explicitly quantified in the ES assessment, the HQDS constrained urban expansion on high-quality arable land in plain areas. However, this constraint does not quantitatively evaluate the trade-off between ecological restoration, farmland quality, food production, and economic costs. Future research should integrate crop-yield and economic models to further quantify these trade-offs. Second, the construction of resistance surfaces and the weighting of ESs partly relied on expert knowledge and literature-based parameterization. Although this approach is widely adopted in regional ecological assessments, it inevitably introduces uncertainty and subjectivity into the modeling process. An equal-weight sensitivity analysis was conducted by assigning a weight of 0.20 to each ecosystem service. The resulting ecological sources remained broadly concentrated in the southwestern Funiu Mountains and northern Taihang Mountains, consistent with the baseline AHP-weighted result. However, this analysis included only one alternative weighting scheme and was conducted mainly at the ecological-source identification stage. The complete ecological-corridor network was not reconstructed under all possible weighting combinations. Future research should incorporate multiple expert panels, one-at-a-time weight perturbations, or Monte Carlo sampling of weight distributions to further evaluate the robustness of the complete ESP. Finally, constrained by the 30 m resolution of the LUCC data, this study prioritized macro-scale ecological patterns and excluded patches smaller than 10 km2 to maintain computational efficiency. Consequently, certain micro-scale ecological processes and small but critical stepping stones may have been omitted. Future studies are encouraged to employ higher-resolution remote-sensing datasets and multi-scale analytical frameworks to better represent fine-scale ecological connectivity and spatial heterogeneity.
5. Conclusions
Based on relevant policies for ecological conservation and high-quality development in the HYRB, this study developed HQDS and used NGS as the reference scenario to evaluate the effects of policy interventions on regional ecosystems. The spatiotemporal evolution of multiple ESs from 1985 to 2050 was subsequently simulated, and ESPs were constructed to systematically characterize their evolutionary dynamics in the HYRB. The main conclusions are as follows: (1) From 1985 to 2050, LUCC in the region remained relatively stable. Built-up, cropland, and forest were the dominant land cover types, showing pronounced spatial heterogeneity. The primary land use transitions occurred between cropland and built-up areas. (2) Across the HYRB, various ESs remained relatively stable from 1985 to 2050. Specifically, SC, HQ, and CS generally showed higher values in mountainous and forested areas and lower values in the central and eastern plains. The SE was mainly concentrated in areas with relatively high erosion and sediment-delivery potential, whereas lower SE values were generally observed in the plain areas. In contrast, WY showed a distinct spatial distribution, with lower values in the southwestern region and higher values in the northeastern region. Based on the simulations for 2035 and 2050, WY and SC were projected to increase under both future scenarios, whereas HQ and CS exhibited slight declines. SE increased from 2035 to 2050 under both scenarios, although the magnitude of the increase was slightly lower under the HQDS than under the NGS. Moreover, the mean SE under the HQDS was 11.9% lower than that under the NGS over the 1985–2050 simulation period, indicating reduced modeled overland sediment-delivery pressure. (3) The regional ESP exhibits pronounced spatial heterogeneity. Ecological sources are primarily concentrated in the southwestern Qinling–Funiu mountains, where ecosystem service provision is relatively high. This region plays a key role in maintaining regional ecological stability and landscape connectivity. Scenario comparisons indicate that the HQDS produces more favorable ecological conservation outcomes than the NGS. Compared with the NGS, the HQDS results in a larger total ecological source area and fewer ecological source patches and corridors, indicating greater aggregation of ecological sources and improved ecological network connectivity. This framework provides a robust computational ecology methodology and spatial decision-support system for future adaptive ecosystem management, enabling the effective algorithmic translation of macro-level conservation policies into quantifiable ecological strategies. These findings provide a scientific foundation for future regional ecological protection and spatial management efforts.




 ,
,