1. Introduction
Remote sensing object detection is a core component in many high-impact applications, including urban management, traffic monitoring, disaster assessment, environmental surveillance, and security-related reconnaissance [
1,
2,
3]. Compared with natural-image detection, overhead remote sensing imagery typically covers large geographic areas and contains complex background clutter, while targets of interest often appear as small instances with dense distributions, arbitrary orientations, and large scale variations. In many real-world deployments, detection systems are further expected to distinguish fine-grained sub-classes (e.g., different aircraft models, vessel types, or vehicle variants), where inter-class appearance differences are subtle and can be easily overwhelmed by shadows, texture noise, and background structures [
4]. These characteristics make fine-grained remote sensing object detection both practically important and technically challenging.
Most existing remote sensing detectors inherit general-purpose detection paradigms, such as feature pyramid networks (FPNs) for multi-scale representation, two-stage RoI-based detectors, and one-stage dense predictors, while incorporating oriented bounding boxes (OBBs), rotated RoI alignment, and angle-aware regression/classification to handle arbitrary orientations [
5,
6,
7,
8]. Despite substantial progress in oriented localization, fine-grained settings still expose several structural limitations. First, scale perception is often static: conventional FPN-based designs typically rely on heuristic or fixed assignment rules to select a single pyramid level for each instance [
9]. In remote sensing imagery, where targets span a wide range of sizes and small objects are prevalent and crowded, such static selection frequently yields mismatched features, suppressing fine-grained cues such as edges and local textures. Second, orientation awareness is often confined to the regression head: angle information primarily serves oriented box prediction, while RoI feature extraction and local aggregation remain axis-aligned or template-fixed [
10]. Consequently, rotations cause systematic misalignment of discriminative parts within RoI features, making it difficult to consistently capture fine-grained structures (e.g., wings and tail of aircraft, bow and deck of ships, or head and rear of vehicles). Third, instance-specific discriminability is insufficient: fine-grained recognition requires emphasizing discriminative channels and local patterns that vary across instances, but commonly used attention mechanisms are typically applied using image-level or layer-level statistics, lacking explicit instance-wise dynamic selection and thus remaining vulnerable to background interference and intra-class variation [
11].
These limitations share a common root in the perception stage of RoI-based detection. In practice, a large fraction of the final errors in fine-grained remote sensing detection can be traced back to how RoI features are extracted and formed before the classification and regression heads. Yet, this process is largely predefined: the detector typically decides which pyramid level to use, how to align local sampling, and which feature subspace to emphasize via static architectural choices or hand-crafted rules, rather than inferring these choices conditioned on each instance [
12,
13]. This mismatch becomes particularly severe in fine-grained scenarios. When targets are tiny, selecting an inappropriate feature level can wash out the already weak part cues and turn sibling classes into near-indistinguishable blobs. When targets are rotated, axis-aligned sampling can distort the relative layout of discriminative parts, causing inconsistent representations across orientations. When targets are dense, background textures and neighboring instances can dominate RoI activations, and non-adaptive channel utilization wastes capacity on irrelevant structures. As a consequence, even strong prediction heads may operate on suboptimal RoI representations, leading to persistent within-family confusions and unstable localization [
14,
15]. This observation motivates a central viewpoint of this work: improving fine-grained remote sensing detection requires an instance-adaptive perception mechanism at the RoI feature extraction stage, so that the detector can dynamically decide where, at what scale, and with which feature emphasis to perceive each RoI.
Unlike existing methods that primarily improve oriented object detection through stronger backbones, feature pyramid enhancements, or global attention mechanisms, they rarely model instance-specific perception within the RoI feature extraction stage. In particular, conventional FPN-based detectors rely on fixed scale assignment, and standard attention modules operate at image-level or feature-map-level rather than instance-level adaptation. As a result, they lack explicit mechanisms for adaptive scale selection and channel-wise feature modulation conditioned on each object instance.
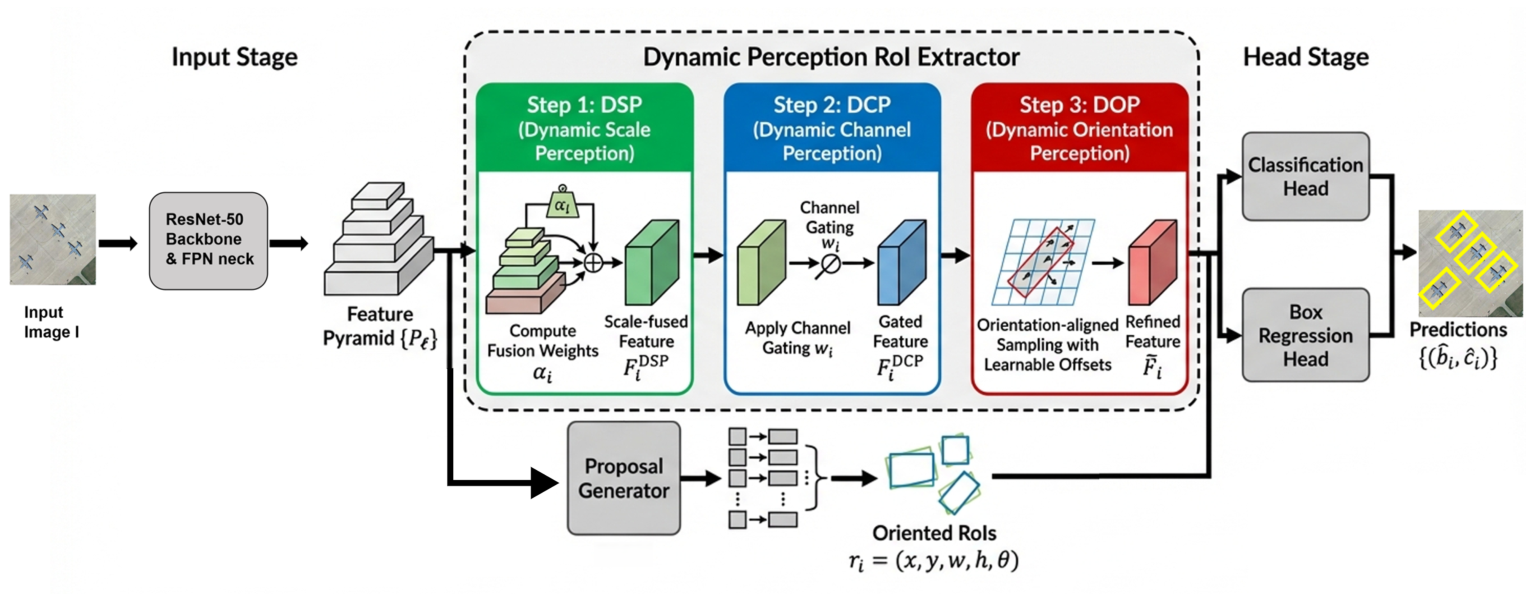
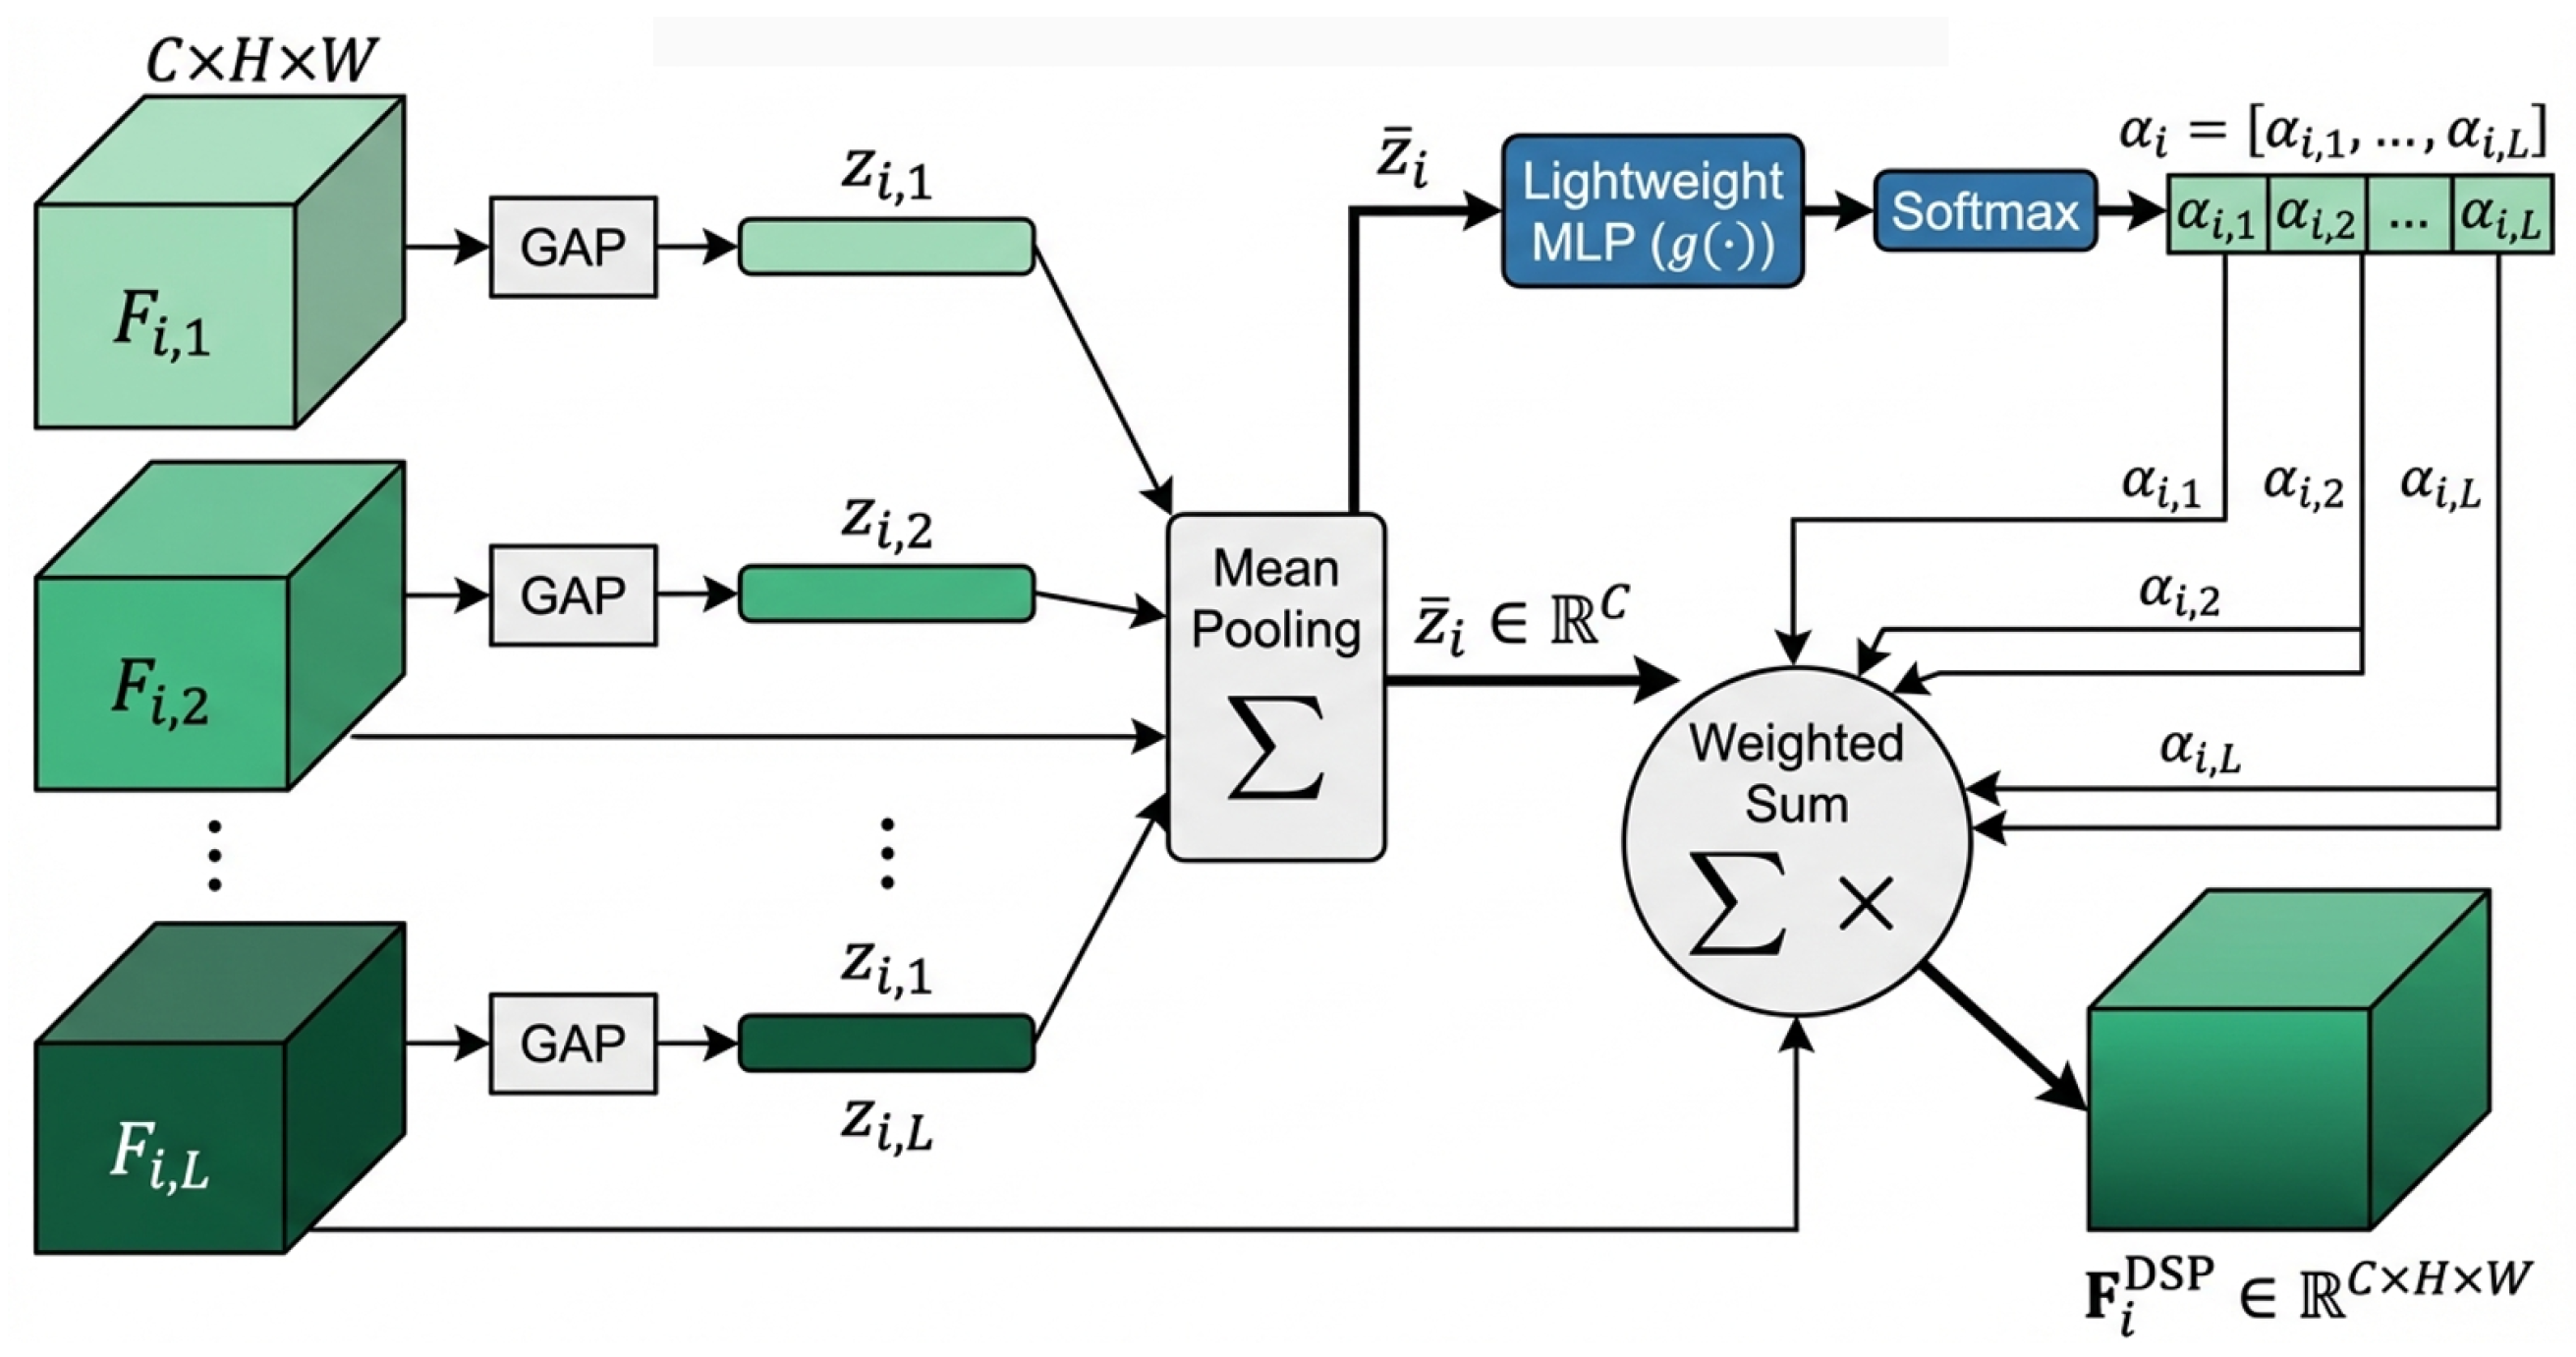
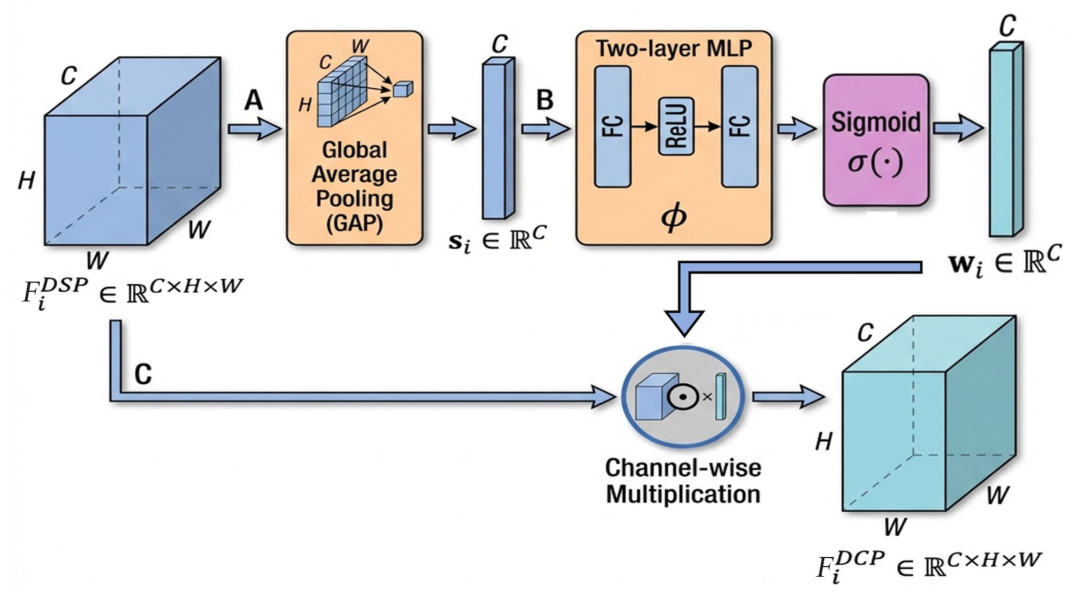
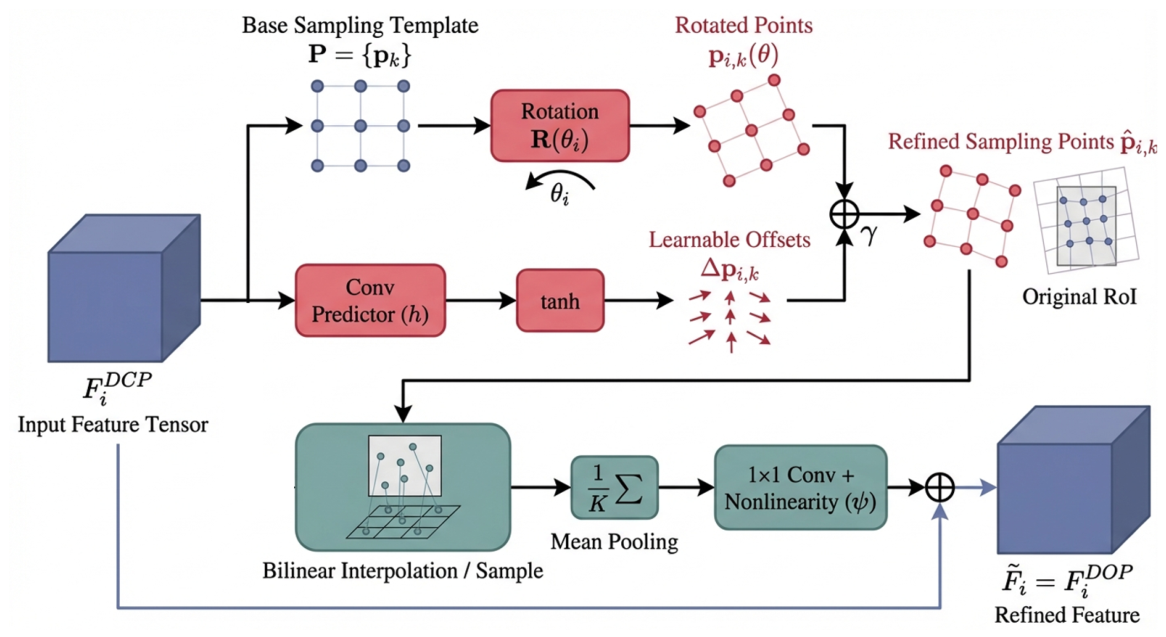
In this paper, we propose DyPerceiver-Det, a dynamic perception framework for fine-grained oriented object detection in remote sensing imagery. Instead of treating scale selection, channel modulation, and geometric alignment as independent components, DyPerceiver-Det reformulates RoI feature extraction as a unified instance-aware perception process. In this formulation, feature formation is explicitly conditioned on each object instance, and dynamic scale, channel, and orientation modeling are jointly integrated within the same RoI representation pipeline. Specifically, (1) Dynamic Scale Perception (DSP) extracts RoI features from multiple FPN levels and predicts instance-wise fusion weights, enabling adaptive scale selection conditioned on object size and local context; (2) Dynamic Channel Perception (DCP) applies instance-wise channel gating on RoI features to highlight discriminative subspaces for sub-class separation; and (3) Dynamic Orientation Perception (DOP) performs orientation-aligned dynamic local sampling by rotating a sampling template according to the object angle and refining it with learnable offsets, stabilizing the capture of fine-grained part structures under arbitrary orientations. These modules are lightweight and plug-and-play, allowing seamless integration into existing oriented detectors while providing interpretable perception signals such as scale fusion weights and channel gates.
Our main contributions are summarized as follows:
We propose DyPerceiver-Det, a plug-and-play Dynamic Perception RoI Extractor for RoI-based oriented detectors, which improves fine-grained remote sensing OBB detection by adapting RoI representations along scale, channel dimensions, and orientation-aligned sampling.
We introduce DSP, DCP, and DOP as lightweight instance-wise modules that, respectively, enable multi-level RoI fusion, category-/instance-dependent channel gating, and rotation-aligned local sampling with learnable refinement, directly targeting small objects and dense cluttered layouts.
We develop a unified evaluation protocol for fine-grained remote sensing detection, including scale-bucket AP, crowded-bucket AP, and fine-grained confusion analysis, and demonstrate consistent improvements on FAIR1M and MAR20 with interpretable visualizations and modest computational overhead.
4. Experiments
4.1. Experimental Setup
4.1.1. Datasets
We evaluate on two fine-grained remote sensing benchmarks:
(1) FAIR1M is a large-scale dataset for fine-grained oriented object detection, containing more than 15,000 high-resolution images and more than one million annotated instances [
47]. All instances are annotated with OBBs and organized into 5 generic categories and 37 sub-categories. FAIR1M includes challenging properties such as crowded scenes, complex backgrounds, and large variations in object scales and orientations. The OBB annotation is represented by four vertices arranged clockwise, with the top-left vertex marked as the first point to indicate the positive direction. Due to the large image sizes, we follow the common practice in FAIR1M and crop images into
patches with a stride of 256 for training and evaluation.
(2) MAR20 is a public benchmark for fine-grained military aircraft recognition in remote sensing imagery, including 3842 images, 20 aircraft types, and 22,341 instances [
48]. Each instance is annotated with both a horizontal bounding box and an OBB. Most images are around
pixels and are collected from 60 military airports worldwide.
For FAIR1M, we follow a standard split strategy, where 70% of the images are used for training, 10% for validation, and 20% for testing. For MAR20, we adopt a similar split protocol with 60% for training, 20% for validation, and 20% for testing due to the smaller dataset scale and class balance considerations.
4.1.2. Metrics
We report oriented detection performance using:
(1) OBB mAP: Mean average precision evaluated on oriented boxes under IoU threshold 0.5.
(2) Scale-bucket AP: , , . We follow the COCO-style scale definition using instance area (in pixels) on the cropped patches: small if area , medium if , and large otherwise.
(3) Crowded-bucket AP:
and
. For each ground-truth instance
i, we compute a local density score
where
is the oriented IoU between instance
i and its neighbor
j,
is a fixed overlap threshold (we set
), and
is the indicator function. We then mark the top
instances with the largest
in each image patch as
crowded and the rest as
non-crowded (we use
). This yields a consistent density-aware split across FAIR1M and MAR20.
4.1.3. Compared Methods
We compare DyPerceiver-Det with representative oriented detectors under a unified backbone and training protocol. For clarity, we categorize all baselines into two groups: single-stage and two-stage oriented detectors.
Single-stage methods directly predict oriented boxes on dense feature maps. We include the anchor-based Rotated RetinaNet (RetinaNet-O) and the anchor-free FCOS-O as representative single-stage baselines [
21,
29]. Two-stage methods first generate proposals and then refine them with an RoI head. We include Faster R-CNN-O, Oriented R-CNN, and RoI Transformer as representative two-stage baselines [
16,
24,
28], where RoI Transformer additionally performs orientation-aware feature transformation/alignment within the RoI head. We also include Gliding Vertex and
A-Net as two-stage oriented baselines [
26,
49], since they follow a proposal–refinement pipeline while using geometry refinement or alignment strategies tailored for rotated detection. All methods are evaluated using the same metrics on both FAIR1M and MAR20 (OBB mAP, scale-bucket AP, and crowded-bucket AP), ensuring consistent comparisons throughout this section.
4.1.4. Training and Implementation Details
All experiments use a ResNet-50 backbone with an FPN neck and share the same input preprocessing to keep the evaluation protocol consistent across datasets. For FAIR1M, we train on cropped patches with stride 256 and evaluate with the same tiling setup. For MAR20, we resize images while preserving aspect ratio and pad them to , so that both datasets use the same input resolution, the same definition of scale buckets, and the same crowded-bucket construction.
We train all methods with SGD (momentum 0.9, weight decay ) using a 36-epoch schedule, with learning rate decays at epochs 24 and 33. To keep optimization comparable across detector families, we use an initial learning rate of 0.005 for two-stage detectors and 0.0025 for single-stage detectors, and we keep these settings fixed on both datasets. The default total batch size is eight (two images per GPU on four GPUs), and we linearly scale the learning rate with total batch size when changing the number of GPUs. Data augmentation includes random horizontal and vertical flipping with probability 0.5; random rotation within ±30 degrees; color jittering with brightness, contrast, and saturation factors set to 0.2; and multi-scale resizing with image scales ranging from 0.5 to 1.5 of the original resolution.
For the proposed regularization terms, we set the sparsity loss weight to 0.1 and the consistency loss weight to 0.05 across all experiments. In addition, the consistency constraint uses a temperature parameter of 0.5 to control the sharpness of the consistency distribution. The offset scaling factor in the DOP module is set to 1.0, which allows for moderate spatial displacement while preventing unstable sampling behavior.
These hyperparameters are kept fixed across both FAIR1M and MAR20 datasets without additional tuning to ensure fair comparison. We empirically found that the model performance is stable within a relatively wide range of these values, indicating that the proposed method is not sensitive to small hyperparameter variations.
4.2. Results on FAIR1M
4.2.1. Quantitative Results
Table 1 reports the quantitative results on FAIR1M using the unified metric definitions. All compared methods are grouped into single-stage and two-stage oriented detectors. Overall, two-stage oriented detectors are consistently stronger than single-stage baselines on FAIR1M (e.g., RoI Transformer 34.7 vs. FCOS-O 31.0), indicating that proposal-based refinement is particularly beneficial under cluttered backgrounds and dense layouts. Among two-stage baselines, RoI Transformer achieves the best mAP (34.7), suggesting that orientation-aware RoI feature transformation improves fine-grained recognition beyond standard rotated box regression. DyPerceiver-Det further surpasses the best baseline by
mAP (36.8 vs. 34.7), and this gain is consistent with an instance-wise dynamic strategy that complements strong RoI heads, rather than relying on a specific detector design.
Furthermore, DyPerceiver-Det yields the largest improvement on small objects: increases from 22.5 (RoI Transformer) to 25.0, a gain of . This suggests that instance-wise scale routing (DSP) is particularly effective for tiny objects whose optimal feature resolution deviates from heuristic FPN assignment. The improvements on medium and large objects remain consistent: improves by (37.0 vs. 35.3), and improves by (45.6 vs. 44.5), showing that the method does not trade off large-object performance for small-object gains.
For dense layouts, DyPerceiver-Det improves from 28.2 to 31.8 (), which is larger than the improvement on APnon-crowded (37.8 vs. 36.0, ). This gap indicates that dynamic orientation-aware sampling and channel gating play a more critical role when objects are spatially close and background interference is severe. In crowded areas, DOP reduces feature misalignment caused by arbitrary orientations and overlapping instances, while DCP suppresses clutter-dominant channels that otherwise produce false positives or unstable orientations.
4.2.2. Fine-Grained Confusion Analysis
We analyze fine-grained misclassification on FAIR1M via a detection confusion matrix over the 37 classes. Using the same prediction set as
Table 1, we match detections to ground truth by oriented IoU (IoU
OBB > 0.5) and accumulate a confusion matrix
, where
counts matched instances whose ground-truth class is
i but predicted as
j. We then report the row-normalized matrix
(each row sums to 1), which reveals the dominant confusion destinations for each ground-truth class. Since a full
matrix is too large to present clearly in the main text, we provide two compact views: (i) Top-
K most confused class pairs (largest off-diagonal
); (ii) a within-airplane sub-matrix on the most confusing aircraft types to expose fine-grained aircraft ambiguity.
Table 2 lists the Top-12 confusions. Two patterns dominate: (1) confusion among visually similar vehicles (e.g., Small car/Van/Bus and truck-family variants), and (2) confusion among ships/boats that share elongated hull shapes and appear under dense harbor clutter. A third, smaller but important pattern is fine-grained aircraft confusion among similar airliner families, especially when objects are small or partially occluded.
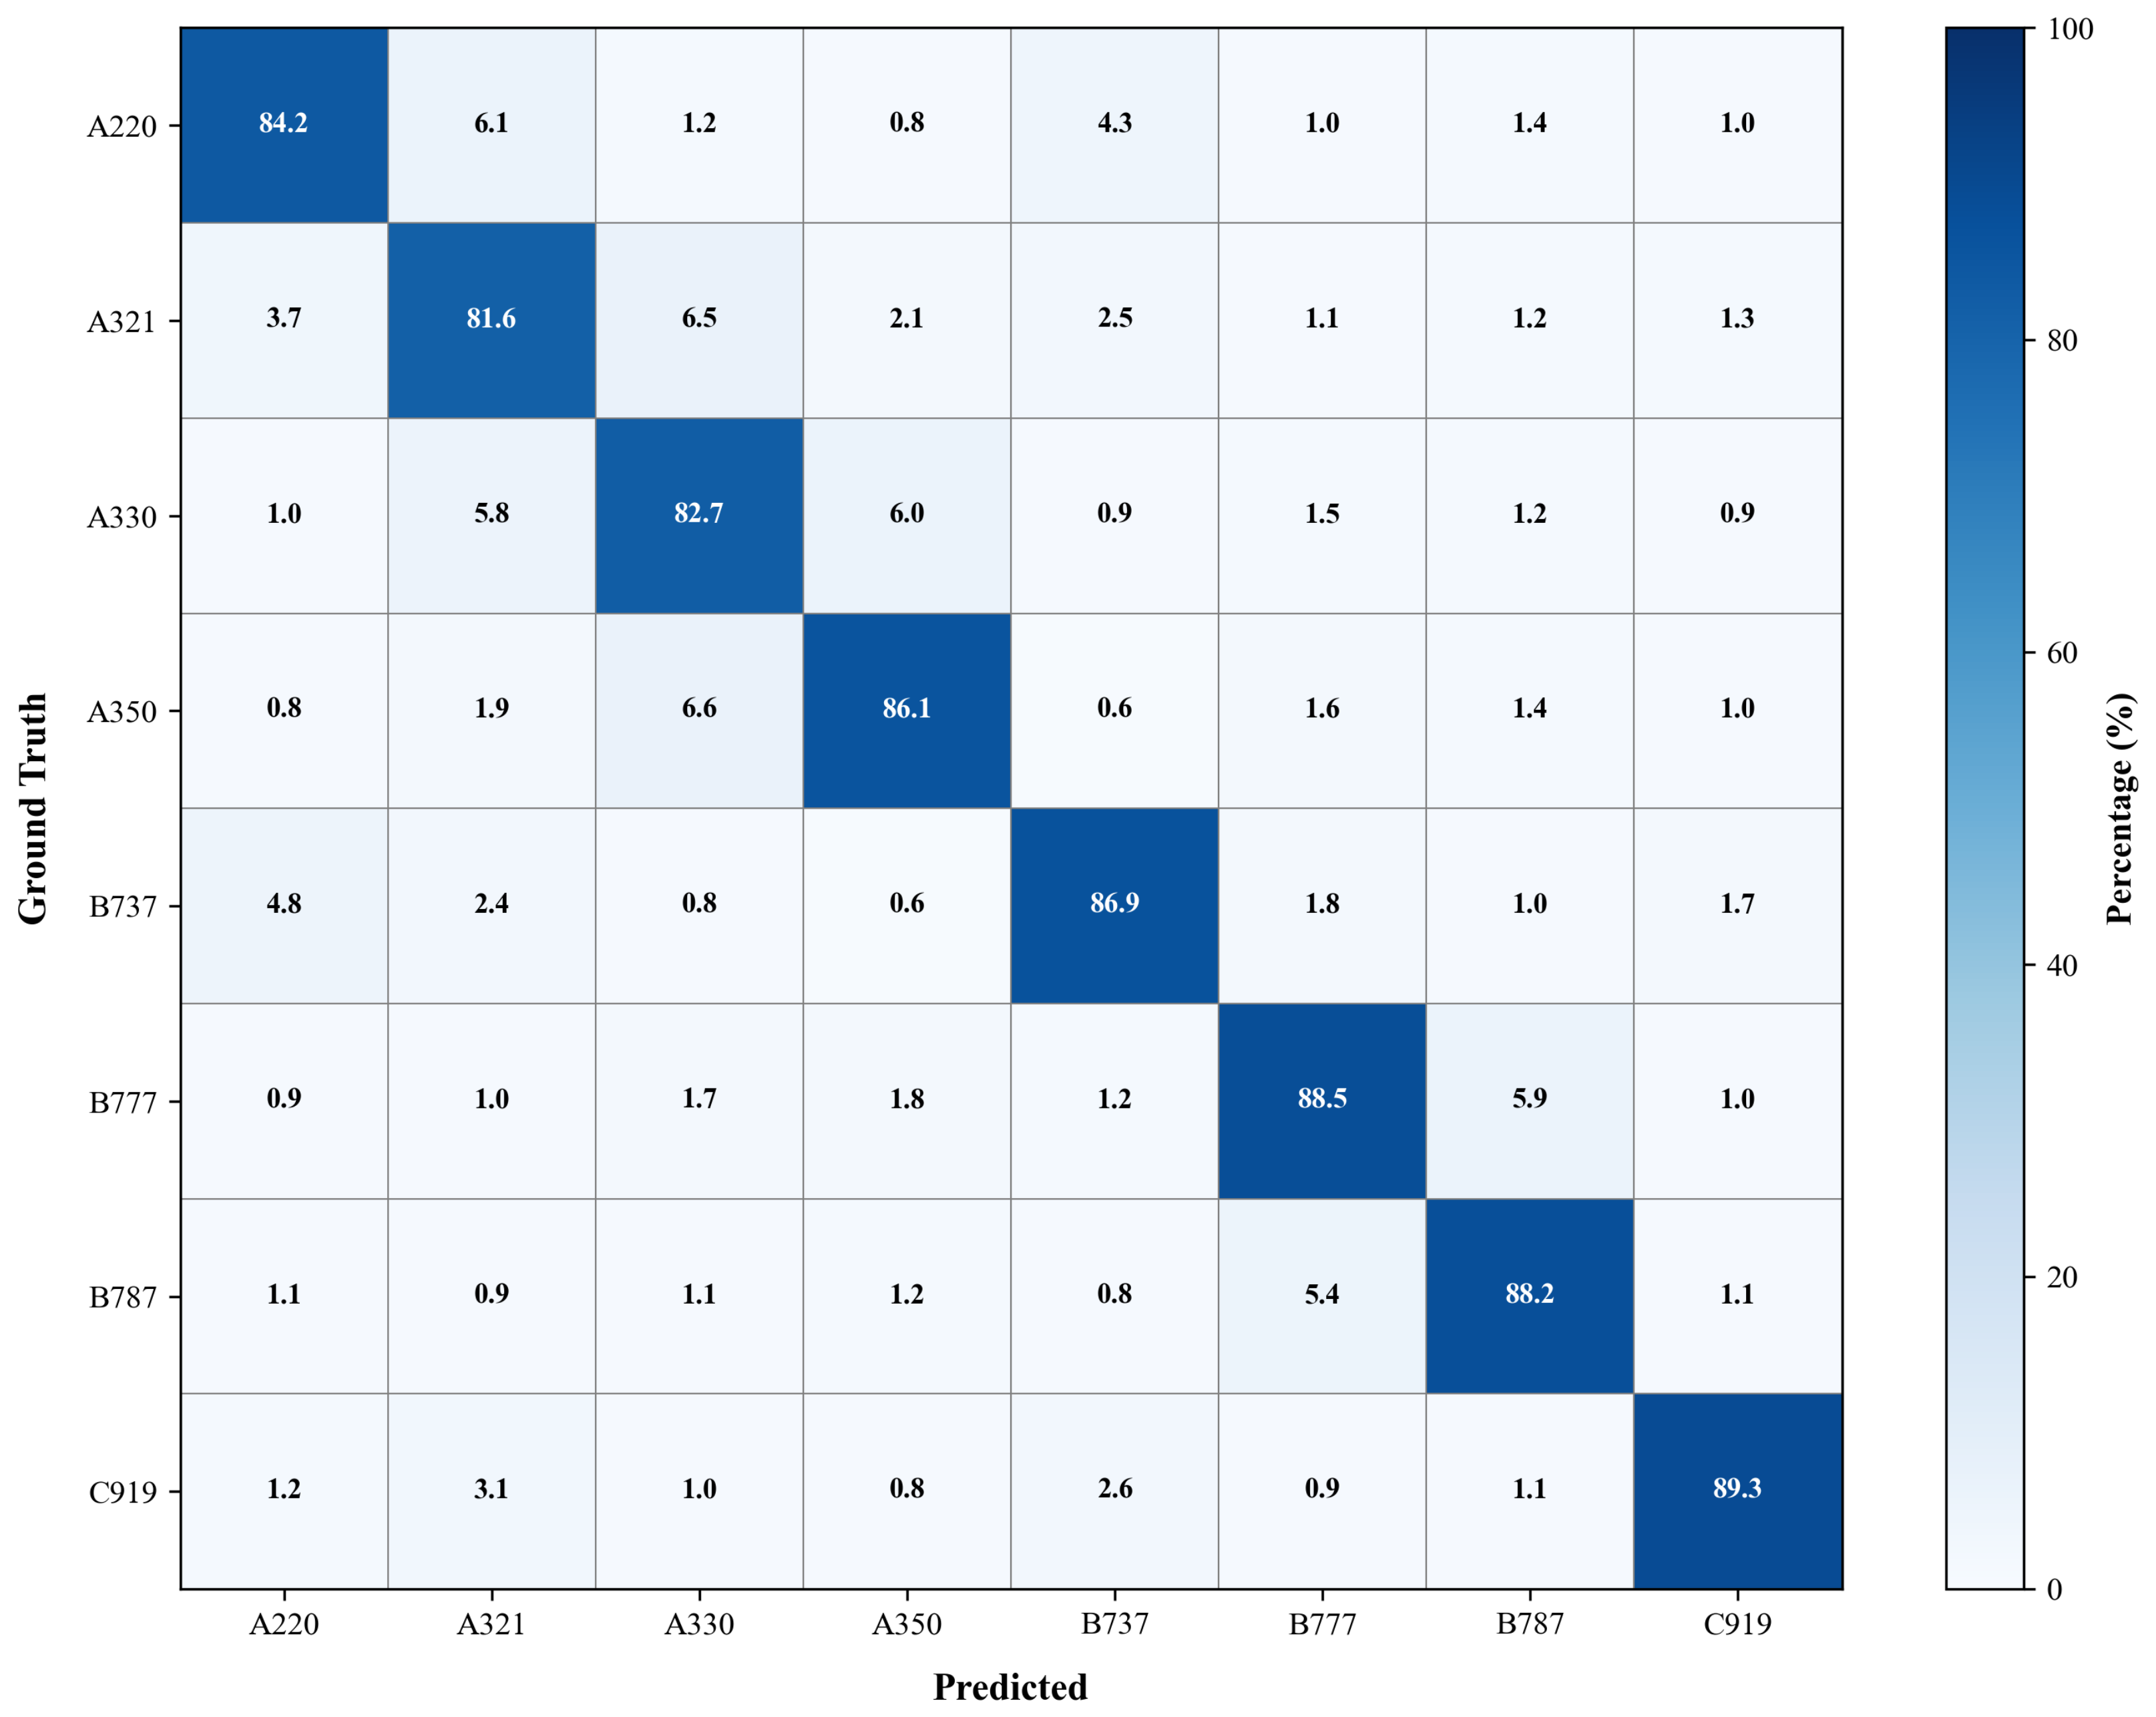
To zoom into the fine-grained aircraft regime,
Figure 5 reports an
row-normalized confusion sub-matrix over representative aircraft types: {A220, A321, A330, A350, Boeing737, Boeing777, Boeing787, C919}. Diagonal entries indicate correct classification rates; off-diagonal entries capture fine-grained confusion among visually similar airliners under varying scales and orientations.
The confusion statistics are consistent with two core properties of FAIR1M. First, most high-probability confusions occur within the same super-category (vehicle–vehicle, ship/boat–ship/boat, airplane–airplane), rather than across super-categories. This indicates that the dominant error source is fine-grained ambiguity among sibling classes that share similar geometry and textures, instead of coarse semantic separation. Second, the strongest confusions align with the hard regimes highlighted by our bucketed evaluation: small objects (limited pixels) and crowded scenes (dense neighborhoods) amplify class ambiguity, because discriminative details are partially missing and nearby instances introduce feature interference.
In practice, these confusion modes can be interpreted by their visual causes: (i) truck-family confusions (Cargo Truck/Dump Truck/Truck Tractor/Trailer) are driven by similar rectangular bodies and partial visibility under occlusion; (ii) boat-family confusions (Motorboat/Fishing Boat/Tugboat) are driven by small scale and background clutter (wake and harbor textures); (iii) cargo-ship variants (Dry Cargo Ship/Liquid Cargo Ship) are driven by elongated hull similarity under arbitrary orientations; (iv) airliner-family confusions (A321↔A330, Boeing777↔Boeing787, etc.) arise when wings/fuselage proportions are under-resolved or truncated in crowded airports.
These observations motivate the need to evaluate and improve fine-grained discrimination beyond overall mAP, and they directly connect to the small/crowded performance reported earlier: reducing feature misalignment and interference in these regimes is essential for suppressing the dominant off-diagonal confusions.
4.2.3. Qualitative Visualization and Interpretation
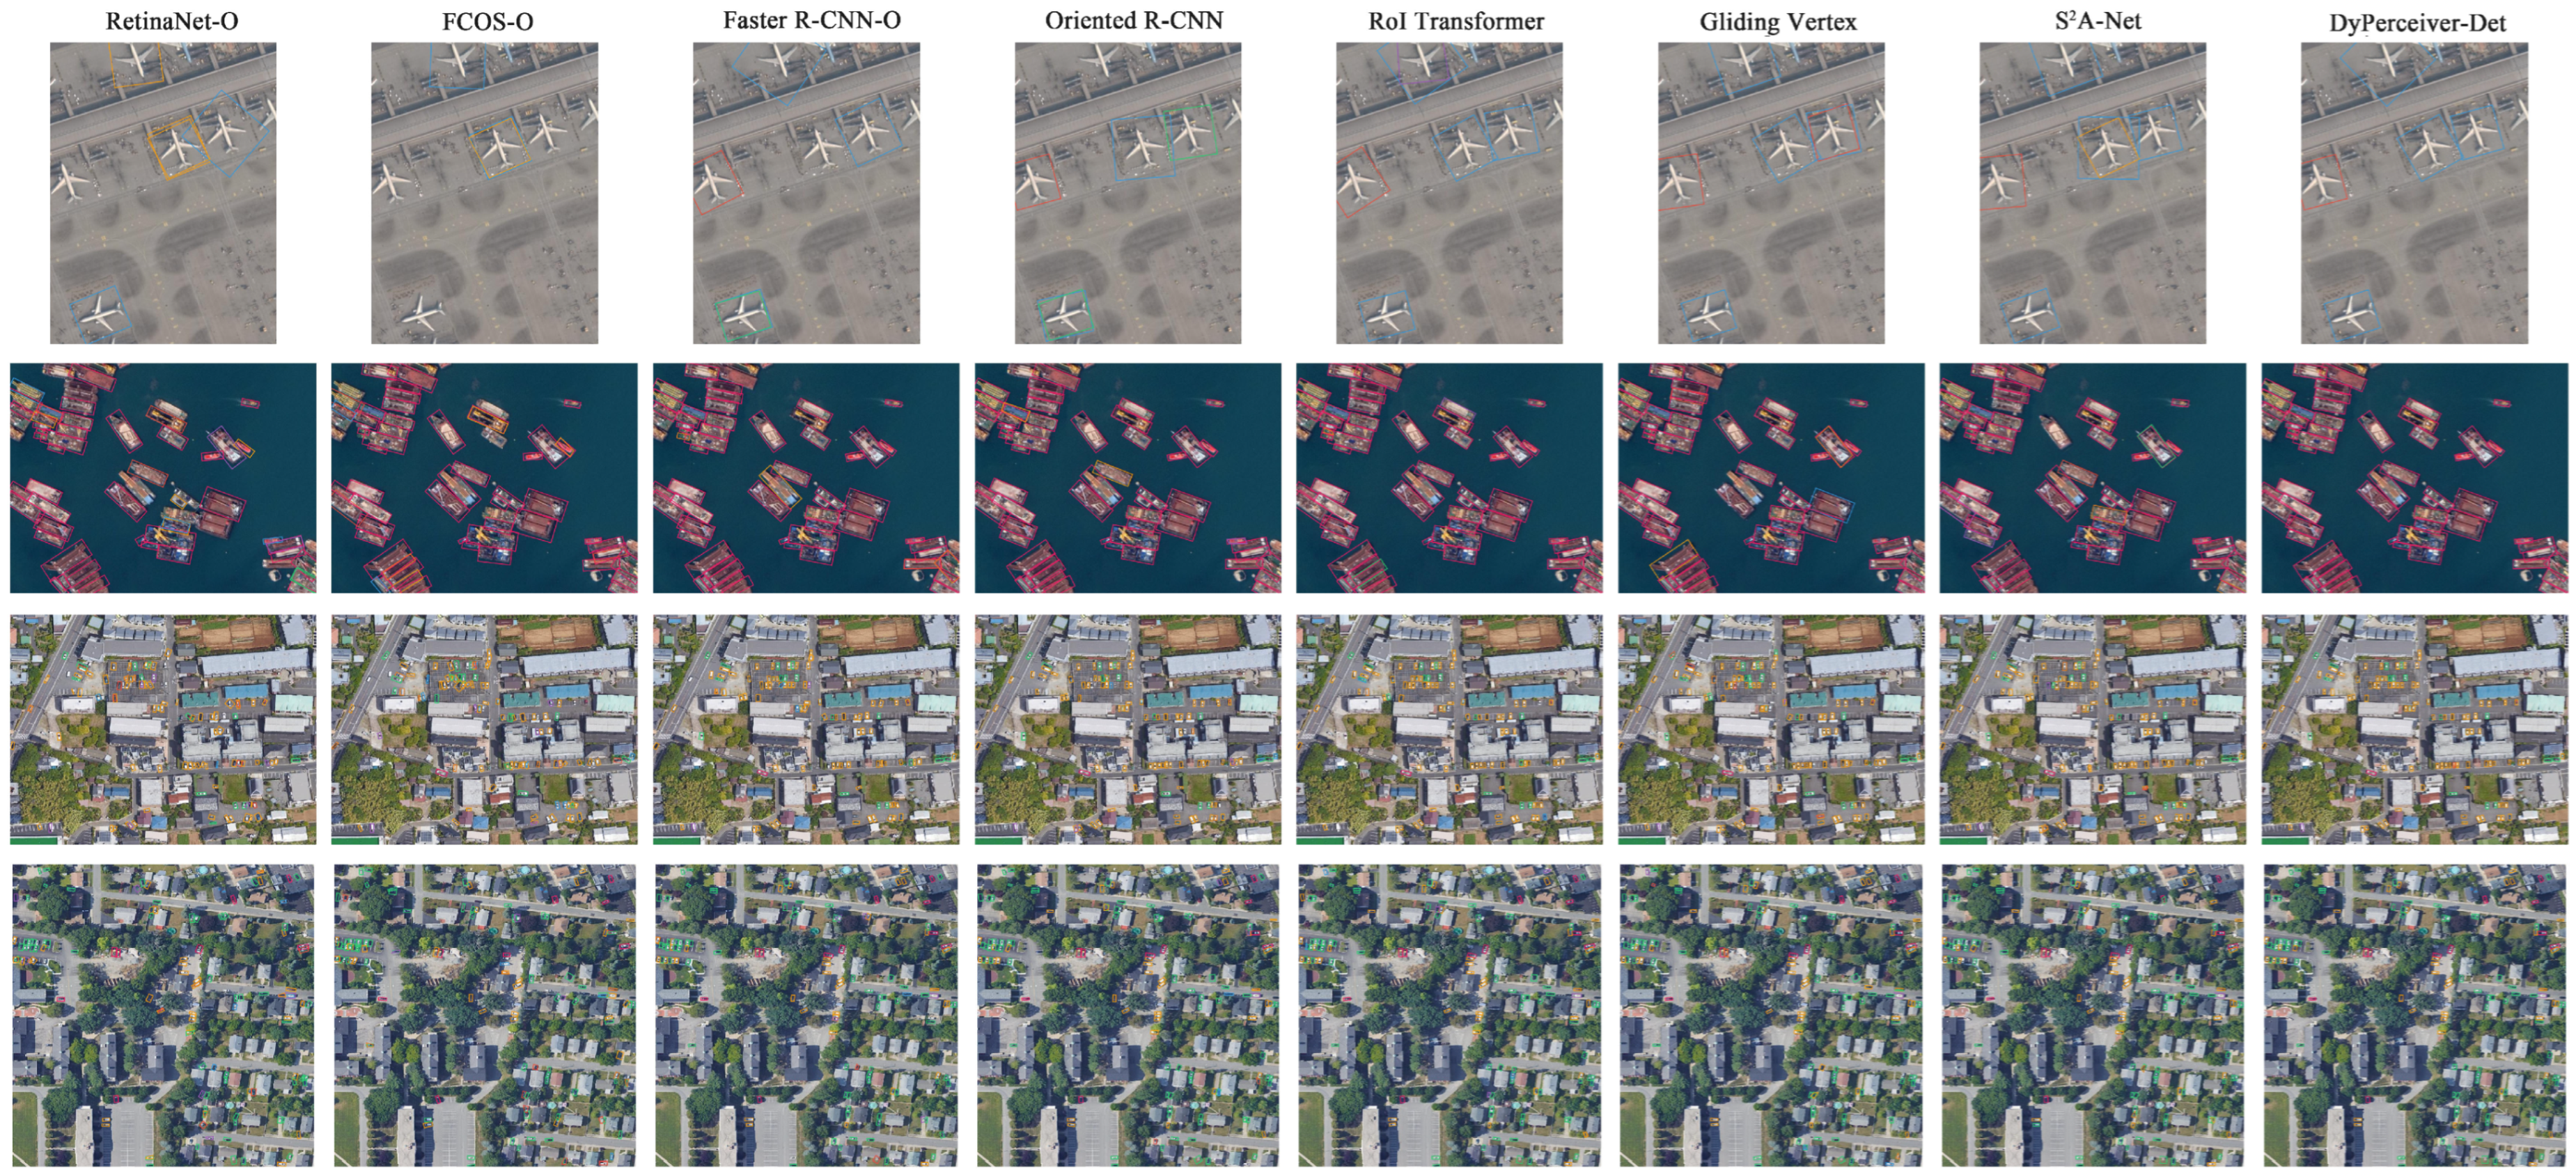
We visualize detection outputs for all compared methods on the same FAIR1M patches to provide qualitative insights into their performance differences. Each visualization overlays predicted oriented boxes with distinct colors for different object classes, using an identical rendering style across methods.
Figure 6 adopts a side-by-side layout: each row is a representative scene (e.g., airport, harbor, road), and columns correspond to RetinaNet-O, FCOS-O, Faster R-CNN-O, Oriented R-CNN, RoI Transformer, Gliding Vertex,
A-Net, and DyPerceiver-Det.
The qualitative results corroborate the quantitative findings in
Table 1 and reveal clear performance distinctions across methods. Single-stage baselines (RetinaNet-O and FCOS-O) exhibit noticeable limitations: they tend to miss small targets more frequently, produce more orientation jitter under clutter, and generate a higher number of false positives. The stronger two-stage baselines (Faster R-CNN-O, Oriented R-CNN, Gliding Vertex, and
A-Net) show improved performance with reduced missed detections and more accurate bounding boxes, though they can still confuse visually similar instances in dense layouts. RoI Transformer demonstrates further improvements with fewer missed detections and more precise localization. DyPerceiver-Det produces the most accurate results: it generates tighter oriented boxes for elongated objects, achieves nearly perfect detection recall with minimal missed targets, exhibits superior class discrimination without confusion errors, and produces significantly fewer false positives in crowded patches. These qualitative observations are consistent with the larger gains on
and
metrics, demonstrating the effectiveness of the proposed dynamic perception mechanisms.
4.3. Results on MAR20
4.3.1. Quantitative Results
MAR20 is a fine-grained military aircraft benchmark with 20 aircraft types, where the benchmark abbreviates {SU-35, C-130, C-17, C-5, F-16, TU-160, E-3, B-52, P-3C, B-1B, E-8, TU-22, F-15, KC-135, F-22, FA-18, TU-95, KC-10, SU-34, SU-24} as A1–A20. We follow the same evaluation protocol for a consistent cross-dataset analysis.
Table 3 reports the quantitative comparison on MAR20. Among the baselines, the strongest overall performance is achieved by RoI Transformer (82.72 mAP), followed by Oriented R-CNN (81.92) and Gliding Vertex (81.48), matching the general trend that two-stage detectors are preferable for fine-grained recognition. Notably, DyPerceiver-Det improves over the best baseline by a clear margin (84.10 vs. 82.72), and the gain is concentrated on the most challenging regimes (small and crowded), suggesting that instance-wise dynamic perception complements proposal-based refinement rather than merely re-implementing a stronger detector head.
The bucketed evaluation in
Table 3 reveals two consistent patterns. First, fine-grained aircraft recognition is strongly bottlenecked by small instances: single-stage baselines show a large gap between
and
, indicating that limited pixels and weak part evidence dominate the failure cases. Second, crowded airport layouts amplify both localization and classification ambiguity:
is systematically lower than AP
non-crowd for all methods, reflecting feature interference from nearby aircraft and complex runway/apron backgrounds. DyPerceiver-Det exhibits the most pronounced gains on
and
(e.g., +
and +
over RoI Transformer), which is aligned with our design goal of per-instance dynamic scale/orientation/channel perception to mitigate under-resolved textures and neighborhood interference in fine-grained settings.
4.3.2. Fine-Grained
Confusion Analysis
Unlike FAIR1M, MAR20 contains a single super-category (aircraft) with 20 fine-grained types (A1–A20). We compute a
confusion matrix
and report its row-normalized form
, where each row corresponds to one ground-truth aircraft type.
Table 4 lists the Top-10 off-diagonal confusions (row-normalized, %), which highlights that the dominant errors are sibling-type ambiguities within visually similar families.
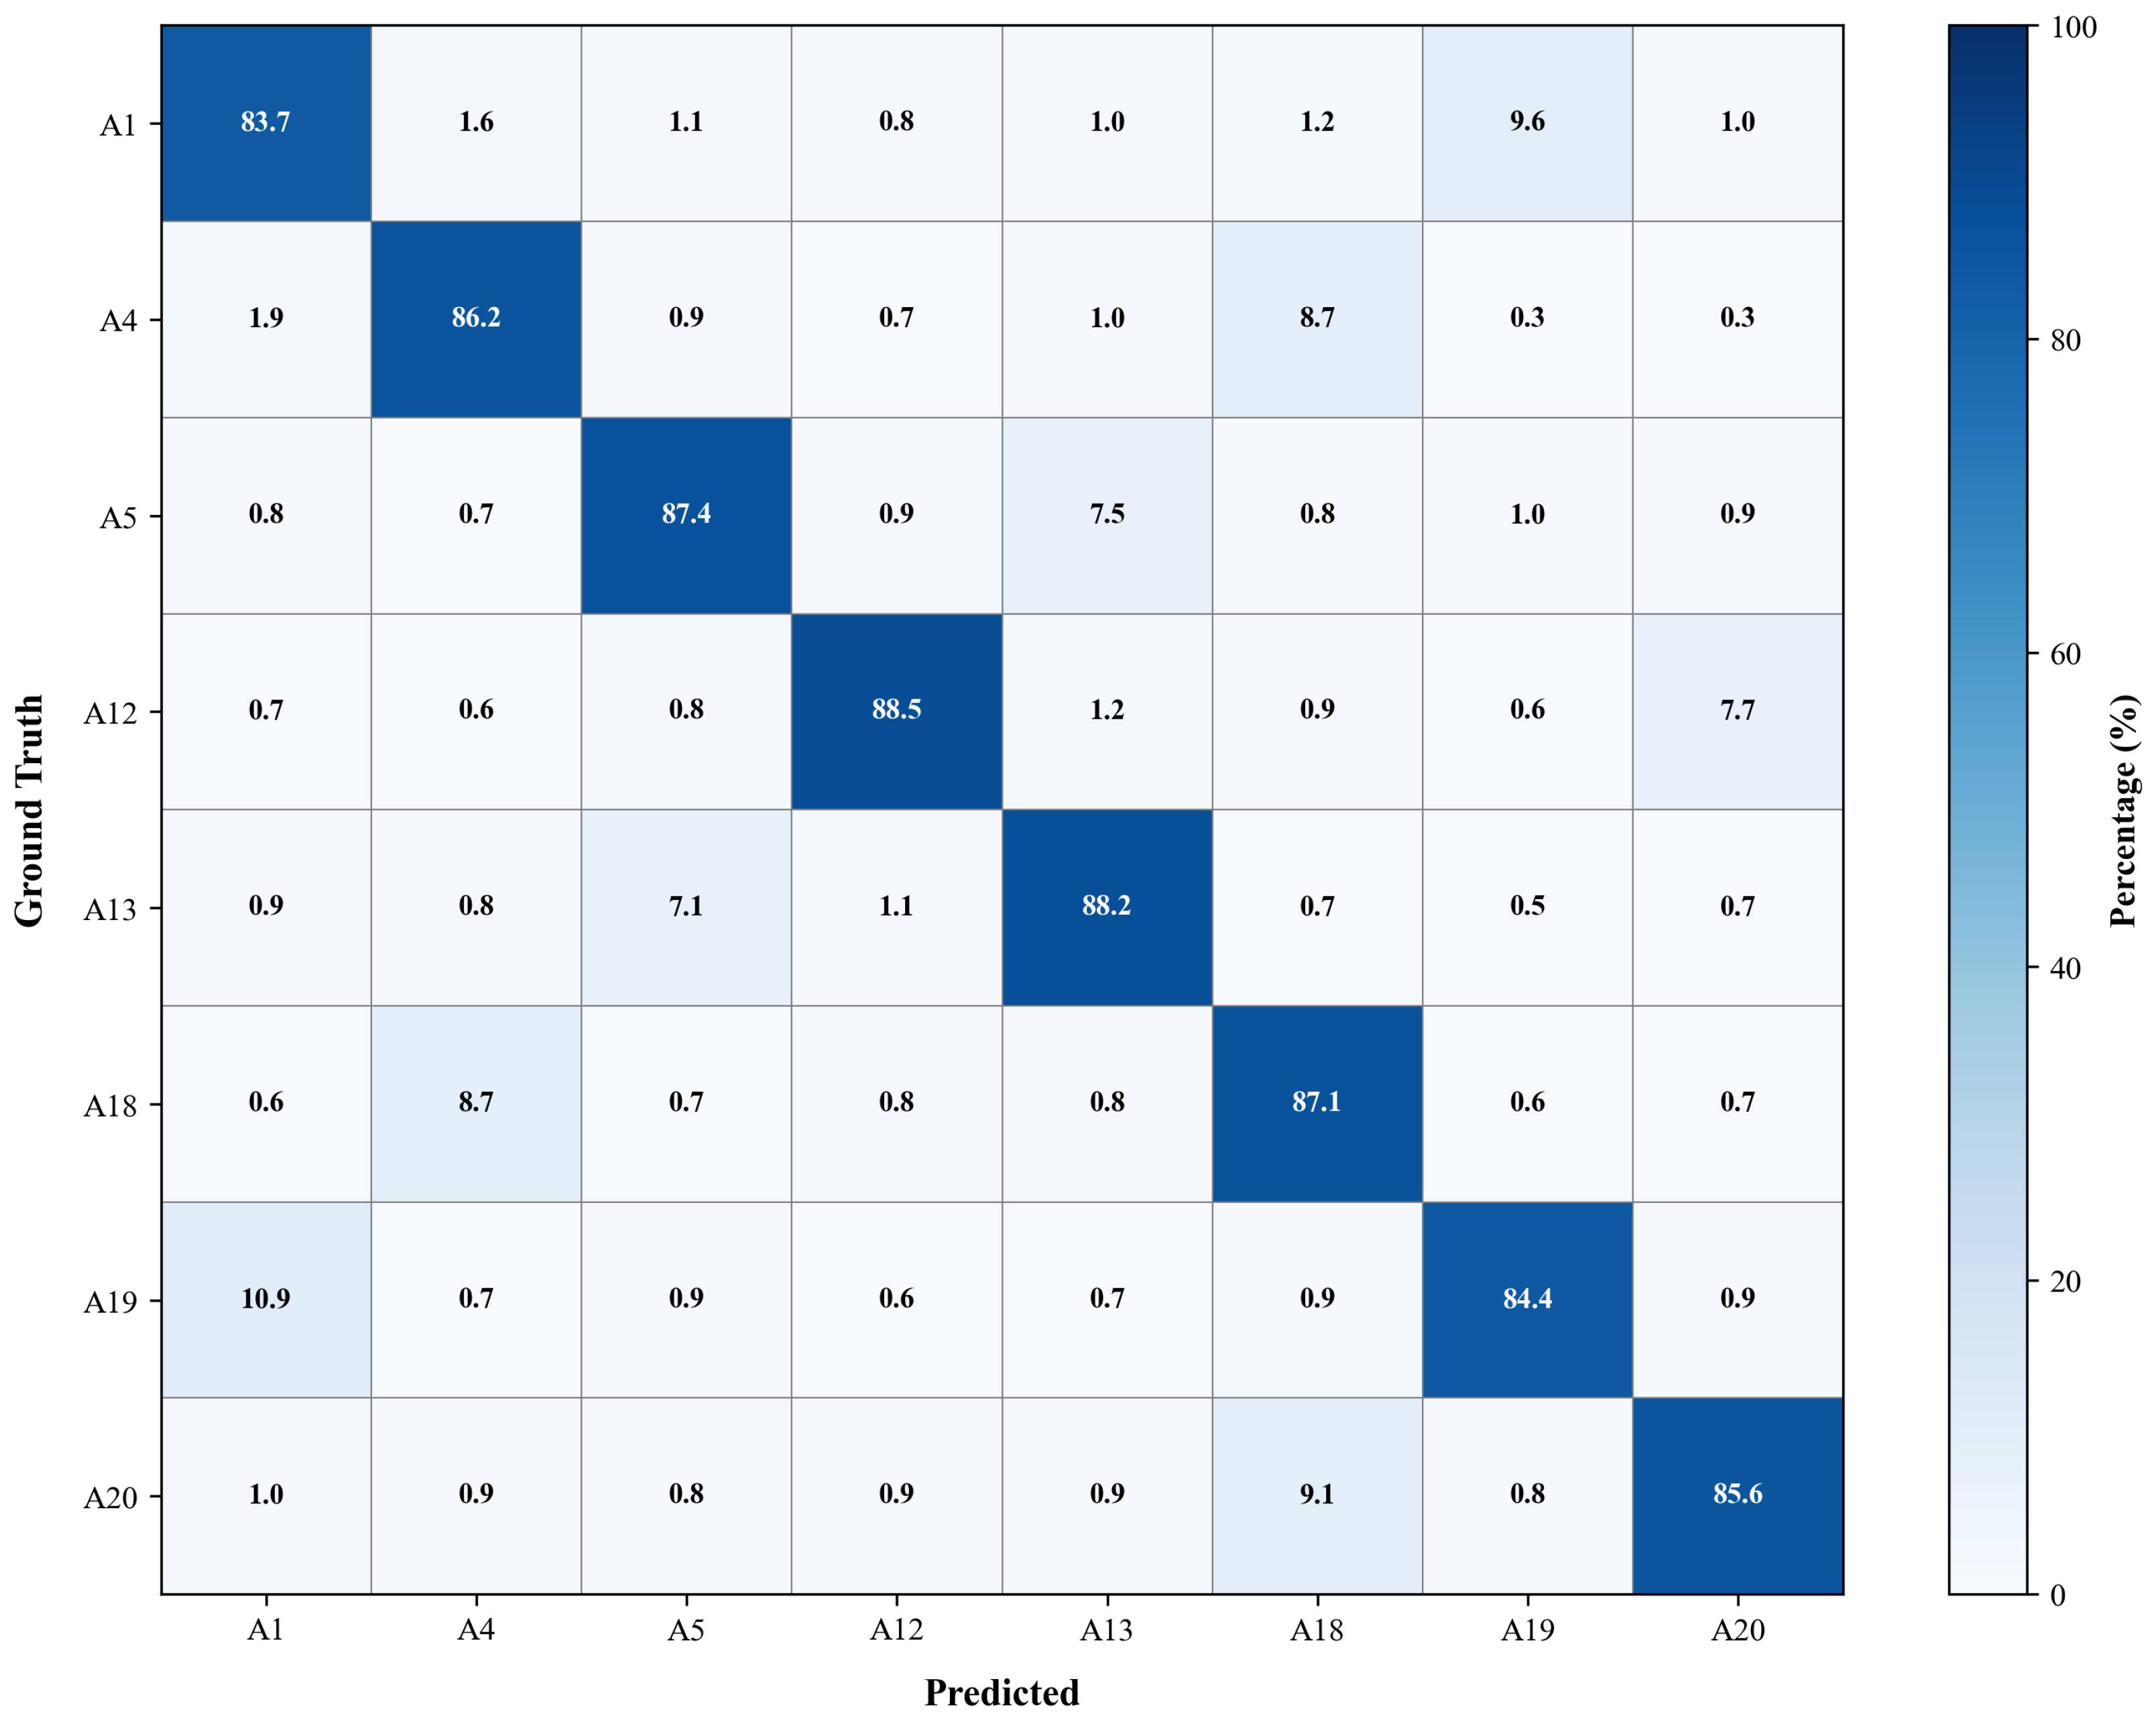
To further expose structured confusion within the most ambiguous subset,
Figure 7 reports an
sub-matrix over representative types {A1, A4, A5, A12, A13, A18, A19, A20}, chosen from the high-frequency confusions. The diagonal remains dominant, while the largest off-diagonal entries align with the Top-10 list, indicating that the remaining errors are concentrated on a small set of visually similar pairs, typically under small scale, partial occlusion, or dense parking layouts.
Overall, the confusion structure on MAR20 is more ’purely’ fine-grained than FAIR1M because all categories are aircraft. This makes the task particularly sensitive to subtle part cues (nose/canard/tailplane layout) that are easily degraded when targets are small or tightly packed. The reduced off-diagonal mass on the most frequent confusion pairs, together with the stronger
and
gains in
Table 3, is consistent with DyPerceiver-Det improving discriminative RoI features under scale limitation and neighborhood interference.
4.3.3. Qualitative
Visualization and Interpretation
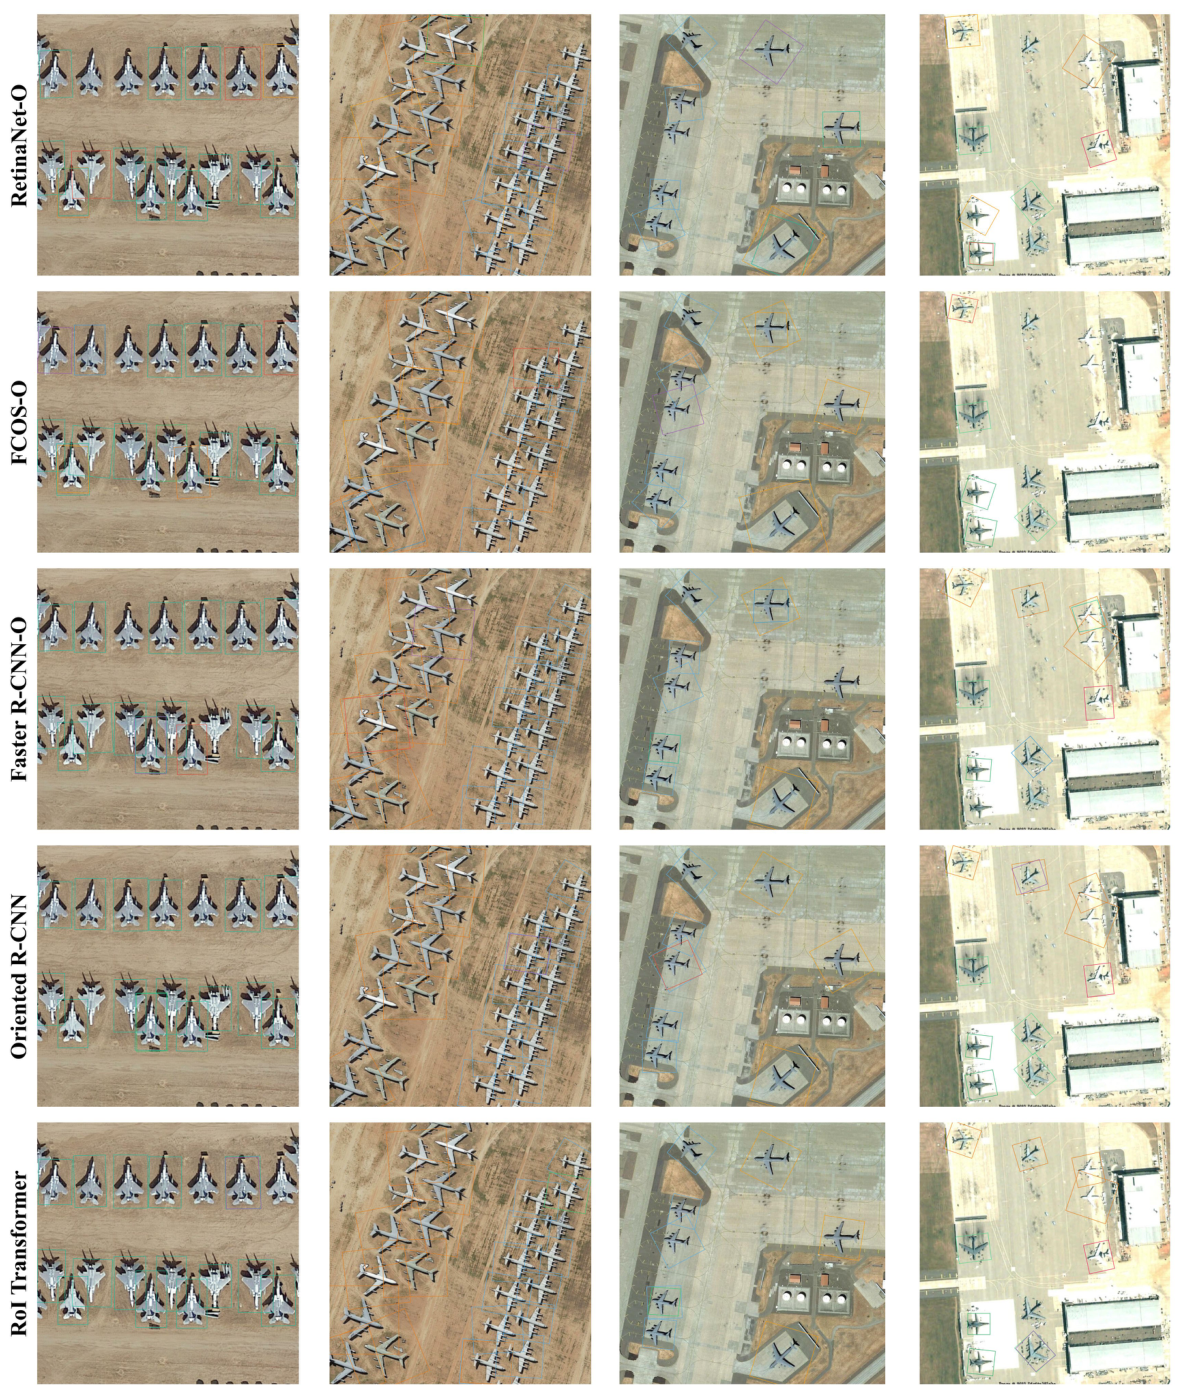
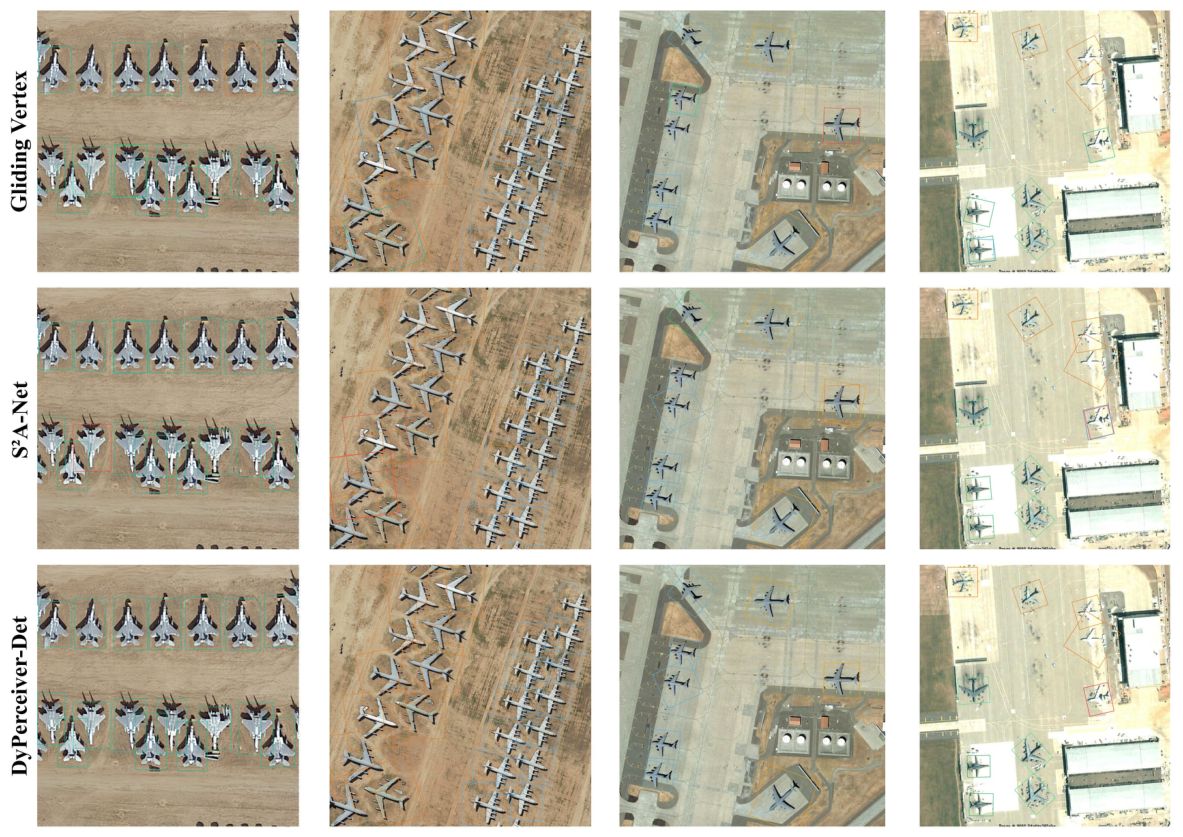
Figure 8 visualizes representative detection results on MAR20 for RetinaNet-O, FCOS-O, Faster R-CNN-O, Oriented R-CNN, RoI Transformer, Gliding Vertex,
A-Net, and DyPerceiver-Det. We choose three typical scenarios that highlight different challenges in oriented object detection: (i) small aircraft scattered across apron regions, which tests the ability to detect tiny targets in sparse layouts; (ii) dense parking with heavy overlap, which evaluates performance under severe occlusion and crowding; and (iii) large aircraft with extreme rotations, which challenges the robustness of orientation estimation under large angular variations.
Across these challenging cases, the qualitative results reveal distinct performance patterns that align with the quantitative metrics. Single-stage baselines (RetinaNet-O and FCOS-O) exhibit noticeable limitations: they tend to miss small instances in scattered scenarios, produce class-swapped predictions in dense layouts where visually similar aircraft types are clustered together, and struggle with accurate localization under extreme rotations. The stronger two-stage baselines (Faster R-CNN-O, Oriented R-CNN, Gliding Vertex, and A-Net) demonstrate improved localization accuracy and better handling of overlapping instances, but they still exhibit fine-grained label flips on visually similar aircraft types (e.g., confusing A1 with A19, or A4 with A18) in crowded regions. RoI Transformer shows further improvements with more precise localization and fewer missed detections. DyPerceiver-Det typically yields the most accurate results: it produces tighter oriented boxes that better align with elongated aircraft structures under rotation, achieves superior fine-grained classification with fewer class-swapped predictions in crowded regions, and maintains robust detection performance across all three scenarios. These qualitative observations visually match the quantitative improvements on small object detection and crowded scene performance, demonstrating the effectiveness of the dynamic perception mechanisms in handling diverse and challenging detection scenarios on the MAR20 dataset.
4.4. Ablation Studies
4.4.1. Component Ablation
We evaluate the contribution of each proposed module by progressively adding them to the same baseline detector under the unified training protocol and the same evaluation metrics defined in
Section 4.1.2. Specifically, we start from the baseline and add DSP, then add DCP, and finally add DOP to form the full model.
Table 5 reports the results on both FAIR1M and MAR20 with consistent metrics: OBB mAP, scale-bucket AP, and crowded-bucket AP. We observe a monotonic improvement when adding modules, and the gains are more pronounced on the challenging regimes (small objects and crowded scenes). DSP brings the largest boost on
, while DCP and DOP provide additional gains on
, which matches their intended roles in alignment and clutter suppression.
On FAIR1M, adding DSP yields a clear gain on (21.3→23.2), indicating that instance-wise scale routing helps recover fine-grained details for tiny targets. Adding DCP further improves (28.4→30.0), suggesting that orientation-aligned sampling reduces feature interference under dense layouts. Finally, adding DOP brings additional improvement on crowded scenes (30.0→31.8) and also increases (36.1→37.0), consistent with channel-wise suppression of clutter-dominant responses. Similar trends hold on MAR20, where gains concentrate on and , which are the two most sensitive regimes for fine-grained aircraft recognition.
Table 6 reports the ablation results of different DOP designs under the same evaluation protocol as the main experiments. We observe that both offset-only and rotation-only variants improve over the baseline, but their gains are limited and concentrated in specific scenarios. Offset-only sampling lacks an explicit geometric prior, forcing the network to simultaneously learn global rotation alignment and local deformation modeling, which leads to suboptimal performance in crowded and highly rotated scenes. Rotation-only sampling provides strong pose alignment, but it is unable to adapt to local variations such as truncation, part displacement, and proposal noise.
By combining rotation alignment with learnable offsets, the full DOP achieves consistent improvements across all metrics, especially on and , where precise geometric alignment and local refinement are both critical. This demonstrates that rotation and offset learning are complementary rather than redundant, validating the proposed two-stage sampling design.
4.4.2. Full-Factorial Interaction Analysis of DSP, DCP, and DOP
To explicitly quantify the interaction effects among DSP, DCP, and DOP, we conduct a full-factorial ablation study covering all possible module combinations. This experiment evaluates not only individual contributions but also pairwise and full-module interactions under a consistent evaluation protocol.
As shown in
Table 7, the results demonstrate that each module contributes complementary benefits across different evaluation dimensions. DSP consistently improves performance on small objects, reflected by higher
, due to adaptive multi-scale feature selection. DCP mainly enhances representation quality, leading to improved performance across
and
, where discriminative channel modulation is critical. DOP significantly improves localization in challenging scenarios, especially reflected in gains on
, where orientation-aligned sampling reduces feature misalignment.
When combining modules, performance improves consistently across all metrics, including mAP and , indicating that the three components are mutually reinforcing rather than redundant. The full configuration achieves the best results across all evaluation dimensions, confirming the effectiveness of the proposed coupled instance-aware perception design.
4.4.3. Regularization Ablation
We ablate two lightweight regularizers applied to the instance-conditioned decisions: (i) a sparsity regularizer that encourages confident routing/gating (reducing noisy mixtures), and (ii) a consistency regularizer that enforces stable decisions under strong geometric augmentations (random rotation and flips), which is particularly important for remote sensing where the same object can appear at arbitrary orientations. All settings are evaluated with the same metrics.
Table 8 shows that both regularizers improve overall accuracy and, more importantly, stabilize performance in the most challenging regimes. On FAIR1M, removing either term causes a larger drop in
than in AP
non-crowded, suggesting that regularization mainly reduces decision noise when multiple adjacent objects and clutter textures compete for attention. The same trend holds on MAR20, where fine-grained aircraft recognition is highly sensitive to small targets and dense parking layouts. When both regularizers are removed, the degradation is most evident on
and
, indicating that the dynamic policy becomes less reliable precisely in the regimes where instance-wise adaptation is most needed.
A notable observation is that the two regularizers are complementary rather than redundant. Sparsity mainly sharpens the dynamic routing/gating decisions and improves crowded-scene robustness (e.g., on FAIR1M drops from 31.8 to 31.0 without sparsity), while consistency primarily stabilizes decisions under large rotations and augmentations (e.g., a further drop to 30.6 without consistency). Removing both leads to the largest degradation (FAIR1M mAP 35.8 and 29.8), indicating that stable and confident instance-wise decisions are necessary to translate dynamic perception into reliable gains, especially in dense scenes where feature interference is severe.
4.4.4. Hyper-Parameter Sensitivity
We studied the sensitivity of DyPerceiver-Det to four key hyper-parameters that control the trade-off between accuracy and efficiency: dop_k, out_size, reduction, and . Specifically, dop_k corresponds to the number of sampling points K in DOP, out_size determines the spatial resolution of RoI features used for orientation-aligned sampling, reduction controls the channel bottleneck ratio in DCP gating, and regulates the maximum displacement magnitude of learnable offsets in DOP.
The default configuration is set to
, which is used in all main experiments.
Table 9 reports sensitivity results on both FAIR1M and MAR20. Overall, DyPerceiver-Det is not sensitive to moderate variations of these hyper-parameters, and performance changes smoothly across different settings, indicating stable optimization behavior.
For DOP-related parameters, increasing dop_k from 4 to 9 improves by enabling denser orientation-aligned sampling, while further increasing it to 12 brings only marginal gains. Similarly, out_size shows a mild trade-off between spatial detail and computational cost, where medium resolution provides the best balance.
The scaling factor controls the flexibility of geometric deformation in DOP. Smaller values restrict sampling adaptability, while excessively large values may introduce unstable offsets, slightly degrading localization accuracy in crowded scenes. The default setting achieves a stable balance between flexibility and robustness.
For DCP, the reduction parameter controls the capacity of channel-wise modulation. A moderate value provides optimal discriminative ability, while overly aggressive reduction weakens fine-grained representation, especially for small objects.
Overall, these results demonstrate that DyPerceiver-Det does not rely on a narrow hyper-parameter configuration. Instead, all parameters exhibit stable behavior within a reasonable range, confirming the robustness of the proposed instance-adaptive perception framework.
4.4.5. Ablation Visualizations
To make the ablation behavior interpretable, we visualize the dynamic signals under different ablation settings on FAIR1M. Since FAIR1M contains three major object super-categories (Ship/Vehicle/Airplane), we report category-aware visualizations for each module and relate the observed patterns to the bucketed improvements in
Section 4.4.
(1) DSP scale-weight visualization.
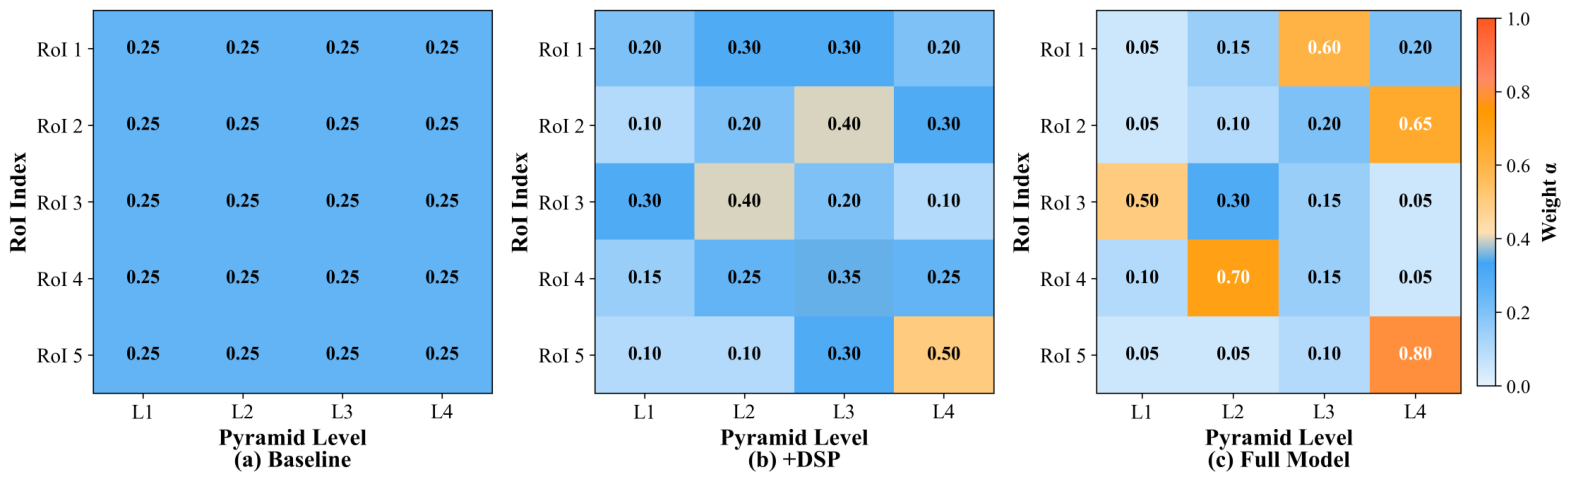
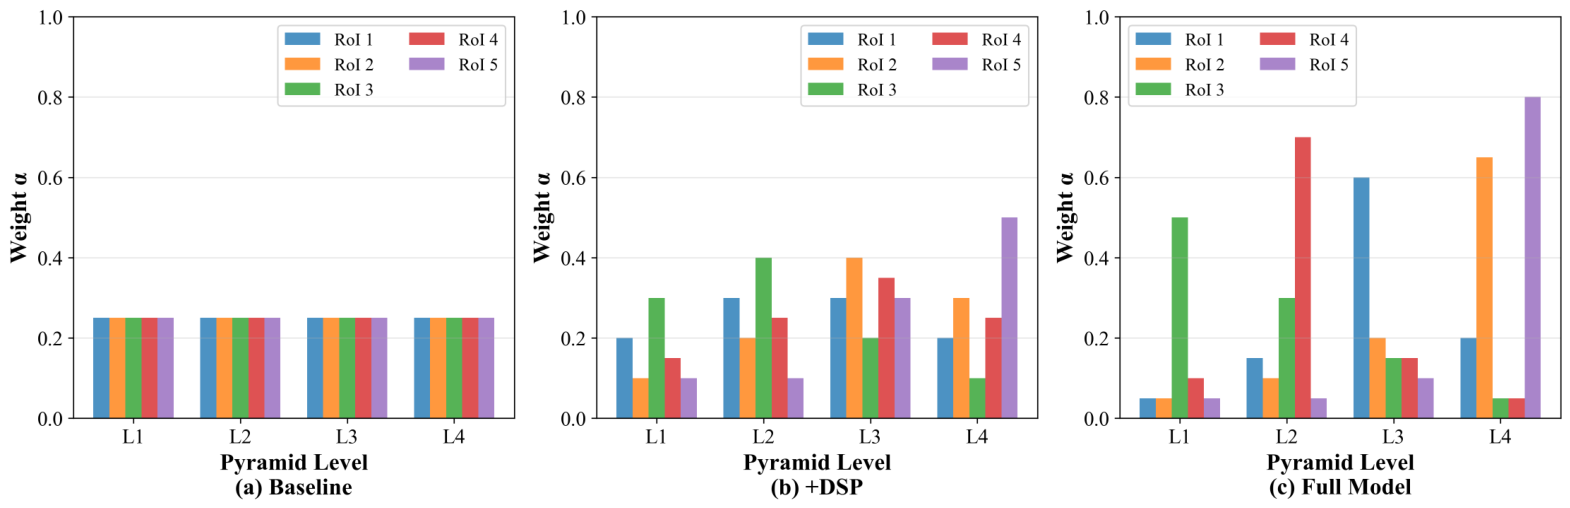
Figure 9 and
Figure 10 visualize the scale routing weights
produced by DSP under three settings: Baseline, + DSP, and the Full Model. In the baseline setting, the scale responses are close to a fixed or uniform allocation across pyramid levels, which indicates that the detector lacks an instance-adaptive mechanism to select the most suitable feature resolution. After adding DSP, the routing weights become more selective, and different RoIs begin to emphasize different FPN levels according to their object size and surrounding context. In the Full Model, this trend becomes more evident: small vehicles and aircraft tend to assign larger weights to high-resolution pyramid levels, while larger ships or elongated objects rely more on semantically stronger lower-resolution levels.
This visualization supports the methodological motivation of DSP. Instead of using a fixed FPN level assignment, DSP learns an instance-specific scale selection strategy. Such behavior explains why the full model obtains a clear improvement on in the ablation results: small objects can preserve more detailed spatial cues by routing features toward appropriate high-resolution levels, while medium and large objects still benefit from semantic features at deeper levels. Therefore, DSP does not simply introduce additional parameters, but provides an interpretable scale-adaptive perception mechanism.
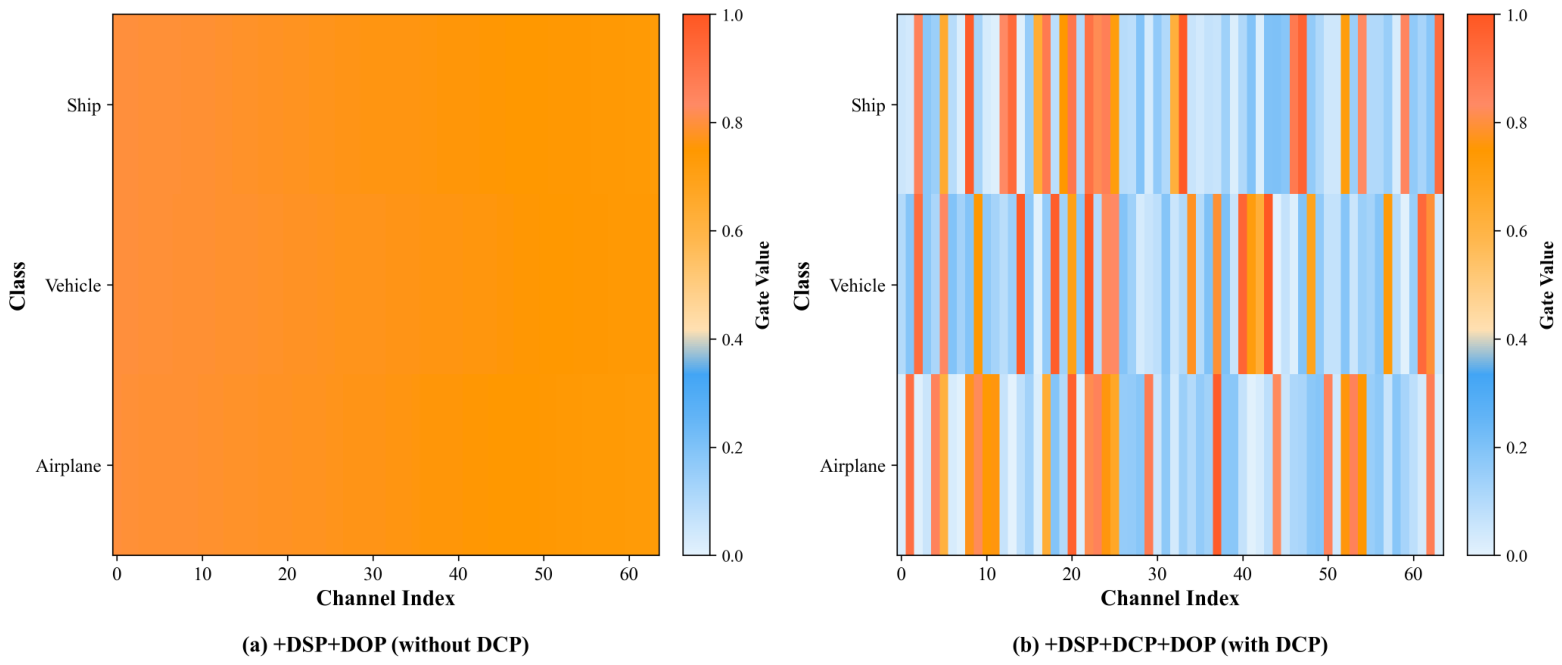
(2) DCP channel-gate visualization.
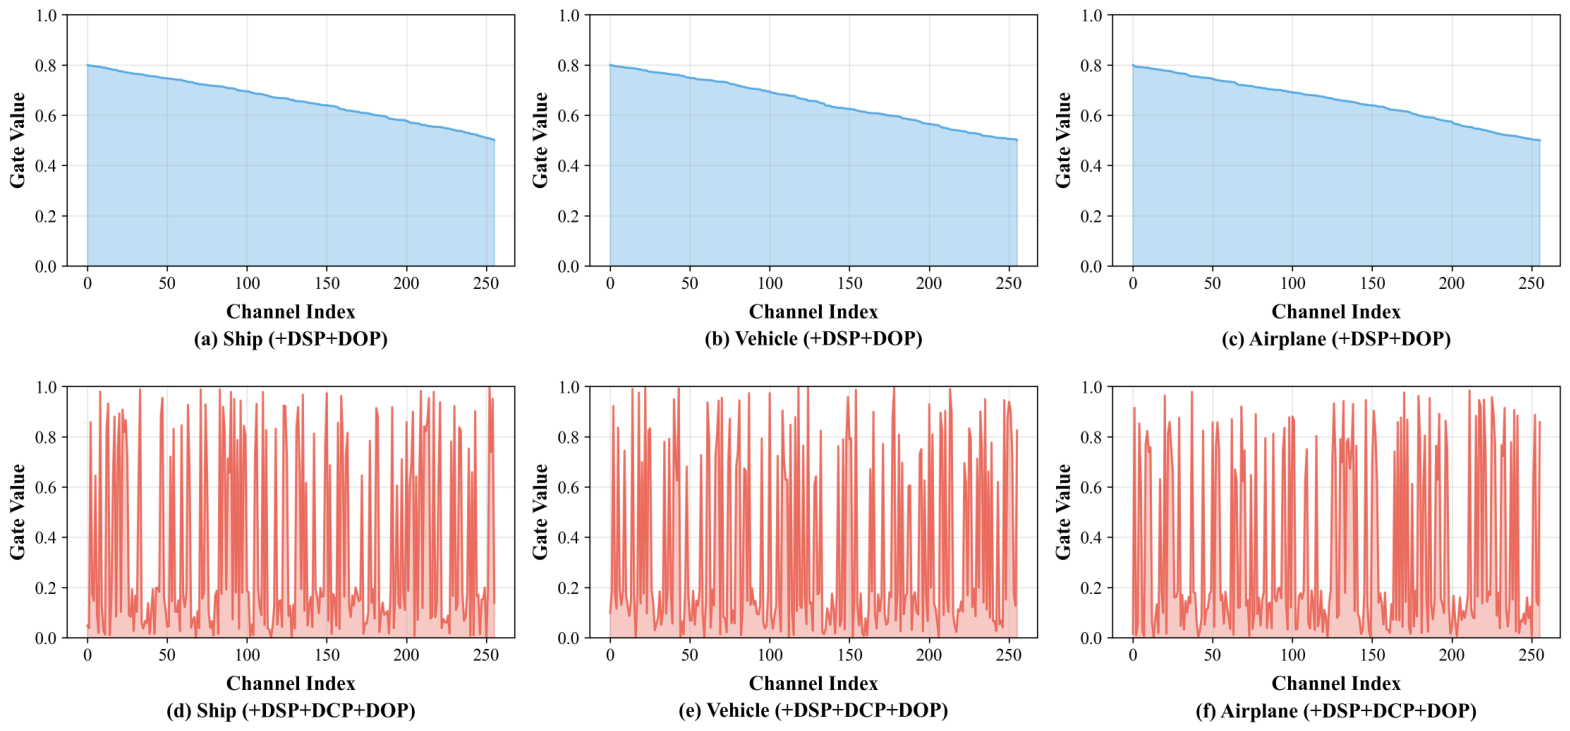
Figure 11 and
Figure 12 visualize the channel gate vector
g from DCP across the three super-categories. We compare the + DSP + DOP setting without DCP and the Full Model with DCP. Without DCP, the channel activation patterns are relatively smooth and similar across categories, suggesting that the RoI features still contain redundant or background-sensitive responses. After DCP is introduced, the channel gates become more structured and category-dependent. For instance, vehicle RoIs activate channels related to compact shape and edge patterns, ship RoIs emphasize elongated hull-like structures, and airplane RoIs show stronger responses on channels associated with wing-fuselage layouts.
This category-dependent gating behavior is consistent with the design purpose of DCP. By selectively activating discriminative channels and suppressing background-sensitive ones, DCP enhances the instance-specific discriminability of RoI features. This is especially useful in crowded scenes, where neighboring objects and structured background textures can easily contaminate feature responses. The more structured channel gates therefore provide visual evidence for the improvement on and support the claim that DCP helps reduce fine-grained confusion under cluttered conditions.
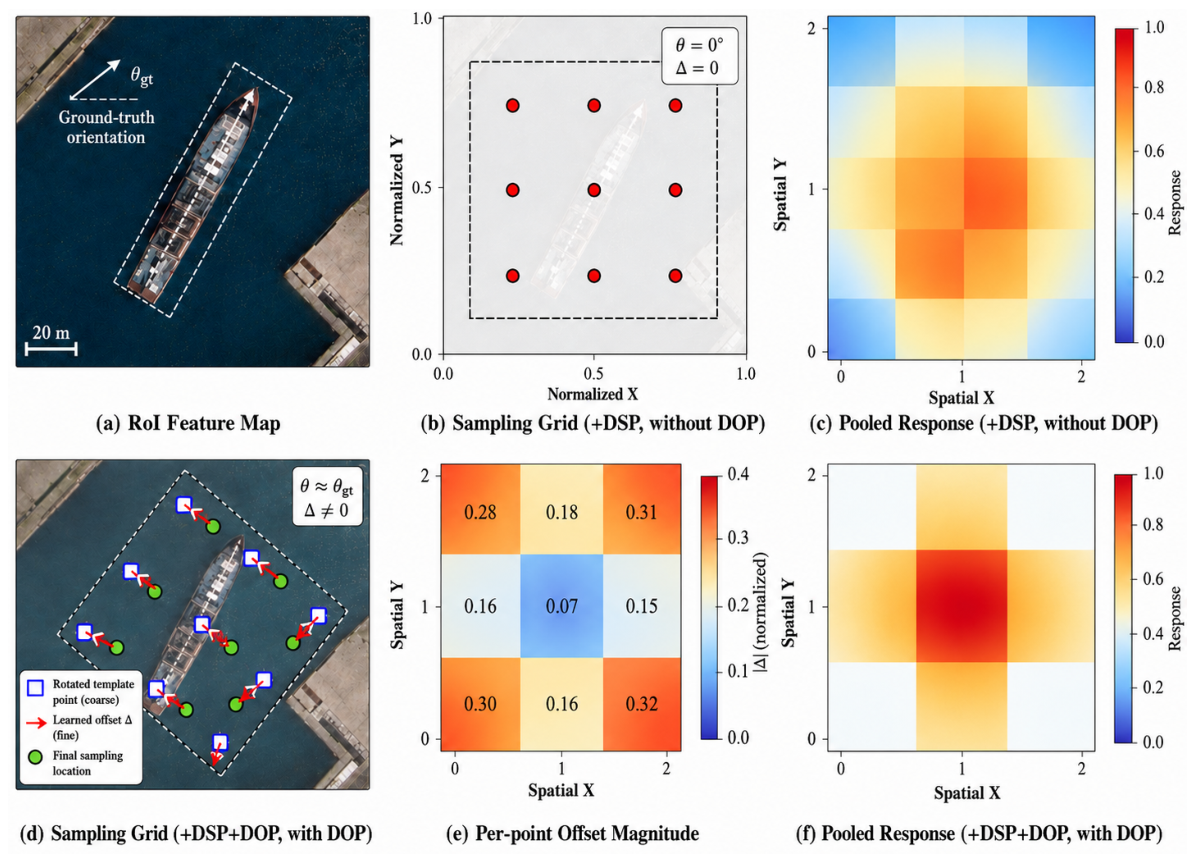
(3) DOP sampling-alignment visualization.
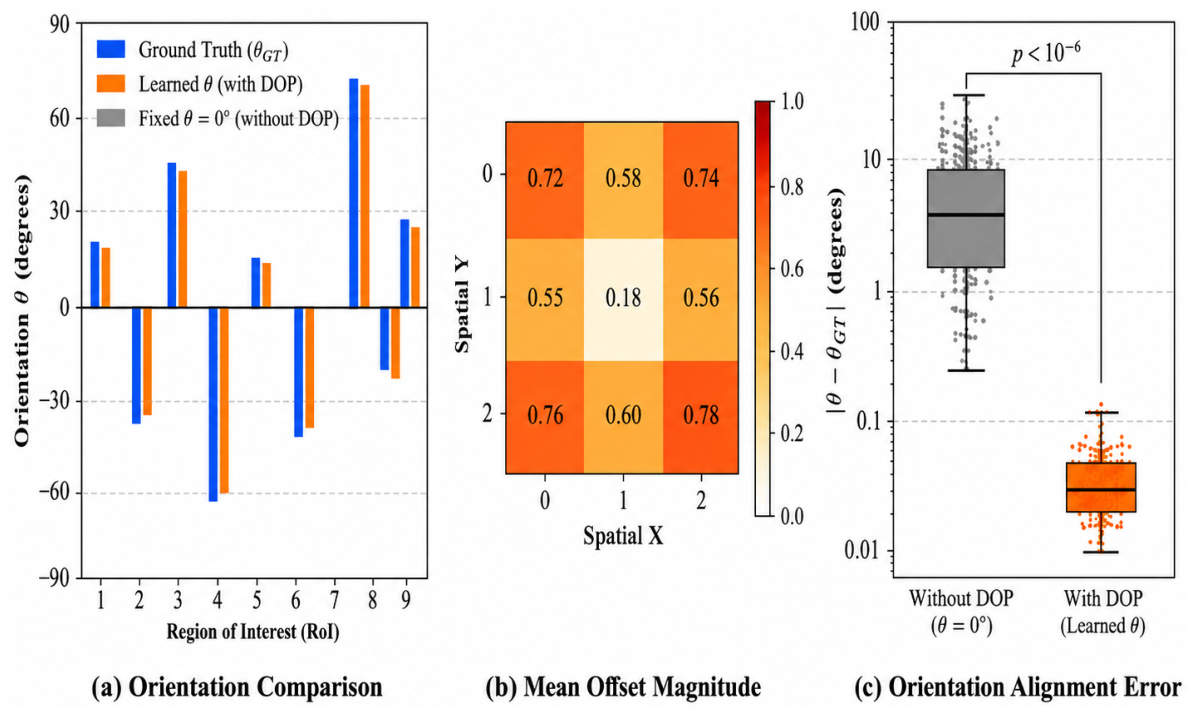
Figure 13 and
Figure 14 provide a comprehensive visualization and statistical analysis of the learned rotation and offsets in DOP. We analyze both the sampling behavior and the corresponding response changes under + DSP (without DOP) and + DSP + DOP settings.
Figure 13 illustrates the sampling grids and feature responses. Without DOP, the sampling pattern remains axis-aligned and is unable to adapt to the orientation of rotated objects, which leads to misaligned feature extraction and noticeable background leakage in the response maps. After introducing DOP, the sampling grid is first rotated according to the predicted instance orientation, providing a coarse pose alignment with the object structure. On top of this, the learned offsets further refine sampling locations toward informative regions such as object boundaries and part structures. The per-point offset magnitude shows a clear spatial pattern, where boundary points receive larger corrections while central points remain relatively stable. This indicates that offsets are used for local geometric refinement rather than global rotation estimation. As a result, the response maps become more concentrated on the target region with significantly reduced background activation.
Figure 14 further provides statistical evidence of the learned rotation and offsets. The predicted orientations closely match ground-truth angles, while the baseline without DOP is fixed at zero rotation, confirming that DOP successfully learns instance-specific pose alignment. In addition, the offset magnitude distribution shows a consistent pattern across RoIs, with larger values near boundary sampling locations and smaller values in central regions. The orientation error distribution further demonstrates that DOP significantly reduces angular mismatch compared to the baseline. These results jointly validate that DOP decomposes the sampling process into two complementary components: global rotation alignment and local offset refinement. This decomposition explains the improved performance on small and crowded objects, where both accurate pose alignment and local structural adaptation are required.
4.5. Class-Wise Performance Under Imbalanced Distribution
To further evaluate the effectiveness of DyPerceiver-Det under class-imbalanced scenarios, we report class-wise Average Precision (AP) results on both FAIR1M and MAR20 datasets. This evaluation provides a more fine-grained perspective on model behavior across heterogeneous and fine-grained categories.
As shown in
Table 10, DyPerceiver-Det consistently outperforms the baseline across all categories in both datasets. On FAIR1M, significant improvements are observed in both dominant categories (e.g., aircraft and ships) and relatively underrepresented categories (e.g., small vehicles and complex structures). In particular, the average performance on rare classes increases from 29.8% to 34.2%, demonstrating stronger robustness under long-tailed distributions.
Similarly, on MAR20, which consists of fine-grained aircraft categories, the proposed method achieves consistent gains across all subclasses. The most notable improvements are observed in visually similar categories such as F-22 and SU-35, indicating that the proposed instance-adaptive perception mechanism effectively reduces inter-class confusion in fine-grained recognition scenarios.
Overall, the results in
Table 10 demonstrate that DyPerceiver-Det improves not only overall detection performance but also class-balanced representation quality. This suggests that the instance-level dynamic perception design helps mitigate the adverse effects of class imbalance by enhancing feature discriminability for both frequent and rare categories.
4.6. Performance on Extreme Aspect-Ratio Objects
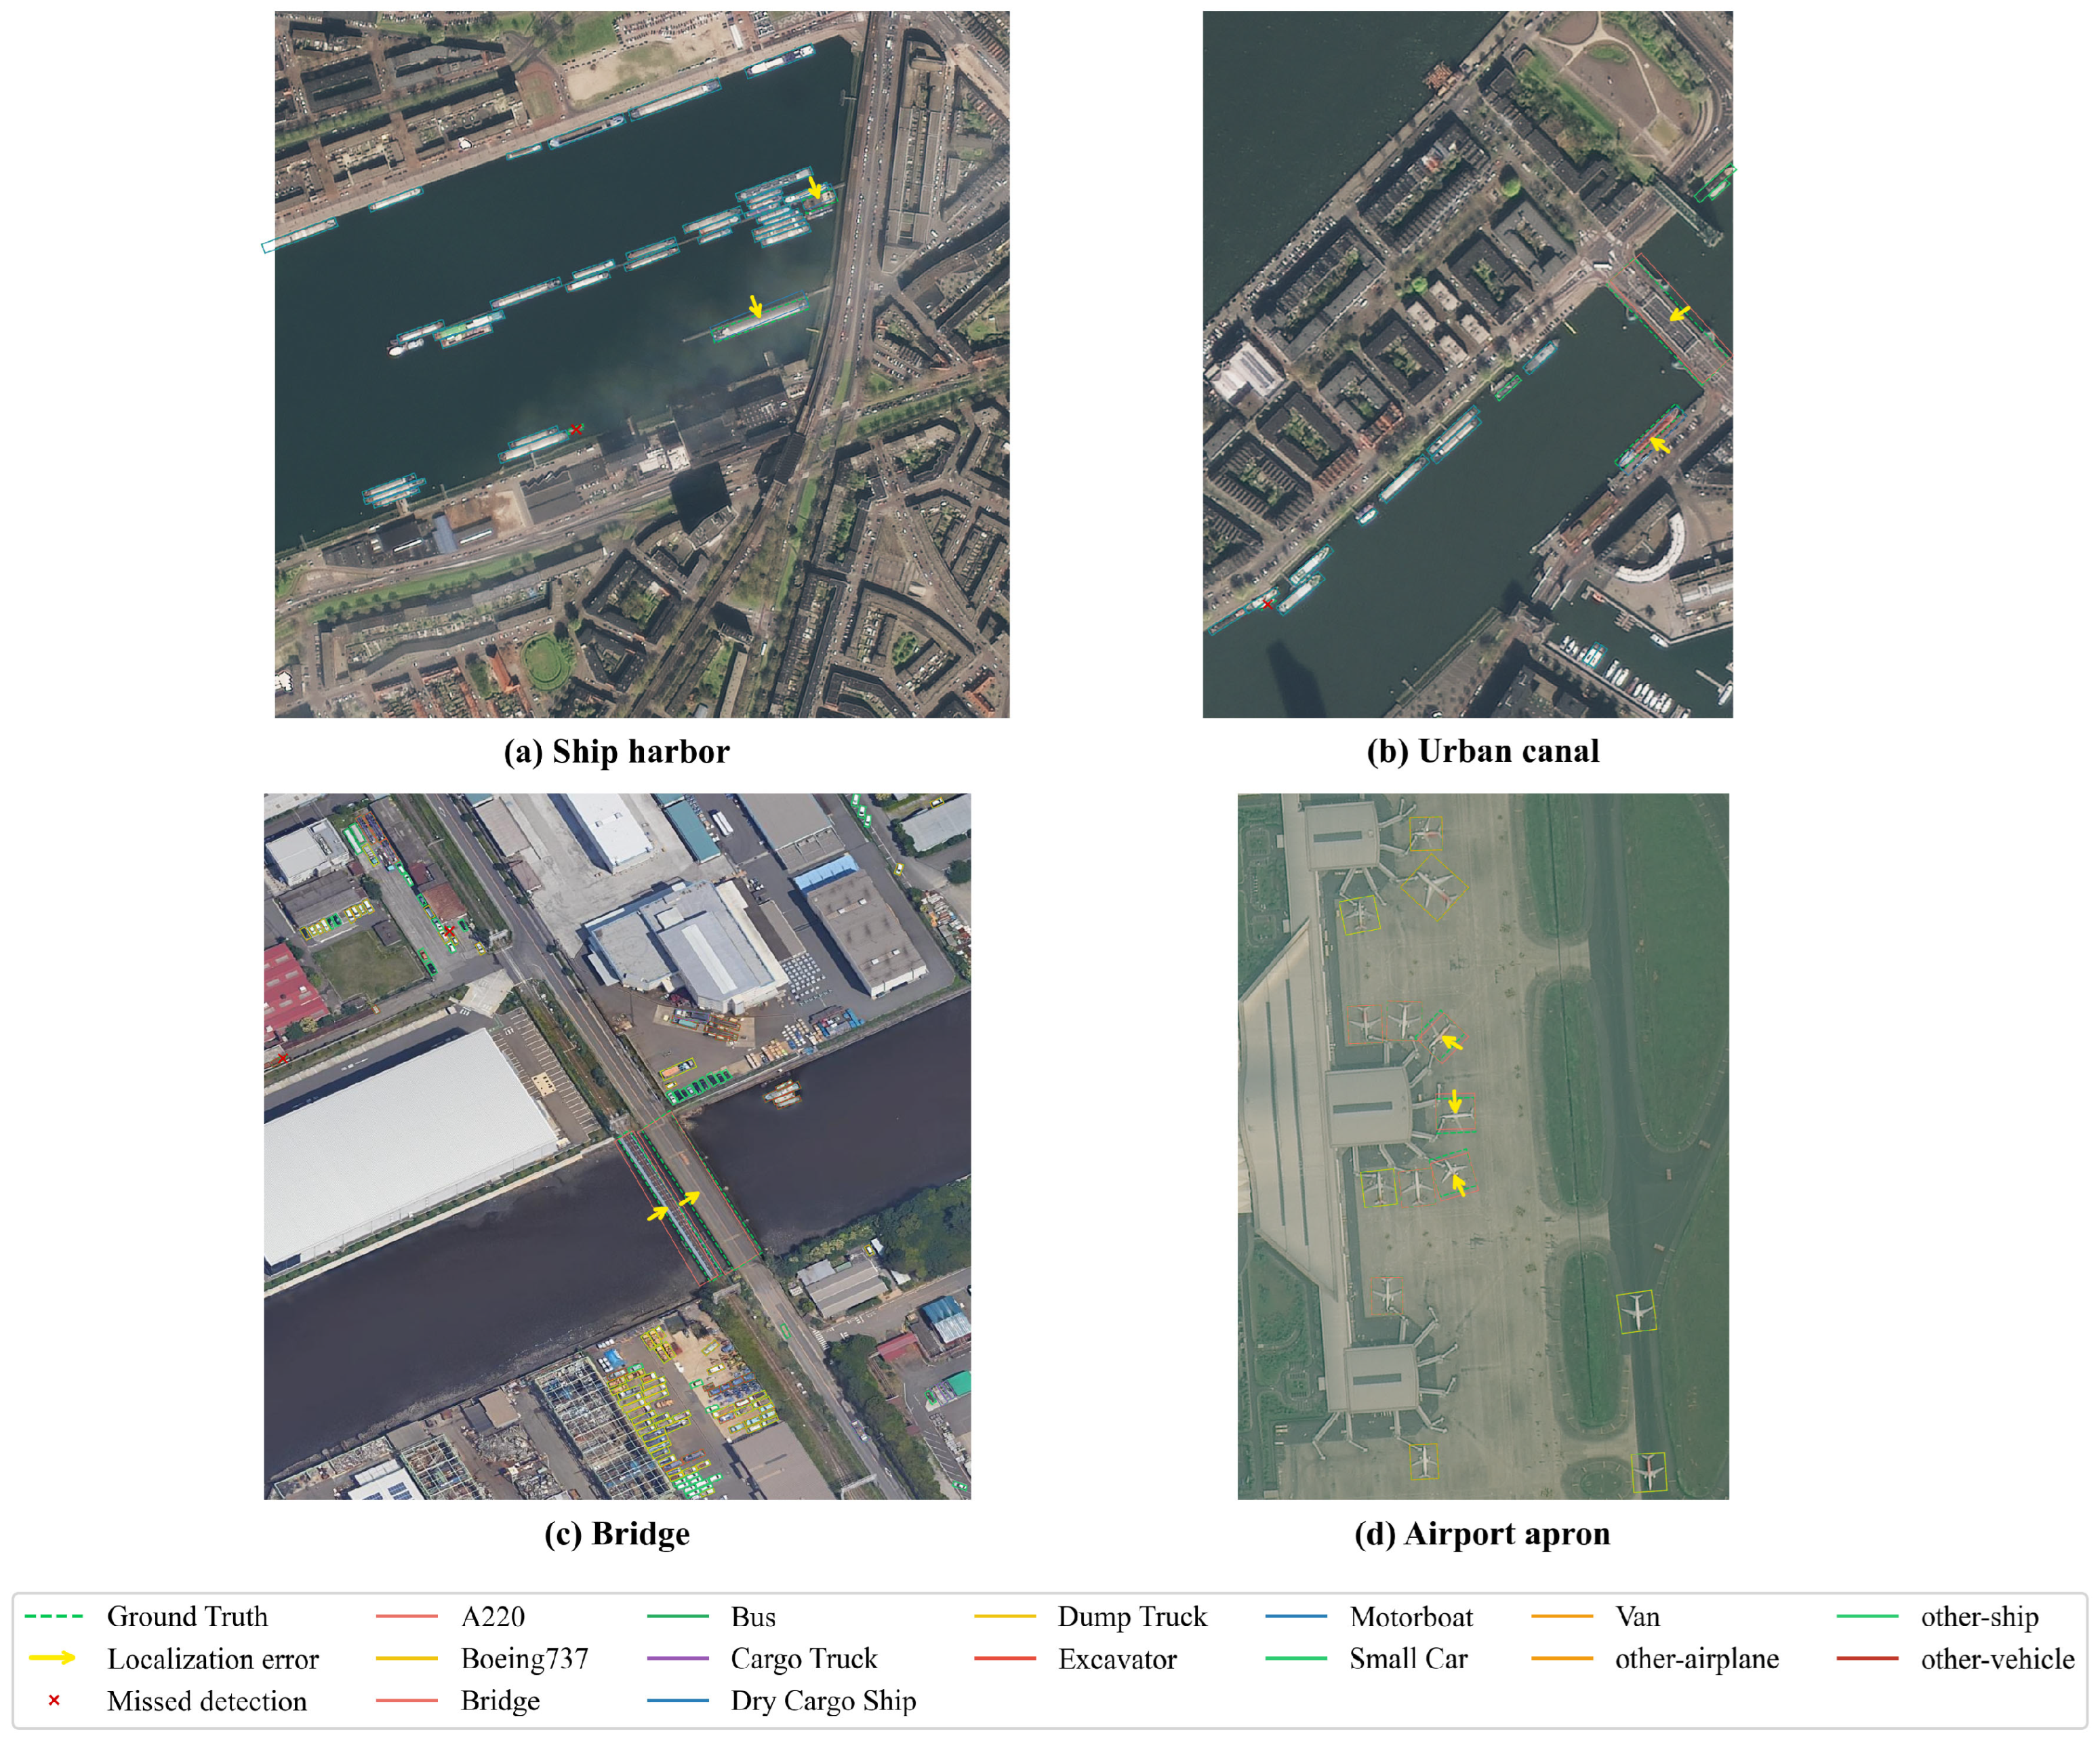
To further evaluate the robustness of DyPerceiver-Det on challenging geometric structures, we analyzed its performance on extreme aspect-ratio objects, such as ships, bridges, and aircraft, which are common in remote sensing imagery and often exhibit strong geometric elongation. These instances are particularly demanding for oriented detectors because background easily dominates along the minor axis, extremely small footprints increase miss risk, and dense layouts amplify boundary ambiguity.
Figure 15 provides a dedicated qualitative study on this setting.
Figure 15 focuses on four representative FAIR1M patches dominated by extreme-aspect-ratio targets: (a) ship harbor, (b) urban canal, (c) bridge waterfront, and (d) airport apron. In each panel, all annotated instances are marked with ground-truth oriented boxes (green dashed contours), while DyPerceiver-Det predictions are overlaid as solid, class-colored boxes in the same view. Missed detections and localization errors are explicitly highlighted with red “×” and yellow arrows, respectively, so that the dominant failure modes can be identified at a glance.
Overall, DyPerceiver-Det shows strong alignment with ground truth along the major axis of elongated structures. In the harbor and canal scenes (a–b), most ships are correctly detected, and the class-colored predictions closely follow the orientation and extent of the corresponding ground-truth boxes. In the bridge waterfront scene (c), the method localizes the long bridge structure reliably, but a few extremely compact instances—mainly small vehicles or vessels with very limited minor-axis extent—are missed. In the airport apron scene (d), all visible aircraft are detected; the remaining errors appear as minor boundary offsets in crowded gate regions, where neighboring aircraft share similar orientations and are tightly packed.
These visual results indicate that DyPerceiver-Det handles extreme-aspect-ratio objects well, especially in preserving the major-axis orientation of ships, bridges, and aircraft. The remaining errors are concentrated in three typical cases: missed extremely small instances, slight localization bias on long objects, and boundary offsets in dense layouts of similarly oriented targets. This failure-case visualization complements the overall detection comparison by making both the strengths and the residual limitations of DyPerceiver-Det on geometrically challenging objects directly observable.
4.7. Efficiency and Overhead
4.7.1. Speed, Parameters, FLOPs, and Memory
We evaluated the computational overhead introduced by DyPerceiver-Det in terms of inference speed (FPS/latency), parameter count, FLOPs, and peak GPU memory. All measurements are conducted with the same backbone (ResNet-50 + FPN), the same input resolution (), and the same batch setting as the main experiments. We report both a training-time view (peak memory) and an inference-time view (latency/FPS), since remote-sensing deployment often requires a strict compute budget.
Table 11 summarizes the efficiency comparison against representative baselines. Although DSP aggregates RoI features from all pyramid levels, this does not introduce additional memory overhead because the multi-level RoI features are not stored simultaneously. Instead, for each pyramid level, RoI features are extracted sequentially and immediately compressed into compact descriptors via global average pooling before fusion. After compression, the intermediate high-resolution RoI feature maps are released, avoiding any accumulation of L full-resolution tensors in GPU memory. Therefore, the memory complexity of DSP remains comparable to single-level RoI extraction, since only low-dimensional embeddings are retained during the fusion process rather than multi-scale feature maps. Compared with a strong two-stage baseline (RoI Transformer/Oriented R-CNN), DyPerceiver-Det introduces a small parameter increase, because DSP/DCP/DOP are implemented as lightweight routing, sampling, and gating modules attached to RoI features. The compute overhead mainly comes from DOP, which performs orientation-aligned sampling on RoI features, while DSP and DCP incur negligible overhead.
We further decompose the overhead of each module on top of the same baseline to clarify where the extra compute comes from. DSP adds a small weighted fusion over pyramid features and does not change the RoI feature resolution, resulting in marginal parameter/FLOPs increase. DCP is an SE style gate on RoI features and contributes minimal overhead. In contrast, DOP introduces additional sampling operations and therefore dominates the latency increase. This decomposition is consistent with the ablation hyper-parameter study (
Section 4.4), where increasing
dop_k or
out_size yields slightly better crowded performance but also increases computation costs.
4.7.2. Accuracy–Efficiency Trade-Off
To evaluate whether the overhead is justified, we compared accuracy gains against the incremental compute cost. DyPerceiver-Det achieves a clear improvement over strong two-stage baselines while maintaining a similar computational profile. For example, relative to RoI Transformer, DyPerceiver-Det improves FAIR1M mAP by (36.8 vs. 34.7), while increasing latency by a small margin (98 ms vs. 92 ms). The gains are even more favorable in the most challenging regimes: the improvement on is larger than the overall mAP gain, which indicates that the additional compute is primarily translated into better robustness rather than marginal refinements on easy instances.
Overall, the results suggest that DyPerceiver-Det provides a practical accuracy–efficiency trade-off: it achieves consistent gains on fine-grained remote-sensing detection (especially small/crowded subsets) with only a modest increase in parameters, FLOPs, and runtime. For deployment, the main remaining bottleneck is the grid_sample-based rotated RoI operation in DOP, which can be replaced with a CUDA-optimized operator to further reduce latency without changing the model design.
4.7.3. Cross-Architecture Plug-And-Play Evaluation
To further evaluate the generalization capability of the proposed DyPerceiver-Det, we conducted cross-architecture experiments across one-stage, two-stage, and transformer-based oriented detectors. The results are reported in
Table 12.
For one-stage detectors (RetinaNet-O), incorporating DSP and DCP consistently improves performance, increasing mAP from 30.2 to 31.8. The gains are particularly noticeable on and , indicating that adaptive scale selection and channel-wise modulation help alleviate feature ambiguity in dense and small-object scenarios.
For two-stage detectors (Oriented R-CNN), the full DSP + DCP + DOP configuration achieves the best performance, improving mAP from 33.8 to 36.8. In particular, DOP contributes significant gains on , demonstrating the importance of orientation-aligned sampling in reducing feature misalignment for densely arranged objects.
For transformer-based detectors (Deformable DETR-O), adding DSP and DCP improves mAP from 34.8 to 36.2, with consistent gains across all evaluation metrics, especially and . This indicates that instance-aware scale and channel modulation are also effective in attention-based detection frameworks.
Overall, as shown in
Table 12, the proposed modules consistently improve performance across all architectures, confirming that DyPerceiver-Det is not restricted to RoI-based detectors. Instead, DSP, DCP, and DOP provide complementary improvements at different stages of feature representation, demonstrating strong plug-and-play generalization capability.
5. Discussion
5.1. Dynamic Perception for Fine-Grained Remote Sensing
Fine-grained remote-sensing OBB detection differs from generic object detection in that the dominant errors are rarely caused by coarse category ambiguity; instead, they are driven by subtle intra-family differences under severe imaging constraints. Across FAIR1M and MAR20, three factors repeatedly amplify fine-grained confusion: (i) extreme scale variation, where many instances fall into the small bucket and lose discriminative part evidence; (ii) arbitrary orientations and elongated shapes, where misaligned feature extraction degrades both localization and classification; and (iii) dense layouts with structured clutter, where neighboring instances and background textures interfere with RoI features. A fixed perception strategy (fixed FPN assignment, fixed RoI sampling, and fixed channel utilization) is brittle under these conditions, because the “best” feature resolution, sampling geometry, and feature subspace vary significantly across instances even within the same scene. The core advantage of dynamic perception is to make these choices instance-conditioned: the model adapts its scale aggregation, orientation-aligned sampling, and channel emphasis to the content and difficulty of each RoI, which is crucial for resolving fine-grained ambiguity when pixels and context are limited.
5.2. Contributions of Each Module Across Scenarios
The ablation results suggest a clear division of labor among DSP, DCP, and DOP, and this division aligns with the bucketed analyses. DSP mainly addresses scale-induced ambiguity by soft routing across pyramid levels, which improves on both datasets and reduces errors that originate from under-resolved fine details. DCP mainly addresses clutter-induced ambiguity by suppressing background-dominant channels in an instance-wise manner, which further improves and reduces false positives and sibling-class flips in structured backgrounds. The effectiveness of DSP and DCP lies in shifting RoI feature extraction from static aggregation to instance-adaptive perception. DSP addresses scale ambiguity by learning soft multi-level feature fusion, while DCP reduces feature redundancy by performing instance-wise channel modulation. This design fundamentally differs from conventional FPN-based pipelines and global attention mechanisms, as it introduces dynamic decision-making at the instance level rather than image or feature-map level. DOP mainly addresses geometry-induced ambiguity by aligning sampling to the estimated instance orientation, which stabilizes features for elongated objects and provides larger gains in crowded scenes where background leakage and neighbor interference are prominent. Importantly, these modules are complementary: DSP improves the input quality for the RoI head, DCP improves the discriminative subspace for fine-grained classification, and DOP improves geometric alignment during feature extraction, forming an instance-level strategy loop that is difficult to replicate by simply stacking stronger heads.
5.3. Limitations and Future Directions
While DyPerceiver-Det improves fine-grained OBB detection consistently, several limitations remain. First, the current DOP implementation relies on a grid_sample-based rotated RoI operation, which is flexible but not optimal for runtime; a CUDA-optimized operator would substantially reduce latency and unlock higher-resolution RoI features for deployment. Second, DOP depends on the quality and stability of the orientation estimate from proposals or intermediate predictions; when angles are ambiguous (near-square objects) or truncated (patch boundaries), the aligned sampling grid may drift, and performance can degrade. A promising direction is to incorporate an angle-confidence mechanism and fall back to a hybrid sampling strategy when orientation is uncertain. Third, fine-grained discrimination is fundamentally limited by weak supervision: when targets are extremely small, the available pixels may be insufficient to recover part cues needed to distinguish sibling classes (e.g., similar airliner families or truck/ship variants). Future work may incorporate part-level weak supervision or self-supervised local alignment objectives to enhance fine-grained representation learning without requiring dense part annotations. Finally, the crowded regime remains challenging due to NMS-related suppression and heavy overlap; integrating density-adaptive post-processing is orthogonal to our method and may further improve recall in ultra-crowded scenes.
6. Conclusions
We presented DyPerceiver-Det, a practical fine-grained oriented object detector for remote sensing that performs instance-wise dynamic perception along three axes: DSP for adaptive multi-level feature selection, DCP for suppressing clutter-dominant responses, and DOP for orientation-aligned RoI feature extraction. This instance-conditioned strategy forms a closed loop over scale, geometry, and appearance, which is particularly important for fine-grained recognition under extreme scale variation, arbitrary rotations, and dense layouts. Experiments on FAIR1M and MAR20 under a unified evaluation protocol show consistent improvements in OBB mAP, with more pronounced gains on challenging subsets such as small objects and crowded scenes. Beyond overall accuracy, we provided fine-grained confusion analysis and qualitative visualizations to interpret where the gains come from, and ablation studies to quantify the contribution of each module with modest computational overhead. Despite these improvements, limitations remain in runtime efficiency for grid_sample-based rotated RoI operations, sensitivity to orientation confidence for ambiguous instances, and the inherent difficulty of extremely small targets with weak part evidence. We believe that optimizing the rotated RoI operator, integrating confidence-aware alignment, and introducing part-aware weak/self supervision are promising directions to further advance fine-grained remote-sensing OBB detection.