Article

Structure-Confidence Guided Phase Congruency and Cascade Matching for Registration of Optical and SAR Images

1
National Key Laboratory of Radar Signal Processing, Xidian University, Xi’an 710071, China
2
Hangzhou Institute of Technology, Xidian University, Hangzhou 311231, China
*
Author to whom correspondence should be addressed.
Remote Sens. 2026, 18(14), 2322; https://doi.org/10.3390/rs18142322
Submission received: 26 May 2026 / Revised: 1 July 2026 / Accepted: 9 July 2026 / Published: 10 July 2026

Highlights

What are the main findings?
  • A high-precision optical-SAR image registration framework that collaboratively enhances feature detection and matching is proposed. By jointly optimizing structure-confidence-weighted PC and distance-direction dual-constraint matching, the framework achieves significant performance.
  • The RNW-PC method integrates RTV with NSCT to suppress speckle-induced pseudo-structures and enhance cross-modal common features, while the WSC method employs a coarse-to-fine window scaling strategy with cosine directional consistency to substantially increase the number of correct matches.
What are the implications of the main findings?
  • The proposed detection-matching collaborative enhancement strategy provides an effective solution to the challenge of heterogeneous image matching caused by cross-modal noise and texture similarity.
  • By acquiring high-precision cross-modal correspondences without ground control points, this method offers reliable technical support for multi-source remote sensing tasks such as uncontrolled geolocation.

Abstract

Optical and synthetic aperture radar (SAR) image registration (OSIR) based on structural feature points is essential for all-weather and all-day multi-source data alignment. However, such methods are often plagued by insufficient correct correspondences caused by speckle noise and textural similarity, by which OSIR accuracy is limited. Therefore, a high-precision framework combining structure-confidence-weighted phase congruency (PC) with window-scaled cascaded (WSC) matching is proposed in the paper, through which accuracy is enhanced via the synergistic reinforcement of feature detection and matching. In feature detection, a weighting factor based on relative total variation and nonsubsampled contourlet transform is designed for PC calculation (i.e., RNW-PC). By suppressing noise-induced pseudo-structures and selectively enhancing cross-modal consistent features, the repeatability of keypoints is significantly improved. In feature matching, a coarse-to-fine WSC approach is proposed. A scaling window and cosine similarity are introduced, by which a refined directional consistency screening of candidate points within the neighborhood is performed based on the spatial constraints established during the coarse matching phase. Omissions in correct correspondences are effectively reduced through dual constraints of distance and direction. On 60 image pairs, the proposed method outperforms existing point-based algorithms, with NCM increasing by at least 2.43-fold and accuracy improving by over 19.85%.

1. Introduction

Optical and synthetic aperture radar (SAR) image registration (OSIR) is the process of precisely geometrically aligning images captured by two different types of sensors of the same scene [1]. As two typical categories of heterogeneous images, the combination is recognized to be of significant value for practical applications. Specifically, optical images are characterized by rich spectral information and clear textural details, which intuitively reflect the semantic information of ground objects. However, their acquisition is reliant on illumination conditions and is easily obscured by clouds, rain, and dust. In contrast, SAR images are acquired through active microwave imaging, by which all-day and all-weather operational capabilities are offered. Clouds, fog, and other obstructions can be effectively penetrated by SAR, but the images are difficult to interpret. The inherent limitations of a single sensor can be overcome by the strong complementarity of the two in terms of application capabilities [2], and high-precision image registration is thus established as a key prerequisite for unlocking the potential of their synergistic interpretation. For example, in land cover classification tasks, the limitations of single-modal imagery in terms of spectral confusion or textural noise can be effectively mitigated by OSIR, with a significant improvement in the classification reliability of key land features such as farmland and water bodies [3]. In disaster emergency response, detailed land cover and infrastructure information is provided by pre-event optical images, while post-event SAR images penetrate clouds and rain to acquire affected area imagery in a timely manner. The scope and degree of the disaster damage can be precisely assessed by the results obtained from their registration [4]. Therefore, OSIR is crucial for improving the overall utilization of multi-sensor data in complex environments and has been established as an indispensable research direction.
In existing research, image registration methods based on point features typically establish correspondences by extracting prominent keypoints (such as corners, strong points, or edge intersections) within images, constructing local descriptors, and performing feature matching [5]. Since descriptors are constructed based on statistical properties of local windows, such methods robust performance against geometric transformations, perspective changes, and local occlusions is exhibited by such methods [6]. Currently, it has been established as one of the mainstream approaches in both research and application within the field of image registration [7,8]. Nevertheless, owing to the differing imaging mechanisms of optical and SAR sensors, significant distinctions exist between the two in terms of radiation characteristics and noise types [8,9], which makes stable detection and successful matching of corresponding feature points in cross-modal scenarios considerably challenging. In particular, the repeatability of feature points (i.e., the ability to stably detect the same physical point in two images) and the number of correct matches are significantly constrained under the influence of nonlinear radiation distortion (NRD) and SAR multiplicative speckle noise. It has been recognized as a major bottleneck in achieving high-precision OSIR [9].
To address the aforementioned issues, more fundamental structural information within images has gradually been brought to the attention of researchers in recent years. Compared with texture features corresponding to image gradient information, structural features corresponding to phase often have stronger stability across different modal images, thereby mitigating the interference caused by significant NRD [7,10]. The RIFT proposed by Li et al. [11] is one of the representative algorithms. The phase congruency (PC) measure, i.e., the degree of consistency of local phase information at different angles, was utilized to reflect the edge structural features of an image. On this basis, feature points were then detected. The RI-LPOH algorithm designed a weighted moment map for both corner and edge point detection, which was calculated based on the maximum and minimum moments of the PC [12]. Xie et al. constructed a Harris scale space for feature point detection by convolving the maximum moment (Max-M) of the PC with a log-Gabor filter (LGF) [13].
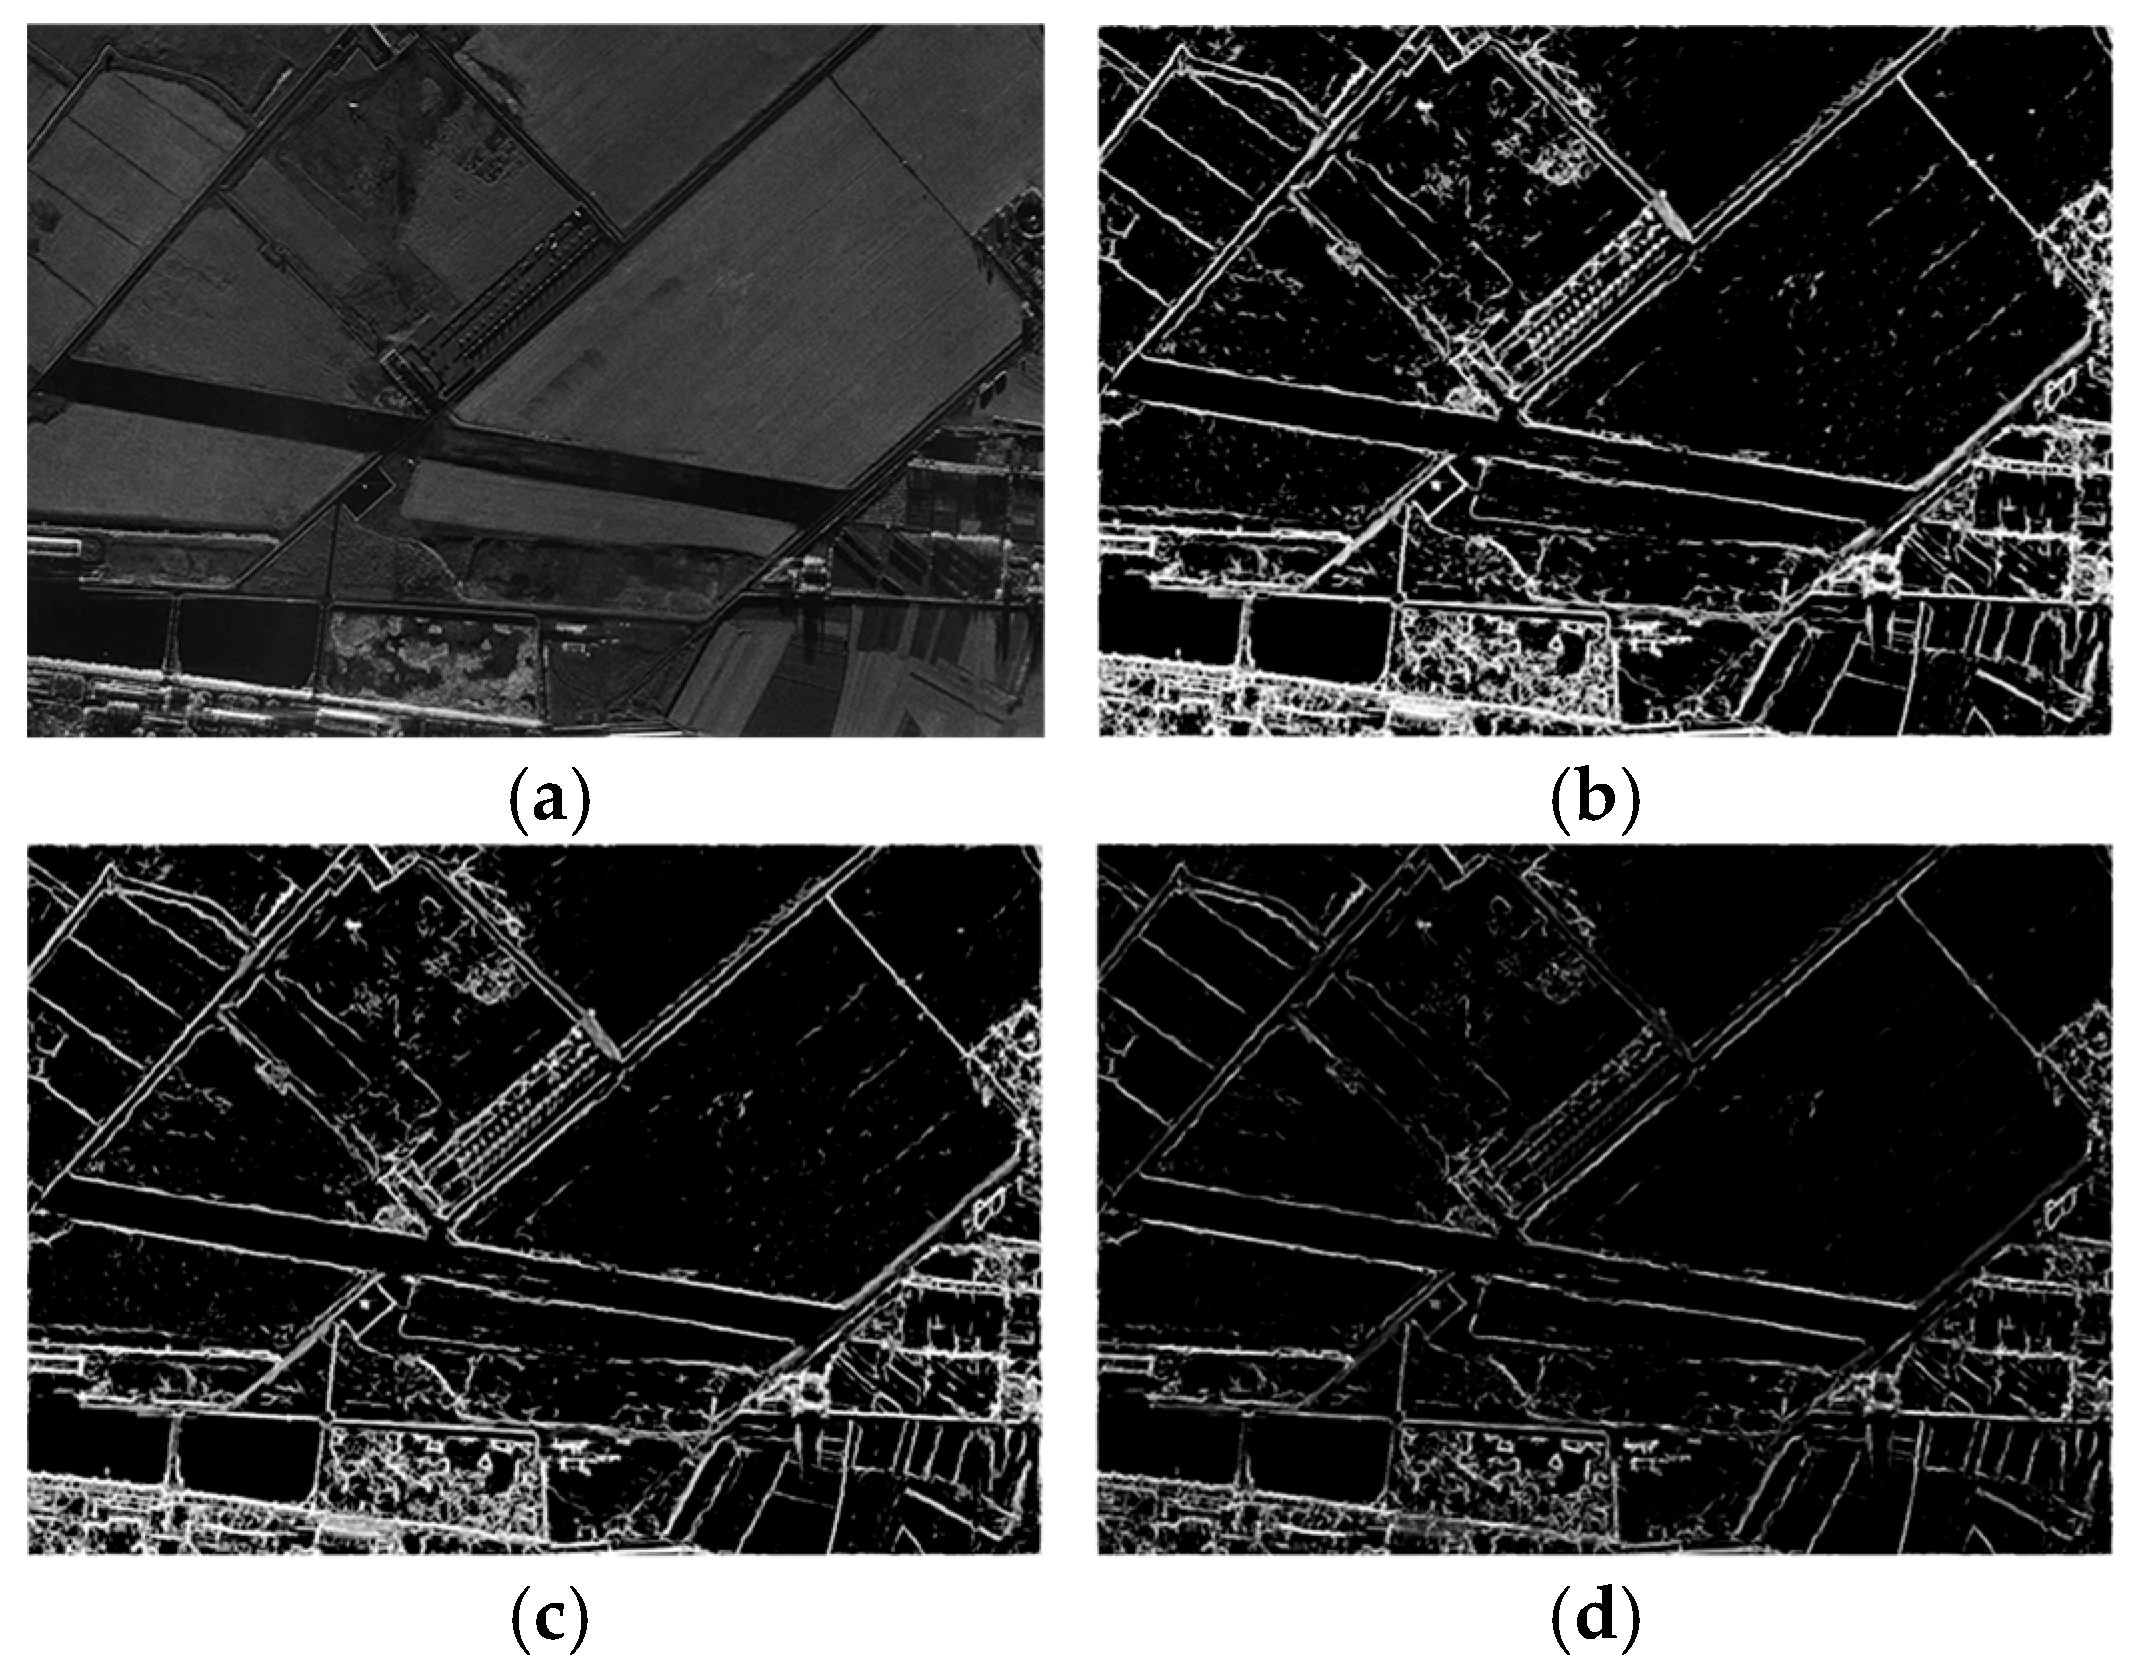
Although NRD can be effectively resisted by the aforementioned PC-based structural feature methods, the ability to distinguish the physical sources of features is lacking in the feature retention and enhancement method [14] based on the response spread value. Especially for SAR images, the front-end noise suppression is not sufficient due to the mismatch of the noise estimation model. During the subsequent feature retention and enhancement stage, modality-specific pseudo-features induced by multiplicative noise may be simultaneously amplified alongside genuine structure. On the one hand, some unreasonable feature points may be consequently detected in some homogeneous areas (e.g., lawns, sandy ground, and water surfaces) [15,16]. On the other hand, a global suppression strategy (e.g., adjusting the sigmoid cutoff factor σ ) is employed to mitigate these false features, while real edge structures with similar response intensities are also weakened, as shown in Figure 1. In fact, high-quality feature points should be theoretically distributed within stable physical structures exhibiting cross-modal consistency, such as roads, bridges, and terrain boundaries [10,17]. Relying solely on response spread values makes it hard to ensure that high-value stable structures are prioritized for enhancement during cross-modal registration. Reliable correspondences are difficult to establish for some SAR features extracted by traditional PC methods, severely limiting the repeatability of the feature points [18]. Consequently, it is necessary to investigate a weighting factor that is capable of distinguishing and selectively enhancing stable genuine structures based on the structural stability rather than response intensity.
After feature point detection is completed, one of the core tasks of image registration is shifted to feature matching. As one of the critical steps in realizing high-precision registration, as many correct correspondences as possible are aimed to be established between the detected feature points of the two image categories [19]. In existing methods, distance metrics between descriptors (such as NNDR) are commonly used in conjunction with mismatch suppression strategies such as RANSAC and FSC to filter out mismatched pairs [20,21,22]. However, due to the lack of spatial constraints, false matches are prone to being produced by NNDR with similar texture regions. To address this issue, Zhang et al. used scale constraints to obtain an initial transformation for constructing spatial constraints [19]. The feature points are then mapped to the reference image, and nearest neighbors are searched for within the local neighborhood to obtain a large number of correct matches. Nevertheless, the mapped point positions may be shifted by the estimation error of the transformation model, which may cause the geometric nearest-neighbor criterion to fail. Therefore, the feature points within the neighborhood need to be further filtered.
In recent years, deep learning techniques have been increasingly applied to OSIR tasks, which establish spatial correspondences between images through neural network learning [8]. Quan et al. proposed a self-distillation feature learning network, which enhances accuracy by jointly optimizing matching and self-distillation learning [23]. Ye et al. introduced domain adversarial wavelet learning to mitigate cross-modal differences, achieving unsupervised registration [24]. Yuan et al. achieved end-to-end registration through CNN-Transformer combined feature extraction and cascade matching strategy optimization [25].
Although good performance has been achieved by these methods, several challenges remain. On the one hand, a large amount of high-quality annotated data is heavily relied upon by supervised methods [7]. Under challenges such as variations in brightness and contrast, manual visual inspection is insufficient to ensure geometric accuracy between corresponding points, significantly limiting the performance of matching models [8]. On the other hand, although reliance on annotated data is mitigated to some extent by unsupervised methods, the performance is severely constrained by the quality of the training data [26]. Due to the speckle noise in SAR imagery, models trained on specific datasets are likely to exhibit insufficient transferability in practical engineering applications, struggling to maintain stable registration results across different datasets [27]. Hence, handcrafted OSIR methods remain an indispensable research pathway, capable of providing the data foundation for deep learning or ensuring performance for practical engineering applications.
In the paper, an OSIR algorithm based on structure-confidence-weighted PC and window-scaled cascaded (WSC) matching is proposed. The specific contributions are summarized as follows:
  • A weighted PC based on structural confidence is proposed for feature detection. Relative total variation (RTV) and nonsubsampled contourlet transform (NSCT) are combined to construct a weighting factor, which could effectively suppress pseudo-structures caused by multiplicative noise and selectively enhance cross-modal consistent structures. The repeatability of feature points is effectively improved by the novel PC (i.e., RNW-PC).
  • A WSC matching method is devised. Spatial constraints are established by the method through coarse matching with large windows. On this basis, the window size is reduced to adapt the descriptor to local structural changes, and cosine similarity is introduced to replace geometric proximity as the matching criterion, thereby filtering candidate points based on directional consistency. NCM is significantly increased through the dual safeguards of near distance and same direction.
  • For basically aligned image pairs and data containing significant rotational differences, the correct matches, registration accuracy, etc., are significantly improved compared to existing state-of-the-art algorithms, i.e., OS-SIFT [22], HAPCG [28], LNIFT [29], RIFT2 [30], and the machine learning-based WSSF [7].
The rest of the paper is organized as follows. The necessity of this work is clarified in Section 2 by establishing the OSIR workflow model and analyzing the key issues in the detection and matching stages, and the proposed RNW-PC and WSC matching methods are described in detail. Using the data of basic alignment and rotation differences, the proposed method is validated and discussed in Section 3 through feature detection experiments, registration experiments, and ablation experiments. Section 4 provides a brief discussion. At last, the paper is summarized in Section 5.

2. Materials and Methods

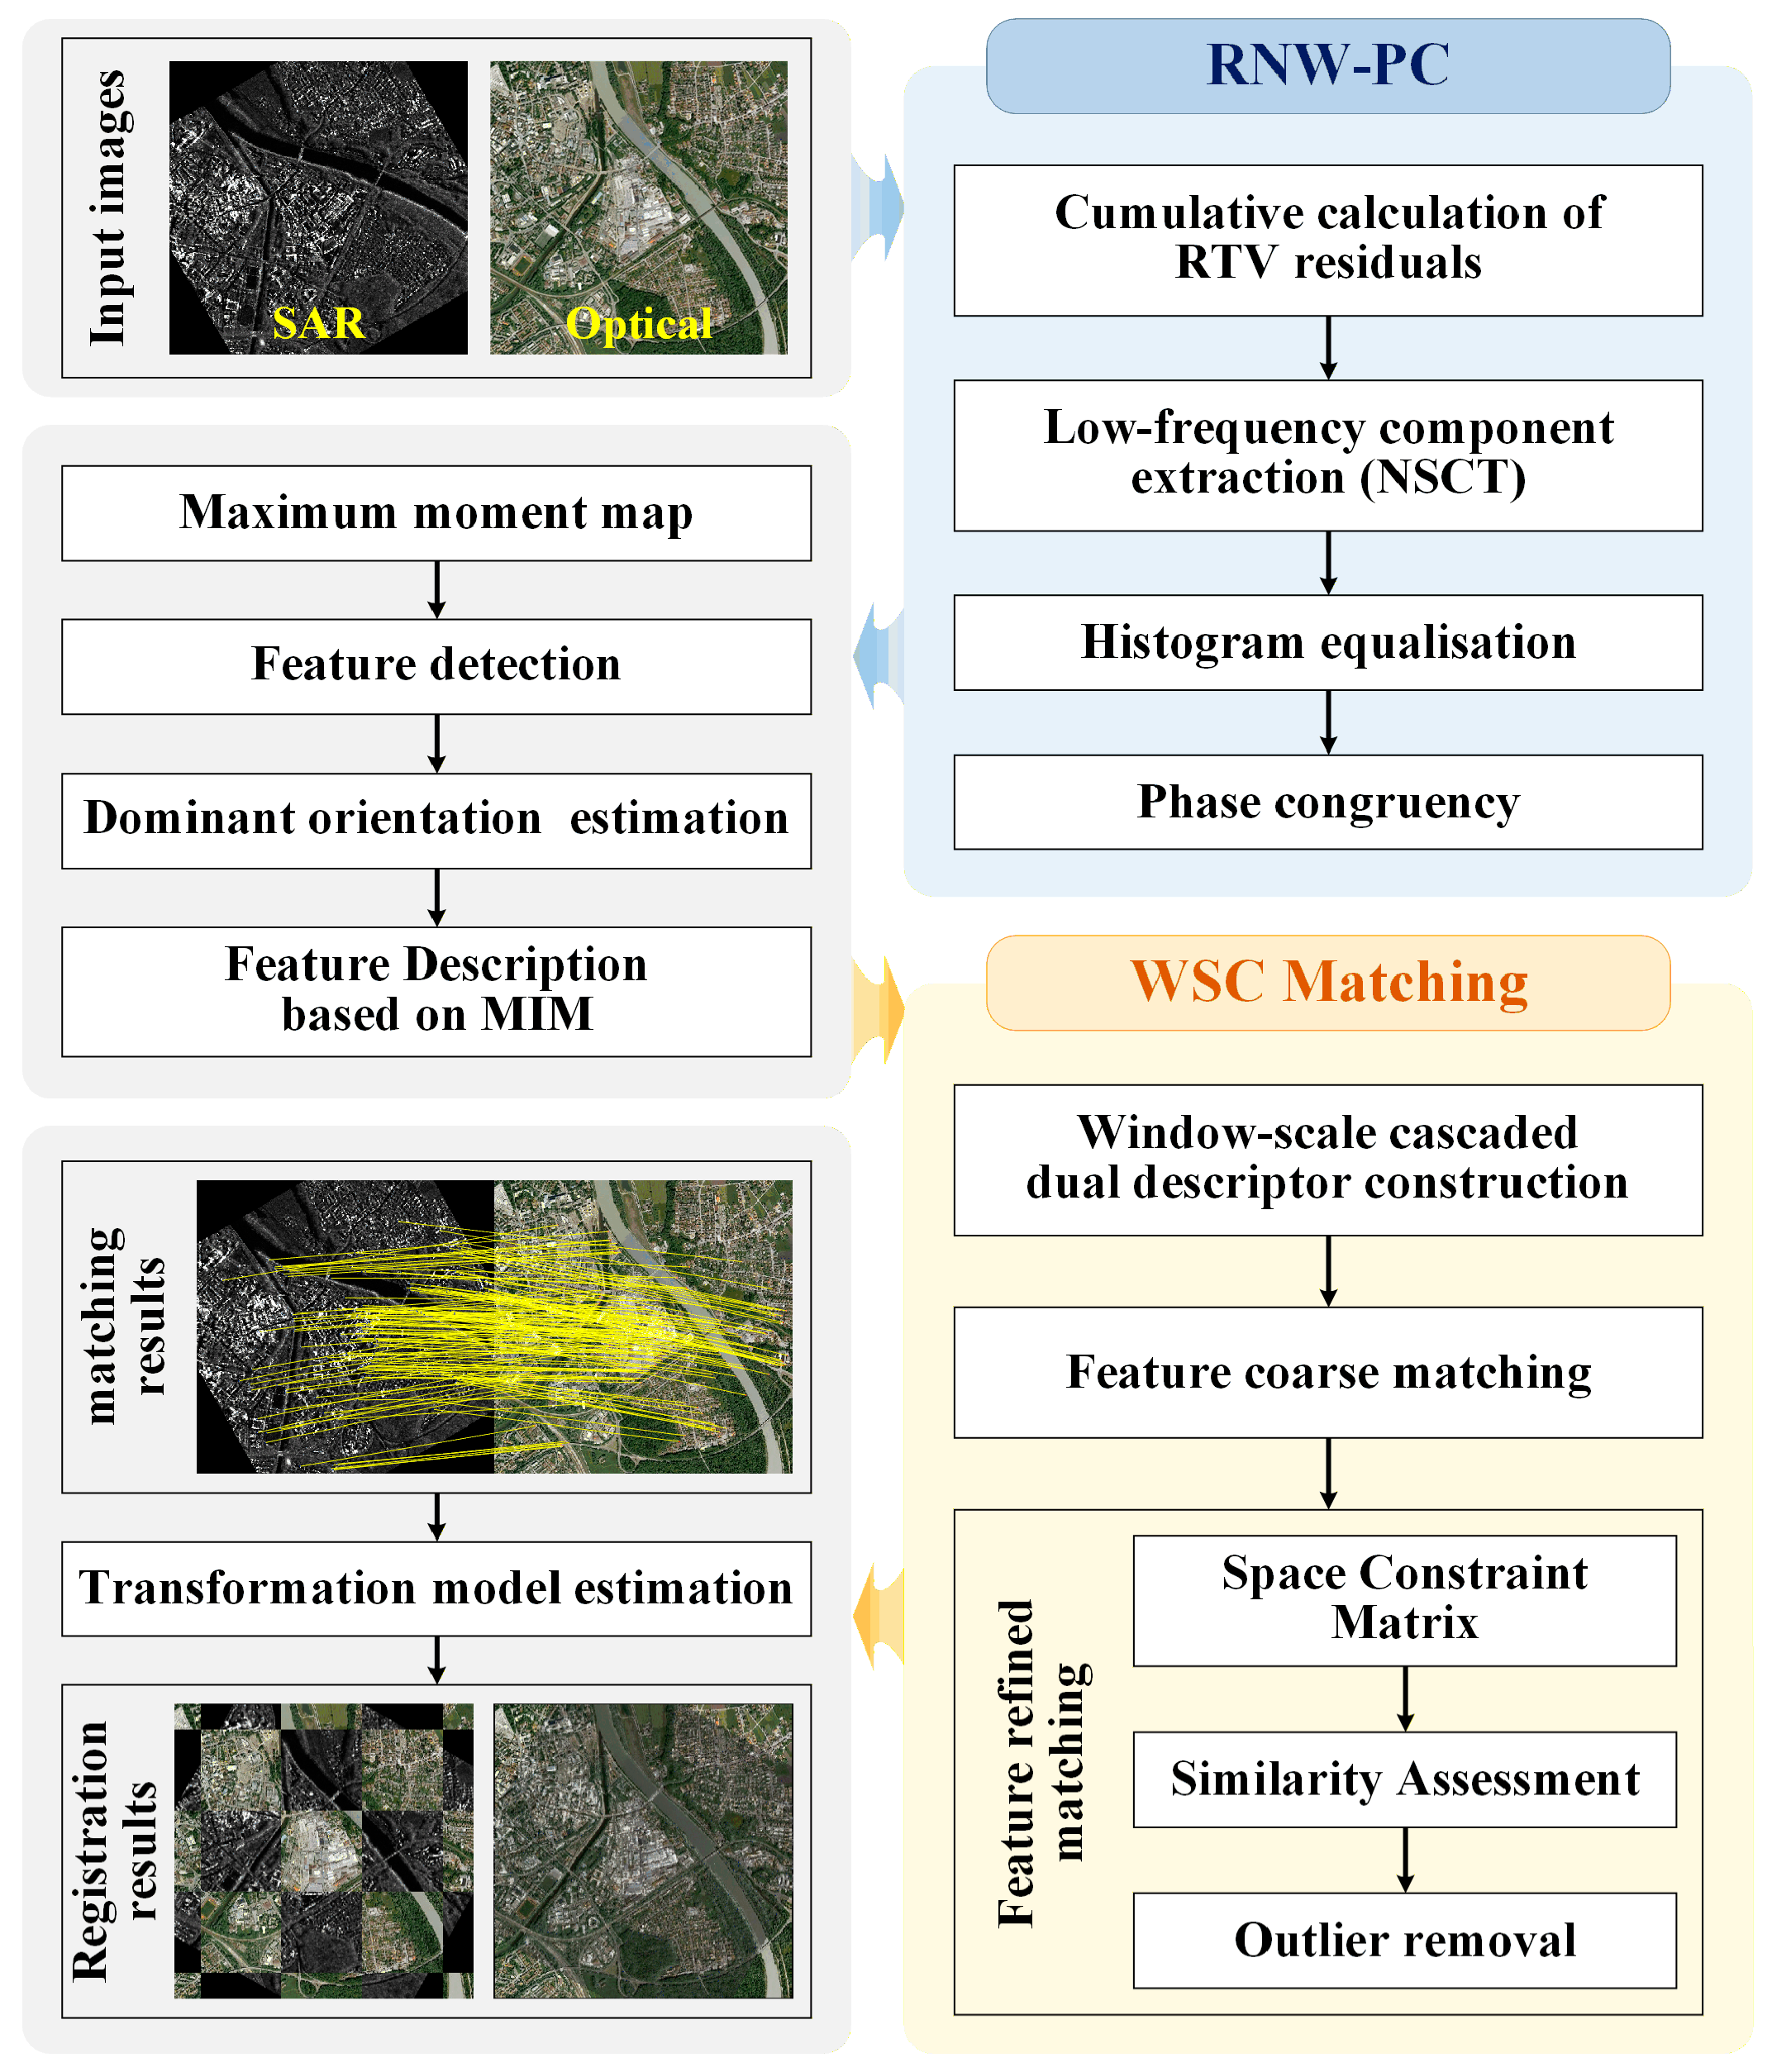
In this section, a process model for registration based on structural feature points is first established to clarify the relationships among the different stages. Subsequently, problem analyses are conducted for the two core stages of structural extraction and feature matching in OSIR, and the corresponding solutions are designed, respectively. Finally, the two modules are integrated into a unified registration workflow. The overall framework of the proposed OSIR algorithm is illustrated in Figure 2.

2.1. Model Establishment and Problem Analysis

2.1.1. Registration Process Model

Typically, OSIR based on structural feature points comprises five core stages: consistent structure extraction, feature detection, feature description, feature matching, and transformation model estimation. Given a pair of corresponding images I s a r , I o p t , the process can be modeled as follows:
I o p t = T H ( T m a t c h ( T d e s c ( T d e t ( T s t r I s a r ) ) ) )
where T s t r refers to structure extraction, which extracts cross-modal consistent structural information from images. T d e t denotes the feature point detection stage, which extracts corresponding feature points from structural maps. T d e s c represents the feature description stage, which constructs a description vector for each feature point. T m a t c h stands for the feature matching stage, which establishes correspondences between feature points. T H denotes the transformation model estimation stage, which determines the spatial transformation matrix based on the matching results.
In the process, T s t r forms the foundation of the entire process, where the quality of the output directly affects the performance of subsequent steps. If the structural maps of the two types of images exhibit insufficient consistency, the number of corresponding feature points will be reduced and the accuracy of the dominant orientation estimation will be compromised, thereby affecting the registration effect. Furthermore, even if T s t r and T d e t provide a sufficient number of corresponding feature points, the advantage gained during the detection phase fails to carry over to the transformation model estimation if these points cannot be adequately matched during the subsequent matching stage. Consequently, the performance improvements in the T s t r and T m a t c h stages are the focus of this paper, with the key issues in each stage analyzed in turn below.

2.1.2. Pseudo-Structure Problem

In the T s t r stage, PC theory is widely used to extract structural information from images [11]. The traditional two-dimensional PC (2D-PC) model is computed by convolving the image with a multi-scale and multi-directional LGF. To analyze the relationship between the PC measure and orientation changes, the PC response is independently computed for each orientation θ o by RIFT [11], as defined below:
P C o u , v = W o u , v s A s o u , v Δ Φ s o u , v T n s A s o u , v + ε
where u , v is the coordinate of a pixel point and s , o denotes the scale and orientation of the LGF. The phase deviation is obtained from Δ Φ s o u , v . A s o u , v is the amplitude obtained based on the orthogonal response of the LGF. T n is the noise level estimated based on the Rayleigh distribution, and ε is a small constant used to circumvent extreme values. operator avoids negative internal data. W o u , v is a sigmoid weighting function defined as follows [14].
W o u , v = 1 1 + e γ σ s o u , v
where s o u , v represents the filter response spread value, which is determined by the amplitude. σ is the threshold, and γ controls the slope of the function. Theoretically, a large spread value s u , v resulting from responses distributed across multiple scales should be assigned a high weight for real edges, whereas the opposite should hold for noise-induced pseudo-structures [14].
Nevertheless, different from optical images, multiplicative speckle noise is inherent in SAR images due to the coherent image formation mechanism of SAR [31]. In some homogeneous regions, local intensity mutation may be induced by the noise coupling with the background signal. When the PC model is directly applied, the LGF-based responses in the frequency domain closely resemble those of the actual structure, which may trigger accidental phase alignment. In the subsequent feature retention and enhancement process, since the traditional weighting factor depends on the response spread value, accidentally aligned pseudo-structures that exhibit a large spread are likely to be preserved and amplified, thus forming visual artifacts in homogeneous regions. In the OSIR, the discriminability of similarity metrics is weakened by these pseudo-structures, resulting in a decrease in repeatability of feature points, thus restricting the final registration accuracy [15]. Moreover, it is difficult to prioritize enhancing stable structures of high value for cross-modal registration based solely on response spread values. Consequently, in the T s t r stage, a weighting function capable of distinguishing the sources of responses is required to be designed for the PC model. By suppressing pseudo-structures in textural regions, the cross-modality consistency of the structure maps is improved.

2.1.3. Correct Correspondence Omission

In the T m a t c h stage, the set of feature points provided by T d e t serves as the input, where the core task is transformed into establishing as many accurate and reliable correspondences as possible between the two sets of feature points. Typically, single-step feature point matching strategies rely on strict NNDR and FSC. However, due to the large initial search space, true correspondences are difficult to distinguish under the influence of similar textures and complex backgrounds by descriptors that rely solely on local pixel statistics. As a result, a large number of correct matches may be prematurely omitted by NNDR, resulting in an insufficient initial interior point rate.
Related studies narrow the search scope by introducing spatial constraints, i.e., mapping feature points to the reference image based on the initial transformation model and searching for the nearest neighbor within a local neighborhood [19]. However, the positions of the mapped feature points may be offset due to estimation errors in the initial transformation model. Geometric distance metrics are relatively sensitive to such shifts, making them prone to producing false matches within local neighborhoods. Therefore, an additional screening criterion is required to be introduced within the neighborhood under spatial constraints to compensate for the deficiency of the nearest geometric distance metric.

2.2. RNW-PC Construction and Feature Detection

As discussed in Section 2.1.2, the source of a response is difficult to distinguish by the sigmoid-weighted function that relies on the response spread value. Therefore, a structure-confidence-based PC weight function is required to be constructed to suppress pseudo-structures in textural regions. RTV achieves structure–texture decomposition through an iterative optimization procedure [27]. During the iteration process, the stable global structure resists smoothing continuously, resulting in larger cumulative residuals, while the textured regions converge rapidly [32]. Therefore, the consistent and stable edge structures that need to be preserved can be preliminarily distinguished from other regions that need to be suppressed by the cumulant of the RTV residual image. However, due to the multiplicative speckle noise inherent in SAR images, local non-stationary variations are induced in the residual accumulation map. If the map is directly used to construct the PC weight, local non-uniform fluctuations (i.e., burrs) may be induced in the weights by these high-frequency components, thus interfering with the accurate detection of feature points. NSCT maintains the image size during decomposition by virtue of its translation invariance [33], so that structural positions can be stably preserved. Simultaneously, burrs can be separated into high-frequency sub-bands via multi-scale decomposition [33], while the low-frequency responses can be retained to smooth the weight variations. Therefore, pseudo-responses in textured regions can be effectively suppressed by combining these two techniques to form a structural confidence weight.
According to [34], the RTV method is implemented by minimizing the objective function composed of a regularization term and a fidelity term, which is defined as follows:
arg min R p R p I p 2 2 + λ R T V p
R T V p = D x p L x p + ε + D y p L y p + ε
where I and R represent the input image and the output structural image, respectively. λ is a parameter that balances the fidelity term R p I p 2 2 and the regularization term R T V p . Within the window centered on pixel p , the windowed total variation in pixel p in the x and y directions is denoted by D x p and D y p , respectively, and the windowed inherent variation is denoted by L x p and L y p , respectively. By dynamically updating the weight matrix and solving the system of linear equations iteratively, the optimal solution of RTV can be expressed as follows:
ν R t + 1 = I + λ F t 1 ν I
where the vector forms of R and I are denoted by ν R and ν I . t means the iteration index and I is an identity matrix. F is a weight matrix, which is determined by the structure vector v R t .
According to the image sequence R t , t = 1 , 2 , , I t e r N u m obtained from (6), the residual accumulation function is defined as follows:
R A = t = 1 I t e r N u m R t R t 1
where R A represents the RTV residual cumulative image. Specifically, a higher pixel value indicates greater changes during the iteration process, corresponding to the edge structure. Conversely, it corresponds to the modality-specific regions that need to be suppressed.
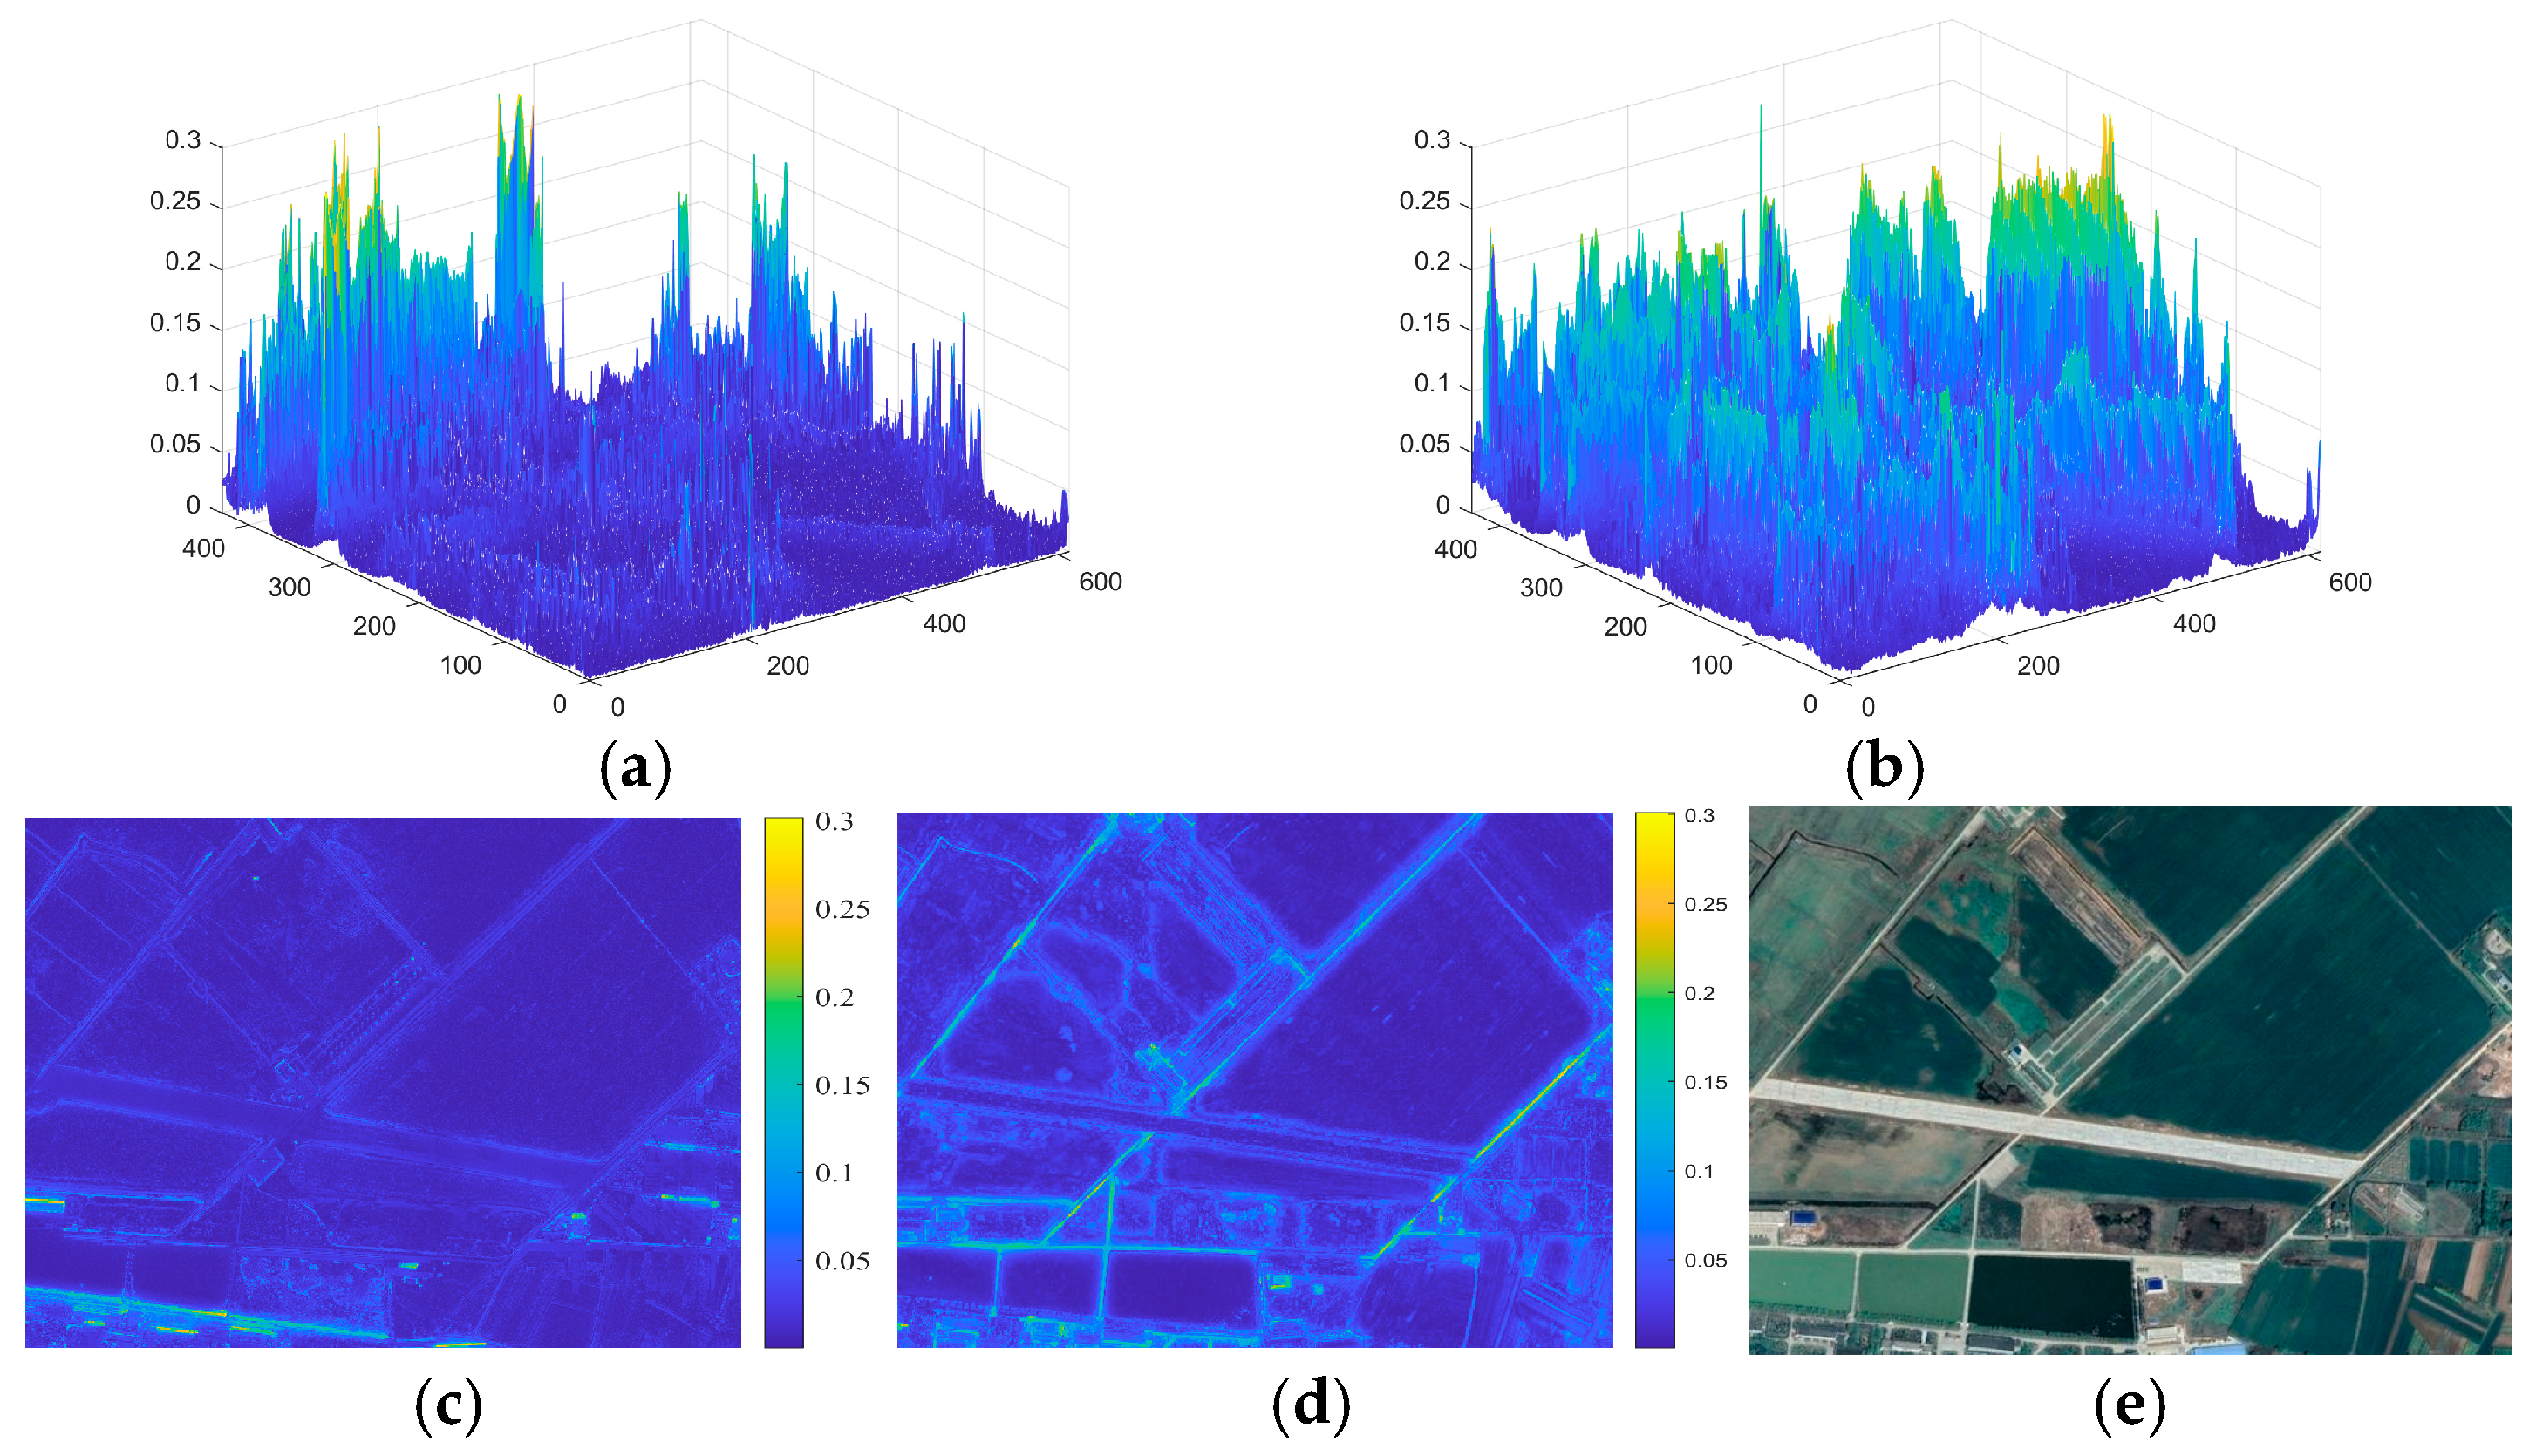
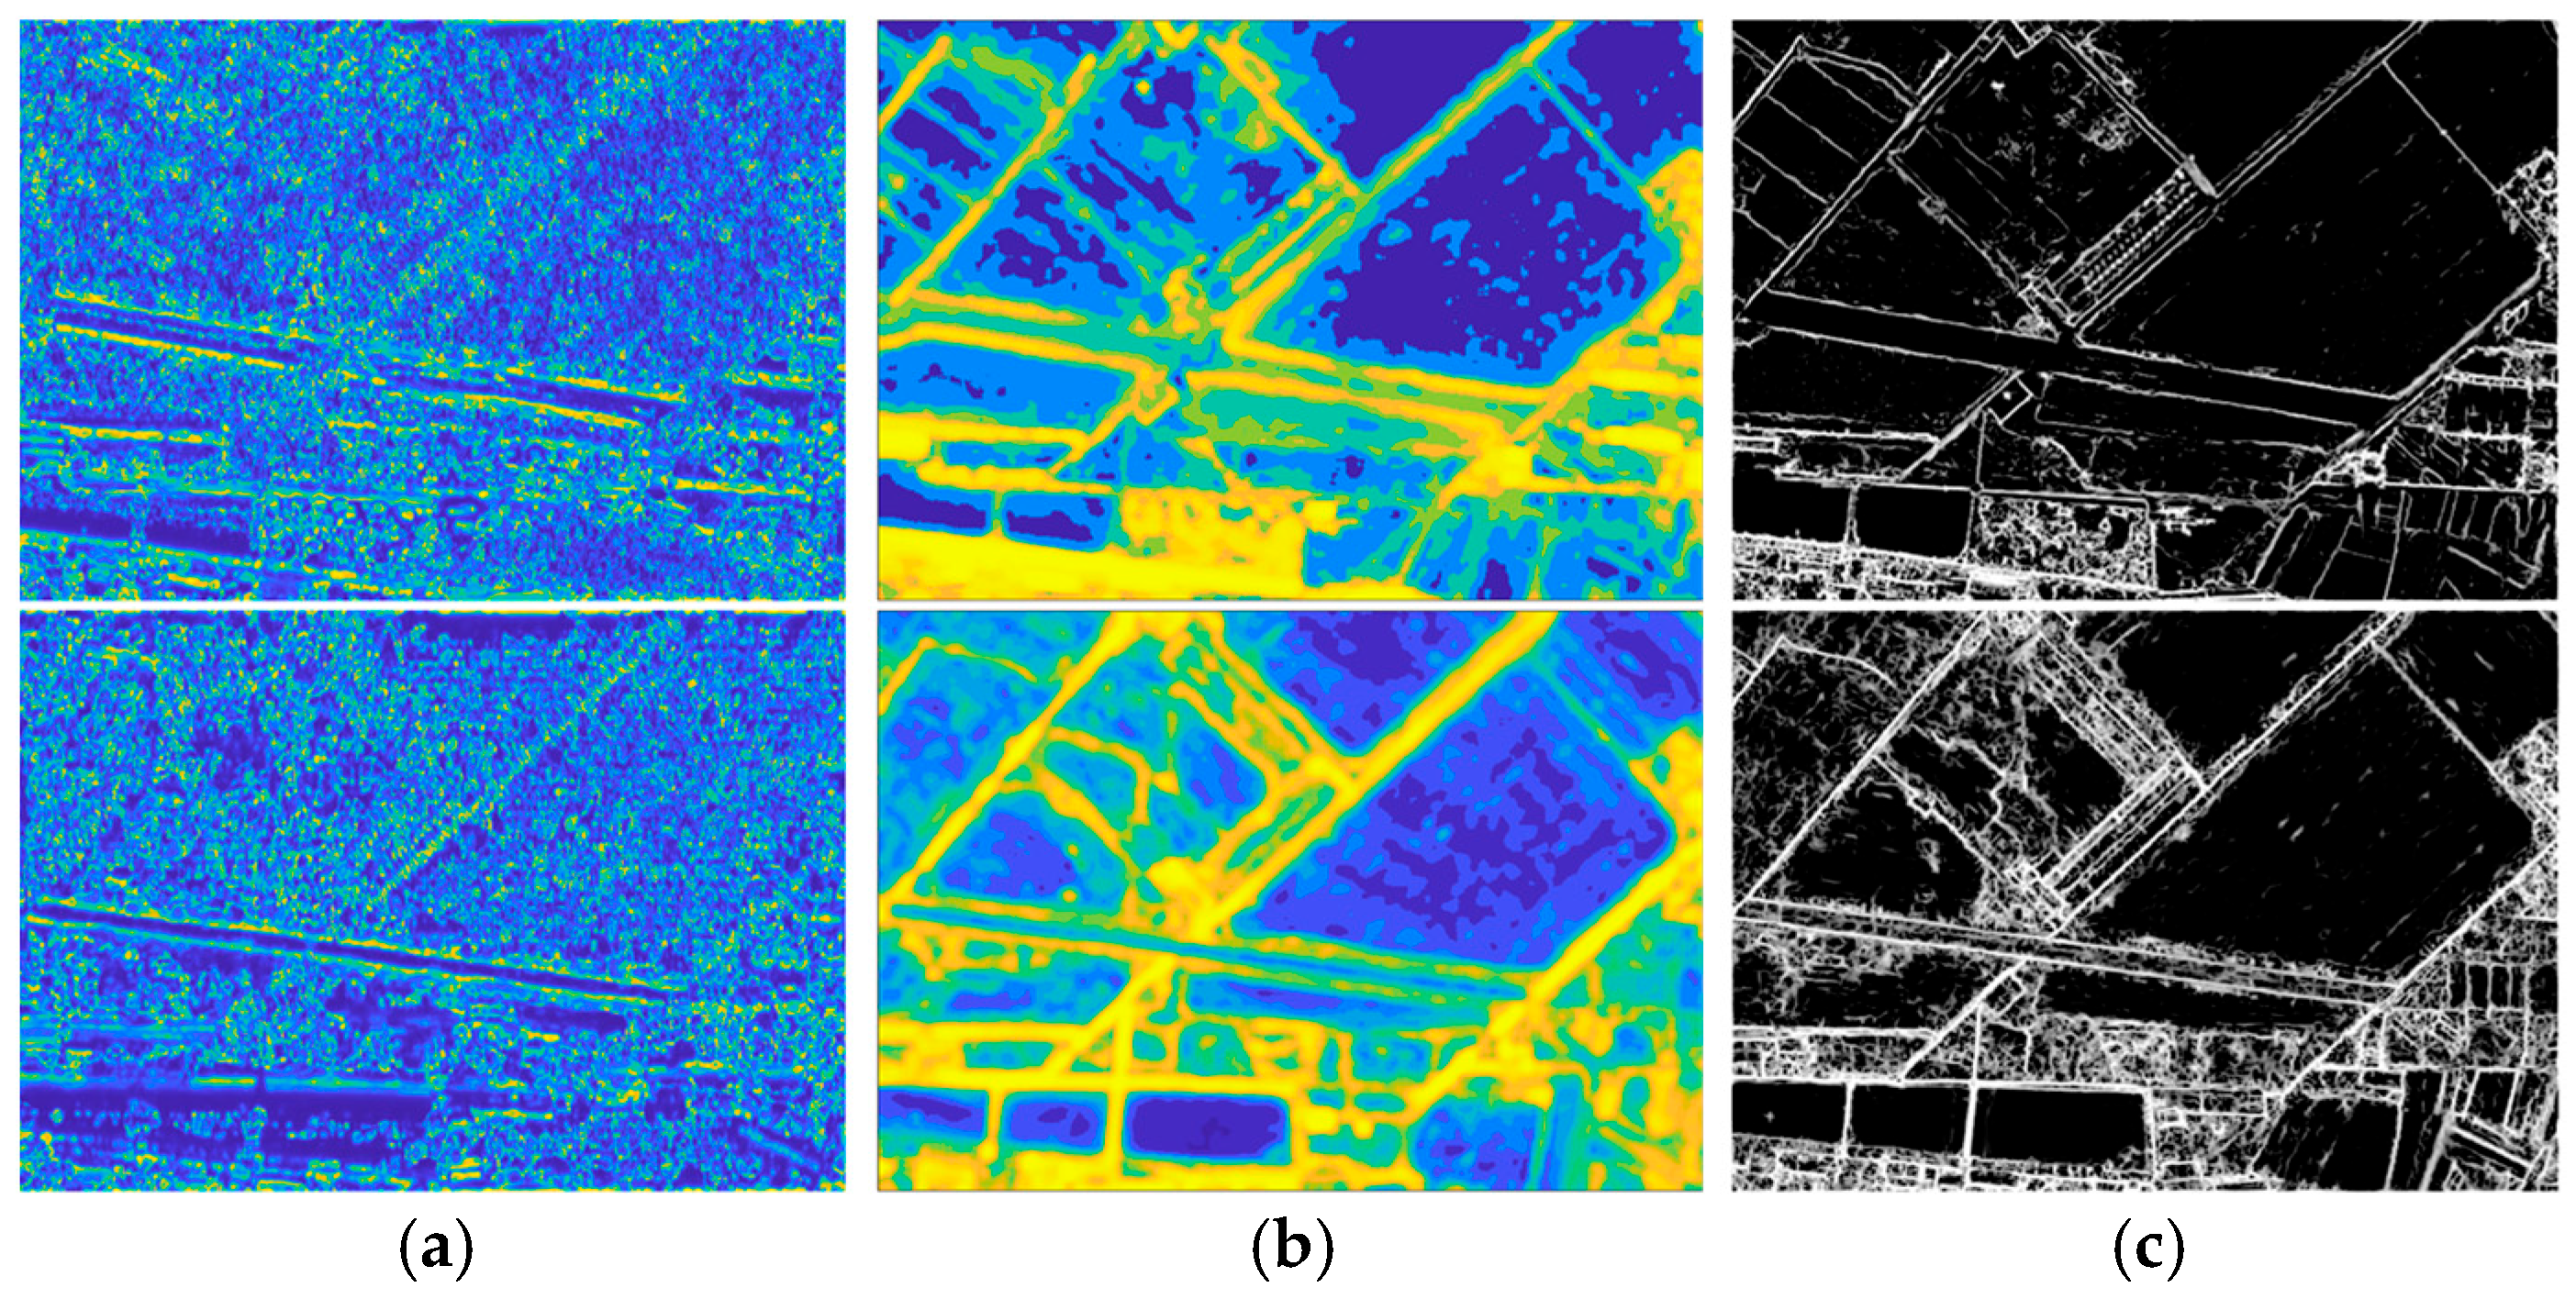
In theory, R A has the initial capability to distinguish edge structures from other regions, as shown in Figure 3. However, multiplicative speckle noise in SAR images may cause local non-stationary variations in R A . To suppress this phenomenon, NSCT is introduced to extract the low-frequency components of R A to smooth the fluctuations. Furthermore, structural positions can be kept as stable as possible since the image size remains constant throughout the process [33].
First, the input image is decomposed by the non-subsampled pyramid (NSP) of the NSCT to obtain the low-frequency (LF) sub-band through iterative decomposition. Then, the PC weighting function is constructed based on the LF component of R A , as defined below:
L l = R A , l = 0 L l 1 Φ l o w ( l ) , l = 1 , 2 , , D N
where L l is the LF sub-band image obtained after the l-th level decomposition. Φ l o w ( l ) represents the low-pass filter corresponding to the l-th level. To uniformize the value distribution of the weighting factor, histogram equalization is applied to L D N , yielding the final weighting factor L D N . The RNW-PC model can be defined as follows:
P C R N W u , v = L D N u , v s o A s o u , v Δ Φ s o u , v T n s o A s o u , v + ε
The results of the structure detection based on RNW-PC are shown in Figure 4. It is clearly evident that prominent and stable structures can be enhanced by RNW-PC, and pseudo-structures in modality-specific regions can be suppressed.
For feature detection, a RIFT-like method [11] is used. Specifically, the Max-M is calculated based on RNW-PC, and the FAST algorithm [35] is used to detect feature points on moment images.

2.3. Feature Description and WSC Matching

As discussed in Section 2.1.3, the geometric nearest distance metric is sensitive to shifts in mapped positions after the initial transformation model is introduced to establish spatial constraints, which may still result in mismatches within the local neighborhood. This is because the geometric closest distance relies on the distance information between feature points. Therefore, a screening criterion robust to position shifts is required to be introduced within the spatially constrained neighborhood. The angle between descriptor vectors is measured by the cosine similarity, which is independent of the distance to the feature points and is somewhat robust to changes in amplitude. Therefore, in the refined matching stage under spatial constraints, the descriptor window is narrowed by WSC to reduce the influence of local geometric distortions [11], and cosine similarity is adopted as the direction consistency criterion, thereby achieving dual constraints on both distance and direction within the neighborhood to prevent correct correspondences from being omitted.
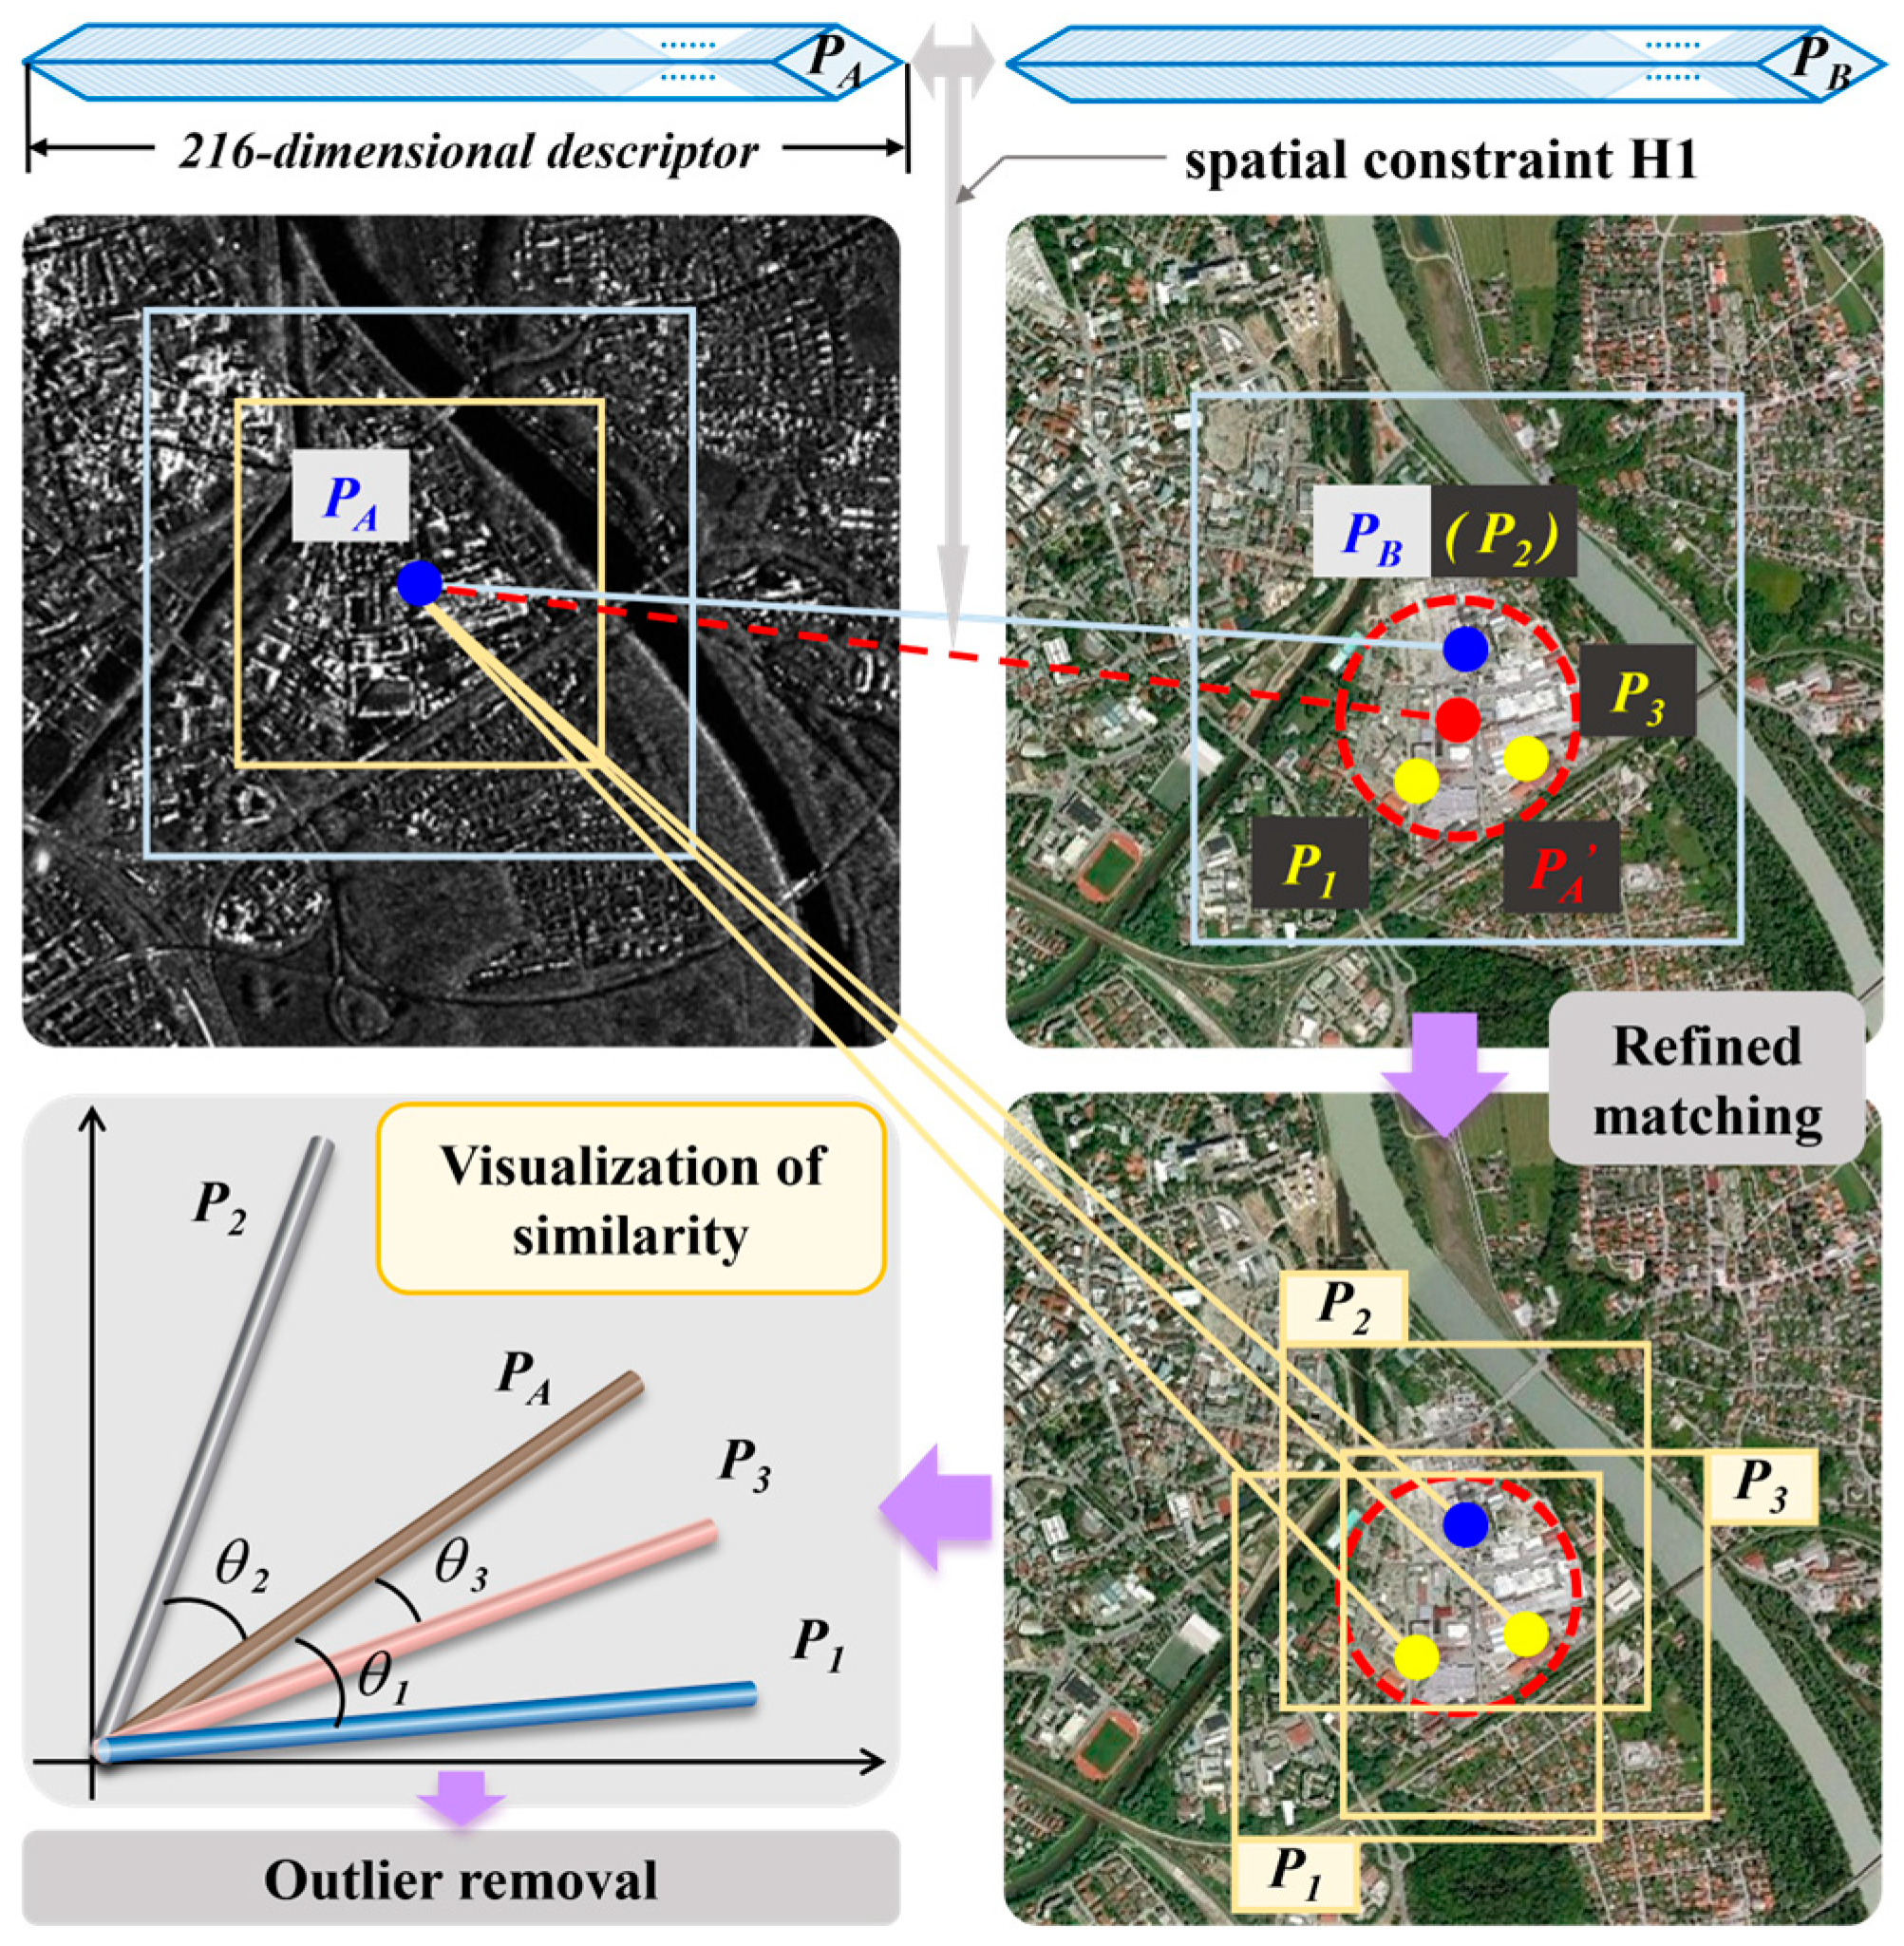
In this section, the feature description method employed to support the process is first introduced, followed by a detailed exposition of the WSC matching method. The schematic diagram of the coarse-to-fine matching is shown in Figure 5.

2.3.1. Feature Description

Similar to SIFT-like algorithms, the dominant orientation of each point is assigned using gradient amplitude and orientation [27]. Unlike traditional methods, the gradient distribution histogram is constructed from the RNW-PC-based Max-M map. Since the RNW-PC is intended to suppress the interference of multiplicative noise, a more reliable orientation estimation is expected. Moreover, the orientation is restricted to the full range 0 ° , 360 ° . Peaks above 90% of the maximum height are selected as auxiliary orientations. Then, the local maximum index map (MIM) [11] patch of each point is rotated accordingly. Subsequently, rotation-invariant descriptors are generated according to the RIFT2 [30]. Notably, two descriptors are constructed per point by controlling the size of the local window: one derived from a large window and another from a small window. The former is used for coarse matching to estimate global spatial constraints, and the latter is used for fine matching to obtain reliable correspondences under the guidance of spatial constraints.

2.3.2. Coarse Matching

After obtaining local large-window description vectors, NNDR is employed for preliminary matching to obtain the initial set of matching point pairs P i n t i a l . However, NNDR performs a global search based solely on the local appearance similarity of descriptors. Geometric mismatches introduced by repeated textures or complex backgrounds are difficult to eliminate. The direct application of FSC on P i n t i a l may lead to model estimation faults due to the low proportion of internal points. Therefore, a scale histogram analysis is introduced by reference to [19] and [36], which imposes geometric constraints on matching point pairs to further eliminate potential mismatches and update the matching set to yield P s h . Based on increasing the proportion of inner points, a relatively strict FSC threshold is employed to estimate the initial transformation model H 1 .

2.3.3. Refined Matching

During fine-matching, the initial transformation model H 1 is employed as a spatial constraint to narrow the search range for corresponding points. Specifically, each feature point in the sensed image is first projected onto the coordinate system of the reference image based on the coarse model H 1 . If a correct matching point exists, it should theoretically lie within a finite neighborhood of radius r a around the projection point. Second, cosine similarity is introduced as a directional constraint within the local neighborhood. The local small-window descriptor is employed for similarity calculation to reduce the impact of local geometric distortion on descriptor stability [11]. Then, from all feature points within the neighborhood of the projection point, the correspondences with a similarity score no less than S r a t i o relative to the current point descriptor are selected as high-confidence candidate matching pairs. The feature point descriptor of the sensed image is represented by vector S r c , while that of the reference image is represented by R e f . The cosine similarity between two descriptors is defined as below.
S i m i l a r i t y S r c , R e f = S r c R e f S r c R e f
Finally, the newly generated set of matching points P c o s is input into the FSC algorithm with a strict threshold applied to eliminate residual mismatches. Finally, a more precise transformation model H 2 is estimated.

3. Results

In this section, to comprehensively validate the image registration performance of the proposed method, four sets of data comprising 60 image pairs are selected for qualitative and quantitative evaluation. Since the proposed method is based on point features and has rotation invariance, five advanced registration algorithms with rotation invariance are selected as comparison objects, i.e., OS-SIFT, HAPCG, LNIFT, RIFT2, and the machine learning-based WSSF. Additionally, the effectiveness of the improved components is validated through ablation experiments. To ensure fairness, the implementation code for the compared algorithms is sourced from the website provided by the original authors.

3.1. Experiment Settings

3.1.1. Datasets

To comprehensively evaluate the performance of the proposed algorithm, an experimental dataset encompassing a variety of scenarios is constructed. Some image pairs are randomly selected from the publicly available datasets OS [15], MultiResSAR [37], and MRSI [38], while the rest are actual airborne SAR measurement data. The selection of data takes into full consideration factors such as time and resolution and covers a variety of scenarios, including cities, villages, and farmland. For the convenience of analysis, the data is first divided into three basic test sets according to source and size, labeled as GA, GB, and GC. Furthermore, to validate rotation invariance, GD is derived from the first three groups, thereby forming four test sets in total.
Specifically, GA comes from the pre-aligned OS dataset and contains 15 pairs of randomly selected images, each with a size of 512 × 512 pixels. GB is sourced from the MultiResSAR dataset, which contains image pairs with slight geometric differences, and the true transformation matrix is provided by the dataset. Some images in GC are derived from data obtained through actual measurements by airborne SAR. The true transformation matrix is calculated by manually selecting approximately thirty uniformly distributed corresponding feature points [7]. The remaining data are sourced from the MRSI dataset. Additionally, to test the rotation invariance of the algorithm, five image pairs are randomly chosen from each of the A–C groups to form the GD, ultimately yielding a total of 15 image pairs. Random rotations are applied to the SAR images within them. Since the angle is set manually, the true transformation matrix for the image pair containing the rotation difference can be computed based on the rotation parameters and the known true-value transformation.

3.1.2. Evaluation Metrics

To adequately evaluate the performance of the proposed algorithm, a combination of qualitative and quantitative methods is used for assessment. For qualitative evaluation, the results of correct matching are directly compared, and the registration effect is visualized using a checkerboard grid image. For quantitative evaluation, the number of correct matches (NCM), the ratio of corrected number (NCR), and root mean square error (RMSE) are used as performance evaluation metrics.
Correct matches are correspondences with residuals less than 5 pixels after applying the truth value transformation H , as defined below [21].
N C M = k r i H k l i 2 < 5 i = 1 C t o t a l
where k l i , k r i is the i-th pair of matched keypoints. C t o t a l denotes the total number of matching point pairs obtained after Section 2.3.3. NCM is positively correlated with the estimated accuracy of the transformation model [27].
NCR represents the proportion of correct matches among all matches, defined as follows:
N C R = N C M N T M
where NTM is obtained from P c o s in Section 2.3.3 [26]. A higher NCR value represents greater reliability of the match [21].
RMSE is a key metric for measuring the accuracy of registration. Based on the differences between the true transformation and the algorithm-estimated transformation, which is calculated below.
R M S E = 1 N C M j = 1 N C M k r c j H k l c j 2 2
where k l c j , k r c j is a pair of correctly matched features as defined by NCM. Generally, a lower RMSE indicates better registration accuracy [12].
A successful registration requires dual confirmation through quantitative metrics and visual assessment. According to [29], the NCM is first verified to be no less than 10; if not, the match is deemed unsuccessful. Then, the images are aligned based on the transformation matrix obtained from NCM. If no obvious misalignments are detected in the local region of the checkerboard grid image, the match is considered successful. Finally, the ratio of successful matches to total matches, S R , is calculated and recorded. It should be noted that if a pair of images fails to align successfully, the RMSE is directly recorded as 20 [29].

3.2. Parameter Study

In the experiment, optical images are used as reference images, and SAR images are taken as images to be registered. The parameters of the comparison algorithm are all set to the optimal settings recommended by their original authors. For the proposed algorithm, the parameters of the PC (excluding weight function settings) remain consistent with the RIFT2 algorithm. The size of local image blocks used for dominant orientation estimation and initial description vector construction follows the optimal setting for RIFT2, i.e., 96 × 96 . The local window size for descriptor construction in fine matching is set to 72 × 72 . For the histogram determining the dominant orientation, the number of bins in the histogram is set to 24. Referring to the studies in [32] and [34], the number of iterations is fixed at I t e r N u m = 30 . The similarity threshold is set to S r a t i o = 0.5 .
For the weighting function of RNW-PC, it is the three parameters λ , σ r and D N that require analysis. As a regularization optimization weight, the overall smoothing strength of the results is primarily controlled by λ . The increase in λ makes the image blurrier, but as the original author pointed out, it has limited benefit for texture separation [34]. σ r denotes the initial standard deviation of the Gaussian filter in R T V p computations, which is crucial for achieving texture separation. The window spatial scale is controlled by it, and the higher the value, the stronger the texture suppression effect [34]. On the contrary, more image detail may be lost as the value increases. Parameter D N is the number of decomposition layers in NSCT. If the number of decomposition layers is too few, it is hard to effectively suppress noise and mitigate structural inhomogeneity; conversely, excessive smoothing may result in serious loss of edge response. Therefore, the selection of appropriate parameters is crucial. Therein, 20 pairs of images are randomly selected to serve as the test dataset for analyzing the impact of these parameters. NCM is employed as the evaluation metric for three independent experiments. It should be noted that only one parameter is varied in each experiment, while the others are set to fixed values. The experimental results are summarized in Table 1, Table 2, Table 3 and Table 4.
The following conclusions can be drawn based on the results of the parameter sensitivity experiments. (1) A significant non-monotonicity is exhibited in the relationship between NCM and the parameter λ . Within the range λ = 0 . 01 , there may exist an optimal value for performance. Deviations from the range (whether increases or decreases) result in a reduction in NCM. (2) The optimal result is achieved at σ r = 8 . Values below or above 8 lead to a reduction in NCM. (3) D N = 3 facilitates the attainment of optimal NCM when λ and σ r are fixed. In summary, λ = 0.01 , σ r = 8 , and D N = 3 are set as the final parameter configuration for subsequent experiments in this paper, whose combination achieves the observed optimal performance within the tested range.

3.3. Feature Detection Analysis

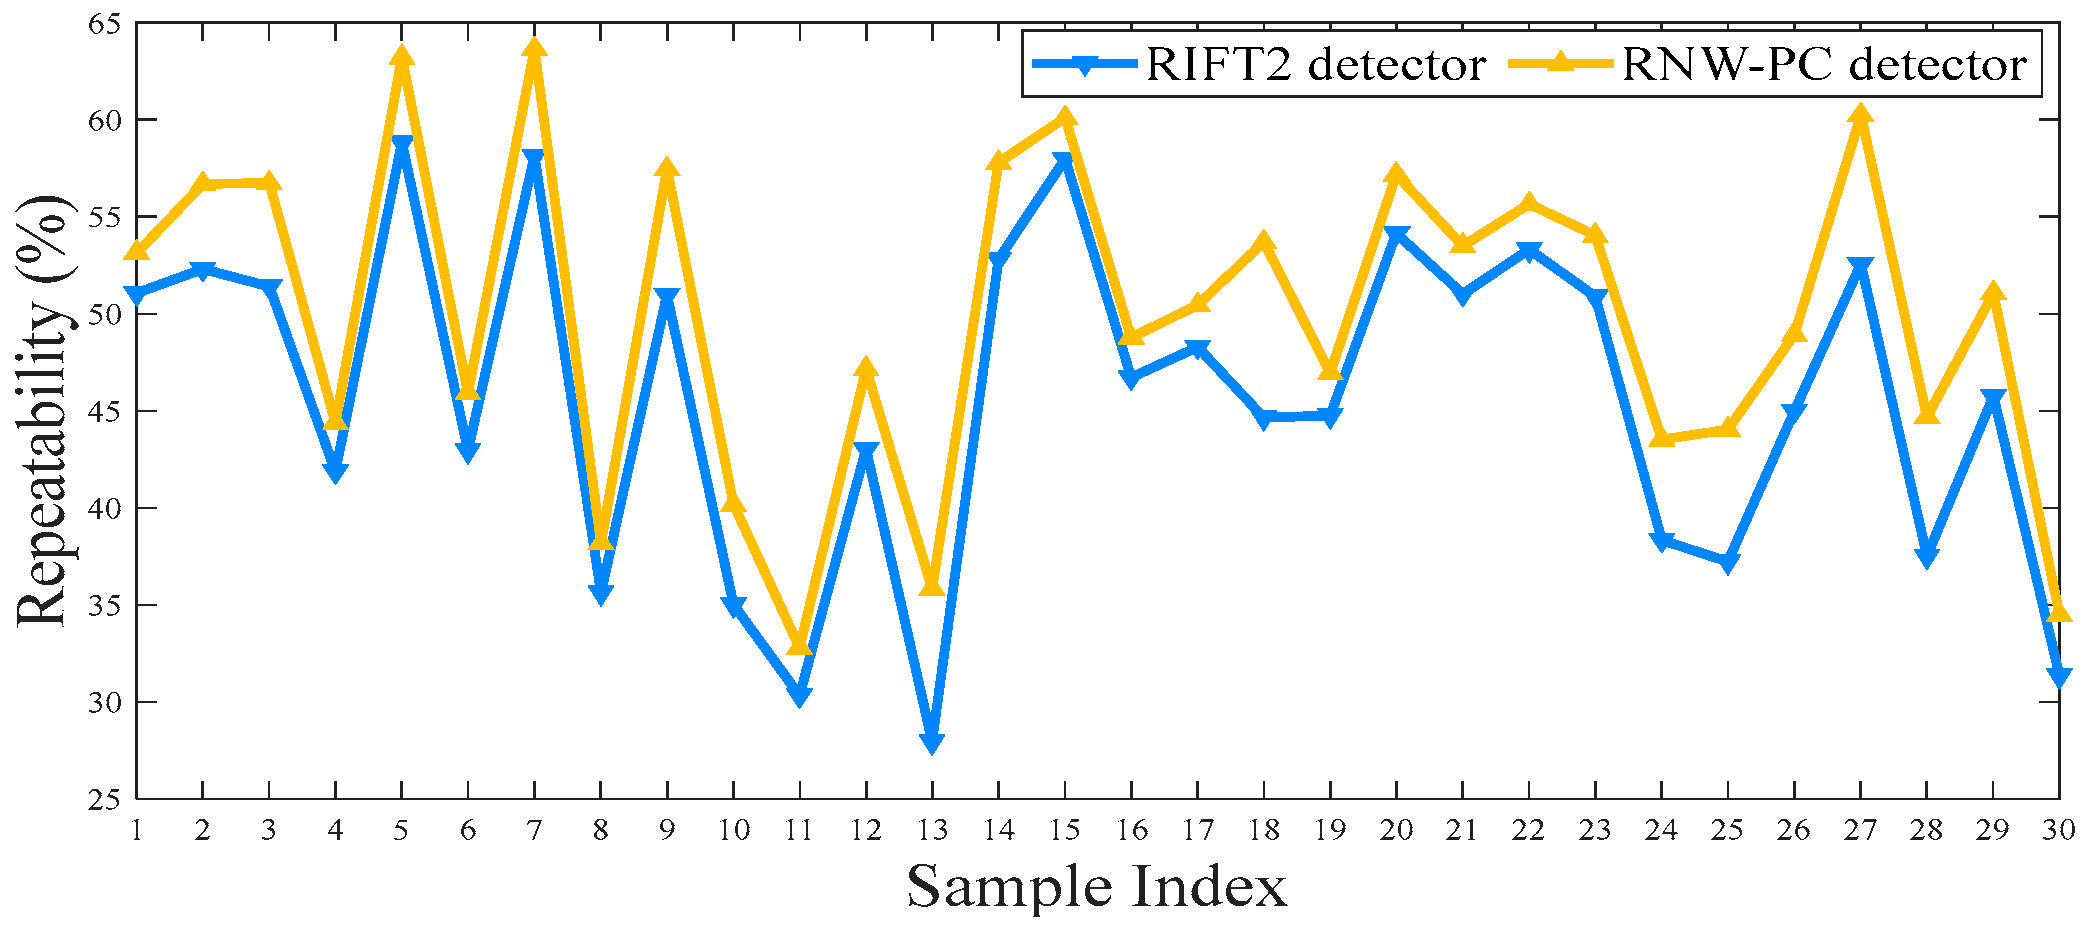
To verify the effectiveness of RNW-PC for feature point detection, the RNW-PC detector is compared with the RIFT2 detector on 30 pairs of image data randomly selected from the datasets. The reason for choosing RIFT2 is that the feature point detection is based on the classic PC method. The repeatability rate R γ is employed as an evaluation indicator, which is defined as the ratio of the number of corresponding keypoints (i.e., the Euclidean distance between two points is no greater than 3 pixels) to the number of detected feature points [22]. For fairness, all steps except structure detection are the same in the experiment. Approximately 5000 feature points are detected in each image. The average results are summarized in Table 5, and a comparison of the experiments for each pair of data is given in Figure 6.
As can be seen, the repeatability of feature points can be effectively increased by the RNW-PC detector proposed in this paper. Compared with the classical PC-based RIFT2 detector, the average repeatability rate of the RNW-PC detector on the test set reaches 50.01%, and the relative improvement is 4.29% (i.e., about 215 pairs of potential correct matching points). Thus, the effectiveness of the weighting mechanism adopted by RNW-PC in dealing with significant NRD and strong speckle noise between heterogeneous optical and SAR images has been fully verified by the experimental results.

3.4. Noise Robustness

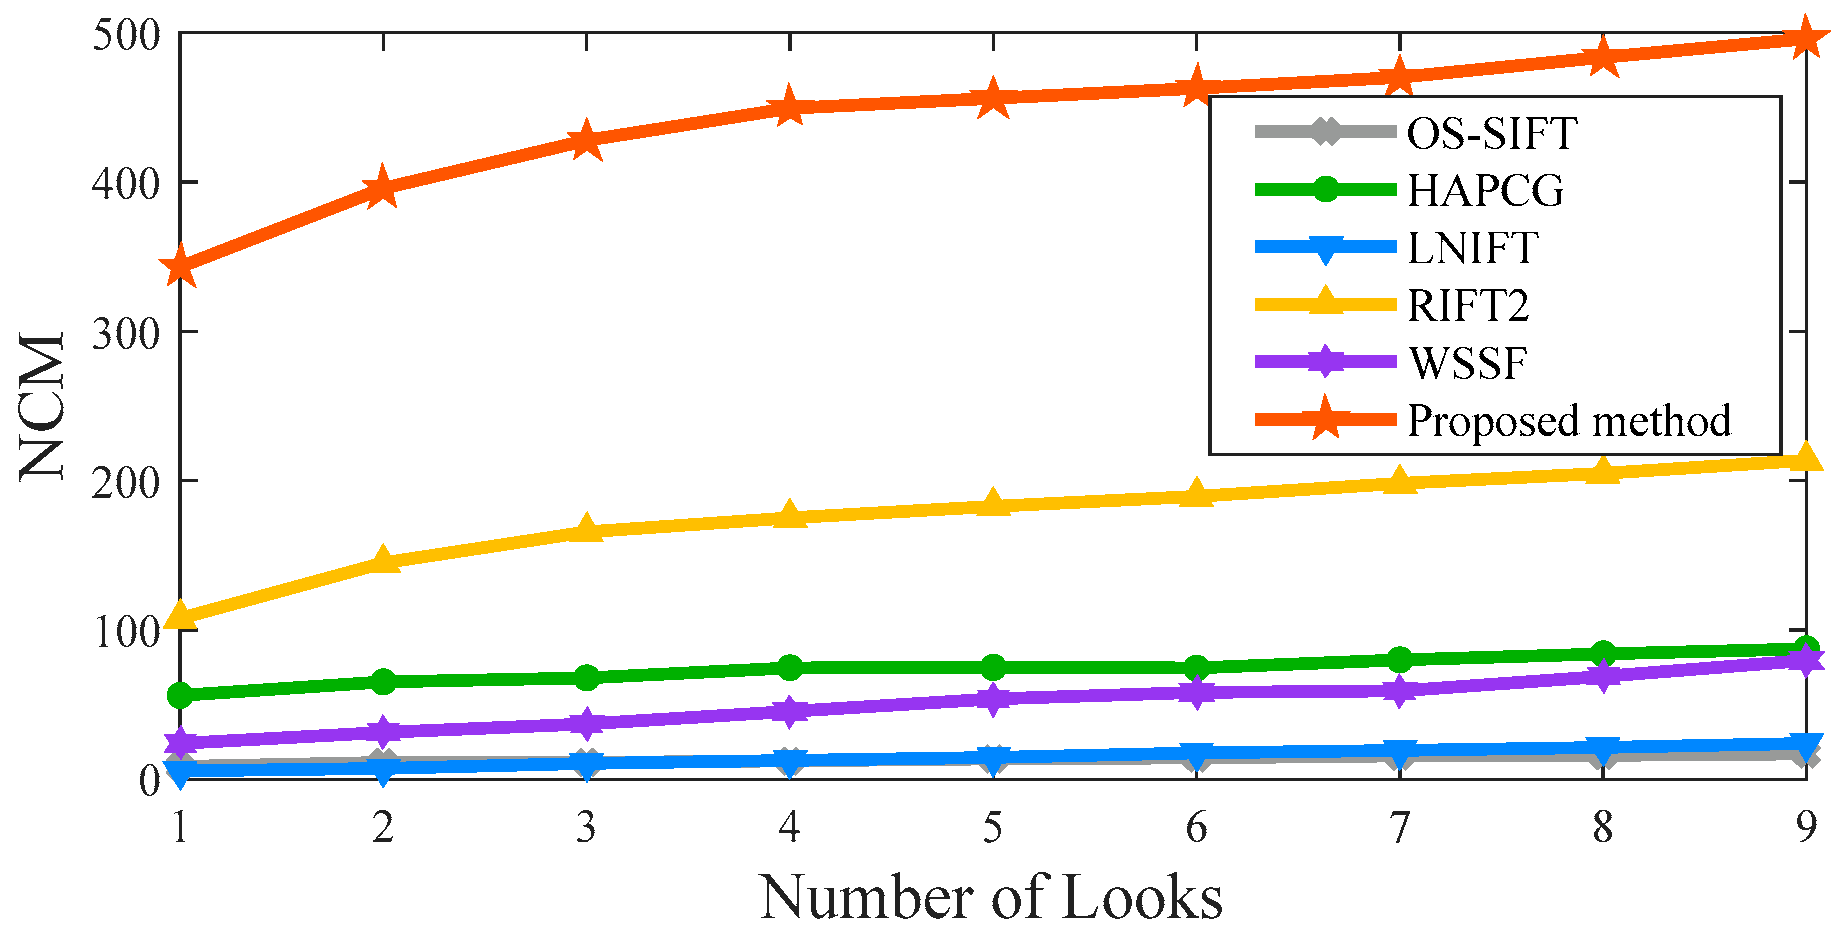
To evaluate the resistance of the proposed method to speckle noise, simulated experiments are conducted on 10 sets of images. Referencing [22] and [27], optical images are registered with simulated SAR images with varying noise levels (i.e., from one to nine looks), and NCM is adopted as the evaluation metric. It should be noted that the number of looks is inversely proportional to the noise level.
The experimental results are shown in Figure 7. Overall, as the number of looks decreases, the registration performance of all methods deteriorates. However, compared to comparative algorithms, the highest N C M a v e across all noise levels is achieved by the proposed method, and the performance under strong noise (one look) is still higher than the results obtained by all comparison algorithms under the weakest noise (nine-look) condition. Under the one-look condition, the N C M a v e reached 343.11, representing 3.18 times the improvement over RIFT2. The proposed method exhibits strong robustness to speckle noise, primarily due to the ability of its weighting mechanism to suppress noise-induced pseudo-structures. Meanwhile, the dual spatial and directional constraints during the matching phase ensure that a sufficient number of reliable correspondences can still be established despite the decline in feature point quality.

3.5. Qualitative Evaluations

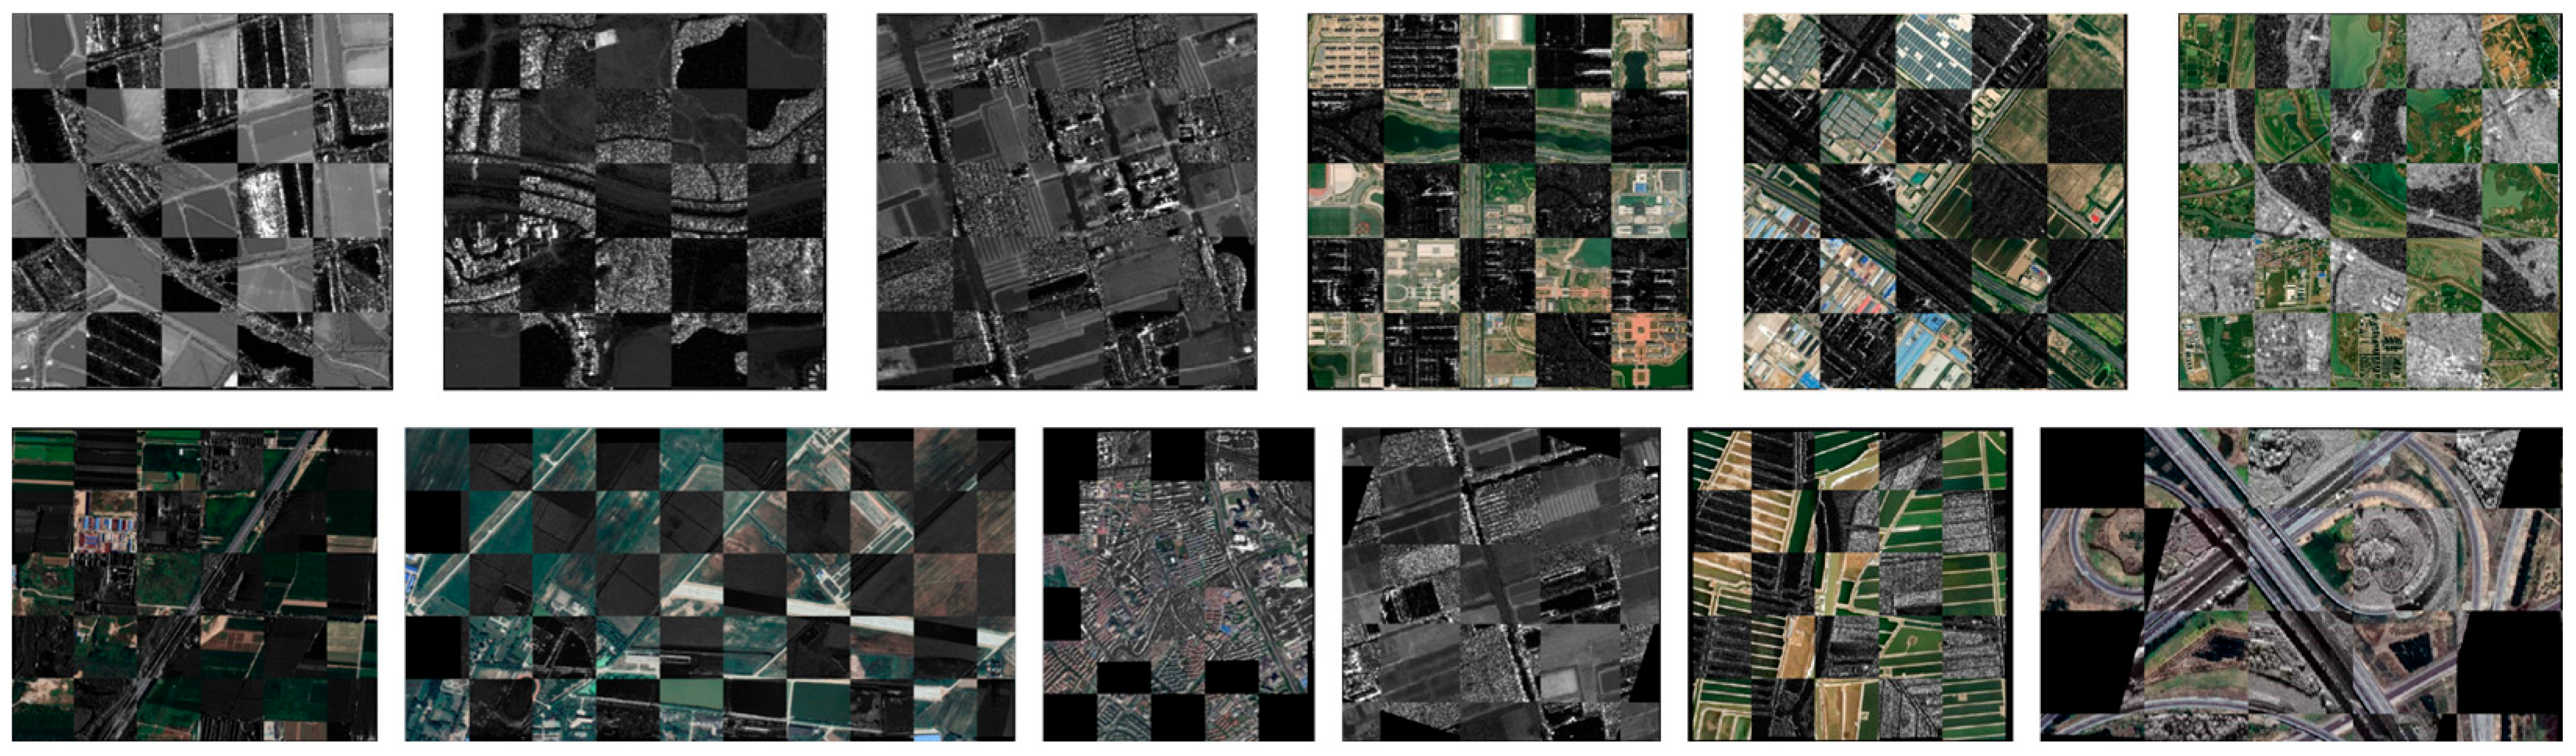
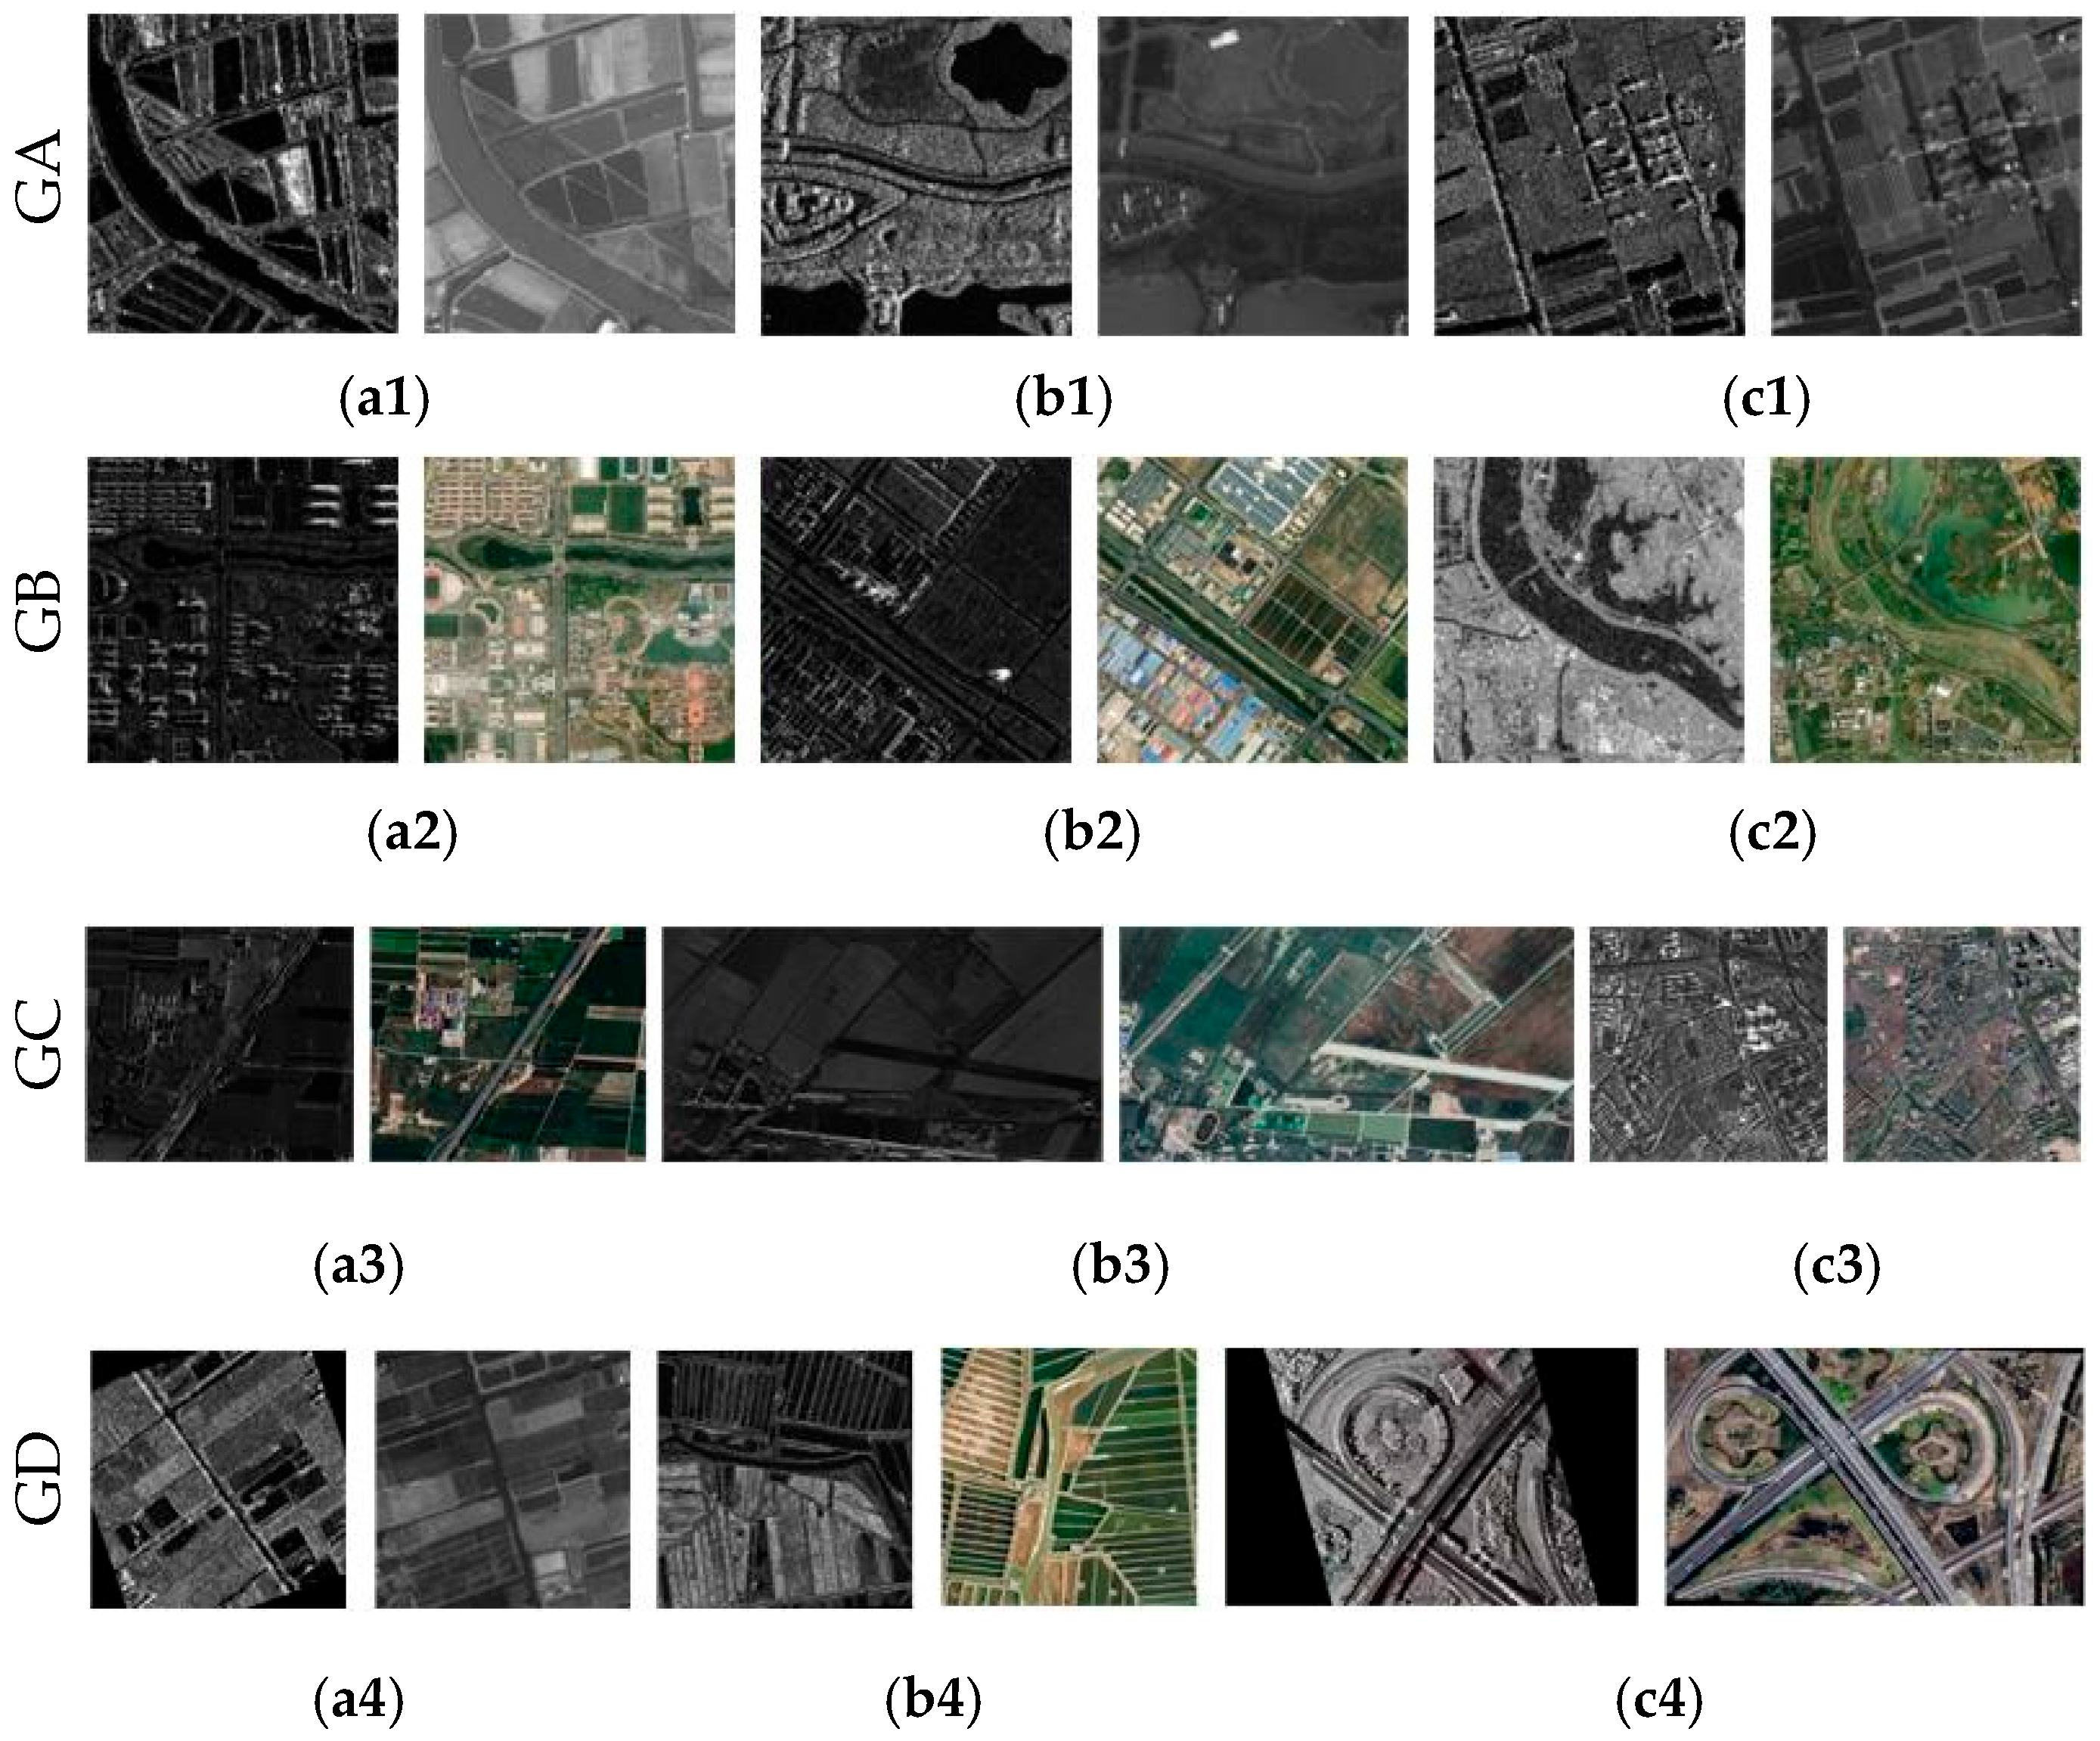
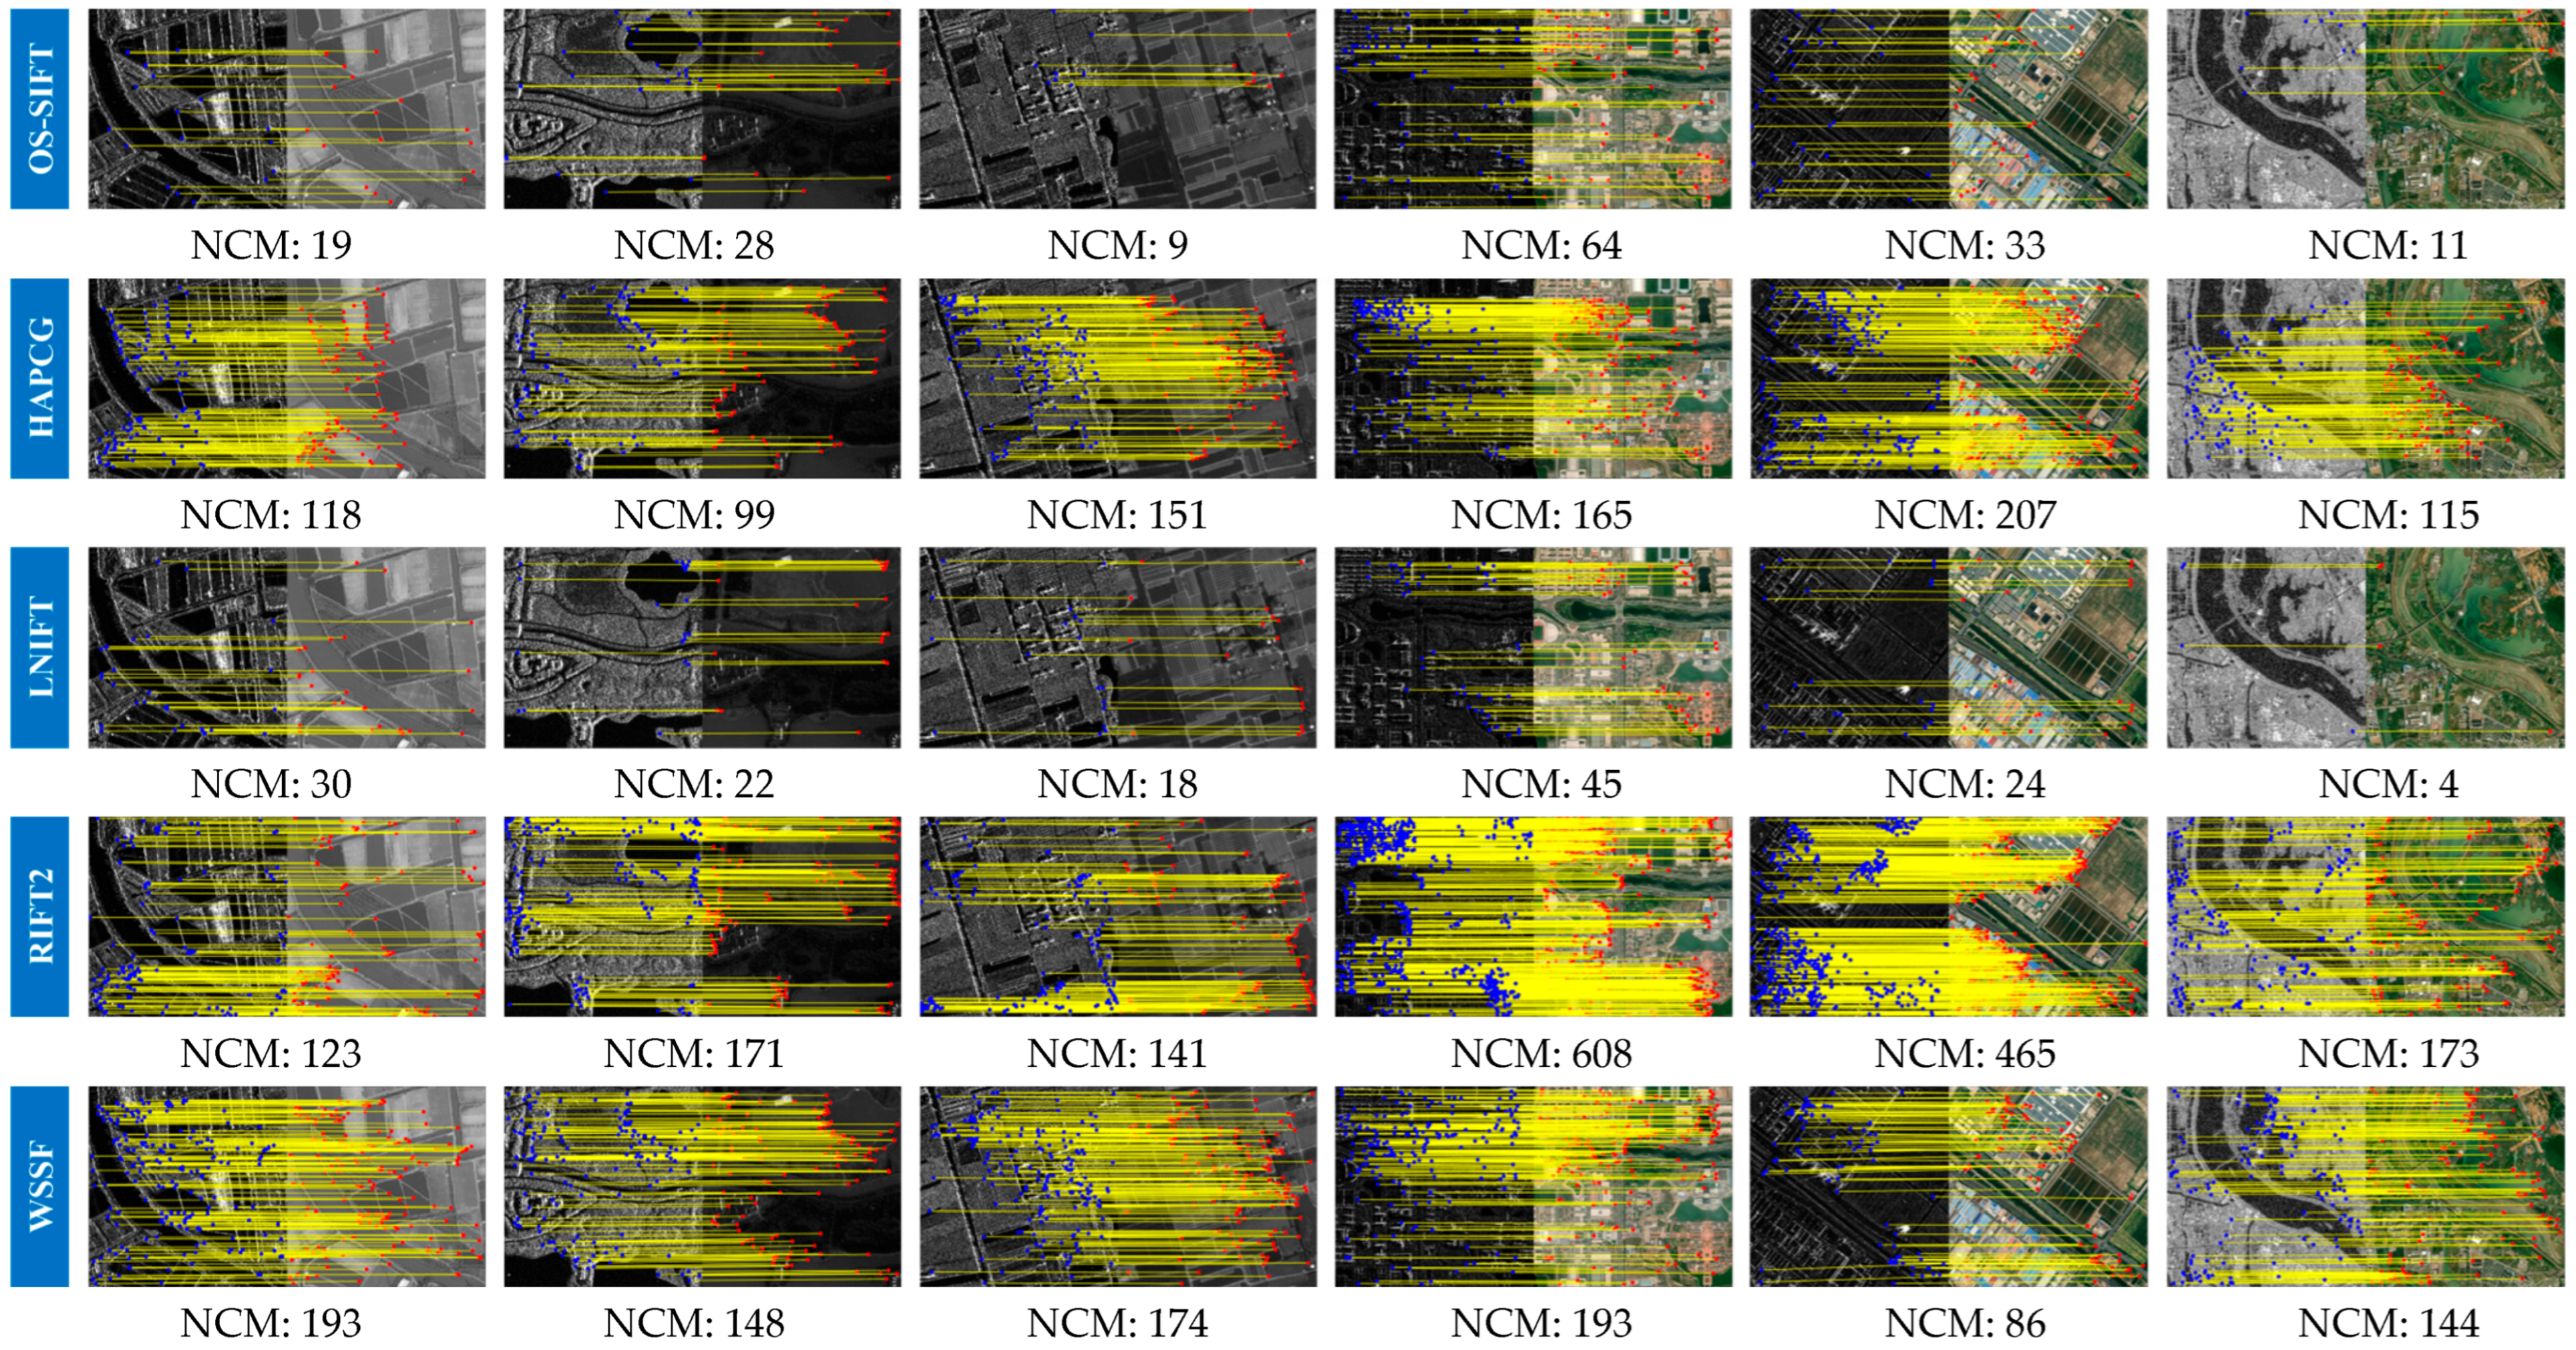
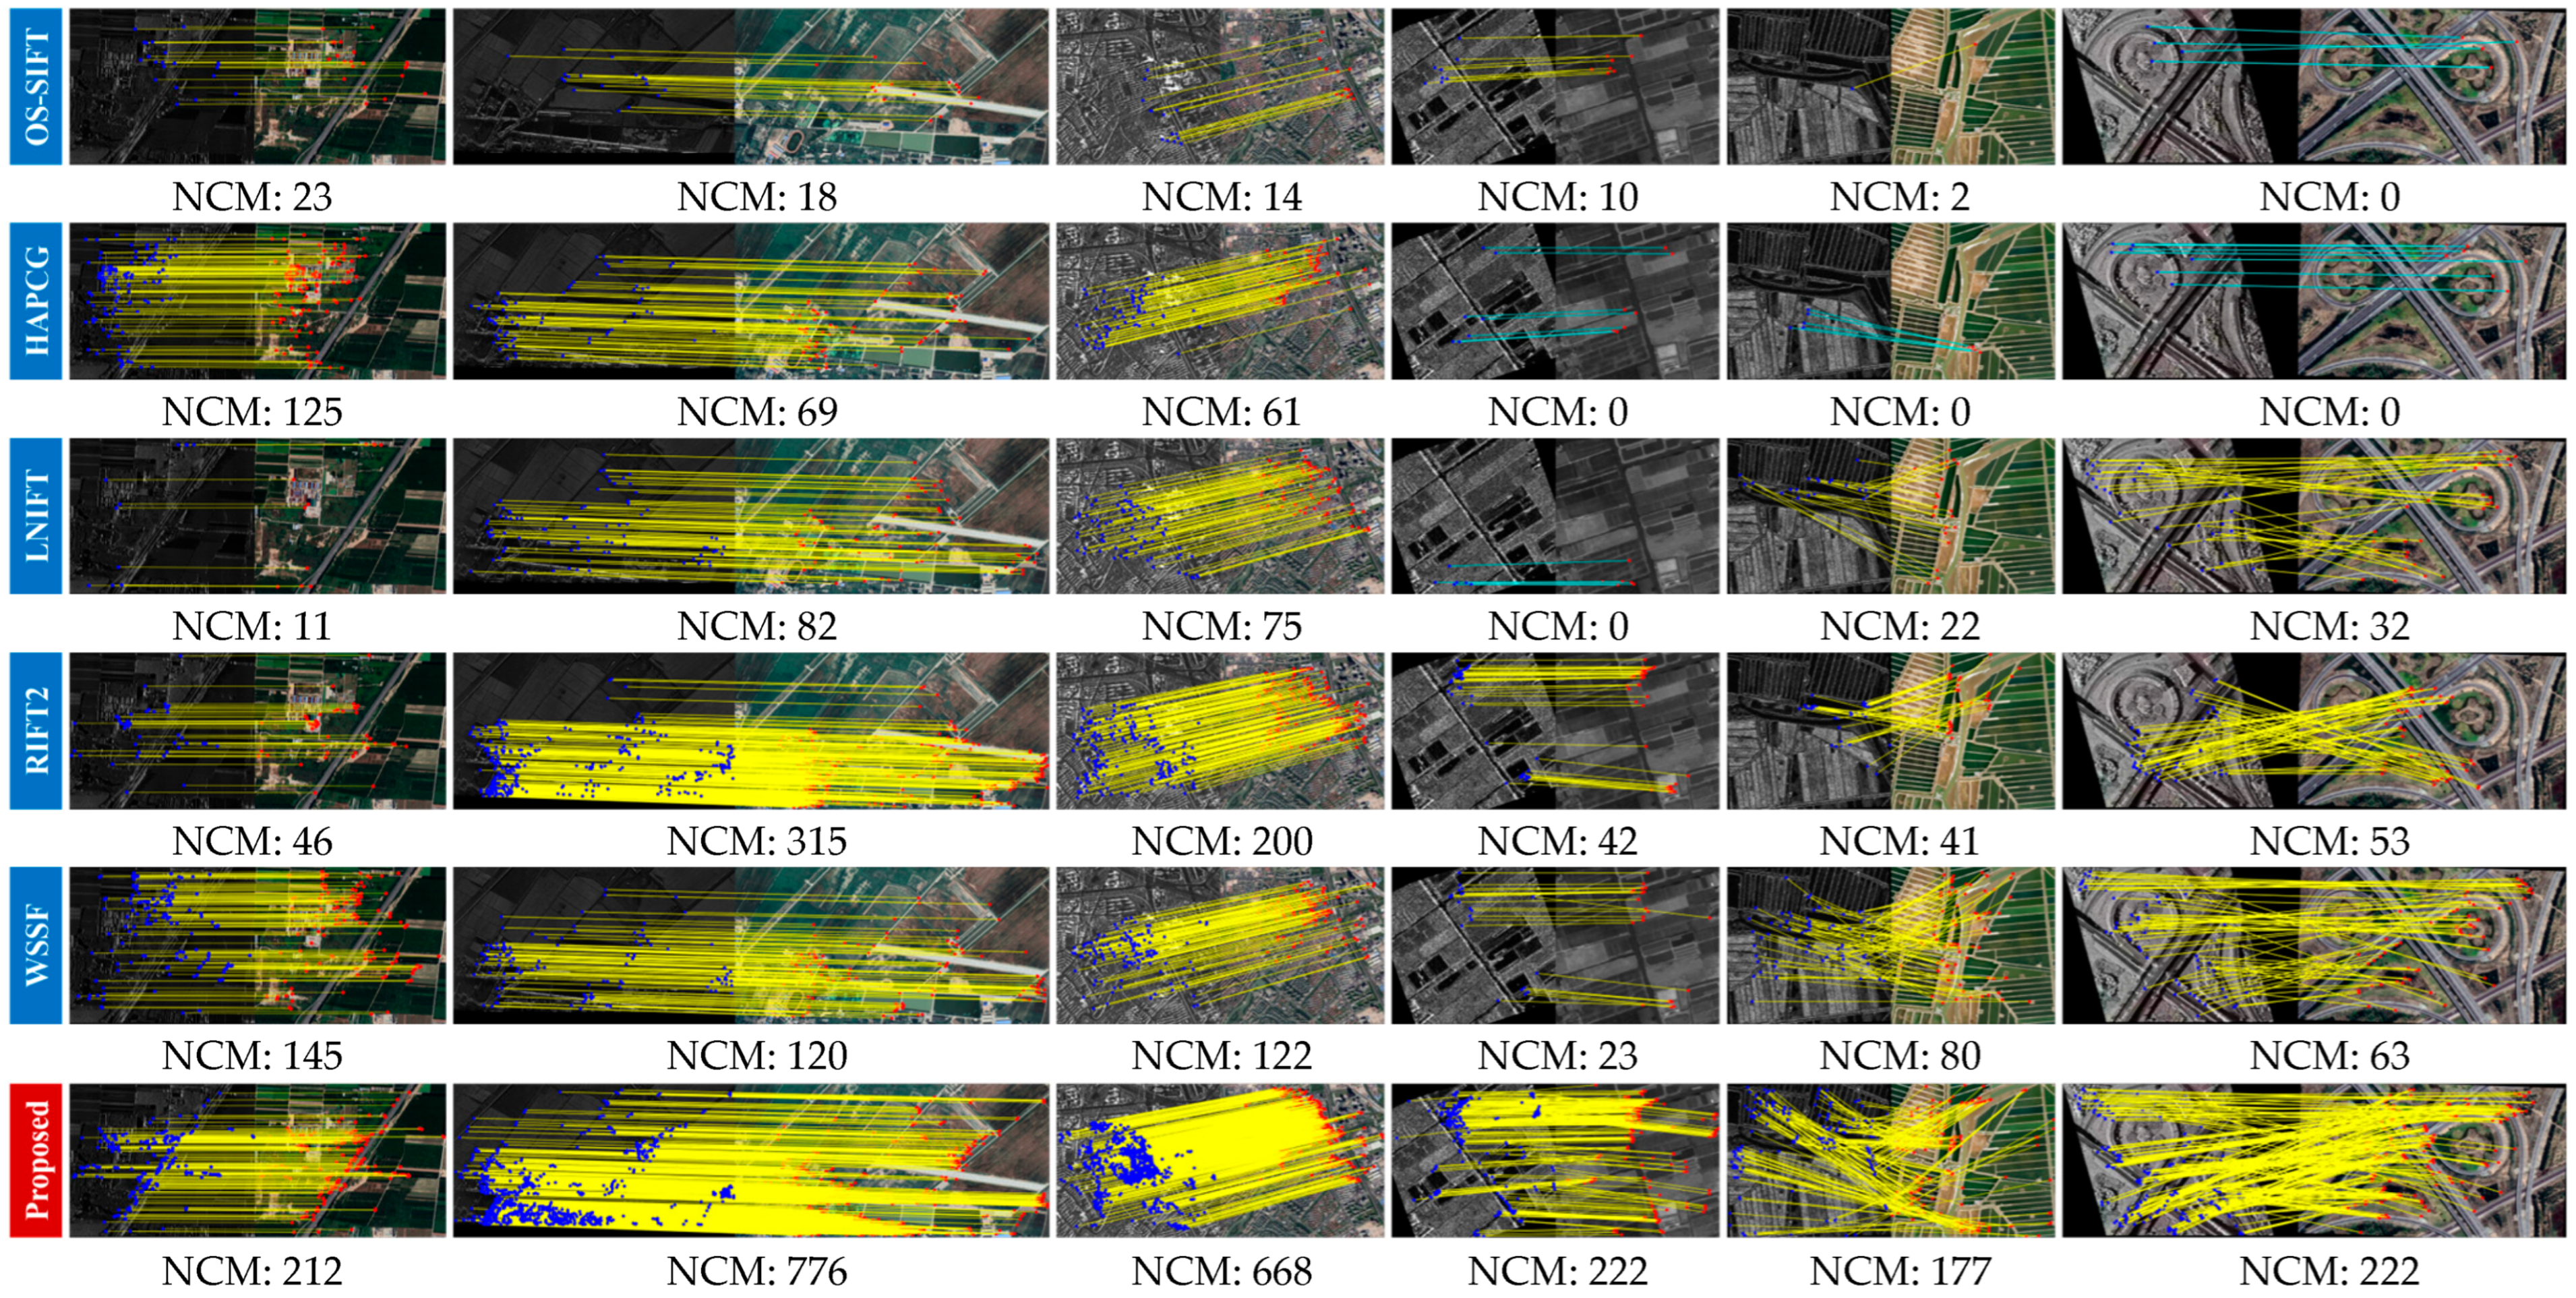
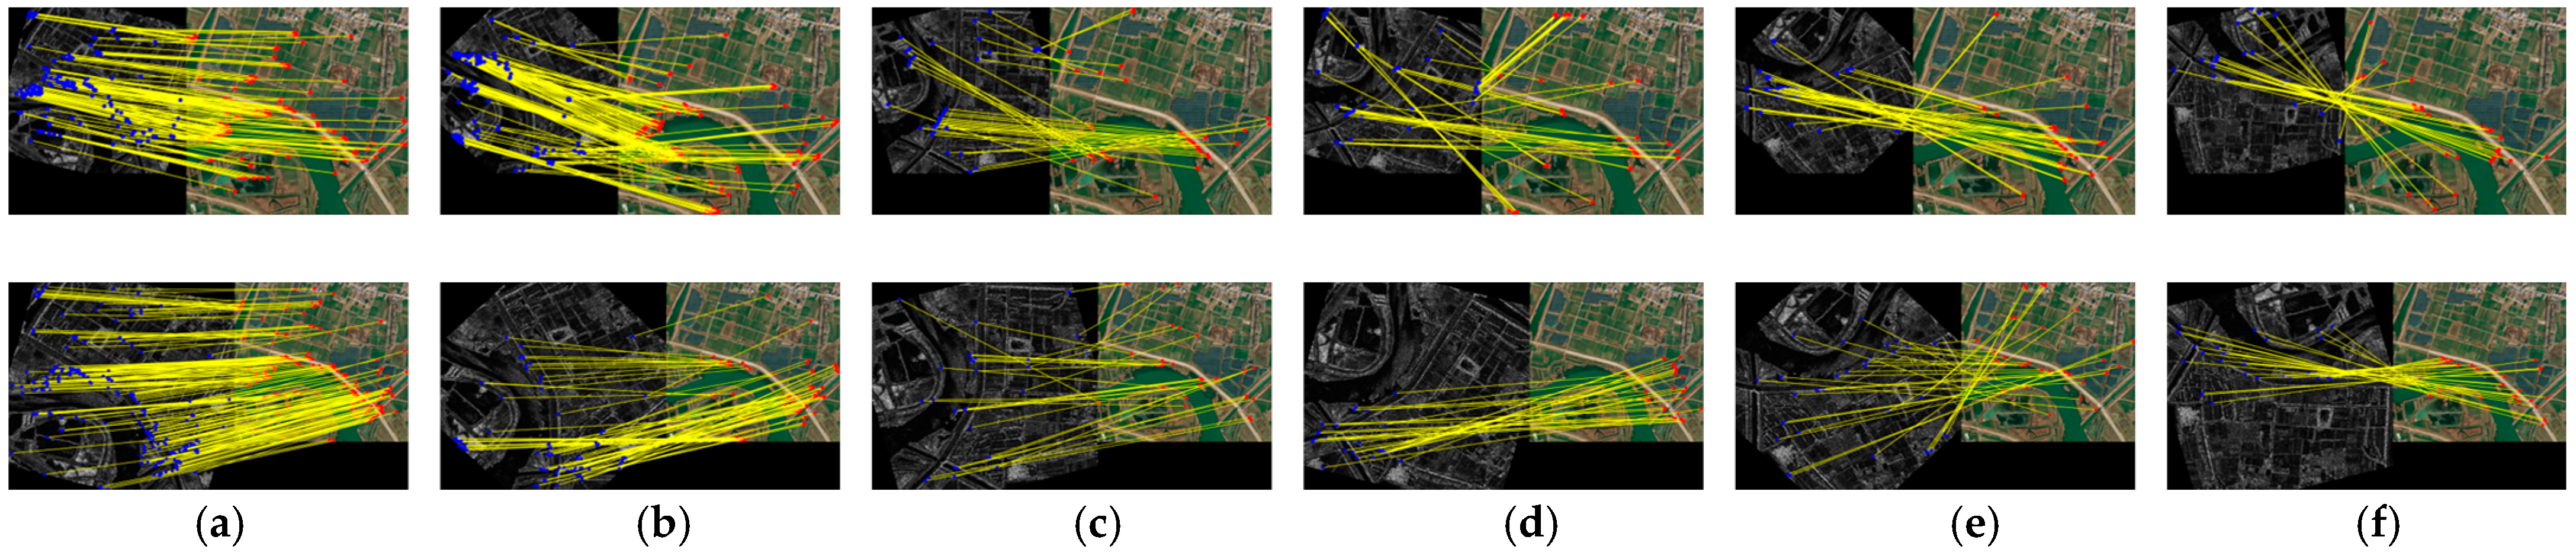
As shown in Figure 8, twelve pairs of sample images are randomly selected from four datasets for qualitative analysis of matching and image registration performance. Apart from GA(a)–(c), none of the remaining image pairs are completely aligned, and obvious rotational differences are present in GD(a)–(c). Furthermore, significant NRD is exhibited in all data. Therefore, it is challenging to achieve effective registration of these images. The visualization results of correct keypoint matching for each algorithm are further demonstrated in Figure 9 and Figure 10. It should be noted that the correct keypoints in the reference image are colored red, while the corresponding keypoints in the sensed image are colored blue. The correct correspondence between the two is indicated by yellow connecting lines. If there is no correct match (i.e., NCM = 0), the erroneous match is marked in cyan.
OS-SIFT is a classical OSIR algorithm based on gradient information. Among all comparative algorithms, the registration performance is only slightly superior to that of LNIFT on some data without significant rotation differences, and the robustness for registering images with significant rotational differences is insufficient. As noted in the literature [7], gradient features are sensitive to SAR speckle noise and NRD, and the texture information they represent is inadequate for addressing the substantial differences between multimodal images. The promotion in feature point repeatability of the OS-SIFT algorithm is largely constrained by the limitation, ultimately resulting in generally low NCM values in most cases.
HAPCG performs well on the first three data sets. However, it completely fails to perform effective registration on the GD sample data that exhibit significant rotational variations. The root cause of the issue lies in the estimation method for the dominant orientation [26]. The convolution response of the LG odd-symmetric filter in multiple directions is projected onto the X-axis and Y-axis to directly calculate the dominant orientation. Nevertheless, the issue of direction reversal may be introduced by the operation, leading to erroneous estimation of the dominant orientation and subsequently causing registration failure. Furthermore, similar to the OS-SIFT algorithm, the matching mechanism of HAPCG also lacks spatial constraint-based interference resistance, making erroneous associations highly likely to occur. The potential of both algorithms to achieve higher NCM on certain datasets, such as GC(b) and GC(c), is severely limited by the shared shortcoming in spatial constraint.
Ten out of twelve image pairs are successfully matched by LNIFT. Although the number of successful matches achieved by the algorithm is higher than that of HAPCG, it yields a significantly lower NCM than other algorithms in the majority of the data. The NCM in GB(c) is even at the critical threshold for transformed model estimation, which implies that the robustness and reliability of the registration are seriously insufficient [29]. This is primarily attributable to the fact that LNIFT performs registration based on high-frequency detail information. High-frequency information simultaneously not only contains valid structural features but is also heavily contaminated with noise, directly leading to an increase in erroneous feature points and thereby limiting subsequent matching and registration performance.
All sample data registrations are successfully achieved by RIFT2, with NCM outperforming other comparative algorithms in the majority of cases. The outstanding performance is primarily attributable to the ability of the PC to effectively capture the structural information within heterogeneous images. However, PC is susceptible to interference from localized strong NRD and speckle noise, and spurious structural responses may even be generated [15]. Hence, similar to the challenges faced by LNIFT, RIFT2 is insufficiently robust for certain images, such as GC(a).
The matching success rate of WSSF is consistent with RIFT2, and the NCM is superior to OS-SIFT, HAPCG, and LNIFT in almost all data. It is primarily due to the effective reinforcement of the common structural features through the machine learning-based edge confidence (EC) calculation. However, the value of NCM is significantly lower than that of RIFT2 for certain data, e.g., GB(b) and GD(a). It may be caused by the high texture similarity in certain local regions of the sample images, such as farmland, which interferes with the feature detection and matching process. Additionally, more complex characteristics are exhibited by SAR images. The speckle noise may require more attention during EC model training.
Compared to all previously mentioned algorithms, all data are successfully matched by the proposed algorithm, with the highest number of NCMs. Apparently, the best matching effect is achieved by the proposed algorithm. Meanwhile, a more intuitive view of the registration results is provided by the checkerboard images of the sample data in Figure 11. It is clear that most images align precisely with good continuity of edges and textures. Even images with significant rotational differences achieve excellent registration. The reason may be that the ability to resist strong local NRD and speckle noise is significantly enhanced by the designed structural detection method, ensuring the quality of feature point detection. Furthermore, a lot of potentially correct matching omissions are minimized through spatial and directional constraints. In summary, the greater applicability and robustness of the proposed algorithm in addressing the complex challenges of OSIR are demonstrated.

3.6. Quantitative Evaluations

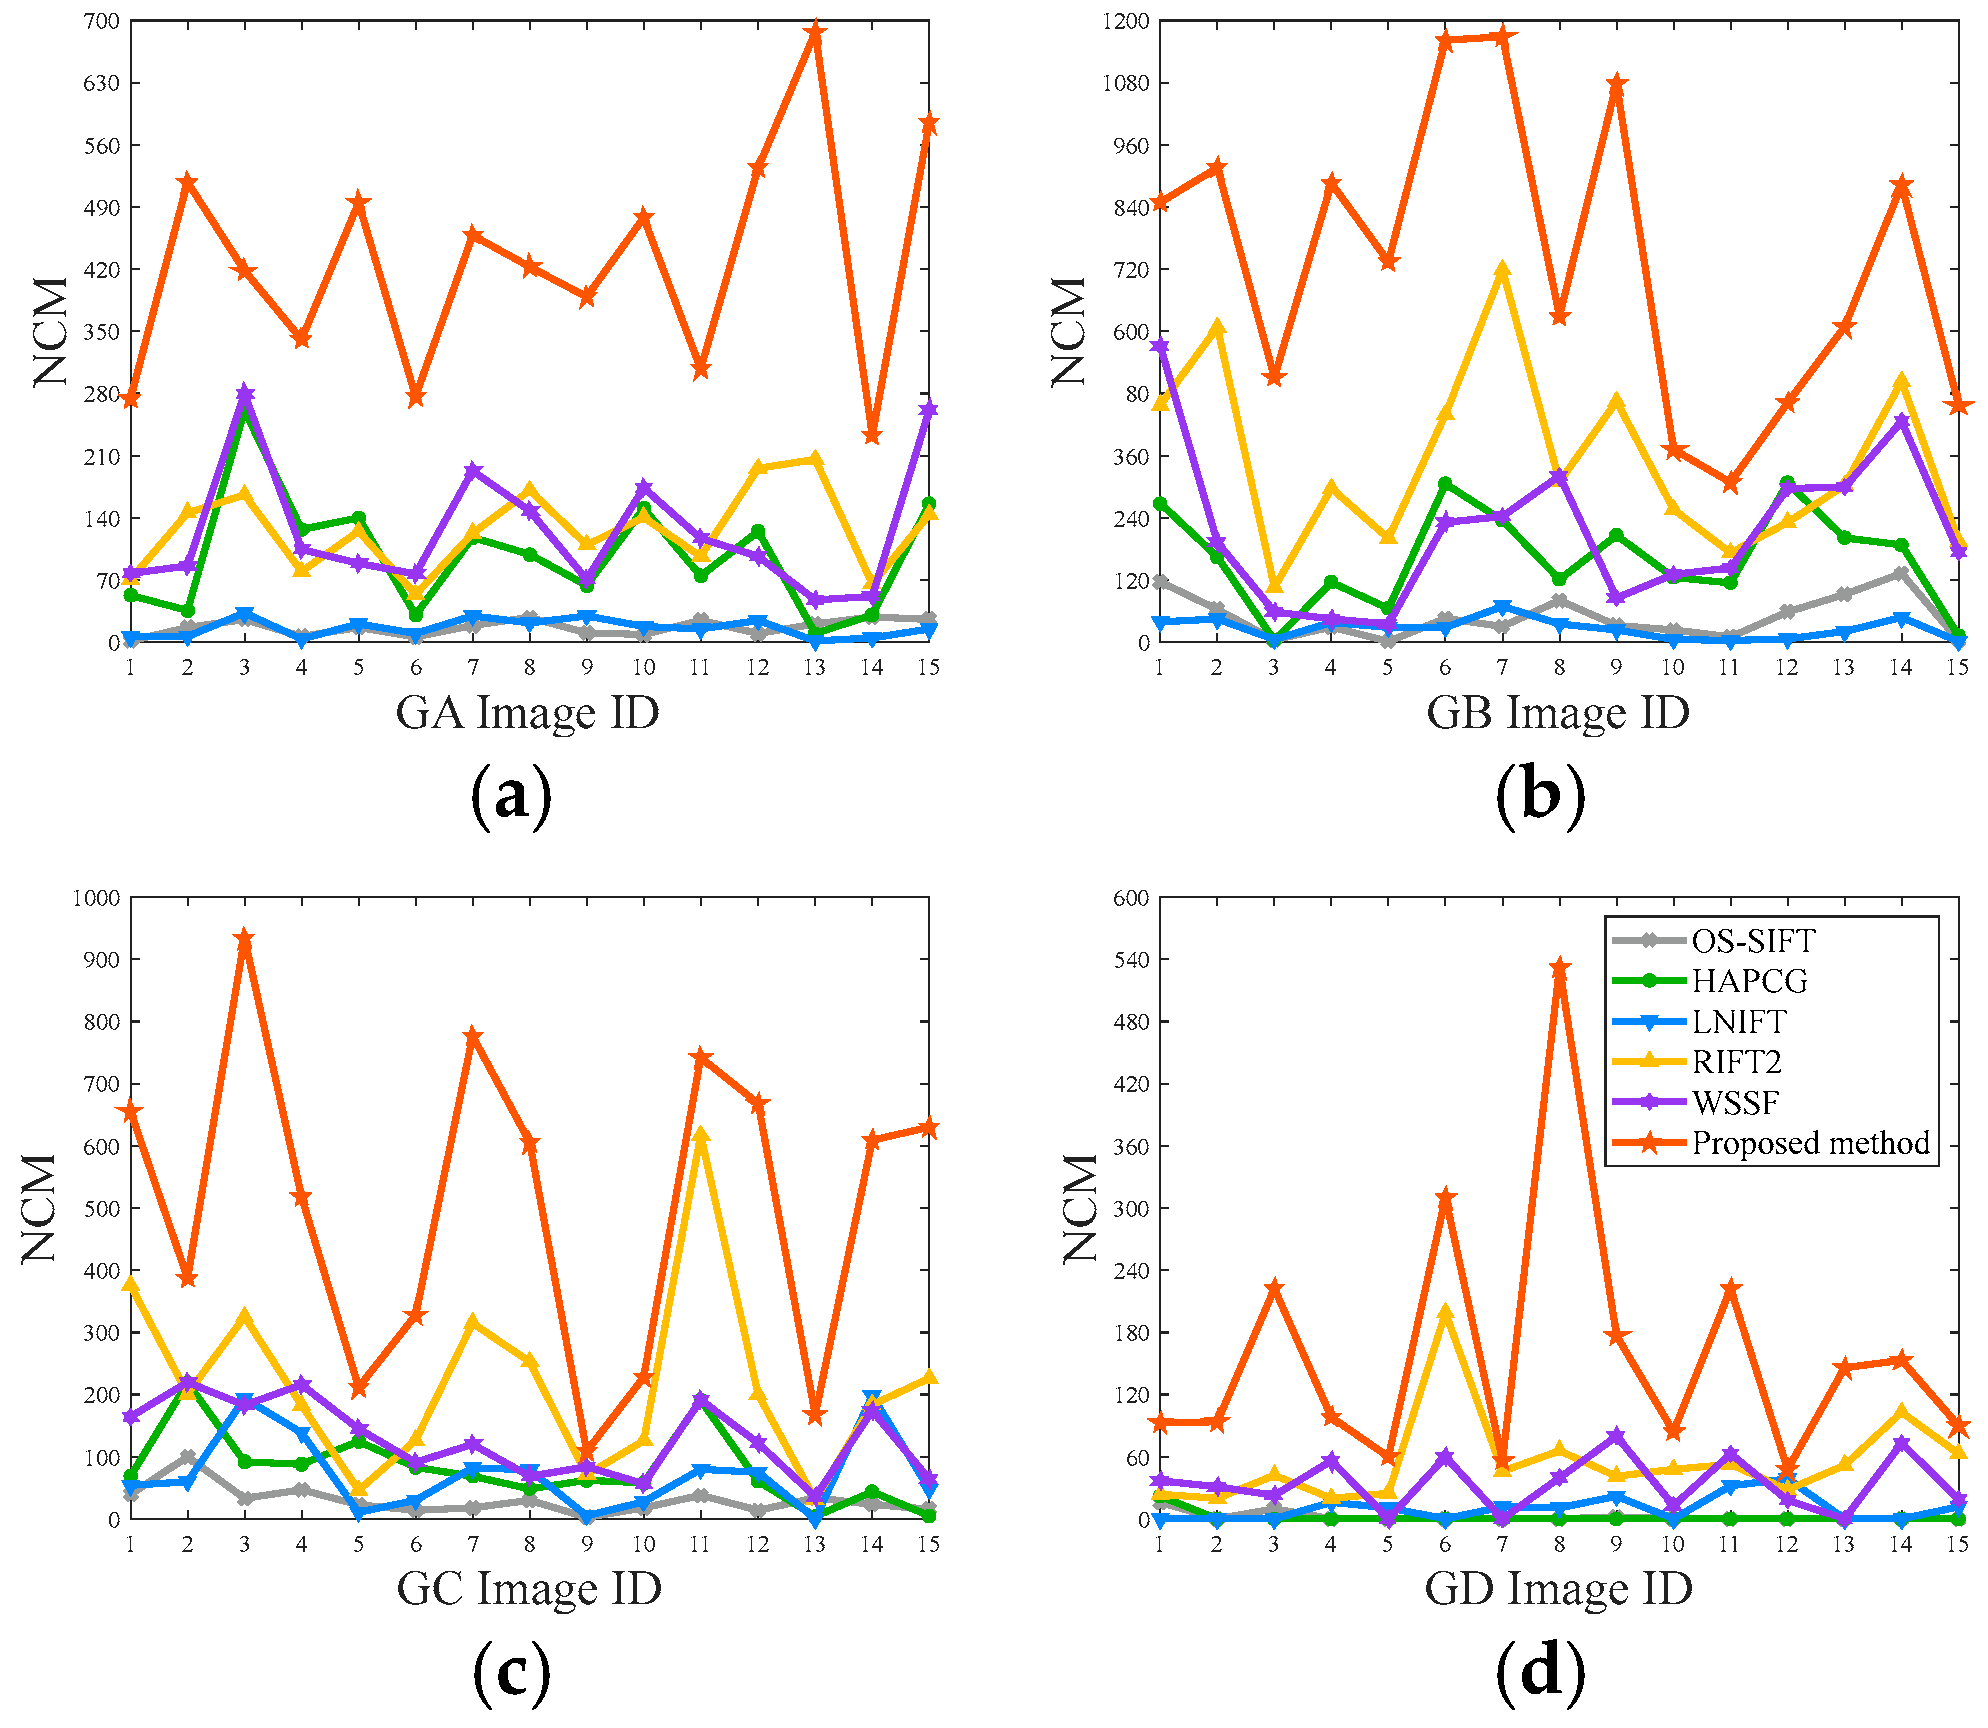
The average results of RMSE, NCM, NCR, and SR for all image data are shown in Table 6. The average values of each indicator across different datasets are listed in Table 7. Furthermore, to provide a more intuitive comparison of the registration effect, the quantitative comparison of NCM on the four datasets is presented in Figure 12. Generally, a smaller RMSE indicates higher registration accuracy, while NCM, NCR, and SR show the opposite trend [21,29].
According to the quantitative results in Table 6 and Table 7, OS-SIFT exhibited the highest number of images that failed to achieve successful registration, with an overall average SR of only 66.67%. Furthermore, it achieves the lowest NCR in the first three data sets and also lags relatively behind in the remaining metrics. OS-SIFT attempts to detect feature points through gradient calculation. However, since gradients are susceptible to noise interference, a significant number of unreliable outliers may also be detained for valid features, which directly limits the effective feature cardinality available for matching. Concurrently, the correct correspondences are difficult to fully screen out from these features by the matching method it employs. Consequently, the observed phenomena of low NCR and high matching failure rates can be directly explained.
Among other comparison algorithms, LNIFT significantly lags behind in performance across the first three datasets. Specifically, the worst results are achieved across nearly all key metrics, i.e., the highest RMSE and the lowest NCM and NCR, with no dataset achieving 100% successful registration. Despite the fact that LNIFT possesses rotational invariance, the SR on GD is only 53.33%, with RMSE exceeding 10, NCM below 15, and NCR below 5%. The presence of noise within the high-frequency detail information relied upon by LNIFT is corroborated by these results. Consequently, the accuracy and repeatability of feature points are inadequately supported, leading to constrained registration performance.
Compared to LNIFT, HAPCG performs well on GA with image pairs lacking significant rotation, achieving a success rate of 100%. It indicates that the NRD of heterogeneous images can be effectively countered by PC structural features. However, on GD data exhibiting obvious rotational differences, the algorithm largely fails: the SR is merely 6.67%, the RMSE exceeds 15, and the NCM drops to as low as 1.47. As previously mentioned, the direction reversal issue potentially introduced by its direction estimation mechanism is corroborated by the sharp decline in performance, leading to difficulties in establishing accurate correspondences between descriptors under rotational variations. Moreover, the insufficient location accuracy of feature points may be proven due to the sensitivity of the PC to speckle noise [15], resulting in an RMSE approaching 3 pixels even on GA. Also, the overall N C M a v e is only better than OS-SIFT and LNIFT due to the absence of spatial constraints.
A marked advantage is exhibited by RIFT2 over all comparison algorithms, which successfully achieves registration across all data and leads in most metrics. Specifically, the RMSE across all datasets is stable below 2.7 pixels. Among the five comparison algorithms, all achieve the highest number of NCMs. On the GD dataset, excellent performance is also demonstrated by the RIFT2 (i.e., NCM > 50, RMSE < 2.1, SR = 100%), which is significantly superior to the first three algorithms. The robustness performance is primarily attributable to the effective capture of cross-modal consistency structural information by PC [11]. However, the N C R a v e value is merely 15.25%. As noted in [15], the PC exhibits insufficient suppression of false structural responses induced by localized strong NRD and speckle noise. It would result in a decline in the quality of the feature point set, potentially introducing numerous erroneous associations into the subsequent matching process. It could also be the primary reason for the comparatively low NCM values in certain datasets, e.g., GA-6, GB-12, and GC-5, as illustrated in Figure 12.
The same S R as RIFT2 is achieved by WSSF across the first three datasets, with RMSE values outperforming RIFT2 in all groups. It shows that the structural enhancement strategy contributes to improving the registration accuracy. However, the NCM and NCR are mostly lower than RIFT2, and SR and NCR on GD are only 80% and 5.44%, respectively. It may stem from the following reasons. First, the ability of the EC model to generalize across scenarios may be insufficient, leading to reduced reliability in feature detection under complex scenarios. Second, as the original author points out, effective screening of feature points prior to matching is lacking, resulting in a set of feature points containing noise points directly entering the matching stage, which severely hampers the improvement of NCR performance.
The proposed algorithm significantly outperforms the comparison methods across nearly all evaluation metrics. In terms of accuracy, RMSE remains the lowest across all datasets, achieving an overall mean of 1.9999 pixels. An improvement of 19.85% over the suboptimal RIFT2 algorithm is achieved, and some images even attain sub-pixel level (i.e., less than 2 pixels) registration accuracy. In terms of quantity, the largest NCM value is obtained in the vast majority of data, as shown in Figure 12. The overall mean is 456.68, which is 2.43 times that of RIFT2. Moreover, the proposed algorithm has an N C R a v e of 23.55%. Although it is slightly below 20% on GD, it remains the highest value among all algorithms. N C R a v e is 73.16% and 54.43% improved over HAPCG and RIFT2, respectively, and 2.92 times and 2.67 times better than LNIFT and WSSF, respectively.
According to the NCM and NCR results, the proposed method achieves the highest NCM, while the absolute number of incorrect matches is also relatively large. This is mainly attributed to the fact that, in the fine matching stage, under the constraint of the initial transformation model H 1 , candidate optical correspondences are sought for all SAR feature points as extensively as possible. As a result, the matching cardinality is far larger than that of other methods, which only screen among the point pairs that have already been matched in the coarse matching stage. Under these circumstances, the absolute number of incorrect matches is also likely to increase as NCM increases significantly. Nevertheless, the improvement in NCM achieved by the proposed method is significantly greater than the increase in false matches. In other words, both NCM and NCR maintain superiority. Meanwhile, the superior registration performance of the proposed method is further validated by its lower RMSE.
In summary, the performance advantages can be attributed to the following two points. (1) RTV iterative residuals and NSCT are introduced as PC weighting factors. False features can be effectively suppressed, and structural consistency can be significantly enhanced, thereby reducing the impact of local strong SAR speckle noise and NRD on feature detection. (2) Dual constraints on space and direction are provided by the coarse-to-fine matching strategy. Interference from similar textures and complex backgrounds is effectively mitigated, and the issue of positional offset is overcome, thereby significantly increasing the NCM.

3.7. Ablation Analysis

To comprehensively evaluate the contribution of each improvement module to the performance of OSIR, ablation experiments are conducted on all 60 image pairs. Two core modules are incorporated within the proposed algorithm: RNW-PC (RPC) and WSC Matching (WM). Therefore, four different configurations are designed to verify the contributions of each module. According to the implementation code published in the RIFT2 paper, the traditional PC method is adopted by RIFT2 for feature detection, and the combination of NNDR and FSC (NF) is used as the matching strategy, thus serving as the baseline (BL) for the ablation experiments. The specific settings are as follows:
  • BL (Baseline): Conventional PC is adopted for feature detection, and NF is used for matching. This configuration is consistent with the implementation code provided by the original author of RIFT2, which serves as a baseline for performance comparison.
  • BL + RPC: Conventional PC is replaced by the proposed RNW-PC, while NF matching is retained to verify the independent performance of the new weighting factors.
  • BL + WM: NF matching is replaced by the proposed WSC, while conventional PC is retained to validate the performance improvement of the matching mechanism.
  • Ours (Full Model): The proposed complete algorithm, which integrates two improved modules to demonstrate the overall performance.
The comparison results of RMSE and NCM for the four configurations are shown in Table 8, from which the following conclusions can be drawn.
  • Independent validity of modules: The registration performance can be improved by introducing either RPC or WM.
  • Advantages of the complete scheme: The best performance is achieved by the complete algorithm, which integrates all improved modules. Compared with the BL, RMSE is improved by 19.85%, NCM is increased by 2.43 times, and the overall performance is the best.
In conclusion, all the improved modules proposed in the study make a positive contribution to the performance improvement, with the complete method achieving optimal results. The solid foundation is provided by the improved detection module for high-precision registration, and the optimized matching method ensures that the potential can be fully realized. The performance of the overall algorithm would be reduced by the removal of any module.


4. Discussion

4.1. Effects of Rotation and Scale Changes

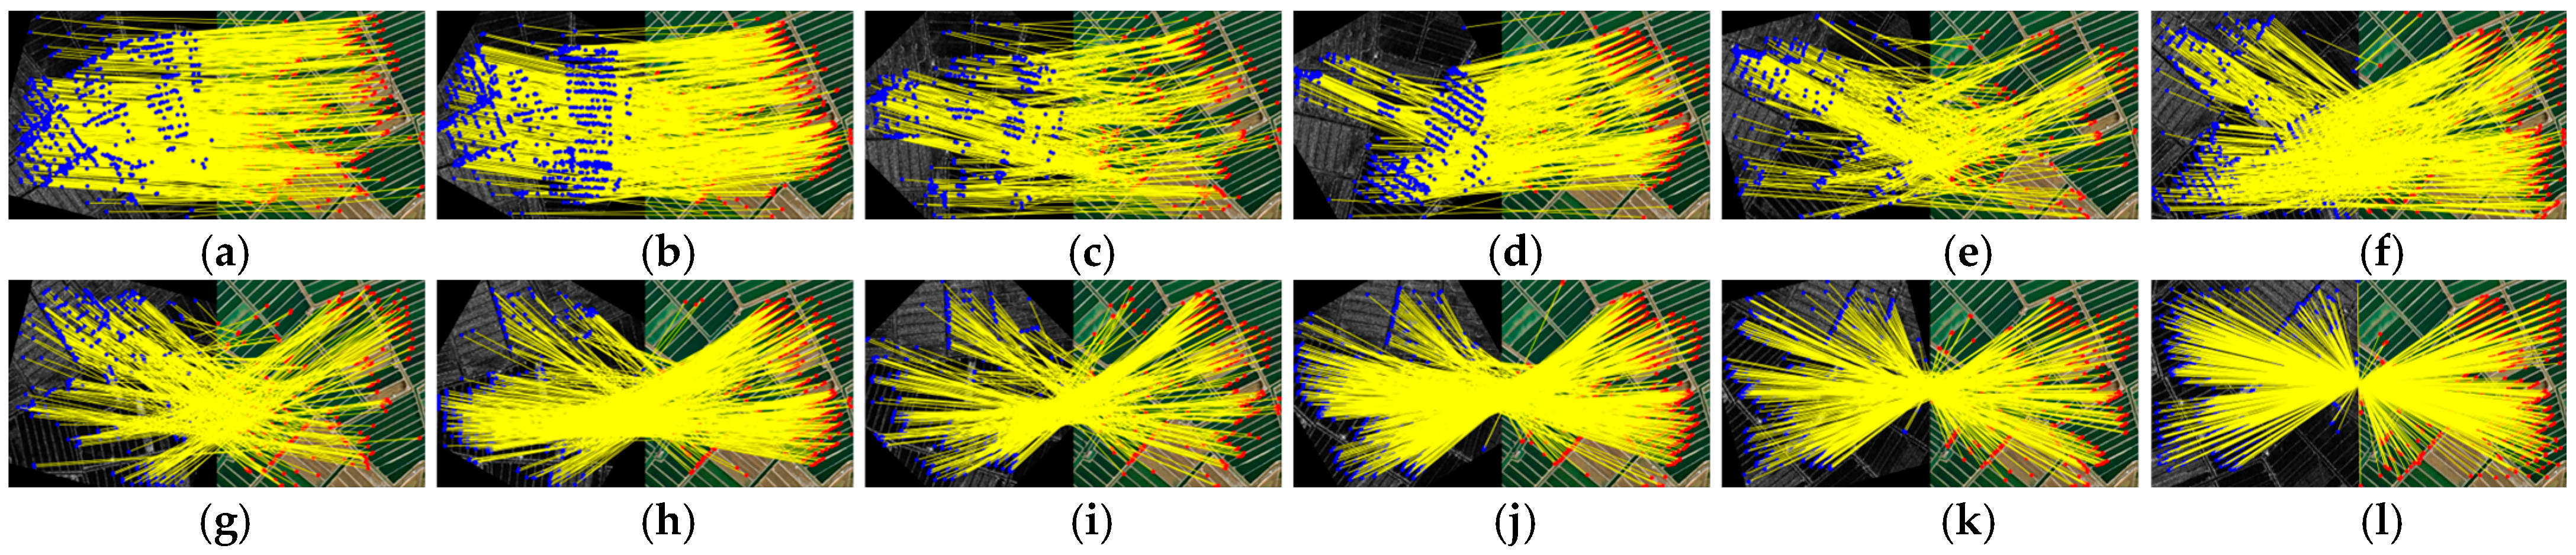
To comprehensively evaluate the performance of the proposed algorithm under rotation and scale variations, three pairs of images are selected for testing, with NCM used as the quantitative evaluation metric. The optical image is set as the reference image. In the rotation experiment, the SAR images are rotated clockwise in 15 ° increments to generate 12 perceptual images with distinct rotational variations. In the scale experiment, the SAR images are scaled within the range [0.8, 1.3] at intervals of 0.1, generating six perceptual images at different scales. Moreover, to further investigate the performance of the algorithm under the combined effects of rotation and scale variations, the boundary cases of scale variation (i.e., 0.8× and 1.3×) are selected. Each is tested in combination with rotation angles of 15 ° , 45 ° , 75 ° , 105 ° , 135 ° , 165 ° . The visualization results of feature point matching are shown in Figure 13, Figure 14 and Figure 15, and the NCM statistical results are summarized in Table 9, Table 10 and Table 11.
Experimental results show that, in terms of rotational discrepancies, effective matching is achieved by the proposed algorithm across all 12 tested rotation angles. In particular, since the angular interval of the LGF employed in PC is set to 30 ° , non-integer multiples of 30 ° , such as 15 ° and 45 ° , are located within the transition regions between adjacent filter orientations, where the directional response is relatively ambiguous, posing a severe challenge to rotation invariance. However, even under such challenging conditions, over 300 correct matches are retained, validating the strong robustness to significant rotation differences. In terms of scale differences, successful matching is accomplished for all six image pairs. Although the NCM decreases as the scale difference increases, over 200 correct matches are still preserved at scale factors of 0.8 and 1.3, indicating a favorable tolerance within a certain range. Under the combined effect of both rotation and scale differences, all combinations are successfully matched. Even in the most adverse case with a scale factor of 1.3 and a rotation angle of 165 ° , over 30 correct matches are maintained, verifying that the rotation invariance of the algorithm can be effectively preserved while a certain degree of scale variation is tolerated.
It should be noted that a rotation invariance module is incorporated in the proposed method, whereas no scale space is constructed to explicitly handle significant scale differences. In practical remote sensing image registration tasks, significant scale differences can typically be corrected in advance with the aid of auxiliary data such as geographic prior information and ground resolution, and the image pairs can even be adjusted to a state where only translational differences remain [16,39]. Therefore, with the integration of existing auxiliary technologies, the applicable scope of the proposed algorithm can be effectively extended to cover registration scenarios involving both rotation and scale differences.

4.2. Running Time Analysis

The average runtime of each method across all data is summarized in Table 12. All experiments were processed by MATLAB R2021b on a computer with an Intel Core Ultra 9 275HX CPU and 32.0 GB of RAM.
Under the premise that the number of feature points detected is kept roughly consistent, the longest running time is incurred by the proposed method, which is approximately 23.94% higher than that of RIFT2. The main reasons can be summarized as follows. First, compared to gradient-based methods, PC calculations are more complex [27]. Second, the computation of the structural confidence map and the coarse-to-fine two-stage matching strategy are introduced in the proposed method, where additional time overhead is brought by the RTV iteration and the descriptor construction process. Furthermore, extra computational burden is also introduced by the estimation of the dominant orientation. However, the primary focus of this paper is on improving registration accuracy. While these modules increase the computational load, the proposed method significantly outperforms RIFT2, which ranks second in overall performance, across all three metrics: NCM, NCR, and RMSE. Furthermore, this computational burden can be effectively alleviated through engineering techniques such as GPU parallel acceleration and descriptor dimensionality reduction.
In summary, the proposed method can be applied to downstream tasks that require offline fine fusion and mapping of multi-sensor data. Taking earthquake disaster assessment as an example, rotation differences are often introduced between pre-earthquake optical images and post-earthquake SAR images due to different viewing angles. In addition, accurate geo-referencing information is difficult to acquire for real-time SAR imagery under severe post-disaster weather conditions and unreliable satellite navigation signals. Hence, the resolution can be first unified by auxiliary data such as ground sampling distance, and then high-precision rotation-invariant registration can be accomplished by the proposed method without geographical priors. After registration, the spatial extent of secondary disasters such as building collapse, road damage, and landslides can be precisely compared, and reliable data support can be provided for emergency response and loss assessment.

5. Conclusions

In this paper, a high-precision rotation-invariant OSIR algorithm is proposed, which combines structure-confidence-weighted PC with WSC matching. In feature detection, the pseudo-structures caused by noise in SAR images can be effectively suppressed by the designed RNW-PC model, whilst cross-modal consistency features can be enhanced, thereby significantly improving the repeatability of feature points detected based on the Max-M. In WSC matching, interference caused by similar textures and complex backgrounds is effectively mitigated by the spatial constraints established during the coarse matching phase. The scaled window descriptors and cosine similarity introduced in the fine-matching process serve as directional constraints, thereby further mitigating the issue of positional offset. Through this dual safeguard, NCM is significantly increased. Experimental results across multiple datasets demonstrate that the proposed method outperforms current state-of-the-art point feature-based algorithms in both the number of correctly matched points and registration accuracy.
The primary limitation of the proposed method lies in the fact that it is not yet sufficiently considered for large-scale variations. Consequently, subsequent work will focus on integrating scale invariance into the existing workflow and improving computational efficiency through engineering optimization. Meanwhile, more flexible unsupervised feature learning strategies are also being explored to further expand the applications.

Author Contributions

Conceptualization, Z.L. and S.T.; methodology, Z.L. and J.H.; software, Z.L.; validation, Z.L.; formal analysis, Z.L., J.H. and C.J.; investigation, Z.L., W.W. and Z.H.; resources, S.T. and L.Z.; writing—original draft preparation, Z.L.; writing—review and editing, Z.L., J.H., C.J. and W.W.; visualization, Z.L.; funding acquisition, S.T. All authors have read and agreed to the published version of the manuscript.

Funding

This research was funded in part by the National Natural Science Foundation of China under Grants 61971329, 61701393, and 61671361, in part by the Natural Science Basic Research Plan in Shaanxi Province of China under Grant 2020ZDLGY02-08.

Data Availability Statement

The public datasets used in this study are available from publicly accessible repositories. In-house data are available on request from the corresponding author.

Conflicts of Interest

The authors declare no conflicts of interest.

References

  1. Sun, X.; Zuo, Z.; Guo, X.; Li, X.; Zhou, P.; Guo, R.; Su, S. A coarse-to-fine optical-SAR image registration algorithm for UAV-based multi-sensor systems using geographic information constraints and cross-modal feature consistency mapping. Remote Sens. 2026, 18, 683. [Google Scholar] [CrossRef]
  2. Chen, Z.; Zhang, X.; Xu, X.; Chen, H.; Mi, X.; Yang, J. Registration-aware cross-modal interaction network for optical and SAR images. Inf. Fusion 2025, 123, 103278. [Google Scholar] [CrossRef]
  3. Quan, Y.; Zhang, R.; Li, J.; Ji, S.; Guo, H.; Yu, A. Learning SAR-optical cross modal features for land cover classification. Remote Sens. 2024, 16, 431. [Google Scholar] [CrossRef]
  4. Wang, T.-L.; Jin, Y.-Q. Postearthquake building damage assessment using multi-mutual information from pre-event optical image and postevent SAR image. IEEE Geosci. Remote Sens. Lett. 2012, 9, 452–456. [Google Scholar] [CrossRef]
  5. Cao, M.; Yan, Q.; Yu, Y.; Zhao, H.; Lyu, Z. MLV: Robust image matching via multilayer verification. IEEE Sens. J. 2024, 24, 14454–14470. [Google Scholar] [CrossRef]
  6. Wei, L.; Xie, F.; Chen, J.; Chu, F.; Zhang, Z.; Yi, M. EF-GLOH: An efficient visible and infrared image matching algorithm based on phase congruency and gradient enhancement. IEEE Sens. J. 2025, 25, 8433–8445. [Google Scholar] [CrossRef]
  7. Wan, G.; Ye, Z.; Xu, Y.; Huang, R.; Zhou, Y.; Xie, H.; Tong, X. Multimodal remote sensing image matching based on weighted structure saliency feature. IEEE Trans. Geosci. Remote Sens. 2024, 62, 4700816. [Google Scholar] [CrossRef]
  8. Geng, Z.; Yang, B.; Pi, Y.; Fan, Z.; Dong, Y.; Huang, K.; Wang, M. MIRRIFT: Multimodal image rotation and resolution invariant feature transformation. IEEE Trans. Geosci. Remote Sens. 2025, 63, 4703316. [Google Scholar] [CrossRef]
  9. Zhang, X.; Wang, Y.; Liu, J.; Wang, S.; Zhang, C.; Liu, H. Robust coarse-to-fine registration algorithm for optical and SAR images based on two novel multiscale and multidirectional features. IEEE Trans. Geosci. Remote Sens. 2024, 62, 5215126. [Google Scholar] [CrossRef]
  10. Lv, N.; Han, Z.; Zhou, H.; Chen, C.; Wan, S.; Su, T. Prominent structure-guided feature representation for SAR and optical image registration. IEEE Geosci. Remote Sens. Lett. 2024, 21, 4010805. [Google Scholar] [CrossRef]
  11. Li, J.; Hu, Q.; Ai, M. RIFT: Multi-modal image matching based on radiation-variation insensitive feature transform. IEEE Trans. Image Process. 2020, 29, 3296–3310. [Google Scholar] [CrossRef]
  12. Tu, H.; Zhu, Y.; Han, C. RI-LPOH: Rotation-invariant local phase orientation histogram for multi-modal image matching. Remote Sens. 2022, 14, 4228. [Google Scholar] [CrossRef]
  13. Xie, Z.; Zhang, W.; Wang, L.; Zhou, J.; Li, Z. Optical and SAR image registration based on the phase congruency framework. Appl. Sci. 2023, 13, 5887. [Google Scholar] [CrossRef]
  14. Kovesi, P. Phase congruency: A low-level image invariant. Psychol. Res. 2000, 64, 136–148. [Google Scholar] [CrossRef] [PubMed]
  15. Xiang, Y.; Tao, R.; Wang, F.; You, H.; Han, B. Automatic registration of optical and SAR images via improved phase congruency model. IEEE J. Sel. Top. Appl. Earth Obs. Remote Sens. 2020, 13, 5847–5861. [Google Scholar] [CrossRef]
  16. Wang, L.; Sun, M.; Liu, J.; Cao, L.; Ma, G. A robust algorithm based on phase congruency for optical and SAR image registration in suburban areas. Remote Sens. 2020, 12, 3339. [Google Scholar] [CrossRef]
  17. Zhou, Y.; Han, Z.; Dou, Z.; Huang, C.; Cong, L.; Lv, N.; Chen, C. Edge consistency feature extraction method for multi-source image registration. Remote Sens. 2023, 15, 5051. [Google Scholar] [CrossRef]
  18. Pang, S.; Ge, J.; Hu, L.; Guo, K.; Zheng, Y.; Zheng, C.; Zhang, W.; Liang, J. RTV-SIFT: Harnessing structure information for robust optical and sar image registration. Remote Sens. 2023, 15, 4476. [Google Scholar] [CrossRef]
  19. Zhang, X.; Wang, Y.; Liu, H. Robust optical and SAR image registration based on OS-SIFT and cascaded sample consensus. IEEE Geosci. Remote Sens. Lett. 2022, 19, 4011605. [Google Scholar] [CrossRef]
  20. Yao, Y.; Zhang, Y.; Wan, Y.; Liu, X.; Yan, X.; Li, J. Multi-modal remote sensing image matching considering co-occurrence filter. IEEE Trans. Image Process. 2022, 31, 2584–2597. [Google Scholar] [CrossRef] [PubMed]
  21. Yu, Q.; Ni, D.; Jiang, Y.; Yan, Y.; An, J.; Sun, T. Universal SAR and optical image registration via a novel SIFT framework based on nonlinear diffusion and a polar spatial-frequency descriptor. ISPRS J. Photogramm. Remote Sens. 2021, 171, 1–17. [Google Scholar] [CrossRef]
  22. Xiang, Y.; Wang, F.; You, H. OS-SIFT: A robust SIFT-Like algorithm for high-resolution optical-to-SAR image registration in suburban areas. IEEE Trans. Geosci. Remote Sens. 2018, 56, 3078–3090. [Google Scholar] [CrossRef]
  23. Quan, D.; Wei, H.; Wang, S.; Lei, R.; Duan, B.; Li, Y.; Hou, B.; Jiao, L. Self-distillation feature learning network for optical and SAR image registration. IEEE Trans. Geosci. Remote Sens. 2022, 60, 4706718. [Google Scholar] [CrossRef]
  24. Ye, H.; Zhang, S.; Li, L.; Meng, X. An unsupervised domain adversarial wavelet learning method for registration of optical and SAR heterogeneous remote sensing images. In Proceedings of the IEEE International Conference on Signal, Information and Data Processing (ICSIDP), Zhuhai, China, 22–24 November 2024. [Google Scholar]
  25. Yuan, X.; Li, Z.; Hu, Q.; Li, J. Cascaded homography-constrained local feature matching for optical and SAR images. IEEE J. Sel. Top. Appl. Earth Obs. Remote Sens. 2025, 18, 7829–7842. [Google Scholar] [CrossRef]
  26. Huang, J.; Yang, F.; Chai, L. Multimodal remote sensing image registration based on adaptive spectrum congruency. IEEE J. Sel. Top. Appl. Earth Obs. Remote Sens. 2024, 17, 14965–14981. [Google Scholar] [CrossRef]
  27. Fan, J.; Xiong, Q.; Li, J.; Ye, Y. Robust registration of optical and SAR images using multi-orientation relative total variation structural representation. IEEE J. Sel. Top. Appl. Earth Obs. Remote Sens. 2023, 16, 9320–9335. [Google Scholar] [CrossRef]
  28. Yao, Y.; Zhang, Y.; Wan, Y.; Liu, X.; Guo, H. Heterologous images matching considering anisotropic weighted moment and absolute phase orientation. Geomat. Inf. Sci. Wuhan Univ. 2021, 46, 1727–1736. [Google Scholar]
  29. Li, J.; Xu, W.; Shi, P.; Zhang, Y.; Hu, Q. LNIFT: Locally normalized image for rotation invariant multimodal feature matching. IEEE Trans. Geosci. Remote Sens. 2022, 60, 5621314. [Google Scholar] [CrossRef]
  30. Li, J.; Shi, P.; Hu, Q.; Zhang, Y. RIFT2: Speeding-up RIFT with a new rotation-invariance technique. arXiv 2023, arXiv:2303.00319. [Google Scholar]
  31. Xiong, X.; Jin, G.; Xu, Q.; Zhang, H.; Wang, L.; Wu, K. Robust registration algorithm for optical and SAR images based on adjacent self-similarity feature. IEEE Trans. Geosci. Remote Sens. 2022, 60, 5233117. [Google Scholar] [CrossRef]
  32. Wang, L.; Xiang, Y.; You, H.; Qiu, X.; Fu, K. A robust multiscale edge detection method for accurate SAR image registration. IEEE Geosci. Remote Sens. Lett. 2023, 20, 4006305. [Google Scholar] [CrossRef]
  33. Lv, S.; Man, T.; Zhang, W.; Wan, Y. High quality underwater computational ghost imaging based on speckle decomposition and fusion of reconstructed images. Opt. Commun. 2024, 561, 130460. [Google Scholar] [CrossRef]
  34. Xu, L.; Yan, Q.; Xia, Y.; Jia, J. Structure extraction from texture via relative total variation. Assoc. Comput. Mach. Trans. Graph. 2012, 31, 139. [Google Scholar] [CrossRef]
  35. Rosten, E.; Porter, R.; Drummond, T. Faster and better: A machine learning approach to corner detection. IEEE Trans. Pattern Anal. Mach. Intell. 2010, 32, 105–119. [Google Scholar] [CrossRef] [PubMed]
  36. Gong, M.; Zhao, S.; Jiao, L.; Tian, D.; Wang, S. A novel coarse-to-fine scheme for automatic image registration based on SIFT and mutual information. IEEE Trans. Geosci. Remote Sens. 2014, 52, 4328–4338. [Google Scholar] [CrossRef]
  37. Zhang, W.; Zhao, R.; Yao, Y.; Wan, Y.; Wu, P.; Li, J.; Li, Y.; Zhang, Y. Multi-resolution SAR and optical remote sensing image registration methods: A review, datasets, and future perspectives. arXiv 2025, arXiv:2502.01002. [Google Scholar]
  38. SIMD: Self-Similarity Index Map for Multi-Modal Remote Sensing Image Matching. Available online: https://skyearth.org/publication/project/SIMD/ (accessed on 22 May 2026).
  39. Paul, S.B.; Pati, U.C. High-resolution optical-to-SAR image registration using mutual information and SPSA optimisation. IET Image Process. 2021, 15, 1319–1331. [Google Scholar]
Figure 1. Comparison of PC results. (a) Original SAR image; (b) PC with σ = 0 . 1 ; (c) PC with σ = 0 . 3 ; (d) PC with σ = 0 . 6 .
Remotesensing 18 02322 g001
Figure 2. Framework of the devised registration algorithm.
Remotesensing 18 02322 g002
Figure 3. RTV residual cumulative results. (a) and (b) represent the three-dimensional surface representations of SAR-RA and Optical-RA, respectively. (c) and (d) represent the two-dimensional pseudo-color images of SAR-RA and Optical-RA, respectively. (e) is the original optical image.
Remotesensing 18 02322 g003
Figure 4. Weighting factors and RNW-PC results (the first row shows the results of the SAR image, while the second row displays the results of the optical image). (a) Sigmoid weighting factor of traditional PC ( o = 4 as an example). (b) Weighting factor of RNW-PC. (c) Structure detection results based on RNW-PC.
Remotesensing 18 02322 g004
Figure 5. Illustration of coarse-to-fine matching. The red circles represent the neighborhoods determined by the spatial constraint. Lines represent matching relationships.
Remotesensing 18 02322 g005
Figure 6. Repeatability rate comparison of sample data.
Remotesensing 18 02322 g006
Figure 7. NCM under different noise levels.
Remotesensing 18 02322 g007
Figure 8. Sample data (a1c4). Numbers 1–4 denote Groups A–D from top to bottom; letters a–c denote the three sample pairs within each group. Subfigures (a1c1) show the three sample pairs for Group A; (a2c2) for Group B; (a3c3) for Group C; and (a4c4) for Group D.
Remotesensing 18 02322 g008
Figure 9. Matching results for the sample data in GA and GB. From top to bottom, the order is: OS-SIFT, HAPCG, LNIFT, RIFT2, WSSF, and the method proposed. From left to right are the sample data from GA and GB.
Remotesensing 18 02322 g009aRemotesensing 18 02322 g009b
Figure 10. Matching results for the sample data in GC and GD. From top to bottom, the order is: OS-SIFT, HAPCG, LNIFT, RIFT2, WSSF, and the method proposed. From left to right are the sample data from GC and GD.
Remotesensing 18 02322 g010
Figure 11. Checkerboard registration result for all sample images.
Remotesensing 18 02322 g011
Figure 12. NCM comparison for each pair of images. (a) GA; (b) GB; (c) GC; (d) GD.
Remotesensing 18 02322 g012
Figure 13. Feature matching results of the proposed method under different rotation variations. (a) 15 ° , (b) 30 ° , (c) 45 ° , (d) 60 ° , (e) 75 ° , (f) 90 ° , (g) 105 ° , (h) 120 ° , (i) 135 ° , (j) 150 ° , (k) 165 ° , (l) 180 ° .
Remotesensing 18 02322 g013
Figure 14. Feature matching results of the proposed method under different scale variations. (a) 0.8×, (b) 0.9×, (c) 1.0×, (d) 1.1×, (e) 1.2×, (f) 1.3×.
Remotesensing 18 02322 g014
Figure 15. Feature matching results of the proposed method under different scale and rotation variations. The scale difference for the first row is 0.8×, the second row is 1.3×. (a) 15 ° , (b) 45 ° , (c) 75 ° , (d) 105 ° , (e) 135 ° , (f) 165 ° .
Remotesensing 18 02322 g015
Table 1. Critical parameter settings.
ParametersVariableFixed Parameters
λ λ = 0.005 , 0.01 , 0.015 , 0.02 σ r = 8 ,   D N = 3
σ r σ r = 6 , 7 , 8 , 9 , 10 λ = 0.01 ,   D N = 3
D N D N = 2 , 3 , 4 , 5 λ = 0.01 ,   σ r = 8
Table 2. Average NCM variation with λ .
Parameters λ , σ r = 8 , D N = 3
0.0050.010.0150.02
NCM441.9452.1432.8429.9
Table 3. Average NCM variation with σ r .
Parameters σ r , λ = 0.01 , D N = 3
678910
NCM421.4428.2452.1431.2415.8
Table 4. Average NCM variation with D N .
Parameters D N , λ = 0.01 , σ r = 8
2345
NCM426.3452.1418.8411.8
Table 5. Evaluation result of feature detection.
MethodRepeatability Rate R γ (%)
RIFT2 detector45.72
RNW-PC detector50.01
Table 6. Average results of all data on four metrics.
MetricMethod
OS-SIFTHAPCGLNIFTRIFT2WSSFProposed
S R a v e (%)66.6771.6768.3310095100
R M S E ave 8.98277.75398.19342.49513.36821.9999
N C M a v e 24.4486.0031.45187.92126.42456.68
N C R a v e (%)3.3313.608.0715.258.8223.55
Table 7. Average results of each group on four metrics.
DataMetricMethod
OS-SIFTHAPCGLNIFTRIFT2WSSFProposed
ASR (%)73.3310066.67100100100
RMSE (pixels)7.59982.88698.52642.62172.51242.0533
NCM16.8798.4716.2126.4125.13427.87
NCR (%)2.4316.757.5013.288.1725.96
BSR (%) 86.6793.3366.67100100100
RMSE (pixels)6.31473.99658.58052.67542.56062.0597
NCM48.87162.827.07351.2217.2735.13
NCR (%)6.3222.9610.0223.6112.8626.28
CSR (%)93.3386.6786.67100100100
RMSE (pixels)4.29785.28995.15912.62812.57431.9996
NCM30.1381.2772.2218.73129.13504.73
NCR (%)4.1214.3310.6716.798.8222.94
DSR (%)13.336.6753.3310080100
RMSE (pixels)17.718518.842110.50752.05525.82601.8872
NCM1.871.4710.3355.3334.2159
NCR (%)0.440.374.097.315.4419.02
Table 8. Results of ablation study.
MethodMetric
RMSE (Pixels)NCM
BL2.4951187.92
BL + RPC2.2380236.97
BL + DM2.3464389.75
Ours1.9999456.68
Table 9. NCM at different rotation angles.
Angle15°30°45°60°75°90°105°120°135°150°165°180°
NCM654821370506324603328462321575386647
Table 10. NCM at different scales.
Scale0.80.911.11.21.3
NCM239639656625494256
Table 11. NCM at different scales and rotation angles.
ScaleRotation Angle
15°45°75°105°135°165°
0.814512334403832
1.32058432333433
Table 12. Average running time of different algorithms across all data.
MethodOS-SIFTHAPCGLNIFTRIFT2WSSFProposed
Time (s)16.31306.14395.048567.228210.132383.3222
Disclaimer/Publisher’s Note: The statements, opinions and data contained in all publications are solely those of the individual author(s) and contributor(s) and not of MDPI and/or the editor(s). MDPI and/or the editor(s) disclaim responsibility for any injury to people or property resulting from any ideas, methods, instructions or products referred to in the content.