4.1. Influential Factors of Three-Dimensional Vertical Morphology in BTH
The Moran’s I test for spatial autocorrelation shows that only Period 4 (2011–2014) exhibits a significant negative Moran’s I (−0.693,
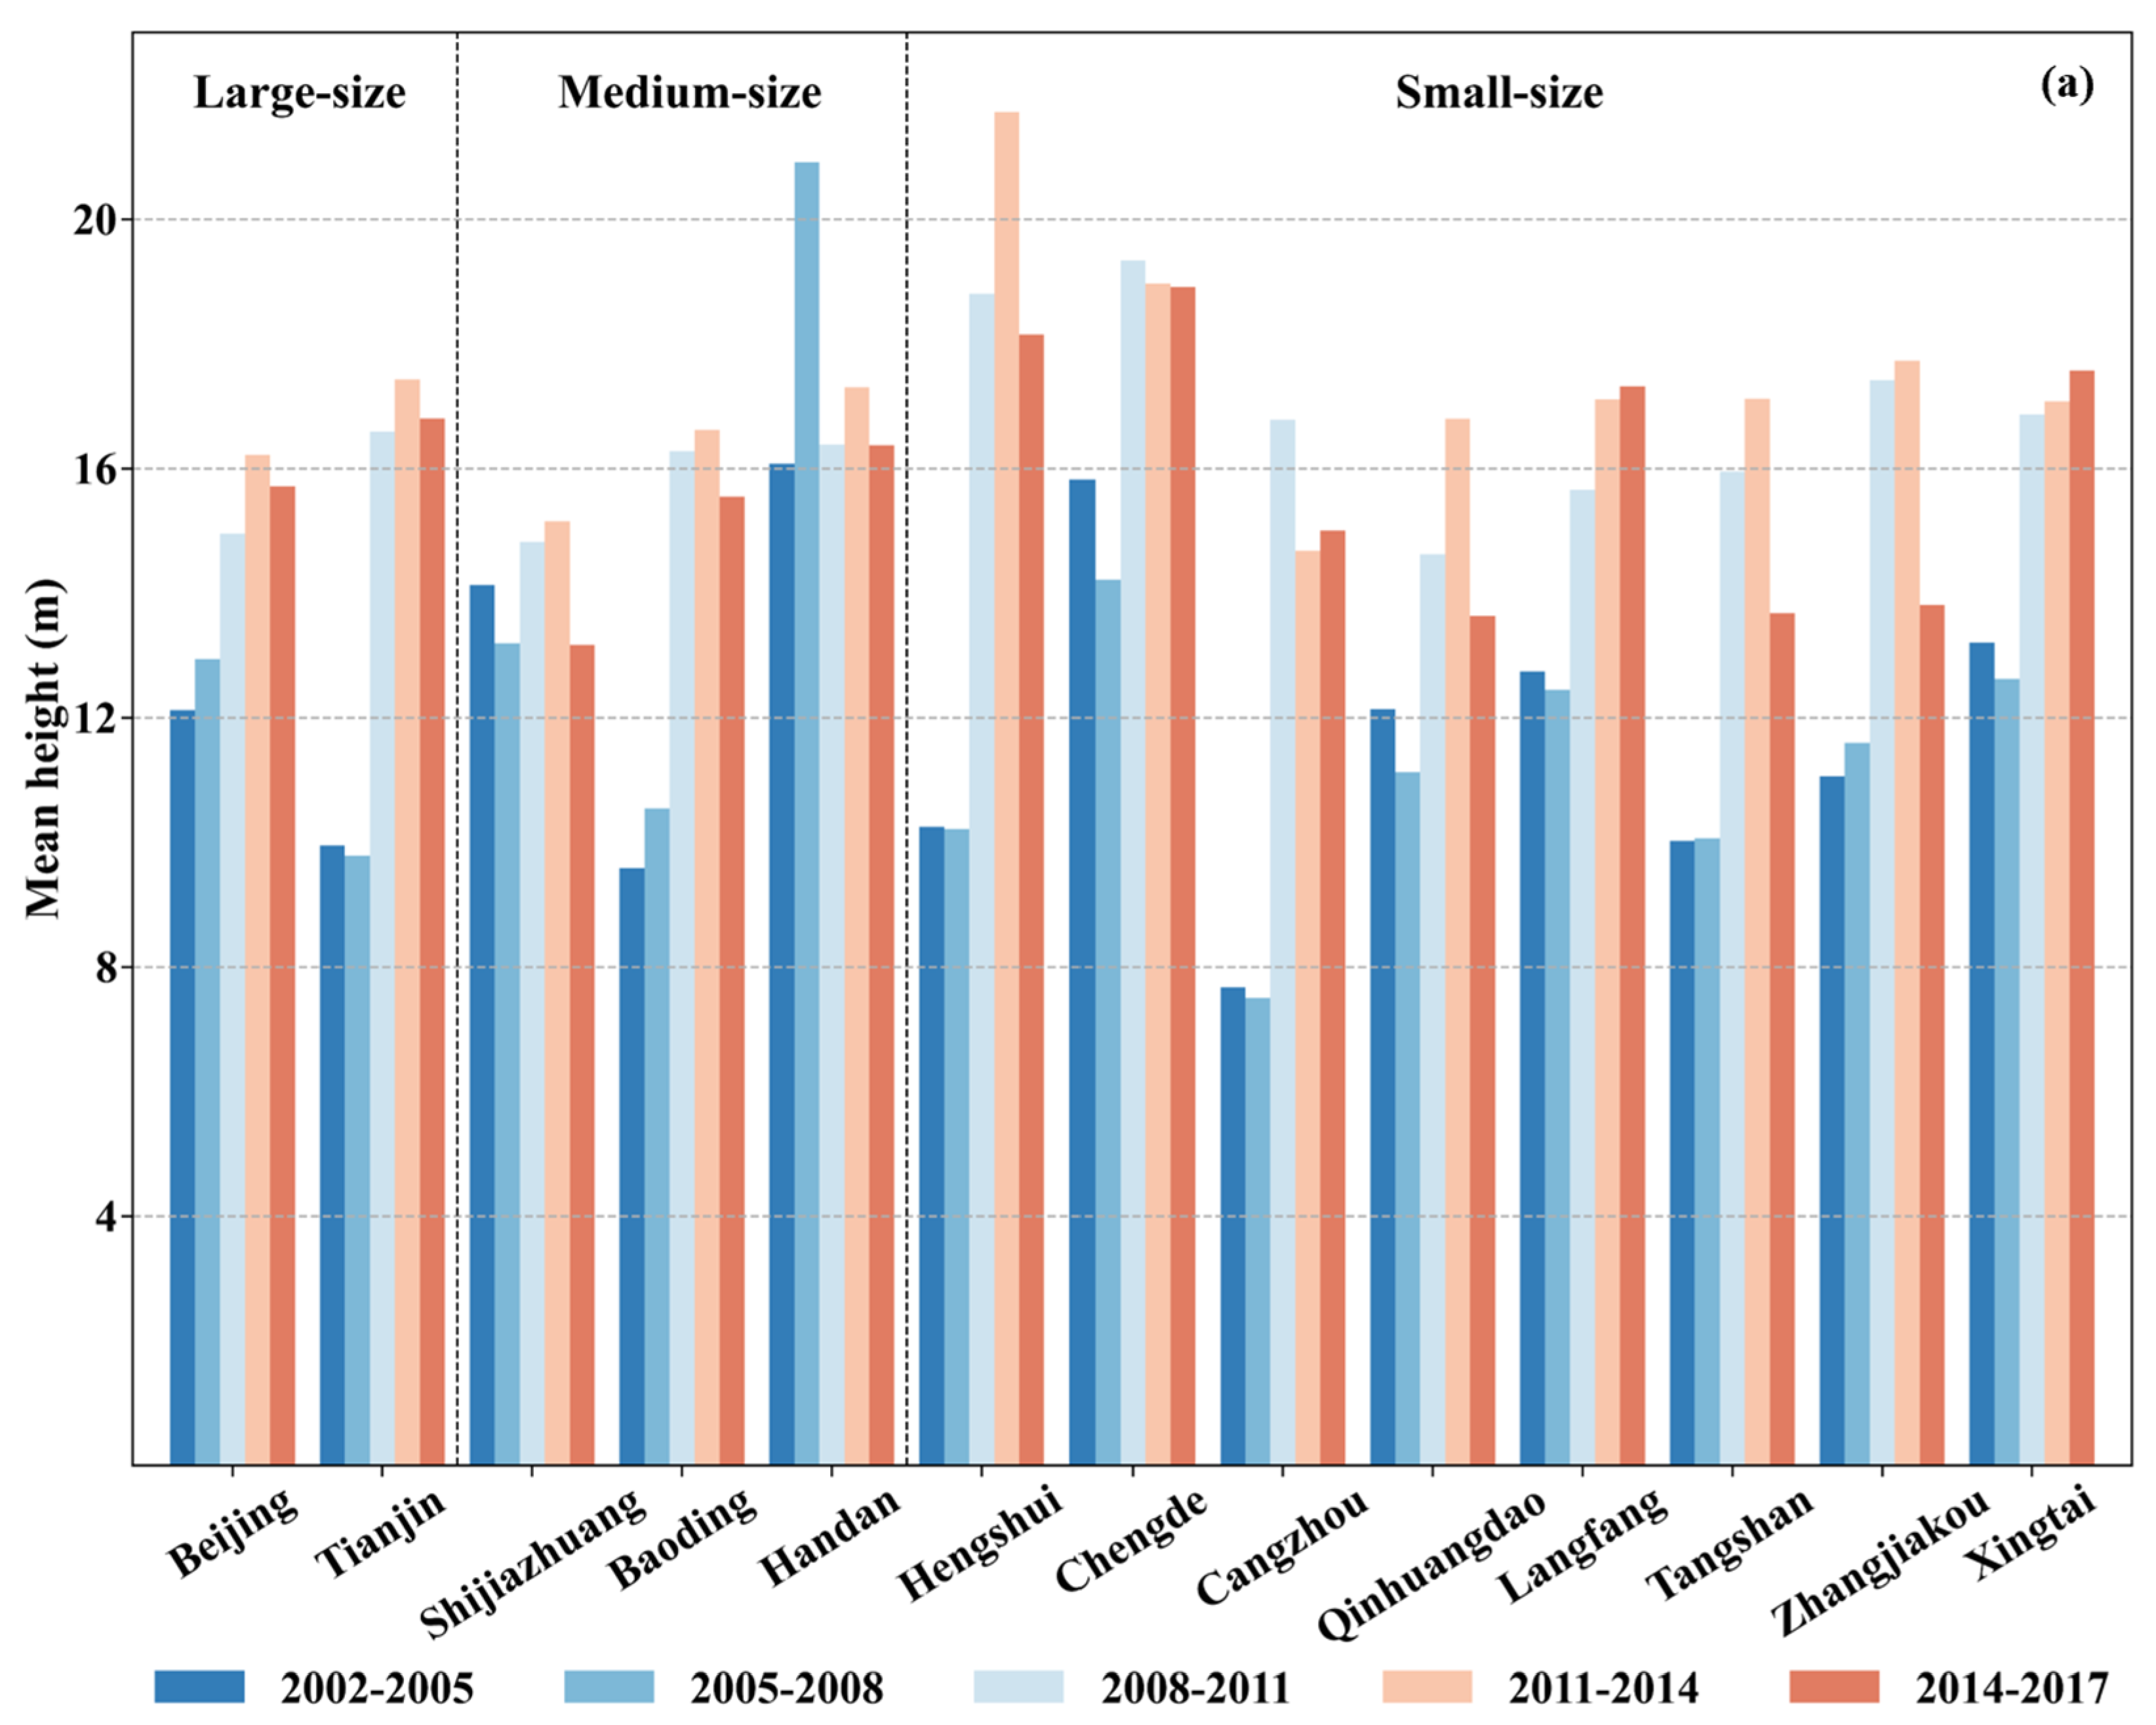
p < 0.01), indicating a “high-low” alternating spatial pattern of newly built building heights, which is consistent with our finding (
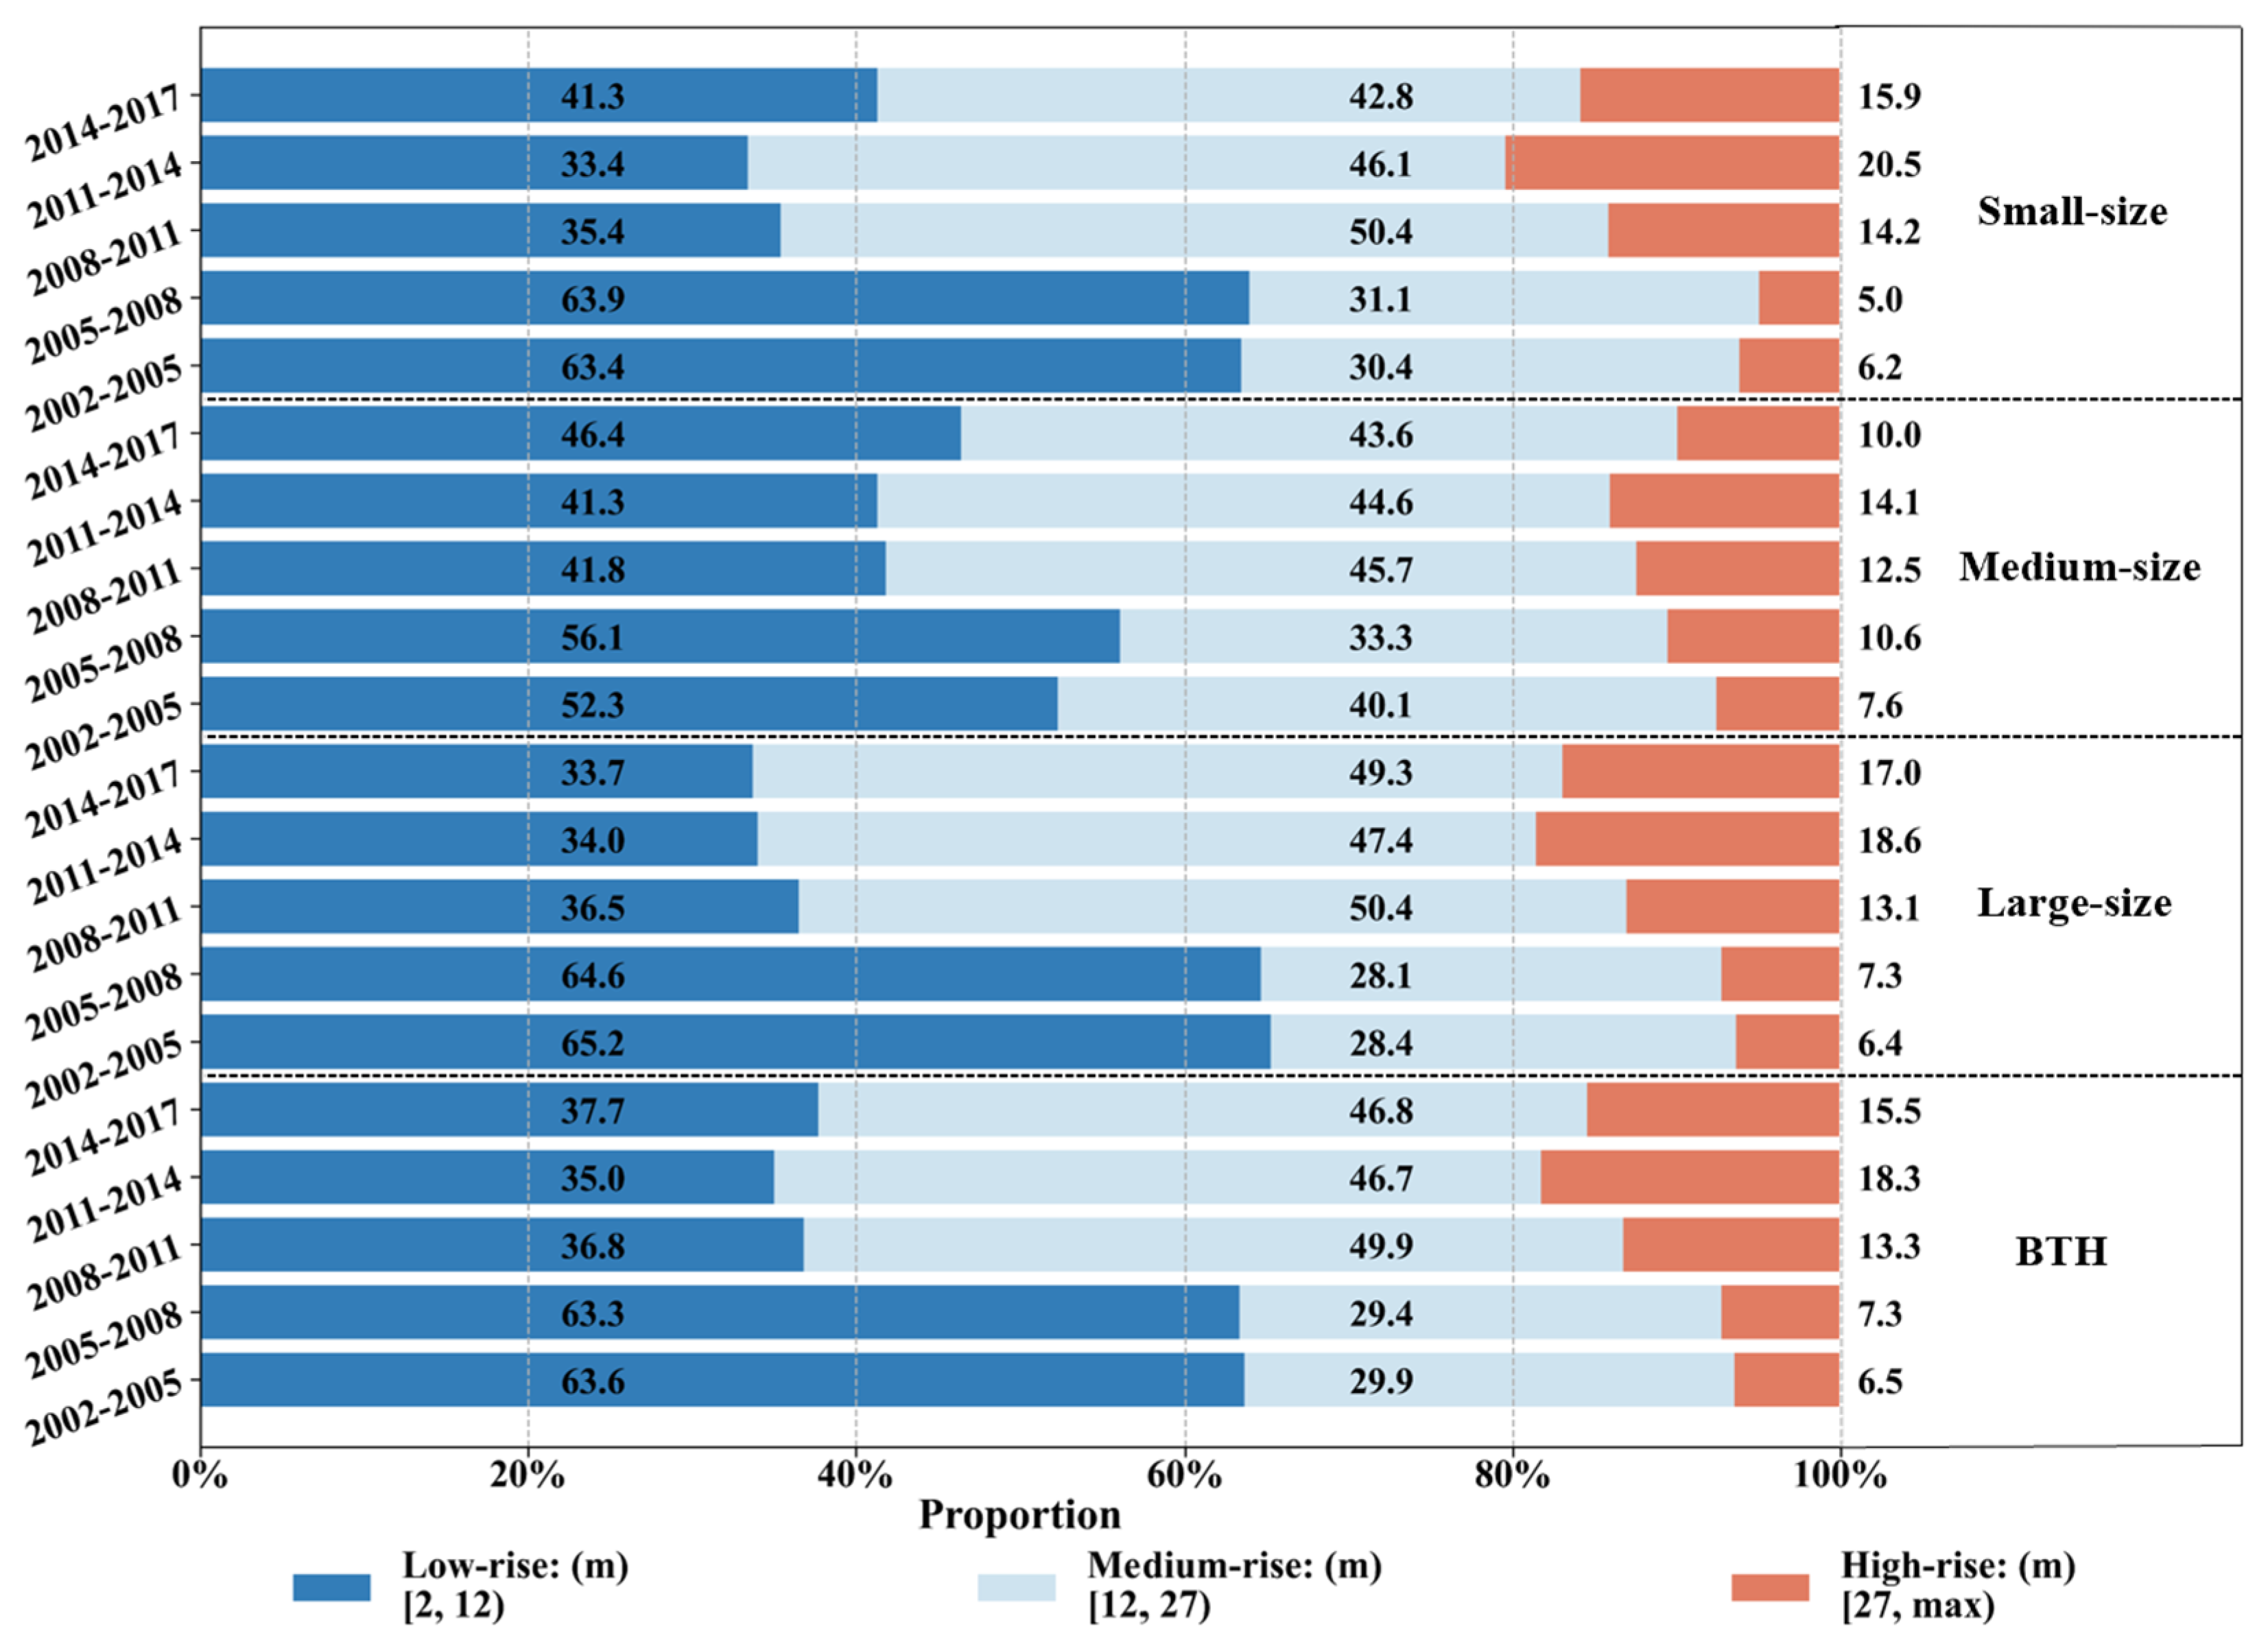
Figure 6) that new buildings in small cities were generally higher than those in large and medium-sized cities during this period. This negative correlation can likely be explained from two perspectives: building height regulation and urban development. First, strict height limits and historic preservation policies in major cities like Beijing have restricted the height of new buildings, whereas smaller cities face fewer such restrictions. Moreover, as these smaller cities were undergoing rapid urban development during this period, they prioritized high-rise development to create urban landmarks. Second, large cities enforce stricter floor area ratio (FAR) controls than small cities, while Hebei is vigorously promoting new-style urbanization, allowing for increased FAR in new development zones to encourage high-rise construction. At the same time, the concept of the “Beijing Metropolitan Economic Circle” has been gaining increasing attention during this period. Expectations regarding housing prices have risen in the small cities and county towns surrounding Beijing, and developers have tended to boost property values by constructing high-rise buildings. Small cities have primarily focused on urban development centered around high-rise construction projects. Consequently, new buildings in small and medium-sized cities tend to be taller, while those in large cities are not as tall as those in smaller cities, resulting in a “high-low” contrast characterized by negative spatial autocorrelation. Although this significant spatial effect is limited to a single phase and is not a universal characteristic across the entire cycle, and given the context of height restriction policies and urban development as revealed by the heterogeneity analysis, this spatial anomaly appears to be a temporary phenomenon. However, it is important to note that this negative spatial autocorrelation may still have a potential impact on the overall panel regression results. Specifically, if this spatial pattern of alternating high and low building heights in new construction is driven primarily by factors such as land marketization and industrial structure, ignoring this spatial characteristic could lead to biased assessments of the statistical significance of key variables. In future research, we should strive to address this issue.
For new urban construction sites, a complicated multifactorial ground cover type, there is still a deficiency in change detection research [
54], and the extraction of building heights for newly constructed sites is even less studied. Our results show that there is a negative correlation between Total population and urban sprawl, whereas, in previous studies, the population factor plays an important positive driving role [
49,
55,
56]). Population growth urgently requires cities to increase their capacity to accommodate residents, and areas with higher building heights can provide a greater number of dwellings to meet housing demand [
57]. When the rate of land expansion does not match the rate of population increase, urban land expansion requires a shift from low density to compactness [
58], one manifestation of which is an increase in building heights [
59]. The size of the urban population should be the underlying cause of urban expansion [
60]. However, we find that in each period, the total population of medium-sized and small cities increases slowly or remains unchanged or even shows a decreasing posture, while the built-up area is mostly in a state of continuous increase, indicating that the rate of land expansion in small and medium-sized cities has not been slower than the rate of population increases. At the same time, in large cities, there may be a marginal effect: when the population density exceeds a certain threshold, its effect on building heights is attenuated [
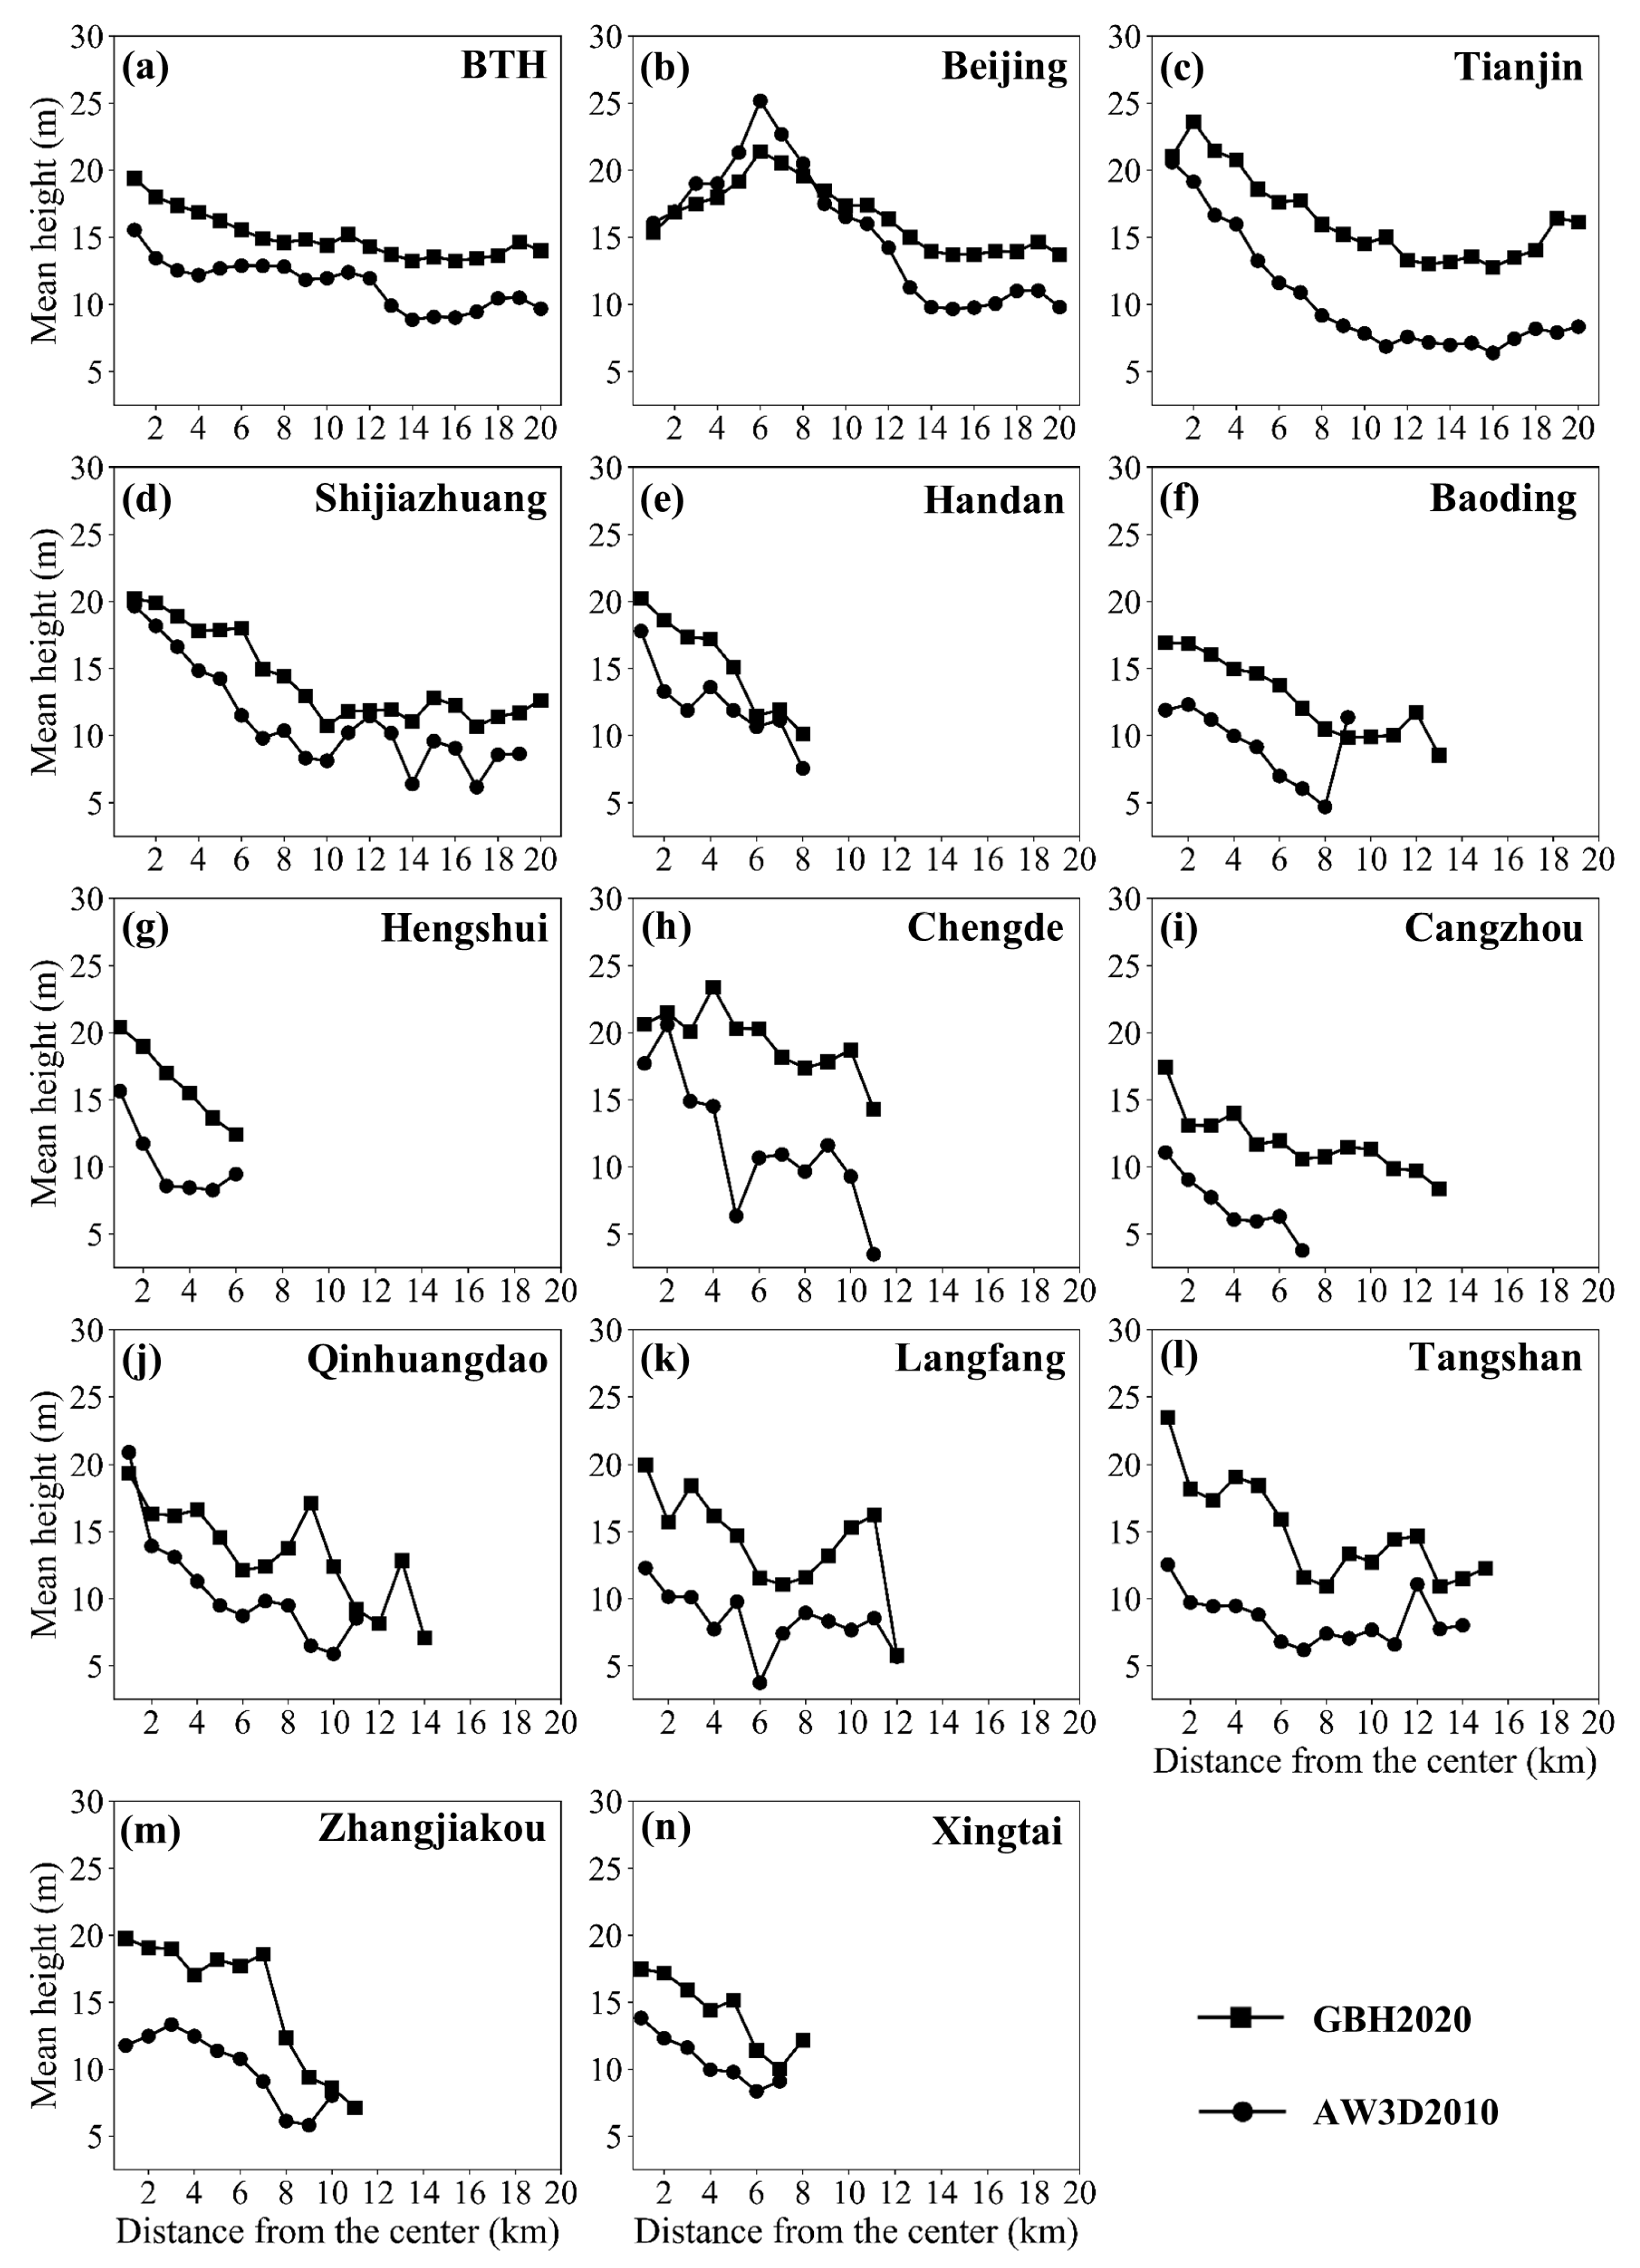
57]. On the other hand, based on the results of the concentric ring analysis shown in
Figure 4 and previous studies, at the beginning of the study, the study area has already experienced the emergence of many new cities and new districts in the form of enclave expansion [
58]. The expansion rate of the main urban areas of large cities is significantly faster than that of other cities [
61], and the earlier start of urbanization, the bigger the original building land area [
62]. During the period under study, large cities expanded at a slower rate, mainly in suburban areas, while small and medium-sized cities showed medium- to high-speed expansion, with expansion areas close to urban centers [
62]. At this time, a large number of people from small and medium-sized cities in Hebei province flowed into Beijing and Tianjin, and there were signs of population flow from small cities to medium-sized cities in Hebei province [
63]. At the same time, the inflow of people from large cities was mainly concentrated near urban centers [
64]. While the population of large cities increases, the height of new buildings in the suburbs is not high; the population of small and medium-sized cities remains unchanged or decreases, but the height of new buildings in the city center is higher, which leads to a negative correlation between population and the height of new buildings.
Analyzed in terms of economy, industrial structure is significantly and positively correlated with the height of new buildings in the city. This is largely consistent with the findings of previous studies on the relationship between industrial structure and urban sprawl, both at the two- and three-dimensional levels [
32,
65,
66,
67]. In the study interval, the value added by the tertiary industry in most cities has increased faster than that of the secondary industry, which means that the BTH region has gradually become more industrialized and the tertiary industry has flourished in recent years. This continuous optimization and upgrading of the industrial structure intrinsically affect the change of building land [
68], which is manifested in the shift in consumption from subsistence consumption to a stage of developmental and enjoyment-based consumption [
69], which leads to more and more high-rise buildings such as offices, financial centers, and high-rise housing, and a higher mean value of the height of new buildings. Office buildings and financial centers, which primarily serve the tertiary sector, are typically located near a city’s CBD. As shown by the results of our concentric ring analysis (
Figure 4), areas closer to the city center generally have higher average building heights. At the same time, the variation in building heights in city centers of small and medium-sized cities over the past decade has been significant. This may be because, compared to large cities, the tertiary sector in small and medium-sized cities had a lower baseline in 2010 but experienced rapid growth over the decade, resulting in a larger height disparity. This also confirms the positive role of industrial structure in the development of new building land. The actual per capita GDP, on the other hand, is weak and insignificant in this study, which is inconsistent with most of the studies [
55,
70]. Conventionally, regional gross domestic product (GDP) is treated as a core proxy for regional economic development. Economically advanced regions tend to invest in high-rise construction, implying an expected positive correlation between per capita GDP and newly built building height. Nevertheless, Gao et al. [
22] documented that the linkage between GDP and construction land scale remains relatively weak even if statistically significant, demonstrating that such correlation is inherently susceptible to research scope and time frame as an objective feature of the variables themselves. On this substantive ground, one plausible reason for the insignificant coefficient in our linear regression is that the real nexus between GDP and new building height may follow a nonlinear pattern across the BTH region; the adoption of a linear empirical framework therefore fails to capture such nonlinear association and yields an insignificant coefficient. Future studies could adopt nonlinear modeling to further examine the GDP-building height nexus.
As a factor that is the focus of this study, the development of the land market exhibits a strong positive association with the three-dimensional vertical form of the city. This is generally consistent with the results of previous studies [
32,
71]. Land marketization has driven the functional differentiation of urban land use, and the business and service functions of urban centers have been intensified, resulting in the formation of central business districts (CBDs) lined with employment and commercial centers [
72], which has led to a rise in the height of new buildings. This result, however, is not quite the same as most previous studies describing the drivers of urban sprawl from a two-dimensional perspective [
7,
19,
22,
23,
24]. These studies generally agree that the development of land marketization will promote the intensive use of urban land and inhibit urban sprawl, but this is a conclusion based on the horizontal sprawl of the city, and as mentioned earlier, the horizontal and vertical sprawl of the city are related, but it does not mean that they can be discussed in the same way. As the level of land marketization increases, land users will consciously improve the intensive use of land, and land grantors will optimize the efficiency of land resource allocation under the influence of competition and price mechanisms [
22], which will make land resources limited and challenging. To overcome this challenge, cities have shifted their goals and directions from rapid development to efficient development [
73], and this has led to strategies and paths that have transferred from incremental expansion to stock optimization, resulting in a development pattern that makes full use of the vertical space of the city [
74]. This is manifested in the fact that the development of land marketization has had an inhibiting effect on the horizontal expansion of cities, while it is positively correlated with vertical expansion.
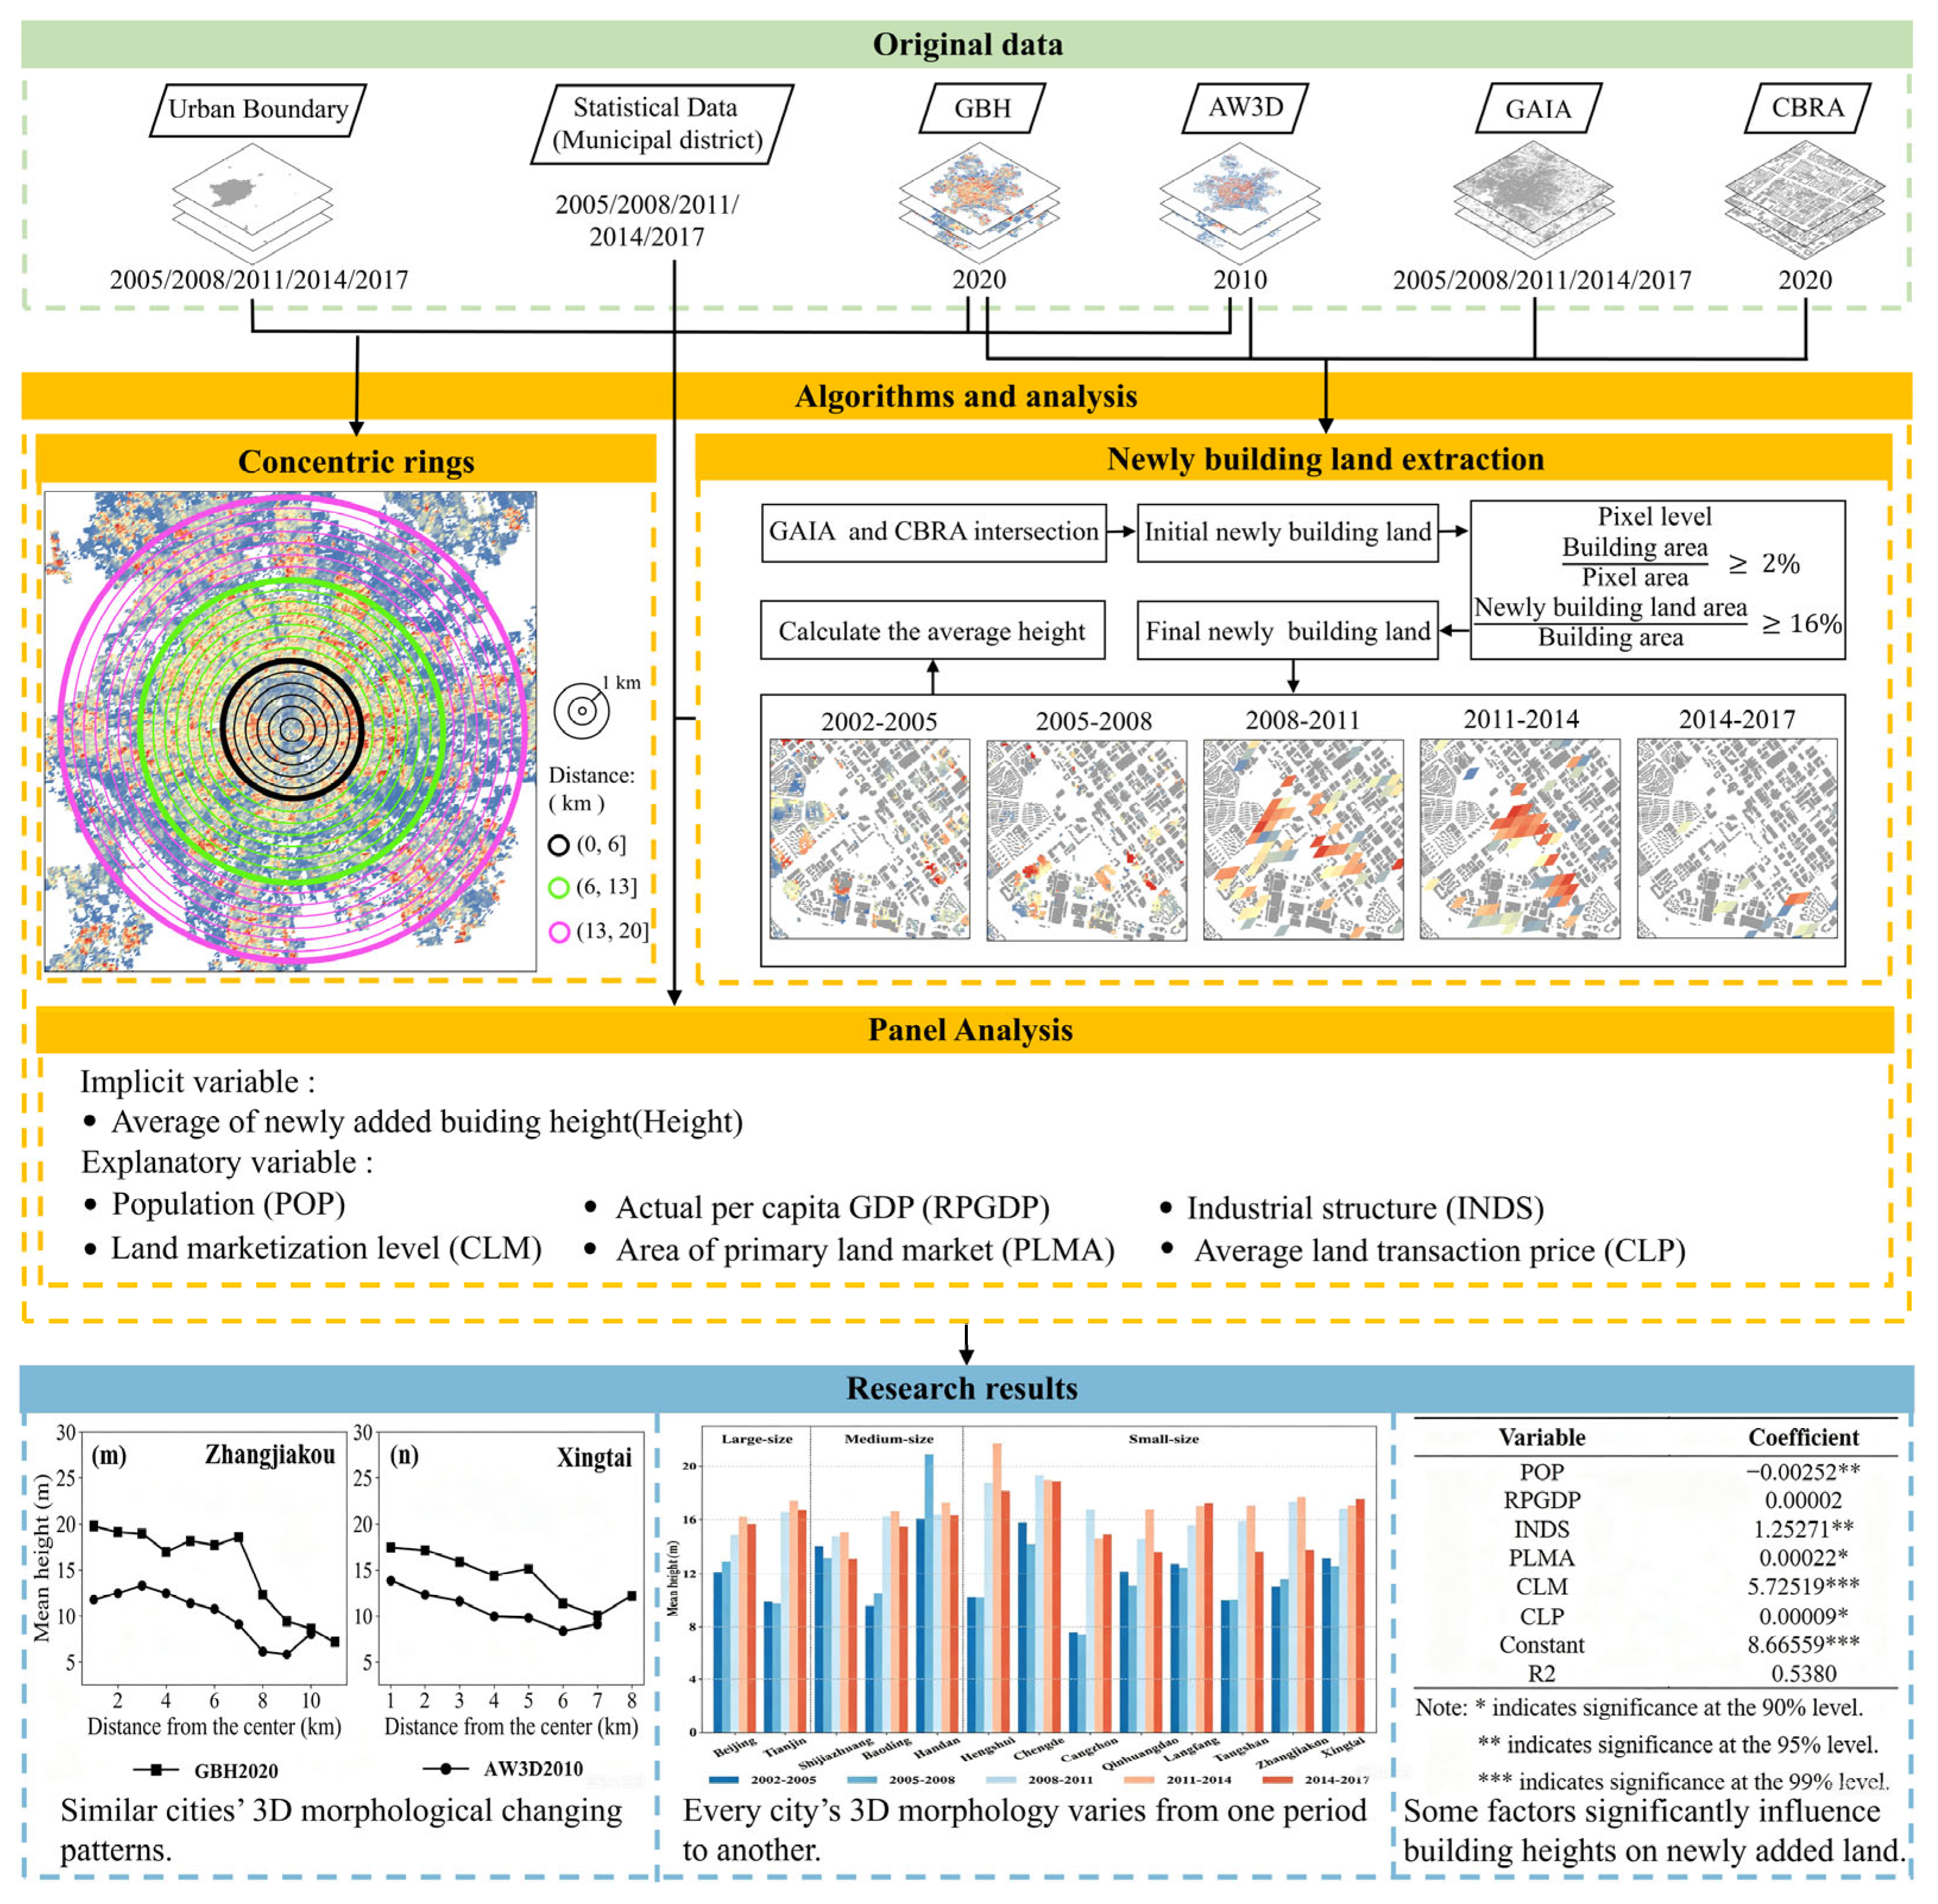
It is worth noting that the average building height of newly developed land varied across the five periods, with the height of newly developed buildings reaching a significant peak in most city categories between 2008 and 2011 (
Figure 6). This may be attributed to the fact that in 2008, in response to the financial crisis, China implemented a four-trillion- yuan infrastructure stimulus plan. The same year, the State Council’s executive meeting issued policies such as the “Several Opinions on Promoting the Healthy Development of the Real Estate Market,” which accelerated the construction of affordable housing and encouraged reasonable housing consumption. This series of measures drove up housing prices, stimulated large-scale urban construction projects, and led to the simultaneous launch of high-rise residential development projects nationwide, resulting in a significant increase in the number of high-rise buildings. In the land market, policies governing land auctions, tenders, and public listings were fully implemented in November 2007. The primary land market expanded rapidly, and fierce competition among real estate developers drove up land costs, prompting developers to favor the construction of high-rise buildings to reduce the cost per unit of land. This trend also led to an increase in the floor-to-ceiling heights of new buildings. Consequently, this resulted in a sharp rise in the height of newly developed buildings during the third phase in most cities.
4.2. Influential Factors of Three-Dimensional Morphology of BTH Cities
Most of the cities in the BTH region have shown a tendency to expand outwards with the city center as a circle during the decade. This is because cities need to continuously absorb the positive externalities of spatial agglomeration for stable development and long-term stability [
75,
76], and they need to carry out orderly lateral expansion in a compact form to efficiently promote the development of urbanization [
77], whereas a circle is the most compact form with relatively minimal internal spatial barriers and a more concentrated and regular distribution [
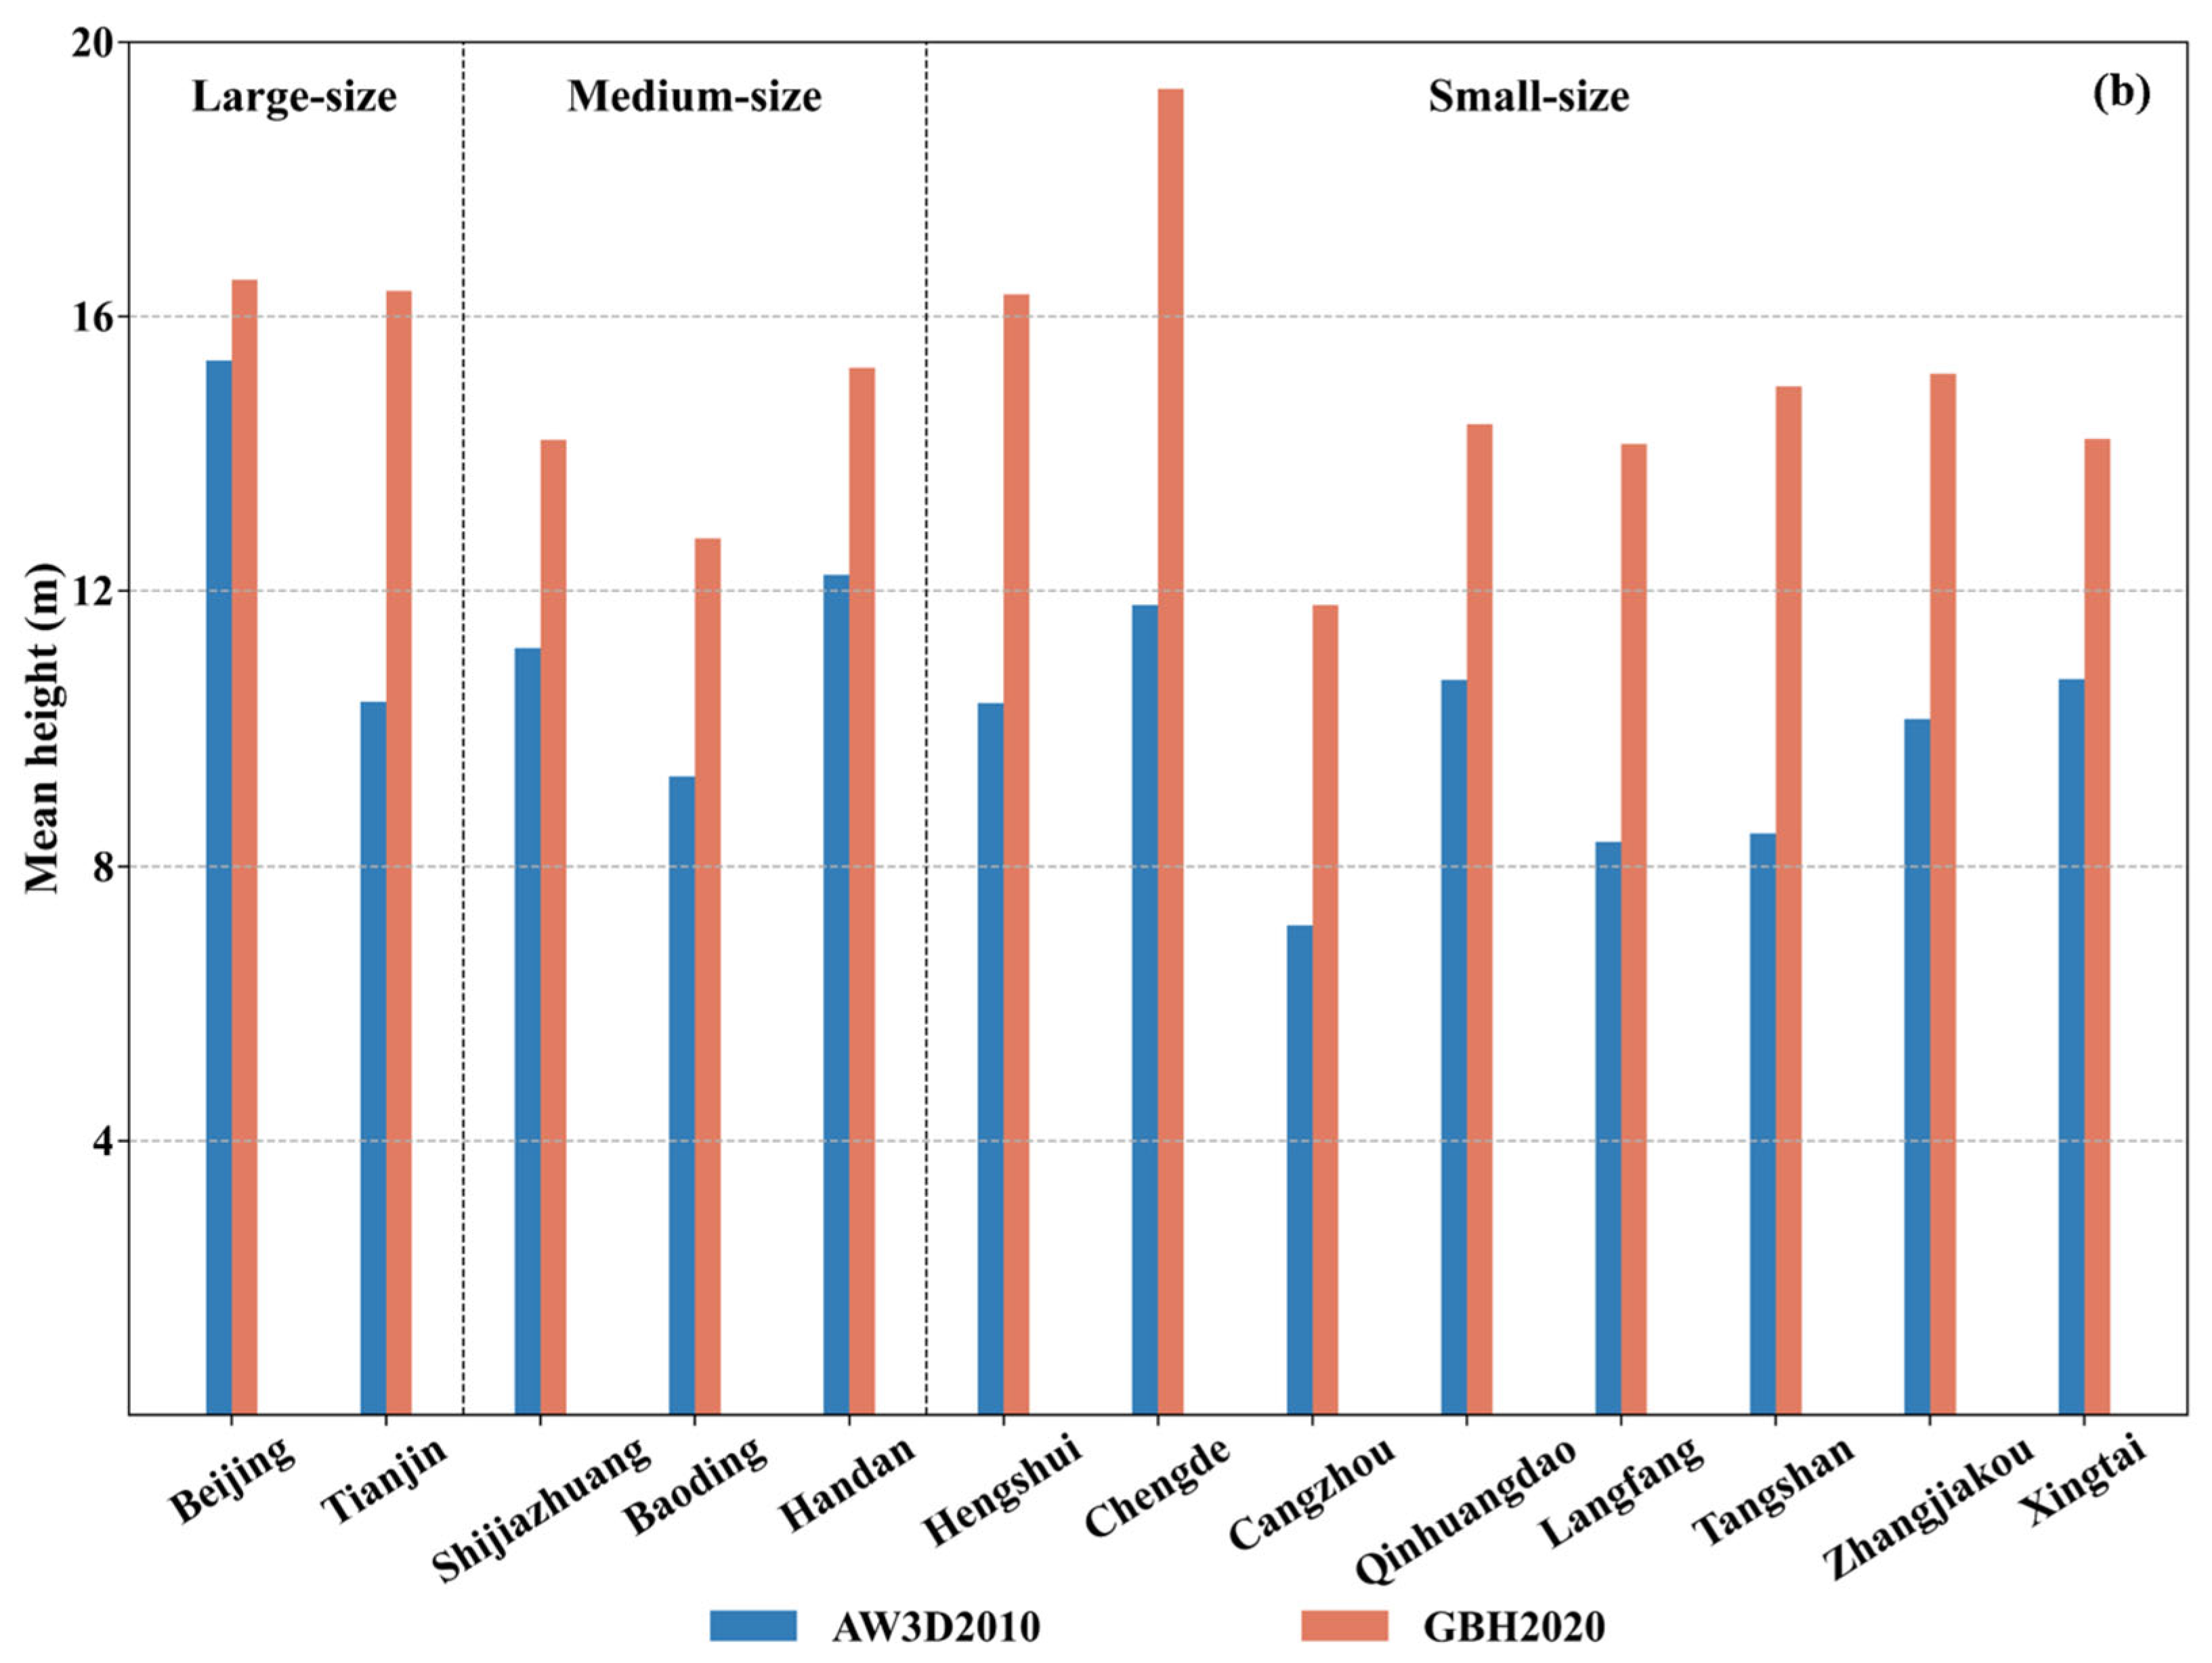
78]. A few cities including Zhangjiakou and Chengde are exceptions. Their urban cores lie on either side of river valleys, leading to strip-shaped expansion along river banks. The average building height across the BTH region increased, which is consistent with findings from previous studies [
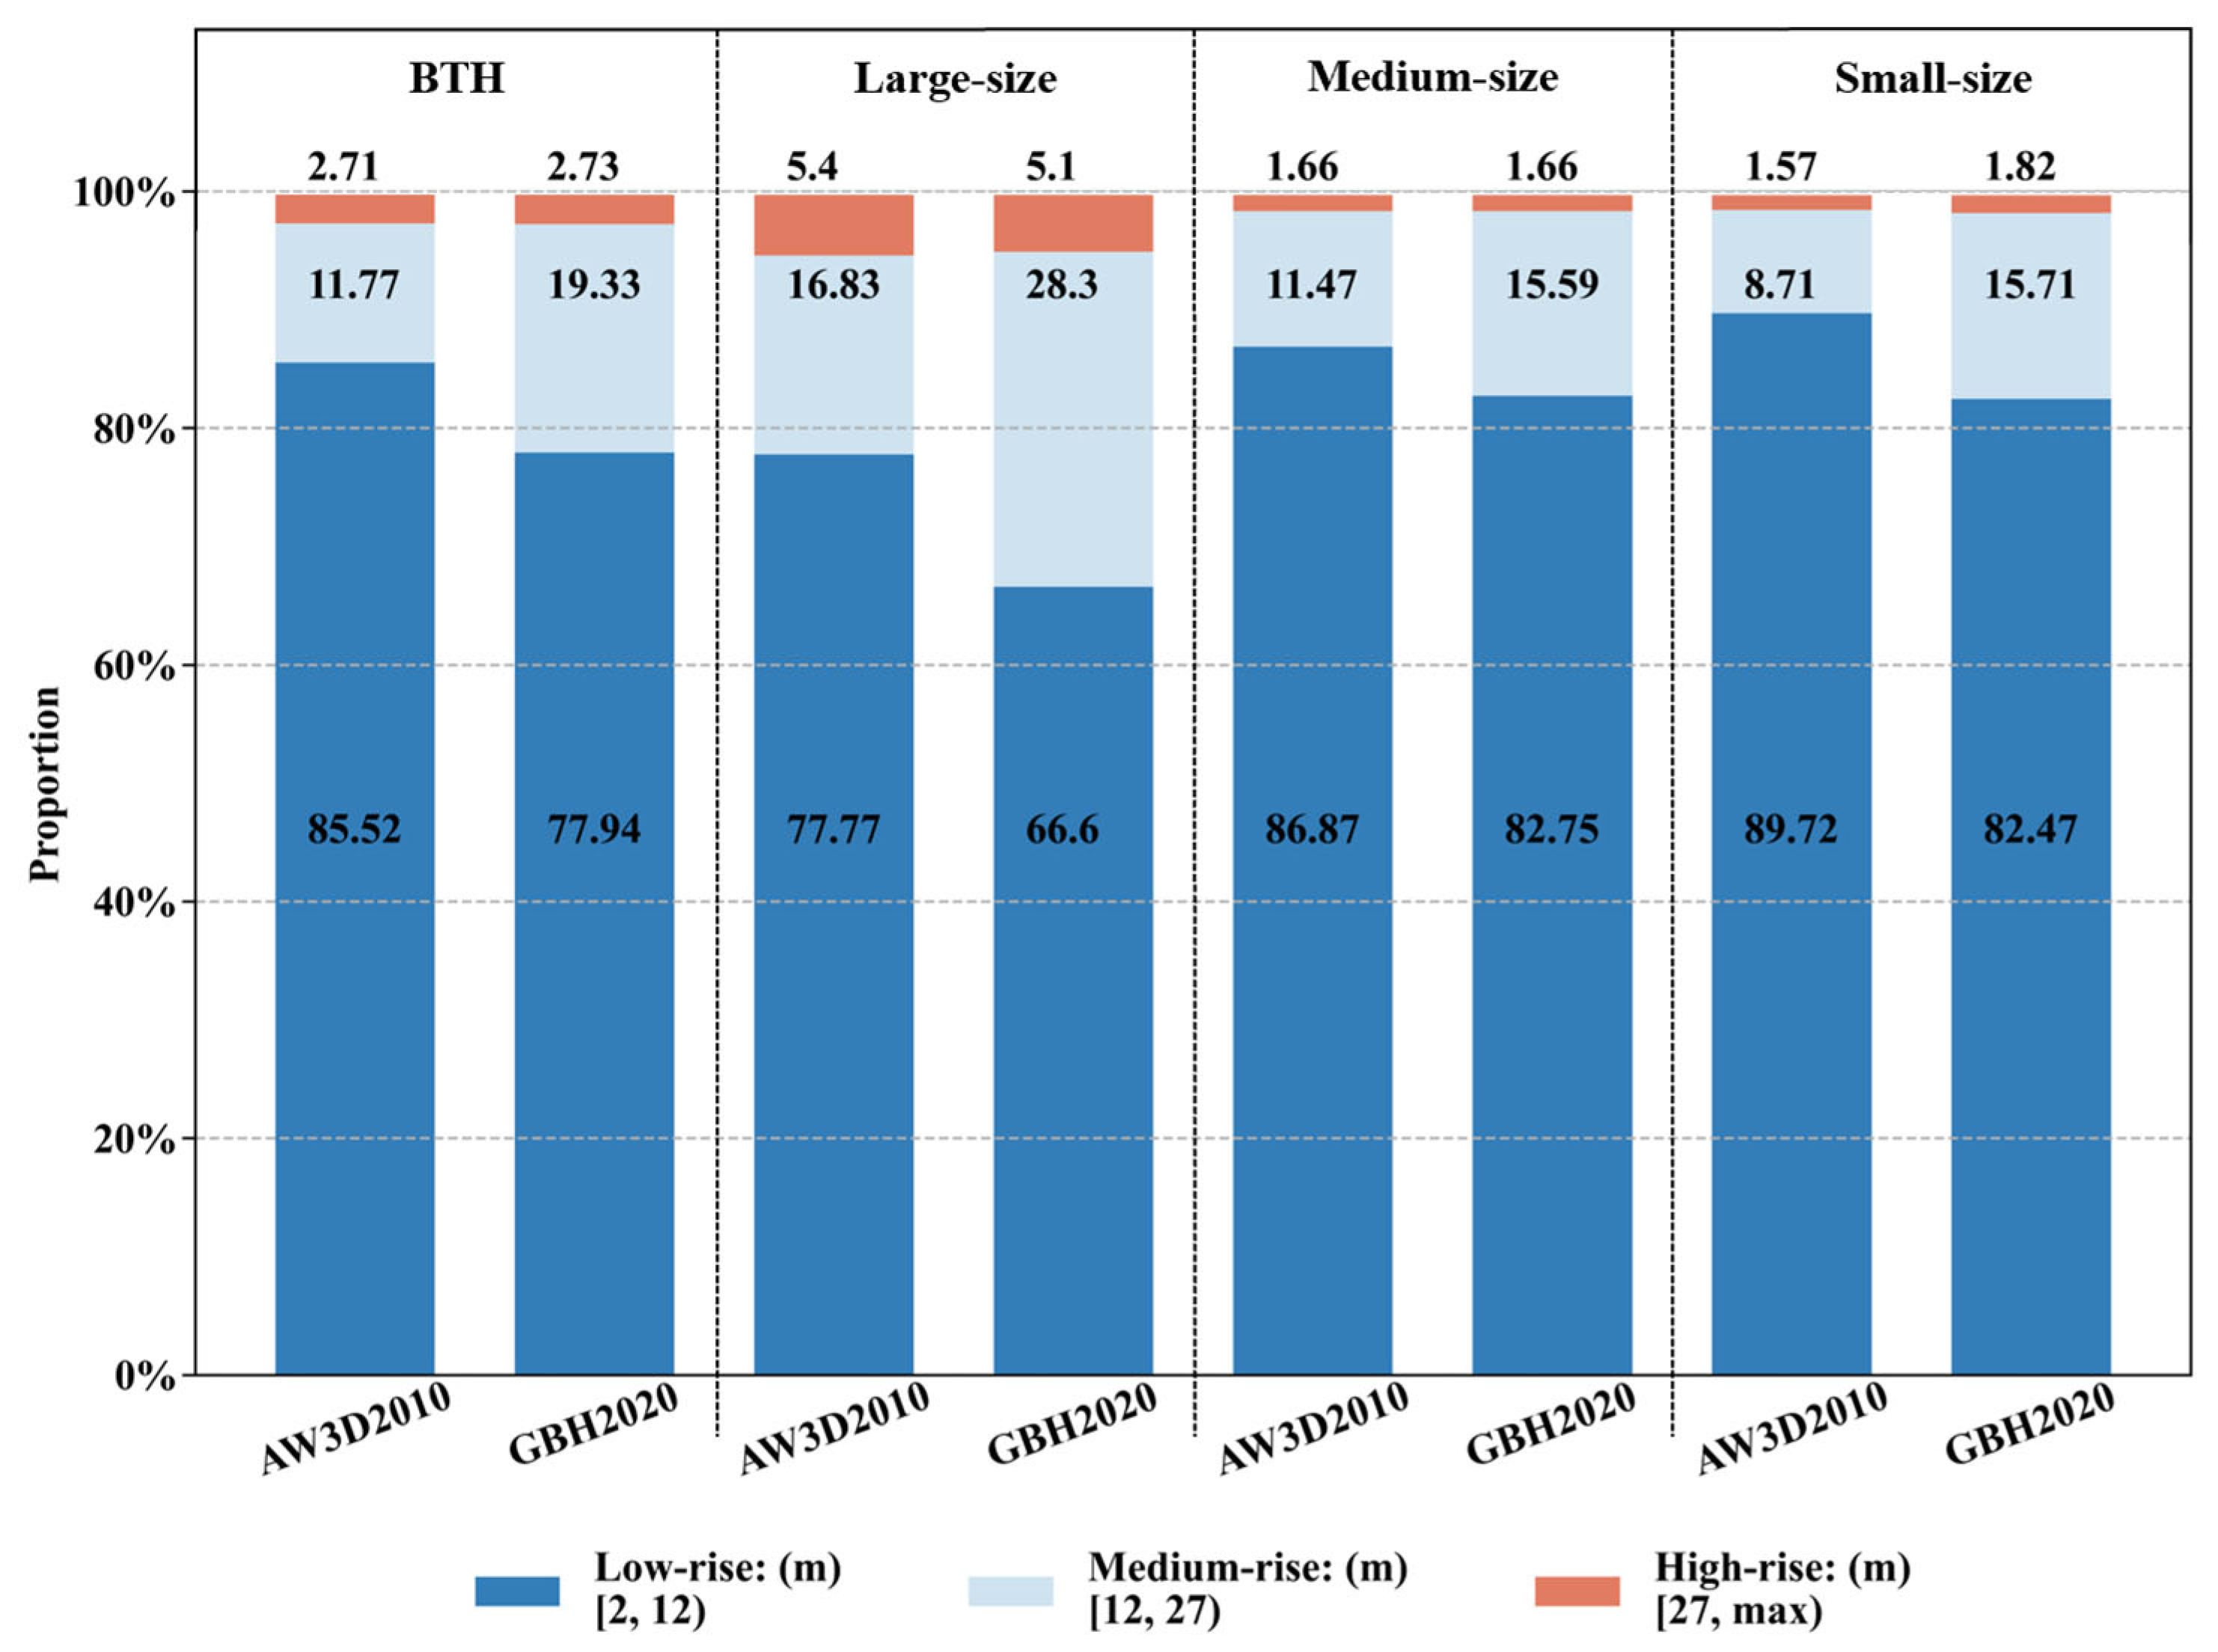
32], and it is worth mentioning that the proportion of low-rise buildings decreases, and the proportion of medium- and high-rise buildings increases. This is because with the acceleration of economic development and urbanization, the urban population increases, and the construction of medium- and high-rise buildings becomes a necessary path for urban development [
59].
At the level of horizontal expansion, large cities with large original built-up areas have slow rates of horizontal expansion, which is consistent with previous studies [
62]. This is due to their large land size, a stable urban spatial structure, and a spatial expansion pattern dominated by infill [
58]. The increase in such a spatial expansion pattern is mainly in low and medium-rise buildings, resulting in a lower proportion of high-rise buildings and little change in average height. However, also as large cities, Tianjin and Beijing have different development trends. As the political, economic, and cultural center of China, Beijing has the unique advantage of having established a relatively up-to-date industrial structure and a high level of economic development, while Tianjin has a large gap in urban development compared to it [
79]. Therefore, the urban form of Tianjin at the beginning of the study is similar to that of a medium-sized city. In the past decade, thanks to the development and opening up strategy of Binhai New Area, Tianjin has entered an unprecedented period of urban expansion [
80]. The intensity and speed of urban expansion have gone through a process of ‘medium-high speed growth–high-speed growth–low-speed growth’ [
81], and the pattern of expansion is mainly fringe-type and infill-type, which has resulted in a much greater increase in building height than that of Beijing. It is worth noting that, according to the concentric ring analysis (
Figure 4), building heights across Tangshan increased significantly between 2010 and 2020. This may be attributed to a combination of factors, including urban planning and the city’s historical built environment. Tangshan faces unique development conditions: the city relies on low-rise, single-story housing built after the earthquake, and due to constraints on the scale of developable land, it is difficult to expand outward in a disorderly manner. As a result, development has shifted toward vertical, intensive development. Coupled with the implementation of new urban planning, which lacks the height restrictions typical of historic old cities, this has led to the emergence of large-scale high-rise residential and commercial buildings. Consequently, the city’s average building height growth rate is significantly higher than that of most cities in the BTH region.
Medium-sized cities primarily adopt edge expansion combined with infill expansion. Their urban cores are beginning to take shape, presenting the characteristics of a strong core and a weak periphery [
58]. Edge expansion is dominated by low-rise and mid-rise buildings, whereas infill development within urban cores mainly consists of mid-rise and high-rise buildings. Accordingly, the overall proportion of high-rise buildings remains nearly stable, while that of low-rise and mid-rise buildings increases. In contrast, small cities expand mainly in the form of enclave and edge growth. Their urban cores are not fully developed and exert limited attraction to surrounding areas, so new construction is largely concentrated within core zones [
58]. For this reason, small cities witness a substantial growth in mid-rise and high-rise buildings, and register the most remarkable rise in average building height over the decade.
The spatial evolution of cities can be described as a two-stage process of diffusion and agglomeration, with the evolution of cities beginning with the expansion of the urban seed or core [
82], which has a certain regularity, although the manifestations show slight differences due to the different contexts of individuals [
83]. Large cities always change from small cities. From this, we can speculate that in the next cycle, today’s small cities may begin to expand along their edges and accompanying infill of their urban cores; while the relative suburbs of today’s medium-sized cities have developed almost to the point of spill-over effects, with the main mode of expansion changing to infill. For large cities, on the other hand, there may be a trend towards decentralization and re-centralization, as in other global cities [
84], or they may undergo a process of polycentricity [
85].