1. Introduction
Landslides are among the most widespread geological hazards worldwide and cause severe casualties, infrastructure damage, and economic losses annually [
1]. In mountainous and hilly regions, intense rainfall, complex geological conditions, and human engineering activities jointly increase the probability of landslide occurrence [
2]. Therefore, landslide susceptibility mapping (LSM) has become an important approach for regional geological hazard identification and disaster prevention [
2]. Early studies mainly relied on statistical analysis, expert knowledge, and Geographic Information System (GIS)-based spatial analysis methods for landslide hazard assessment [
3]. In recent years, with the rapid development of machine learning and remote sensing technologies, significant progress has been achieved in prediction accuracy and automated analysis for landslide susceptibility assessments [
4]. Previous studies have demonstrated that LSM can effectively identify potential high-risk areas and provide important scientific support for disaster prevention, land-use planning, and engineering construction [
3,
4,
5]. In particular, multi-source geospatial and remote sensing data have provided important information for landslide identification and dynamic monitoring [
6].
Guangdong Province is located in southeastern coastal China and is strongly affected by a subtropical monsoon climate, complex terrain, and frequent heavy rainfall events, resulting in widespread geological hazards such as landslides [
1,
2]. Previous studies have shown that landslides in Guangdong and southern China exhibit obvious spatial clustering characteristics under the combined influence of typhoon-induced rainfall, complex topography, and human engineering activities [
7,
8]. In particular, against a background of rapid urbanization and frequent typhoon rainfall, road construction, mining activities, and land-use changes have further increased slope instability [
9]. In recent years, numerous landslide susceptibility studies have been conducted in Guangdong and humid mountainous regions of southern China using Random Forest (RF), Support Vector Machine (SVM), deep learning, and ensemble learning methods, achieving relatively good prediction performance [
10,
11,
12].
Machine learning methods have been widely applied in landslide susceptibility studies because they can effectively handle complex nonlinear relationships and high-dimensional environmental factors [
4]. Compared with traditional statistical models, machine learning approaches can better model the coupling relationships among high-dimensional, multi-source, and nonlinear environmental variables, making them increasingly popular in recent LSM research [
13,
14]. Among these methods, RF and SVM have become representative machine learning models for landslide susceptibility assessment due to their strong ensemble learning capability and nonlinear classification performance, respectively [
10,
11]. Compared with traditional machine learning algorithms, Extreme Gradient Boosting (XGBoost) can effectively capture complex nonlinear relationships and feature interactions among environmental factors through a gradient boosting framework while maintaining strong resistance to overfitting and high computational efficiency [
15]. Owing to its excellent performance in handling high-dimensional and complex environmental data, XGBoost has been widely used in recent landslide susceptibility studies [
16]. Previous studies have shown that XGBoost generally outperforms traditional machine learning models regarding prediction accuracy and model stability, particularly in complex environmental conditions [
4].
Although machine learning models can significantly improve landslide susceptibility prediction accuracy, the internal decision-making process of ensemble learning models is often difficult to interpret, limiting their use in geological mechanism analysis [
17]. To improve model interpretability, the SHAP (Shapley Additive Explanations) method, based on Shapley value theory from cooperative game theory, quantitatively evaluates the contribution of each environmental factor to the prediction results and reveals both the positive and negative effects as well as nonlinear influence patterns of variables [
17]. In recent years, SHAP has gradually been applied to landslide susceptibility studies to identify key controlling factors and their mechanisms [
18]. Compared with traditional feature importance analysis methods, SHAP not only quantifies the contribution of variables but also reveals the direction and nonlinear characteristics of their effects on model outputs [
19].
Landslide occurrence is generally controlled by multiple factors, including topographic conditions, geological environments, climatic factors, vegetation coverage, and human engineering activities [
2]. Among these factors, vegetation coverage and land-use changes influence slope stability through root reinforcement, soil moisture regulation, and reductions in surface erosion [
20], whereas prolonged periods of heavy rainfall may increase soil water content and pore-water pressure while reducing slope shear strength, thereby triggering landslides [
21]. In addition, road construction and engineering activities may alter original slope structures and intensify slope disturbances, further increasing landslide susceptibility [
9]. Therefore, comprehensive consideration of multiple environmental factors is essential for improving landslide prediction performance.
Therefore, this study takes the terrestrial area of Guangdong Province as the study region and integrates multi-source geospatial data to construct a landslide conditioning factor system and conduct a landslide susceptibility assessment using the XGBoost model. Furthermore, SHAP analysis was employed to investigate the contribution characteristics and mechanisms of environmental factors, thereby improving the interpretability of the prediction results. This study provides useful references for landslide risk identification and disaster prevention in Guangdong Province and other regions of southern China.
Compared with previous studies, the main contributions and innovations of this study are as follows:
- (1)
Multi-source geospatial data, including Digital Elevation Model (DEM), vegetation, precipitation, and land-use data, were integrated to construct a regional-scale landslide conditioning factor system for Guangdong Province.
- (2)
The XGBoost model was applied to the multi-source conditioning factor dataset to produce a provincial-scale landslide susceptibility map for Guangdong Province and evaluate the spatial consistency between predicted high-susceptibility zones and historical landslide records.
- (3)
SHAP analysis was further used to interpret the model results by identifying the main conditioning factors and their nonlinear effects, thereby providing an explanation for regional landslide susceptibility patterns in Guangdong Province.
2. Materials and Methods
2.1. Study Area
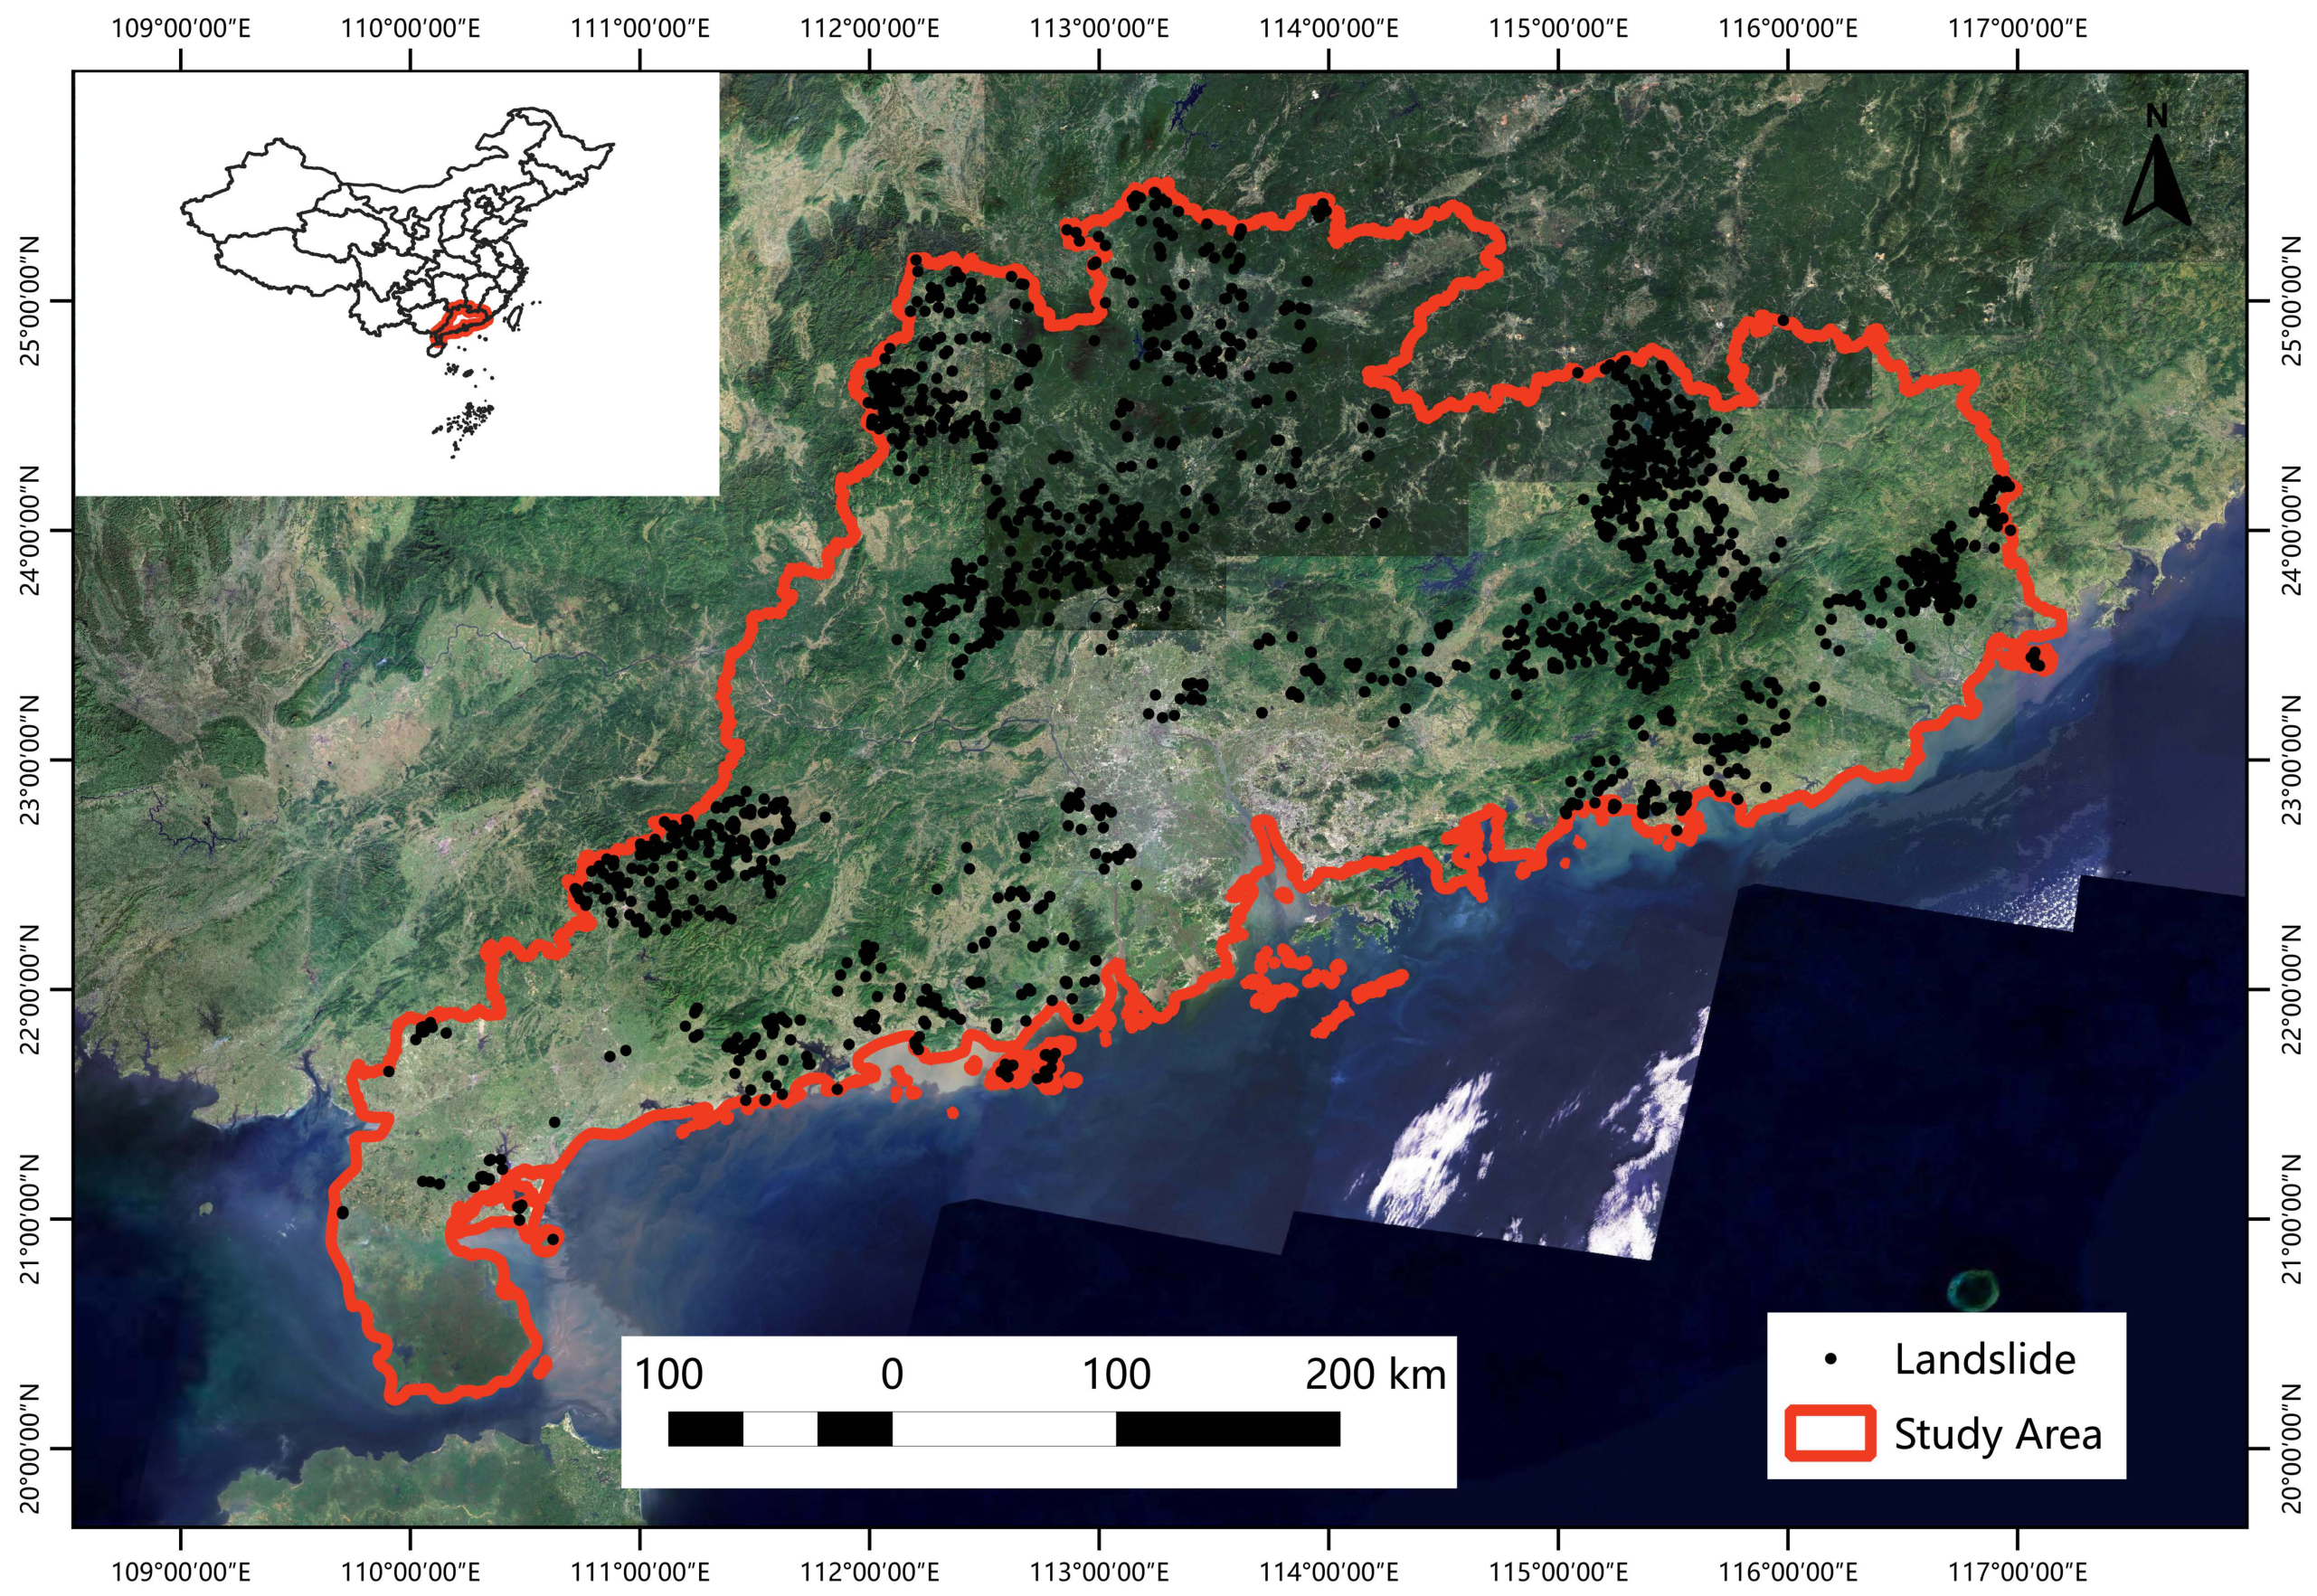
The study area is located in the terrestrial region of Guangdong Province in southern China, with geographic coordinates ranging from 109° to 117°E and 20–25°N, covering a total area of approximately 179,800 km2. Influenced by complex natural environments and regional geological conditions, landslide hazards are widely distributed and occur frequently throughout Guangdong Province.
In terms of topography, Guangdong Province is located within the third step of China’s three-step terrain system. Although the overall elevation is relatively low, the region is characterized by significant terrain relief and diverse geomorphic types. The major landform types include mountains, hills, platforms, and plains, among which mountainous and hilly areas account for approximately 60% of the total provincial area. The overall terrain generally decreases from north to south, with mountainous and hilly regions mainly distributed in northern Guangdong. By contrast, plains and platforms dominate the southern region. Influenced by regional fault structures, mountain ranges in Guangdong are predominantly distributed along a northeast–southwest direction, accompanied by widespread valleys and basins, which provide favorable topographic conditions for landslide occurrence.
Climatically, Guangdong Province belongs to a typical subtropical monsoon climate zone characterized by abundant annual precipitation, frequent typhoons, and intense rainfall events. Short-duration heavy rainfall events are particularly common. Continuous heavy rainfall can rapidly increase soil water content and pore-water pressure, thereby becoming a major external triggering factor for landslides [
21].
In terms of geological conditions, Guangdong Province contains various lithological types, including granite, sandstone, metamorphic rocks, and carbonate rocks. Highly weathered rock masses and unconsolidated deposits generally exhibit poor stability under heavy rainfall, making them more susceptible to landslide occurrence.
During the period covered by the road-network data used in this study (2012–2024), road construction, slope excavation, and infrastructure engineering activities have significantly altered the original topographic conditions and surface structures, reducing local slope stability and further increasing landslide risk [
9]. The location of the study area and the spatial distribution of the landslide inventory points are shown in
Figure 1.
2.2. Data Sources
2.2.1. Landslide Dataset
Landslide inventory data provide an essential basis for landslide susceptibility assessment studies. In this study, historical landslide inventory data obtained from the national geological hazard spatial distribution dataset were used as the source of landslide samples.
To comprehensively characterize factors controlling landslide occurrence, 20 landslide conditioning factors (LCFs) were selected for model construction based on the study area’s natural geographical conditions and the results of previous research. These factors were derived from topography, geological structure, land use, hydrological conditions, climate, and vegetation.
To ensure spatial consistency among multi-source datasets, all environmental factors were resampled to a unified spatial resolution of 30 m × 30 m using the DEM raster data as the reference layer. After removing records with missing or invalid raster values, 1439 valid landslide inventory points were retained as positive samples for landslide susceptibility modeling. The basic information of all conditioning factors is listed in
Table 1.
2.2.2. Landslide Conditioning Factors
Topographical Factors
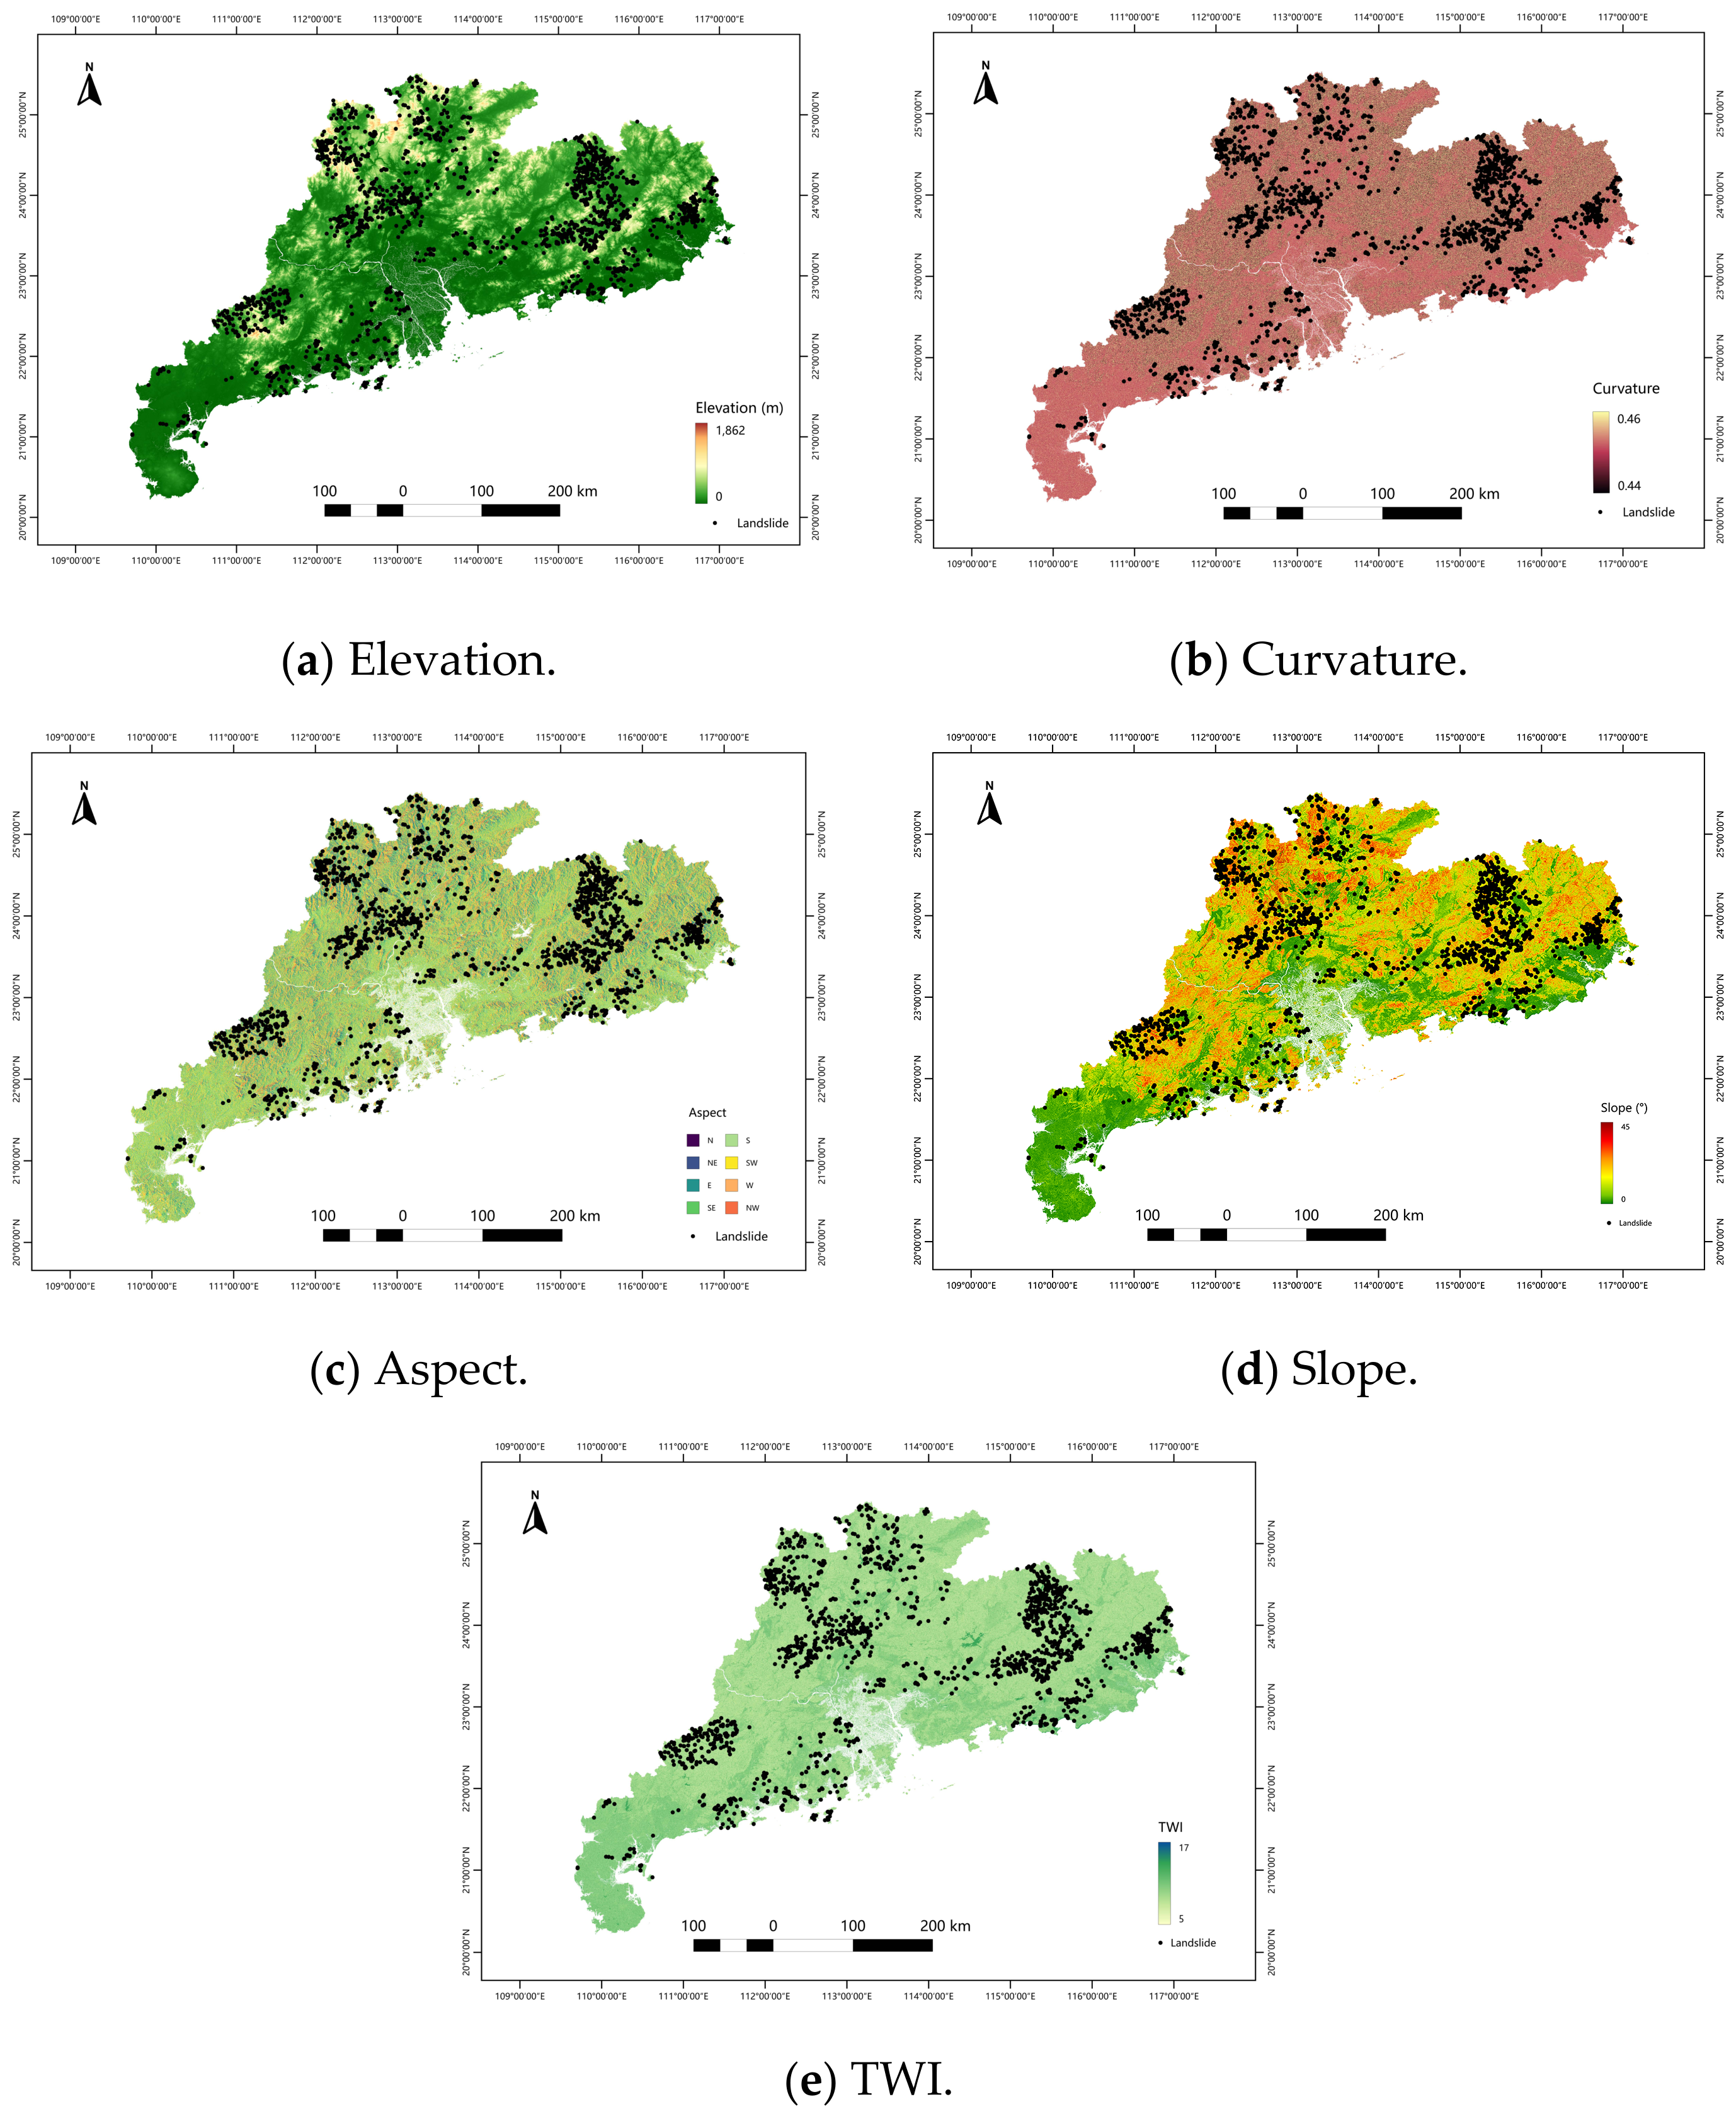
Topographical factors play an important role in landslide susceptibility assessment because they directly reflect slope stability and surface geomorphological characteristics. Elevation represents the regional terrain distribution pattern, while slope describes terrain steepness and significantly influences gravitational slope instability. Curvature reflects variations in surface morphology and affects surface runoff and erosion processes. Aspect influences solar radiation, weathering intensity, and surface moisture conditions, thereby altering the physical properties of slopes. In addition, the Topographic Wetness Index (TWI) can reflect the capability of surface water accumulation and the distribution characteristics of potential runoff [
22]. Previous studies have indicated that slope and TWI are important topographical controlling factors affecting landslide occurrence and have significant impacts on slope stability and surface runoff processes [
22,
23].
In this study, topographical factors including elevation, slope, aspect, curvature, and TWI were derived from DEM data. The DEM dataset was obtained from the Shuttle Radar Topography Mission (SRTM) elevation product [
24]. The spatial distributions of the topographical factors used in this study are shown in
Figure 2.
Geological Factors
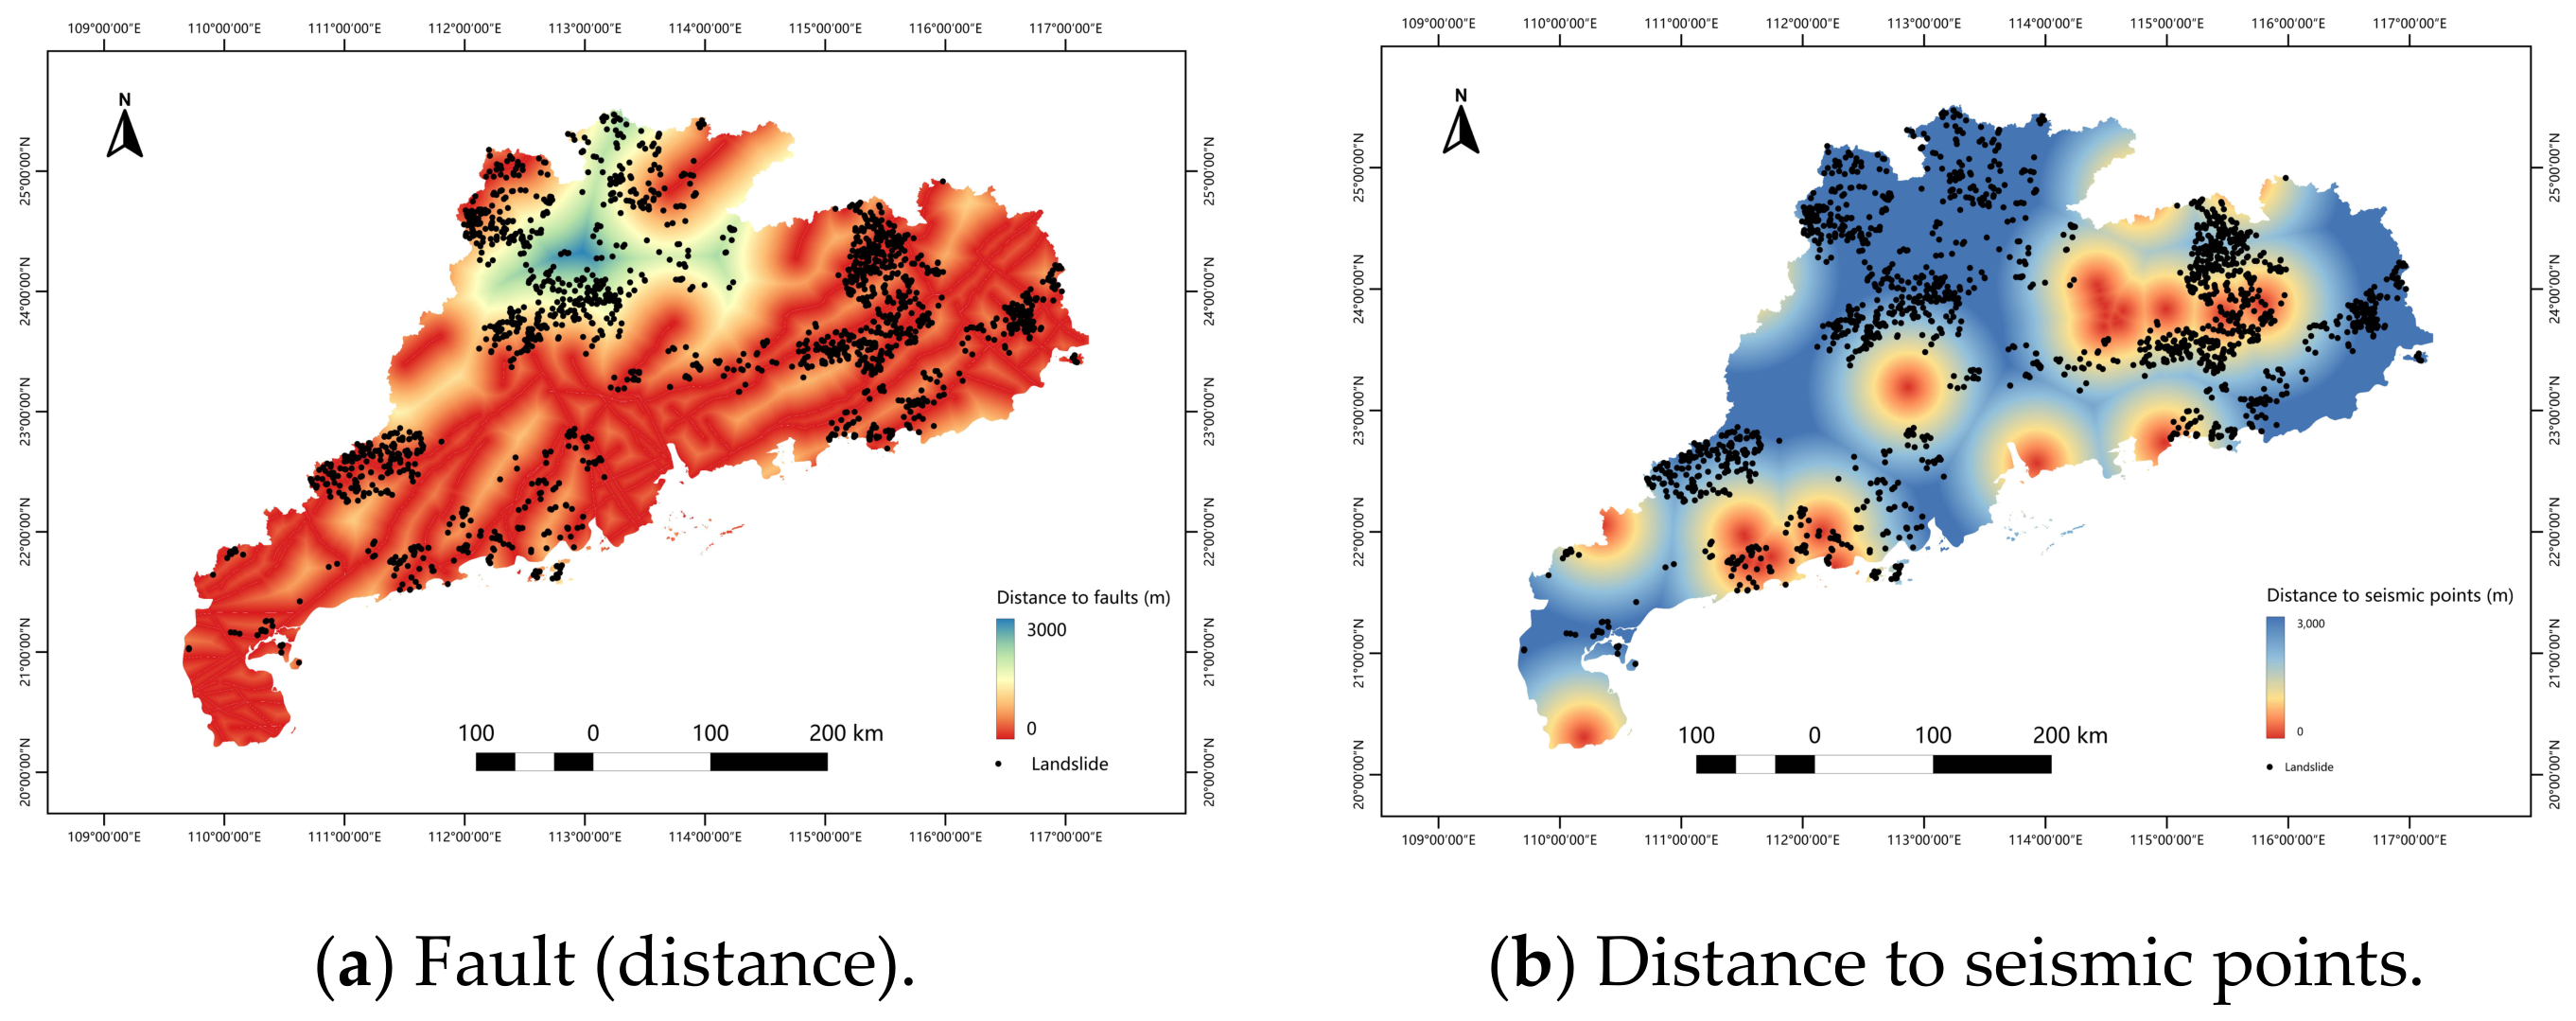
Geological structural conditions are important intrinsic controlling factors influencing the occurrence of landslides, as they determine the material composition of slopes and the mechanical properties of rock and soil masses. In this study, fault distance and seismic point distance are selected as geological factors. Fault activity can damage rock mass structures and form fractured zones, thereby reducing slope stability. Therefore, areas closer to faults generally have a higher probability of landslide occurrence. The spatial distributions of the geological factors are shown in
Figure 3.
Land Factors
Land-use change is recognized as a key factor influencing landslide occurrence, as different land-cover types can significantly affect surface structure and hydrological processes. Different land-use types influence slope stability by altering vegetation cover, soil structure, and surface runoff conditions [
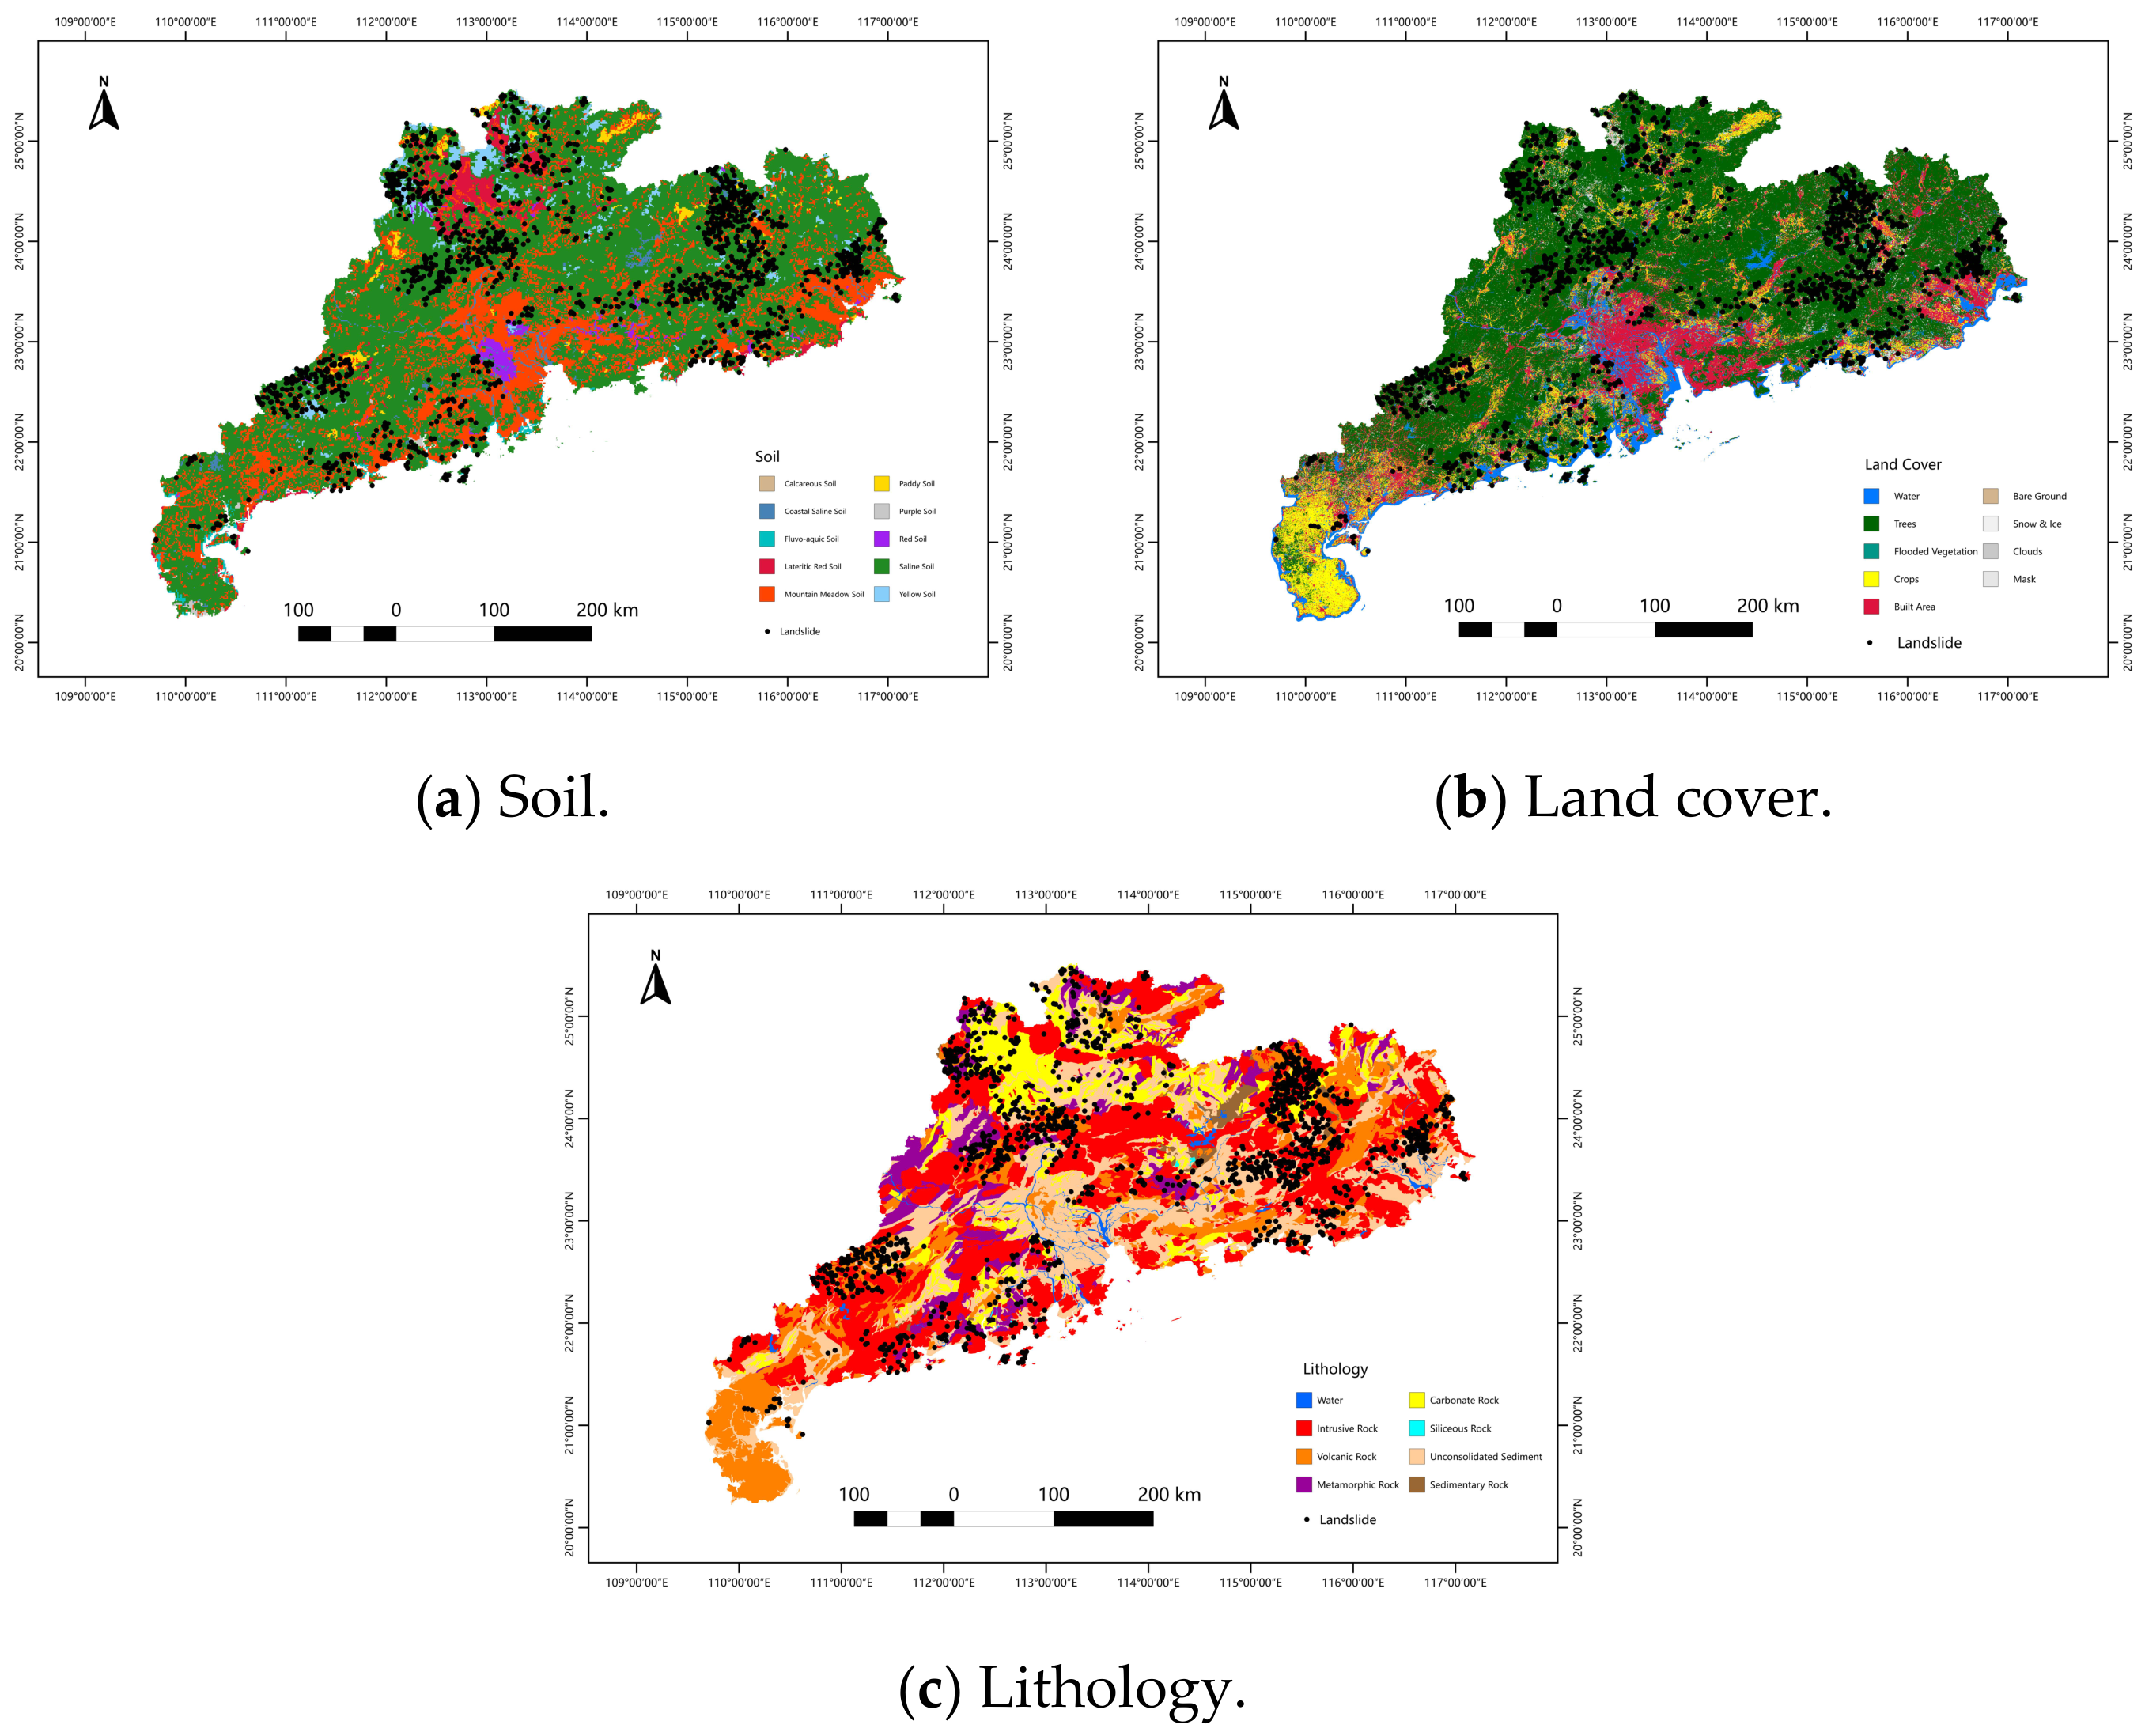
20]. Vegetation can enhance soil stability through root reinforcement, whereas construction activities may increase landslide risk. Soil type directly affects the physical and mechanical properties of slope materials as well as water infiltration capacity. There are substantial differences among soil types in terms of shear strength, pore structure, and water-retention characteristics. In addition, lithological conditions and the degree of rock mass fragmentation also exert significant influences on slope stability.
The land-use/land-cover data used in this study were obtained from the GlobeLand30 V2020 product provided by the National Geomatics Center of China. The GlobeLand30 mapping framework and 30 m global land-cover production method were described by Chen et al. [
25]. The spatial distributions of the land-related factors are shown in
Figure 4.
Hydrological Factors
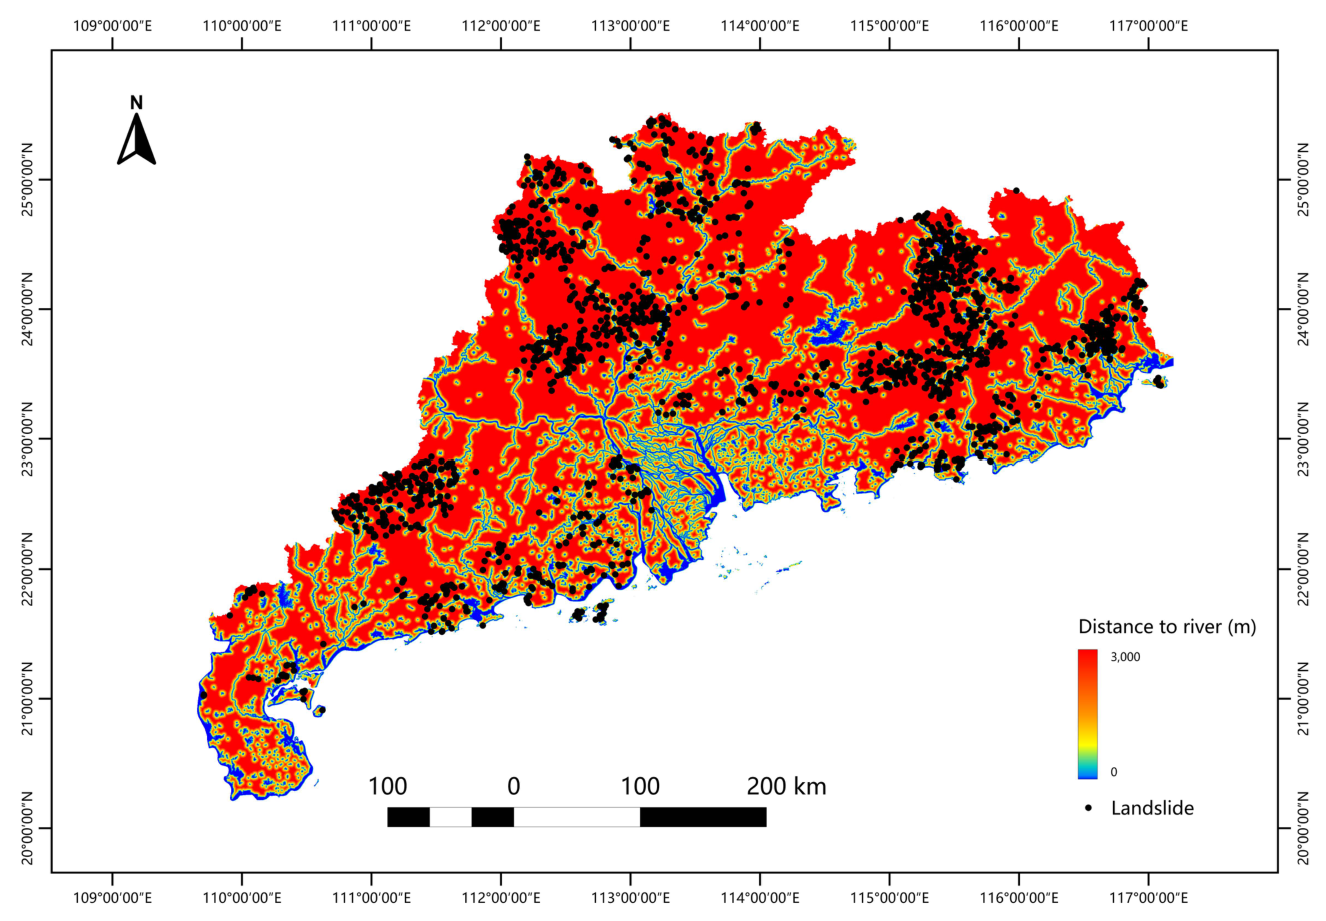
Hydrological conditions play a critical role in landslide occurrence. Areas in close proximity to rivers are generally subjected to stronger fluvial erosion and hydrodynamic forces, which can reduce slope stability and consequently increase the likelihood of landslide occurrence. Therefore, distance to rivers was selected as an important hydrological conditioning factor in this study. The spatial distribution of the hydrological factor is shown in
Figure 5.
Anthropogenic Activity Factors
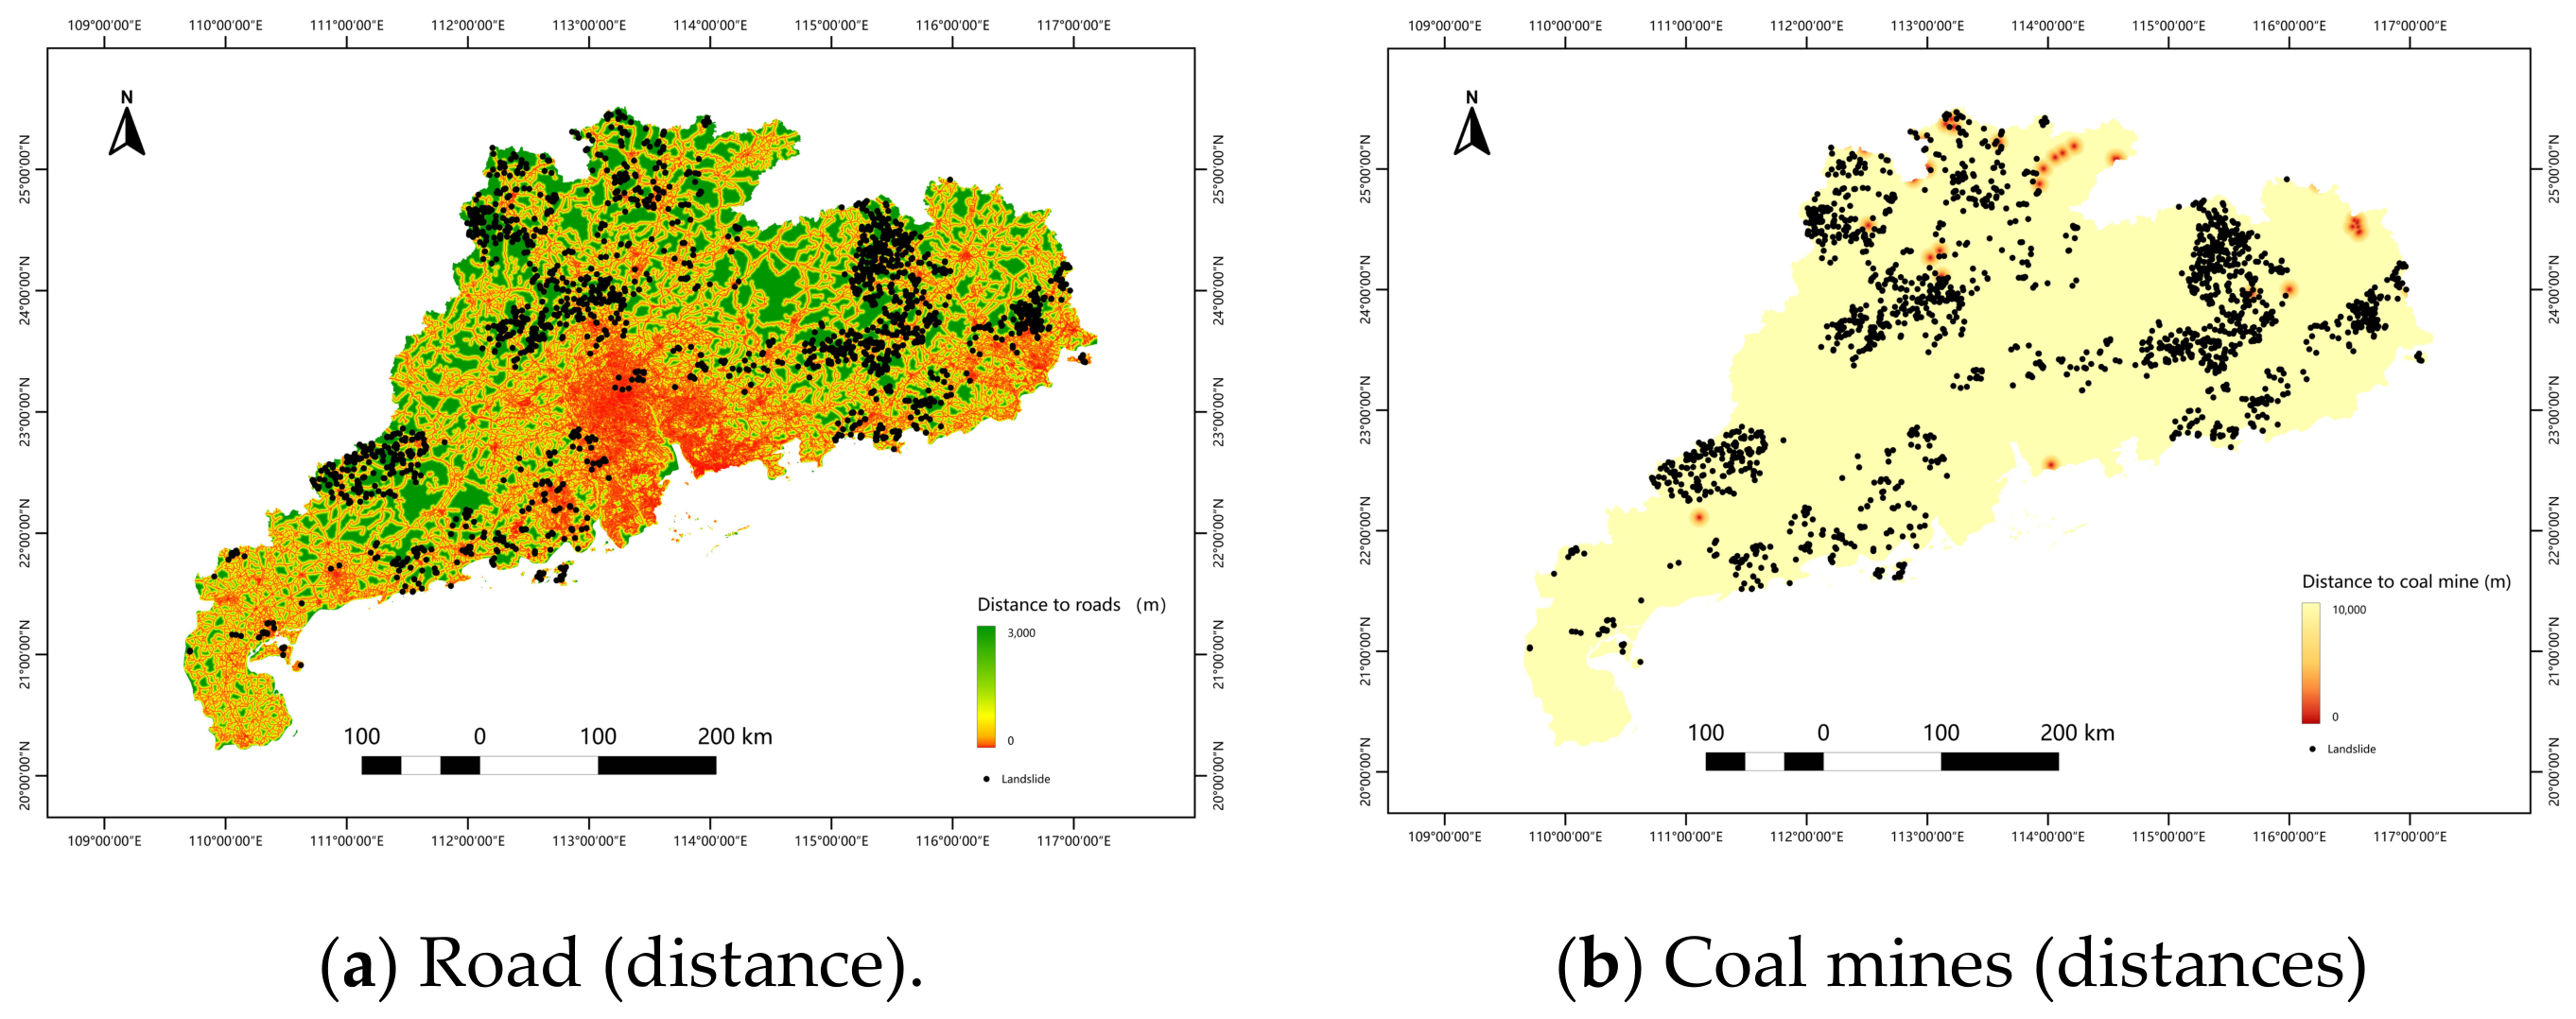
Anthropogenic engineering activities significantly influence landslide occurrence. Engineering construction can alter the original topographic conditions and surface structure of the land, thereby decreasing slope stability. In particular, slope excavation and changes in drainage conditions associated with road construction can easily trigger slope instability. Accordingly, distance to roads was selected as an important indicator reflecting the intensity of human activities. The road-network data used to calculate distance to roads was obtained from OpenStreetMap (OSM), covering road information from 2012 to 2024. In addition, mining activities may modify regional geostress conditions and further increase the risk of slope failure. Previous studies have demonstrated that disturbances induced by road engineering commonly alter the original slope structure and drainage conditions, thereby significantly increasing landslide susceptibility [
9]. The spatial distributions of the human activity factors are shown in
Figure 6.
Vegetation Factors
Vegetation cover reflects surface ecological conditions and plays an important role in regulating slope stability. In this study, the Normalized Difference Vegetation Index (NDVI) was employed to characterize vegetation conditions [
26]. Vegetation can enhance slope stability through root reinforcement, reduction in surface erosion, and regulation of soil moisture content. In general, areas with higher levels of vegetation coverage exhibit lower probabilities of landslide occurrence.
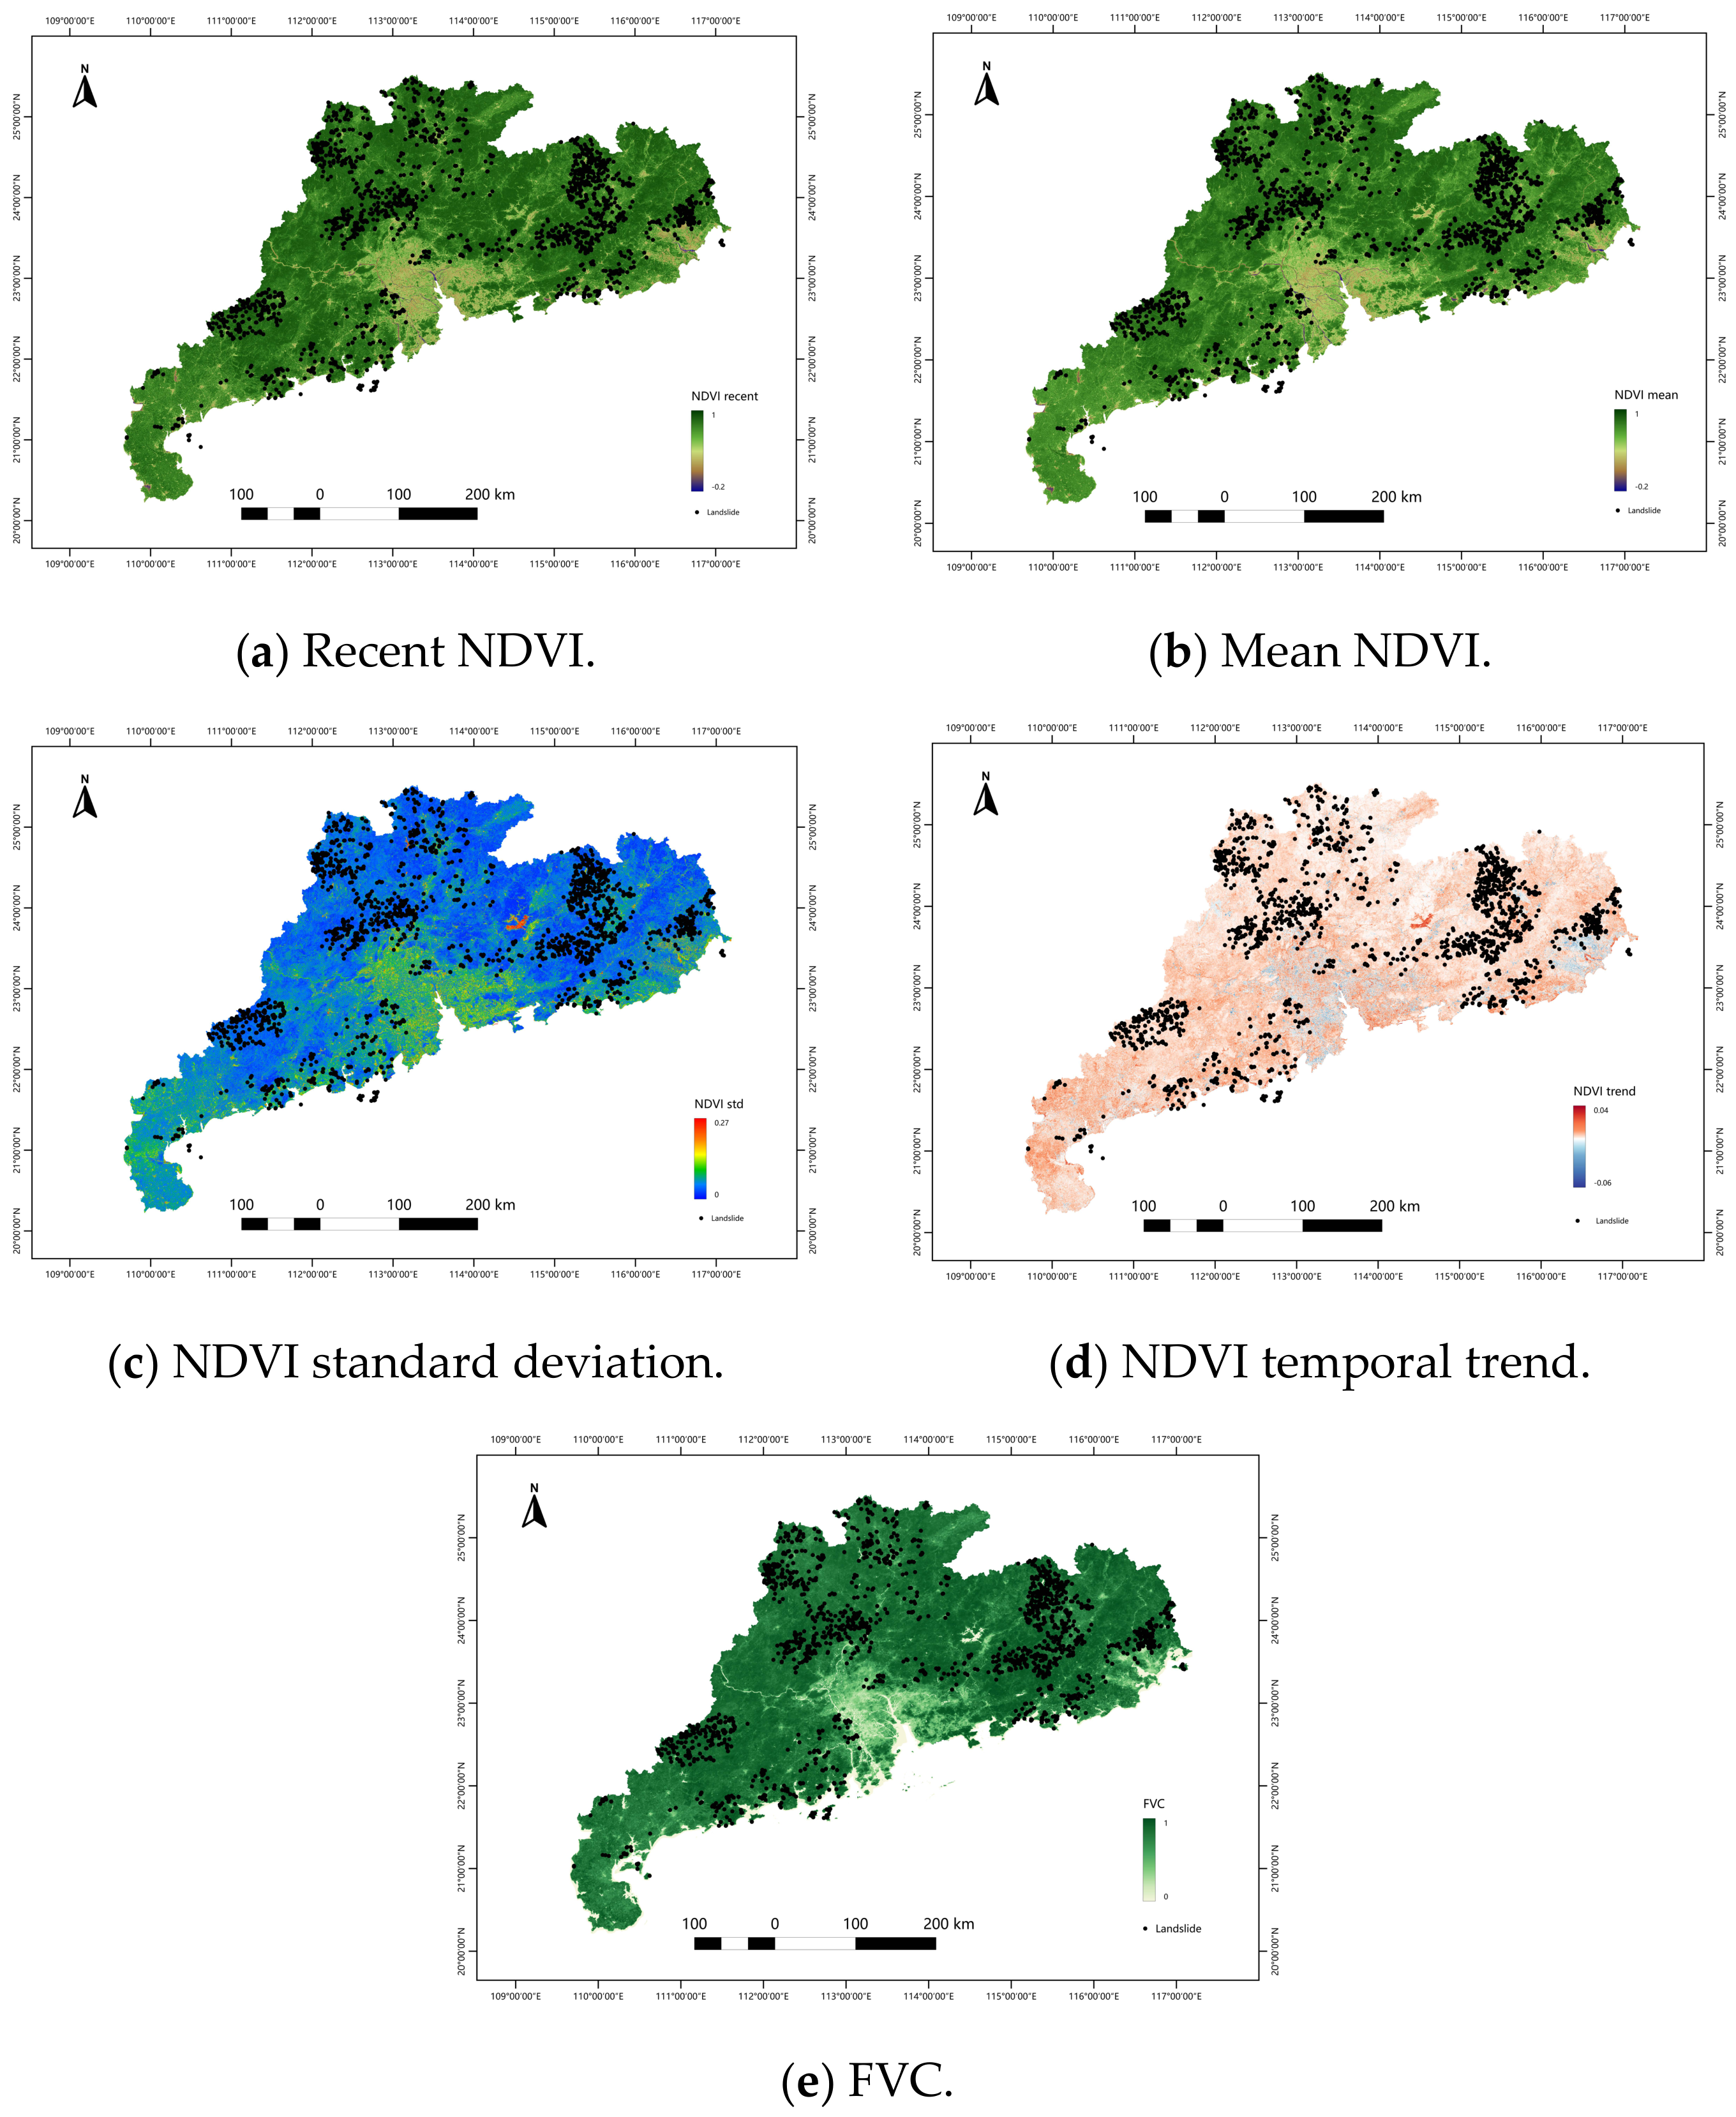
Vegetation-related factors, including recent NDVI, mean NDVI, NDVI standard deviation, NDVI temporal trend, and Fractional Vegetation Cover (FVC), were selected for landslide susceptibility assessment. The spatial distributions of the vegetation-related factors are shown in
Figure 7.
Precipitation Factors
Precipitation is one of the most important external triggering factors of landslides. Prolonged and intense rainfall events can increase soil moisture content, elevate pore-water pressure, and reduce soil shear strength, thereby triggering landslide hazards [
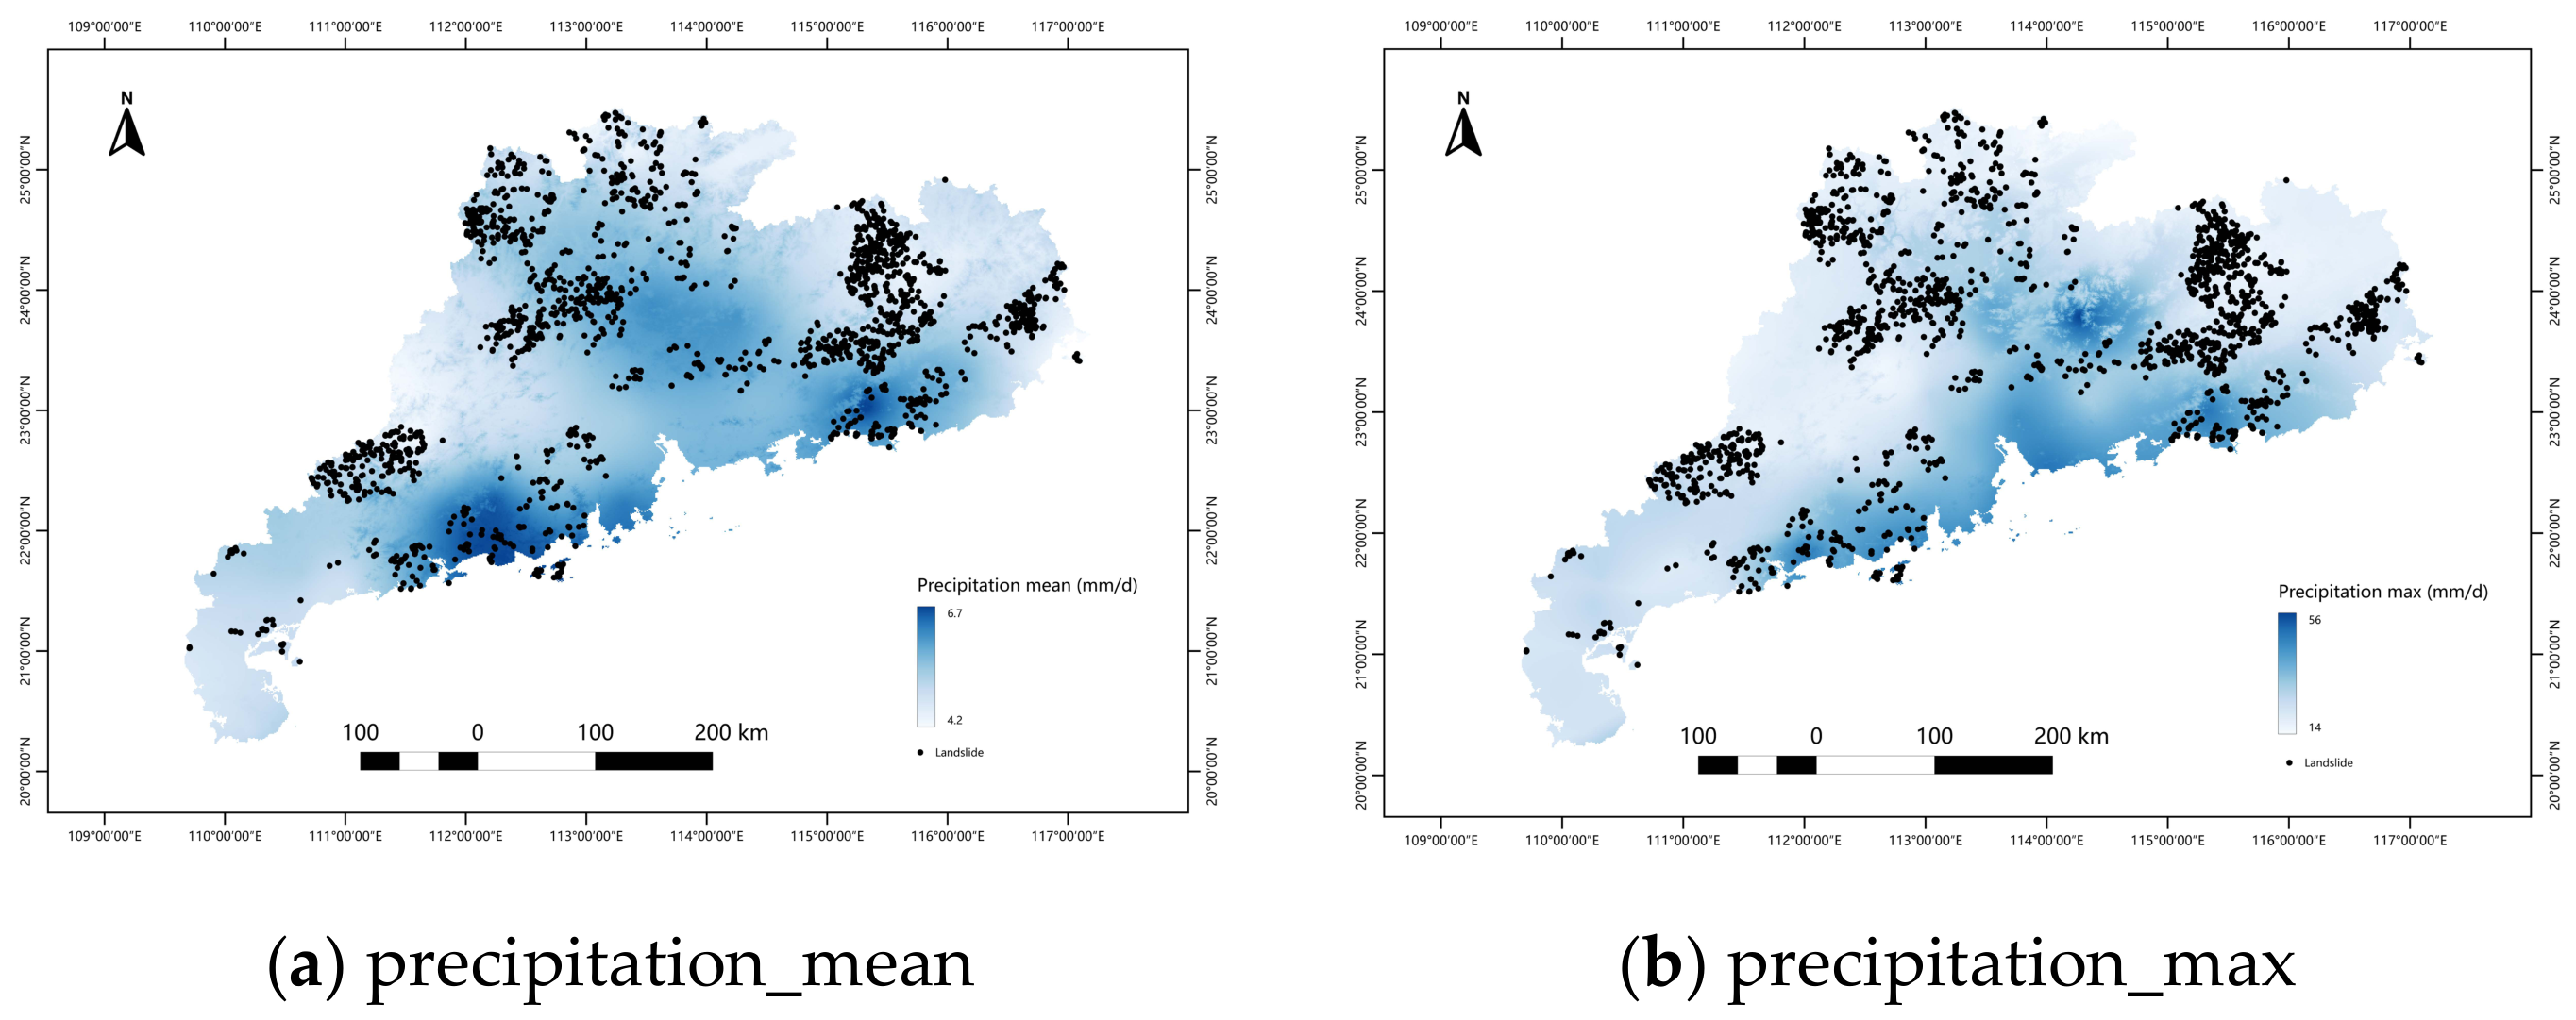
21]. Therefore, precipitation-related factors, including annual average precipitation and extreme rainfall indices, were selected to characterize regional rainfall conditions. The spatial distributions of the precipitation-related factors are shown in
Figure 8.
2.3. Data Preprocessing
To eliminate discrepancies among multi-source datasets in terms of spatial resolution, coordinate systems, data formats, and measurement scales, and to improve the stability and reliability of model training, all datasets underwent unified preprocessing prior to model construction.
First, all environmental factors were spatially aligned and resampled using DEM data as the reference. After removing records with missing or invalid raster values, 1439 valid landslide inventory points were retained as positive samples for landslide susceptibility modeling. Subsequently, a 1000 m buffer was established around the historical landslide points. At the same time, candidate non-landslide points within the buffer zones were excluded to reduce the possibility of incorrectly selecting potential landslide or near-landslide areas as non-landslide samples. Then, stratified random sampling was conducted in the remaining candidate areas based on slope, elevation, and land-cover type, thereby improving the representativeness of the non-landslide samples in terms of topographic and land-cover conditions. Because some landslide points corresponded to invalid values in the environmental factor rasters, invalid samples were removed, and the remaining valid positive and negative samples were further balanced at a 1:1 ratio. Finally, the sample dataset used for model training and validation was constructed.
During the model development stage, the dataset was randomly divided into training and testing subsets at a ratio of 7:3. The training set was used for model construction, and the testing set was employed to evaluate model performance and generalization capability.
To avoid severe multicollinearity among environmental factors, the Variance Inflation Factor (VIF) analysis was conducted for all variables. Generally, a VIF value greater than 10 indicates strong multicollinearity among variables. As shown in
Table 2, the maximum VIF value of all environmental factors in this study was 4.9, which is below the threshold value of 10. This result indicates that no severe multicollinearity exists among the selected variables; therefore, all 20 environmental factors were retained as input variables for model development.
2.4. XGBoost
Compared with traditional statistical models, machine learning approaches are more effective in handling the coupling relationships among high-dimensional, multi-source, and complex nonlinear environmental factors. Therefore, they have been widely applied in landslide susceptibility assessment studies in recent years [
13,
14]. Compared with conventional statistical methods, machine learning models generally exhibit stronger nonlinear representation capability and better generalization performance, thereby improving the spatial prediction accuracy of landslides [
4]. Among these methods, Random Forest (RF) and Support Vector Machine (SVM) have become representative machine learning models in landslide susceptibility studies, owing to their strong ensemble learning capability and nonlinear classification performance, respectively [
10,
11].
XGBoost is an ensemble learning method based on the additive model framework. Its core concept is to iteratively construct weak learners (decision trees) that continuously fit the residuals generated by the previous iteration, thereby improving overall predictive performance. For a given dataset, the prediction result of the model can be expressed as follows:
where
represents the
-th decision tree,
denotes the functional space of regression trees, and
is the number of trees.
The model is optimized by minimizing the objective function, which consists of a loss term and a regularization term:
where
denotes the loss function (e.g., logarithmic loss), and
represents the regularization term used to control model complexity:
Here, denotes the number of leaf nodes, denotes the weight of the j-th leaf node, and and are regularization parameters used to constrain model complexity and prevent overfitting.
During each iteration, XGBoost employs a second-order Taylor expansion to approximate the loss function, thereby accelerating the optimization process and improving computational efficiency and convergence speed.
Compared with conventional machine learning models, Extreme Gradient Boosting (XGBoost) can effectively capture complex nonlinear relationships and feature interactions among environmental factors through the gradient boosting framework, while also exhibiting strong resistance to overfitting and high computational efficiency [
15]. By incorporating regularization terms, second-order Taylor expansion, and parallel computing mechanisms, XGBoost can effectively improve model generalization performance while reducing model complexity [
15]. Owing to its strong capability in handling high-dimensional data, complex environmental variables, and feature interactions, XGBoost has been widely applied in landslide susceptibility assessment studies in recent years [
16]. Previous studies have demonstrated that XGBoost performs well for high-dimensional features, nonlinear relationships, and class imbalance problems, and has achieved high predictive accuracy in various geological hazard susceptibility assessments [
16].
To reduce the risk of overfitting, fixed empirical parameters were not adopted in this study. Instead, hyperparameter optimization was performed using RandomizedSearchCV. The parameters searched included n_estimators, max_depth, learning_rate, subsample, colsample_bytree, min_child_weight, gamma, reg_alpha, and reg_lambda. Model evaluation was conducted using 5-fold stratified cross-validation to obtain more robust performance estimates. The optimized XGBoost model parameters used in this study are listed in
Table 3.
2.5. SHAP
Although machine learning models can effectively improve the predictive accuracy of landslide susceptibility assessments, the internal decision-making processes of ensemble learning models are often highly complex. This makes it difficult to directly interpret the contributions of environmental factors to prediction results. This limitation restricts the application of such models in geoscientific mechanism analysis [
17]. To enhance model interpretability, the SHapley Additive exPlanations (SHAP) method, grounded in the Shapley value theory from cooperative game theory, was introduced to quantify the contribution of each environmental factor to the model prediction and reveal the direction (positive or negative) and nonlinear effects of individual variables [
17]. The ability of TreeSHAP to efficiently interpret tree-based model structures has led to the widespread application of SHAP for the interpretability analysis of ensemble learning models such as Random Forest and XGBoost [
17]. In recent years, SHAP has gradually been adopted in landslide susceptibility studies to identify key controlling factors and their underlying mechanisms [
18]. Therefore, this study integrates XGBoost with SHAP to analyze the characteristics and mechanisms that contribute to and influence environmental factors, thereby improving the interpretability of landslide susceptibility assessment results.
After model construction, the SHAP framework was employed to interpret both individual samples and the overall XGBoost model. Based on the Shapley value principle in cooperative game theory, SHAP quantifies the marginal contribution of each feature to a given sample. The SHAP value can be expressed as a linear combination of feature contributions:
where
denotes the model output for sample
,
represents the baseline prediction of the model when all features are absent (typically the mean value of the training dataset), and
denotes the contribution of feature
to the prediction result, namely the Shapley value.
The Shapley value is calculated as follows:
where
denotes the full set of features,
S denotes a subset of features, excluding feature
, and
represents the model prediction using only the feature subset
. The sign of the Shapley value indicates the feature’s direction of influence on the model output (positive values indicate an increasing effect, whereas negative values indicate a decreasing effect), and its magnitude reflects the strength of the contribution.
By calculating the SHAP values of all environmental factors, their degree of contribution and direction of influence could be quantified for individual factors regarding landslide occurrence from both global and local perspectives. This approach provides an interpretable basis for identifying the dominant controlling factors and nonlinear response mechanisms underlying landslide formation, thereby offering theoretical support and practical guidance for model reliability evaluation, visualization, and variable importance analysis in landslide susceptibility assessments.
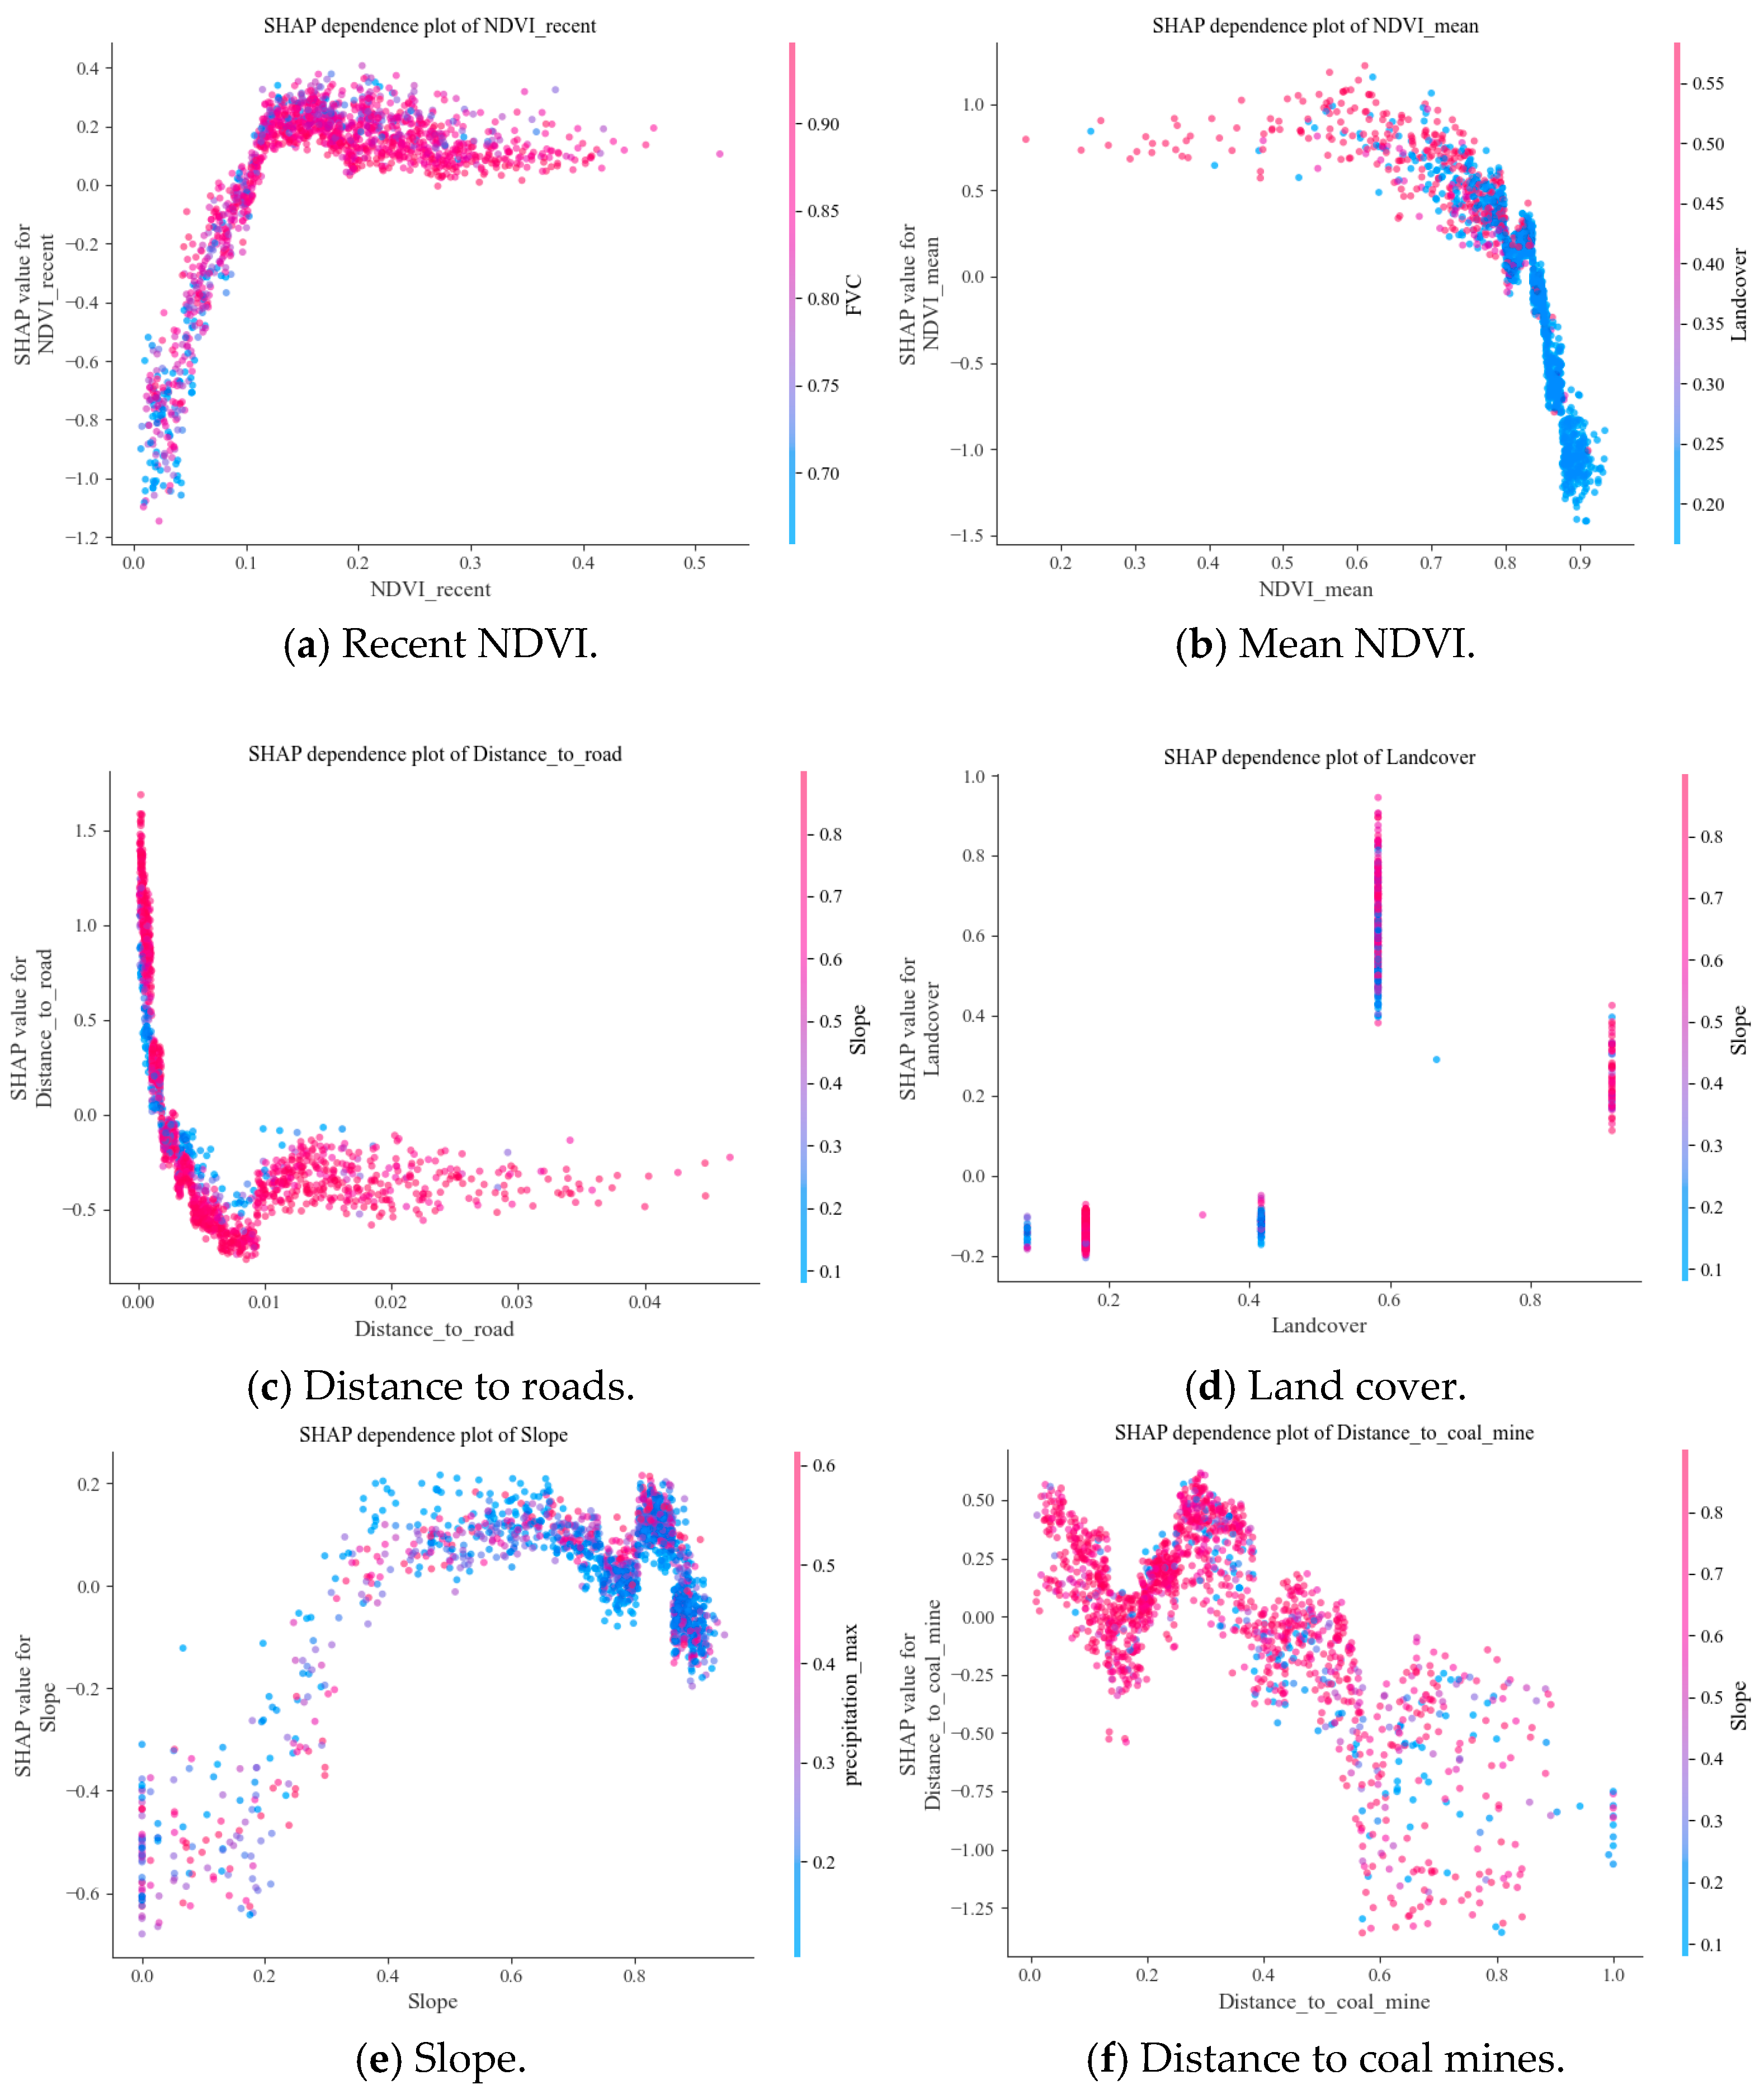
In addition to the SHAP bar plot and beeswarm plot, SHAP dependence plots were generated for the main factors in this study to reveal the nonlinear response relationship between changes in factor values and SHAP values. In addition, potential interaction effects were visualized using color-coded variables.
2.6. Model Construction Workflow
In this study, a landslide susceptibility assessment framework was developed based on the XGBoost model. First, all conditioning factors were spatially aligned and resampled using the DEM raster as the reference layer. Historical landslide points were used as positive samples. For non-landslide samples, candidate points within a 1000 m buffer around historical landslide points were first excluded, and stratified random sampling was then conducted in the remaining areas based on slope, elevation, and land-cover type. After removing samples with invalid raster values, the valid landslide and non-landslide samples were balanced at a 1:1 ratio.
The final sample dataset was divided into training and testing subsets at a ratio of 7:3. A total of 20 environmental conditioning factors were used as input variables for model training. To reduce overfitting, the XGBoost model was optimized using RandomizedSearchCV, and 5-fold stratified cross-validation was applied to evaluate the stability of model performance. The optimized model was then applied to the entire study area to generate the landslide susceptibility probability map. The output values ranged from 0 to 1, with higher values indicating higher landslide susceptibility.
After model training, model performance was evaluated using metrics such as accuracy, precision, recall, F1-score, and receiver operating characteristic curve–area under the curve (ROC-AUC). In addition, the SHAP method was employed to analyze the contribution and influence mechanisms of different environmental factors. Spatial data preprocessing, raster alignment, and map visualization were performed using QGIS 4.0.1. The machine-learning modeling and interpretability analysis were implemented in Python 3.10 using XGBoost 1.7.6, scikit-learn 1.7.2, and SHAP 0.48.0.
3. Results
3.1. Landslide Susceptibility Zonation Map
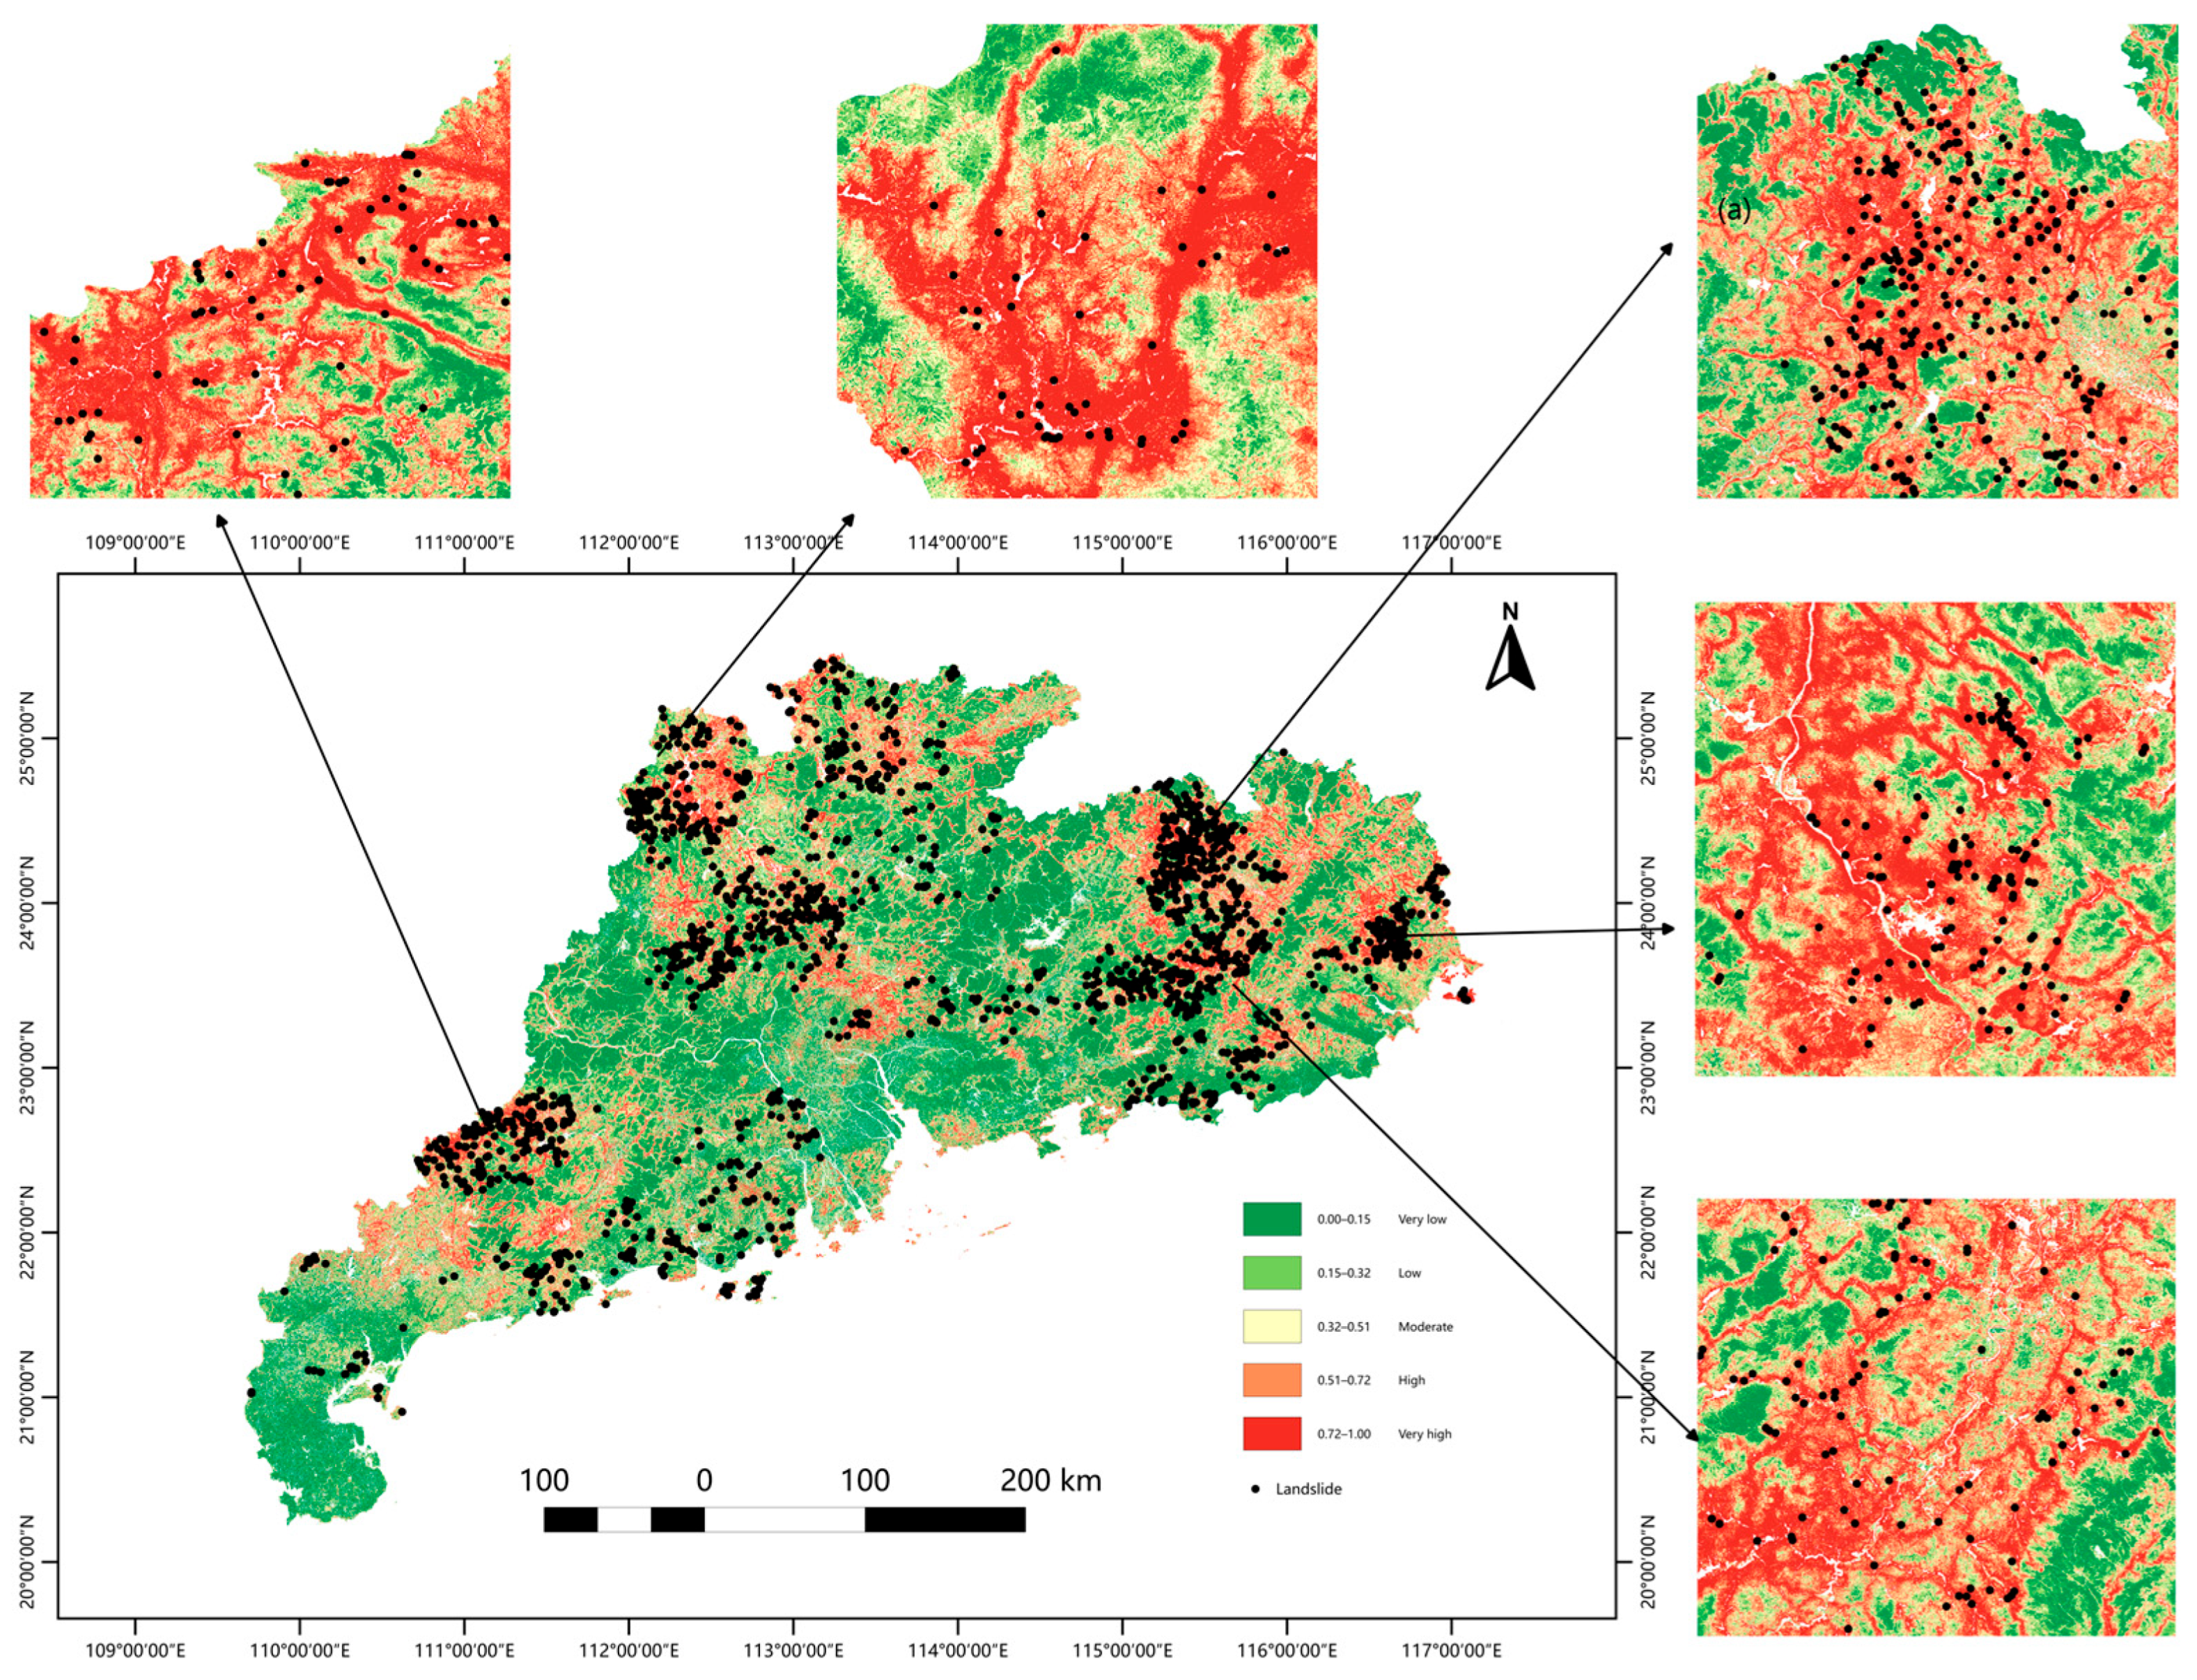
By applying the trained XGBoost model to the entire study area, landslide susceptibility prediction was conducted across the region. Based on the landslide susceptibility probability values generated by the model, the Natural Breaks (Jenks) classification method was employed to divide the study area into five susceptibility levels: very low, low, moderate, high, and very high. Subsequently, a landslide susceptibility zonation map was generated. This method identifies class breaks according to the internal distribution of susceptibility probabilities and minimizes within-class variance. In this study, equal interval and quantile classifications were also examined for comparison, and the main spatial pattern of high-susceptibility areas was similar among the various methods. Jenks’ classification was retained because it better reflects the clustered distribution of susceptibility probabilities and avoids the need for equal class widths and area proportions. It should be noted that this classification was used only for map visualization and zonation; model evaluation was based on continuous probability outputs and independent testing samples.
Considering the spatial distribution of landslide inventory points, most historical landslides are concentrated in the red and orange zones, showing a strong spatial correspondence with the high-susceptibility areas identified by the model. This result indicates that the model can effectively capture the spatial heterogeneity characteristics of landslide hazards in Guangdong Province.
The mountainous regions in northern and eastern Guangdong are characterized by strong topographic relief and relatively fragile ecological environments. Under the combined influences of terrain conditions, intense precipitation, and anthropogenic activity, these regions exhibit a relatively high risk for landslides. The high-susceptibility zones in Guangdong Province are mainly distributed in the mountainous and hilly areas of northern Guangdong and eastern Guangdong, as well as the peripheral hilly areas surrounding the Pearl River Delta. By contrast, the Pearl River Delta plain generally exhibits relatively higher stability. As shown in
Figure 9, high-susceptibility areas are primarily concentrated in Qingyuan, Shaoguan, Heyuan, Meizhou, northern Huizhou, as well as Chaozhou and Jieyang, with scattered distributions also occurring in the hilly regions of western Guangdong. This spatial distribution pattern is generally consistent with previous studies on landslides in Guangdong Province and the mountainous regions of South China [
7,
8].
3.2. Model Accuracy Evaluation
To quantitatively evaluate the model’s performance in landslide susceptibility prediction, a confusion matrix was employed on both the training and testing datasets. Multiple statistical metrics were used, including accuracy, precision, recall, and area under the ROC curve (AUC).
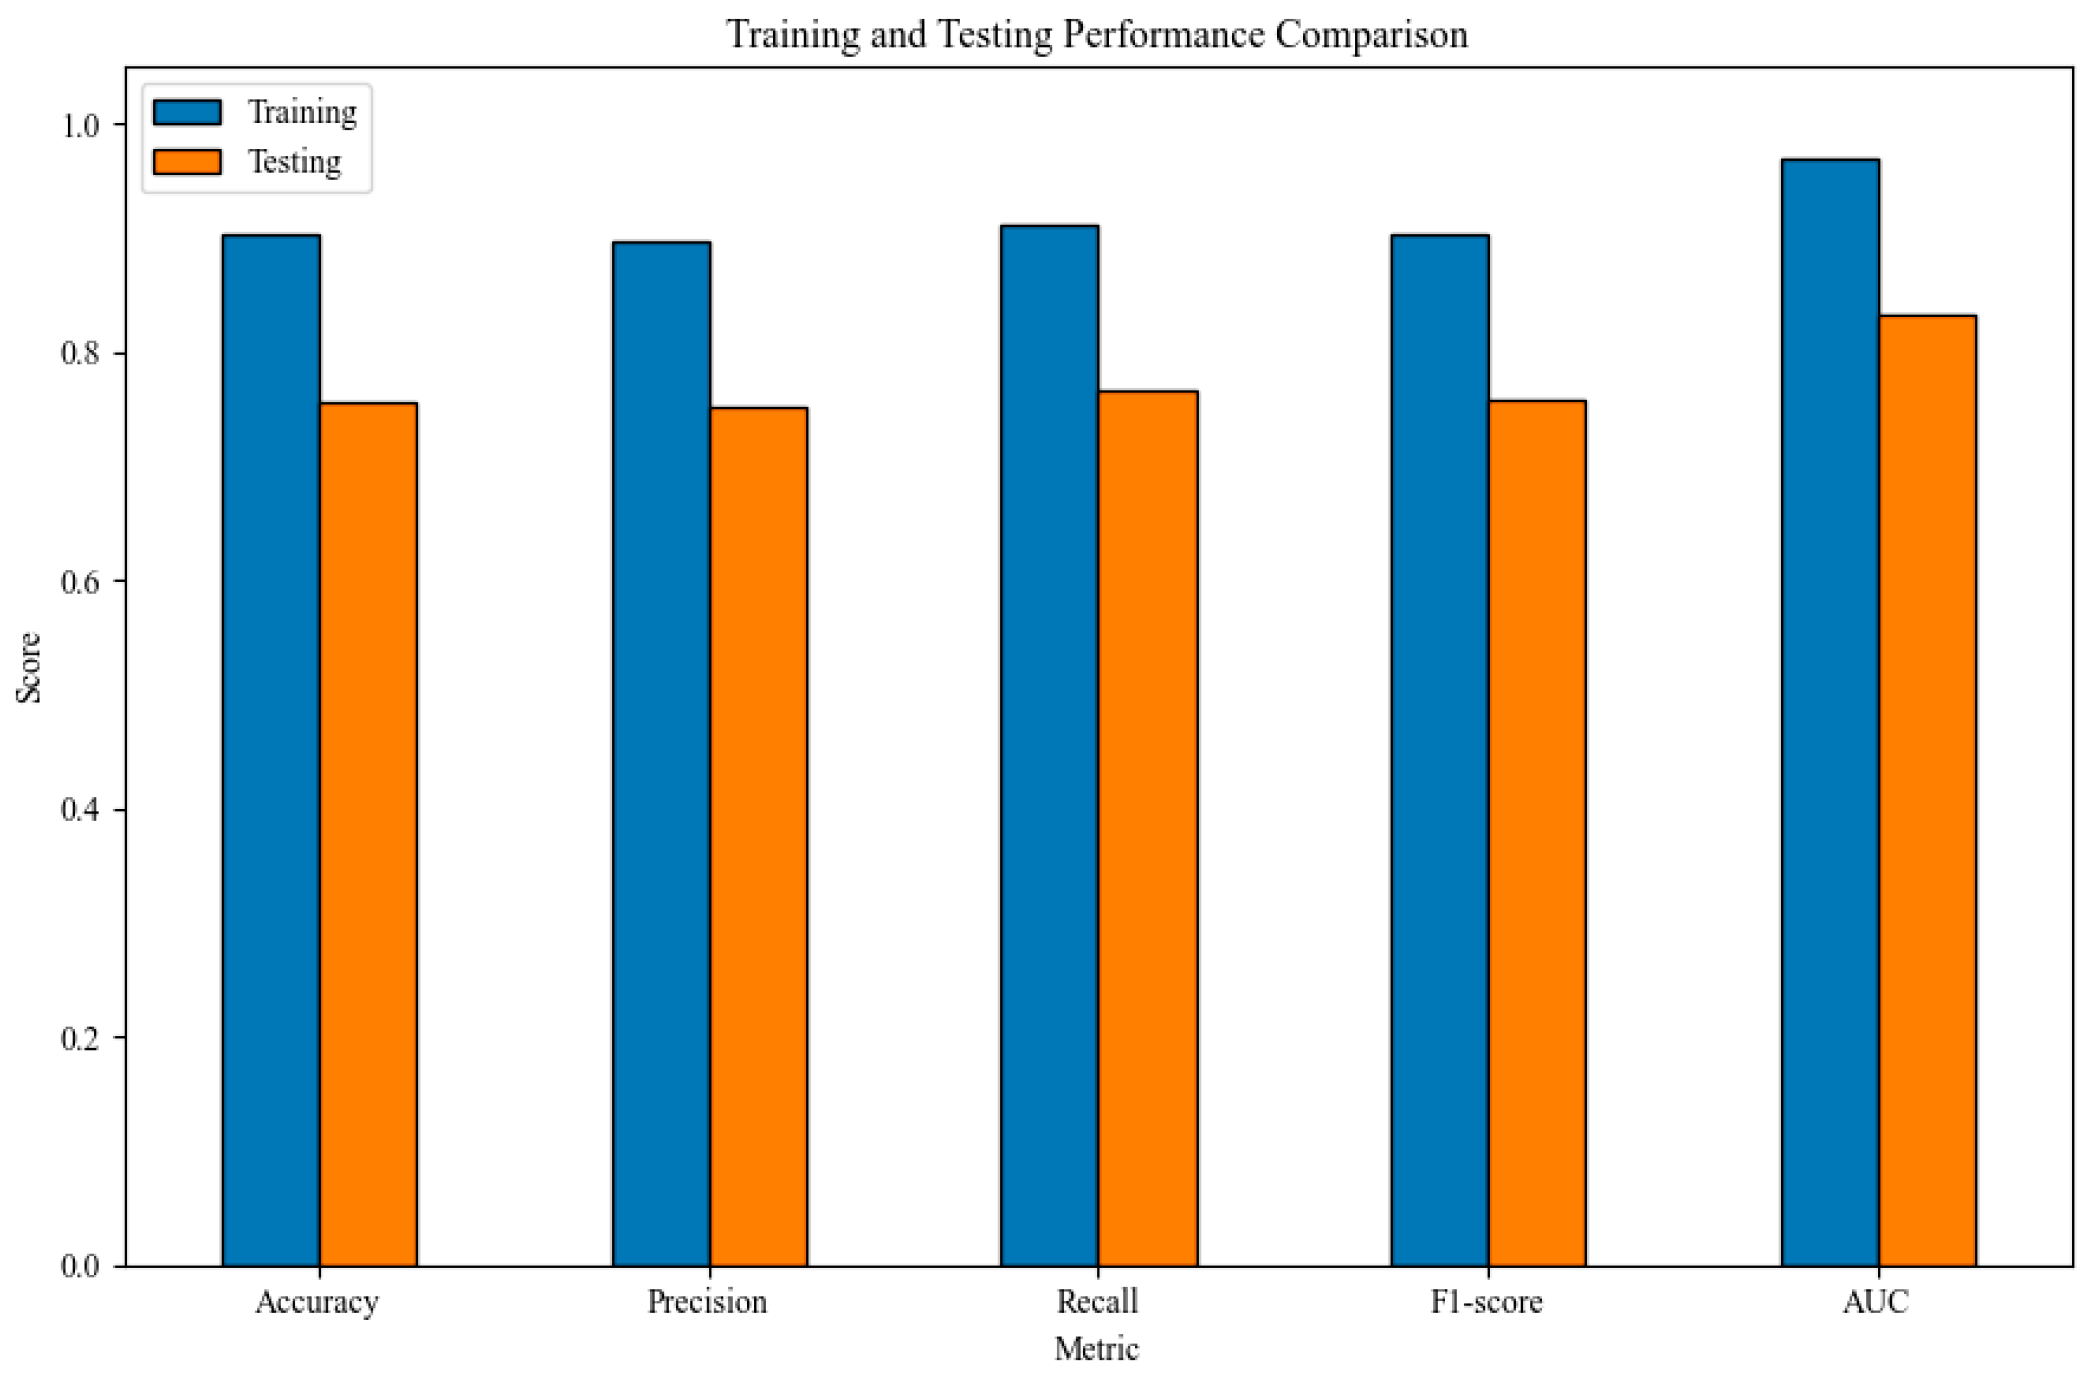
The results showed that the model’s accuracy, precision, recall, F1-score, and AUC on the training set were 0.9037, 0.8974, 0.9116, 0.9044, and 0.9691, respectively. Based on the independent test set, the corresponding values were 0.7569, 0.7523, 0.7662, 0.7592, and 0.8335, respectively. The results of five-fold stratified cross-validation showed that the model achieved an accuracy of 0.7630 ± 0.0249, precision of 0.7568 ± 0.0245, recall of 0.7755 ± 0.0336, F1-score of 0.7658 ± 0.0256, and AUC of 0.8457 ± 0.0219. The detailed performance evaluation results of the XGBoost model are summarized in
Table 4. These results indicate that the model maintained relatively stable predictive performance under different data partitions.
A comparison of the main evaluation metrics between the training and testing datasets is shown in
Figure 10. By comparing the evaluation metrics of the training and testing datasets, it is clear that all performance indicators on the training dataset are notably higher than those on the testing dataset. The AUC decreased from 0.9691 on the training set to 0.8335 on the testing set, with a gap of 0.1356, indicating that the model still has a certain degree of overfitting. However, the testing AUC remained above 0.80, suggesting that the model maintained reasonable ranking capability and discrimination performance on unseen samples. The recall value decreased from 0.9116 to 0.7662, indicating that the model’s ability to identify landslide samples was weaker on the testing dataset. Overall, the model achieved acceptable generalization performance, although further improvement is still needed, particularly with regard to recall.
3.3. ROC Curve and Confusion Matrix Analysis
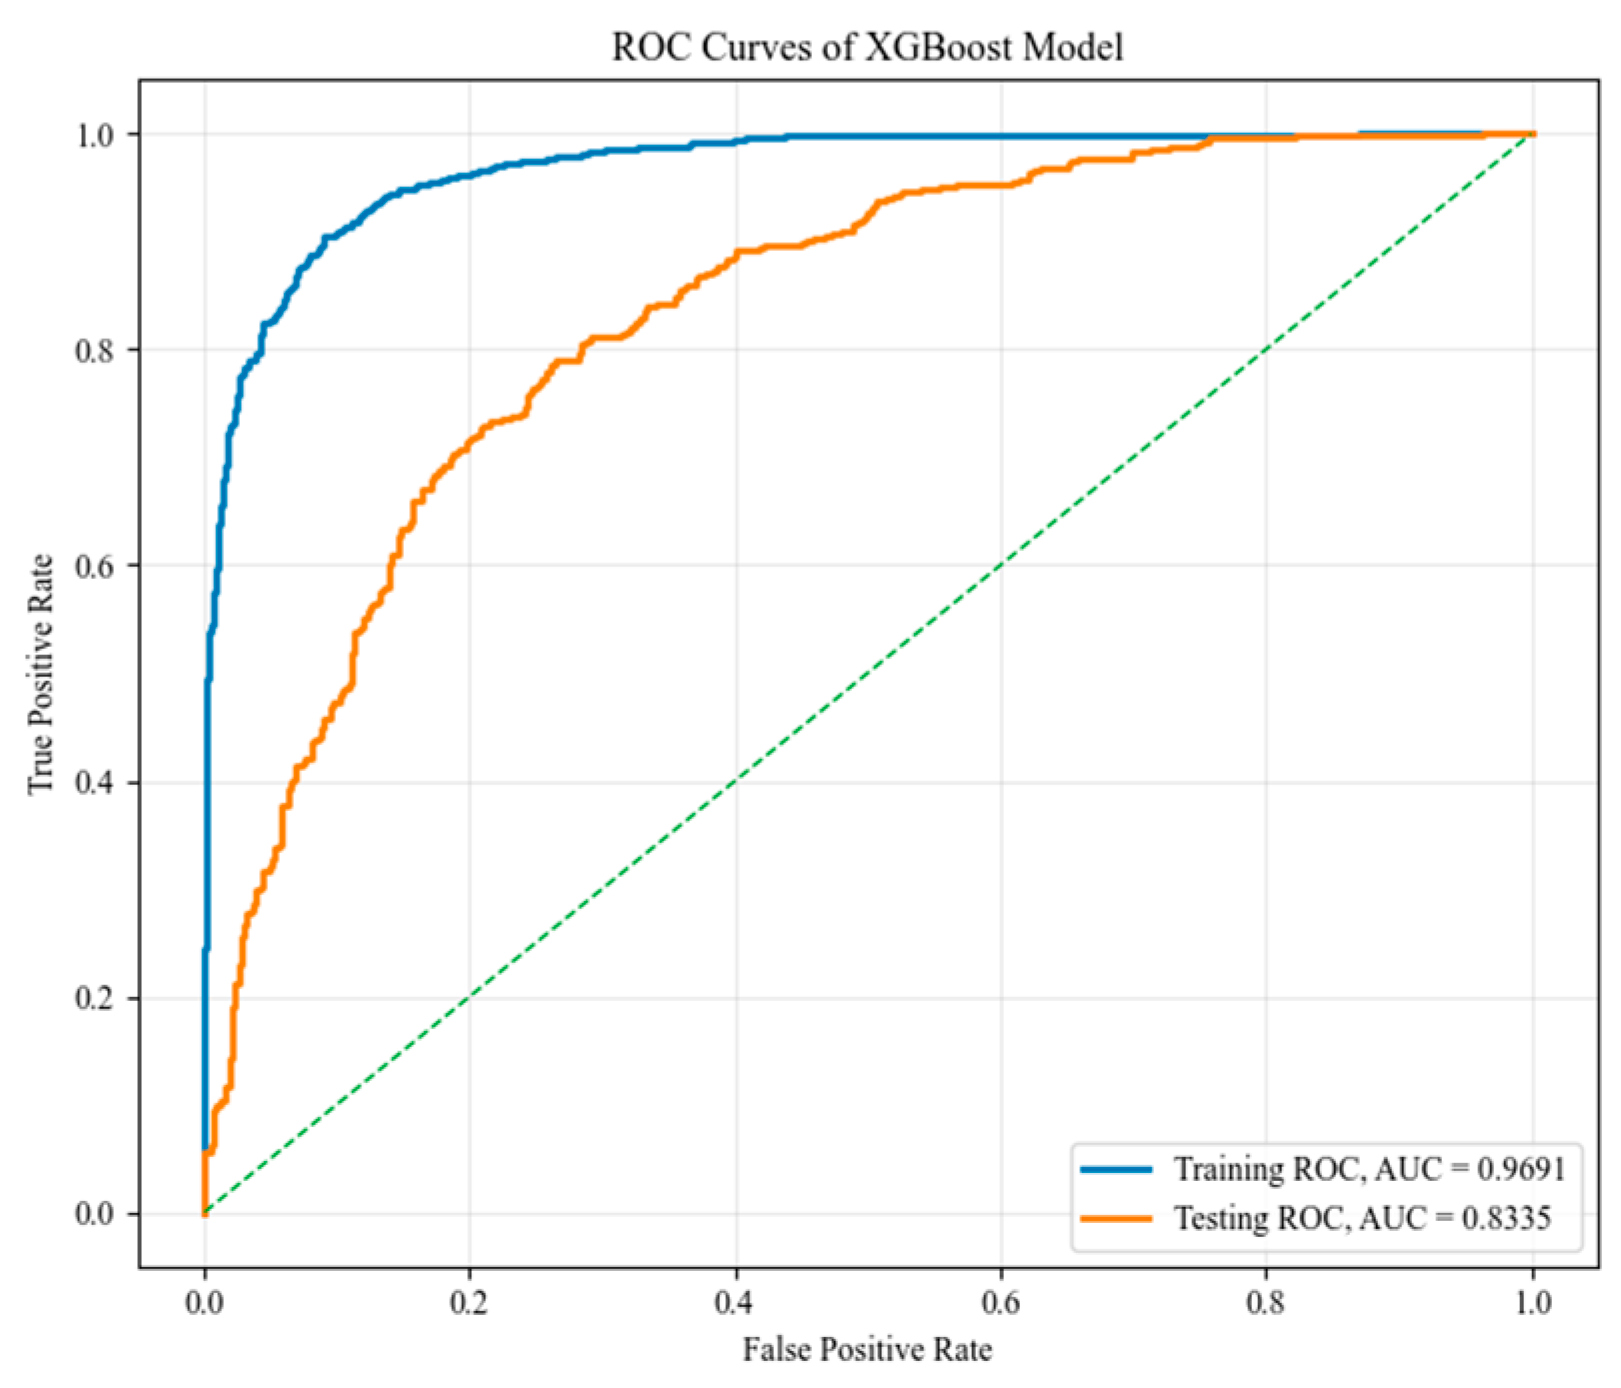
Figure 11 shows the ROC curves of the XGBoost model for the training and independent testing datasets. The AUC values were 0.9691 for the training set and 0.8335 for the testing set. The training curve is near the upper-left-hand part of the plot, indicating a strong fit to the training samples. The testing curve is also well above the diagonal reference line, suggesting that the model can separate landslide and non-landslide samples when applied to unseen data.
The lower AUC obtained from the testing set compared with the training set indicates that some overfitting remains. However, the testing AUC of 0.8335 shows that the model still has acceptable discrimination ability for regional landslide susceptibility mapping. Considering the complexity of landslide occurrence and the heterogeneity of environmental conditions in Guangdong Province, this level of performance is reasonable for a provincial-scale assessment. Therefore, the susceptibility map should be used mainly to identify areas with relatively high landslide potential and to support regional screening, rather than to replace detailed site-specific hazard investigation.
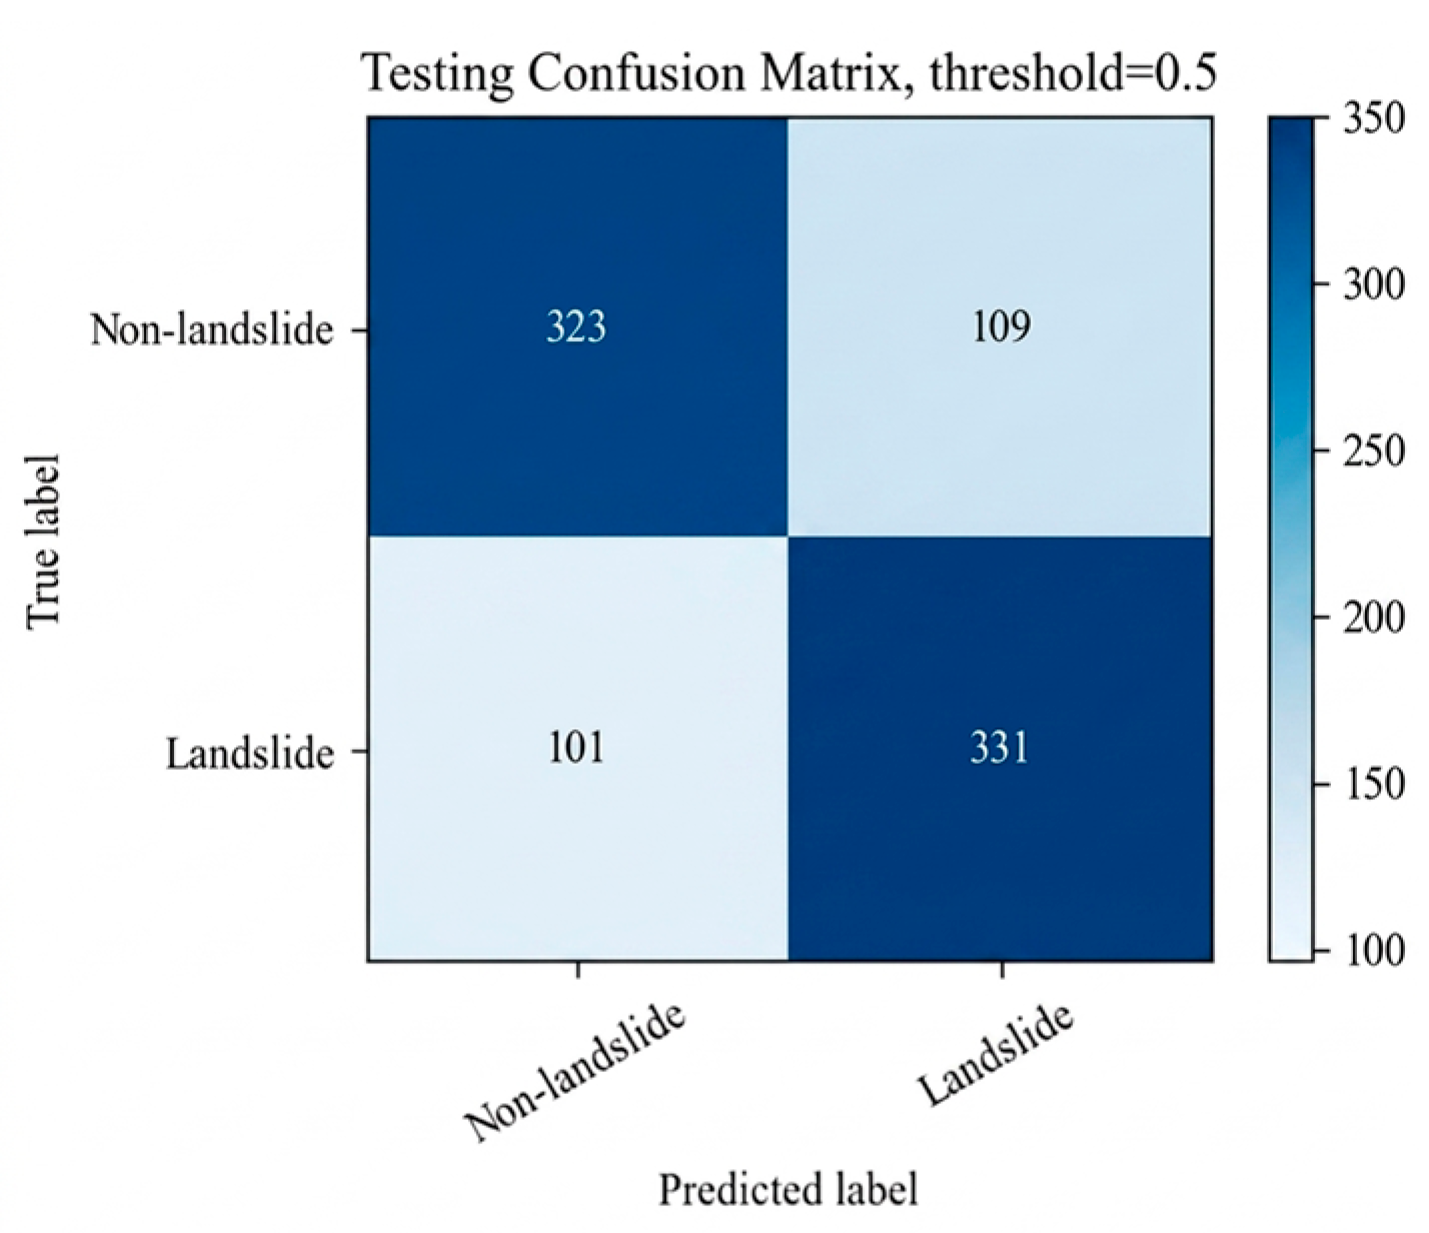
The confusion matrix of the testing dataset at a classification threshold of 0.5 is shown in
Figure 12. Among the 432 non-landslide samples included, 323 were correctly classified as non-landslide instances, and 109 were misclassified as landslide events. For the 432 landslide samples, 331 were correctly identified, and 101 were classified as instances of non-landslide.
Based on these results, the model achieved a testing accuracy of 0.7569. The precision and recall for the landslide class were 0.7523 and 0.7662, respectively, with an F1-score of 0.7592. These values indicate that the model maintained a relatively balanced performance in identifying landslide and non-landslide samples. The number of missed landslide samples was slightly lower than the number of false alarms, suggesting that the model tended to identify landslide-prone conditions with moderate sensitivity at the selected threshold.
3.4. Feature Importance Analysis
To further investigate the contribution of individual factors in the XGBoost model to landslide susceptibility prediction, the SHAP (SHapley Additive exPlanations) method was employed for each environmental factor.
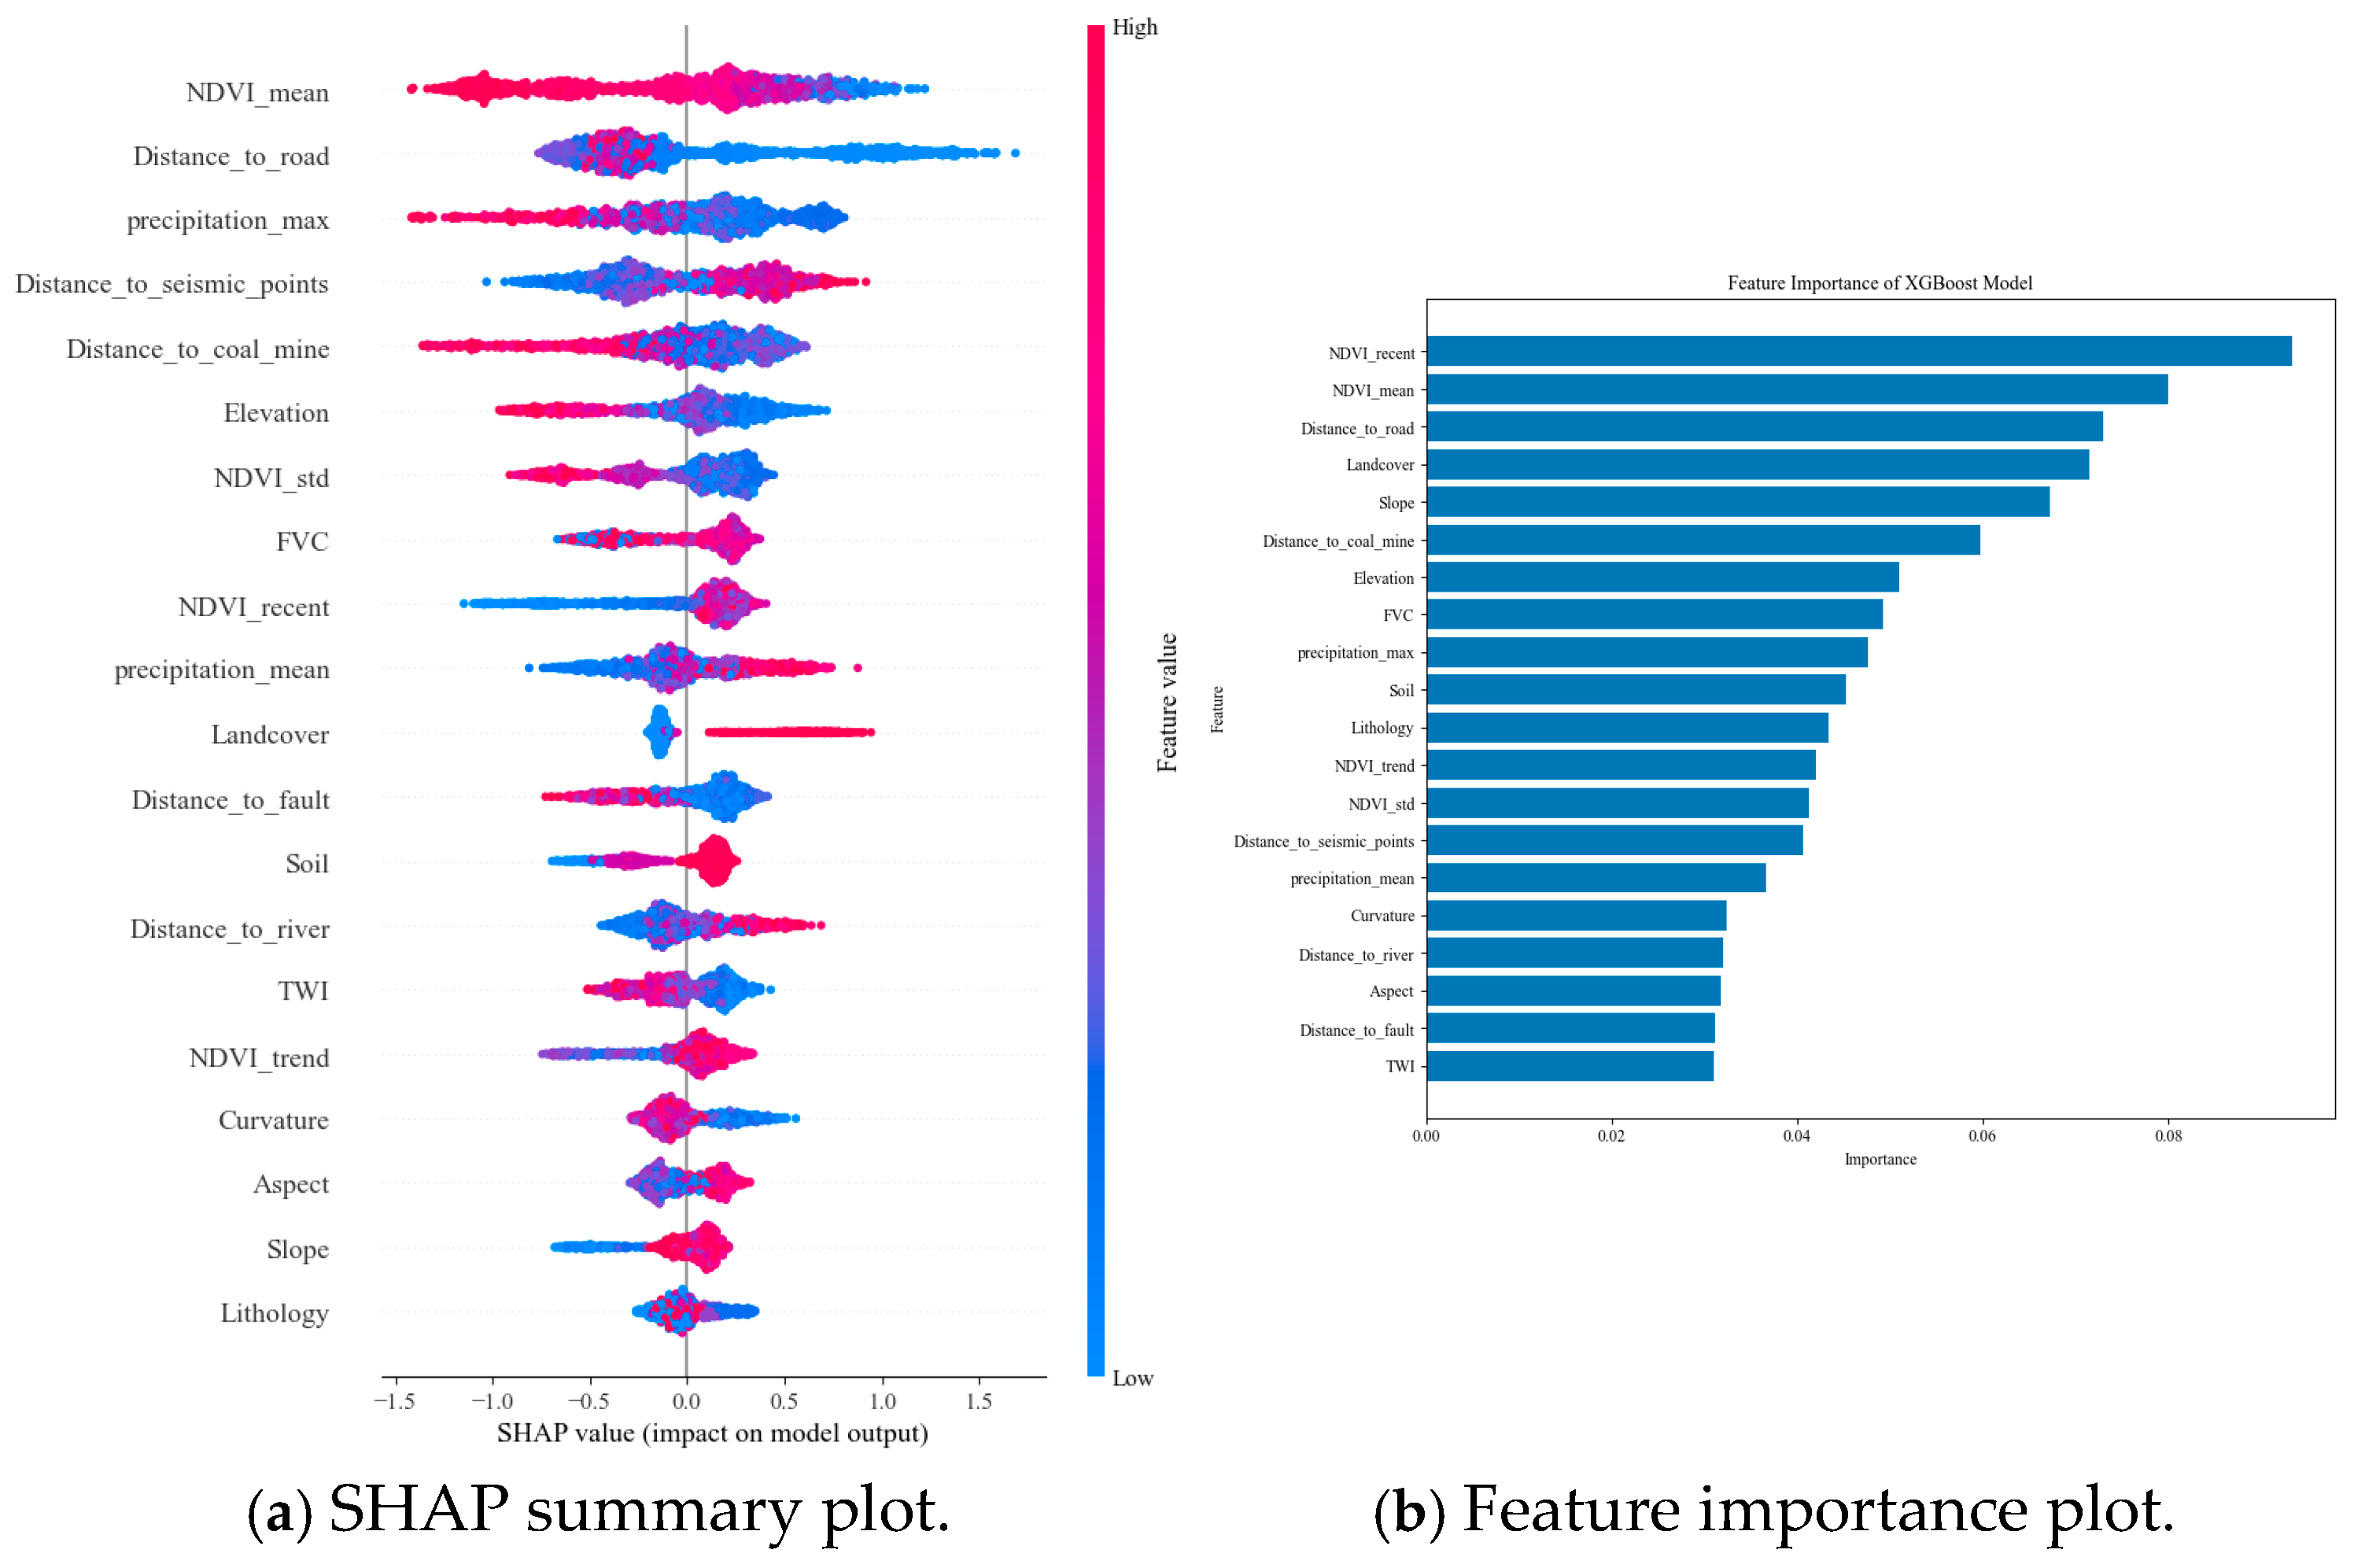
Figure 13a shows the SHAP summary plot, and
Figure 13b shows the feature importance results for the XGBoost model. Among the 20 conditioning factors, vegetation-related variables and human activity factors contributed strongly to the model. NDVI_recent and NDVI_mean ranked as the two most important variables, followed by distance_to_roads, land cover, slope, and distance_to_coal_mines. This ranking indicates that recent vegetation conditions, long-term vegetation cover, road disturbance, land-cover type, terrain gradient, and mining activity were closely related to landslide occurrence in the study area.
The SHAP summary plot further shows the direction and distribution of each factor’s contribution. For distance_to_roads, lower values generally produced positive SHAP values, suggesting that areas closer to roads had higher predicted landslide susceptibility. This is consistent with the influence of slope cutting, road construction, and engineering disturbance in mountainous areas. For NDVI-related variables, the SHAP values were widely distributed, indicating that vegetation conditions affected the model in a nonlinear manner rather than through a simple monotonic relationship. Precipitation, elevation, distance to seismic points, and distance to coal mines also showed clear variations in SHAP values, reflecting their local influence on landslide susceptibility.
3.5. SHAP Dependence Plots
As shown in
Figure 14, SHAP dependence plots were used to examine how the main factors affected the model output. In these plots, the x-axis represents the factor value, and the y-axis represents the SHAP value. Positive SHAP values increase the predicted landslide probability, whereas negative values reduce it. The results indicate that most factors showed nonlinear effects rather than simple linear relationships.
Vegetation variables showed clear effects on the model. For NDVI_mean, low-to-moderate values generally corresponded to positive SHAP values, while high values were mostly associated with negative SHAP values. This suggests that areas with better long-term vegetation cover tend to have lower landslide susceptibility. The response of NDVI_recent was more complex. The SHAP values identified for this variable were not simply higher in low-NDVI areas, indicating that recent vegetation conditions may also be affected by seasonality, land-cover type, and human disturbance.
Distance_to_roads showed an obvious distance-decay pattern. Samples close to roads usually had positive SHAP values; however, as the distance from roads increased, SHAP values decreased. This indicates that road construction and related slope disturbance may increase landslide susceptibility near transportation corridors. The color distribution also suggests that this effect is stronger on steeper slopes.
Different land-cover classes showed distinct SHAP distributions. Since land cover is a categorical variable, the numerical codes on the x-axis should not be interpreted as continuous values. The main information provided is the difference in SHAP values among various land-cover types. This reflects the combined effects of vegetation cover, runoff conditions, soil protection, and human disturbance on landslide susceptibility.
Slope also showed a nonlinear response. Gentle slopes mostly had negative SHAP values, while medium to steep slopes had higher SHAP values. However, SHAP values did not increase continuously for the highest slope range. This implies that slope alone cannot explain landslide occurrence, and its effect is related to other factors such as rainfall, lithology, land cover, and slope materials.
Distance_to_coal_mines had a local influence on the model output. SHAP values were generally higher at short to moderate distances from coal mines and decreased with increasing distance. This suggests that mining activity may affect slope stability through surface disturbance, stress changes, and altered drainage conditions; the influence of this variable decreases as the distance from mining areas increases.
4. Discussion
4.1. Primary Controlling Factors
The feature importance and SHAP results show that vegetation-related variables, road proximity, land-cover type, slope, and distance to coal mines are the main contributors to landslide susceptibility in Guangdong Province. NDVI_recent and NDVI_mean significantly contributed, indicating that vegetation conditions are closely related to landslide occurrence in the study area. In Guangdong Province, vegetation cover is influenced by the humid monsoon climate, seasonal rainfall, land-use type, and human disturbance. Therefore, the NDVI not only reflects vegetation density, but is an indicator of slope protection, surface erosion, and soil moisture conditions. The importance of road proximity, slope, land cover, and distance to coal mines further suggests that landslides in northern and eastern Guangdong are controlled by both the conditions of natural terrain and human activities, such as road construction, slope excavation, and mining disturbance.
4.2. Analysis of Model Limitations
There is a certain gap between the ROC curves of the training set and the test set, indicating that the model was subject to a certain degree of overfitting. Despite this, the overall difference remains within an acceptable range. This result is largely consistent with the performance of ensemble learning models reported in geohazard susceptibility assessments in existing studies; while enhancing overall discriminatory ability, these models may be accompanied by a slight decrease in generalization performance. It should be noted that 101 of the 432 landslide samples in the testing dataset were incorrectly classified as non-landslide samples, corresponding to an omission rate of approximately 23.4%. From the perspective of disaster risk management, such false-negative predictions are particularly important because potentially unstable areas may receive insufficient attention or lack preventive measures if they are classified as low-susceptibility zones. Therefore, although the model shows acceptable performance for regional-scale screening, the susceptibility map should be used as a preliminary prioritization tool rather than as the sole basis for site-specific decisions. In practical applications, areas classified as moderate to very high susceptibility should be further evaluated together with rainfall warnings, field surveys, engineering geological conditions, and local hazard records. To reduce missed landslide-prone areas, future studies could adopt a more conservative classification threshold to improve recall or incorporate additional dynamic triggering factors, such as rainfall intensity prior to landslide events, although this may increase the number of false alarms.
Although the proposed model achieved satisfactory predictive performance, certain uncertainties still exist. These uncertainties mainly arise from the following aspects: the completeness and accuracy of the historical landslide inventory cannot be fully guaranteed, and some small-scale landslide events may have been omitted; discrepancies in spatial resolution and acquisition time among multi-source datasets may lead to inconsistencies in feature representation, thereby affecting model stability; and some key controlling factors were not incorporated into the model, limiting its capability to characterize complex landslide mechanisms comprehensively. In particular, the land-cover factor used in this study was derived from a single epoch of GlobeLand30 V2020, whereas the landslide inventory covers a much longer historical period. Therefore, the 2020 land-cover data may not fully represent the actual land-use conditions when some historical landslides occurred. This may introduce uncertainty in areas affected by rapid urbanization, road construction, agricultural expansion, or mining activities. Thus, the contribution of the land-cover variable should be interpreted as reflecting recent land-cover conditions rather than the exact pre-failure land-use state of each landslide. Future studies could reduce this uncertainty by incorporating multi-temporal land-cover products.
4.3. Practical Implications
Despite these limitations, the proposed model still demonstrates strong practical value for regional-scale landslide susceptibility assessment. First, it can effectively identify high-risk areas and provide a reliable basis for landslide susceptibility zonation. Second, the model maintains strong discriminative capability while effectively controlling the false alarm rate, making it suitable for regional screening and priority zoning. Furthermore, for large-scale studies such as provincial-scale assessments, the proposed approach achieves a favorable balance between computational efficiency and predictive accuracy, indicating strong potential for broader application.
Future studies will integrate multi-temporal datasets and explore transfer learning approaches to further improve the applicability and generalization capability of the model across different regions and temporal scales.
5. Conclusions
In this study, a regional-scale landslide susceptibility assessment model for Guangdong Province was constructed based on multi-source environmental factors.
High-susceptibility zones are mainly distributed in the mountainous regions of northern Guangdong, the hilly areas of eastern Guangdong, and the peripheral hilly zones surrounding the Pearl River Delta, showing strong spatial consistency with the distribution of historical landslide inventory points.
The model achieved an AUC value of 0.8335 for the testing dataset, indicating its good predictive capability and generalization performance.
The SHAP analysis revealed that vegetation-related variables, road proximity, land-cover type, slope, and distance to coal mines are the major controlling factors influencing landslide occurrence in the study area. This finding indicates that landslide formation in Guangdong Province is jointly controlled by vegetation conditions, terrain characteristics, and anthropogenic activities. Furthermore, the results demonstrate that the landslide formation process exhibits pronounced multi-factor coupling and nonlinear response characteristics [
4].