Article

Improving Assimilation of Polar-Orbiting Satellite Microwave Radiances over the Tibetan Plateau Using a Gaussian–Flat Variational Quality Control

1
State Key Laboratory of Climate System Prediction and Risk Management, Nanjing University of Information Science and Technology, Nanjing 210044, China
2
Hunan Meteorological Data Center, Hunan Meteorological Bureau, Changsha 410118, China
3
Guangzhou Institute of Tropical and Marine Meteorology, China Meteorological Administration, Guangzhou 510640, China
4
Xizang Meteorological Administration, Lhasa 510640, China
*
Author to whom correspondence should be addressed.
Remote Sens. 2026, 18(12), 2029; https://doi.org/10.3390/rs18122029
Submission received: 6 May 2026 / Revised: 14 June 2026 / Accepted: 15 June 2026 / Published: 18 June 2026

Highlights

What are the main findings?
  • The Flat-VarQC significantly increases the effective assimilation rate of polar-orbiting satellite microwave observations over the Tibetan Plateau (by approximately 4–28%) by recovering observations rejected by conventional quality control.
  • The differences in the analysis weights of the temperature channel and the humidity channel in Flat-VarQC are revealed.
  • The scheme shows better applicability and effectiveness for microwave temperature sounders than for microwave humidity sounders, with more reasonable weights for temperature observations.
  • A Gaussian–Flat variational quality control suitable for improving the assimilation of satellite data over the Tibetan Plateau is developed.
  • Optimizing the key parameters enables more effective use of multi-channel microwave observations from multiple polar-orbiting satellites under complex terrain conditions over the Tibetan Plateau, providing reference parameter schemes in operational assimilation systems.
What are the implications of the main findings?
  • The improved assimilation of satellite observations enhances the analysis of key dynamic and moisture fields, thereby improving forecasts of heavy precipitation over the Tibetan Plateau.
  • The parameter optimization for Flat-VarQC provides a practical reference for assimilating satellite observations over data-sparse regions with complex terrain.

Abstract

The evolution of weather systems over the Tibetan Plateau (hereinafter referred to as the Plateau) significantly affects the quality of numerical weather prediction in its surrounding areas and downstream regions. Given the scarcity and relatively low quality of conventional observations over the Plateau, satellite observations with high spatial and temporal resolution are particularly important. However, the complex surface conditions of the Plateau severely limit the effective application and assimilation performance of satellite observations. The variational quality control (VarQC) scheme has demonstrated strong capability to reasonably utilize observations of varying quality to improve assimilation analyses. In view of this, this study developed a variational quality control scheme based on the non-Gaussian characteristics of observation errors, specifically a scheme based on a “Gaussian + flat” distribution (Flat-VarQC), tailored for satellite observations over the Plateau. Key parameters of the scheme are optimized for polar-orbiting satellite microwave sounders, enabling more appropriate adjustment of the observation weights in the assimilation process based on the innovations, thereby increasing the effective assimilation rate of polar-orbiting satellite microwave sounding data over the Plateau and improving the quality of analyses. Experimental results indicate that observation errors of satellite observations over the Plateau exhibit pronounced fat-tailed distribution characteristics. The conventional Gaussian assumption in variational assimilation schemes leads to a low effective assimilation rate of observations, thereby reducing the contribution of polar-orbiting satellite microwave sounding data to the analyses over the Plateau. The proposed Flat-VarQC scheme significantly improves the effective assimilation rate of both conventional and satellite observations over the Plateau, incorporates more beneficial observational information, and eliminates harmful observational information, thereby enhancing the positive contribution of observations to assimilation analyses. This scheme leads to particularly significant improvements in the assimilation of spaceborne microwave temperature sounder observations over the Plateau and in forecasts of heavy precipitation associated with meso- and micro-scale weather systems.

1. Introduction

Meteorological satellites and numerical weather prediction (NWP) are two of the most remarkable scientific achievements in meteorology over recent decades, and their developments are mutually reinforcing [1,2]. The Tibetan Plateau (hereinafter referred to as the Plateau) is a key driver of the global climate system. However, its complex land–atmosphere coupling processes pose severe challenges to NWP. Conventional observations in this region are sparse and of relatively low quality. As a result, they cannot satisfy the operational requirements of high-precision NWP. Satellite observations offer high resolution and extensive coverage. In theory, they can provide critical information for data-sparse regions like the Plateau, thereby improving NWP performance [3,4,5,6]. Nevertheless, satellite observations also introduce multiple technical bottlenecks in assimilation due to their retrieval methods and observational characteristics. Significant systematic biases [7,8] and cloud contamination in rainy areas [9] severely restrict their assimilation effectiveness. These issues are further exacerbated over the Plateau due to its complex terrain and high elevation. Consequently, the potential contribution of satellite observations to improving NWP quality is substantially limited over the Plateau.
Currently, satellite data assimilation based on variational schemes must satisfy the assumption that observation errors are unbiased and follow a Gaussian distribution [2]. However, satellite observations exhibit larger errors and more irregular error distributions than conventional observations [1]. Over the Plateau, observation errors exhibit even more pronounced “fat-tailed distribution” characteristics [10]. Therefore, more diverse and sophisticated quality control (QC) strategies are required to fully utilize satellite observations. Routine QC pre-processing strategies are performed independently prior to assimilation, including background checks [11], extreme value checks, channel selection, limb checks, and surface-type detection. These processes directly result in the rejection of a large quantity of valid satellite observations [1]. In addition, cloud detection in clear-sky assimilation further reduces the effective assimilation rate of satellite observations. Over the Plateau, complex terrain and highly variable upper-cloud conditions exacerbate this problem [6]. Numerous studies have attempted to address the low effective assimilation rate of satellite observations. These include all-sky assimilation [6,12,13,14,15,16], expansion of usable channels [17,18,19], and development of fast radiative transfer models suitable for complex surface conditions [20,21]. Among these approaches, variational quality control (VarQC) provides a new way to improve the effective assimilation rate of satellite observations [22]. Statistical analyses consistently indicate that actual satellite observation errors often follow the fat-tailed distribution rather than the Gaussian distribution [23,24]. This characteristic is particularly pronounced over high-altitude regions with complex terrain [6,10]. Therefore, VarQC schemes based on non-Gaussian error models have great potential and application value for satellite data assimilation over the Plateau.
Variational quality control originated from the recognition that observation errors often follow non-Gaussian distributions [25]. These errors typically consist of two components: random errors, which are Gaussian, and gross errors, which are non-Gaussian. Based on this theoretical framework, a QC method for conventional observations was later implemented within the optimal interpolation scheme (OIQC), and this approach achieved considerable success [26]. Building on this foundation, Ingleby and Lorenc proposed a “Gaussian + flat” error model [27]. Using Bayesian probability theory, they further developed VarQC, a method that integrates quality control directly into the variational assimilation system. The European Centre for Medium-Range Weather Forecasts (ECMWF) was the first to implement VarQC for conventional observations within a variational assimilation system [28], and their work demonstrated that VarQC is superior to and can completely replace OIQC. Subsequently, the VarQC scheme based on the “Gaussian + flat” distribution (Flat-VarQC) achieved further success and has since been successfully applied in operational NWP systems [29,30]. Currently, Flat-VarQC is primarily used to improve the assimilation quality of conventional observations, and it is also being gradually extended to radar and satellite data assimilation [31,32,33,34]. Within the WRFDA system, Flat-VarQC has been preliminarily applied to conventional observations over the Plateau, with some positive results [10]. However, due to the inherent characteristics of satellite observations, the beneficial impact of Flat-VarQC in satellite data assimilation remains limited. This is especially true over the Plateau, where surface conditions are complex. Further in-depth investigation is needed into the applicability and effectiveness of Flat-VarQC in this region. Optimizing the key parameters of VarQC based on different channels can improve the effective assimilation rate of polar-orbiting satellite microwave sounding observations, which in turn enhances the forecast performance of meso- and micro-scale heavy precipitation [35].
Extensive research has been conducted based on Flat-VarQC. VarQC for conventional observations has been shown to improve effective assimilation and suppress the negative impact of harmful data, thereby enhancing the assimilation of mass fields [30]. Research also indicates that VarQC offers significant potential and application value for NWP data assimilation. Satellite observations with relatively low quality and more complex error characteristics are a key example. In particular, important progress has been made in all-sky satellite data assimilation [33]. However, over the Plateau, the effective assimilation rate and analysis quality of satellite observations are significantly reduced due to complex terrain conditions, which has become the main bottleneck limiting the development of NWP over the Plateau. Compared to previous studies on conventional observations over the Plateau [10], this study applies the Flat-VarQC scheme, originally developed for conventional observations, to satellite data assimilation over the Plateau. Several heavy rainfall events occurred over the Plateau in June 2017, including a local rainstorm near Lhasa on 21–22 June of that year. The case studies and batch experiments were conducted during this period to investigate the applicability and effectiveness of Flat-VarQC for polar-orbiting satellite microwave data under complex surface conditions. This work also aims to construct the key channel-dependent parameters suitable for the characteristics of innovations of satellite observations over the Plateau. The ultimate goal is to maximize the effective assimilation of both conventional and satellite observations, thereby improving the quality of analyses and forecasts over the Plateau.
The remainder of this paper is organized as follows. Section 2 presents the theoretical background and formulation of the Flat-VarQC scheme, and demonstrates the advantages of the scheme through analysis of innovations over the Plateau. Section 3 details the experimental design and configuration of the assimilation system and model, and discusses practical considerations for applying Flat-VarQC, including key parameter settings, adjustments to the background check, and the activation of Flat-VarQC during minimization iterations. Section 4 presents the parameter optimization method for Flat-VarQC and, based on batch experimental results, analyzes the improvement in the effective assimilation rate of polar-orbiting satellite microwave data over the Plateau after optimization. Section 5 presents the results of the assimilation and forecast experiments for typical heavy precipitation events over the Plateau, focusing on analyzing improvements in vertical motion to evaluate the effectiveness of Flat-VarQC in enhancing the quality of analyses for satellite observations over the Plateau. Section 6 summarizes the paper and provides relevant discussions.

2. Flat-VarQC for Polar-Orbiting Satellites over the Plateau

2.1. Theoretical Formulation of Flat-VarQC

The fat-tailed distribution of observation errors essentially arises from a relatively high proportion of outliers [10,29]. Therefore, the assimilation requires the use of robust estimation theory, which remains reliable in the presence of outliers [36]. Robust estimation originates from the concept of “robustness” in statistics. Robustness refers to the degree to which final estimation results are affected when a small number of outliers are present in the observational sample [36]. If the estimation results are only slightly affected, the method is considered to have good robustness. Conversely, even a very small number of outliers can severely distort the final analyses, indicating weak robustness of the method. Estimation methods that yield results with good robustness are called robust estimation methods. These estimation methods rely on error probability density function models that possess good robustness and reduce the negative contribution of outliers in the process of seeking optimal estimation results. In general, they do not simply “accept” or “reject” data; instead, they continuously down-weight outliers during the analysis process to “resist” their interference with the analysis results. For outliers, robust estimation assigns weights close to zero to reduce or even eliminate their negative impact. For suspicious data that lie between valid and harmful observations, it applies appropriate down-weighting [30]. Thus, in theory, this smooth down-weighting approach can effectively suppress the negative contribution of outliers without directly discarding them.
VarQC has been developed based on robust estimation theory and methods. In the cost function of the three-dimensional variational assimilation system, the observation term is expressed mathematically as:
J o = 1 2 y H x T O 1 y H x ,
where y denotes observations, H is the observation operator applied to the state vector x, and O is the observation errors covariance matrix. Assuming uncorrelated observations, this simplifies to:
J o = 1 2 y H x σ o 2 ,
where σ o is the standard deviation of observation errors. For a single observation, the cost function and its gradient are:
J o N = 1 2 y y ^ σ o 2 ,
J o N = 1 σ o y y ^ σ o 2 ,
here, y ^ represents the model variable transformed by the observation operator during the minimization iterations of variational assimilation. It should be noted that the above expression and all subsequent derivations are performed solely in observation space. The Jacobian, which is obtained by computing the gradient of the nonlinear observation operator, is handled separately within the adjoint of the radiative transfer model. Consequently, the actual code implementation of the theory related Flat-VarQC does not involve the Jacobian. The above variational assimilation scheme is based on the assumption that observation errors contain only random errors and fully satisfy a Gaussian distribution. In other words, the probability of gross errors is zero. If the probability of gross errors is not zero, then observation errors exhibit non-Gaussian characteristics. Suppose the actual observation errors follow a contaminated normal distribution:
p Q C = 1 A N + A F ,
here, N and F represent the Gaussian distribution and the interference distribution respectively, and A is the prior probability of gross error in the observations [28]. If the interference distribution is assumed to be a flat distribution, then:
F = 1 2 d σ o y y ^ < d σ o 0 y y ^ d σ o ,
here, d is the interval of the flat distribution probability density function (PDF). In the assimilation system, this represents the range within which the innovations (OMB, the observation minus background) do not exceed a certain multiple of the observation errors. Essentially, this interval defines the meteorologically meaningful observations in the Flat-VarQC. According to Bayesian estimation theory, the relationship between the cost function of analyses and the PDF of observation errors is:
J o = ln p + C ,
where C is a constant satisfying J o 0 = 0 . Substituting the assumed non-Gaussian error model (Equation (5)) into Equation (7) yields the cost function, gradient function, and corresponding weight function for the Flat-VarQC:
J o Q C = ln γ + e J o N γ + 1 ,
J o Q C = J o N W Q C ,
W Q C = 1 P = 1 γ γ + e J o N ,
here, γ = A 2 π / 2 d 1 A , and P denotes the posterior probability of gross errors. This indicates that the key parameters of Flat-VarQC scheme are the contamination rate of observations (A) and the multiple (d) that defines the allowable range of the innovations relative to the observation errors [10,28]. Since γ 0 and e J o N 0 , the weight functions W Q C 1 and W Q C 0 . This means that the weight can approach infinitely close to zero but can never equal zero. Consequently, VarQC does not directly reject observations with very low quality. Instead, it assigns reasonable analysis weights based on the useful information they contain.

2.2. Applicability of Flat-VarQC to Satellite Observations over the Plateau

Conventional QC focuses on the background analysis of outliers. It can explain the physical causes of errors and reveal the mechanisms by which outliers affect analysis results. However, conventional QC assumes that observation errors follow the Gaussian distribution, which has weak robustness. When outliers appear, analyses often tend to overfit them to avoid large residuals. This consequently degrades the analysis quality of high-quality observations [36]. Therefore, conventional QC typically discards as many suspicious observations as possible to ensure the “safety” of analyses. This inevitably sacrifices the potential contribution of observations. Furthermore, conventional QC performs “reject” or “accept” decisions before data assimilation. For suspicious data that lie between valid and harmful observations [30], this approach may either lose some useful information or introduce some harmful information. This is precisely where VarQC has its advantage. VarQC assigns appropriate analysis weights to each observation through a weight function, based on the proportion of useful information it contains. This allows the contribution of each observation to be fully utilized. At the same time, VarQC employs a non-Gaussian distribution with good robustness to describe error characteristics. This approach ensures the safety of analyses while improving the utilization efficiency of observations.
Robust estimation theory holds that no ideal “fully robust” estimation exists; the robustness of any theoretical model is limited [37]. For the Flat-VarQC, if the proportion of outliers is too high, or if the outliers themselves are too extreme, the analysis results may still be negatively affected when the scheme’s tolerance is exceeded. Therefore, in practical applications of VarQC, conventional QC should still be used to discard clearly erroneous observations. Otherwise, analysis quality may deteriorate. However, the rejection threshold for conventional QC can be set more loosely. It should be emphasized that relaxing the rejection threshold allows more observations to enter the assimilation system. Yet the relaxation strength must be adjusted appropriately according to the actual quality of the observations [11,28]. Correspondingly, the key parameters of the Flat-VarQC should also be adjusted. The specific statistical method for key parameters is presented in Section 4.1.
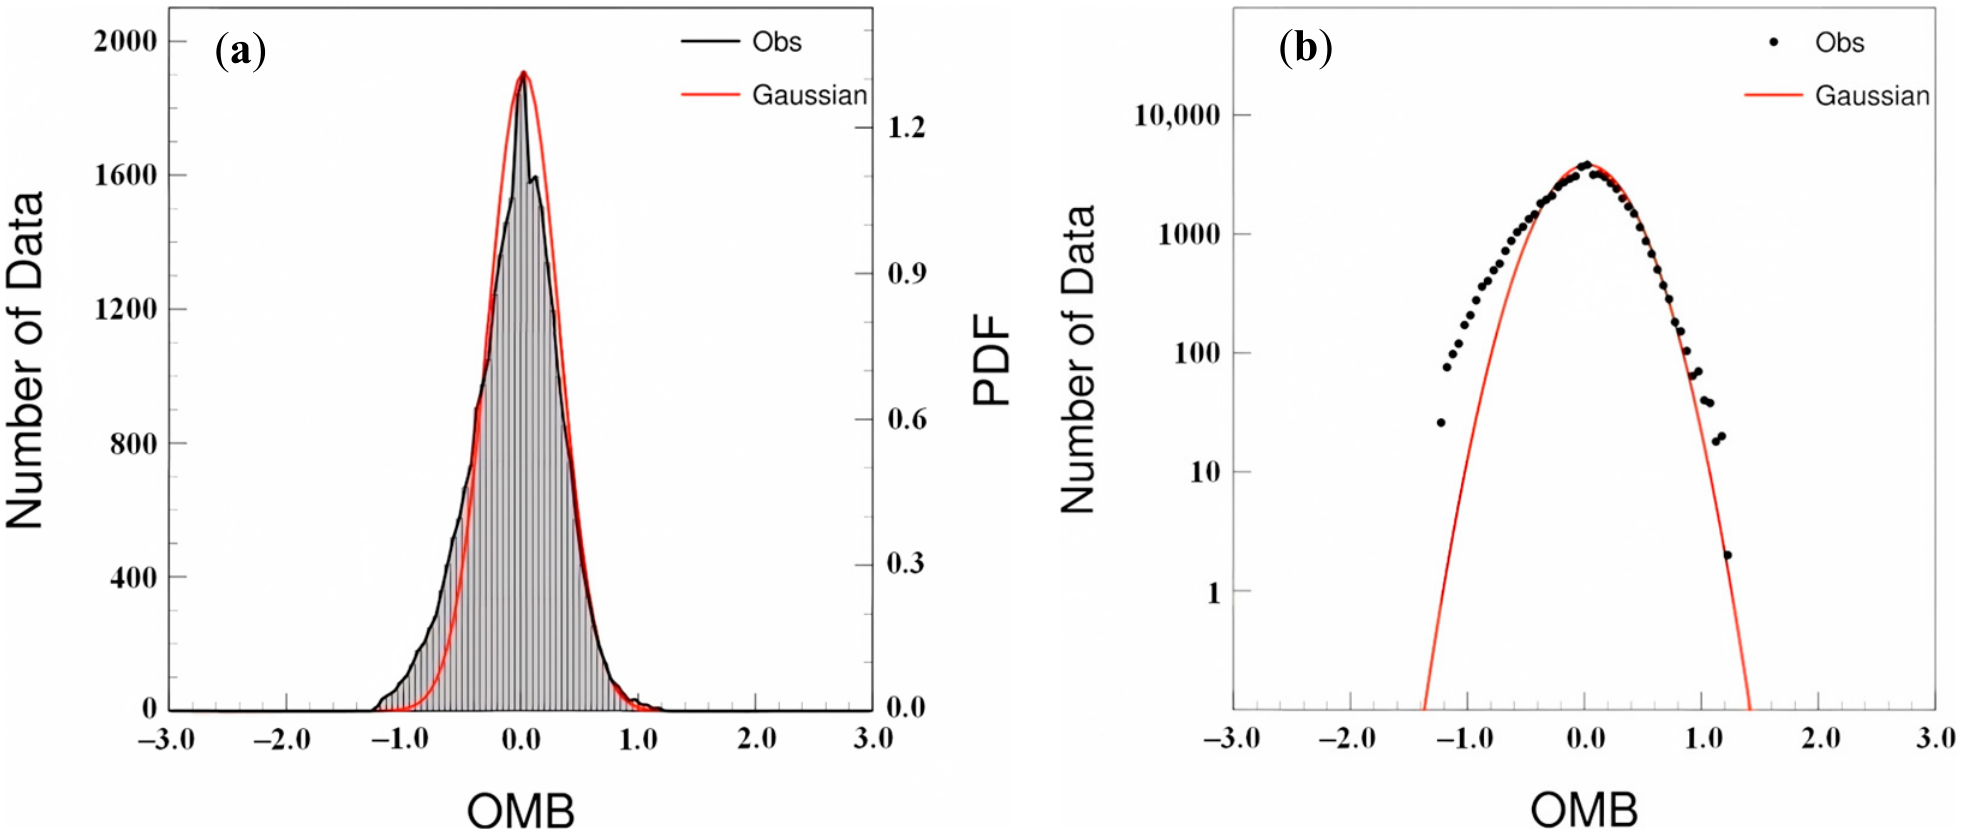
The OMB in the variational assimilation system can approximately fit the PDF of observation errors. This provides a characterization of observation errors. To accurately understand the differences in error characteristics between satellite observations and conventional observations, Figure 1 shows the statistical distribution of the innovations for channel 7 of Advanced Microwave Sounding Unit A (AMSUA) on NOAA18 (with a weighting function peak at approximately 200 hPa [38]) from June 2017. The figures show that the innovation characteristics of satellite observations are more complex. Due to the characteristics inherent to satellite observations, the innovations (black solid line) exhibit a very severe “fat-tail” phenomenon. Even after stricter QC processes, they still differ significantly from the ideal Gaussian distribution (red solid line). Moreover, their distribution shape is more irregular. Even after certain bias-correction processes, some asymmetric distribution characteristics remain. At high altitudes and over the complex terrain of the Tibetan Plateau, errors in radiative transfer modeling are amplified. This increase in modeling errors leads to a higher proportion of gross errors in innovations. Consequently, a non-Gaussian error model becomes more appropriate for describing these observation innovations.
These results indicate that the actual distribution characteristics of innovations no longer satisfy the basic assumption of a Gaussian and unbiased distribution in the assimilation system. This severely limits the analysis effectiveness of satellite observations. Therefore, the Flat-VarQC, which can more accurately describe the non-Gaussian distribution characteristics of observation errors, holds greater practical value and application potential for satellite data assimilation.

3. Data and Experimental Design

3.1. Model Configuration and Data

This study uses the Weather Research and Forecasting model (WRF version 3.9) and its three-dimensional variational assimilation system (WRFDA), with a horizontal resolution of 3 km × 3 km. Both the assimilation system and forecast model have 41 vertical levels. The model top is set at 50 hPa. The domain for the data assimilation and the forecast model over the Plateau covers (74.6°E–99.4°E, 25.2°N–37.8°N). The physical parameterization schemes include the WRF double-moment 6-class (WDM6) microphysics scheme, the Rapid Radiative Transfer Model (RRTM) for long-wave radiation, the Dudhia short-wave radiation scheme, the Monin–Obukhov surface layer scheme, the Noah land-surface model, and the Yonsei University Planetary Boundary Layer Scheme (YSU scheme). The cumulus convection parameterization scheme is turned off.
The 12 h GFS (Global Forecast System) forecast fields, provided by the National Centers for Environmental Prediction (NCEP), share the horizontal resolution of 0.25° × 0.25° and are used for analyzing innovations of satellite observations, estimating key parameters of the Flat-VarQC scheme, and serving as the background for data assimilation experiments. The assimilated conventional observations include surface observations (SYNOP), radiosonde observations (SOUND), automated aircraft reports (Airep), and satellite winds (Geoamv). The polar-orbiting satellite microwave observations include Advanced Microwave Sounding Unit A (AMSUA) on National Oceanic and Atmospheric Administration 18 (NOAA18) and Meteorological Operational Satellite 2 (METOP2), Microwave Humidity Sounder (MHS) on NOAA18 and METOP2, and Advanced Technology Microwave Sounder (ATMS) on the Suomi National Polar-orbiting Partnership (Suomi-NPP) satellite. The channel selection for each sensor follows the default settings of the WRFDA The Community Radiative Transfer Model (CRTM) is used in the satellite assimilation. The key parameters of the Flat-VarQC scheme (A and d) are determined from the innovation statistics of each satellite data assimilation [10]. The specific statistical method and detailed parameter values are presented in Section 4.1. Precipitation forecasts were validated against 0.0625° × 0.0625° hourly multi-source precipitation products of China Meteorological Administration (CMA) Land Data Assimilation System (CLDAS), provided by the National Meteorological Information Center of China [39].

3.2. Experiment Setup

The batch assimilation experiment over the Plateau region was conducted from 00 UTC on 1 June to 18 UTC on 30 June 2017, spanning 30 days. Cold-start assimilation was performed four times daily at 6 h intervals. Satellite observations were assimilated under clear-sky conditions. Based on the batch analyses, this study focuses on evaluating the impact of Flat-VarQC versus traditional conventional QC on effective assimilation rates for microwave observations from polar-orbiting satellites. In conventional QC experiments, observations with deviations from the background ≤5σo (threshold) were allowed into the assimilation system [11], while satellite observations were limited to ≤3σo [35]. Following analysis of innovations and validation through batch assimilation experiments, the Flat-VarQC experiment relaxed these thresholds to ≤8σo and ≤6σo, respectively. Within these ranges, the vast majority of observations follow a heavy-tailed distribution. Relaxing the thresholds to these values thus retains most observations that may contain useful information. Moreover, pre-experiments confirmed that no unreasonable perturbations in the analysis increments occurred under these thresholds. Additionally, the limb check enabled in conventional QC experiments was deactivated during this study.
Prior to activating Flat-VarQC, it is essential to perform a standard variational assimilation process with sufficient iterations to stabilize analytical quality. This step prevents the suboptimal quality of satellite observations from interfering with minimization operations and compromising assimilation accuracy [28]. Sensitivity experiments were conducted with activation steps ranging from iteration 15 to 45 at intervals of 5. Based on these experiments, the VarQC for conventional observations was activated at iteration 20 of the minimization process during assimilation. For satellite observations, the VarQC was activated at iteration 40. Both batch experiments utilized variational bias correction (VarBC) [40] to mitigate the adverse effects of systematic errors on analysis results. Additionally, the minimization algorithm in the Flat-VarQC of the assimilation system employs the Lanczos method [41] to ensure iterative stability throughout the minimization process [35].
To further compare the assimilation performance of the Flat-VarQC across different microwave sensor channels, the batch assimilation experiment incorporating all aforementioned satellite observations was designated as the control experiment (ACH). Two parallel control experiments were established: (1) the TCH experiment: assimilating only AMSUA and ATMS temperature channels (6, 7, 8, 9, 10); and (2) the QCH experiment: assimilating only MHS and ATMS humidity channels (18, 19, 20, 21, 22). All other parameters for both the TCH and QCH experiments were identical to those of the ACH experiment. The detailed experimental protocols are presented in Table 1.
To analyze short-term heavy precipitation events near Lhasa, both the conventional QC experiment (CTL) and the Flat-VarQC experiment (VQC) were conducted. The assimilation time was set to 06 UTC on 21 June 2017, with 36 h forecasts generated after model initialization to evaluate the simulation performance of the Flat-VarQC over the Plateau region. The assimilated observations, assimilation system configurations, and forecast model setups were identical to those used in the ACH experiment.

4. Effectiveness of Flat-VarQC for Satellite Observations over the Plateau

4.1. Optimization of Key Parameters in the Flat-VarQC for Satellite Observations over the Plateau

Based on the analyses of Equations (5) and (6) in Section 2.1, the key parameters of the Flat-VarQC scheme are the prior probability of gross error A and the range of possible values d. The parameter d defines the allowable range within which the innovations do not exceed a certain multiple of the observation errors. The weights assigned to observations in the analyses are sensitive to the values of A and d. Therefore, the setting of these two key parameters directly affects the practical performance of the Flat-VarQC [42]. The key parameters are determined by the inherent properties of the observations. Their values are significantly influenced by the quality of the observations. Consequently, different qualities of observations lead to different parameter values. Over the Plateau, the quality of satellite observations is lower than that over plain areas due to the influence of the terrain. To fully realize the application potential of Flat-VarQC over the Plateau, it is necessary to optimize the parameters based on the innovation characteristics of observations in this region. This parameter optimization is a core aspect of applying the Flat-VarQC over the Plateau.
The key parameters can be determined through statistical analysis of innovations [10]. As shown in Figure 1, the value of d for various types of observations can be determined from the width of the two tails of the innovation distribution. Specifically, 2 d = max O M B min O M B / σ o . For the parameter A, the “fat-tailed” distribution in Figure 1 can be considered as outlier data that do not satisfy the Gaussian distribution. The proportion of such data is then calculated to determine A for that observation type. Table 2 lists the channel selections for polar-orbiting satellite microwave data used in this study, along with the corresponding parameter values.
It should be noted that the above parameter estimation method is affected by factors such as the background fields, the observation operator, and the quality of the observations. Degraded background fields contaminate the estimated observation error via the OMB, which convolves background and observation information [10,28,42]. Errors in the observation operator, typically considered part of the model error, also affect the OMB statistics. Moreover, the effective data volume, controlled by the threshold of the background check, influences the parameter estimates by altering the proportion of non-Gaussian observations [10,35]. Nonetheless, from a long-term perspective, these parameters remain stable as long as the three factors mentioned above do not change. The parameter variations are typically one to two orders of magnitude smaller than the parameter values themselves. Therefore, re-estimation is only required when any of these factors undergoes substantial changes. Otherwise, reliable parameters can be obtained over a sufficiently long time window at negligible computational cost.

4.2. Error Characteristics of Polar-Orbiting Satellite Microwave Observations

Due to the characteristics inherent to satellite observations, different channels of the same sensor on the same satellite exhibit different observation error characteristics. Even for the same type of sensors mounted on different satellites, their error characteristics also differ. If the Flat-VarQC is applied without making such distinctions and uses the same key parameters for all, its ability to improve the effective assimilation rate of satellite observations will be reduced. Consequently, its positive impact on the analysis results will also be weakened [35]. It should be noted that the current Flat-VarQC scheme cannot eliminate errors introduced by cloud contamination. Therefore, the analysis presented herein is performed under clear-sky conditions. All satellite observations have been subjected to cloud-detection schemes to remove data contaminated by clouds or precipitation.
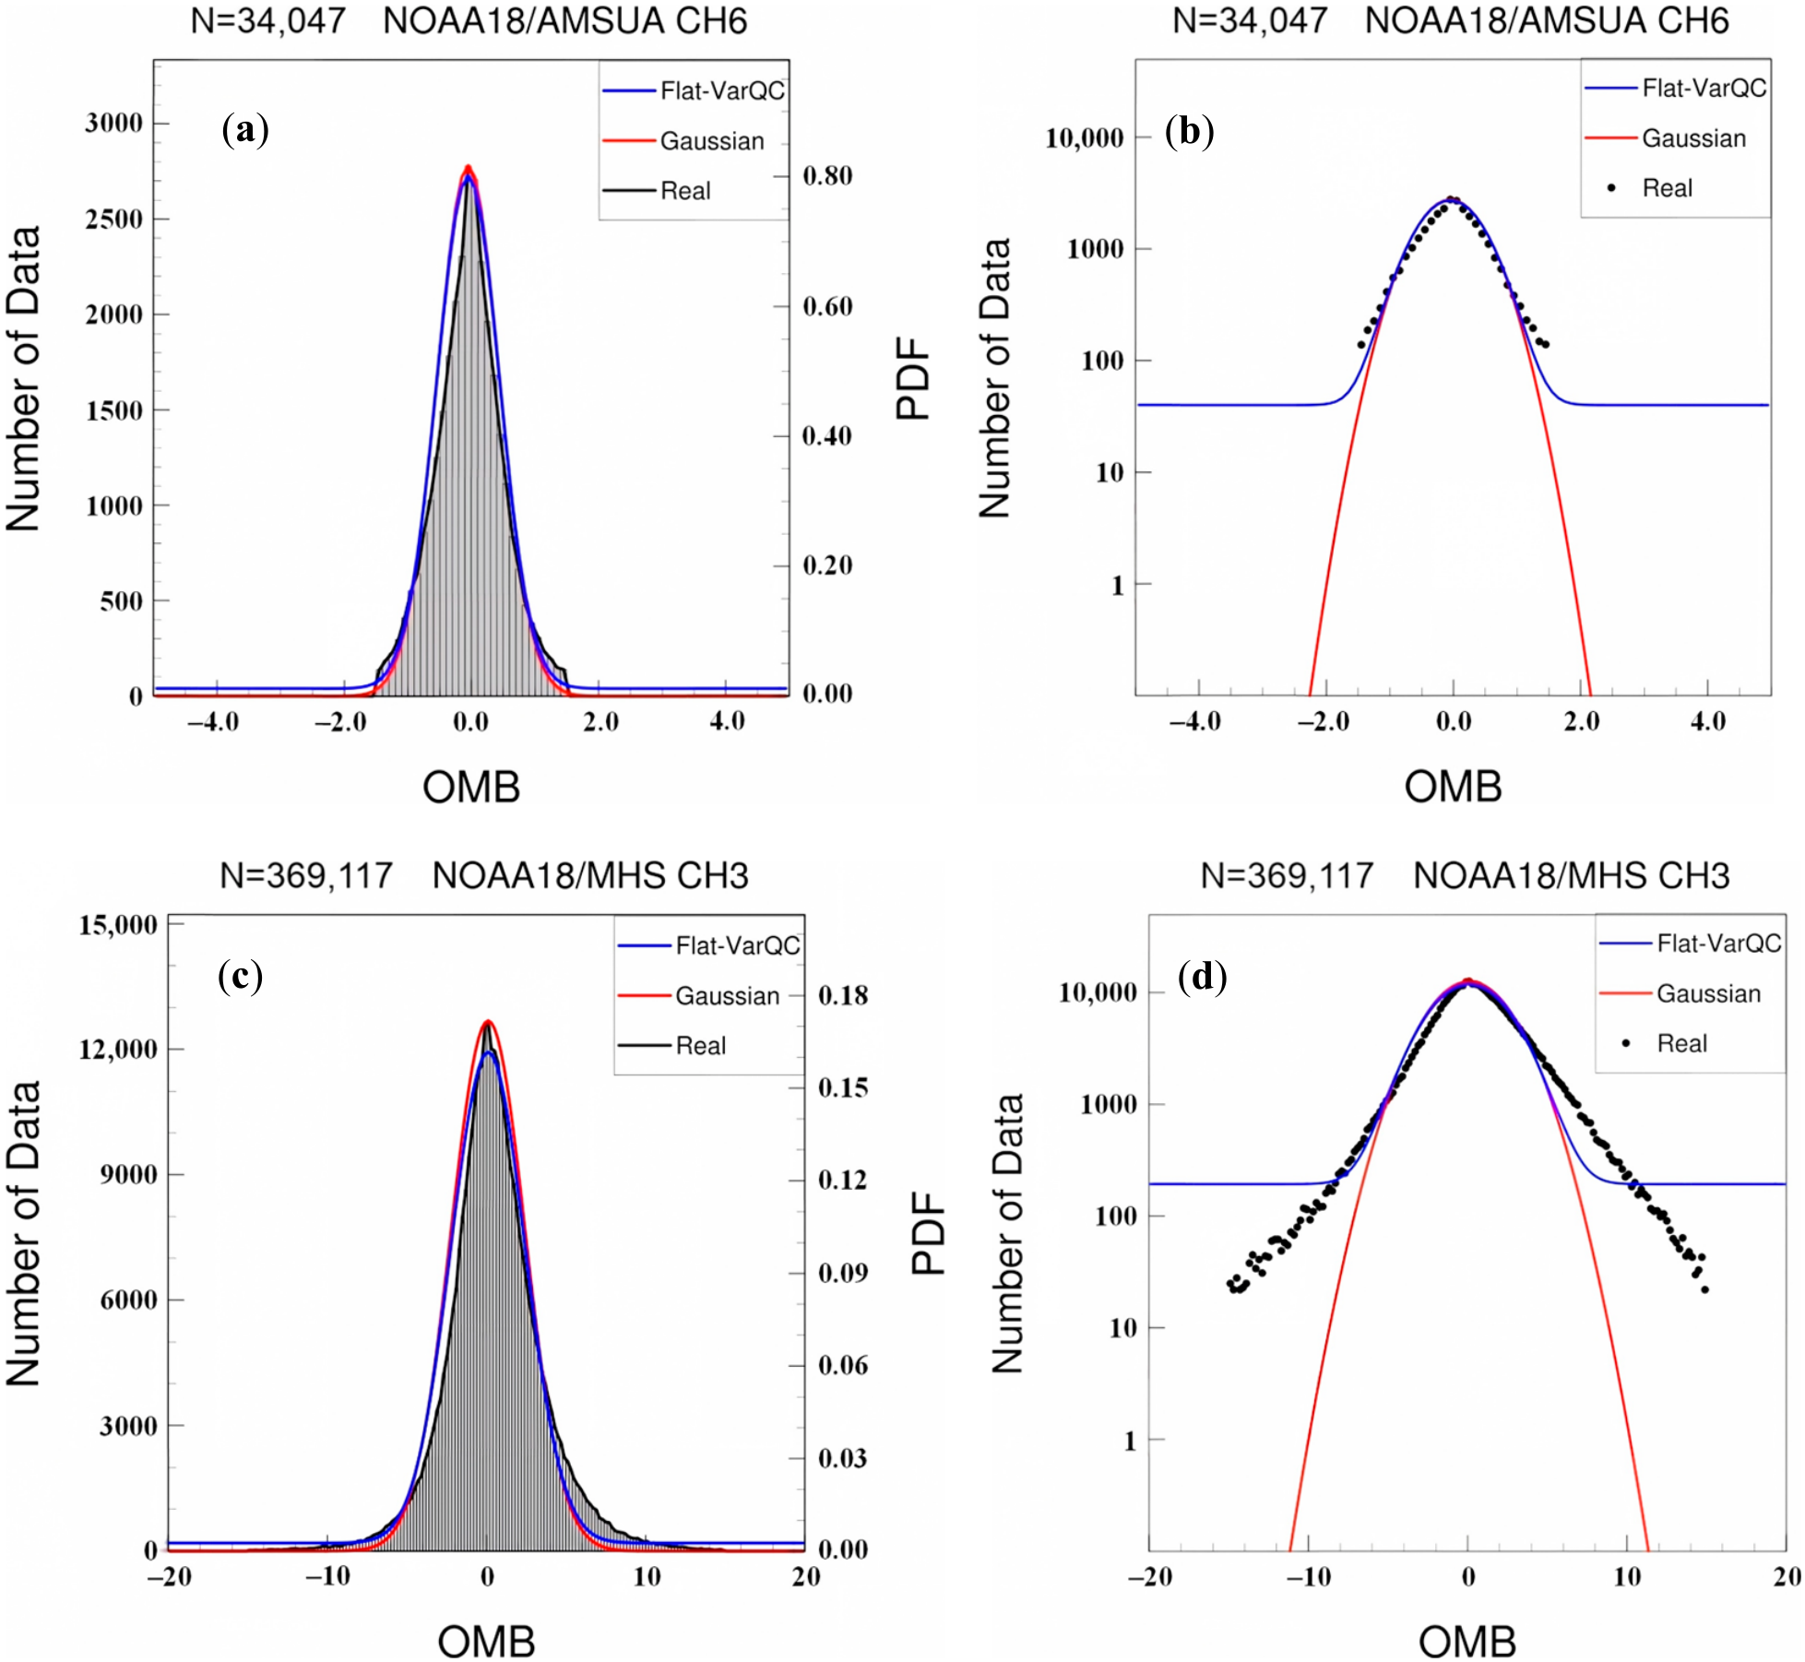
As shown in the fitting results of the innovations for NOAA18/AMSUA Channel 6 (Figure 2a) and NOAA18/MHS Channel 3 (Figure 2c) over the Plateau in June 2017, along with their corresponding logarithmic coordinate distributions (Figure 2b,d), the “fat-tail” phenomenon of the innovations of satellite observations is very severe. The distribution differs significantly from the standard Gaussian distribution and also exhibits some asymmetric characteristics. The complex terrain and heterogeneous surface conditions over the Plateau hinder the accurate estimation of satellite observation errors. The observation operator also exhibits large errors in this region, leading to a degraded quality of satellite data. These terrain-induced factors contribute significantly to the pronounced fat-tail features observed in the innovation distributions. The non-Gaussian distribution model of the Flat-VarQC can capture the “fat-tail” characteristics of innovations to a certain extent (blue solid line). Its fitting performance is clearly superior to that of the pure Gaussian distribution. The fitting results for other channels of other satellite sensors are similar.
The Flat-VarQC scheme can adequately account for these non-Gaussian characteristics arising from the complex terrain. This indicates that the Flat-VarQC has significant advantages and potential value for further improving the effective assimilation rate of polar-orbiting satellite observations, which have more complex observation error characteristics.

4.3. Improvement in the Effective Assimilation Rate of Satellite Observations over the Plateau

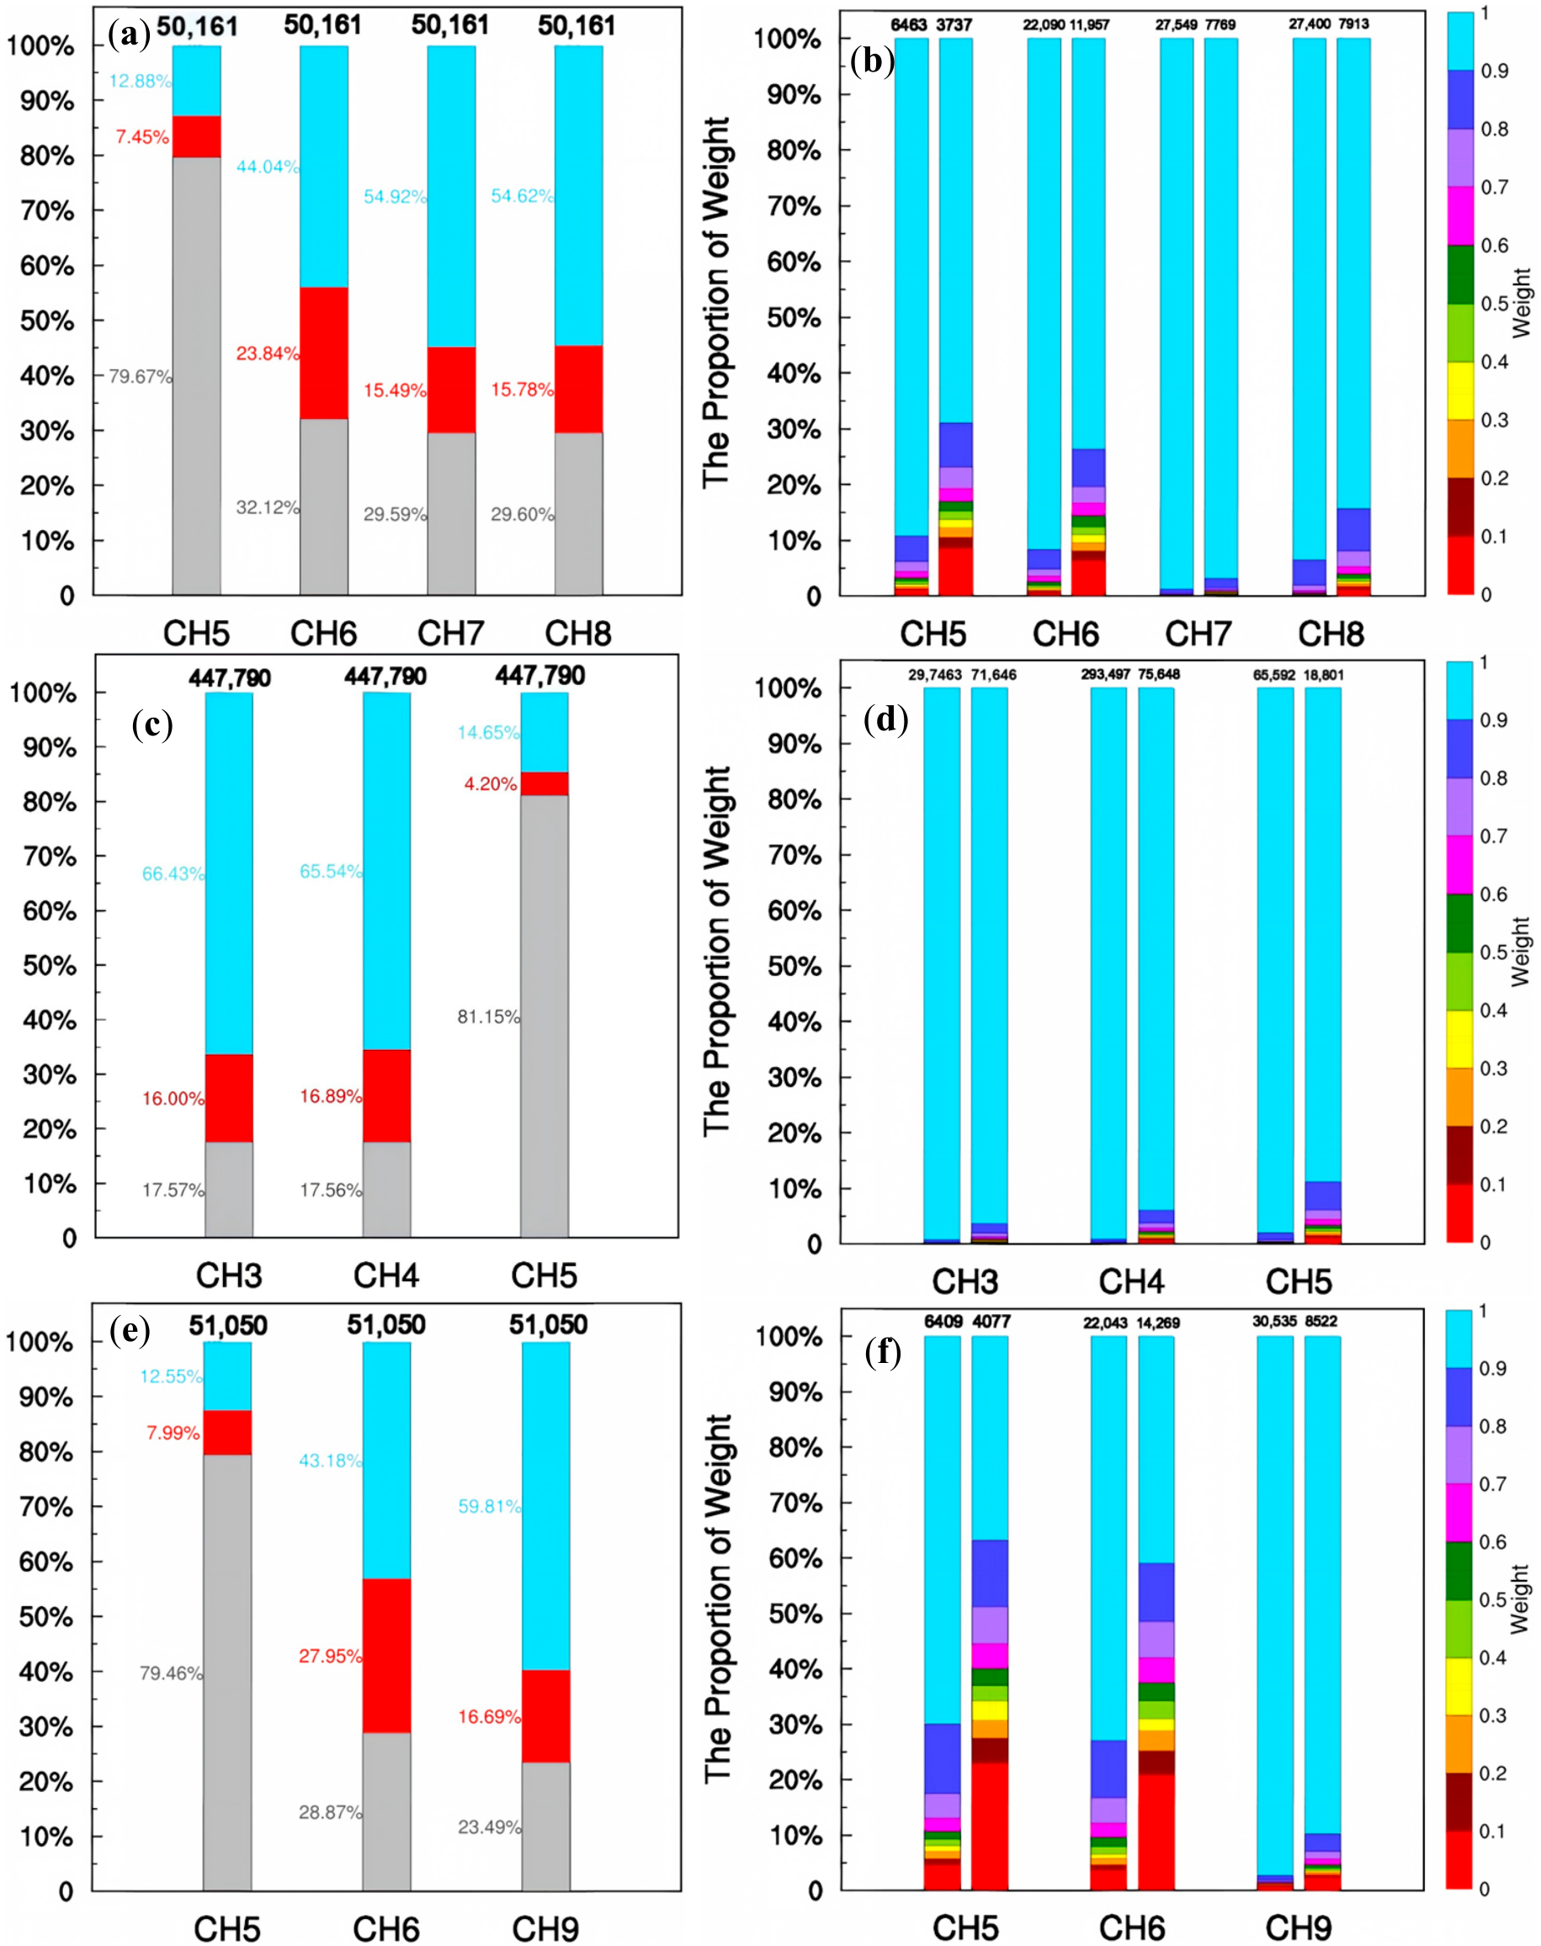
The data utilization rates from the conventional QC experiment and the Flat-VarQC experiment for satellite observations (Figure 3a,c,e,g) reflect the improvement in the effective assimilation rate of satellite observations over the Plateau achieved by the Flat-VarQC. As shown in Figure 3, conventional QC rejects approximately 30–85% of satellite observations over the Plateau (the sum of the red and gray bars). Channel 5 of AMSUA and MHS are near-surface channels. As a result, a large number of observations are excluded from the assimilation system. This greatly reduces the potential contribution of satellite observations over the Plateau to analyses. In the Flat-VarQC experiment, a looser rejection threshold is used. The scheme effectively recovers about 4–28% of the previously rejected observations (red bars) and assimilates them. This increases the number of assimilated satellite observations over the Plateau. Although a considerable portion of observations is still not assimilated (gray bars), the number of recovered observations remains substantial. This demonstrates the potential value of the Flat-VarQC scheme in improving the assimilation of satellite observations over the Plateau. The weight statistics for conventional QC and the recovered observations (Figure 3b,d,f,h) show the following. Among the observations recovered by the Flat-VarQC, more than 50% are assigned high weights in the analyses. Meanwhile, for satellite observations of relatively lower quality (e.g., METOP2/AMSUA), a considerable portion of the observations that passed conventional QC are assigned lower analysis weights.
These results demonstrate the ability of VarQC to recover useful information from suspicious observations that conventional QC would reject. They also show its ability to identify harmful information. Consequently, the Flat-VarQC improves the effective assimilation rate of satellite data over the Plateau—a region with sparse conventional observations and a need for further improvement in analysis quality.

4.4. Optimization of Analysis Weights

Conventional observations are sparse over the Plateau. Therefore, improving the effective assimilation rate of satellite observations is crucial for enhancing the quality of data assimilation in this region. The terrain over the Plateau is complex, and the quality of satellite observations is relatively low. Even satellite observations that pass conventional QC still contain considerable harmful information. This greatly limits the positive contribution of satellite observations to assimilation over the Plateau. The Flat-VarQC can effectively reduce the negative impact of harmful information on analysis results by assigning appropriate analysis weights.
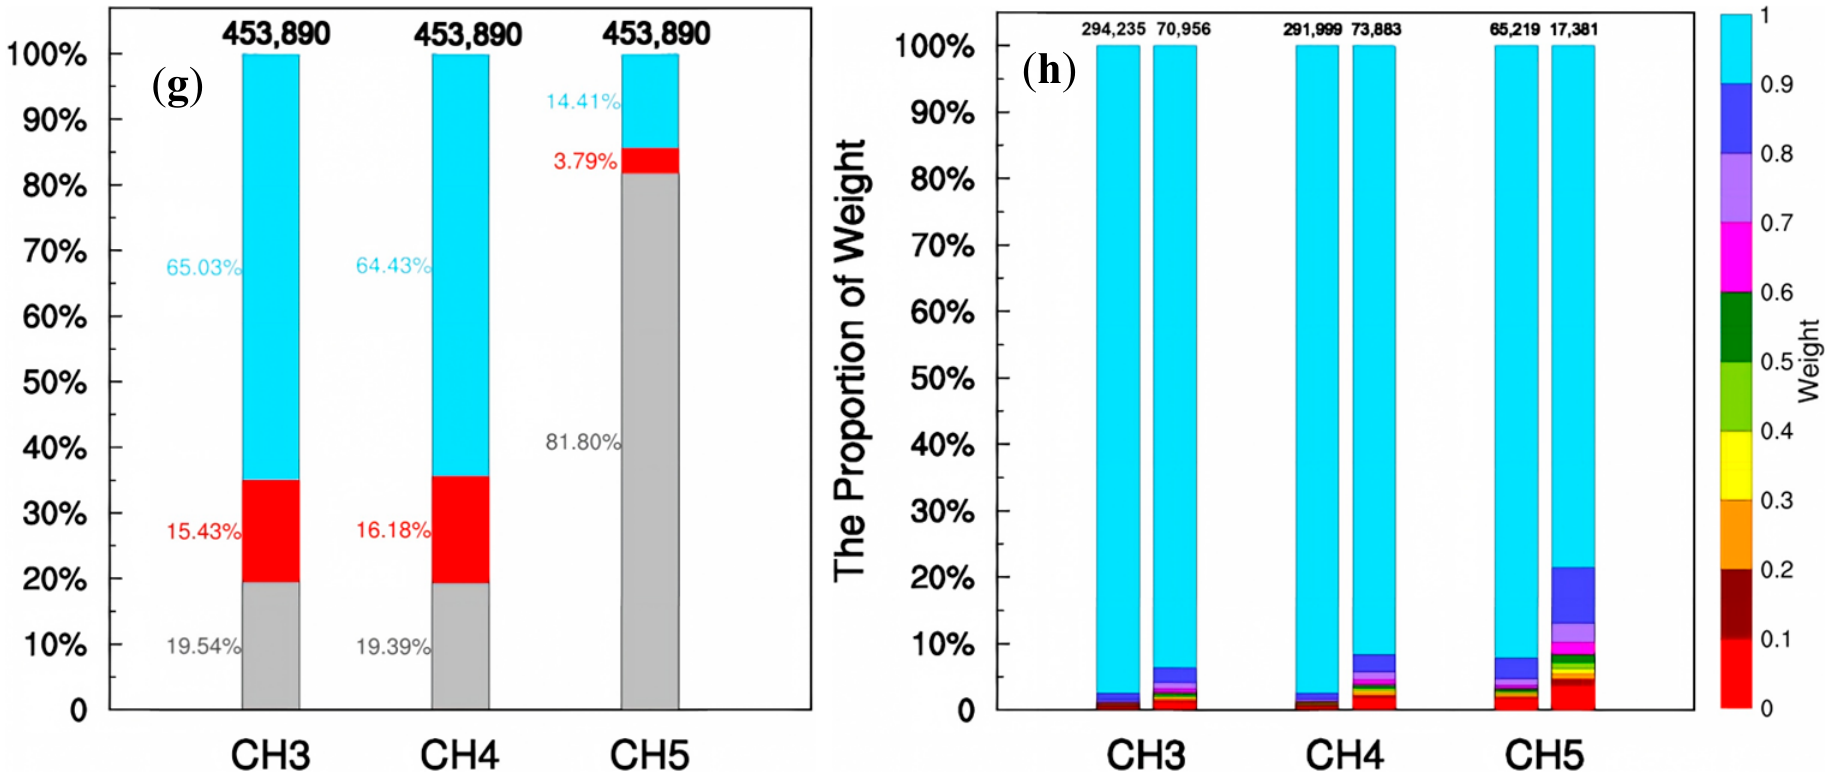
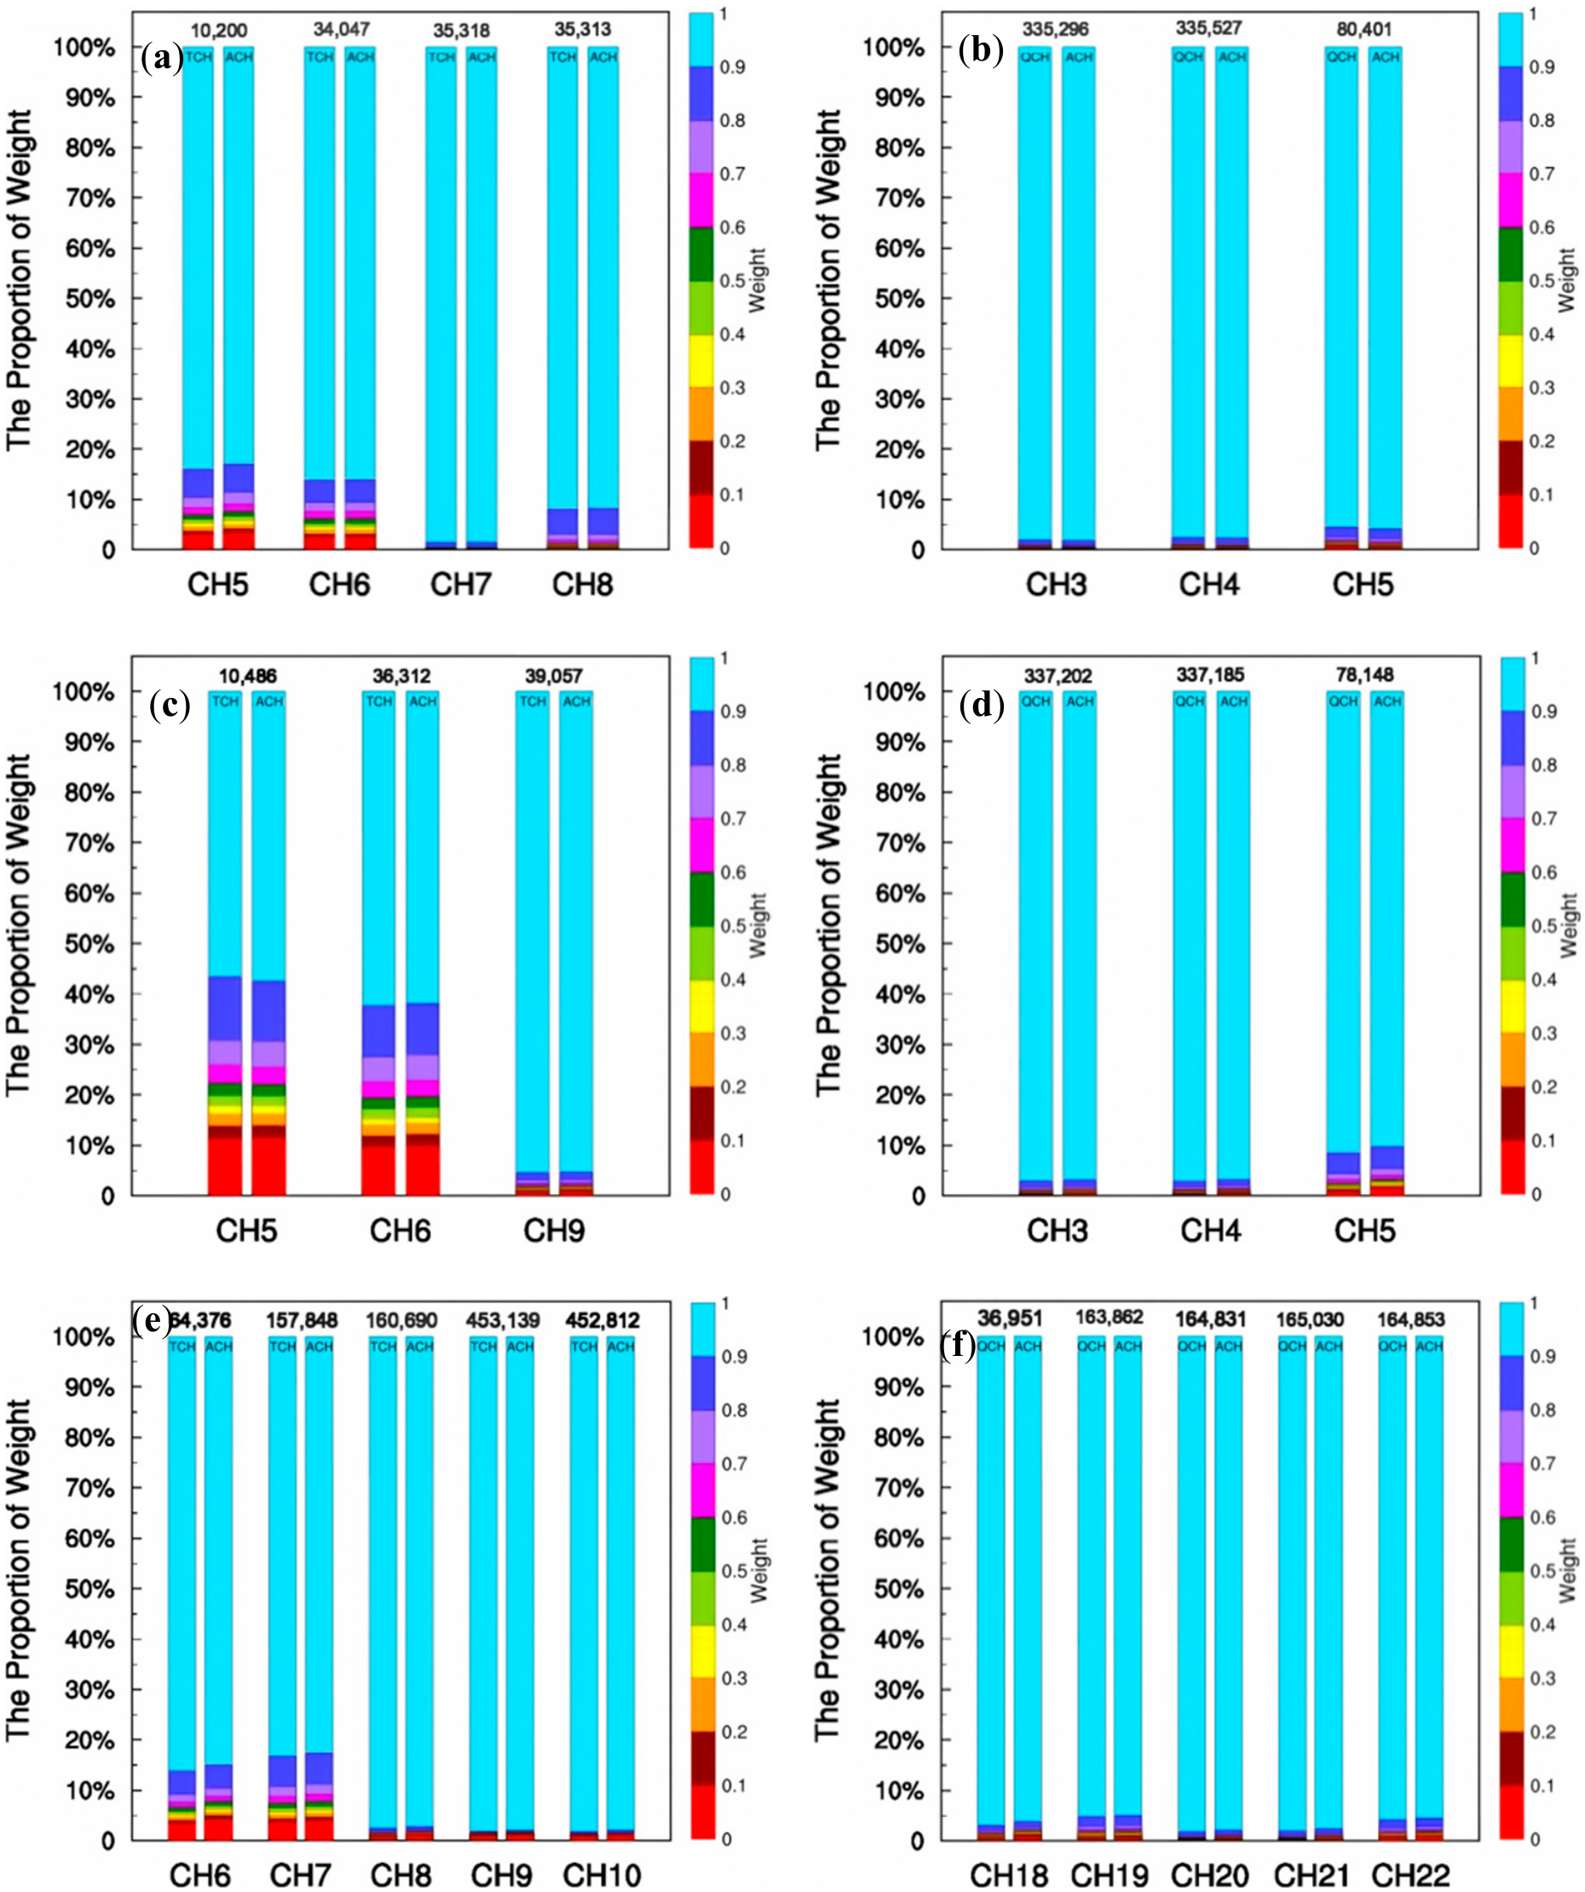
Figure 4 shows the analysis weight statistics for satellite observations from the ACH, TCH, and QCH experiments, based on 30 days of observations in June 2017. These statistics directly reflect the improvement in the effective assimilation rate of satellite observations over the Plateau achieved by the Flat-VarQC. The experimental results for all five types of satellite observations show that the Flat-VarQC increases the proportion of low-weight observations to varying degrees across all channels. For the same sensors on the same satellites, the proportion of low-weight observations is higher for lower-level channels (e.g., AMSUA CH5, MHS CH5, ATMS CH6). This is because lower-level channels are more affected by the terrain over the Plateau, leading to lower data quality and thus smaller analysis weights. In contrast, observations from higher-level channels tend to be more consistent with a Gaussian distribution. They are therefore assigned larger analysis weights, with the proportion of high-weight observations approaching 100%.
A comparison between Figure 4a,c,e and Figure 4b,d,f reveals the following. The proportion of low-weight observations for METOP2/AMSUA is significantly higher than that for NOAA18/AMSUA and the temperature channels of Suomi-NPP/ATMS. The proportion for METOP/MHS is also slightly higher than that for NOAA18/MHS and the humidity channels of Suomi-NPP/ATMS. This indicates that for sensors measuring the same physical quantity, or for the same type of sensors on different satellites, lower data quality leads to a higher proportion of low-weight observations. Further comparison between the ACH, TCH, and QCH experiments shows the following. In the ACH experiment, the proportion of low-weight observations for temperature is slightly higher than in the TCH experiment, while the proportion for humidity is slightly lower than in the QCH experiment. Based on these results of weights, assimilating microwave humidity observations may reduce the effective assimilation rate of microwave temperature observations. Specifically, the higher effective assimilation rate of humidity observations in the ACH experiment (evidenced by fewer low-weight humidity observations than in QCH) occurs at the expense of temperature observations, which are assigned low weights more frequently in ACH than in TCH. This indicates that the applicability and effectiveness of the Flat-VarQC are slightly better for microwave temperature observations than for microwave humidity observations. It is worth noting that humidity is spatially discontinuous by nature, and its observation errors tend to be large. Consequently, when humidity observations are assigned high weights in VarQC, they do not necessarily make a positive contribution to analyses.

5. Assimilation and Forecast Performance of Satellite Observations over the Plateau

5.1. Effective Adjustment of the Background by Flat-VarQC

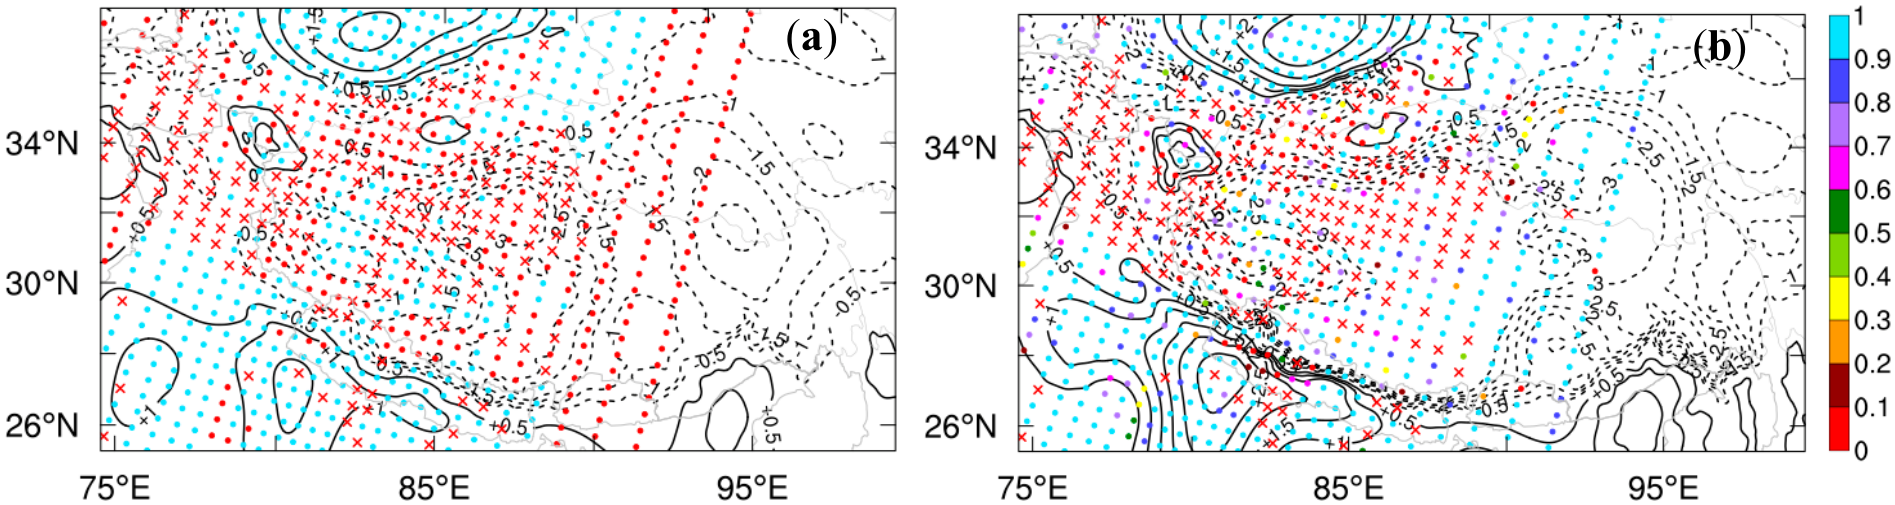
To evaluate the performance of Flat-VarQC in satellite data assimilation and forecasting, a typical weather event was selected for assimilation and forecast experiments. Figure 5 shows the 400-hPa temperature analysis increments from the conventional QC experiment (CTL) and the VarQC experiment (VQC) at 0600 UTC on 21 June 2017. Positive (negative) increments (contours) indicate warming (cooling) of the analyses relative to the backgrounds. Both experiments produce negative temperature increments over most of the Plateau. Distinct cooling centers appear in the central and eastern Plateau, while a weak warming center appears in the northwestern Plateau. Compared with the CTL experiment (Figure 5a), the VQC experiment (Figure 5b) shows a stronger maximum cooling of about 0.5 to 1.0 K over the southern and eastern Plateau. The warming center to the north and southwest is also stronger by about 0.5 K. These results reflect a clear difference between the two QC schemes in how the effectively assimilated observations adjust the background temperature field. This leads to different three-dimensional temperature structures in the analyses over the precipitation region. For the heavy precipitation area southeast of Lhasa Station (91.15°E, 29.65°N), the VQC experiment produces a stronger negative temperature increment at 400 hPa compared with the CTL experiment (Figure 5b vs. Figure 5a). This negative temperature increment will further cool the analysis relative to the CTL experiment. As a result, atmospheric instability above the heavy precipitation region will increase. This is more favorable for the initiation and development of heavy precipitation, thereby improving the analyses and the quality of forecasts.
At the assimilation time, METOP2/AMSUA, METOP2/MHS, and Suomi-NPP/ATMS satellite observations covered the model domain. Figure 5a,b show the effective assimilation rates for METOP2/AMSUA Channel 6 in the two experiments. The effective assimilation weights indicate the following. In the CTL experiment, all satellite observations for this channel over Lhasa are rejected. Consequently, the upper-level temperature field over this region fails to represent the true atmosphere. In contrast, the VQC experiment uses a looser rejection threshold. This allows these observations to enter the assimilation system and participate in the analysis. In the Flat-VarQC, observations whose innovations satisfy the Gaussian distribution are assigned high weights approaching one. Observations with non-Gaussian innovations are assigned reasonable analysis weights based on the proportion of useful information they contain. This ensures that useful information from observations is fully absorbed while harmful information is effectively suppressed. Thus, the contribution of observations is maximized, and analysis quality is improved. These results demonstrate that VarQC can generate a temperature analysis over the Plateau with higher quality than conventional QC. This is particularly beneficial for the analyses and forecasts of meso- and micro-scale weather systems.

5.2. Improving the Quality of the Analysis

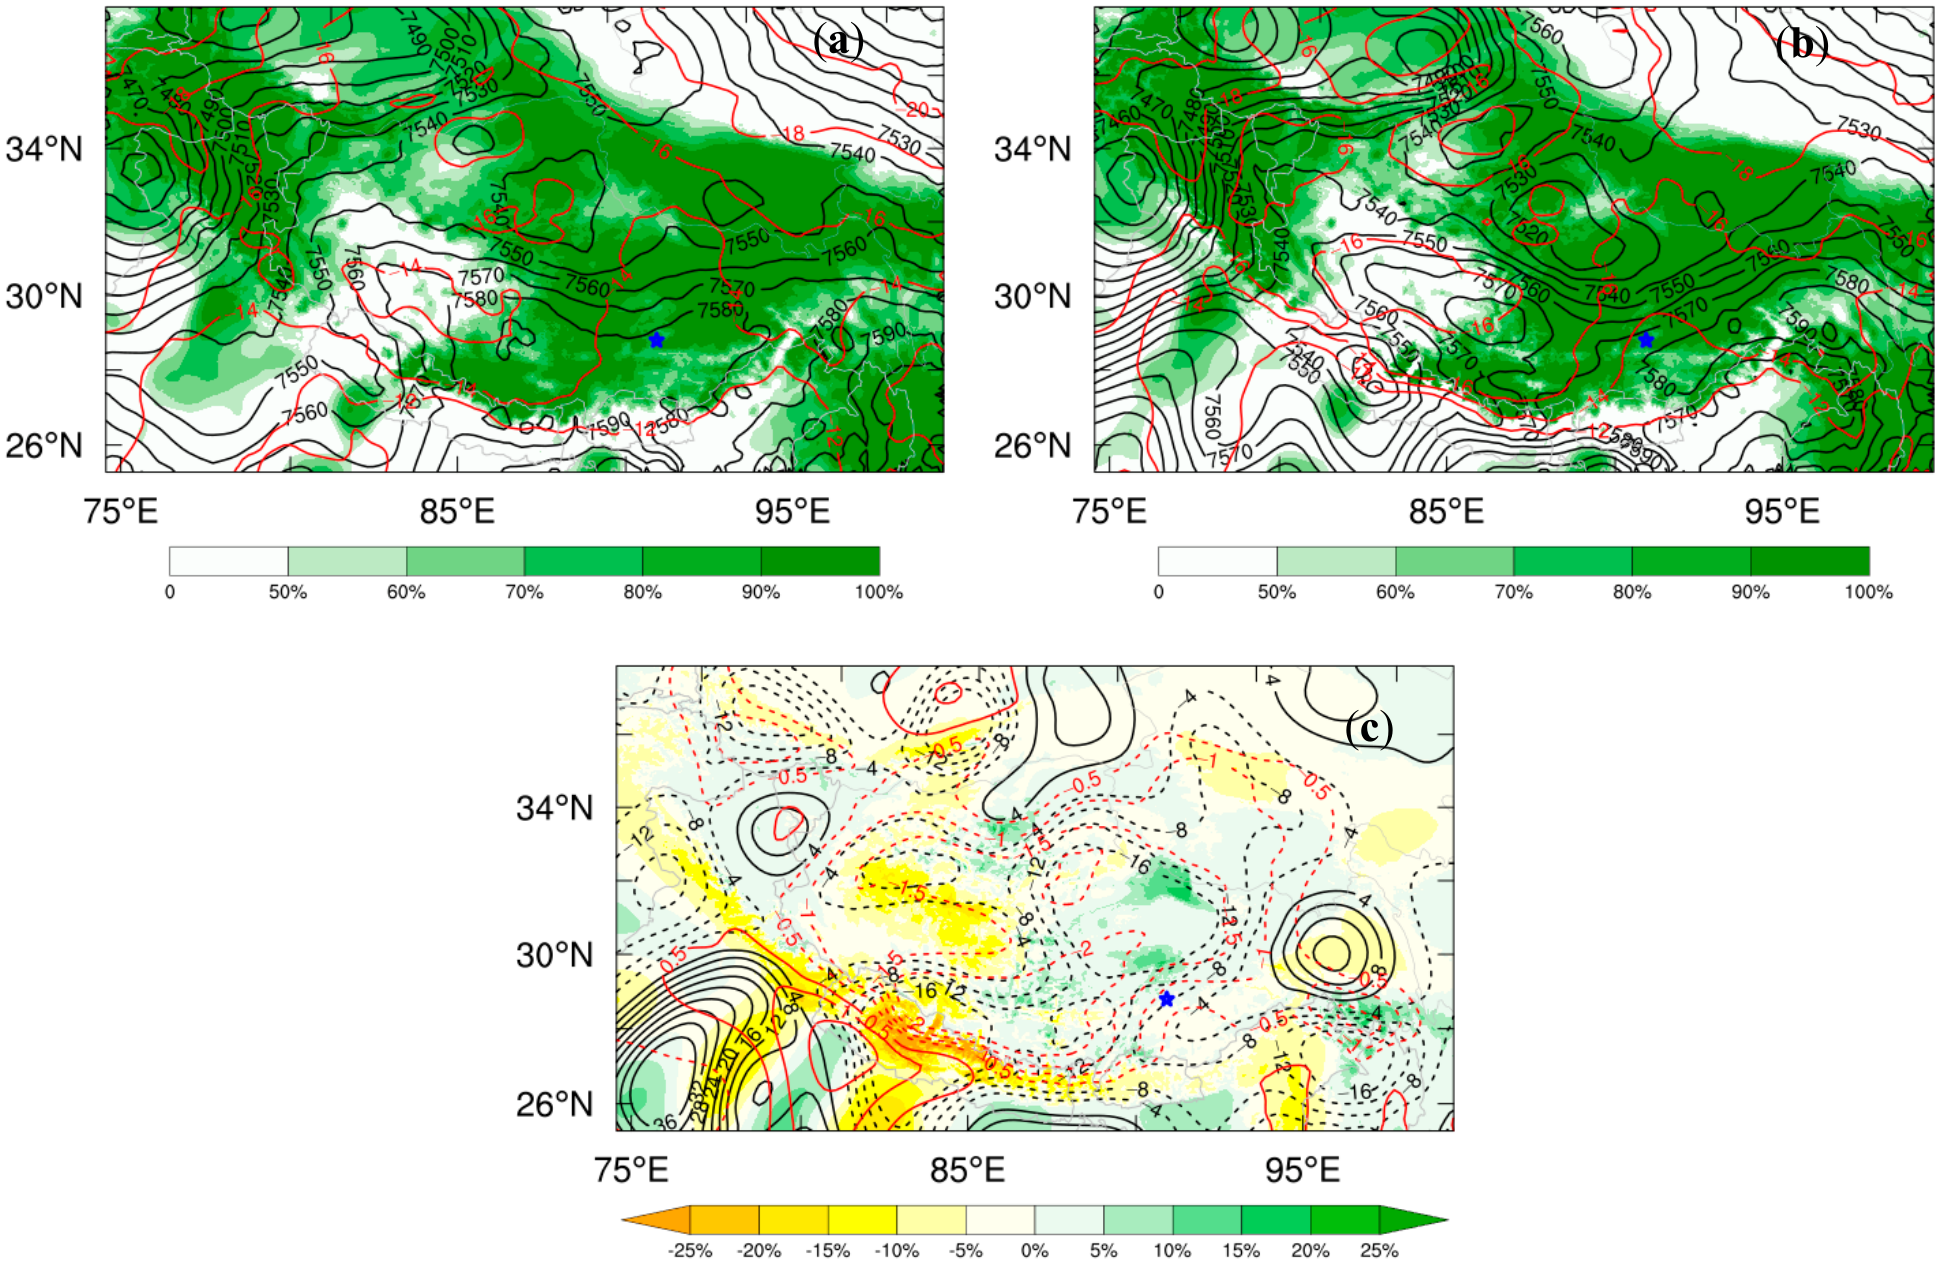
The 400 hPa analysis fields from the CTL and VQC experiments, along with their difference (Figure 6), show the following. Before the occurrence of heavy precipitation at 0600 UTC on 21 June, both experiments show that Lhasa is located at the front bottom of a low-pressure system. However, the low-pressure system in the VQC experiment (Figure 6b) is significantly stronger than that in the control experiment (Figure 6a). Moreover, the moisture condition in the VQC experiment is more abundant. The difference (Figure 6c) provides a clearer view. Compared with the CTL experiment (Figure 6a), the VQC experiment (Figure 6b) shows a strengthening of the low-pressure system by about 28 gpm and an increase in water vapor by about 10%. These changes provide more favorable key influencing systems and moisture conditions for the initiation and development of heavy precipitation. These results demonstrate the following. Flat-VarQC assigns more reasonable assimilation weights to each observation based on its error characteristics. This allows the scheme to fully absorb the positive contribution of observations to analysis while eliminating the harmful information contained in the observations. As a result, the analysis obtained from VarQC describes the actual atmospheric state more accurately than that from conventional QC. In other words, the quality of the initial field for the numerical model is improved, which lays a foundation for further improving its forecast performance.
Notably, the VQC experiment demonstrates more significant improvements in both height and temperature fields after incorporating satellite data assimilation, while the enhancement in water vapor conditions remains relatively limited. This validates the applicability of the Flat-VarQC for assimilating satellite humidity observations.

5.3. Improvement in Forecasting Skill

Figure 7 shows the observed precipitation and the 12 h accumulated precipitation forecasts from the CTL and VQC experiments at 0600 UTC on 22 June 2017. The observed precipitation (Figure 7a) shows that the 12 h accumulated precipitation to the northeast of Lhasa Station reaches the heavy rain level, with local areas reaching torrential rain. The CTL experiment (Figure 7b) shows a severe underestimation of precipitation. The precipitation intensity is clearly too weak, and the experiment fails to forecast the maximum precipitation center northeast of Lhasa Station. The VQC experiment (Figure 7c) also fails to forecast torrential rain to the northeast of Lhasa. However, compared with the CTL experiment, the VQC experiment forecasts precipitation intensity reaching the heavy rain level, with the precipitation area located near Lhasa. The VQC experiment outperforms the CTL experiment in both precipitation intensity and location. This further demonstrates the good potential of the Flat-VarQC scheme for satellite observations in improving heavy precipitation forecasts over the Plateau.
The 12 h precipitation forecasts from the two experiments were verified. The Threat Score (TS) focuses on the number of correct forecasts within a given precipitation interval and quantifies the effectiveness and reliability of the forecasting system. It is expressed as:
T S = N A N A + N B + N C ,
where NA is the number of correctly forecast grid points (hits), NB is the number of false alarm grid points, NC is the number of missed forecast grid points. The Equitable Threat Score (ETS) is a bias-adjusted TS score that removes the contribution of random forecasts (Ar). The ETS and Ar are defined as:
E T S = N A - A r N A + N B + N C - A r ,
A r = ( N A + N B ) ( N A + N C ) N A + N B + N C + N D ,
where ND is the number of correct rejections (i.e., grid points where both the forecast and observation are below the specified threshold), and the remaining symbols are the same as in Equation (11).
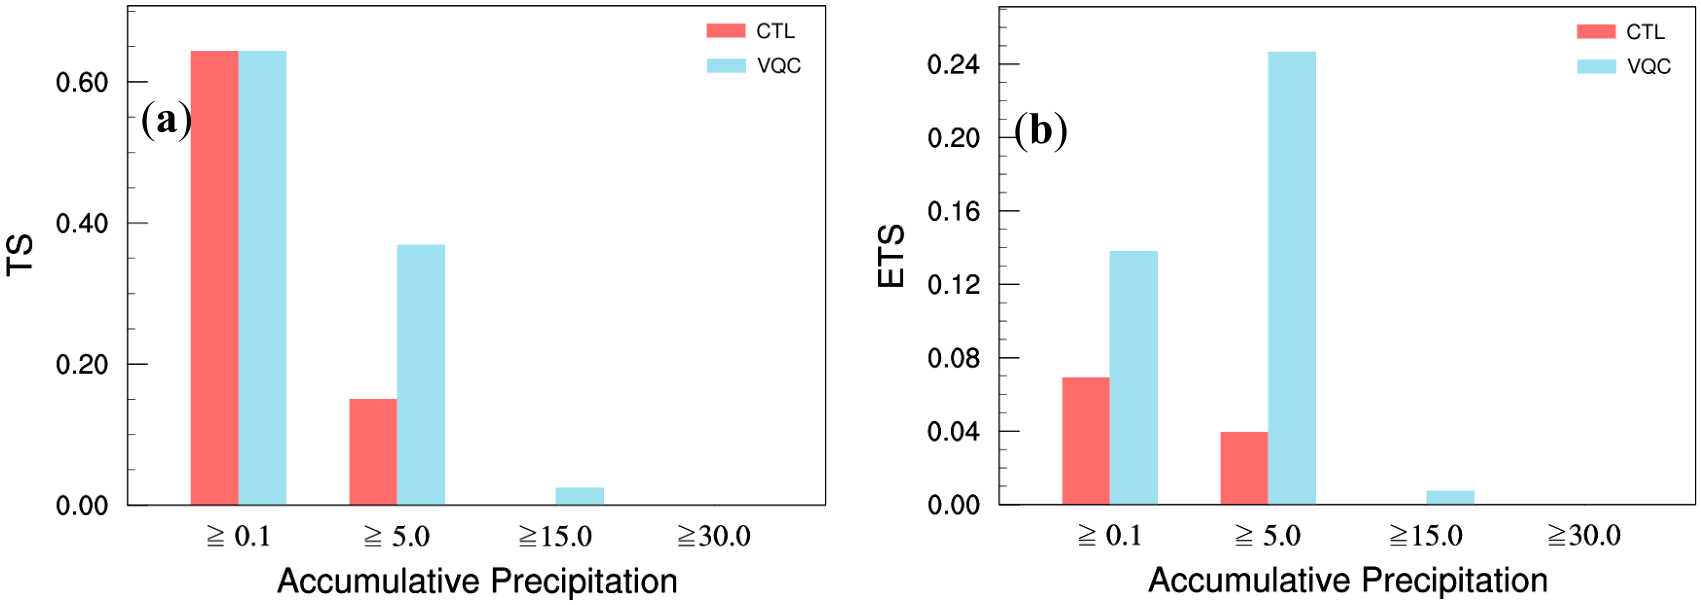
As can be seen from the TS and ETS of the 12 h precipitation forecasts from the two experiments (Figure 8), the forecast quality of the 12 h accumulated precipitation at various thresholds in the VQC experiment is generally better than that in the CTL experiment over the main precipitation area. In particular, for moderate rain and heavy rain forecasts, the VQC experiment significantly outperforms the CTL experiment. Although neither experiment successfully forecasts torrential rain, the satellite data assimilation with VarQC clearly improves the forecast of this heavy precipitation event, demonstrating the potential of the Flat-VarQC scheme in enhancing the accuracy of heavy precipitation forecasts.
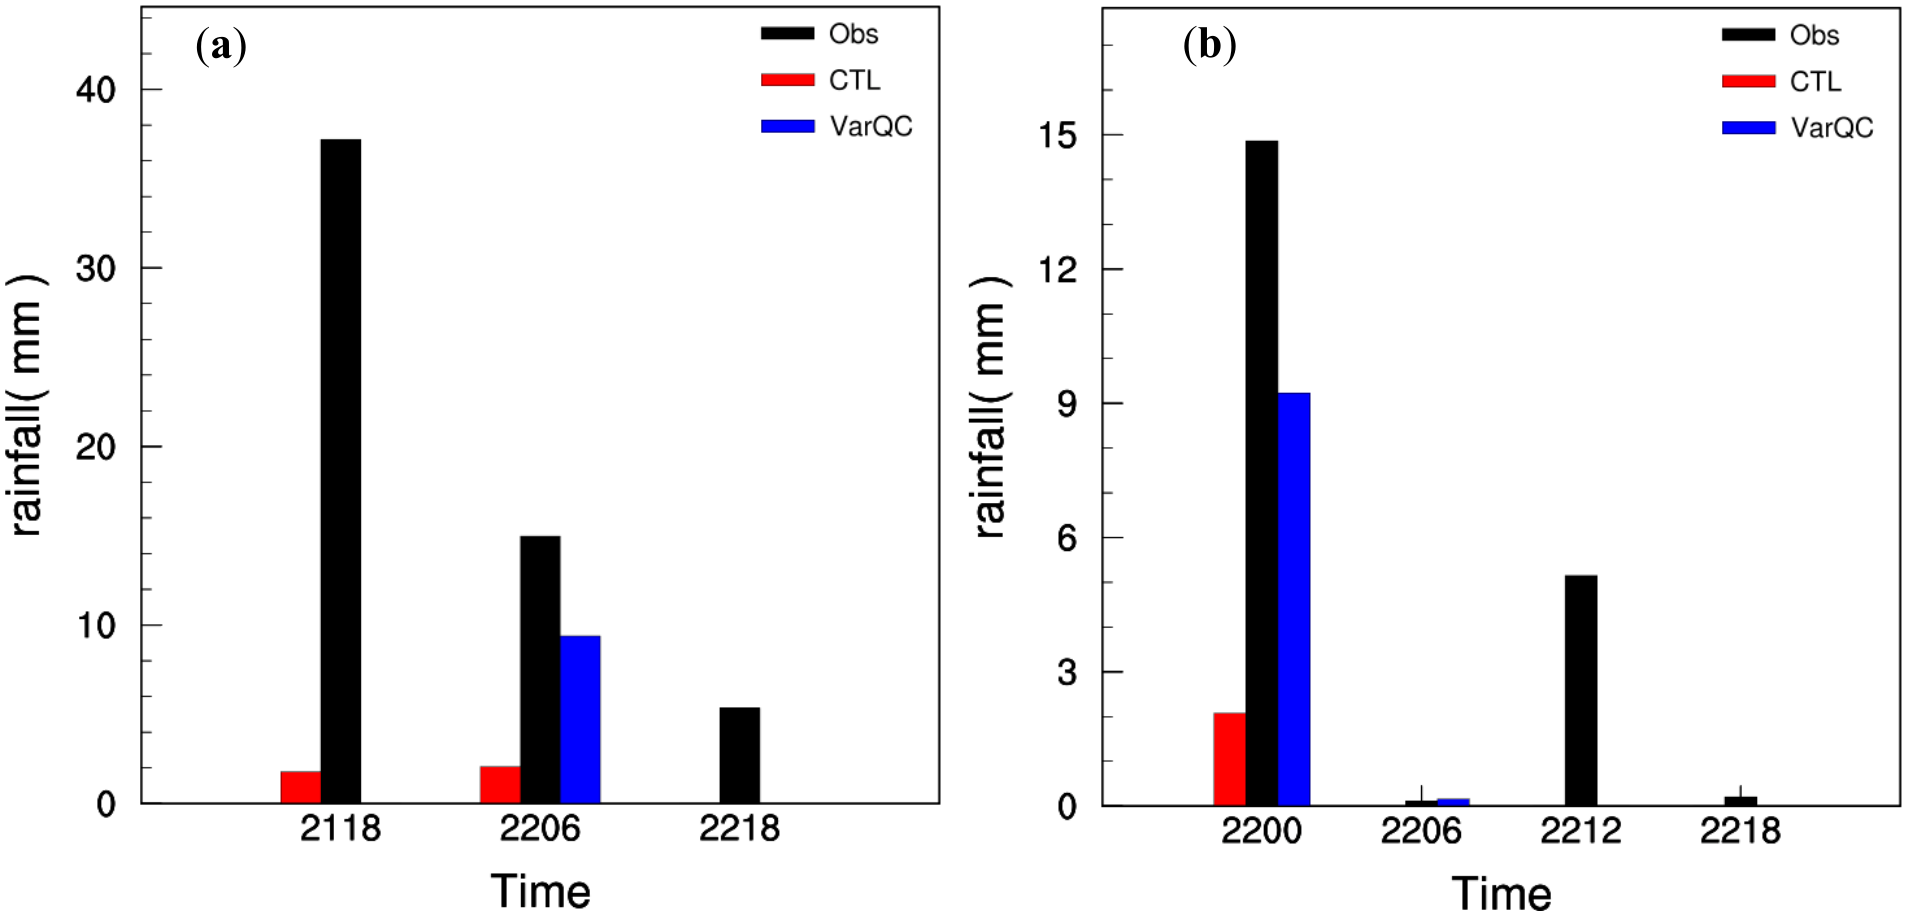
Further analysis of the 12 h accumulated precipitation during the entire precipitation event and the 6 h accumulated precipitation in the subsequent 24 h at Lhasa Station, along with the precipitation forecasts from the two experiments (Figure 9), reveals the following. The CTL experiment hardly forecasts any heavy precipitation at Lhasa Station during the entire precipitation period. After assimilating satellite observations, the VQC experiment still fails to forecast the intensity and timing of the 12 h accumulated precipitation at Lhasa Station at 1800 UTC on 21 June. However, its precipitation forecast quality for subsequent periods is clearly better than that of the CTL experiment. The VQC experiment accurately forecasts the intensity of the 12 h accumulated precipitation at 0600 UTC on 22 June and the 6 h accumulated precipitation at 0000 UTC on 22 June at Lhasa Station. For this heavy precipitation event near Lhasa, the Flat-VarQC improves the effective assimilation rate of satellite observations. It fully realizes the positive contribution of satellite observations to the analyses and further enhances the quality of the analyses. As a result, the intensity and spatiotemporal distribution of heavy precipitation forecasts from the VQC experiment are superior to those from conventional QC for satellite observations.
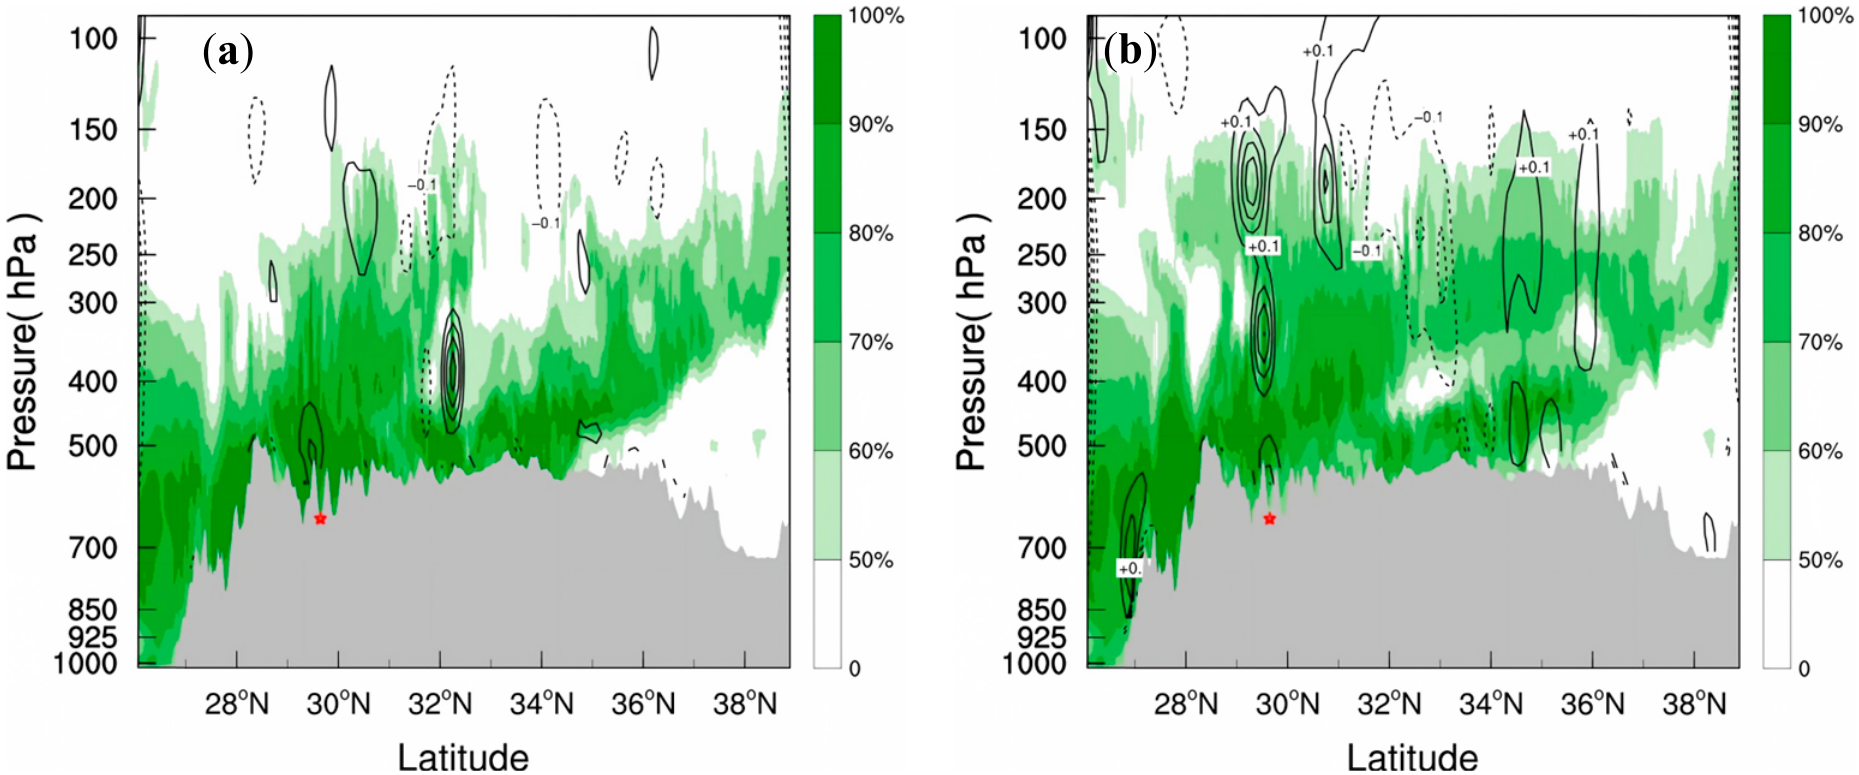
To evaluate the capability of the Flat-VarQC for satellite observations in forecasting key influencing systems and moisture conditions for heavy precipitation—such as meso- and micro-scale weather systems—Figure 10 shows the meridional vertical cross-sections of vertical velocity and relative humidity at Lhasa Station from the 12 h forecasts of the CTL and VQC experiments. The figures show the following after satellite data assimilation. In the CTL experiment (Figure 10a), the vertical ascending motion over Lhasa is weak. It exists only near the surface layer and above 250 hPa. This is less favorable for precipitation, and the result is consistent with Figure 7 and Figure 8. In the VQC experiment (Figure 10b), the vertical velocity over Lhasa is significantly stronger, reaching 0.4 m/s. The strong convective motion extends from the lower levels up to around 150 hPa. In terms of moisture conditions, the relative humidity over Lhasa in the VQC experiment is slightly increased from the lower to the upper levels. The significantly enhanced convective intensity is more favorable for precipitation. It also promotes vertical transport of low-level moisture, providing sufficient moisture supply for the maintenance of precipitation. The combined effect of these two aspects makes the VQC experiment with satellite data assimilation superior to the CTL experiment in both dynamic conditions and moisture conditions. This gives the VQC experiment an advantage in the accuracy of precipitation forecasts (Figure 7 and Figure 8).

6. Conclusions and Discussion

The effective assimilation rate of observations over the Tibetan Plateau is low. This limits the quality of analyses and forecast skill. Based on the WRFDA system, the Flat-VarQC scheme suitable for the Plateau region has been developed. The key parameters of the Flat-VarQC, including the prior probability of gross error (A) and the multiple (d) that defines the allowable range of the innovations relative to the observation errors, are optimized based on the non-Gaussian distribution characteristics of actual innovations over the Plateau. Through case studies and batch experiments, the applicability and effectiveness of this scheme for assimilating polar-orbiting satellite microwave observations over the Plateau are investigated and analyzed. The main conclusions are as follows:
  • The Flat-VarQC with optimized parameters can improve the effective assimilation rate of polar-orbiting satellite microwave observations and the quality of analyses over the Plateau. The innovations of satellite observations over the Plateau exhibit pronounced fat-tailed distribution characteristics. A large number of available observations are rejected by conventional QC and cannot be effectively assimilated. As a result, the actual assimilation rate of polar-orbiting satellite microwave observations over the Plateau remains low.
  • The applicability and effectiveness of the Flat-VarQC are better for microwave temperature sounders than for microwave humidity sounders over the Plateau. During the analysis process, the Flat-VarQC assigns more reasonable weights to microwave temperature sounder observations. This allows the positive contribution of these observations to be more fully realized. In contrast, the improvement in weights for microwave humidity sounders is less evident.
  • The Flat-VarQC can absorb more useful information from satellite observations over the Plateau. Compared with conventional quality control, it also effectively reduces the negative impact of harmful information from observations during assimilation. As a result, it enhances the positive contribution of polar-orbiting satellite microwave observations to analyses and improves the quality of forecasts. This scheme has great application potential for the analyses and precipitation forecasts of meso- and micro-scale weather systems over the Plateau.
Satellite observations are numerous but of relatively low quality over the Plateau. Their effective assimilation presents more scientific difficulties than that of conventional observations. The Flat-VarQC has good applicability and effectiveness for assimilating polar-orbiting satellite microwave observations. However, the key parameters for other spaceborne sensor observations still require independent statistical analyses. Meanwhile, VarQC still struggles to properly characterize the error features of observations contaminated by clouds in the middle and lower troposphere [43]. This limits its ability to improve the quality of analyses under all-sky conditions. For instance, the VQC experiment still failed to capture the heavy rainfall core northeast of Lhasa, indicating that further improvements are needed.
Furthermore, the Flat-VarQC based on the “Gaussian + flat” distribution assumes that outliers represent gross errors and treats them as erroneous observations without meteorological significance. However, some studies have shown that certain outlier observations may have meteorological significance and contain useful information that can be exploited [30]. Therefore, a new scheme that assumes observation errors follow a “Gaussian + Laplace” distribution (Huber norm), namely the Huber-VarQC, may have further potential to improve analyses in the presence of outliers compared with the Flat-VarQC [43,44]. At present, the more advanced Huber-VarQC still has some scientific issues to be resolved. In particular, its applicability and effectiveness for satellite observations require further in-depth research.

Author Contributions

Conceptualization, J.Y. and X.M.; methodology, J.Y., J.H. and X.M.; software, J.Y., B.H. and J.H.; validation, J.Y. and B.H.; formal analysis, J.Y. and X.M.; investigation, J.Y.; resources, X.M., J.H., H.C. and H.D.; data curation, X.M., J.H., H.C. and H.D.; writing—original draft preparation, J.Y.; writing—review and editing, X.M. and J.H.; visualization, J.Y.; supervision, X.M. and J.H.; project administration, X.M.; funding acquisition, J.Y., X.M. and J.H. All authors have read and agreed to the published version of the manuscript.

Funding

This research was funded by the National Natural Science Foundation of China (grant numbers U2442221 and 42305172), the Guangdong Basic and Applied Basic Research Foundation (grant number 2024A1515510015), and the Postgraduate Research & Practice Innovation Program of Jiangsu Province (grant number KYCX25_1590).

Data Availability Statement

The 12 h GFS forecast datasets by NCEP were obtained from https://gdex.ucar.edu/datasets/d084001 (accessed on 16 July 2025), the satellite datasets were obtained from https://gdex.ucar.edu/datasets/d735000 (accessed on 13 November 2023), the CLDAS dataset were obtained from https://data.cma.cn/dataService/cdcindex/datacode/NAFP_CLDAS2.0_NRT (accessed on 18 April 2026), the other datasets presented in this study are available on request from the corresponding author and first author.

Acknowledgments

We acknowledge the High Performance Center of Nanjing University of Information Science & Technology for their support of this work.

Conflicts of Interest

The authors declare no conflicts of interest.

References

  1. Eyre, J.R.; English, S.J.; Forsythe, M. Assimilation of satellite observations in numerical weather prediction. Part I: The early years. Q. J. R. Meteorol. Soc. 2020, 146, 49–68. [Google Scholar] [CrossRef]
  2. Eyre, J.R.; Bell, W.; Cotton, J.; English, S.J.; Forsythe, M.; Healy, S.B.; Pavelin, E.G. Assimilation of satellite observations in numerical weather prediction. Part II: Recent years. Q. J. R. Meteorol. Soc. 2022, 148, 521–556. [Google Scholar] [CrossRef]
  3. McNally, A.P.; Derber, J.C.; Wu, W.; Katz, B.B. The use of TOVS level-1b radiances in the NCEP SSI analysis system. Q. J. R. Meteorol. Soc. 2000, 126, 689–724. [Google Scholar] [CrossRef]
  4. Liu, Q.; Weng, F. Detecting the warm core of a hurricane from the special sensor microwave imager sounder. Geophys. Res. Lett. 2006, 33, 863–883. [Google Scholar] [CrossRef]
  5. Pan, X.D.; Li, X.; Cheng, G.D.; Hong, Y. Effects of 4D-Var Data Assimilation Using Remote Sensing Precipitation Products in a WRF Model over the Complex Terrain of an Arid Region River Basin. Remote Sens. 2017, 9, 963. [Google Scholar] [CrossRef]
  6. He, J.; Ma, X.L.; Chen, X. Benefit of Assimilating Satellite All-Sky Infrared Radiances on the Cloud and Precipitation Prediction of a Long-Lasting Mesoscale Convective System over the Tibetan Plateau. Q. J. R. Meteorol. Soc. 2023, 149, 2742–2760. [Google Scholar] [CrossRef]
  7. Andersson, E.; Hollingsworth, A.; Kelly, G.; Lönnberg, P.; Pailleux, J.; Zhang, Z. Global Observing System Experiments on Operational Statistical Retrievals of Satellite Sounding Data. Mon. Weather Rev. 1991, 119, 1851–1865. [Google Scholar] [CrossRef]
  8. Dee, D.P. Bias and data assimilation. Q. J. R. Meteorol. Soc. 2005, 131, 3323–3343. [Google Scholar] [CrossRef]
  9. Kelly, G.; Andersson, E.; Hollingsworth, A.; Lönnberg, P.; Pailleux, J.; Zhang, Z. Quality Control of Operational Physical Retrievals of Satellite Sounding Data. Mon. Weather Rev. 1991, 119, 1866–1880. [Google Scholar] [CrossRef]
  10. Yang, J.R.; He, J.; Ma, X.L.; Hao, B.J.; Zhang, T.T. Study on variational quality control of data assimilation in Tibetan Plateau: Parameters optimization and effective assimilation. Acta Meteorol. Sin. 2024, 82, 443–458. (In Chinese) [Google Scholar] [CrossRef]
  11. Järvinen, H.; Undén, P. Observation Screening and Background Quality Control in the ECMWF 3D-Var Data Assimilation System. In ECMWF Technical Memorandum No. 236; ECMWF: Reading, UK, 1997; pp. 1–33. [Google Scholar]
  12. Geer, A.J.; Lonitz, K.; Weston, P.; Kazumori, M.; Okamoto, K.; Zhu, Y.Q.; Liu, E.H.; Collard, A.; Bell, W.; Migliorini, S.; et al. All-sky satellite data assimilation at operational weather forecasting centres. Q. J. R. Meteorol. Soc. 2018, 144, 1191–1217. [Google Scholar] [CrossRef]
  13. Niu, Z.Y.; Wang, L.W.; Kumar, P. Scale Analysis of Typhoon In-Fa (2021) Based on FY-4A Geostationary Interferometric Infrared Sounder (GIIRS) Observed and All-Sky-Simulated Brightness Temperature. Remote Sens. 2023, 15, 4035. [Google Scholar] [CrossRef]
  14. Li, Z.T.; Han, W. Impact of Implementing All-Sky Radiance Assimilation for FY-3E MWHS-2 in the CMA-GFS. Mon. Weather Rev. 2025, 153, 847–863. [Google Scholar] [CrossRef]
  15. Wang, T.H.; Sun, W.; Ping, F. Impact of All-Sky Assimilation of Multichannel Observations from Fengyun-3F MWHS-II on Typhoon Forecasting. Remote Sens. 2025, 17, 2056. [Google Scholar] [CrossRef]
  16. He, J.; Ding, W.Y.; Wang, H.; Xiao, H.; Chen, S.Q.; Zhang, H.L.; Deng, H.; Ma, X.L. Pilot EnKF Assimilation of FY-4A AGRI All-Sky Upper-Tropospheric Water Vapor Radiances for a Warm-Sector Heavy Rainfall Case in South China. Atmos. Res. 2026, 337, 108934. [Google Scholar] [CrossRef]
  17. English, S.J.; Renshaw, R.J.; Dibben, P.C.; Smith, A.J.; Rayer, P.J.; Poulsen, C.; Saunders, F.W.; Eyre, J.R. A comparison of the impact of TOVS and ATOVS satellite sounding data on the accuracy of numerical weather forecasts. Q. J. R. Meteorol. Soc. 2000, 126, 2911–2931. [Google Scholar] [CrossRef]
  18. Niu, Z.Y.; Zhang, L.; Dong, P.M.; Weng, F.Z.; Huang, W.; Zhu, J. Effects of Direct Assimilation of FY-4A AGRI Water Vapor Channels on the Meiyu Heavy-Rainfall Quantitative Precipitation Forecasts. Remote Sens. 2022, 14, 3484. [Google Scholar] [CrossRef]
  19. Zhong, T.T.; Yang, C.; Min, J.Z.; Shi, B.Y.; Sun, Q.B. Added Value of Assimilating FY-4B AGRI Water Vapor Radiances on Analyses and Forecasts for “23 · 7” Heavy Rainfall. Remote Sens. 2025, 17, 3808. [Google Scholar] [CrossRef]
  20. Fang, L.; Zhan, X.W.; Hain, C.R.; Yin, J.F.; Liu, J.C.; Schull, M.A. An Assessment of the Impact of Land Thermal Infrared Observation on Regional Weather Forecasts Using Two Different Data Assimilation Approaches. Remote Sens. 2018, 10, 625. [Google Scholar] [CrossRef] [PubMed]
  21. Bormann, N. Accounting for Lambertian reflection in the assimilation of microwave sounding radiances over land and sea-ice. Q. J. R. Meteorol. Soc. 2022, 148, 2796–2813. [Google Scholar] [CrossRef]
  22. Duan, B.H.; Zhang, W.M.; Yang, X.F.; Dai, H.J.; Yu, Y. Assimilation of Typhoon Wind Field Retrieved from Scatterometer and SAR Based on the Huber Norm Quality Control. Remote Sens. 2017, 9, 987. [Google Scholar] [CrossRef]
  23. Geer, A.J.; Bauer, P. Observation errors in all-sky data assimilation. Q. J. R. Meteorol. Soc. 2011, 137, 2024–2037. [Google Scholar] [CrossRef]
  24. Geer, A.J. Correlated observation errors models for assimilating all-sky infrared radiances. Atmos. Meas. Tech. 2019, 12, 3629–3657. [Google Scholar] [CrossRef]
  25. Lorenc, A.C.; Hammon, O. Objective quality control of observations using Bayesian methods, Theory, and a practical implementation. Q. J. R. Meteorol. Soc. 1988, 114, 515–543. [Google Scholar] [CrossRef]
  26. Dharssi, I.; Lorenc, A.C.; Ingleby, N.B. Treatment of gross errors using maximum probability theory. Q. J. R. Meteorol. Soc. 1992, 118, 1017–1036. [Google Scholar] [CrossRef]
  27. Ingleby, N.B.; Lorenc, A.C. Bayesian quality control using multivariate normal distributions. Q. J. R. Meteorol. Soc. 1993, 119, 1195–1225. [Google Scholar] [CrossRef]
  28. Andersson, E.; Järvinen, H. Variational quality control. Q. J. R. Meteorol. Soc. 1999, 125, 697–722. [Google Scholar] [CrossRef]
  29. Ma, X.L.; He, J.; Zhou, B.Y.; Li, L.L.; Ji, Y.X.; Guo, H. Effect of variational quality control of Non-Gaussian distribution observation errors on heavy rainfall prediction. Trans. Atmos. Sci. 2017, 40, 170–180. (In Chinese) [Google Scholar] [CrossRef]
  30. He, J.; Ma, X.L.; Ge, X.Y.; Liu, J.J.; Cheng, W.; Chan, M.Y.; Xiao, Z.N. Variational Quality Control of Non-Gaussian Innovations in the GRAPES m3DVAR System: Mass Field Evaluation of Assimilation Experiments. Adv. Atmos. Sci. 2021, 38, 1510–1524. [Google Scholar] [CrossRef]
  31. Lopez, P. Direct 4D-Var Assimilation of NCEP Stage IV Radar and Gauge Precipitation Data at ECMWF. Mon. Weather Rev. 2011, 139, 2098–2116. [Google Scholar] [CrossRef]
  32. Auligné, T. Multivariate Minimum Residual Method for Cloud Retrieval. Part II: Real Observations Experiments. Mon. Weather Rev. 2014, 142, 4399–4415. [Google Scholar] [CrossRef]
  33. Geer, A.J.; Migliorini, S.; Matricardi, M. All-sky assimilation of infrared radiances sensitive to mid- and upper-tropospheric moisture and cloud. Atmos. Meas. Tech. 2019, 12, 4903–4929. [Google Scholar] [CrossRef]
  34. He, J.; Ma, X.L.; Han, W.; Deng, H.; Shi, Y.; Wang, H.; Ding, W.Y.; Chen, S.Q. Assimilating satellite clear-sky infrared radiances in the CMA-MESO model using variational quality control. Q. J. R. Meteorol. Soc. 2026, 152, e70142. [Google Scholar] [CrossRef]
  35. Hao, B.J.; Yang, J.R.; Zhang, T.T.; Chen, H.; Hao, X.J.; He, J.; Ma, X.L. Huber norm variational quality control based on channel errors characteristics of microwave thermometer and hygrometer from NOAA19 satellite observations. Acta Meteorol. Sin. 2025, 84, 87–105. (In Chinese) [Google Scholar] [CrossRef]
  36. Huber, J.P. The 1972 Wald Lecture Robust statistics: A review. Ann. Math. Stat. 1972, 43, 1041–1067. [Google Scholar] [CrossRef]
  37. Hampel, F.R. Robust estimation: A condensed partial survey. Probab. Theory Relat. Fields 1973, 27, 87–104. [Google Scholar] [CrossRef]
  38. Mitchell, D.G.; David, S.C.; Zhou, L.H. The Limb Adjustmet of AMSU-A Observations: Methodology and Validation. J. Appl. Meteorol. 2001, 40, 70–83. [Google Scholar] [CrossRef]
  39. Sun, S.; Shi, C.X.; Pan, Y.; Bai, L.; Xu, B.; Zhang, T.; Han, S.; Jiang, L.P. Applicability Assessment of the 1998-2018 CLDAS Multi-Source Precipitation Fusion Dataset over China. J. Meteorol. Res. 2020, 34, 879–892. [Google Scholar] [CrossRef]
  40. Auligné, T.; McNally, A.P.; Dee, D.P. Adaptive bias correction for satellite data in a numerical weather prediction system. Q. J. R. Meteorol. Soc. 2007, 133, 631–642. [Google Scholar] [CrossRef]
  41. Fisher, M.; Nocedal, J.; Trémolet, Y.; Wright, S.J. Data assimilation in weather forecasting: A case study in PDE-constrained optimization. Optim. Eng. 2009, 10, 409–426. [Google Scholar] [CrossRef]
  42. He, J.; Shi, Y.; Zhou, B.Y.; Wang, Q.P.; Ma, X.L. Variational Quality Control of Non-Gaussian Innovations and Its Parametric Optimizations for the GRAPES m3DVAR System. Front. Earth Sci. 2023, 17, 620–631. [Google Scholar] [CrossRef]
  43. Tavolato, C.; Isaksen, L. On the use of a Huber norm for observation quality control in the ECMWF 4D-Var. In ECMWF Technical Memorandum No. 744; ECMWF: Reading, UK, 2015; pp. 1–26. [Google Scholar]
  44. Karina, A.; Lidia, C.; Iliana, G.; Purser, R.J.; Su, X.J. Assessing the benefit of variational quality control for assimilating Aeolus Mie and Rayleigh wind profiles in NOAA’s global forecast system during tropical cyclones. Q. J. R. Meteorol. Soc. 2023, 149, 2761–2783. [Google Scholar] [CrossRef]
Figure 1. Statistical distribution of the innovations for NOAA18/AMSUA Channel 7 over the Plateau in June 2017 (30 days). (a) Linear scale. (b) Logarithmic scale.
Remotesensing 18 02029 g001
Figure 2. The actual distribution (black dots), Gaussian distribution (red solid line), and the distribution of the Flat-VarQC (blue solid line) for the innovations of NOAA18/AMSUA Channel 6 (a,b) and NOAA18/MHS Channel 3 (c,d) over the Plateau in June 2017 (30 days). (a,c) Linear scale. (b,d) Logarithmic scale.
Remotesensing 18 02029 g002
Figure 3. Utilization rates of five satellite data types in June 2017 in conventional QC and Flat-VarQC, and weight distributions of data that passed conventional QC versus retrieved data in Flat-VarQC. In the left panels, the gray bars represent observations rejected in both experiments, red bars represent data retrieved by Flat-VarQC. Percentages left of each bar indicate the proportion relative to total observations (numbers at the top of light blue bars). In the right panels, the left bars represent the weight proportions of all assimilated observations in the Flat-VarQC experiment; the right bars represent the same but for recovered observations. (a,b) NOAA18/AMSUA. (c,d) NOAA18/MHS. (e,f) METOP2/AMSUA. (g,h) METOP2/MHS.
Remotesensing 18 02029 g003aRemotesensing 18 02029 g003b
Figure 4. Statistics of the data volume (numbers at the top of the light blue bars) and the proportion of observations with different analysis weights (color bar) for different channels of five types of satellite observations in the ACH, TCH, and QCH experiments in June 2017. (a) NOAA18/AMSUA. (b) NOAA18/MHS. (c) METOP2/AMSUA. (d) METOP2/MHS. (e) Temperature channels of Suomi-NPP/ATMS. (f) Water vapor channels of Suomi-NPP/ATMS.
Remotesensing 18 02029 g004
Figure 5. Temperature analysis increments of 400 hPa (black contours; units: °C) from the CTL experiment (a) and the VQC experiment (b) at 0600 UTC on 21 June 2017. Crosses indicate the rejected observations by the assimilation system. (a) Light blue dots represent assimilated observations, and red dots represent observations that were rejected by CTL but retained by VQC. (b) Colors represent the weights assigned to METOP2/AMSUA Channel 6 observations.
Remotesensing 18 02029 g005
Figure 6. Analysis of 400 hPa geopotential height (black contours; units: gpm), temperature (red contours; units: °C), and relative humidity (shading; units: %) from the CTL experiment (a) and the VQC experiment (b) at 0600 UTC on 21 June 2017, along with their difference (VQC minus CTL) shown in (c). The blue star indicates the location of Lhasa Station.
Remotesensing 18 02029 g006
Figure 7. The 12 h accumulated precipitation (units: mm) at 0600 UTC on 22 June 2017. The red star indicates the location of Lhasa Station. (a) Observations. (b) CTL experiment. (c) VQC experiment.
Remotesensing 18 02029 g007
Figure 8. Threat Scores (a) and Equitable Threat Scores (b) for 12 h forecast accumulated precipitation at 0600 UTC on 22 June 2017 over the region shown in Figure 7.
Remotesensing 18 02029 g008
Figure 9. Forecast accumulated precipitation (units: mm) at Lhasa Station from 1800 UTC on 21 June 2017. (a) The 12 h forecast accumulated precipitation. (b) The 6 h forecast accumulated precipitation.
Remotesensing 18 02029 g009
Figure 10. Meridional vertical cross-section of the 12 h forecast of vertical velocity (black contours; units: m/s) and relative humidity (shading; units: %) through Lhasa Station (red star). Gray shading represents terrain height. (a) CTL experiment. (b) VQC experiment.
Remotesensing 18 02029 g010
Table 1. Assimilated observations in batch assimilation experiments.
Conventional ObservationsNOAA18/AMSUANOAA18/MHSMETOP2/AMSUAMETOP2/MHSSuomi-NPP/ATMS
ACHSYNOP, SOUND, Airep, GeoamvChannel 5, 6, 7, 8Channel 3, 4, 5Channel 5, 6, 9Channel 3, 4, 5Channel 6, 7, 8, 9, 10, 18, 19, 20, 21, 22
TCHChannel 5, 6, 7, 8Channel 5, 6, 9Channel 6, 7, 8, 9, 10
QCHChannel 3, 4, 5Channel 3, 4, 5Channel 18, 19, 20, 21, 22
Table 2. Channel selection for satellite observations and key parameters of Flat-VarQC.
SatelliteSensorChannelAd
NOAA18AMSUA50.03882.7008
60.03412.9677
70.03594.5466
80.09853.9423
MHS30.07486.1486
40.04985.2349
50.07144.1036
METOP2AMSUA50.08852.8398
60.07332.6770
90.02804.9905
MHS30.07346.6279
40.04395.4887
50.10194.5597
Suomi-NPPATMS60.07933.9769
70.10484.0765
80.02725.7670
90.03467.1073
100.08005.0967
180.02524.6316
190.05444.5886
200.04255.7203
210.05146.4249
220.07856.4720
Disclaimer/Publisher’s Note: The statements, opinions and data contained in all publications are solely those of the individual author(s) and contributor(s) and not of MDPI and/or the editor(s). MDPI and/or the editor(s) disclaim responsibility for any injury to people or property resulting from any ideas, methods, instructions or products referred to in the content.