Article

Embedded Compression Algorithm for Agricultural Optical Remote Sensing Images Based on Adaptive Sparse Coding


1
Faculty of Computing, Harbin Institute of Technology, Harbin 150001, China
2
State Key Laboratory of Smart Farm Technologies and Systems, Harbin 150001, China
3
Harbin Institute of Technology Research Institute for Artificial Intelligence Inc., Harbin 150001, China
4
Department of Land Surveying and Geo-Informatics, Hong Kong Polytechnic University, Hong Kong 999077, China
*
Author to whom correspondence should be addressed.
Remote Sens. 2026, 18(12), 1912; https://doi.org/10.3390/rs18121912
Submission received: 30 April 2026 / Revised: 1 June 2026 / Accepted: 8 June 2026 / Published: 10 June 2026

Highlights

What are the main findings?
  • A content-aware adaptive sparse codingmethodwas developed and successfully deployed on a 5G-integrated edge computing node for efficient agricultural image compression.
  • The system reduces 5G data transmission windows by over 90% at a 95% compression ratio, while maintaining the deviation of critical agronomic indices (NDVI, NDRE, and GNDVI) within 5%.
What are the implications of the main finding?
  • The framework effectively resolves bandwidth bottlenecks and latency issues encountered when transmitting massive high-resolution remote sensing data from field equipment like UAVs.
  • The proposed hardware–software co-design shifts agricultural image processing from an offline paradigm to real-time online acquisition, supporting timely crop monitoring and precision farming decisions.

Abstract

High-resolution remote sensing is essential for information acquisition in smart agriculture, yet real-time processing remains a critical challenge. Although high-resolution imagery provides comprehensive data, its massive volume complicates efficient handling. Existing techniques are predominantly restricted to offline scenarios, conflicting with the practical requirements for online acquisition and transmission. To address these challenges, we propose an adaptive sparse coding method for agricultural remote sensing images that dynamically selects compression strategies based on image content. Using this approach, we developed an embedded terminal system for real-time agricultural data transmission over 5G networks. Experimental results show that at a 95% compression ratio, transmission time is reduced by over 90% compared with uncompressed images. The method also achieves high-fidelity reconstruction; the deviation rates for the normalized difference vegetation index (NDVI) and normalized difference red edge index (NDRE) remain below 5% even at a 97% compression ratio. This approach offers fast transmission, high compression efficiency, and strong reconstruction quality, making it suitable for field equipment such as unmanned aerial vehicles in real-time monitoring networks.

1. Introduction

High-resolution remote sensing has become an important source of information for smart agriculture [1,2,3]. It supports fine-grained agricultural management tasks, including crop phenology monitoring, pest and disease tracking, and yield prediction [4,5,6,7]. Timely crop diagnosis and field-level decision-making require image processing and transmission pipelines that can operate close to the time of acquisition [8]. As optical remote sensing sensors continue to improve in spatial and spectral resolution, the data volume of a single farmland image can reach the gigabyte scale. In practice, however, many processing workflows still rely on offline analysis. Sadeghi-Tehran et al. [9], for example, proposed a convolutional neural network model for shaded-region identification to improve crop spectral feature extraction, but the image data were processed in an offline setting. For field-edge nodes, limited communication bandwidth and onboard computing resources can introduce substantial latency during raw data transmission. Although 5G networks provide higher link capacity than earlier wireless technologies [10], transmitting uncompressed high-resolution imagery remains inefficient for time-sensitive agricultural applications. Therefore, compression methods for agricultural remote sensing should jointly consider compression ratio, preservation of agronomic information, and feasibility on embedded platforms [11].
Compression algorithms must balance the compression ratio and the fidelity of agricultural parameters. The ability to adapt to image content is fundamental to achieving this balance. Agricultural remote sensing images exhibit unique spatial and spectral heterogeneity, requiring compression algorithms to dynamically allocate encoding resources based on local content [12]. Over the past decades, transform coding has become one of the most widely used methods for compressing remote sensing images. The discrete cosine transform (DCT) and discrete wavelet transform (DWT) are standard techniques in mainstream coding architectures. Various lossy and lossless compression schemes using these transforms have been developed for multispectral and hyperspectral imagery [13]. International standards, such as JPEG, AVS [14], and JPEG 2000 [15,16], have been deployed on Earth observation satellites. However, these traditional methods often exhibit pronounced distortion under high compression ratios, making it difficult to concurrently ensure transmission efficiency and agricultural parameter accuracy. Although recent deep learning-based compression models have improved rate-distortion performance, their high computational complexity and massive parameter counts impede deployment on power-constrained embedded agricultural terminals. For instance, Ji et al. [17] proposed an Efficient Channel-Temporal Attention Module (ETAM) that combines spatial feature extraction through lightweight channel attention and temporal dynamics modeling. However, its multi-branch attention pathways and temporal feature aggregation mechanisms impose a substantial memory footprint. Ye et al. [18] proposed the Map-Assisted Generative Compression (MAGC) method for remote sensing image compression, achieving high-fidelity reconstruction at ultra-low bitrates. However, this approach relies on resource-intensive pre-trained diffusion models and complex conditional guidance mechanisms, introducing computational overheads that exceed the constraints of agricultural edge hardware. The lack of content-adaptive mechanisms tailored for agricultural scenarios remains a bottleneck hindering the deployment of compression technologies in real-world farming. Sparse coding provides an effective way to represent signal structures by exploiting redundancy in an appropriate basis or dictionary. Classical sparse coding methods often rely on over-complete dictionaries, such as learned basis sets or dictionary-learning frameworks, to obtain flexible signal representations [19,20]. However, these dictionaries usually need to be trained on representative samples, which may limit their portability across different sensors, crop scenes, and acquisition conditions. Another common route is to obtain sparse coefficients through L 1 -based optimization, as in basis pursuit [21], but such iterative optimization can introduce computational overhead that is not well suited to embedded edge terminals. Considering these constraints, this study adopts a fixed orthogonal DCT basis and introduces a content-adaptive truncation strategy to obtain a sparse coefficient representation for high-resolution agricultural remote sensing images.
The deployment of edge nodes is crucial for real-time agricultural monitoring, and the selection of transmission protocols directly influences overall system performance. In agricultural IoT, the LoRa protocol is widely used for ultra-low-power backhaul of simple sensor data; however, its extremely low data rate makes it unsuitable for time-sensitive tasks involving images [22]. While Zigbee and WiFi are mature in greenhouse monitoring, their effective coverage is relatively small in open-field environments, where link stability is compromised by terrain and vegetation [23,24]. In contrast, 5G technology provides high throughput, ultra-low latency, and extensive coverage, offering a viable pathway for real-time remote sensing transmission [25]. Nevertheless, advancing the communication infrastructure alone cannot resolve the bottleneck of massive data streams, as directly transmitting uncompressed high-resolution images over 5G networks consumes excessive bandwidth [26]. Therefore, it is necessary to jointly design content-adaptive compression algorithms, embedded terminal optimization, and transmission protocol integration to build a robust field-deployable monitoring system.
To address the gaps in agricultural remote sensing data processing, we introduce an integrated solution featuring a content-aware compression framework and a field-ready 5G embedded platform. The principal contributions of this work are as follows:
  • We propose a lightweight, content-adaptive sparse coding algorithm that dynamically adjusts compression parameters based on local texture and spectral characteristics. This method effectively removes redundancy in homogeneous regions while preserving critical details.
  • We develop an end-to-end embedded system that integrates the optimized compression pipeline with 5G transmission, building on the proposed algorithm. This hardware–software co-design enables real-time, high-efficiency data delivery for edge-based remote sensing monitoring platforms.
The paper is organized as follows. Section 2 presents the materials and methods, including the proposed compression framework, embedded implementation, dataset configuration, and evaluation metrics. Section 3 reports the experimental results. Section 4 discusses the main findings, limitations, and future research directions. Section 5 concludes the paper.

2. Materials and Methods

2.1. Overall Framework

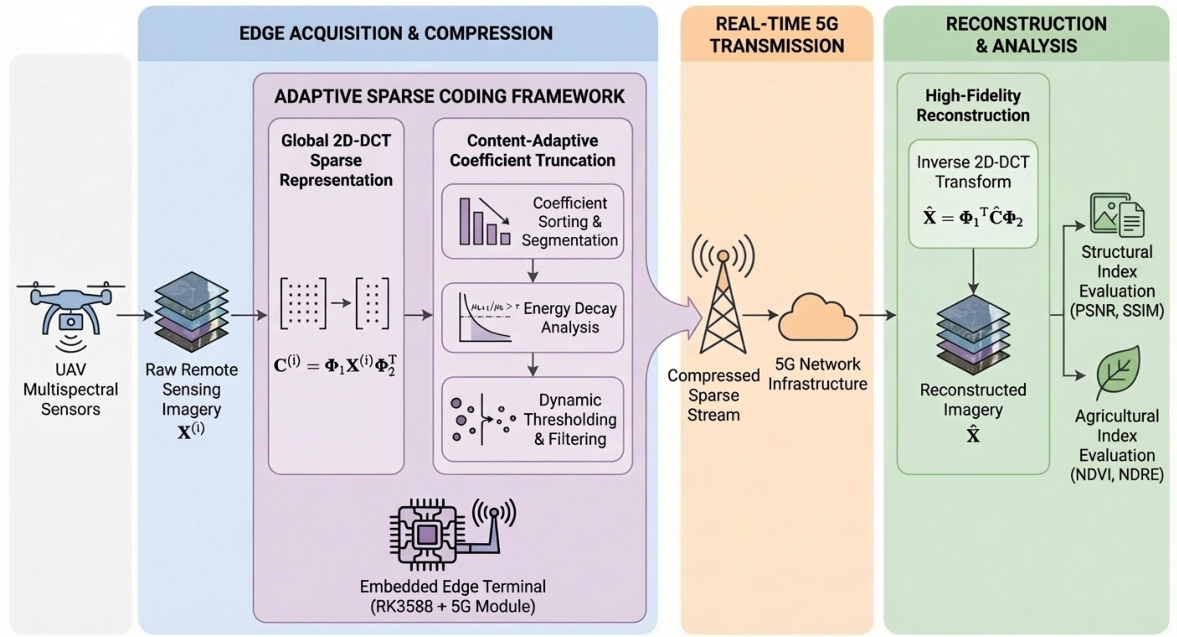
To reduce the mismatch between large image volumes and limited edge resources, the proposed method integrates compression, 5G transmission, and quality assessment into an edge-to-cloud pipeline. The framework consists of three stages. First, a cosine orthogonal basis is used to obtain a sparse representation of multispectral agricultural remote sensing images. Second, a content-adaptive truncation mechanism estimates the decay pattern of transform-domain coefficients and removes low-amplitude components according to a dynamic threshold. Finally, the retained coefficients and their positional indices are transmitted through a 5G network to a central server, where the images are reconstructed and evaluated. An overview of the framework is shown in Figure 1.

2.2. Mathematical Framework of Sparse Representation

Agricultural remote sensing images typically exhibit high spatial correlation in the spatial domain, while demonstrating significant sparsity in specific orthogonal transform domains. Given a single-band remote sensing image matrix X ( b ) R n 1 × n 2 , this study employs a global two-dimensional discrete cosine transform (2D-DCT) to extract energy-concentrated features [27]. Because the 2D-DCT is mathematically separable, the transformation of the two-dimensional image can be equivalently implemented by applying one-dimensional orthogonal transforms along its rows and columns.
Let Φ ( L ) R L × L denote a standard 1D-DCT orthogonal basis matrix of generic dimension L. The element at its k-th row and j-th column, denoted as Φ k , j ( L ) , is mathematically defined in Equation (1):
Φ k , j ( L ) = 1 L , k = 0 2 L cos π ( 2 j + 1 ) k 2 L , k = 1 , 2 , , L 1
where j { 0 , 1 , , L 1 } .
To accommodate the asymmetric dimensions ( n 1 × n 2 ) of the global image matrix, we construct two independent orthogonal basis matrices: a row transform matrix Φ 1 = Φ ( n 1 ) R n 1 × n 1 and a column transform matrix Φ 2 = Φ ( n 2 ) R n 2 × n 2 . By multiplying Φ 1 on the left and the transpose of Φ 2 on the right, the original spatial data is mapped to the frequency domain, formulated as Equation (2).
C ( b ) = Φ 1 X ( b ) Φ 2 T
The matrix formulation above corresponds to the implementation used in this study. For the UAV image with a size of 8414 × 11 , 042 pixels, two DCT basis matrices with sizes of 8414 × 8414 and 11 , 042 × 11 , 042 were generated. This design requires a relatively large memory space, which is one reason why a 16 GB embedded development board was selected for the edge node. In the implementation, the DCT basis matrices are generated once and reused for different spectral bands, rather than being reconstructed repeatedly. This strategy makes the full-matrix transform feasible for the tested image size, although it is not the most memory-efficient implementation. Future versions of the system can replace the full-matrix operation with separable or tile-wise fast DCT implementations to further reduce memory usage and improve scalability for larger images.
After the transform, most low-frequency image structures are represented by a relatively small number of coefficients with large absolute values. In contrast, high-frequency details and noise are usually associated with coefficients of small magnitude. This coefficient distribution motivates the adaptive truncation strategy used in the following step.
Following edge-side truncation and 5G transmission, the cloud server performs image reconstruction. Let C ^ denote the sparse coefficient matrix reassembled from the received non-zero values and indices, with truncated elements padded with zeros. Since the generated basis matrix Φ is strictly orthogonal, satisfying Φ Φ T = I , the inverse transformation does not require matrix inversion. The reconstructed image block X ^ is computed using the transpose of the basis matrix, as defined in Equation (3).
X ^ ( b ) = Φ 1 T C ^ ( b ) Φ 2
This mathematical symmetry ensures that the decoding process on the central server is computationally lightweight while enabling high-fidelity recovery of the agronomic features.

2.3. Content-Adaptive Truncation Algorithm

Traditional compression algorithms generally employ fixed quantization steps or truncation ratios, which struggle to handle the texture heterogeneity in agricultural remote sensing images [28]. We propose a content-aware adaptive truncation mechanism based on the amplitude decay characteristics of the transformed coefficients. The transform-domain coefficient matrix is first flattened into a one-dimensional vector and sorted in descending order by absolute value. The sorted sequence is then equally divided into N continuous sub-segments, and the arithmetic mean of the absolute coefficients within the k-th segment, denoted as μ k , is calculated, where N is an experimentally calibrated hyperparameter.
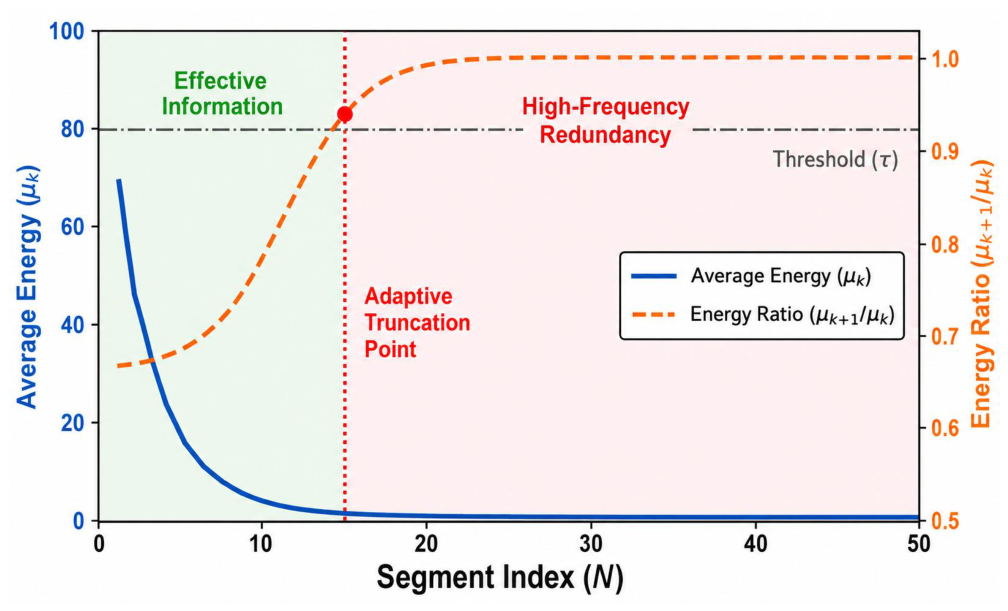
In the spectral distribution of agricultural imagery, high-frequency noise and fine-scale redundant details often appear as a long tail of coefficients with small amplitudes [29]. As the coefficient sequence moves toward the high-frequency end, the amplitudes associated with dominant image structures decrease rapidly. After the sequence enters the low-energy tail region, the amplitude decay becomes more gradual, and the ratio of the average absolute values between adjacent segments, μ k + 1 / μ k , tends to approach 1. Based on this property, the algorithm introduces a dynamic threshold τ . When the adjacent-segment ratio satisfies μ k + 1 / μ k > τ , the subsequent coefficients are treated as low-contribution high-frequency components and are set to zero through hard thresholding. As illustrated in Figure 2, this adaptive intersection provides a data-driven truncation position between the dominant coefficient region and the low-energy tail.
For multispectral images, the truncation point is first calculated independently for each band, and the maximum value is then selected as the global unified truncation position. This conservative design is used to preserve inter-band consistency. Although a per-band truncation strategy could further reduce the payload for spectrally smooth bands, it may also introduce band-dependent loss of spatial details and affect the radiometric relationships used in vegetation-index calculation. By adopting the maximum truncation position across bands, all bands retain at least the coefficient range required by the most detail-rich band. This may leave a small number of redundant coefficients in smoother bands, but it reduces the risk of inconsistent spatial or spectral degradation among bands.

2.4. Edge Device Deployment and 5G Real-Time Transmission

To overcome the latency limitations of traditional offline processing, we deploy the adaptive sparse coding algorithm on resource-constrained edge computing terminals, establishing an end-to-end real-time data acquisition and transmission framework. In field monitoring, the edge node, mounted on mobile platforms such as unmanned aerial vehicles (UAVs), ingests high-resolution multispectral imagery and executes lightweight compression. Since the algorithm only retains the non-zero coefficients prior to the truncation point and their one-dimensional positional indices, the data payload is drastically reduced, alleviating the reliance on wireless bandwidth.
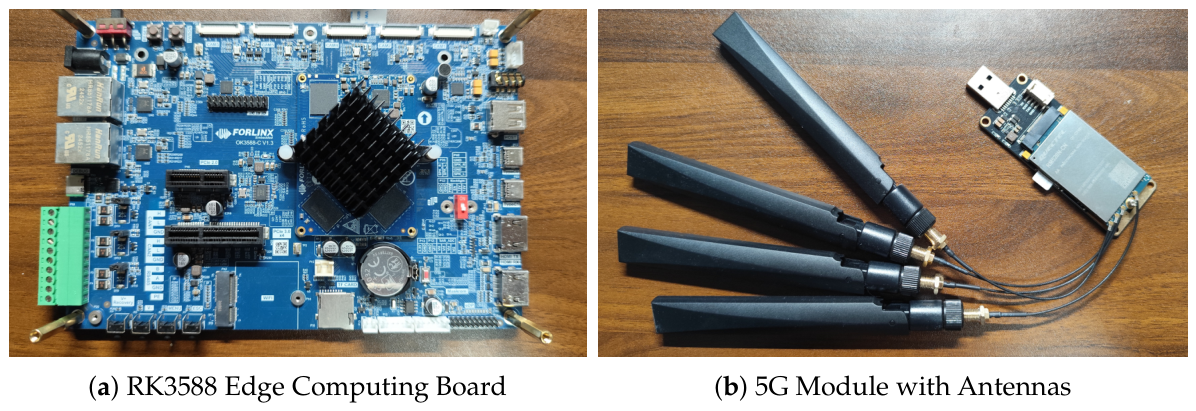
The system’s core hardware architecture comprises a master processing unit and a high-speed communication unit. The master controller uses the Forlinx RK3588 embedded edge computing board (Figure 3a), which efficiently executes the sparse coding algorithm. The communication terminal integrates a Quectel RM520N-CN 5G radio frequency module (Figure 3b), equipped with four YECT005W1A 5G omnidirectional antennas and an embedded China Telecom SIM card, ensuring signal coverage and stability in agricultural environments subject to multipath effects.
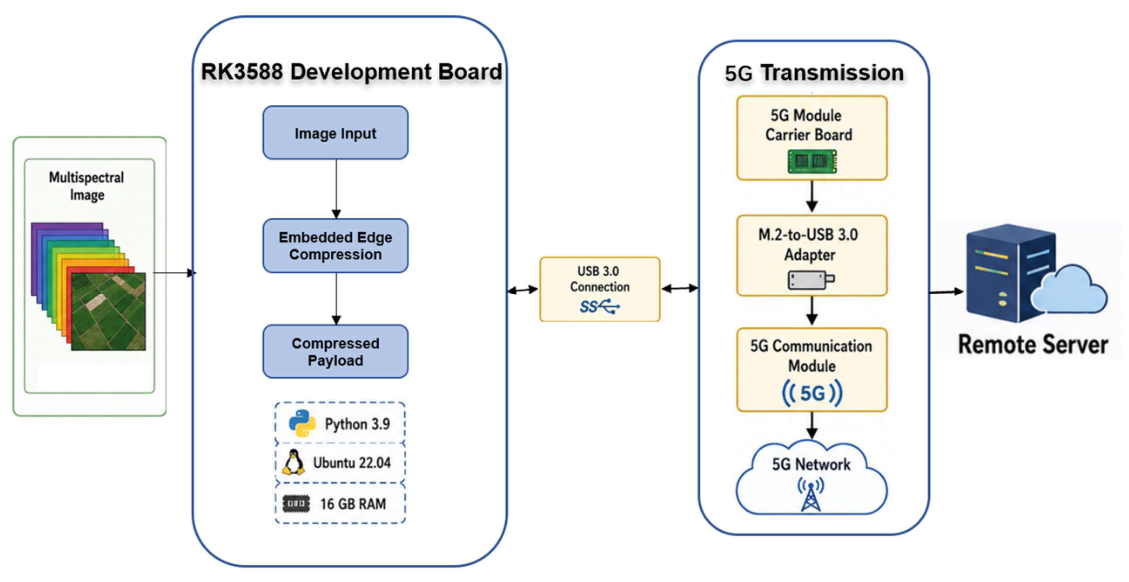
Figure 4 further illustrates the hardware–software workflow of the embedded implementation. The multispectral image is first loaded into the RK3588 development board, where the compression module runs under Ubuntu 22.04 with a Python 3.9 environment. Within the edge node, the image cube is processed by the embedded compression algorithm, which includes DCT transformation, coefficient analysis, adaptive truncation, and coefficient/index encoding. The resulting compressed payload is transferred from the RK3588 board to the 5G module carrier board through a USB 3.0 connection. The 5G communication module is then accessed through the M.2-to-USB 3.0 adapter and transmits the compressed payload to the remote server through the 5G network. On the server side, the payload is decoded and reconstructed for subsequent quality evaluation and vegetation-index analysis.
This module’s lightweight form factor, industrial-grade thermal tolerance, and high uplink capabilities make it highly suitable for UAV operations (specifications detailed in Table 1). The 5G module’s development board bridges to the RK3588 motherboard via an M.2 to USB 3.0 adapter, supporting high-throughput data transfer. At the software protocol layer, the embedded system establishes a point-to-point data link with the 5G base station via cellular dial-up networking. The compressed sparse matrix data stream is then pushed to the remote central cloud server in real-time, utilizing the high bandwidth and low latency of the 5G link for downstream storage and analysis.

2.5. Parameter Calibration

The parameters N and τ are used to control the truncation position rather than to serve as independent model parameters. Specifically, N determines the granularity of coefficient segmentation, while τ controls when the decay between adjacent segment means is considered sufficient for truncation. Their combined effect is ultimately reflected in the realized compression ratio. For example, when N = 100 , each segment accounts for approximately 1% of the sorted coefficient sequence; retaining about five segments therefore corresponds to a compression ratio close to 95%. Different combinations of N and τ may lead to similar truncation positions and similar compression ratios. Therefore, the parameter selection in this study was guided by the target compression ratio, with reconstruction quality and agronomic-index preservation used as secondary checks.

2.6. Experimental Setup and Evaluation Metrics

We evaluated the proposed framework through system-level experiments using field-collected agricultural remote sensing data. The assessment focused on rate-distortion performance, fidelity of downstream agronomic parameters, and end-to-end transmission efficiency in a real edge-to-cloud setup.

2.6.1. Embedded Experimental Platform

Unlike offline processing on high-performance clusters, the compression algorithm was deployed directly on resource-constrained edge nodes. A Forlinx FET3588-C embedded board served as the acquisition and compression terminal. This platform features an octa-core ARM processor and 16 GB LPDDR4 memory, providing sufficient throughput for large multispectral matrices (Table 2). The orthogonal transformation and adaptive truncation run entirely on CPU cores, avoiding power-intensive GPU acceleration. The compressed data is transmitted via 5G to a central server, which performs the inverse transform and quantitative agronomic analysis.

2.6.2. Dataset Configuration

The experimental dataset consists of high-resolution agricultural remote sensing images acquired from an in-field UAV platform and the Sentinel-2 satellite mission. A large UAV image with a spatial size of 8414 × 11 , 042 pixels and five spectral bands, namely Blue, Green, Red, Red Edge, and Near-Infrared, was used as the primary benchmark. The raw data volume is approximately 1.75 GB, representing a data scale that can place substantial pressure on real-time field transmission. To provide an additional evaluation on spaceborne imagery, Sentinel-2 data was also included. Sentinel-2, operated by the European Space Agency (ESA), carries the Multi-Spectral Instrument (MSI), which provides systematic global coverage and frequent revisits [30]. In this study, five agriculturally relevant bands were selected, including the Blue, Green, Red, and Near-Infrared bands at 10 m spatial resolution, together with the red-edge Band 6 at 20 m spatial resolution. The 20 m red-edge band was resampled to 10 m using nearest-neighbor interpolation in ENVI version 5.6 to match the spatial grid of the other bands while avoiding additional radiometric smoothing. The resulting Sentinel-2 data cube has a spatial size of 10 , 980 × 10 , 980 pixels and a file size of approximately 1.1 GB. The spectral configuration of the selected Sentinel-2 bands is summarized in Table 3. Together, the UAV and Sentinel-2 datasets provide two representative acquisition platforms and data scales for evaluating the proposed compression framework.

2.6.3. Evaluation Metrics

To measure transmission efficiency, we use the actual compression ratio (CR). Unlike methods that solely transmit pixel values, the sparse coding framework must transmit both the non-zero coefficient values and their corresponding spatial indices. The values are encoded as 32-bit floats (float32) and the indices as 32-bit integers (int32). Since both occupy 4 bytes, the storage overhead for each retained coefficient is doubled. The actual CR is defined as:
C R = 1 2 K max n 1 n 2
where K max denotes the unified truncation point, and n 1 × n 2 represents the total pixels in a single band.
For image reconstruction quality, we compute the Peak Signal-to-Noise Ratio (PSNR) and Structural Similarity (SSIM), which are standard metrics for multispectral image compression [31,32]. These are calculated band-by-band, and their global averages are reported. For an image cube with size n 1 × n 2 × B , let X ( b ) and X ^ ( b ) be the original and reconstructed images of the b-th band. Because agricultural data often use floating-point formats instead of standard 8-bit integers, we define the dynamic range using the actual maximum radiometric value of the original band, M A X ( b ) . The Mean Squared Error (MSE) and mean PSNR (mPSNR) are calculated as:
M S E ( b ) = 1 n 1 n 2 x = 1 n 1 y = 1 n 2 X ( b ) ( x , y ) X ^ ( b ) ( x , y ) 2
m P S N R = 1 B b = 1 B 10 log 10 ( M A X ( b ) ) 2 M S E ( b )
While PSNR measures absolute pixel-level errors, SSIM evaluates perceptual similarity [33]. To account for radiometric variations, the constants c 1 and c 2 in the SSIM calculation are scaled according to the data range of each band. The mean SSIM (mSSIM) is the average across all B bands:
m S S I M = 1 B b = 1 B S S I M ( X ( b ) , X ^ ( b ) )
Additionally, we calculate the Normalized Difference Vegetation Index (NDVI), Normalized Difference Red Edge Index (NDRE), and Green Normalized Difference Vegetation Index (GNDVI) to verify that the compression preserves radiometric relationships relevant to agronomic analysis. Currently, NDVI is a standard indicator for monitoring crop growth [34,35], computed from the Near-Infrared (NIR) and Red bands:
N D V I = R N I R R R e d R N I R + R R e d
The NDRE index, sensitive to chlorophyll variations for early crop stress detection [36,37], replaces the Red band with the Red Edge band:
N D R E = R N I R R R e d E d g e R N I R + R R e d E d g e
We also computed GNDVI to evaluate compression consistency in the visible spectrum, which reflects photosynthetic efficiency using the Green band [38,39,40]:
G N D V I = R N I R R G r e e n R N I R + R G r e e n

3. Results

3.1. Compression Performance and Parameter Sensitivity

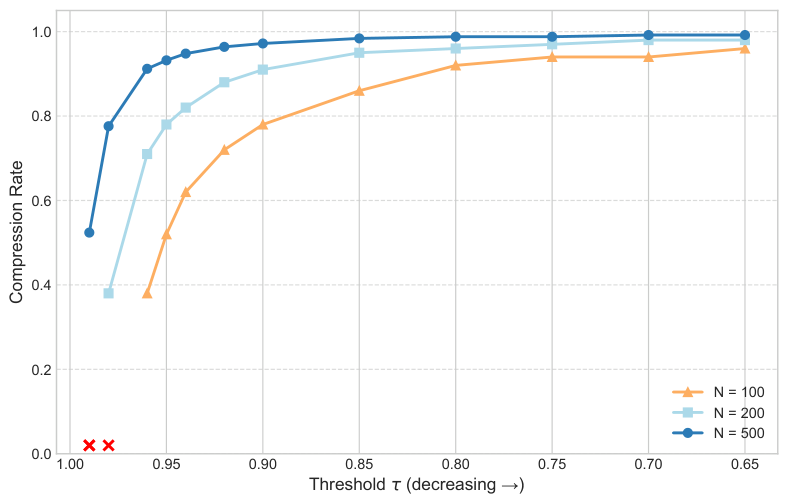
To clarify the calibration process of N and τ , we summarized the measured compression ratios under representative parameter combinations. Since these two parameters mainly affect the truncation position, their influence is interpreted through the realized CR rather than as a separate optimization problem. Figure 5 shows the overall trend, and Table 4 provides numerical operating points for different ( N , τ ) settings. This trend is accompanied by higher reconstruction quality, as reflected by the mPSNR and mSSIM values reported for the representative setting of N = 200 .
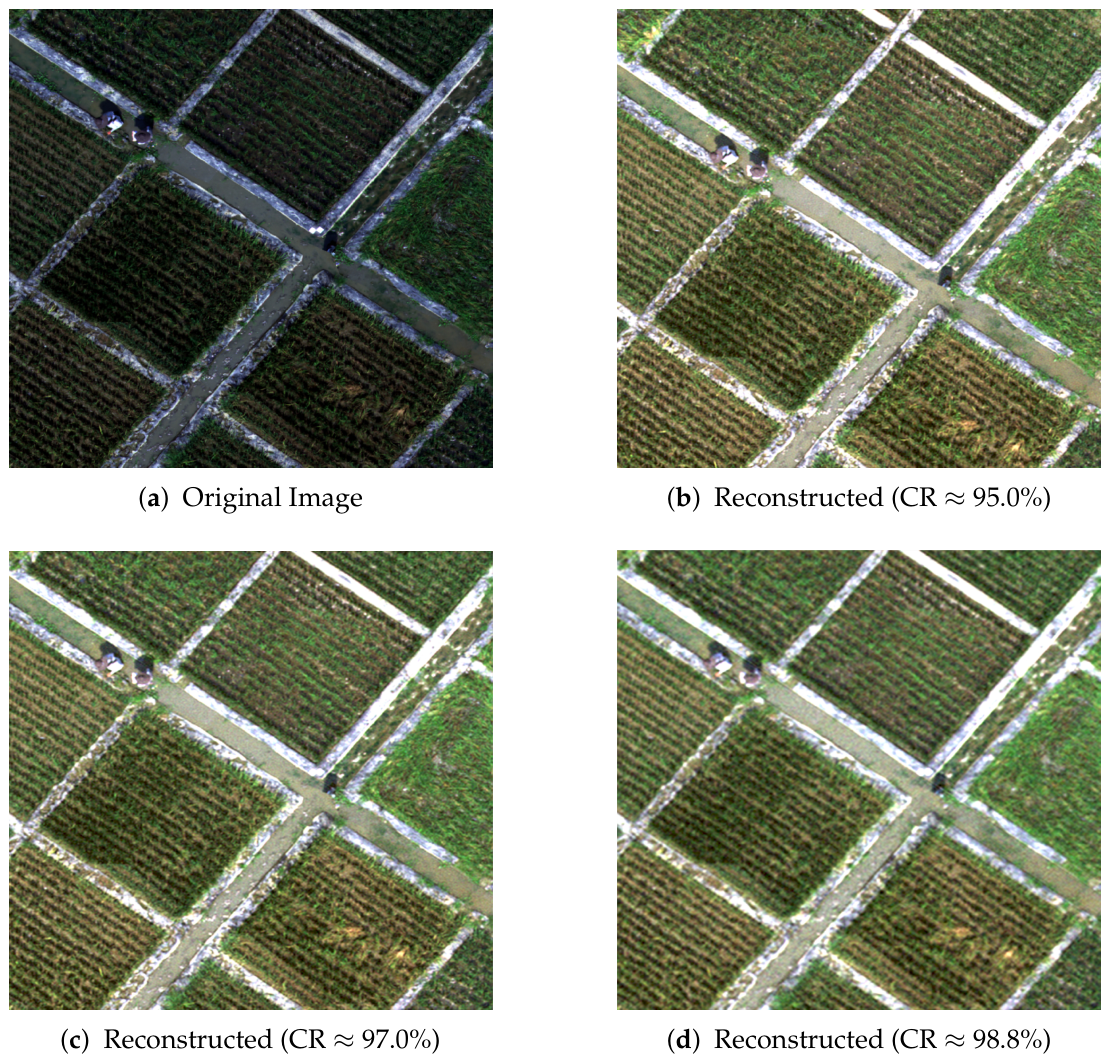
Visual inspection confirms reconstruction quality intuitively. Figure 6 compares the original image with its reconstructed versions. While minor high-frequency textures are smoothed at higher compression ratios, the adaptive mechanism successfully retains macroscopic structures such as farmland boundaries and crop rows. Even at a compression ratio exceeding 95%, visual fidelity remains sufficient for manual interpretation and downstream analysis.

3.2. Quantitative Evaluation of Reconstruction Quality

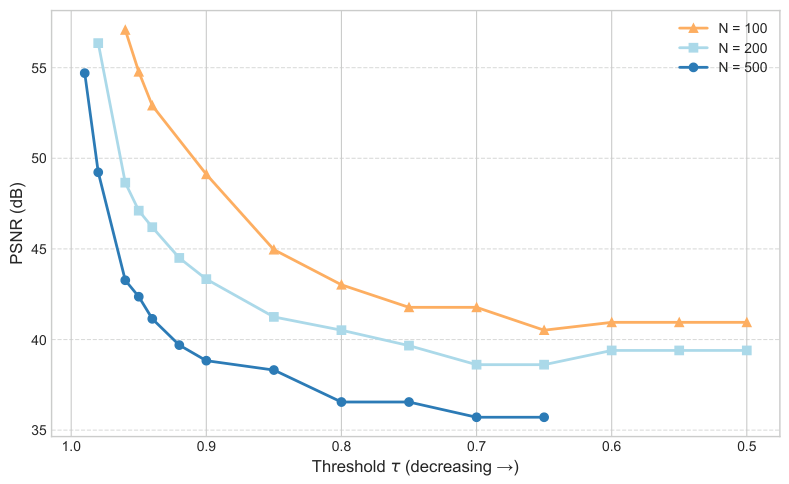
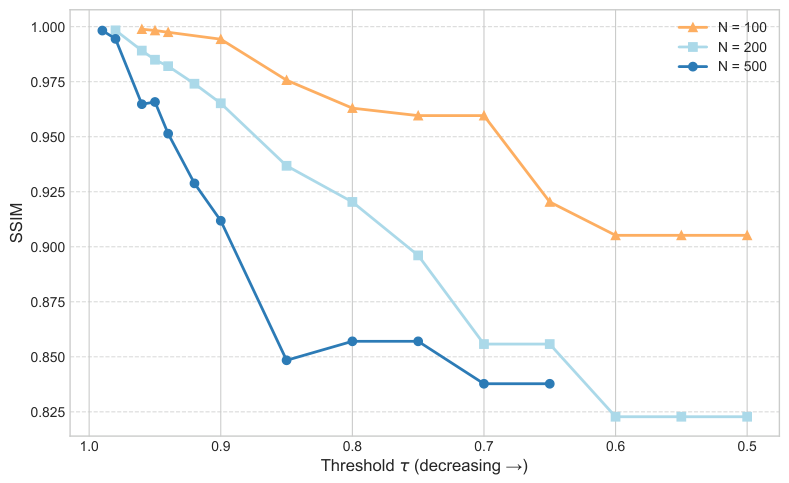
Figure 7 and Figure 8 illustrate the effects of the segment number N and threshold τ on reconstruction quality. Decreasing τ triggers earlier truncation, discarding more high-frequency coefficients and lowering mPSNR and mSSIM. However, the content-aware mechanism ensures this degradation is gradual. Even at high compression ratios, the algorithm preserves essential low-frequency structures without introducing the severe blocking artifacts typical of traditional block-based DCT, providing reliable data for parameter retrieval.

3.3. Fidelity of Agricultural Parameters

Because agricultural imagery is primarily used for condition analysis, preserving relative radiometric intensity across multispectral bands during compression is crucial. We assess parameter retrieval accuracy by calculating NDVI, NDRE, and GNDVI.
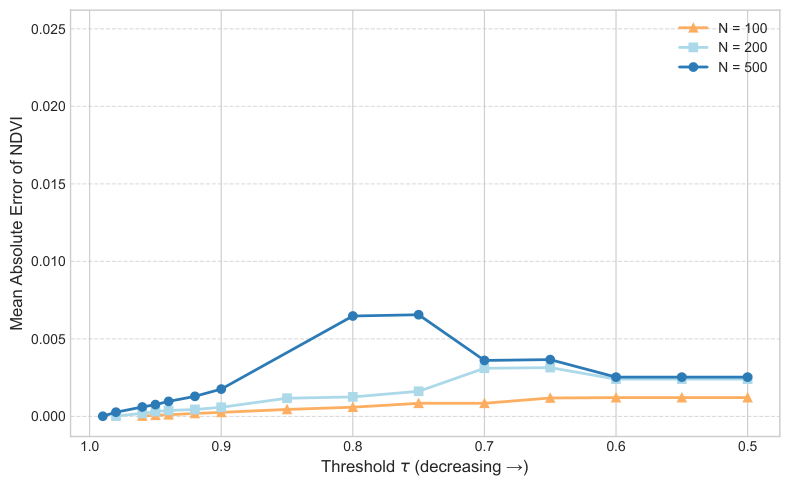
Figure 9 shows the Mean Absolute Error (MAE) of the NDVI across different N and τ settings. The NDVI deviation remains marginal even at high compression ratios, confirming that the algorithm retains key spectral characteristics.
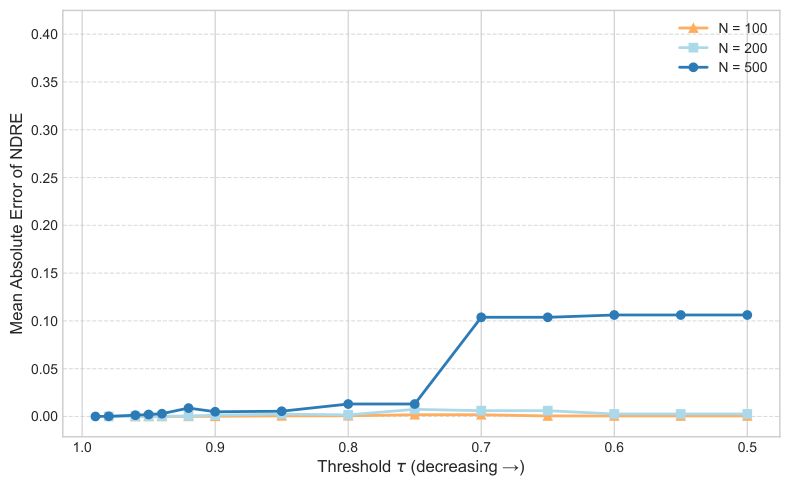
Figure 10 shows the MAE for NDRE. Although the red-edge band contains less energy than the NIR band, the adaptive truncation strategy preserves sufficient high-frequency information to maintain reliable NDRE values.
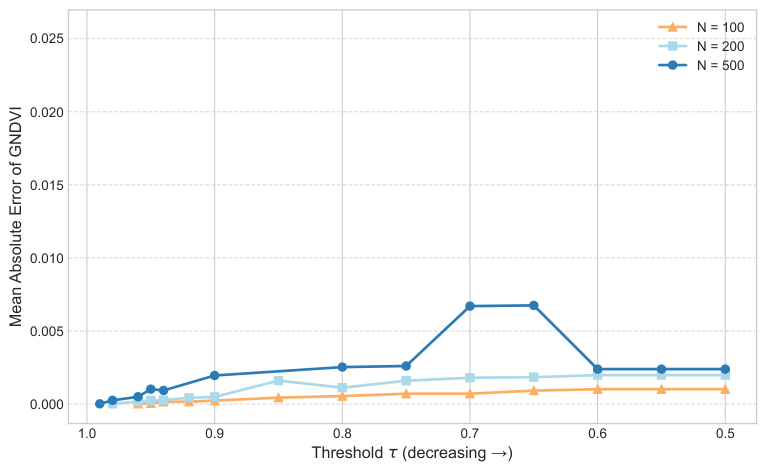
The GNDVI error curve (Figure 11) demonstrates stability comparable to NDVI.
To provide a more direct numerical interpretation of the agronomic-index preservation results, Table 5 summarizes the image-level absolute deviation and relative deviation of NDVI, NDRE, and GNDVI at representative compression ratios of approximately 95% and 97%. The index deviation was calculated from the difference between the reconstructed and original mean index values over valid image regions. This table complements the index-error curves by giving benchmark numerical values at the main compression levels discussed in this study.

3.4. Baseline Comparison on Public UAV-Borne Hyperspectral Data

To further examine the extensibility of the proposed transform-domain compression strategy, an additional baseline experiment was conducted on two public UAV-borne hyperspectral scenes from the WHU-Hi benchmark dataset, namely WHU-Hi-HongHu and WHU-Hi-LongKou [41]. Unlike the five-band multispectral data used in the main experiments, these hyperspectral cubes contain 270 spectral bands and therefore provide a more demanding test case for spectral-spatial compression. In this experiment, the proposed method was extended from band-wise two-dimensional DCT to three-dimensional DCT, in which the transform was applied jointly along the two spatial dimensions and the spectral dimension. JPEG2000 was used as a conventional baseline, with each spectral band compressed independently as a two-dimensional image.
Table 6 reports the reconstruction quality and pixel-wise agronomic-index errors at representative high compression ratios. Here, the MAE and RD values of NDVI, NDRE, and GNDVI were calculated on a pixel-wise basis over valid pixels. This pixel-level evaluation has a different statistical granularity from the image-level mean-index deviation reported earlier for the main UAV and Sentinel-2 experiments. Therefore, the two sets of values should not be directly compared as the same type of error measurement.
The results show that the proposed three-dimensional transform remains competitive with JPEG2000 under high compression. For WHU-Hi-HongHu at approximately 98% compression, the proposed method reduced the RD of NDVI, NDRE, and GNDVI from 4.21%, 30.11%, and 5.59% to 3.75%, 21.99%, and 4.19%, respectively. A similar trend was observed on WHU-Hi-LongKou, where the proposed method produced lower pixel-wise index deviations than JPEG2000 at both compression levels. These results suggest that incorporating the spectral dimension into the transform is beneficial for hyperspectral data, particularly when the compression ratio is high and inter-band redundancy becomes important.

3.5. Feasibility of Edge Deployment and 5G Transmission

To evaluate the implementation feasibility of the proposed framework, we deployed the algorithm on the embedded edge node and measured the data transmission performance using a controlled long-distance 5G communication setup. The test was conducted indoors at an approximate hundred-meter scale using a China Telecom SIM card. Signal quality was checked with the AT+CSQ command command, which returned ( 31 ,   99 ) ; the first value indicates a high received signal strength. The same network setting was used for all compression configurations. Table 7 compares the transmission payloads and required time windows of the raw remote sensing data with those of the edge-compressed data. Under an average tested uplink speed of 3.48 MB/s, directly transmitting the 1.73 GB raw image requires maintaining a stable 5G link for more than 8 min, or 509.1 s. In UAV-based field monitoring, such a long continuous high-throughput connection may be difficult to maintain because of signal fluctuation and platform movement. When the proposed sparse coding algorithm is executed on the edge device, the transmission payloads are reduced to 88.6 MB and 63.7 MB under compression ratios of 95.0% and 96.4%, respectively. The corresponding 5G transmission times decrease to 25.5 s and 18.3 s. These results indicate that edge-side compression can shorten the required transmission window and improve the practicality of agricultural remote sensing data delivery over mobile networks.

4. Discussion

The results show that N and τ mainly affect the method by changing the realized CR. For a fixed N, increasing τ generally retains more coefficients and therefore reduces the CR, while improving mPSNR and mSSIM. When different parameter combinations lead to similar CR values, the corresponding reconstruction metrics are also close, indicating that the final compression level is the dominant factor in the observed trade-off. In practical use, N can therefore be selected according to the desired control granularity, and τ can be adjusted to reach the target CR.
The tabulated results show that the image-level deviations of NDVI and GNDVI remain small at both representative compression ratios. NDRE shows a larger relative deviation, particularly at the higher compression ratio, which is expected because red-edge-based indices are more sensitive to small changes in the red-edge band. Even under this setting, the deviation remains close to 5%, indicating that the compression process largely preserves the mean radiometric relationships required for vegetation-index calculation.
The WHU-Hi experiment provides an additional perspective on the potential extension of the transform-domain strategy to hyperspectral imagery. In that experiment, the transform was extended to the spectral dimension only for the purpose of baseline comparison on public hyperspectral data. The results indicate that exploiting inter-band redundancy can be useful under high compression ratios, especially for pixel-wise vegetation-index preservation. However, this extension should be interpreted as a preliminary validation rather than a change to the main framework evaluated in this study, which remains focused on embedded compression and 5G transmission of agricultural multispectral imagery.
The present study also has several limitations. The experimental validation was conducted on a limited number of agricultural scenes, mainly including UAV imagery and one Sentinel-2 scene. Although these data allow the feasibility of the proposed edge-side compression framework to be evaluated, they are not sufficient to fully characterize its performance across different crop types, growth stages, geographic regions, illumination conditions, and acquisition platforms. In addition, the current evaluation focuses on representative compression settings and image-level quality metrics, whereas more comprehensive statistical analyses across multi-site and multi-temporal datasets remain necessary. These limitations do not affect the observed performance under the tested scenarios, but they indicate that broader validation is needed before drawing conclusions about general applicability.
Future research should extend the framework along several directions. One important direction is to evaluate its adaptability to additional spectral modalities, including hyperspectral and thermal infrared imagery. For hyperspectral data, directly applying the current unified truncation rule may not be sufficiently efficient because such data contain many narrow and highly correlated bands. Future extensions should therefore consider band-group truncation, spectral-spatial coefficient modeling, or three-dimensional sparse transforms to better exploit inter-band redundancy. Thermal infrared imagery, by contrast, has different noise characteristics and lower spatial texture richness, which may require modality-specific threshold calibration. Another direction is to conduct experiments under more diverse agricultural conditions, including different crop types, growth stages, geographic regions, illumination conditions, atmospheric conditions, and acquisition platforms. A larger multi-site and multi-temporal dataset would support more comprehensive statistical analyses of the variability in compression performance and agronomic-index preservation across field conditions. Finally, the compression module could be integrated with lightweight edge-AI models so that retained coefficients are selected not only according to reconstruction quality but also according to downstream agronomic tasks such as stress detection, canopy segmentation, or vegetation-index mapping.

5. Conclusions

This study presented an end-to-end embedded compression and transmission framework for high-resolution agricultural remote sensing imagery. The framework uses a content-aware adaptive sparse coding mechanism to truncate redundant high-frequency components according to the energy decay of orthogonal transform coefficients. When deployed on an edge computing node integrated with a 5G communication module, the proposed system reduced the transmission payloads and shortened the required transmission window under the tested UAV and Sentinel-2 scenarios. At a 95% compression ratio, the 5G transmission window was reduced by more than 95% compared with uncompressed transmission, which can help lower the exposure of field data transfer to link instability in dynamic environments. The reconstructed images retained stable PSNR and SSIM values and did not show the blocking artifacts typically associated with block-based transforms. The results also indicate that the proposed frequency-domain truncation strategy can preserve the radiometric relationships among multispectral bands, with the deviations of key agronomic indices remaining low and the NDRE deviation staying below 5% at a 97% compression ratio.

Author Contributions

Conceptualization, R.Z.; methodology, R.Z. and Z.H.; software, R.Z. and Z.H.; validation, R.Z., Z.H., T.Y. and R.M.; formal analysis, Z.H.; investigation, R.M.; resources, R.Z. and R.M.; data curation, R.M. and Z.H.; writing—original draft preparation, R.Z.; writing—review and editing, R.M., T.Y. and Z.H.; visualization, R.Z.; supervision, Z.H., T.Y. and R.M.; project administration, R.Z.; funding acquisition, R.Z. and R.M. All authors have read and agreed to the published version of the manuscript.

Funding

This work was supported by National Key Research and Development Program Project under Grant 2023YFD2301604, the National Natural Science Foundation of China (grant No. 42471362), the Key Research and Development Program of Heilongjiang Province (Grant No. 2023ZX01A24), the Key Research and Development Program of Heilongjiang Province (Grant No. JD2023GJ01-01), the Project of Laboratory of Advanced Agricultural Sciences, Heilongjiang Province (Grant No. ZY04JD05-010), and the Project of “Soil-Crop-Potassium Deficiency Stress” Multi-source Information Rapid Testing Technology and Interaction Model Research Technology (No. 2024230001000145).

Institutional Review Board Statement

Not applicable.

Informed Consent Statement

Not applicable.

Data Availability Statement

The data presented in this study are available on request from the corresponding author.

Acknowledgments

We would like to thank the editors and reviewers for their professional advice on this manuscript.

Conflicts of Interest

Author Rongqiang Zhao was employed by the Harbin Institute of Technology Research Institute for Artificial Intelligence Inc. The remaining authors declare that the research was conducted in the absence of any commercial or financial relationships that could be construed as a potential conflict of interest.

References

  1. Ndlovu, H.S.; Odindi, J.; Sibanda, M.; Mutanga, O. A systematic review on the application of UAV-based thermal remote sensing for assessing and monitoring crop water status in crop farming systems. Int. J. Remote Sens. 2024, 45, 4923–4960. [Google Scholar] [CrossRef]
  2. Wang, W.; Ma, C.; Wang, X.; Feng, J.; Dong, L.; Kang, J.; Jin, R.; Li, X. A soil moisture experiment for validating high-resolution satellite products and monitoring irrigation at agricultural field scale. Agric. Water Manag. 2024, 304, 109071. [Google Scholar] [CrossRef]
  3. Sun, M.; Zhao, R.; Hu, H.; Ding, S.; Li, D.; Jin, J.; Liu, J. Multichannel Olfactory Sensor Data Augmentation for Enhanced Nondestructive Rice Quality Detection. IEEE Trans. Instrum. Meas. 2026, 75, 2506216. [Google Scholar] [CrossRef]
  4. Zhang, S.; Wang, X.; Lin, H.; Dong, Y.; Qiang, Z. A review of the application of UAV multispectral remote sensing technology in precision agriculture. Smart Agric. Technol. 2025, 12, 101406. [Google Scholar] [CrossRef]
  5. Lu, W.; Zhang, X.; Komatsuzaki, M.; Okayama, T.; Yang, S.; Chen, N. Using Multispectral UAV Imagery for Rye Biomass Estimation and SEM-Based Attribution Analysis. Remote Sens. 2026, 18, 665. [Google Scholar] [CrossRef]
  6. Molitor, C.; Cohen, J.; Lewin, G.; Cognac, S.; Hadunka, P.; Proctor, J.; Carleton, T. Monitoring Maize Yield Variability over Space and Time with Unsupervised Satellite Imagery Features. Remote Sens. 2025, 17, 3641. [Google Scholar] [CrossRef]
  7. Zhao, P.; Meng, R.; Xu, B.; Wu, J.; Shen, Y.; Liu, J.; Huang, B.; Yin, T.; Ferreira, M.P.; Zhao, F. Improved Grass Species Mapping in High-Diversity Wetland by Combining UAV-Based Spectral, Textural, Geometric Measurements. Remote Sens. 2026, 18, 927. [Google Scholar] [CrossRef]
  8. Miller, T.; Mikiciuk, G.; Durlik, I.; Mikiciuk, M.; Łobodzińska, A.; Śnieg, M. The IoT and AI in Agriculture: The Time Is Now—A Systematic Review of Smart Sensing Technologies. Sensors 2025, 25, 3583. [Google Scholar] [CrossRef]
  9. Sadeghi-Tehran, P.; Virlet, N.; Hawkesford, M.J. A Neural Network Method for Classification of Sunlit and Shaded Components of Wheat Canopies in the Field Using High-Resolution Hyperspectral Imagery. Remote Sens. 2021, 13, 898. [Google Scholar] [CrossRef]
  10. Makondo, N.; Kobo, H.I.; Mathonsi, T.E.; Plessis, D.P.D. Implementing an Efficient Architecture for Latency Optimisation in Smart Farming. IEEE Access 2024, 12, 140502–140526. [Google Scholar] [CrossRef]
  11. Xiang, S.; Liang, Q. Remote sensing image compression with long-range convolution and improved non-local attention model. Signal Process. 2023, 209, 109005. [Google Scholar] [CrossRef]
  12. Lu, B.; Dao, P.D.; Liu, J.; He, Y.; Shang, J. Recent Advances of Hyperspectral Imaging Technology and Applications in Agriculture. Remote Sens. 2020, 12, 2659. [Google Scholar] [CrossRef]
  13. Penna, B.; Tillo, T.; Magli, E.; Olmo, G. Transform Coding Techniques for Lossy Hyperspectral Data Compression. IEEE Trans. Geosci. Remote Sens. 2007, 45, 1408–1421. [Google Scholar] [CrossRef]
  14. GB/T 20090.2-2013; Information Technology—Advanced Coding of Audio and Video—Part 2: Video. Standardization Administration of China: Beijing, China; Standards Press of China: Beijing, China, 2013.
  15. Taubman, D.S.; Marcellin, M.W.; Rabbani, M. JPEG2000: Image compression fundamentals, standards and practice. J. Electron. Imaging 2002, 11, 286–287. [Google Scholar] [CrossRef]
  16. Skodras, A.; Christopoulos, C.; Ebrahimi, T. The JPEG 2000 still image compression standard. IEEE Signal Process. Mag. 2002, 18, 36–58. [Google Scholar]
  17. Ji, X.; Yang, X.; Yue, Z.; Yang, H.; Zheng, B. Deep Learning Image Compression Method Based On Efficient Channel-Time Attention Module. Sci. Rep. 2025, 15, 15678. [Google Scholar] [CrossRef]
  18. Ye, Y.; Wang, C.; Sun, W.; Chen, Z. Map-Assisted remote-sensing image compression at extremely low bitrates. ISPRS J. Photogramm. Remote Sens. 2025, 223, 159–172. [Google Scholar] [CrossRef]
  19. Olshausen, B.A.; Field, D.J. Sparse coding with an overcomplete basis set: A strategy employed by V1? Vis. Res. 1997, 37, 3311–3325. [Google Scholar] [CrossRef]
  20. Aharon, M.; Elad, M.; Bruckstein, A. K-SVD: An algorithm for designing overcomplete dictionaries for sparse representation. IEEE Trans. Signal Process. 2006, 54, 4311–4322. [Google Scholar] [CrossRef]
  21. Chen, S.S.; Donoho, D.L.; Saunders, M.A. Atomic Decomposition by Basis Pursuit. SIAM J. Sci. Comput. 1998, 20, 33–61. [Google Scholar] [CrossRef]
  22. Aldhaheri, L.; Alshehhi, N.; Manzil, I.I.J.; Khalil, R.A.; Javaid, S.; Saeed, N.; Alouini, M.S. LoRa Communication for Agriculture 4.0: Opportunities, Challenges, and Future Directions. IEEE Internet Things J. 2025, 12, 1380–1407. [Google Scholar] [CrossRef]
  23. Farooq, M.S.; Javid, R.; Riaz, S.; Atal, Z. IoT Based Smart Greenhouse Framework and Control Strategies for Sustainable Agriculture. IEEE Access 2022, 10, 99394–99420. [Google Scholar] [CrossRef]
  24. Sethi, S.; Sharma, P. New Developments in the Implementation of IoT in Agriculture. SN Comput. Sci. 2023, 4, 503. [Google Scholar] [CrossRef]
  25. ur Rehman, W.; Koondhar, M.A.; Afridi, S.K.; Albasha, L.; Smaili, I.H.; Touti, E.; Aoudia, M.; Zahrouni, W.; Mahariq, I.; Ahmed, M. The role of 5G network in revolutionizing agriculture for sustainable development: A comprehensive review. Energy Nexus 2025, 17, 100368. [Google Scholar] [CrossRef]
  26. Makondo, N.; Kobo, H.I.; Mathonsi, T.E.; Mamushiane, L. A Review on Edge Computing in 5G-Enabled IoT for Agricultural Applications: Opportunities and Challenges. In Proceedings of the 2023 International Conference on Electrical, Computer and Energy Technologies (ICECET), Cape Town, South Africa, 16–17 November 2023; pp. 1–6. [Google Scholar] [CrossRef]
  27. Ahmed, N.; Natarajan, T.; Rao, K. Discrete Cosine Transform. IEEE Trans. Comput. 1974, C-23, 90–93. [Google Scholar] [CrossRef]
  28. Marcellin, M.; Gormish, M.; Bilgin, A.; Boliek, M. An overview of JPEG-2000. In Proceedings of the Proceedings DCC 2000. Data Compression Conference, Snowbird, UT, USA, 28–30 March 2000; pp. 523–541. [Google Scholar] [CrossRef]
  29. Ebadi, L.; Shafri, H.Z.; Mansor, S.B.; Ashurov, R. A review of applying second-generation wavelets for noise removal from remote sensing data. Environ. Earth Sci. 2013, 70, 2679–2690. [Google Scholar] [CrossRef]
  30. Gascon, F.; Bouzinac, C.; Thépaut, O.; Jung, M.; Francesconi, B.; Louis, J.; Lonjou, V.; Lafrance, B.; Massera, S.; Gaudel-Vacaresse, A.; et al. Copernicus Sentinel-2A Calibration and Products Validation Status. Remote Sens. 2017, 9, 584. [Google Scholar] [CrossRef]
  31. Ma, X. High-resolution image compression algorithms in remote sensing imaging. Displays 2023, 79, 102462. [Google Scholar] [CrossRef]
  32. Liu, Y.; Jin, H.; Yao, Y.W.; Chen, Y.; Zhao, Y.; Kong, L.; Li, R.; Liu, X.; Chen, G. Distributed On-Orbit Sparse Coding for Efficient Space Situational Awareness Image Transmission. In Proceedings of the IEEE INFOCOM 2025—IEEE Conference on Computer Communications, London, UK, 19–22 May 2025; pp. 1–10. [Google Scholar] [CrossRef]
  33. Wang, Z.; Bovik, A.; Sheikh, H.; Simoncelli, E. Image quality assessment: From error visibility to structural similarity. IEEE Trans. Image Process. 2004, 13, 600–612. [Google Scholar] [CrossRef] [PubMed]
  34. Huang, S.; Tang, L.; Hupy, J.P.; Wang, Y.; Shao, G. A commentary review on the use of normalized difference vegetation index (NDVI) in the era of popular remote sensing. J. For. Res. 2021, 32, 1–6. [Google Scholar] [CrossRef]
  35. Liu, Y.; Sun, L.; Liu, B.; Wu, Y.; Ma, J.; Zhang, W.; Wang, B.; Chen, Z. Estimation of Winter Wheat Yield Using Multiple Temporal Vegetation Indices Derived from UAV-Based Multispectral and Hyperspectral Imagery. Remote Sens. 2023, 15, 4800. [Google Scholar] [CrossRef]
  36. Vera-Esmeraldas, A.; Pizarro-Oteíza, S.; Labbé, M.; Rojo, F.; Salazar, F. UAV-Based Spectral and Thermal Indices in Precision Viticulture: A Review of NDVI, NDRE, SAVI, GNDVI, and CWSI. Agronomy 2025, 15, 2569. [Google Scholar] [CrossRef]
  37. Pan, D.; Li, C.; Yang, G.; Ren, P.; Ma, Y.; Chen, W.; Feng, H.; Chen, R.; Chen, X.; Li, H. Identification of the Initial Anthesis of Soybean Varieties Based on UAV Multispectral Time-Series Images. Remote Sens. 2023, 15, 5413. [Google Scholar] [CrossRef]
  38. Gitelson, A.A.; Kaufman, Y.J.; Merzlyak, M.N. Use of a green channel in remote sensing of global vegetation from EOS-MODIS. Remote Sens. Environ. 1996, 58, 289–298. [Google Scholar] [CrossRef]
  39. Ferro, M.V.; Catania, P.; Miccichè, D.; Pisciotta, A.; Vallone, M.; Orlando, S. Assessment of vineyard vigour and yield spatio-temporal variability based on UAV high resolution multispectral images. Biosyst. Eng. 2023, 231, 36–56. [Google Scholar] [CrossRef]
  40. Řeřicha, J.; Kohútek, M.; Vandírková, V.; Krofta, K.; Kumhála, F.; Kumhálová, J. Assessment of UAV Imageries for Estimating Growth Vitality, Yield and Quality of Hop (Humulus lupulus L.) Crops. Remote Sens. 2025, 17, 970. [Google Scholar] [CrossRef]
  41. Zhong, Y.; Hu, X.; Luo, C.; Wang, X.; Zhao, J.; Zhang, L. WHU-Hi: UAV-borne hyperspectral with high spatial resolution (H2) benchmark datasets and classifier for precise crop identification based on deep convolutional neural network with CRF. Remote Sens. Environ. 2020, 250, 112012. [Google Scholar] [CrossRef]
Figure 1. Overview of the proposed adaptive sparse coding and 5G transmission framework for agricultural remote sensing.
Remotesensing 18 01912 g001
Figure 2. Schematic of the content-aware adaptive truncation mechanism.
Remotesensing 18 01912 g002
Figure 3. Core hardware components of the system. (a) Forlinx RK3588 embedded edge computing board; (b) Quectel RM520N-CN 5G module with omnidirectional antennas.
Remotesensing 18 01912 g003
Figure 4. Hardware–software implementation workflow of the embedded compression and 5G transmission system. The multispectral image is compressed on the RK3588 development board under Ubuntu 22.04 and Python 3.9, transmitted through the USB 3.0-connected 5G communication module, and delivered to the remote server for reconstruction and subsequent evaluation.
Remotesensing 18 01912 g004
Figure 5. Impact of the number of segments (N) and dynamic threshold ( τ ) on the actual CR. Red crosses denote parameter combinations for which effective compression could not be achieved.
Remotesensing 18 01912 g005
Figure 6. Visual comparison of the original and reconstructed images at different compression ratios. The displayed images are true-color composites generated from the red, green, and blue bands using the same contrast stretching for all panels.
Remotesensing 18 01912 g006
Figure 7. Evolution of mPSNR under different combinations of segment numbers (N) and dynamic thresholds ( τ ).
Remotesensing 18 01912 g007
Figure 8. Evolution of mSSIM under different combinations of segment numbers (N) and dynamic thresholds ( τ ).
Remotesensing 18 01912 g008
Figure 9. MAE of NDVI retrieval under different combinations of segment numbers (N) and dynamic thresholds ( τ ).
Remotesensing 18 01912 g009
Figure 10. MAE of NDRE retrieval under different combinations of segment numbers (N) and dynamic thresholds ( τ ).
Remotesensing 18 01912 g010
Figure 11. MAE of GNDVI retrieval under different combinations of segment numbers (N) and dynamic thresholds ( τ ).
Remotesensing 18 01912 g011
Table 1. Key Technical Specifications of the Quectel RM520N-CN 5G Communication Module.
ParameterSpecification
ModelRM520N-CN
Weight≈8.7 g
Sleep Power Consumption4.7 mA
Idle Power Consumption (USB 3.0)60 mA
Operating Temperature Range 30   ° C to + 75   ° C
Extended Temperature Range 40   ° C to + 85   ° C
Supported Cellular Standards5G NR SA/NSA, LTE-FDD/TDD
5G SA Sub-6 GHz Data RateDL: 2.4 Gbps/UL: 900 Mbps
5G NSA Sub-6 GHz Data RateDL: 3.3 Gbps/UL: 550 Mbps
LTE Data RateDL: 1.4 Gbps/UL: 200 Mbps
Interfaces(U)SIM, USB 3.0/3.1, PCIe 3.0
Note: All data rates represent theoretical maximum values.
Table 2. Core Technical Specifications of the Forlinx FET3588-C Edge Computing Node.
ParameterSpecification
Processor ModelRockchip RK3588 (8 nm Process)
CPU ArchitectureOcta-core (4× Cortex-A76 @ 2.4GHz + 4× Cortex-A55 @ 1.8 GHz)
System Memory16 GB LPDDR4
Storage Capacity128 GB eMMC
Operating SystemLinux (Kernel 5.10)
Operating Temperature 0   ° C to + 80   ° C (Commercial)
Data InterfacesUSB 3.1 Gen1 (5 Gbps), PCIe 3.0
Note: The 16 GB memory configuration prevents out-of-memory errors during the processing of large remote sensing matrices.
Table 3. Spectral configuration of the Sentinel-2 bands used in this study.
BandRegionCenter
(nm)
Bandwidth
(nm)
Resolution
(m)
B2Blue4906510
B3Green5603510
B4Red6653010
B6Red edge7401520
B8Near-infrared84211510
Table 4. Sensitivity of the realized compression ratio and reconstruction quality to the τ and N. The mPSNR and mSSIM values are reported for the representative setting of N = 200 .
τ CR (%)
N = 100
CR (%)
N = 200
CR (%)
N = 500
mPSNR (dB)
N = 200
mSSIM
N = 200
0.6596.098.099.237.580.948
0.7594.097.098.838.370.960
0.8091.896.098.839.010.968
0.8589.195.098.339.540.973
0.9082.991.897.240.920.983
0.9277.389.696.341.630.986
0.9467.385.994.942.660.989
0.9557.182.893.643.400.990
0.9631.177.691.844.510.992
Table 5. Image-level deviation of agronomic indices at representative compression ratios.
CR LevelNDVI
Error
NDVI
RD (%)
NDRE
Error
NDRE
RD (%)
GNDVI
Error
GNDVI
RD (%)
≈95%0.000980.200.000580.610.000810.19
≈97%0.001500.310.000720.770.001170.28
Table 6. Baseline comparison on public UAV-borne hyperspectral data. The agronomic-index errors are calculated on a pixel-wise basis.
DatasetMethodParameterCR
(%)
mPSNR
(dB)
mSSIMSAM
(deg)
NDVI
MAE
NDVI
RD (%)
NDRE
MAE
NDRE
RD (%)
GNDVI
MAE
GNDVI
RD (%)
WHU-Hi-HongHu3D-DCT N = 200 ,   τ = 0.70 97.0037.880.91192.8460.01773.480.014820.400.01413.61
WHU-Hi-HongHuJPEG2000baseline97.1437.510.92562.7790.01763.460.017724.470.01674.28
WHU-Hi-HongHu3D-DCT N = 200 ,   τ = 0.60 98.0037.210.90163.0180.01913.750.015921.990.01634.19
WHU-Hi-HongHuJPEG2000baseline98.1835.640.89133.2370.02144.210.021830.110.02185.59
WHU-Hi-LongKou3D-DCT N = 200 ,   τ = 0.65 97.0042.960.95901.8670.01803.730.013814.050.01322.81
WHU-Hi-LongKouJPEG2000baseline97.1340.680.95731.7320.02545.250.015716.030.01803.85
WHU-Hi-LongKou3D-DCT N = 200 ,   τ = 0.60 98.0040.670.94172.3000.02635.450.017517.890.01894.03
WHU-Hi-LongKouJPEG2000baseline98.1738.270.93452.0340.03397.030.017818.130.02294.90
Table 7. Comparison of 5G Transmission Payloads and Required Time Windows.
Data SourcePayload (MB)Avg. Speed (MB/s)Time (s)
Raw Data1771.53.48509.1
Proposed (95.0%)88.63.4825.5
Proposed (96.4%)63.73.4818.3
Disclaimer/Publisher’s Note: The statements, opinions and data contained in all publications are solely those of the individual author(s) and contributor(s) and not of MDPI and/or the editor(s). MDPI and/or the editor(s) disclaim responsibility for any injury to people or property resulting from any ideas, methods, instructions or products referred to in the content.