


Highlights
What are the main findings?
- Carbon sequestration and net carbon budget differed significantly among biotopes, whereas carbon emissions did not.
- TDGVD was the strongest positive predictor of net carbon budget.
What are the implications of the main findings?
- Backpack LiDAR supported fine-scale biotope carbon assessment.
- It suggests that increasing three-dimensional green volume and optimizing plant community structure are more effective than simply reducing emissions for low-carbon urban park construction.
Abstract
Urban parks are often regarded as carbon sinks, yet their net carbon performance depends on the balance between vegetation carbon uptake and maintenance-related emissions, as well as the accurate representation of within-park spatial heterogeneity. This study used backpack LiDAR, field vegetation surveys, and maintenance inventories to quantify annual carbon sequestration, maintenance emissions, and net carbon budget in 44 plots covering nine biotope types across 16 parks in central Xianyang, China. A four-level biotope classification incorporating canopy openness, ground cover, tree composition, and vertical stratification was applied to link LiDAR-derived three-dimensional structure with ecological-unit-level carbon accounting. Carbon sequestration and net carbon budget differed significantly among biotopes, whereas maintenance emissions did not. Closed broadleaved single-layer forest showed the highest carbon sequestration density (0.772 kg C m−2), while hard-surfaced partly closed broadleaved single-layer forest showed the lowest value (0.132 kg C m−2). Closed woody biotopes functioned as strong carbon sinks, partly closed biotopes as weak sinks, and the partly open short-grass biotope was the only carbon source. Three-dimensional green volume density was the strongest positive predictor of net carbon budget (β = 0.417, p = 0.032), followed by stem density (β = 0.276, p = 0.048), whereas irrigation-related emissions showed a significant negative coefficient (β = −0.276, p = 0.021). Carbon sequestration explained more variation in net carbon budget than maintenance emissions (adjusted R2 = 0.409 vs. 0.134). These findings suggest that backpack LiDAR can support fine-scale identification of priority carbon-sink units in urban parks and that low-carbon park management should prioritize three-dimensional woody vegetation structure while reducing high-input irrigation where feasible.
1. Introduction
Cities are major sources of greenhouse gas emissions and key arenas for climate change mitigation [1,2]. Urban green infrastructure has consequently attracted increasing scholarly and policy attention, given its multifunctional capacity to support carbon sequestration, biodiversity conservation, thermal comfort, and human well-being [3,4]. Parks are often assumed to function as favorable urban carbon sinks because they usually contain relatively complex vegetation and relatively stable management boundaries [5]. However, whether a park actually performs as a sink depends on the balance between vegetation carbon uptake and maintenance-related emissions rather than on its nominal green-space label alone.
Remote sensing has expanded the ability to characterize urban vegetation, but many carbon-oriented studies still rely on park-scale inventories [6], broad land-cover categories, or two-dimensional greening indicators. At the same time, previous studies have shown that urban green spaces can accumulate substantial carbon stocks and sequestration capacity [7,8], especially where woody vegetation is abundant and plant-community structure is well developed [9]. The problem is that whole-park or coarse-type accounting can obscure strong internal heterogeneity among closed woodland, partly closed woodland, open lawns, and hard-surfaced green patches within the same park [10,11].
This scale problem matters because different community units can differ markedly in canopy closure, substrate condition, woody dominance [11,12,13], and maintenance demand [14,15], and these differences can translate directly into divergent net carbon outcomes [16]. A further weakness in the literature is that the net carbon budget remains less frequently assessed than carbon storage or sequestration alone. Routine irrigation, fertilization, pesticide application, pruning, and machinery use can materially offset vegetation gains, particularly in lawn-dominated, high-input, or impervious surface-associated park spaces [17,18]. Urban green spaces should therefore not be presumed to function as net carbon sinks a priori; instead, sink–source status needs to be evaluated under real maintenance regimes and within the broader urban carbon context.
To address these research gaps, this study develops a systematic evaluation framework that bridges spatial classification with quantitative carbon accounting. First, a four-level biotope classification system was established, integrating canopy openness, ground cover, tree composition, and vertical stratification into ecologically interpretable units. Second, high-resolution data were collected from 44 representative plots across nine biotope types in 16 urban parks in Xianyang, China, using backpack LiDAR, field vegetation surveys, and maintenance inventories. Third, a multi-pathway carbon budget analysis was conducted to quantify the balance between vegetation sequestration and maintenance-related emissions, and LiDAR-derived structural metrics were further used to examine the micro-scale determinants of carbon efficiency.
By integrating this methodological workflow, the study seeks to answer the following research questions:
- (1)
- Do carbon sequestration, maintenance emissions, and net carbon budget differ significantly among biotope types within urban parks?
- (2)
- Which LiDAR-derived structural metrics and management variables are most strongly associated with net carbon budget at the plot scale?
- (3)
- When both sequestration and emission pathways are considered, which pathway should be prioritized in low-carbon park optimization?
By answering these questions, this research aims to clarify whether urban park green spaces are inherently net carbon sinks, identify the specific structural and management conditions that differentiate strong sinks from weak sinks or sources, and provide a finer-grained basis for low-carbon park retrofitting and biotope-scale planning interventions [14,19].
2. Materials and Methods
2.1. Study Area
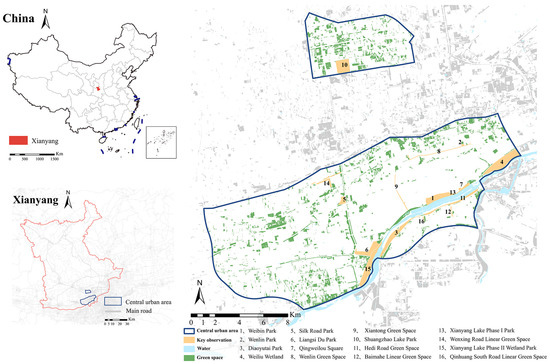
This study was conducted in park green spaces located within the central urban area of Xianyang, China (Figure 1), situated in the central Guanzhong Plain. The region is characterized by a warm-temperate continental monsoon climate with abundant solar radiation and thermal resources, but precipitation is strongly seasonal, being concentrated in summer and autumn and relatively scarce in spring and winter. This hydroclimatic context is relevant because water limitation and maintenance demand may affect both vegetation growth and the carbon footprint of management.
Figure 1.
Location map of the study area in central Xianyang, China.
As the most intensively urbanized and publicly used part of Xianyang, the central urban area exhibits the highest density and greatest diversity of park types in the city. Supported by ecological corridors associated with the Wei and Feng Rivers and a comprehensive network of thematic and community parks, this area provides a representative setting for examining how intra-park vegetation structure and maintenance regimes interact to shape the net carbon budget.
2.2. Data Collection and Processing
2.2.1. Construction of the Biotope Classification System for Park Green Spaces
Building on the biotope mapping framework proposed by Qiu et al. (2010) [20], this study developed a four-level classification system tailored to park biotopes based on vegetation horizontal structure, surface cover, tree composition, and vertical stratification (Table 1). The classification was designed to be ecologically interpretable during field surveys while also being compatible with differentiation from LiDAR-derived structural attributes. At the first level, plots were categorized into open, partly open, partly closed, and closed green spaces according to their tree-canopy coverage. The second level distinguished ground cover-dominated plots from hard surface-dominated plots. The third level separated coniferous, broadleaved, and mixed conifer–broadleaved woody communities. Specifically, for open and partly open green spaces, herb- and shrub-dominated units were further distinguished by mowing or pruning regimes; meanwhile, for partly closed and closed green spaces, the fourth level classifies communities as either single-layer or multi-layer stands. This framework allowed plant-community structure, substrate condition, and management context to be incorporated into a common biotope unit for subsequent remote sensing-supported carbon accounting.
Table 1.
Four-level biotope classification system used to link the LiDAR-derived vegetation structure with biotope carbon accounting in urban park green spaces.
2.2.2. Field Survey and Plot Selection
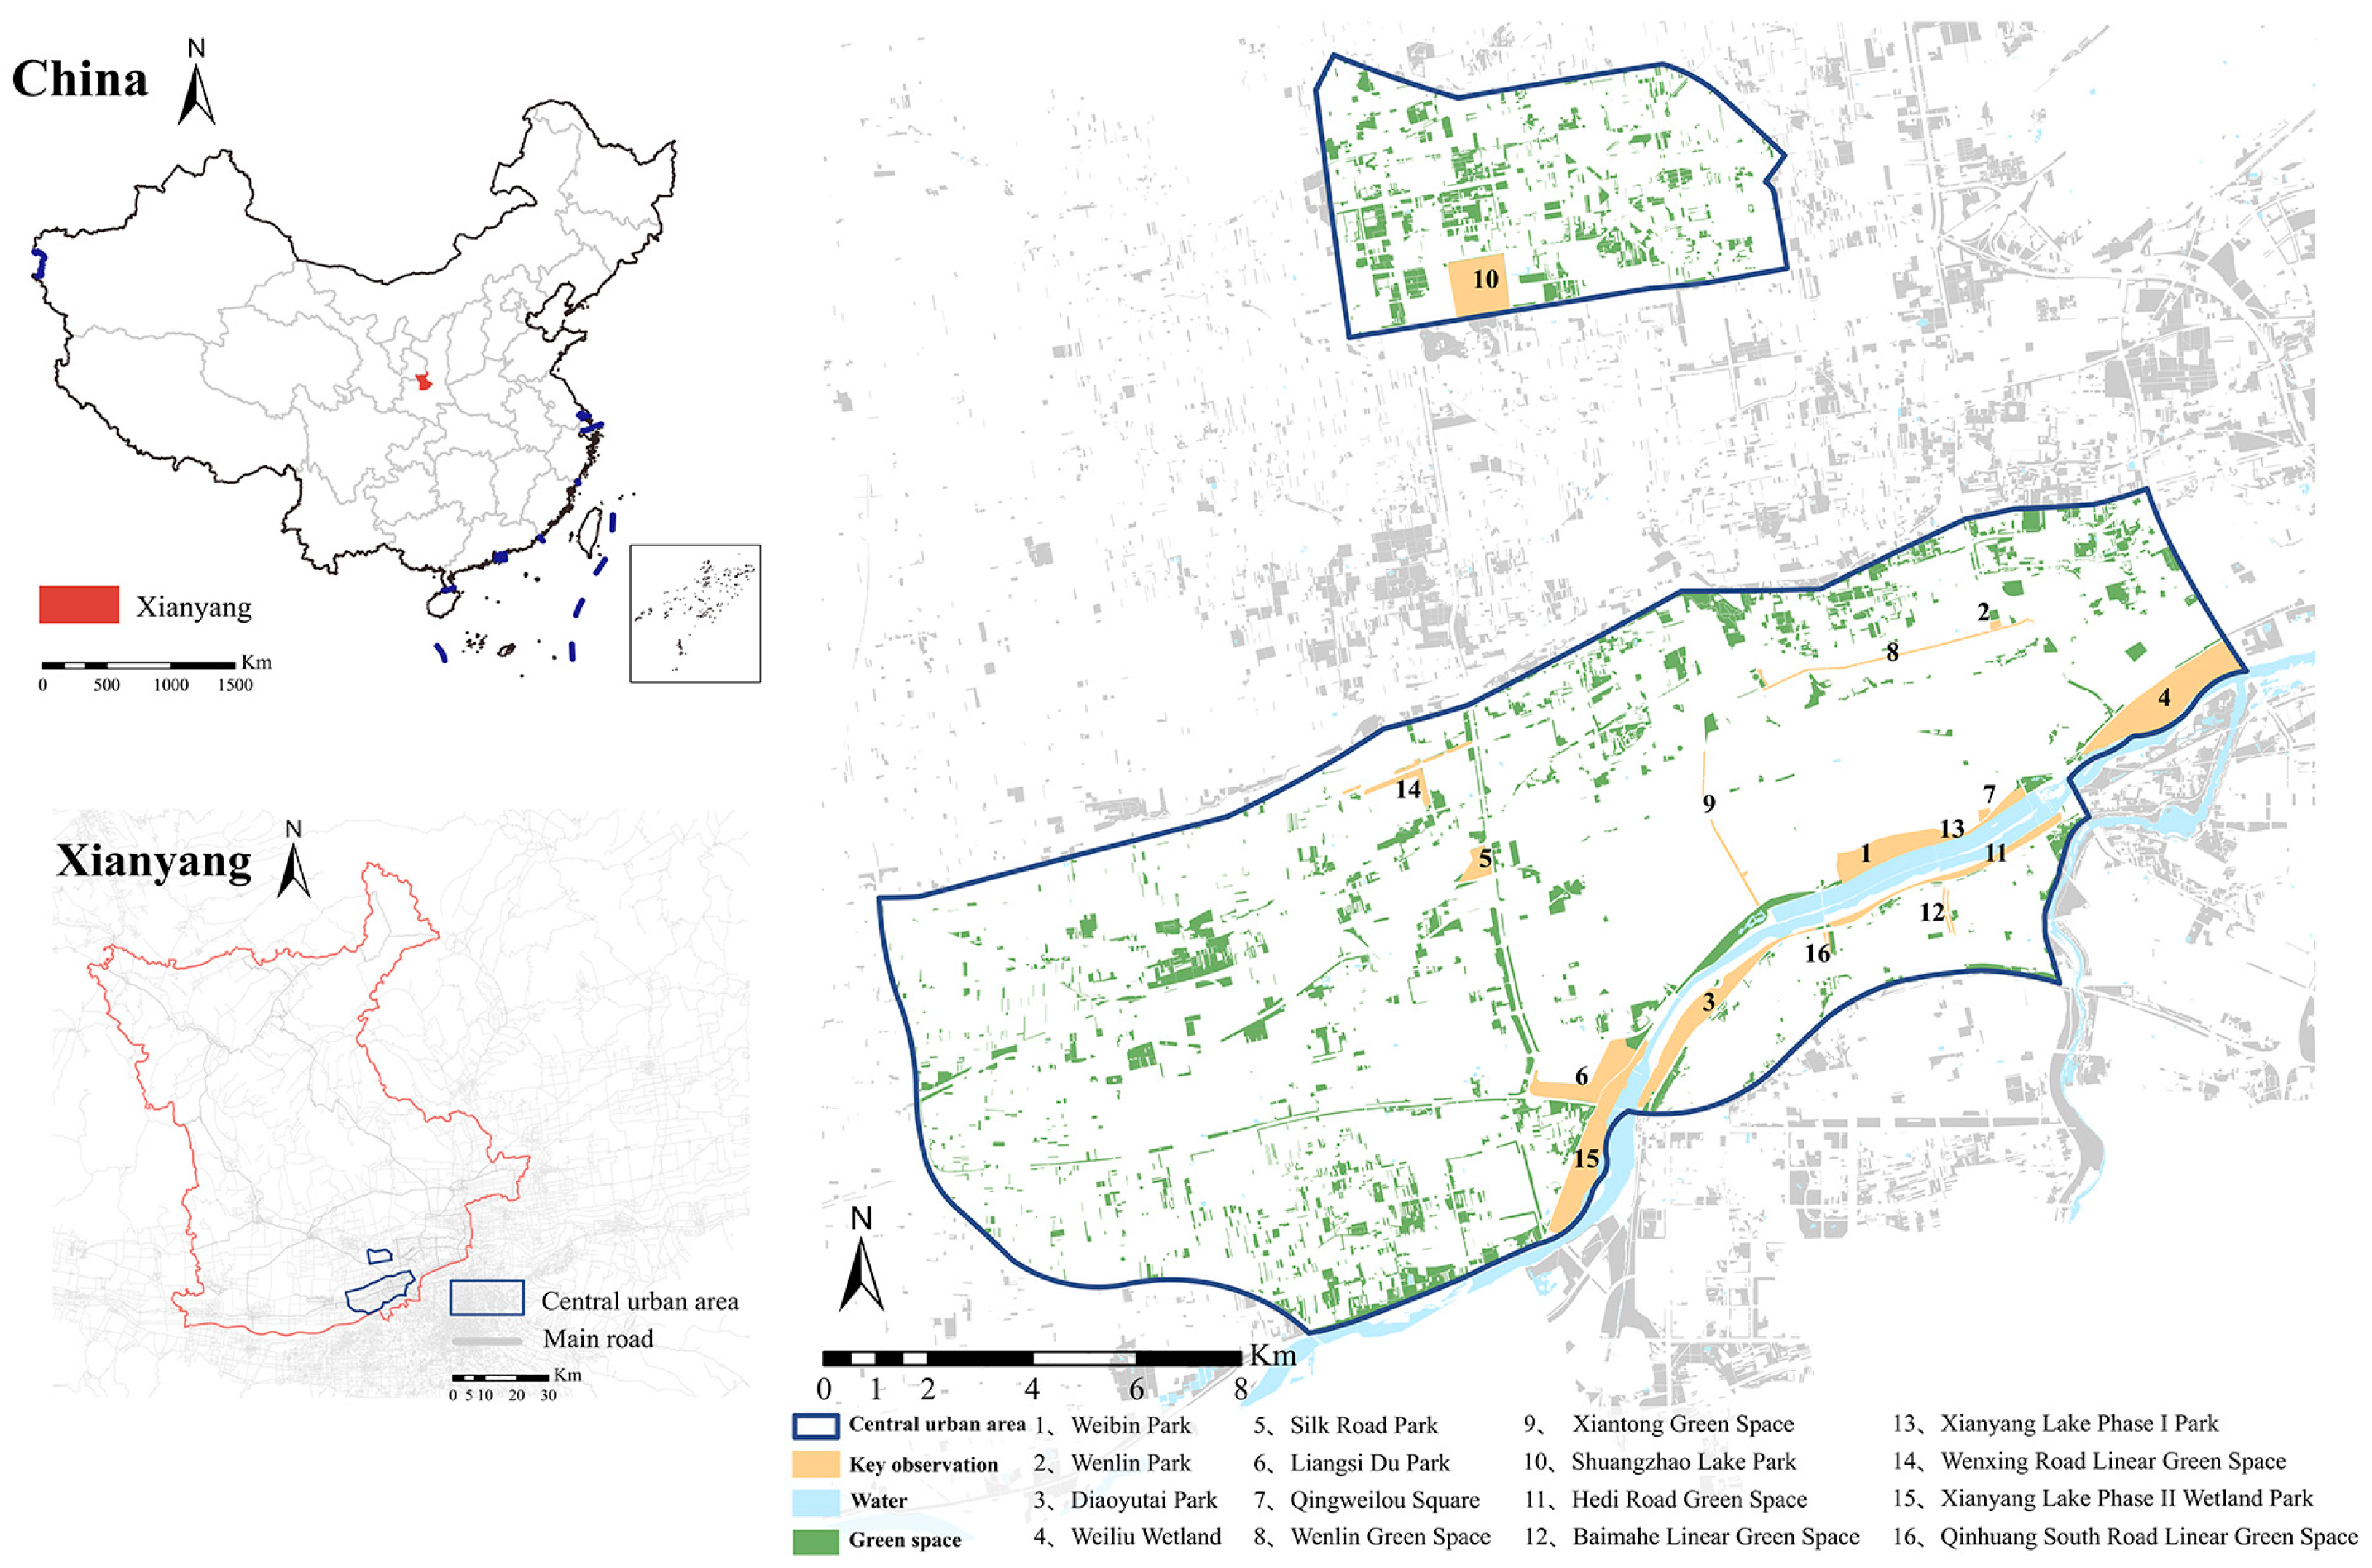
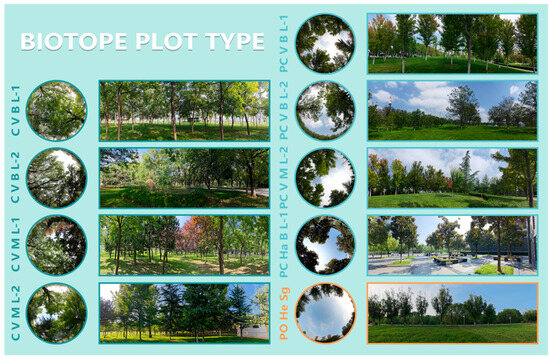
From May to July 2024, 55 park green spaces in central Xianyang were surveyed on the basis of planning documents, current urban development conditions, and field reconnaissance. After considering park age, park type, spatial distribution, and plot accessibility, 16 parks (Table S1) were selected for detailed analysis. Biotopes were identified through remote-sensing image interpretation and field verification. Thirteen biotope types were initially recognized, but some occupied very small areas or had insufficient sample size for robust statistical comparison. Nine representative biotope types were therefore retained (Figure 2, circular photographs show upward canopy views, and rectangular photographs show corresponding horizontal landscape views. These images illustrate differences in canopy openness, vegetation composition, spatial structure, and ground-surface characteristics among biotope types), and 44 valid plots were established (Table S2). The standard plot size was 900 m2 (30 m × 30 m), and where site boundaries prevented a regular square layout, plot shape was adjusted while maintaining equal area to preserve comparability among biotopes.
Figure 2.
Representative biotope plot types included in the analysis. (C = closed green space, PC = partly closed green space, PO = partly open green space; V = vegetated ground cover, Ha = hard surface ground cover, He = herbaceous; B = broad-leaved, M = mixed coniferous and broad-leaved (mixed C&B); L-1 = single-layer structure, L-2 = multi-layer structure; Sg = short/mown grass).
2.2.3. Plot Data Collection
Point-cloud data were collected for each plot using the LiBackpack backpack-mounted LiDAR system (Beijing Digital Green Earth Technology Co., Ltd., Beijing, China) between July and September 2024 and again between July and August 2025. The LiBackpack system is a portable mobile mapping platform integrating LiDAR, an inertial measurement unit, GNSS, and simultaneous localization and mapping technology, enabling high-resolution three-dimensional data acquisition in complex outdoor environments. The LiDAR unit operated at a single-return scanning frequency of 640,000 points s−1, with a 16-line repeated scanning mode, a maximum scanning range of 120 m, and a ranging accuracy of ±1 cm. The system used GNSS-based real-time trajectory positioning, with a trajectory positioning accuracy of 1 cm + 1 ppm. Because complete exported reports for plot-level average point density and trajectory-closure error were not available for all scans, point-cloud quality was controlled through registration consistency checks, visual inspection of point-cloud completeness, removal of obvious non-vegetation artifacts, and comparison with field observations. This limitation is explicitly acknowledged in the uncertainty analysis. The repeated terrestrial remote-sensing surveys enabled annualized carbon sequestration to be estimated from structural change between the two observation periods. At the same time, plot-level vegetation information, including species composition, individual abundance, canopy cover, and growth condition, was recorded in the field. Information on park use and maintenance level was also collected to define the boundary of maintenance-related carbon emissions. Through manager interviews, questionnaires, and field verification, data were obtained on the frequency and intensity of irrigation, fertilization, pesticide application, pruning, and machinery use, thereby providing the inputs required for emission accounting.
2.2.4. Point-Cloud Processing and Extraction of LiDAR-Derived Structural Metrics
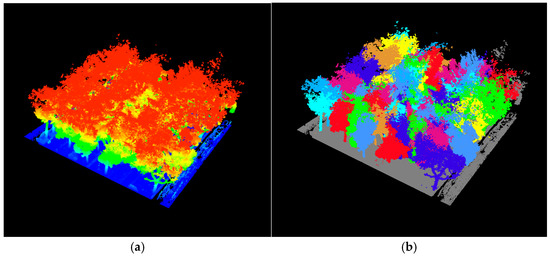
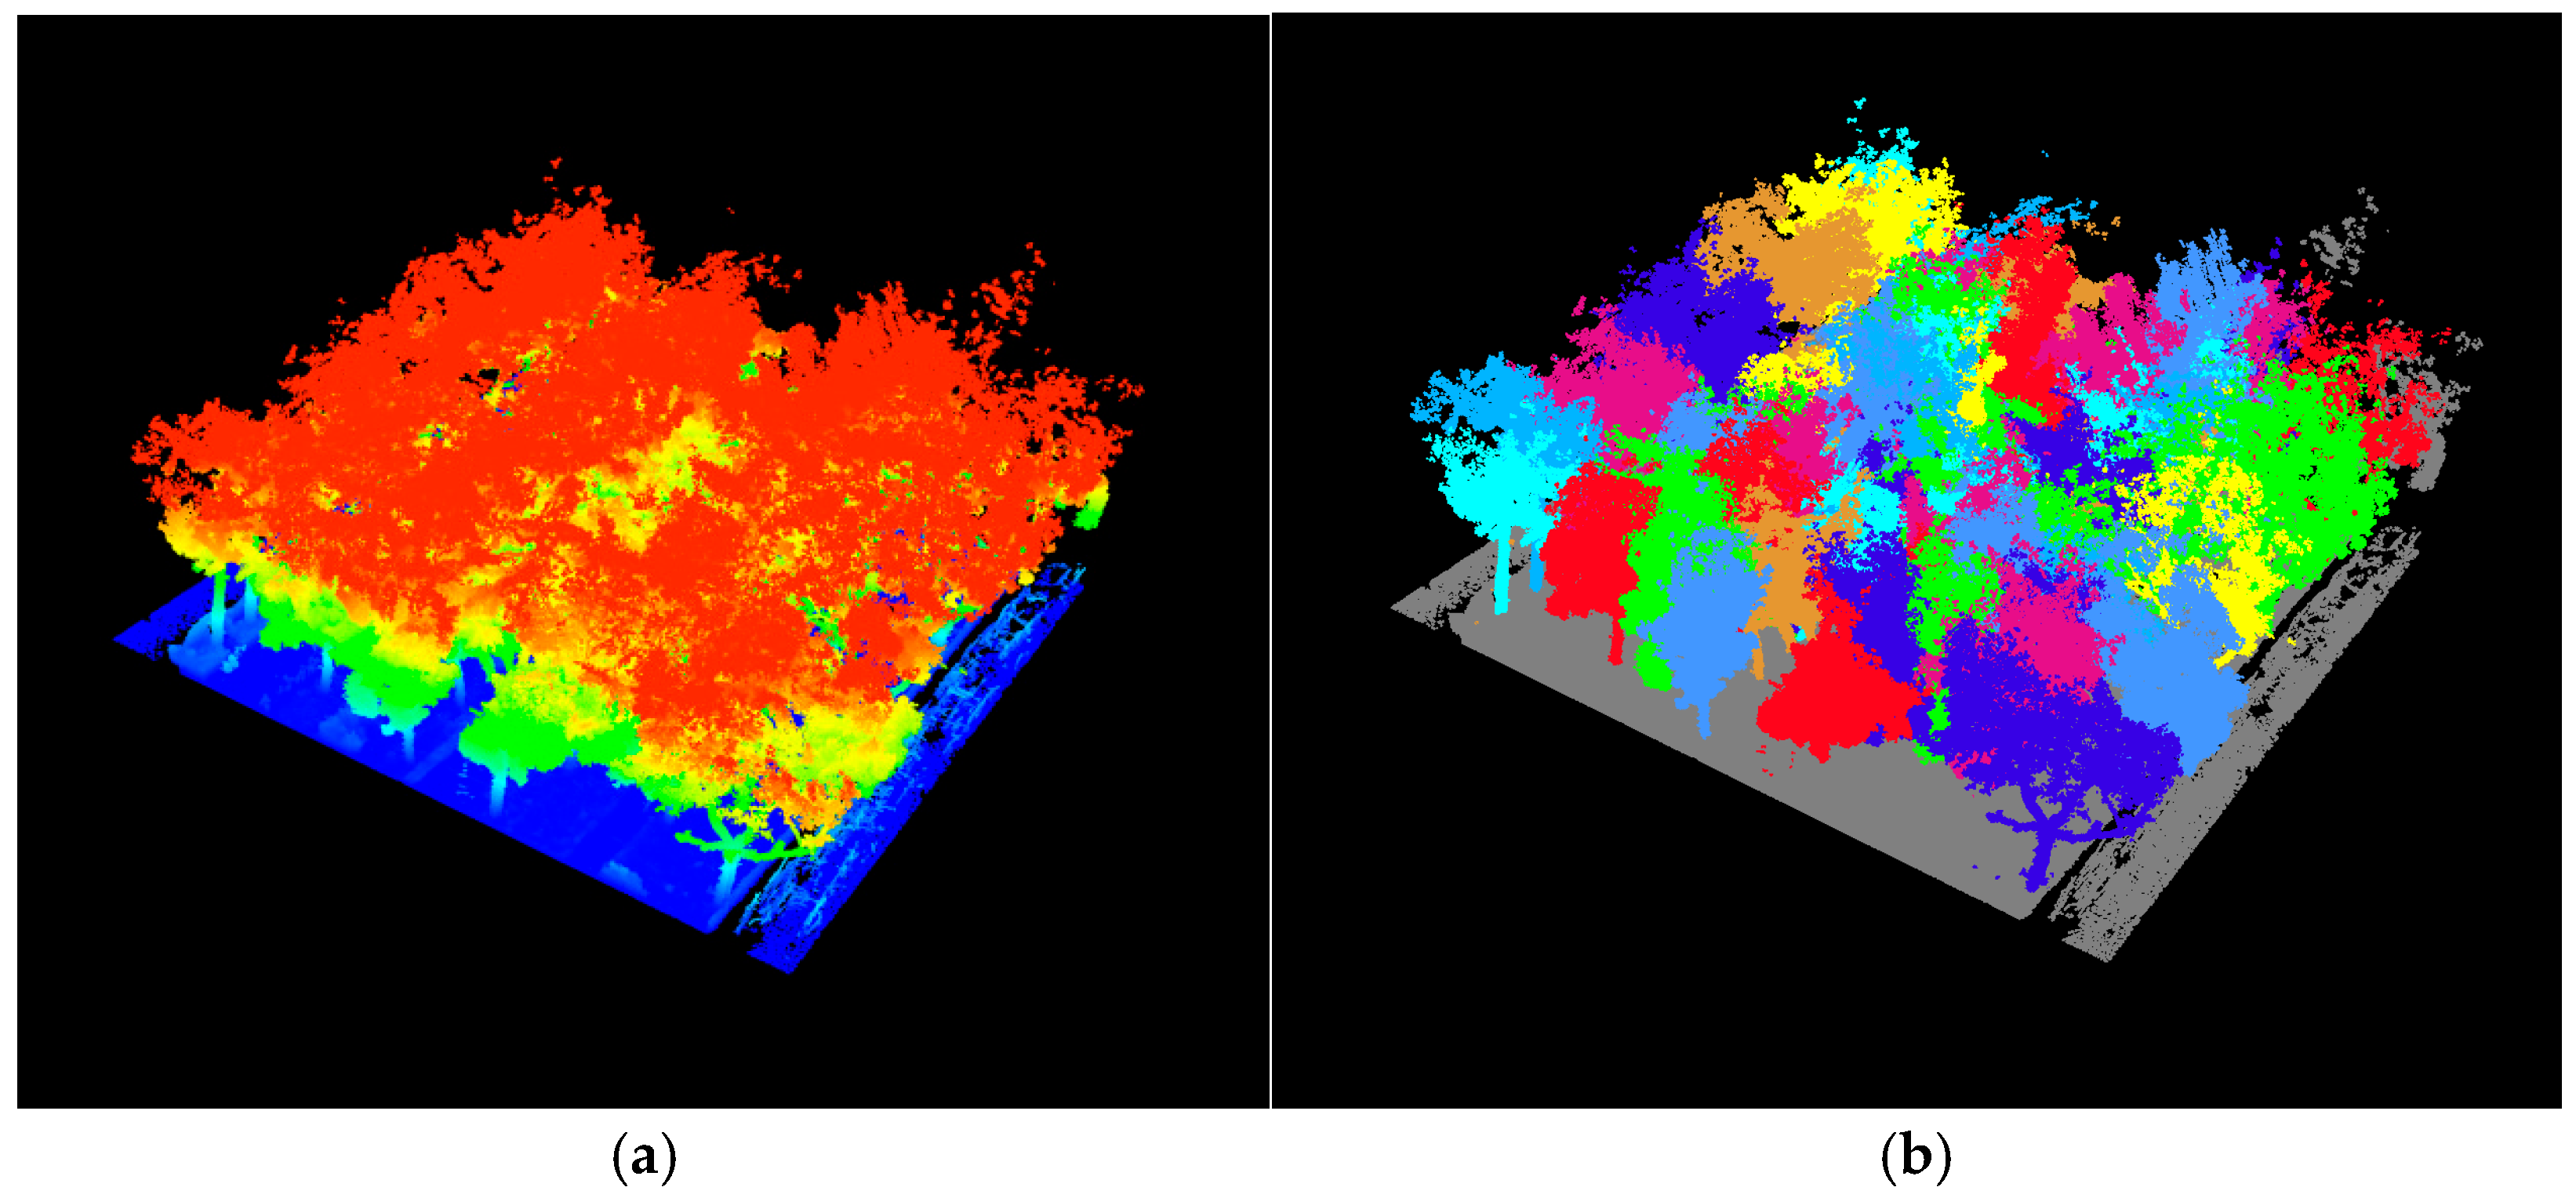
Raw LiBackpack point clouds were first processed using LiFuser-BP (Beijing Digital Green Earth Technology Co., Ltd., Beijing, China) for trajectory solution, point-cloud registration, and generation of plot-level three-dimensional point clouds. The processed point clouds were then imported into LiDAR360 8.0 for resampling, denoising, plot clipping, ground-point filtering, height normalization, vegetation classification, and individual-tree segmentation (Figure 3, Supplementary S1). Resampling was used to adjust point density and improve processing efficiency, while denoising was conducted to remove isolated points and invalid noise caused by environmental interference.
Figure 3.
Point-cloud outputs from a representative sample plot in this study. (a) Raw point-cloud data acquired by backpack LiDAR and (b) point-cloud data after individual-tree segmentation.
Because backpack LiDAR surveys in public parks may be affected by moving people, vehicles, and other non-vegetation objects, all scans were conducted during the low-disturbance periods between 22:00 and 03:00 Beijing time to minimize transient interference. Obvious non-vegetation features captured in the scans were excluded as far as possible during preprocessing. The point clouds were clipped according to the boundary and size of each standard plot. Ground points were then identified using the ground filtering function in LiDAR360, and height normalization was conducted by setting the filtered ground points as the local ground reference. This procedure reduced the influence of terrain variation and allowed tree height and crown-related metrics to be calculated relative to the local ground surface.
After normalization, non-ground points were classified into vegetation categories, including trees, shrubs, hedges, and ground-cover vegetation, with reference to field observations. Individual trees were separated using the seed-point-based individual-tree segmentation algorithm in the TLS forestry module of LiDAR360. For each segmented tree, DBH was extracted from stem points around breast height; tree height was calculated as the vertical distance between the normalized ground surface and the highest point of the tree; crown width was estimated from the horizontal extent of crown points; crown projection area was derived from the two-dimensional crown projection onto the horizontal plane; and crown volume was estimated from the three-dimensional distribution of crown points within the segmented crown envelope. For ground-cover vegetation and hedge-like shrubs, vegetation area and volume were measured using the corresponding software tools. These point-cloud-derived variables were combined with field observations to construct three-dimensional green volume density (TDGVD), stem density, and growth-related structural indicators for each plot. In this way, the backpack LiDAR data provided plot-consistent estimates of vegetation volume and vertical occupation for the subsequent net-carbon analyses rather than serving only as a descriptive visualization tool.
Three-dimensional green volume density (TDGVD) was calculated as TDGVD = Vveg/Aplot, where Vveg is the total LiDAR-derived vegetation volume of trees, shrubs, hedges, and ground-cover vegetation within each plot, and Aplot is the plot area. TDGVD was expressed as m3 m−2 and used to represent the three-dimensional occupation of vegetation per unit ground area. This metric was used as a continuous structural indicator to complement the categorical biotope classification.
2.3. Data Calculation
2.3.1. Carbon Sequestration Estimation
Carbon sequestration was estimated separately for the tree, shrub, and herb layers. For trees and shrubs, carbon storage was calculated using the biomass method. Species-specific allometric equations were used whenever available; when such equations were unavailable, equations from the same genus or family, or general biomass models, were used in that order as substitutes, with the closest taxonomic and structural match selected from the literature (Table S3 [21,22,23,24,25,26,27,28,29] and Table S4 [24,30]). Carbon storage for the woody layers was then converted using a carbon fraction coefficient, and annual sequestration was expressed as the difference in carbon storage between the two survey periods.
Because the herb layer has a short life cycle and is strongly affected by seasonal fluctuation and mowing, the change in herb carbon storage between the two survey dates was not treated as a reliable estimate of annual sequestration. Instead, annual herb-layer sequestration was estimated from the literature-based carbon sequestration rates per unit area combined with herbaceous cover. Carbon sequestration of the tree, shrub, and herb layers was then summed to obtain total annual plant-community carbon sequestration for each plot. The equations used are given below:
where CS is carbon storage of the tree or shrub layer (kg); Bi is the biomass of each individual plant (kg); CF is the carbon fraction coefficient; ASG is carbon sequestration of the tree or shrub layer during the study period (kg); CSt1 and CSt2 are carbon storage at the first and second survey periods, respectively (kg); ASGh is herb-layer carbon sequestration (kg); A is herbaceous cover area (m2); c is the average annual carbon sequestration per unit area (kg·m−2·a−1); ASGtotal is total plant-community carbon sequestration (kg); and ASGt, ASGs, and ASGh represent sequestration in the tree, shrub, and herb layers, respectively (kg).
2.3.2. Carbon Emission Estimation
Guided by the Standard for Maintenance of Landscape and Greening (CJJ/T 287—2018) [31] and field-survey observations, the carbon emission boundary for park maintenance included irrigation, fertilization, pesticide application, pruning, and associated machinery use. A carbon emission factor approach was applied, combining activity data from the field survey with factor values derived from the IPCC Guidelines for National Greenhouse Gas Inventories and related studies [32,33,34] (Supplementary S2, Table S5). This framework was intended to capture differences in routine maintenance emissions among plant communities while remaining operationally feasible for plot-scale comparison. The equations used are as follows:
where CED is annual maintenance-related carbon emission; Cice, Cpce, Cfce, and Ctce denote annual emissions from irrigation, pest control, fertilizer application, and pruning machinery use, respectively; Qi-w is water use of the i-th plant community and Ew is the emission factor for water use; Qi-d is fuel use of the i-th plant community and Ed is the emission factor for diesel or gasoline; Qi-p is pesticide consumption of the i-th plant community and Ep is the pesticide emission factor; Qi-f is fertilizer consumption of the i-th plant community and Ef is the fertilizer emission factor; i denotes the i-th plant community; and n is the total number of communities.
2.3.3. Net Carbon Budget Calculation
The net carbon budget was defined as the difference between total annual carbon sequestration and total annual maintenance-related carbon emissions for each biotope. A positive value indicates that the plant community functions as a carbon sink, whereas a negative value indicates a carbon source. The equation is shown below:
where CBD is the net carbon budget of the urban green-space plant community during the maintenance cycle, ACS is the total annual carbon sequestration of each plant community, and CED is the total annual carbon emission during the maintenance stage.
2.4. Statistical Analysis
All statistical analyses were conducted in SPSS 26.0. Kruskal–Wallis H tests were used to compare carbon sequestration, carbon emissions, and net carbon budget among biotope types because several variables did not fully meet the assumptions of normality and homogeneity of variance. When a Kruskal–Wallis test was significant, post hoc pairwise comparisons were conducted using Mann–Whitney U tests with a Holm–Bonferroni adjustment for multiple comparisons. Given that several variables did not fully meet the assumptions of normal distribution and linear relationships required for Pearson correlation analysis, Spearman rank correlation analysis was employed to examine the relationships between LiDAR-derived structural variables, plant-growth indicators, maintenance variables, and net carbon budget. Finally, multiple linear regression was used to identify key drivers, and separate carbon sequestration and carbon emission pathway models were fitted to compare their explanatory power for variation in net carbon budget. Collinearity was assessed using tolerance and variance inflation factor (VIF) values. Statistical graphs were drawn using Origin 2024 based on the statistical results obtained from SPSS 26.0. For correlation analysis visualizations, Spearman correlation coefficients and significance levels were calculated in SPSS 26.0, and the heatmap was subsequently visualized and refined using R 4.5.3.
3. Results
3.1. Carbon Sequestration, Maintenance Emissions, and Net Carbon Budget Across Biotope Types
3.1.1. Per-Unit-Area Carbon Indicators and Carbon Source–Sink Identification
Carbon sequestration per unit area varied markedly among the nine biotope types, revealing a clear structural gradient captured by the biotope-based LiDAR framework (Table 2). Closed broadleaved single-layer forest (CVBL-1) showed the highest sequestration (0.7719 kg C m−2), followed closely by closed mixed single-layer forest (CVML-1; 0.7685 kg C m−2), closed broadleaved multi-layer forest (CVBL-2; 0.7229 kg C m−2), and closed mixed multi-layer forest (CVML-2; 0.5794 kg C m−2). In contrast, sequestration remained below 0.30 kg C m−2 in the partly closed, partly open, and hard-surfaced units, including PCVBL-1 (0.2746 kg C m−2), PCVML-2 (0.2547 kg C m−2), PCVBL-2 (0.2440 kg C m−2), POHeSg (0.1394 kg C m−2), and PCHaBL-1 (0.1324 kg C m−2). This pattern indicates that canopy closure and woody three-dimensionality were the dominant background controls on sequestration differences across park biotopes.
Table 2.
Net carbon budget per unit area and carbon source–sink classification across biotopes.
Maintenance-related carbon emissions per unit area varied much less among biotopes than sequestration did. The highest value occurred in the partly closed mixed multi-layer forest (PCVML-2; 0.2262 kg C m−2), followed by several closed woody units, whereas the hard-surfaced partly closed broadleaved single-layer forest (PCHaBL-1; 0.0899 kg C m−2) had the lowest value. When sequestration and emissions were combined, all closed biotopes functioned as strong carbon sinks, all partly closed biotopes functioned as weak carbon sinks, and the partly open short-grass biotope (POHeSg) emerged as the only carbon source.
3.1.2. Differences in Carbon Budget Indicators Among Biotopes
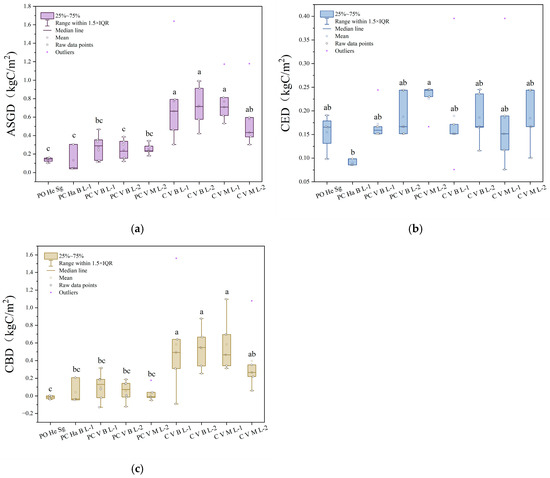
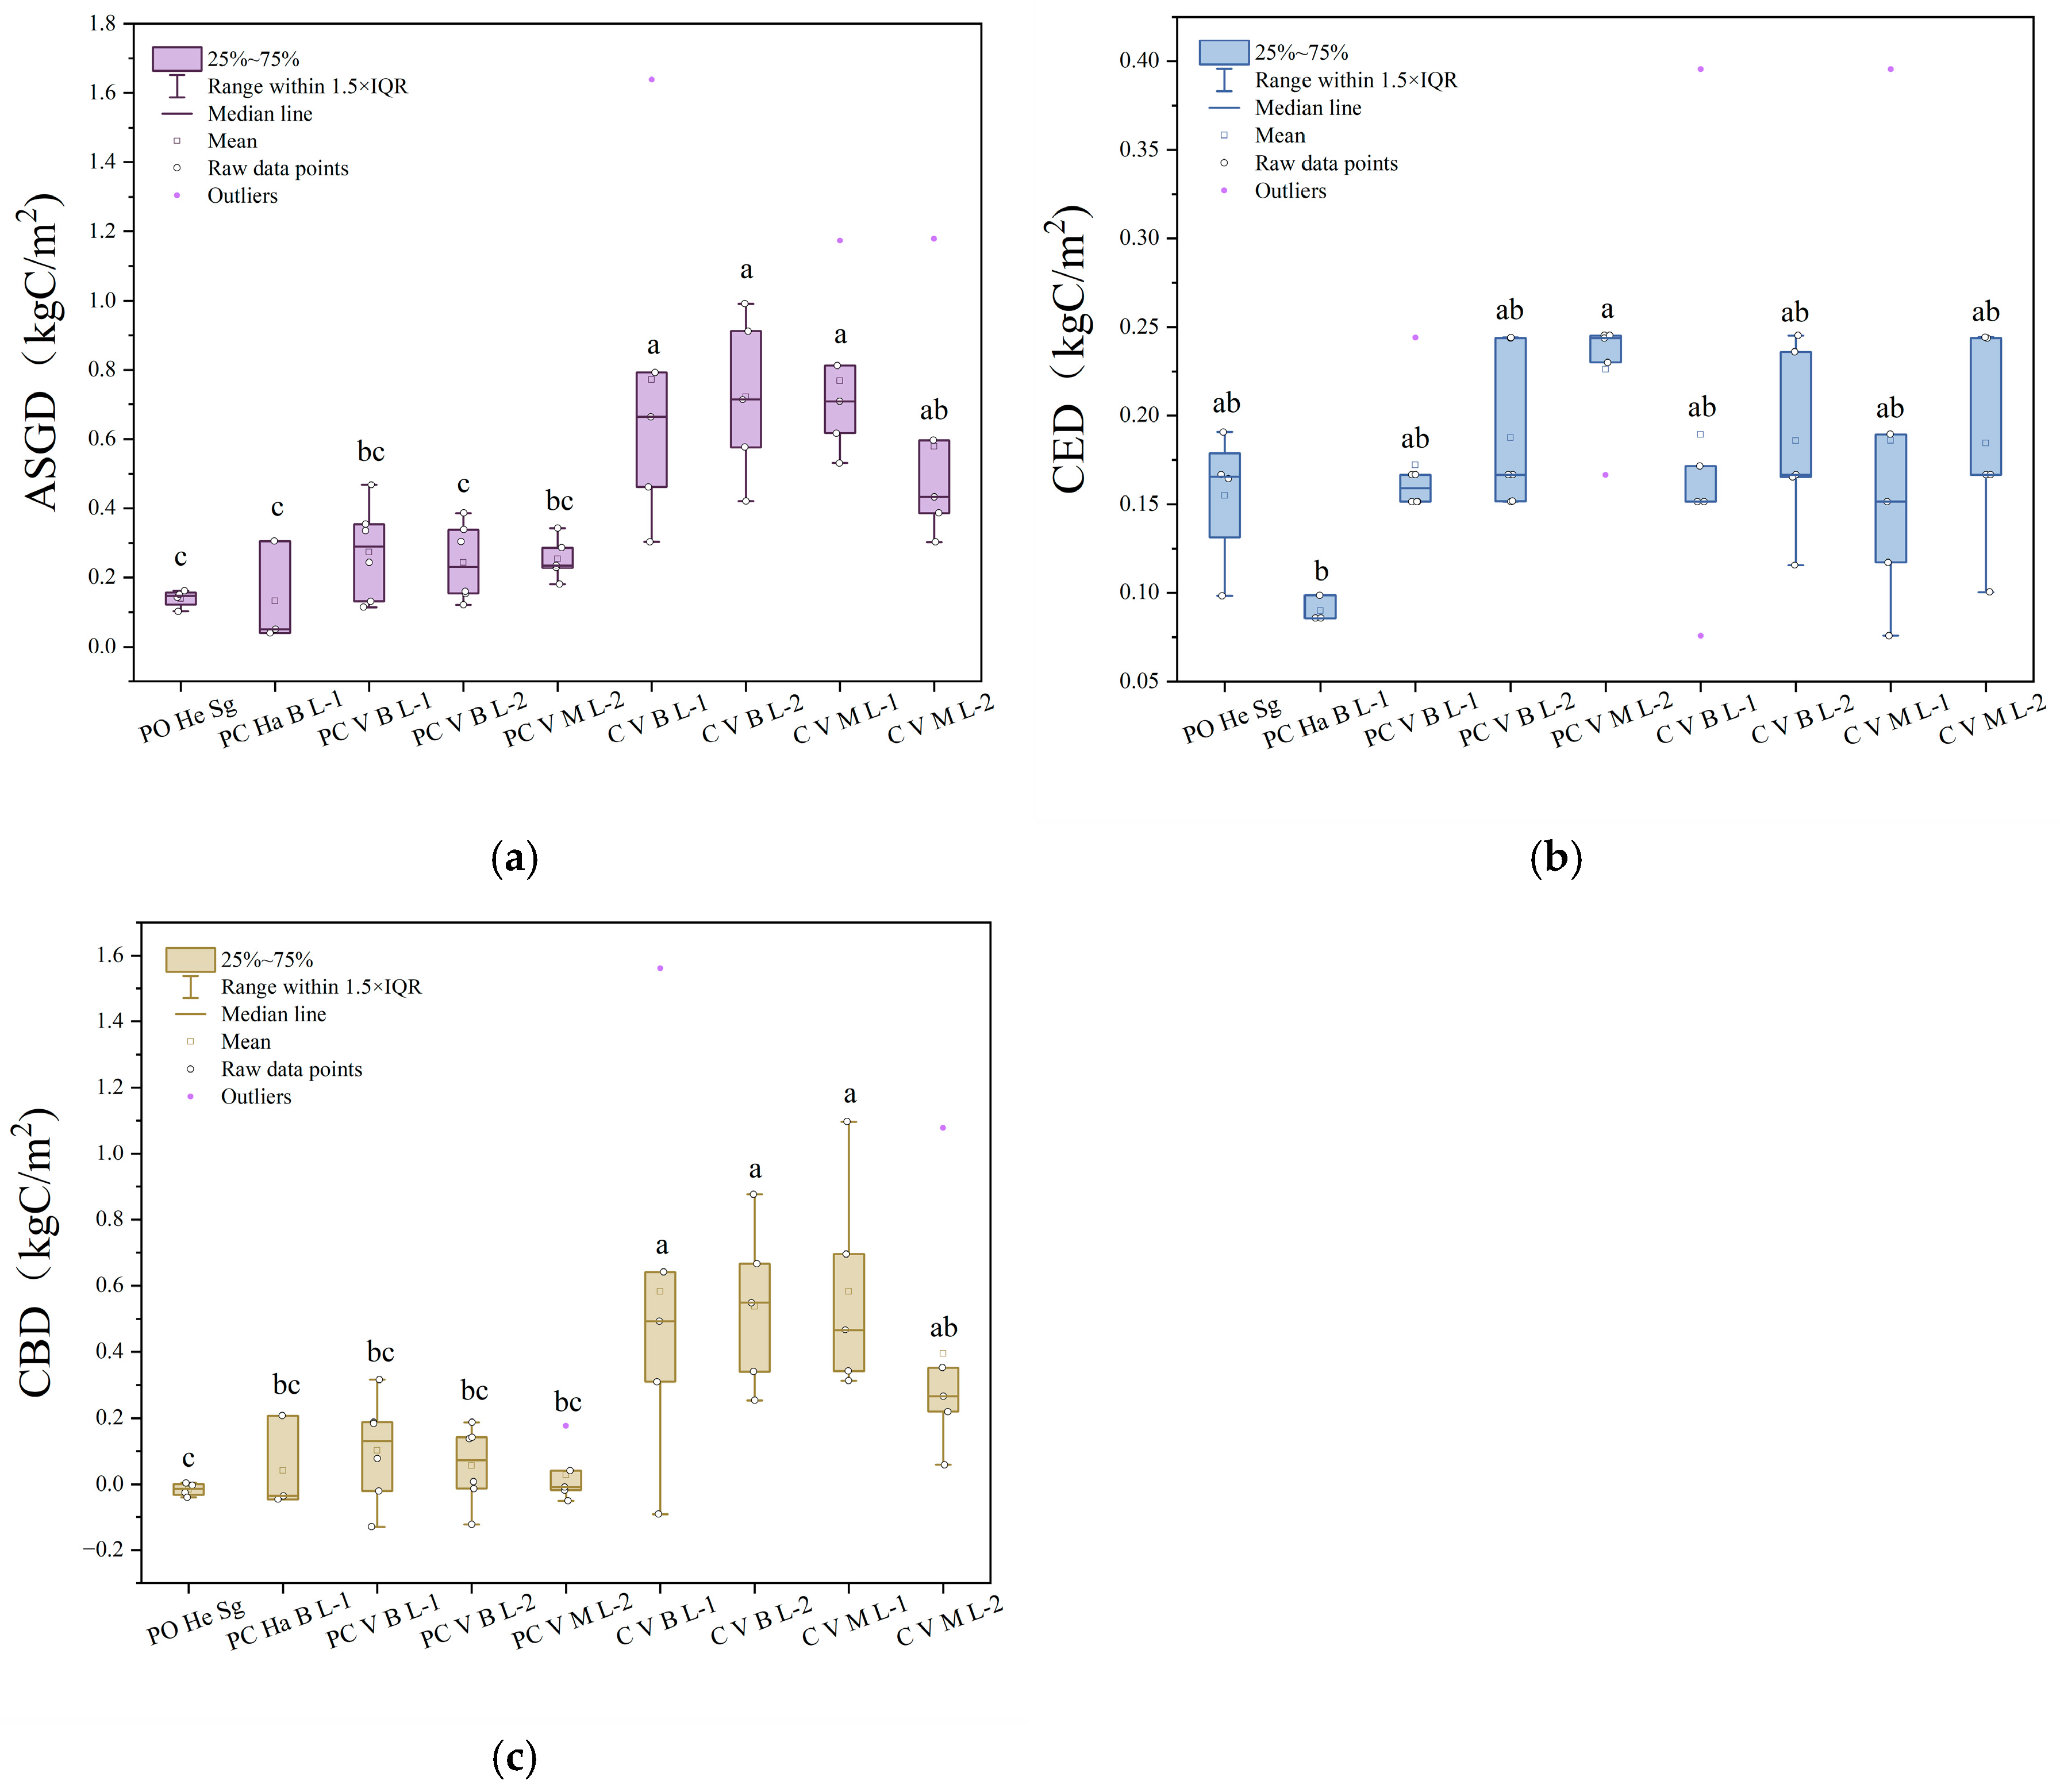
The Kruskal–Wallis test showed that carbon sequestration density differed significantly among biotopes (H = 29.919, p < 0.001; Figure 4a),significant difference groups were indicated by letters (a, ab, b, bc, c). Treatment groups labeled with different letters differed significantly, whereas those sharing the same letter did not differ significantly. Closed woody biotopes consistently occupied the upper end of the gradient, whereas the partly open short-grass biotope remained at the lower end.
Figure 4.
Differences in carbon-budget indicators among biotopes: (a) carbon sequestration density, (b) maintenance-emission density, and (c) net carbon budget density.
By contrast, differences in maintenance-emission density among biotopes were not statistically significant (p = 0.168; Figure 4b). This suggests that, under the management regime of the parks studied, routine maintenance emissions were comparatively constrained by broadly similar operational practices rather than by vegetation structure alone.
Net carbon budget density also differed significantly among biotopes (H = 25.164, p = 0.001; Figure 4c). Closed biotopes displayed the highest net carbon budgets, whereas the partly open short-grass biotope showed a negative value (−0.02 kg C m−2) and functioned as a carbon source. Overall, the biotope framework separated structurally distinct park units with contrasting carbon performance, and the observed differentiation in net carbon budget was more consistent with variation in sequestration than with variation in maintenance emissions.
3.2. Factors Influencing Plant Community Carbon Budget
3.2.1. Correlation Analysis
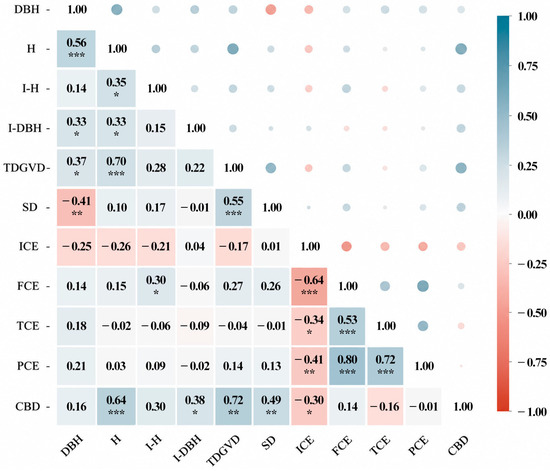
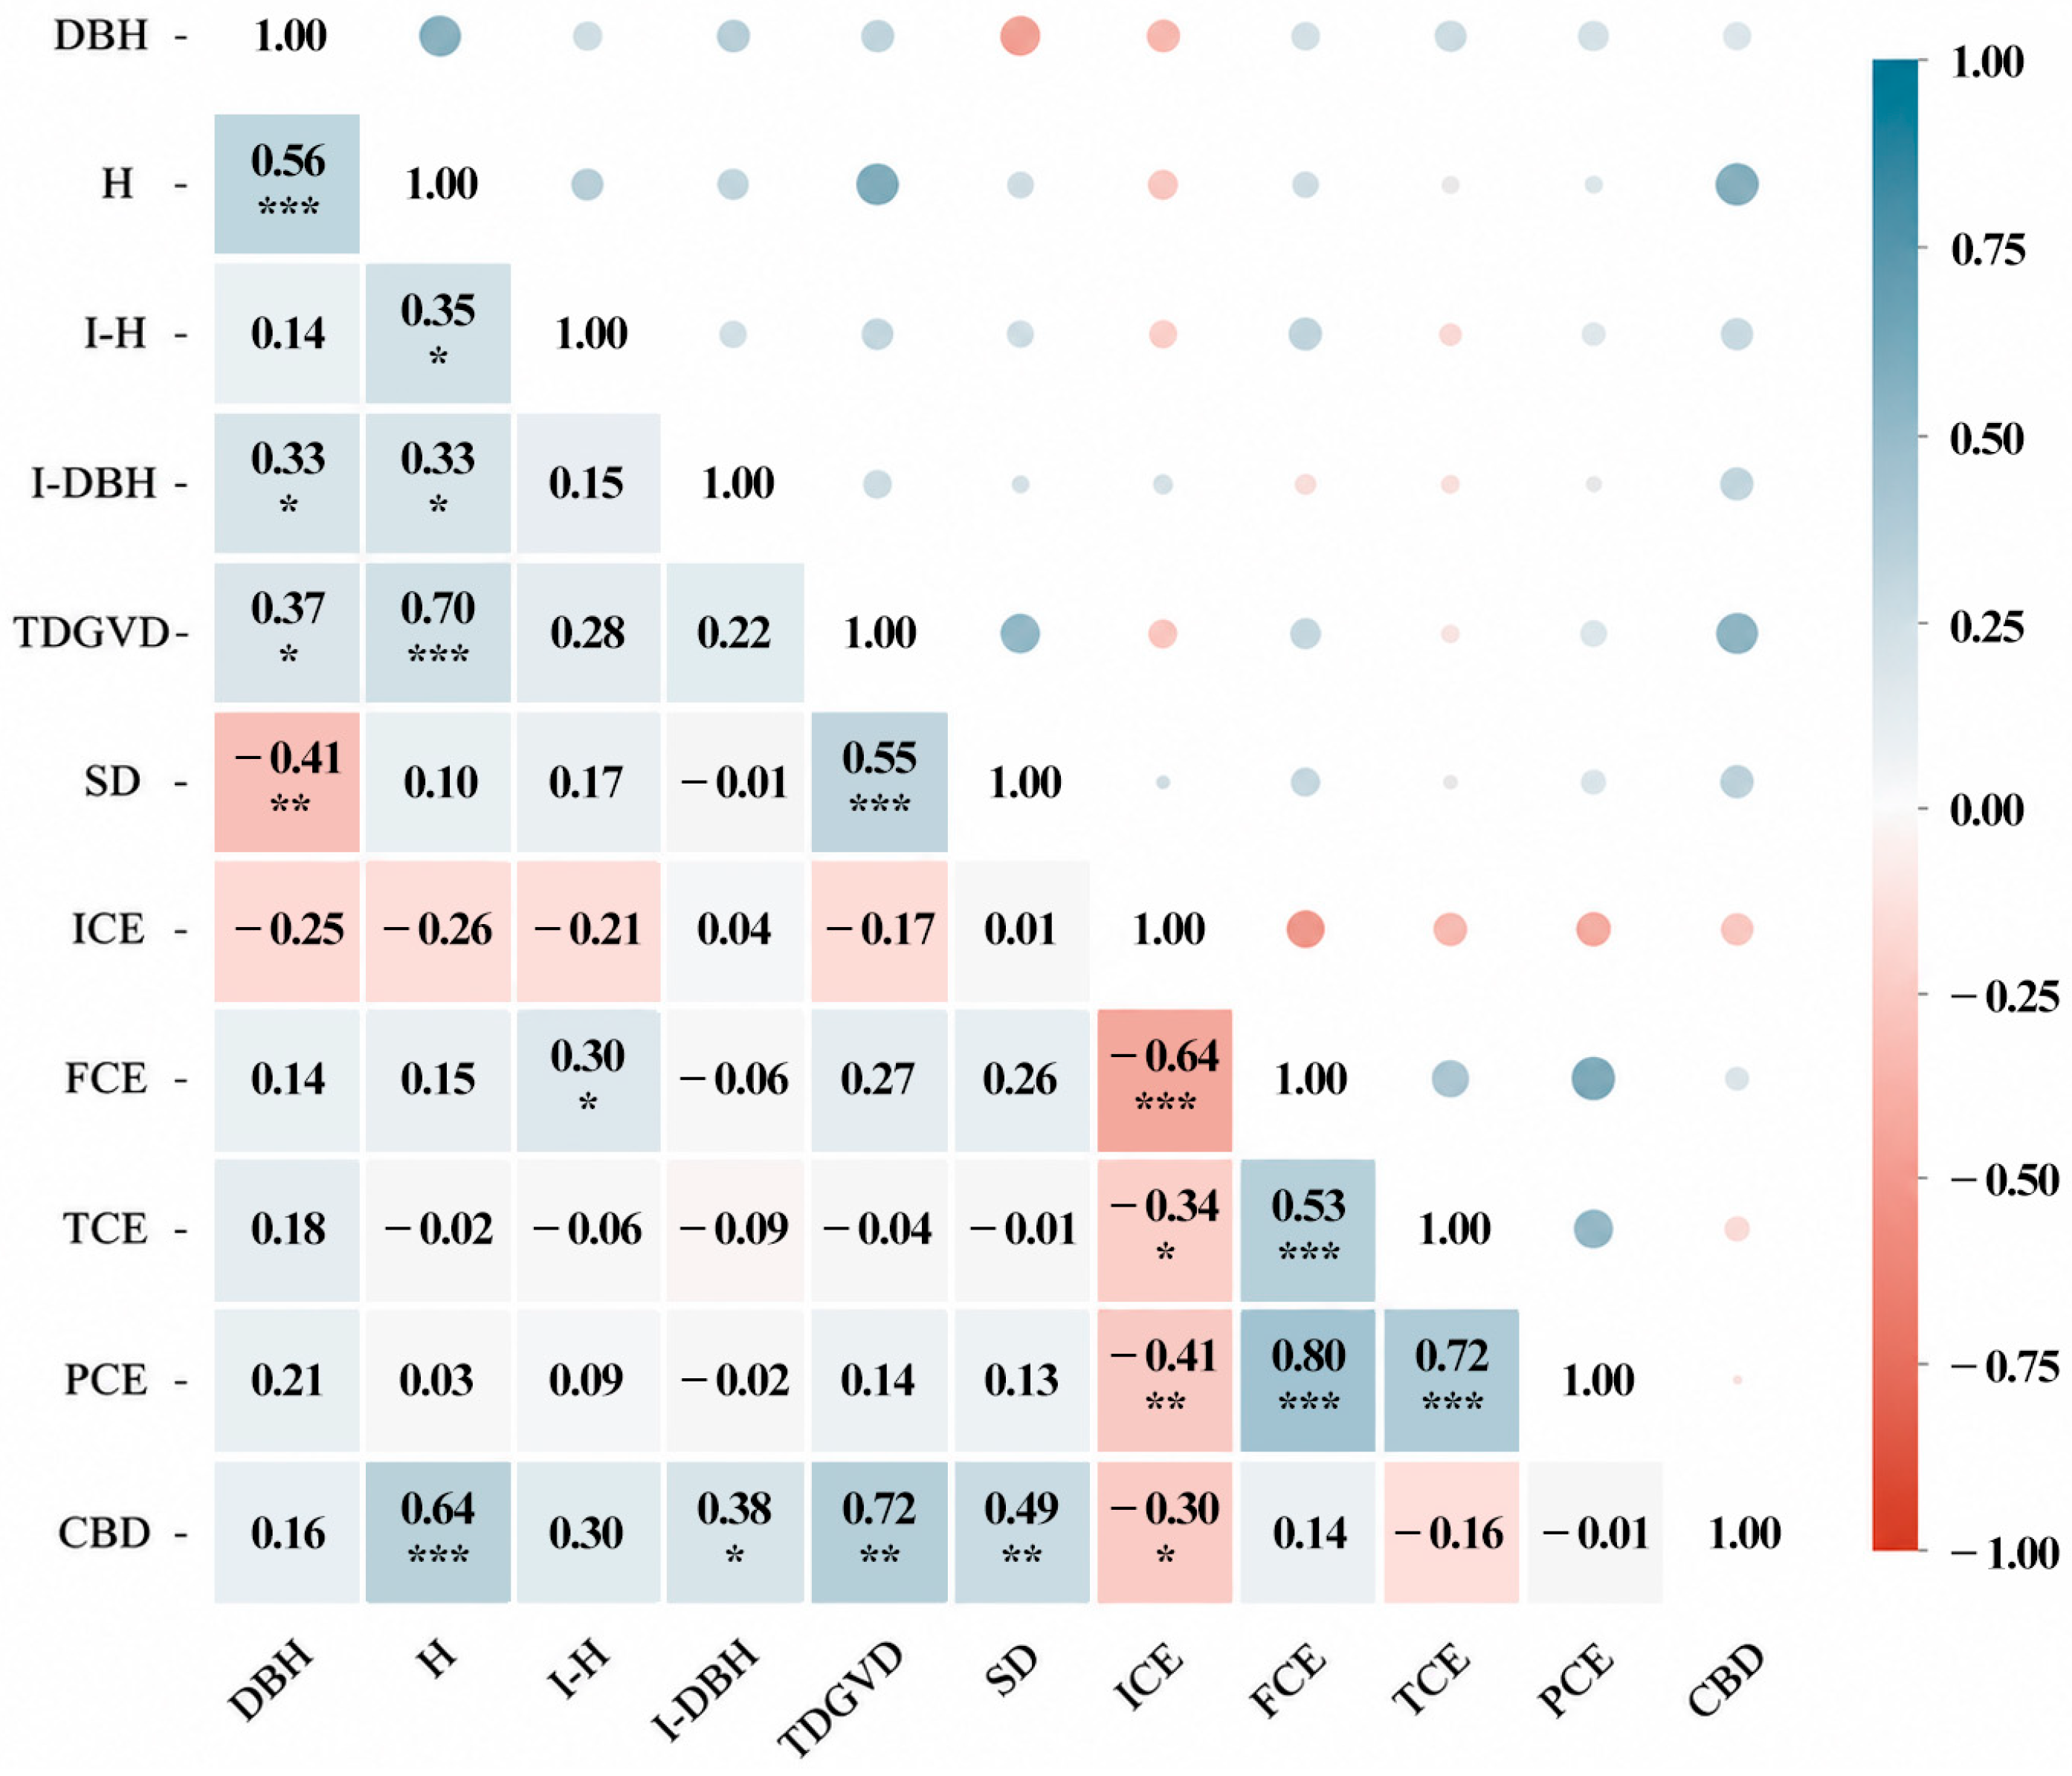
Given that several variables did not fully meet the assumptions of normal distribution and linear relationships required for Pearson correlation analysis, Spearman’s rank correlation analysis was employed. This non-parametric method is more suitable for assessing monotonic relationships among structural, growth, maintenance, and carbon-budget variables and is less sensitive to outliers. Spearman’s correlation analysis showed that the net carbon budget (CBD) was significantly related to several structural, growth, and management variables (Figure 5), with the strongest associations occurring for variables that described three-dimensional vegetation organization.
Figure 5.
Spearman correlation heatmap showing relationships between net carbon budget and community structure, plant growth, and maintenance variables (* p < 0.05, ** p < 0.01, *** p < 0.001).
Among plant growth variables, mean plant height (H) was positively correlated with CBD (r = 0.64, p < 0.001), and mean DBH increment (I-DBH) also showed a positive correlation (r = 0.38, p = 0.011). Mean DBH and mean height increment (I-H), however, were not significantly related to CBD.
Among structural variables, the LiDAR-derived three-dimensional green volume density (TDGVD) had the strongest positive correlation with CBD (r = 0.72, p < 0.001), and stem density (SD) was also positively correlated with CBD (r = 0.49, p < 0.001). These relationships indicate that denser three-dimensional vegetation occupation, rather than planar greenness alone, was most consistently associated with improved net carbon performance.
Among the maintenance-related variables, irrigation-related carbon emissions (ICE) showed a significant negative correlation with net carbon budget values (r = −0.30, p = 0.048), indicating that plots with higher irrigation-related emissions tended to have weaker net carbon benefits. In contrast, fertilization (FCE), trimming/pruning (TCE), and pesticide application (PCE) showed no significant relationships. Within the studied parks, irrigation therefore appears to be the management input most directly associated with weakened net carbon benefit.
3.2.2. Multiple Regression Analysis of Key Influencing Factors
A multiple linear regression model was fitted with net carbon budget as the dependent variable and H, I-DBH, TDGVD, SD, and ICE as explanatory variables. The overall model was significant (R2 = 0.474, p < 0.001), indicating that the selected variables explained a substantial proportion of variation in the net carbon budget across the sample plots. Collinearity diagnostics showed tolerance values above 0.3 and VIF values between 1.064 and 2.891, suggesting that no serious multicollinearity affected model stability (Table 3).
Table 3.
Multiple linear regression results in factors influencing the community net carbon budget.
Among the standardized coefficients, the LiDAR-derived TDGVD had the largest positive coefficient for the net carbon budget (β = 0.417, p = 0.032). Stem density also showed a significant positive coefficient (β = 0.276, p = 0.048), whereas irrigation-related emissions showed a significant negative coefficient (β = −0.276, p = 0.021). Mean plant height and mean DBH increment did not retain independent significance after the structural and management variables were included. These results indicate that plot-level carbon performance was more strongly associated with remotely sensed community structure and irrigation-related maintenance pressure than with individual growth traits alone.
3.2.3. Comparison of the Explanatory Power of Sequestration and Emission Pathways
To distinguish the relative importance of sequestration and emission processes, variables associated with biomass accumulation and three-dimensional vegetation structure were grouped into a carbon sequestration pathway, whereas maintenance-related variables were grouped into a carbon emission pathway. Separate regression models were then fitted for the two pathways.
The carbon sequestration pathway model, which included TDGVD, SD, H, and I-DBH, explained more variation in net carbon budget (adjusted R2 = 0.409, p < 0.001) than the carbon emission pathway model based on irrigation input alone (adjusted R2 = 0.134, p = 0.008). This result suggests that, within the sampled biotopes, differences in vegetation structure and biomass accumulation were more informative for explaining net carbon performance than differences in maintenance-related emissions. Nevertheless, the significant negative coefficient for irrigation indicates that maintenance inputs can still weaken the final net carbon benefit, especially where vegetation sequestration capacity is limited.
4. Discussion
4.1. Differentiation of Net Carbon Budget Among Biotopes and Its Ecological Significance
At the biotope scale resolved by backpack LiDAR and field mapping, urban park green spaces did not function as uniform net carbon sinks. Instead, clear differentiation emerged among strong sinks, weak sinks, and a carbon source. Net carbon budgets ranged from 0.58 kg C m−2 in closed forests to −0.02 kg C m−2 in short-grass areas. This finding extends previous urban-park carbon studies by showing that the most decision-relevant contrast is not simply between parks and non-parks, but among internal community units with different canopy closure, substrate condition, vertical structure, and maintenance demand [35,36].
The strong performance of closed woody biotopes is ecologically plausible. Closed broadleaved and mixed forests outperformed all other types, most likely because greater canopy closure, higher woody dominance, larger standing biomass, and more sustained dry-matter accumulation increased carbon sequestration per unit area. These biotopes also had more continuous vertical occupation and greater crown projection, which may have supported more stable biomass accumulation. This interpretation is consistent with evidence that urban tree-dominated or structurally intact communities generally store and sequester more carbon than sparsely wooded or fragmented green spaces [37,38,39].
By contrast, partly closed biotopes showed substantially lower net carbon budgets per unit area (0.03–0.10 kg C m−2). Although these units still functioned as carbon sinks, their sink strength was much weaker than that of closed biotopes. This difference may be related to reduced canopy closure, lower woody biomass density, fragmented vertical structure, or insufficiently developed understory layers. In such biotopes, the amount of carbon fixed through vegetation growth may be limited, whereas maintenance activities such as pruning, irrigation, litter removal, and path or facility management may still generate carbon emissions. The balance between sequestration and emissions, therefore, becomes less favorable, resulting in a weak net carbon sink performance.
The negative net carbon budget of the partly open short-grass biotope (−0.02 kg C m−2) shows that certain urban green-space units may become net carbon sources under routine maintenance. Herb-dominated open landscapes are carbon-inefficient when long-term woody biomass stock is insufficient to offset emissions from mowing, irrigation, trimming, and machinery use. This result is consistent with urban turf studies showing that intensive maintenance can substantially diminish, or even offset, the climatic benefits of lawn-dominated green spaces, particularly under sustained mowing and irrigation regimes [18,40].
The low performance of hard-surfaced woody biotopes (0.04 kg C m−2) further highlights the role of ground conditions. Impervious cover can constrain rooting space, reduce water infiltration, and weaken hydrothermal buffering. These constraints may limit biomass accumulation and reduce the carbon benefit of woody vegetation. Thus, even where trees are present, hard-surfaced substrates can weaken the capacity of woody communities to function as efficient carbon sinks [15,19,41].
From a planning perspective, relying on park-wide averages can be misleading. This approach may overestimate the efficiency of low-performing areas while masking the strategic value of high-performing carbon sinks. A biotope-based perspective is therefore better aligned with refined park renewal because it identifies which community units should be protected, which should be structurally upgraded, and which should be managed primarily for non-carbon functions under an explicit carbon trade-off [14,15,42].
Taken together, these findings shift the discussion from the general question of whether parks sequester carbon to the more operational question of which biotopes deliver robust net carbon benefits under real maintenance regimes. For remote-sensing applications, the main value of high-resolution three-dimensional data lies not in spatial detail alone, but in enabling ecologically interpretable units for management and design intervention [9,43].
Taken together, these findings shift the discussion from the general question of whether parks sequester carbon to the more operational question of which biotopes deliver robust net carbon benefits under real maintenance regimes. For remote-sensing applications, the main value of high-resolution three-dimensional data is not only the measurement of vegetation volume, but also the ability to connect structural information with ecologically meaningful management units.
4.2. More Structure Is Not Automatically Better: Context Dependence of Multi-Layer Effects
Multi-layer communities are often treated as a default design ideal in low-carbon green-space planning, yet the present results indicate that greater vertical stratification does not automatically produce a higher net carbon budget. In several cases, single-layer closed forests performed as well as or better than their multi-layer counterparts. For instance, closed broadleaved single-layer forests achieved a net carbon budget of 0.58 kg C m−2, which exceeded that of closed mixed multi-layer forests (0.40 kg C m−2). This suggests that the carbon benefit of vertical complexity is conditional rather than universal, and that more layers should not be treated as a proxy for greater sink capacity without considering actual biomass organization [38,39,43].
Several mechanisms may explain this pattern. First, some multi-layer stands may have had insufficiently developed understory biomass, so the apparent increase in layering did not translate into substantial additional carbon storage. Second, more complex communities may intensify competition for light, water, and nutrients, especially under the seasonal moisture constraints of the Guanzhong region. Similar insights from forest productivity research indicate that structural diversity can enhance ecosystem function only when species complementarity and resource partitioning are effectively realized [36,44].
The broader implication is that the multi-layer structure is context-dependent rather than universally superior. Its value should be interpreted together with canopy closure, dominant-species performance, planting density, and substrate condition, rather than as an isolated categorical advantage. For urban parks with limited space and competing recreational demands, the practical target is not complexity for its own sake, but a stable and efficient three-dimensional vegetation structure that delivers persistent biomass accumulation without excessive maintenance burden [17,43].
Methodologically, this also helps explain why continuous structural indicators were more informative than coarse structural labels. Variables such as LiDAR-derived three-dimensional green volume density and stem density described the functional intensity of the vegetation more directly than a simple single-layer versus multi-layer classification. This is consistent with the broader shift in urban vegetation assessment toward structure-sensitive metrics that better capture ecological performance than categorical description alone [10,36].
Methodologically, this also helps explain why continuous structural indicators were more informative than coarse structural labels. Variables such as LiDAR-derived three-dimensional green volume density and stem density described the functional intensity of vegetation more directly than a simple single-layer versus multi-layer classification. This supports the use of three-dimensional remote-sensing metrics to refine biotope classification and carbon-performance assessment.
4.3. Key Drivers: From Planar Greening to Three-Dimensional Carbon Efficiency
Three-dimensional green volume density emerged as the strongest positive predictor of the net carbon budget, suggesting that the carbon performance of urban parks depends more on vegetation volume and spatial occupancy than on greening area alone. Compared with planar indicators, LiDAR-derived three-dimensional metrics provide a closer proxy for aboveground biomass and the scale of the photosynthetic interface. This interpretation aligns with studies showing that plant-community structure, spatial configuration, and woody organization are central to urban carbon sequestration performance [14,37,39,42].
This result also explains why the biotope framework performed well in separating strong carbon sinks, weak sinks, and carbon-source units. The typology captured broad ecological differences, while TDGVD and other continuous structural metrics provided a more sensitive measurement of within-type structural variation. Therefore, the contribution of backpack LiDAR should not be understood as technical novelty alone. Its main value lies in connecting three-dimensional vegetation measurement with ecological classification and carbon-budget interpretation.
Stem density also showed a significant positive coefficient, indicating that moderate densification can increase total woody biomass per unit area. This result should not be read as an argument for indiscriminate densification. Excessive density may increase crown crowding, root competition, and long-term growth suppression. The practical implication is not that the denser planting is always better, but that an appropriate density range can strengthen carbon sequestration when coordinated with canopy closure, species composition, site condition, and recreational use [36].
Irrigation showed a significant negative association with net carbon budget, suggesting that the carbon cost of water-related maintenance can erode net benefits. In the Guanzhong setting, where precipitation is seasonally uneven and evaporative demand is substantial, irrigation may be necessary for vegetation survival and landscape quality. However, this result indicates that irrigation demand should be explicitly considered when evaluating the net carbon performance of park biotopes. This interpretation is consistent with studies emphasizing that water use and turf management can weaken the net carbon performance of urban green spaces when structural sequestration capacity is limited [40,45].
By contrast, individual growth variables lost significance once community structural variables were included in the model. This suggests that plot-level carbon performance is associated less with how well single plants grow in isolation than with whether the community as a whole forms an efficient structural configuration. From a planning perspective, carbon-sink enhancement should therefore move beyond specimen-centered thinking and focus more explicitly on community-scale spatial organization, substrate support, and management matching [19,43].
The comparative pathways analysis showed that the vegetation sequestration model (adjusted R2 = 0.409) had higher explanatory power than the maintenance-emission model (adjusted R2 = 0.134). These moderate values are reasonable for in situ urban ecological research, where microclimate, management history, soil condition, park use intensity, species composition, and site disturbance are difficult to fully represent in a single model.
The lower explanatory power of the emission pathway suggests that, within the studied parks in Xianyang, maintenance emissions from irrigation and other operations varied less than vegetation sequestration among biotopes. As a result, differences in net carbon budget were more strongly associated with the carbon-gain side than with the emission-cost side. This interpretation is consistent with the nonsignificant differences in maintenance-emission density among biotope types and with studies showing that urban park carbon performance is fundamentally conditioned by vegetation composition and structural organization [42].
Therefore, although the models do not capture all variation in the data, the statistical evidence supports prioritizing structural optimization in low-carbon park design. This conclusion should be interpreted as a management-oriented association rather than proof of a universal causal mechanism.
4.4. Contrasting Roles of Sequestration and Emission Pathways in Remote-Sensing-Informed Park Optimization
The comparison between pathway models provides a practical management implication: improving the inherent carbon sequestration capacity of vegetation explained more variation in the net carbon budget than reducing maintenance emissions alone. This does not mean that low-carbon maintenance is unimportant. Rather, it indicates that the first-order design task is to increase structurally efficient woody biomass, while the second-order management task is to reduce high-input practices that weaken net benefits. Similar conclusions have been reported in studies showing that urban park carbon performance is strongly conditioned by vegetation composition and structural organization, while management mainly modifies that baseline.
For park planning and renewal, structurally efficient woody biotopes should therefore be treated as core carbon-sink patches and protected or enhanced accordingly. Partly closed weak-sink units can be improved through selective enrichment planting, stronger vertical organization, where ecologically justified, and reduced hard-surface constraints. Open short-grass areas should not necessarily be eliminated because they may provide recreation, visibility, and social-use functions. However, their carbon role should be understood clearly, and high-input lawns should be managed with water-saving, low-mowing, edge-planting, or mixed ground-cover strategies where appropriate [14,17].
More broadly, carbon-sink enhancement in parks should be embedded within a multifunctional planning framework. Biotope configurations that improve carbon balance may also contribute to thermal regulation, habitat quality, and perceived environmental quality, but trade-offs with accessibility, safety, recreation, and maintenance capacity must also be considered. The most robust design pathway is therefore not single-objective carbon maximization but a coordinated improvement of park ecological performance under realistic management constraints and urban ecosystem-service trade-offs [4,19,46].
4.5. Uncertainty Analysis and Limitations
Several sources of uncertainty and research limitations should be acknowledged when interpreting the net carbon budget estimated in this study.
4.5.1. System Boundary Uncertainty
First, the accounting framework captured aboveground plant sequestration and maintenance-stage emissions, but did not include belowground biomass, soil organic carbon, or soil respiration; the estimated net carbon budget should therefore be interpreted as a vegetation–maintenance balance rather than a full ecosystem carbon balance. This boundary definition is useful for comparing plant-community units under park-management conditions, but it does not represent the complete carbon dynamics of urban park ecosystems.
4.5.2. Parameter and Methodological Uncertainty
Second, biomass estimation relied on species-specific or genus-specific allometric equations whenever available, but generic equations were required for several species due to the lack of locally calibrated models. Such equations may introduce uncertainty in urban biomass estimation because urban trees often differ from forest-grown trees in crown architecture, edge exposure, pruning history, management disturbance, and competition intensity. Third, herb-layer sequestration was estimated using the literature-derived parameters, including a constant carbon sequestration coefficient, whereas maintenance emissions were estimated from activity data and emission factors rather than continuous instrumented monitoring. These choices improved operational feasibility but may introduce uncertainty into the absolute values of the net carbon budget, particularly because herbaceous biomass accumulation, mowing frequency, post-mowing regrowth, irrigation sources, and maintenance intensity can vary substantially among plots and management regimes. In addition, plot-level average point density and formal trajectory-closure error were not consistently available for all LiDAR scans; therefore, point-cloud quality control relied on preprocessing, visual inspection, registration consistency, and comparison with field observations. This limitation may affect the precision of vegetation-volume estimates and should be addressed in future sensor-quality reporting.
4.5.3. Spatiotemporal and Statistical Uncertainty
Furthermore, the remote-sensing component relied on backpack LiDAR acquired in a single-city and study-period case. Vegetation growth and annual sequestration may vary with precipitation, temperature, drought stress, management intensity, and other climatic or operational factors. Therefore, the reported annual sequestration values should be interpreted as annualized study-period estimates rather than long-term mean annual rates. In addition, although this study included 44 plots across nine urban biotope types, the sample size was unevenly distributed among different biotope types. Specifically, only two of the nine biotope types had fewer than five replicated plots. This was mainly because some biotope types occurred infrequently, occupied relatively small areas, or showed localized spatial distributions within the study area. Such uneven sample allocation may influence the statistical power of the Kruskal–Wallis tests and the robustness of the regression models. Therefore, the differences among biotope types and the identified relationships should be interpreted with caution. The generalizability of specific structural thresholds and ranking patterns across other climates, management regimes, and sensor platforms remains to be tested.
4.6. Future Directions
Future studies should develop locally calibrated allometric equations for dominant urban tree species to improve the precision of carbon stock and sequestration estimates. Future research should also increase the number of plots for underrepresented biotope types and conduct multi-city comparative studies to improve statistical reliability and generalizability. Methodologically, future work should integrate belowground carbon pools and soil processes, incorporate long-term operational monitoring, and record plot-level LiDAR quality indicators such as average point density, registration residuals, and trajectory-closure error wherever available. An important next step for remote-sensing research is to examine how the ecological-unit approach developed from terrestrial LiDAR can be upscaled or cross-calibrated with UAV, airborne, or satellite observations to support broader urban carbon mapping while retaining sensitivity to within-park heterogeneity.
5. Conclusions
Using vegetation surveys, backpack LiDAR point-cloud metrics, and maintenance inventories from 44 plots representing nine biotope types in 16 parks, this study evaluated carbon sequestration, maintenance emissions, and net carbon budget at the ecological-unit scale within urban parks of central Xianyang. The results suggest that urban parks should not be assumed to function as homogeneous carbon sinks. Instead, their net carbon performance differed substantially among biotope types and was primarily associated with three-dimensional vegetation structure. Closed woody biotopes showed the strongest sink performance, whereas the partly open short-grass biotope functioned as a carbon source under the observed maintenance regime. LiDAR-derived three-dimensional green volume density and stem density were identified as the main positive predictors of net carbon budget, suggesting that vertical vegetation occupation and community-scale structural organization provide more informative indicators than planar greening metrics alone. Because the sequestration pathway explained more variation in the net carbon budget than the maintenance-emission pathway, low-carbon park construction should prioritize the retention and optimization of structurally efficient woody biotopes, while also reducing high-input maintenance activities such as irrigation where feasible.
From a remote-sensing perspective, the main contribution of this study is the development of a biotope-based workflow that uses backpack LiDAR point clouds to derive ecologically interpretable net-carbon units for urban park assessment. For future upscaling, LiDAR-derived metrics such as green volume density, canopy height, and vertical structural complexity are among the most practical indicators because they can be consistently extracted from UAV-LiDAR or dense photogrammetric point clouds across larger urban green-space areas. These structural metrics provide a scalable basis for extending a biotope-level net-carbon assessment to broader urban landscapes and can support management-oriented carbon evaluation. Nevertheless, further cross-city, multi-year, and cross-platform validation is still needed before specific structural thresholds or biotope rankings can be generalized to other urban contexts.
Supplementary Materials
The following supporting information can be downloaded at https://www.mdpi.com/article/10.3390/rs18101672/s1. Table S1: Basic information of the selected park green spaces in Xianyang City; Table S2: Biotope Classification of Park Green Spaces in Xianyang City; Table S3: Allometric Growth Equations of Tree Species Biomass species; Table S4: Reference values for tree species rootstock ratio; Table S5: Carbon Emission Conversion Factors for Energy and Materials. Supplementary S1: LiDAR point cloud images of different biotopes; Supplementary S2: Carbon Emission Survey Questionnaire for Urban Green Space Use and Maintenance Phase.
Author Contributions
Conceptualization, Z.Z., L.Q. and T.G.; methodology, Z.Z., Y.Y. and X.Z.; software, Z.Z.; formal analysis, Z.Z. and Y.M.; investigation, Z.Z., Y.M. and X.Z.; data curation, Z.Z.; writing—original draft preparation, Z.Z., Y.Y. and Y.M.; writing—review and editing, Z.Z., T.G. and L.Q.; visualization, Z.Z., Y.Y. and Y.M.; resources, T.G. and L.Q.; supervision, T.G. and L.Q.; funding acquisition, T.G. and L.Q. All authors have read and agreed to the published version of the manuscript.
Funding
This research was supported by the National Natural Science Foundation of China [grant numbers: 32572141, 32572139].
Data Availability Statement
Dataset available on request from the authors. The raw data supporting the conclusions of this article will be made available by the authors on request.
Conflicts of Interest
The authors declare no conflicts of interest.
References
- Pan, H.; Page, J.; Shi, R.; Cong, C.; Cai, Z.; Barthel, S.; Thollander, P.; Colding, J.; Kalantari, Z. Contribution of Prioritized Urban Nature-Based Solutions Allocation to Carbon Neutrality. Nat. Clim. Change 2023, 13, 862–870. [Google Scholar] [CrossRef] [Scilit]
- Van Der Ploeg, R.; Haigh, M. The Importance of Natural Land Carbon Sinks in Modelling Future Emissions Pathways and Assessing Individual Country Progress Towards Net-Zero Emissions Targets. Front. Environ. Sci. 2024, 12, 1379046. [Google Scholar] [CrossRef] [Scilit]
- IPCC. Climate Change 2022: Mitigation of Climate Change, Chapter 8: Urban Systems and Other Settlements; IPCC: Geneva, Switzerland, 2022. [Google Scholar]
- Muluneh, M.G.; Worku, B.B. Contributions of Urban Green Spaces for Climate Change Mitigation and Biodiversity Conservation in Dessie City, Northeastern Ethiopia. Urban Clim. 2022, 46, 101294. [Google Scholar] [CrossRef] [Scilit]
- Zhou, Y.; Jia, X.; Tian, Y.; Zhang, H.; Dong, N.; Hu, Y.; Ge, S.; Lei, Y.; Tian, G. Net Carbon Balance Analysis of Urban Parks from Construction to Operation: A Multi-Source Data Study in Zhengzhou. Ecol. Indic. 2025, 179, 114287. [Google Scholar] [CrossRef] [Scilit]
- Zhao, D.; Cai, J.; Xu, Y.; Liu, Y.; Yao, M. Carbon Sinks in Urban Public Green Spaces under Carbon Neutrality: A Bibliometric Analysis and Systematic Literature Review. Urban For. Urban Green. 2023, 86, 128037. [Google Scholar] [CrossRef] [Scilit]
- Jo, H. Impacts of Urban Greenspace on Offsetting Carbon Emissions for Middle Korea. J. Environ. Manag. 2002, 64, 115–126. [Google Scholar] [CrossRef] [Scilit]
- Xie, J.; Zhan, Y.; Li, X.; Dai, Z.; Cong, R.; Xu, R.; Zhang, Z.; Yao, Z. Significant Carbon Storage and Sequestration by Urban Greenery in Beijing City During 2010–2020. Urban For. Urban Green. 2025, 112, 128944. [Google Scholar] [CrossRef] [Scilit]
- Kim, J.; Kang, Y.; Kim, D.; Son, S.; Kim, E.J. Carbon Storage and Sequestration Analysis by Urban Park Grid Using I-Tree Eco and Drone-Based Modeling. Forests 2024, 15, 683. [Google Scholar] [CrossRef] [Scilit]
- Shao, J.; Diao, Y.; Zhang, Q.; Wang, J. Optimizing Conservation Planning: An Integrated Approach to Cost-Effective Biodiversity and Carbon Sequestration Management in Yunnan Province, China. Glob. Ecol. Conserv. 2024, 56, e03336. [Google Scholar] [CrossRef] [Scilit]
- Liu, H.; Zhang, J.; Wang, Z. Assessing and Optimizing the Potential for Climate Change Mitigation and Carbon Sequestration in Urban Residential Green Spaces: Energizing Sustainable Cities. Front. Environ. Sci. 2025, 13, 1519297. [Google Scholar] [CrossRef] [Scilit]
- Eom, H.; Shin, Y.; Lee, S.-W.; An, K. Exploring Suitable Urban Plant Structures for Carbon-Sink Capacities. Land 2025, 14, 849. [Google Scholar] [CrossRef] [Scilit]
- Wang, V.; Gao, J. Estimation of Carbon Stock in Urban Parks: Biophysical Parameters, Thresholds, Reliability, and Sampling Load by Plant Type. Urban For. Urban Green. 2020, 55, 126852. [Google Scholar] [CrossRef] [Scilit]
- Zhang, M.; Chen, K.; Liu, H.; Yi, Y. Analysing carbon density in urban parks by considering the management of different functional parks: A case study in Beijing. Ecol. Indic. 2024, 166, 112411. [Google Scholar] [CrossRef] [Scilit]
- Wang, X.; Xue, W.; Ruan, Y.; Cheng, M.; Ma, S. Estimation of Carbon Storage and Influencing Factors for Urban Green Spaces: A View of Green Space Types and Plant Community Structure. Front. Environ. Sci. 2026, 13, 1642030. [Google Scholar] [CrossRef] [Scilit]
- Zhang, H.; Ren, Q.; Zhou, Y.; Dong, N.; Wang, H.; Hu, Y.; Song, P.; He, R.; Tian, G.; Ge, S. Influence of Tree Community Characteristics on Carbon Sinks in Urban Parks: A Case Study of Xinyang, China. Land 2025, 14, 653. [Google Scholar] [CrossRef] [Scilit]
- Wang, Y.; Chang, Q.; Li, X. Promoting sustainable carbon sequestration of plants in urban greenspace by planting design: A case study in parks of Beijing. Urban For. Urban Green. 2021, 64, 127291. [Google Scholar] [CrossRef] [Scilit]
- Churkina, G. The Role of Urbanization in the Global Carbon Cycle. Front. Ecol. Evol. 2016, 3, 144. [Google Scholar] [CrossRef] [Scilit]
- Pataki, D.E.; Carreiro, M.M.; Cherrier, J.; Grulke, N.E.; Jennings, V.; Pincetl, S.; Pouyat, R.V.; Whitlow, T.H.; Zipperer, W.C. Coupling Biogeochemical Cycles in Urban Environments: Ecosystem Services, Green Solutions, and Misconceptions. Front. Ecol. Environ. 2011, 9, 27–36. [Google Scholar] [CrossRef] [Scilit]
- Qiu, L.; Gao, T.; Gunnarsson, A.; Hammer, M.; von Bothmer, R. A Methodological Study of Biotope Mapping in Nature Conservation. Urban For. Urban Green. 2010, 9, 161–166. [Google Scholar] [CrossRef] [Scilit]
- Zhao, Y.M.; Liu, M.H.; Zhou, Q.L.; Bao, Y.F.; Cheng, Y.B.; Li, Y.L.; Yang, W.B. Biomass and Root-to-Shoot Ratio of Individual Populus alba var. pyramidalis in Oasis Farmland Shelterbelts. Sci. Soil Water Conserv. 2020, 18, 35–41. (In Chinese) [Google Scholar] [CrossRef]
- He, H.Z.; Huang, L.H.; Duan, X.; He, R.K. Study on Biomass of Dominant Tree Species in the Second-Ring Forest Belt of Guiyang City. Guizhou Sci. 2007, 03, 33–39. (In Chinese) [Google Scholar]
- Ministry of Ecology and Environment of the People’s Republic of China. Methodology for Voluntary Greenhouse Gas Emission Reduction Projects: Afforestation Carbon Sink; CCER-14-001-V01; Ministry of Ecology and Environment of the People’s Republic of China: Beijing, China, 2023; p. 69. (In Chinese)
- GB/T 43648—2024; Biomass Models and Carbon Accounting Parameters for Standing Trees of Major Tree Species. National Technical Committee on Forest Resources Standardization; State Administration for Market Regulation; Standardization Administration of China: Beijing, China, 2024. (In Chinese)
- DB31/T 1234—2020; Technical Regulations for Accounting and Monitoring of Urban Forest Carbon Sinks. Shanghai Forestry Standardization Technical Committee; China Standards Press: Beijing, China, 2020. (In Chinese)
- Wang, D.S. Study on Net Carbon Storage of Urban Landscape Green Spaces in Beijing Based on Biomass Measurement. Ph.D. Thesis, Beijing Forestry University, Beijing, China, 2010. (In Chinese) [Google Scholar]
- Wen, J.S. Study on the Effects of Urbanization on Carbon Sequestration and Carbon Storage of Vegetation in Built-Up Areas. Master’s Thesis, Zhejiang University, Hangzhou, China, 2010. (In Chinese) [Google Scholar]
- Zhou, J.L.; Li, C.R.; Jia, Y.Y.; Yang, L.; Liu, L.; Xiao, M. Structural Characteristics and Carbon Storage Estimation of Road Forests in Urban Core Area of Tai’an City. Urban For. 2024, 22, 121–128. (In Chinese) [Google Scholar]
- Li, J.H.; Li, C.J.; Peng, S.K. Biomass Estimation Methods and Applications for Poplar Plantations. J. Nanjing For. Univ. (Nat. Sci. Ed.) 2007, 04, 37–40. (In Chinese) [Google Scholar]
- DB61/T 1828—2024; Technical Regulations for Forest Carbon Sink Accounting and Monitoring. Shaanxi Forestry Bureau; Shaanxi Provincial Administration for Market Regulation: Xi’an, China, 2024. (In Chinese)
- CJJ/T 287—2018; Standard for Landscaping Maintenance. Ministry of Housing and Urban-Rural Development of the People’s Republic of China; China Architecture & Building Press: Beijing, China, 2018.
- Intergovernmental Panel on Climate Change. 2006 IPCC Guidelines for National Greenhouse Gas Inventories; IPCC: Geneva, Switzerland, 2006. [Google Scholar]
- Lal, R. Carbon Emission from Farm Operations. Environ. Int. 2004, 30, 981–990. [Google Scholar] [CrossRef] [Scilit] [PubMed]
- Cui, P. Construction and Application of a Carbon Emission Factor Database for the Life Cycle of Buildings. Master’s Thesis, Southeast University, Nanjing, China, 2015. (In Chinese) [Google Scholar]
- Hou, W.; Zhang, Y.; Zhang, Y.; Yang, F.; Wang, H. Analysis of the Response of the Carbon Sequestration and Oxygen Release Benefits of Urban Green Space to Plant Community Characteristic Factors. Landsc. Arch. 2024, 31, 55–61. [Google Scholar] [CrossRef] [Scilit]
- Forrester, D.I.; Bauhus, J. A Review of Processes Behind Diversity—Productivity Relationships in Forests. Curr. For. Rep. 2016, 2, 45–61. [Google Scholar] [CrossRef] [Scilit]
- Nowak, D.J.; Crane, D.E. Carbon Storage and Sequestration by Urban Trees in the USA. Environ. Pollut. 2002, 116, 381–389. [Google Scholar] [CrossRef] [Scilit]
- Zhang, X.; Huang, H.; Tu, K.; Li, R.; Zhang, X.; Wang, P.; Li, Y.; Yang, Q.; Acerman, A.C.; Guo, N.; et al. Effects of Plant Community Structural Characteristics on Carbon Sequestration in Urban Green Spaces. Sci. Rep. 2024, 14, 7382. [Google Scholar] [CrossRef] [Scilit]
- Escobedo, F.; Varela, S.; Zhao, M.; Wagner, J.E.; Zipperer, W. Analyzing the Efficacy of Subtropical Urban Forests in Offsetting Carbon Emissions from Cities. Environ. Sci. Policy 2010, 13, 362–372. [Google Scholar] [CrossRef] [Scilit]
- Townsend-Small, A.; Czimczik, C.I. Carbon Sequestration and Greenhouse Gas Emissions in Urban Turf. Geophys. Res. Lett. 2010, 37, L02707. [Google Scholar] [CrossRef] [Scilit]
- Zhao, D.; Cai, J.; Shen, S.; Liu, Q.; Lan, Y. Nature-Based Solutions: Assessing the Carbon Sink Potential and Influencing Factors of Urban Park Plant Communities in the Temperate Monsoon Climate Zone. Sci. Total Environ. 2024, 950, 175347. [Google Scholar] [CrossRef] [Scilit]
- Jo, H.-K.; Kim, J.-Y.; Park, H.-M. Carbon Reduction and Planning Strategies for Urban Parks in Seoul. Urban For. Urban Green. 2019, 41, 48–54. [Google Scholar] [CrossRef] [Scilit]
- Du, C.; Ge, S.; Song, P.; Jombach, S.; Fekete, A.; Valánszki, I. Optimizing Urban Green Spaces for Vegetation-Based Carbon Sequestration: The Role of Landscape Spatial Structure in Zhengzhou Parks, China. Forests 2025, 16, 679. [Google Scholar] [CrossRef] [Scilit]
- Pretzsch, H.; del Río, M.; Ammer, C.; Avdagic, A.; Barbeito, I.; Bielak, K.; Brazaitis, G.; Coll, L.; Dirnberger, G.; Drössler, L.; et al. Growth and Yield of Mixed Versus Pure Stands of Scots Pine (Pinus sylvestris L.) and European Beech (Fagus sylvatica L.) Analysed Along a Productivity Gradient Through Europe. Eur. J. For. Res. 2015, 134, 927–947. [Google Scholar] [CrossRef] [Scilit]
- Matias, P.; Moreira da Silva, M.; Teigão, J.; Duarte, A. Urban Vegetation Benefits in Mediterranean Cities for Climate Change Adaptation and Water Usage Efficiency—A Case Study in Algarve, Portugal. Front. Environ. Sci. 2025, 13, 1520934. [Google Scholar] [CrossRef] [Scilit]
- Herath, P.; Bai, X. Benefits and Co-Benefits of Urban Green Infrastructure for Sustainable Cities: Six Current and Emerging Themes. Sustain. Sci. 2024, 19, 1039–1063. [Google Scholar] [CrossRef] [Scilit]

Disclaimer/Publisher’s Note: The statements, opinions and data contained in all publications are solely those of the individual author(s) and contributor(s) and not of MDPI and/or the editor(s). MDPI and/or the editor(s) disclaim responsibility for any injury to people or property resulting from any ideas, methods, instructions or products referred to in the content. |
© 2026 by the authors. Licensee MDPI, Basel, Switzerland. This article is an open access article distributed under the terms and conditions of the Creative Commons Attribution (CC BY) license.