Review

Progress and Prospects of Diurnal Temperature Cycle Models: From Isotropic to Anisotropic

College of Resources and Environment, Anhui Agricultural University, Hefei 230036, China
*
Author to whom correspondence should be addressed.
Remote Sens. 2026, 18(10), 1539; https://doi.org/10.3390/rs18101539
Submission received: 14 February 2026 / Revised: 1 May 2026 / Accepted: 5 May 2026 / Published: 12 May 2026

Highlights

What are the main findings?
  • Traditional diurnal temperature cycle (DTC) models are constrained by the isotropic assumption, leading to systematic biases induced by viewing geometries over heterogeneous surfaces.
  • Simultaneously achieving continuous temporal fitting and angular correction remains a core scientific challenge.
What are the implications of the main findings?
  • Incorporating thermal radiation directionality (TRD) into DTC modeling is critical for overcoming traditional limitations and enhancing LST retrieval accuracy over heterogeneous surfaces.
  • Future research on multi-source data fusion and hybrid physics–data-driven modeling promises to advance reliable, all-weather, and spatiotemporally consistent LST monitoring.

Abstract

Land surface temperature (LST) and its diurnal variation are critical for understanding the surface energy balance and water cycle processes. Traditional diurnal temperature cycle (DTC) models are widely used to reconstruct continuous temperature sequences from sparse satellite observations. However, these models rely on the idealized assumption of an isotropic surface and ignore the thermal radiation directionality caused by viewing geometry, which introduces substantial errors over heterogeneous surfaces. Thus, incorporating angular effects into DTC modeling has become an effective approach to improving LST simulation accuracy. This review traces the progress of DTC models from isotropic to anisotropic representations. First, we summarize the development and inherent limitations of conventional isotropic DTC models. Then, we synthesize representative angular-coupled models, ranging from early simple component-based models to recent kernel-driven coupling methods, and compare their physical assumptions, data requirements, parameter complexity, and applicable scenarios. Although these coupled models can significantly improve fitting accuracy over heterogeneous surfaces, they still face challenges. These include strict data requirements, limited all-weather applicability, a lack of nighttime angular correction, and incomplete validation systems. Future research can advance through multi-source data fusion, hybrid modeling strategies, and robust validation systems. These are key to generating high-precision, spatiotemporally consistent LST data.

1. Introduction

Land surface temperature (LST) is one of the key parameters for the Earth’s surface energy balance and climate change research [1,2,3,4]. It exerts profound impacts on the global climate system, ecosystem evolution, and human activities, and possesses extensive application value in multiple research domains. These include surface energy balance [5,6,7], climate change [8,9,10], and urban thermal environment monitoring [11,12,13]. LST exhibits pronounced diurnal variations driven by factors such as solar radiation, atmospheric conditions, and surface characteristics [14,15,16,17,18]. Satellite remote sensing overcomes the spatial and logistical limitations of traditional ground-based measurements, enabling the acquisition of long-term, large-scale, and spatially continuous LST datasets [3,19,20]. Diurnal temperature cycle (DTC) models enable the reconstruction of complete land surface temperature sequences from sparse satellite observation data, thereby providing critical data support for research in areas such as soil moisture monitoring [21,22], evapotranspiration [23,24], and urban heat island analysis [25,26].
However, the LST acquired by remote sensing satellites is fundamentally the radiance temperature from a specific viewing geometry [27,28,29]. Owing to the heterogeneity of the surface material composition and three-dimensional structure, the same target exhibits significant temperature differences at different viewing angles, a phenomenon known as thermal radiation directionality (TRD). Empirical studies confirm that TRD is a key factor limiting LST product accuracy [30,31,32]. In highly heterogeneous areas, temperature discrepancies caused solely by variations in the observation angle can reach 10–16 K [33,34]. Traditional DTC models are generally based on the idealized assumption of “isotropic surface thermal radiation,” which neglects the influence of the viewing geometry on temperature measurements. This simplification limits the model simulation accuracy over heterogeneous land surfaces, with errors especially pronounced during daytime under strong solar radiation [35]. Therefore, it is important to account for the effect of thermal radiation anisotropy when conducting DTC analyses with directional LST observations from satellites. For reanalysis products like ERA5, the values are spatially aggregated and model-based, largely unaffected by viewing geometry, and anisotropic correction is not strictly necessary.
Several studies have systematically reviewed the development of DTC models or TRD models. For example, Cao et al. [36] comprehensively reviewed the development of land surface thermal radiation directionality observation and modeling. Wei et al. [37] and Chen et al. [38] reviewed TRD research from the perspectives of urban surfaces and computer simulation, respectively. Duan et al. [39] and Meng et al. [40] reviewed the development of DTC models and compared the simulation performance of several typical DTC models. However, the above studies either focused on TRD or DTC individually, or on the overall processing chain of LST products, and none of them addressed the coupled modeling of temporal and angular effects of land surface temperature. Although these studies [4,36,41] have noted that LST is simultaneously influenced by both angular and temporal factors and should be jointly modeled, no study has reviewed and analyzed such coupling methods.
Considering these deficiencies, this review focuses on the development of diurnal temperature cycle (DTC) models, with particular emphasis on their progression from isotropic to anisotropic approaches. First, we summarize the categories and key characteristics of DTC models as reported in the literature. Second, we employ bibliometric analysis to quantitatively assess citation patterns, thereby elucidating research activity and development trends in the field. In addition, several representative angular-coupled DTC models are systematically compared in terms of their underlying assumptions, methodological frameworks, and applicability. Finally, the principal limitations of current models are discussed, and potential future research directions are proposed.

2. Development and Research Status of Traditional DTC Models

2.1. The DTC Models

The diurnal variation characteristics of LST contain rich information about the complex energy exchange processes between the Earth’s surface and the atmosphere, serving as a key indicator of the surface energy balance and the climate system. It holds significant importance in meteorology, climatology, hydrology, and ecology [42,43,44,45]. Although geostationary satellites can fully capture daily LST variations owing to their high temporal resolution (up to hourly or sub-hourly), their observations are frequently affected by cloud cover, which leads to extensive data gaps that severely limit the availability of hourly geostationary satellite LST data [46]. Polar-orbiting satellites, capable of acquiring a maximum of four observations per day, struggle to fully characterize intraday LST variations.
The DTC model addresses this limitation, with its core advantage lying in reconstructing daily surface temperature profiles using a limited number of satellite observations. This effectively resolves data gaps and addresses the insufficient temporal resolution of polar-orbiting satellites [16,24]. The DTC model not only effectively captures the surface thermal characteristics but also yields thermal surface parameters that are closely linked to the physical properties [39,47]. For instance, the time of maximum daily temperature (tm) serves as a key indicator for estimating thermal inertia and soil moisture content [21,48]; the daily temperature range (DTR) is a vital indicator of climate change, enabling the estimation of the evapotranspiration fraction and drought monitoring [23,49], and the decay constant k can distinguish between different rock and soil types [17].
DTC models can be divided into four categories: physical models, quasi-physical models, statistical models, and semi-empirical models. The physical models are structurally complex. They simulate land surface temperature by solving the surface energy balance and heat conduction equations. They require high-quality land surface parameters and atmospheric variables observed by satellites or ground meteorological stations as driving inputs. Most land surface process models fall into this category. For example, Kahle [50] developed a simplified land surface thermal model driven by ground-based meteorological observations that can retrieve thermal inertia and simulate surface temperature variations. A typical example of a complex physical land surface model is the Biosphere–Atmosphere Transfer Scheme (BATS), which physically simulates surface temperature and water/heat fluxes by fully coupling soil, vegetation, and snow processes [51]. Jin and Dickinson [43] used the CCM3/BATS climate model to construct a lookup table of typical diurnal land surface temperature patterns determined by latitude, land cover type, season, and time of day. By combining this with satellite observations, they performed interpolation and correction to reconstruct the diurnal temperature cycle under clear-sky conditions. Subsequently, to address cloudy conditions, Jin [52] developed an energy budget-based neighboring pixel method and an air temperature adjustment method, enabling the estimation of land surface temperature for cloud-contaminated pixels.
The quasi-physical methods are centered on the surface energy balance equation and the heat conduction equation, with heat flux as the key variable. By parameterizing the surface flux components, they establish relationships between the DTC and surface properties such as thermal inertia, longwave radiation, sensible heat flux, and latent heat flux, thereby obtaining analytical expressions for temperature dynamics [45,48,53,54,55,56,57,58,59,60,61]. These models typically contain 2–12 parameters and are relatively complex in structure. They assume that the net shortwave radiation follows a half-wave distribution and approximate upward fluxes as linear functions of land surface temperature to obtain analytical solutions. Initially, these models were mainly used to retrieve thermal inertia from diurnal satellite LST data for geological mapping and soil moisture monitoring [57]. Zhan et al. [62] improved the simulation capability in urban areas by introducing air temperature data to correct the linearized boundary conditions. Huang et al. [63] proposed a generic modeling framework (GEM) suitable for clear-sky conditions, which features flexible parameters and achieves fitting accuracy of 0.33–1.71 K.
The statistical models (data-driven methods) do not rely on surface energy balance or heat conduction equations. Instead, they simulate the diurnal cycle of surface temperature through statistical analysis of measured surface temperatures or by establishing regression relationships between temperature and geographic information (such as time, location, and elevation). These methods include using principal component analysis to extract the main patterns of the diurnal cycle of surface temperature [42,64,65], or establishing regression relationships between MODIS land surface temperature products and parameters such as acquisition time, geographic location, and elevation to generate large-scale diurnal temperature curves [66,67]. In addition, there are data-driven methods developed specifically for geostationary satellites, such as those based on singular value decomposition [68,69,70,71,72,73,74]. The core steps of these methods include training data selection, preprocessing, and fitting the diurnal cycle using singular value decomposition and nonlinear least squares.
The semi-empirical models directly fit the diurnal temperature curve using mathematical functions, typically in a piecewise form: a harmonic function for the daytime warming process and an exponential function for the nighttime cooling process. Early research can be traced back to Parton and Logan [75], who proposed a diurnal model for soil and air temperature, using a sine function and an exponential function to represent day and night temperature changes, respectively, laying the basic framework for semi-empirical DTC modeling. Schädlich et al. [76] and Göttsche and Olesen [77] constructed more physically meaningful diurnal surface temperature models based on the heat diffusion equation, which were subsequently improved and extended in many studies [78,79,80,81,82]. In addition, Sun and Pinker [83] used a harmonic function to describe the nighttime cooling process. With the growing use of 1 km high-resolution LST data from polar-orbiting satellites (e.g., MODIS) in many fields [6,84,85,86], four-parameter DTC models have attracted wide interest. These models can reconstruct the complete daily temperature series using just four observations per day. The core idea of such models is to fix or simplify certain parameters in the original multi-parameter models [87,88,89,90,91].
However, there are no absolute boundaries among these four approaches [63]. Physical models, quasi-physical models, and semi-empirical models are all considered physics-based modeling methods. These models are grounded in thermodynamics and atmospheric physics, constructing analytical expressions for the DTC based on physical laws. They possess clear physical significance, strong interpretability, and well-defined model structures, and they generally achieve high accuracy. However, their performance largely depends on the precision and applicability of the input parameters. Data-driven models do not rely on physical mechanisms to characterize the DTC. They identify inherent patterns from historical regional temperature observations, using either statistical or machine learning algorithms for prediction. In practical remote sensing applications, quasi-physical and semi-empirical models are more widely adopted. Their flexibility and efficiency allow them to make use of temporally discrete thermal infrared observations. Recently, advances in machine learning techniques and the growing availability of large-scale satellite datasets have boosted research in this field, and data-driven models are gaining increasing prominence.

2.2. Current Status of DTC Model Research

2.2.1. Acquisition and Processing of Citing Articles

The volume and thematic focus of citing articles serve as robust indicators of a field’s research activity and developmental trajectory. Compared with keyword-based retrieval, forward citation analysis is less affected by variations in terminology. It more directly captures the development trajectory of foundational studies, providing a stable and objective basis for trend analysis. Accordingly, this study used the Web of Science Core Collection as the sole data source and adopted a forward citation analysis approach to track the development status, research attention, and research hotspots of DTC models from the citing articles. The Web of Science database covers peer-reviewed journals in remote sensing, photogrammetry, earth sciences, and related interdisciplinary fields, and provides standardized metadata and export formats, thereby ensuring the transparency and reproducibility of the literature retrieval process. We retrieved and exported from the Web of Science all citing articles published between 2000 and 2025 that cite the four categories of DTC model publications outlined in Section 2.1: physical models [43,50,51,52], quasi-physical models [45,48,53,54,55,56,57,58,59,60,61,62,63], statistical models [42,64,65,66,67,68,69,70,71,72,73,74], and semi-empirical models [76,77,78,79,80,81,82,83,87,88,89,90,91]. Then, we excluded gray literature, including technical reports, theses, and conference proceedings, retained only articles and reviews in English, and extracted metadata (titles, publication years, research scope, and topics). A total of 2247 citing records for the period 2000–2025 were exported from the Web of Science. After deduplication using CiteSpace (version 6.4.2), a final set of 1375 unique publications was obtained as the analytical sample. Based on this dataset, CiteSpace was used to analyze the annual count, regional distribution, and keywords of citing articles. Research dynamics were visualized through annual trend graphs, global distribution maps, and network diagrams, and research hotspots were identified. Additionally, the extensive application scenarios of DTC models in various fields were summarized.

2.2.2. Spatiotemporal Distribution Characteristics of Citing Articles

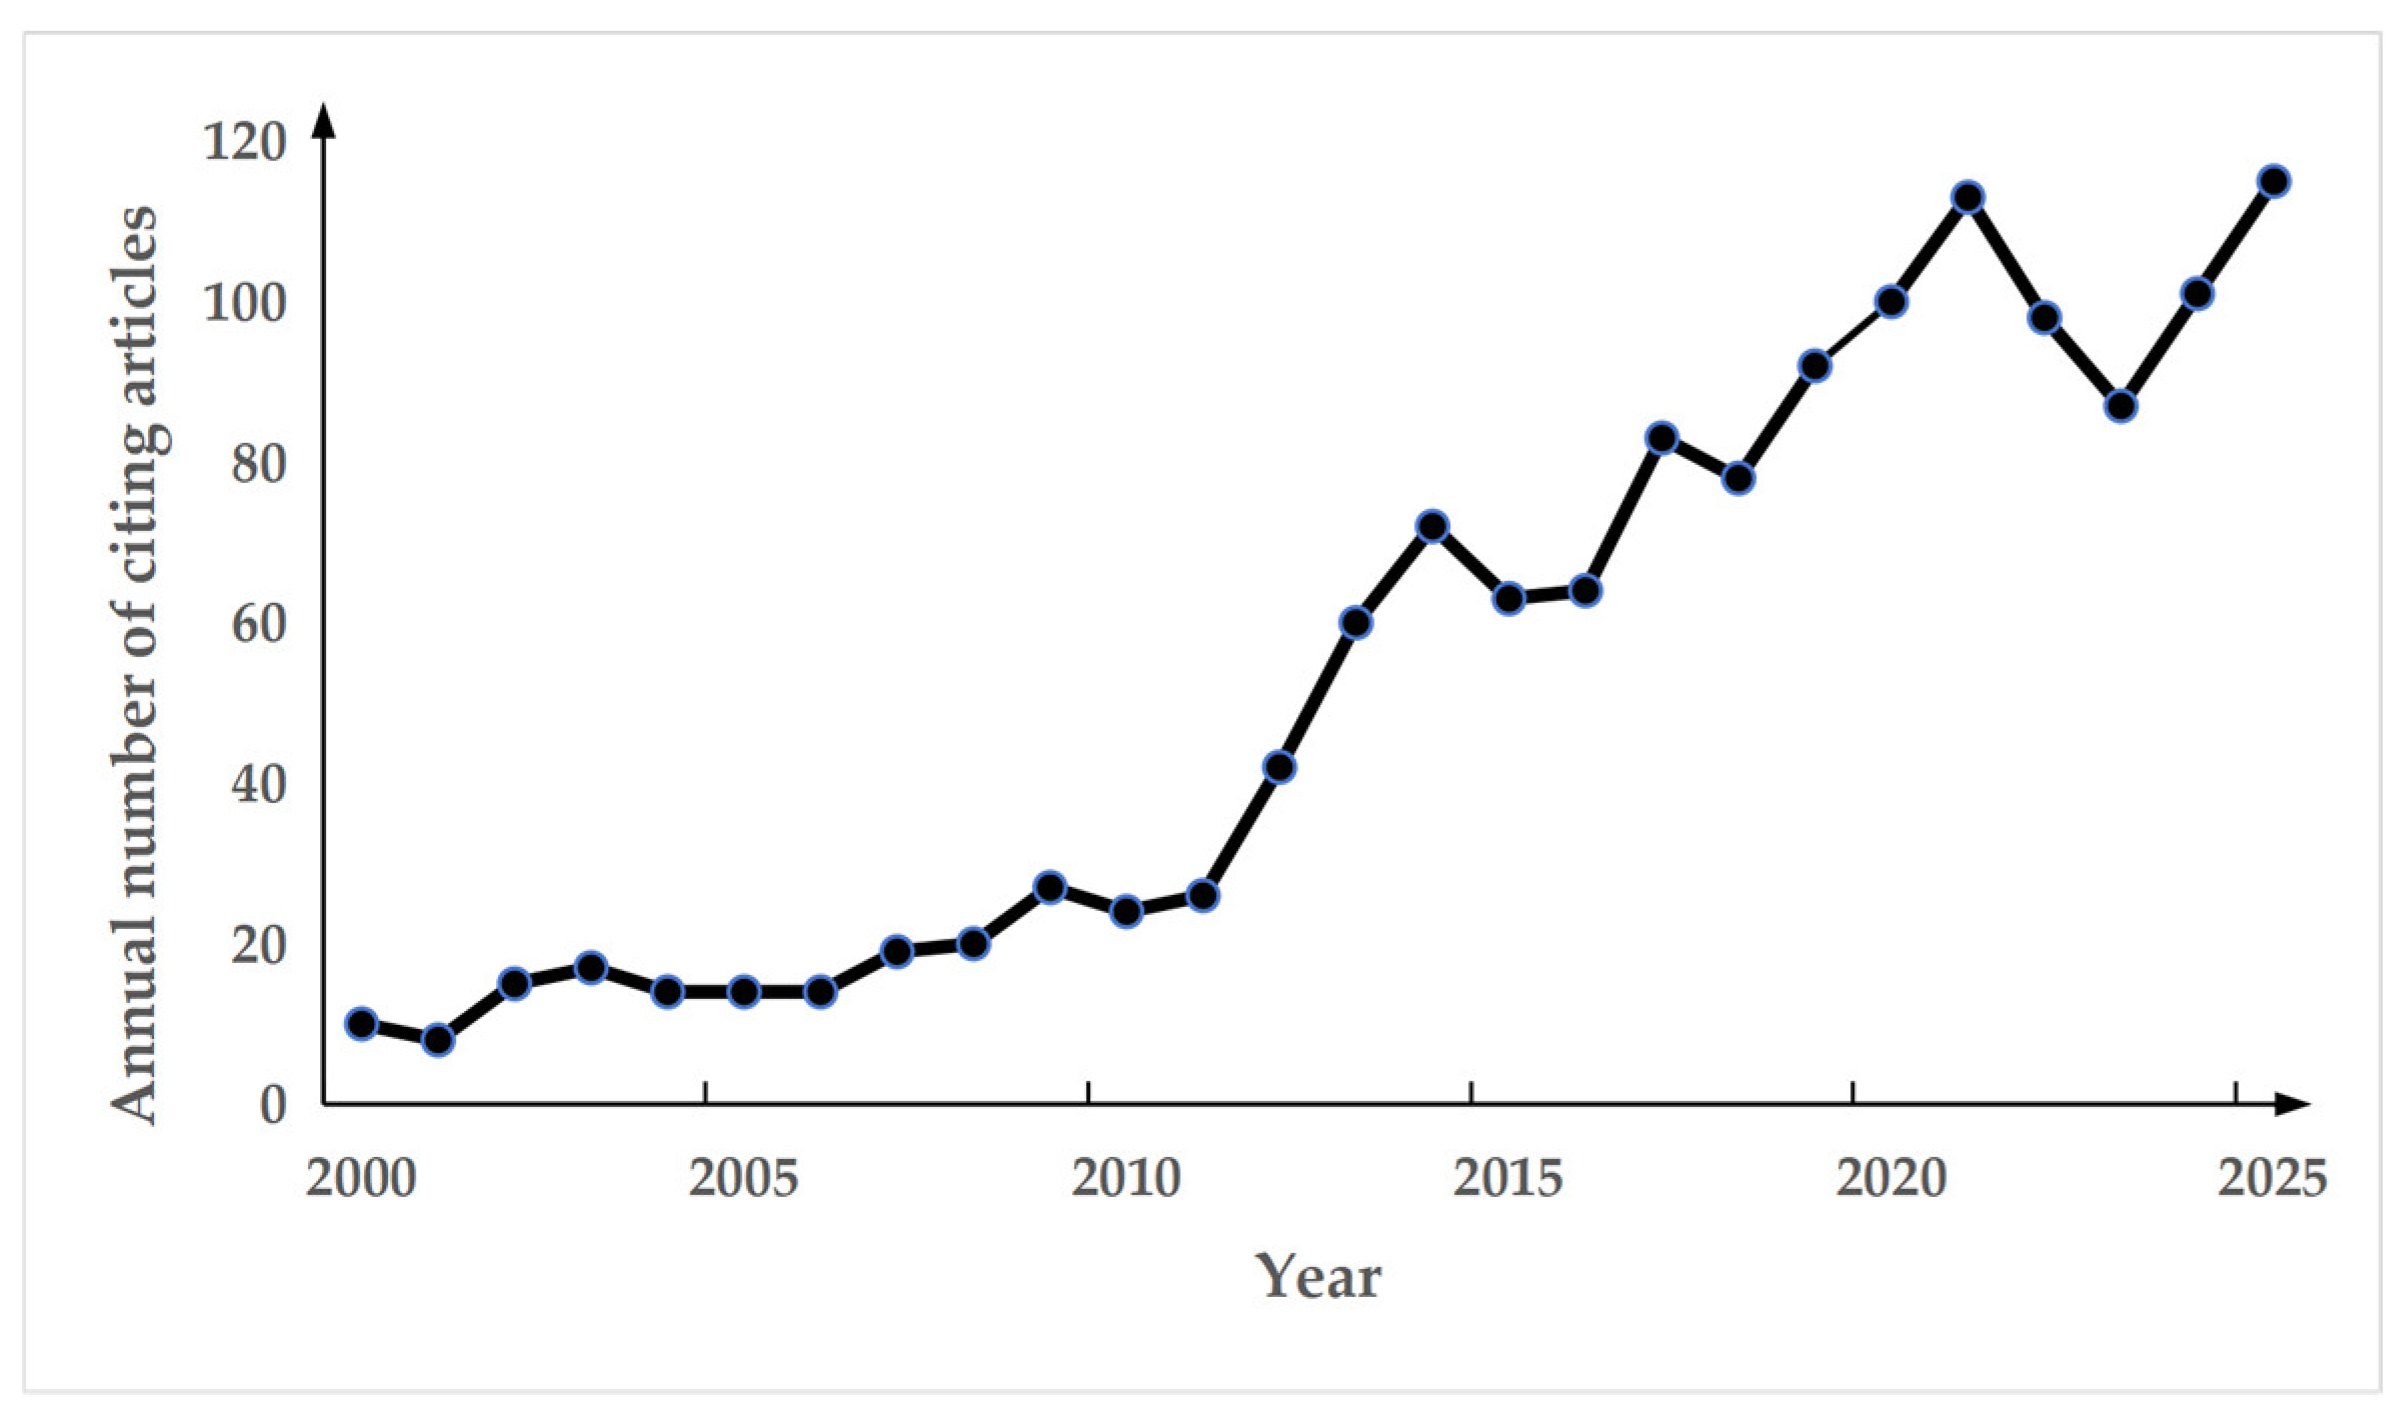
From the perspective of the annual number of citing articles (Figure 1), the number remained low and grew slowly from 2000 to 2010, representing the initial stage of the field. During this period, thermal infrared remote sensing data resources were limited, long-term continuous observation capabilities were insufficient, and the theoretical framework for DTC modeling had not yet matured. Research primarily focused on basic land surface temperature retrieval. From 2011 to 2020, the number of citing articles increased rapidly. During this period, long-term polar-orbiting satellite data, such as MODIS and Landsat, became fully available and operated stably, providing a crucial data foundation for DTC models. After 2015, a new generation of high-temporal-resolution geostationary satellites (e.g., Himawari-8, GOES-16, FY-4A) was successively launched, further enriching high-frequency observation data sources. Meanwhile, environmental issues such as climate change, urban heat islands, and extreme weather events grew in importance, and the demand for continuous, all-weather dynamic monitoring of land surface temperature expanded. Improved data accessibility, together with expanding application demands, jointly drove the rapid development of research during this stage. From 2021 to the present, the annual number of citing articles has remained at a relatively high level, with minor year-to-year fluctuations reflecting normal academic output cycles. During this stage, high-temporal-resolution geostationary satellite data have been more widely applied in DTC modeling, and the introduction of machine learning and data assimilation methods has provided new tools for refined land surface process research. In addition, practical demands such as carbon neutrality, sustainable urban development, and disaster prevention and mitigation continue to drive sustained research progress in the field.
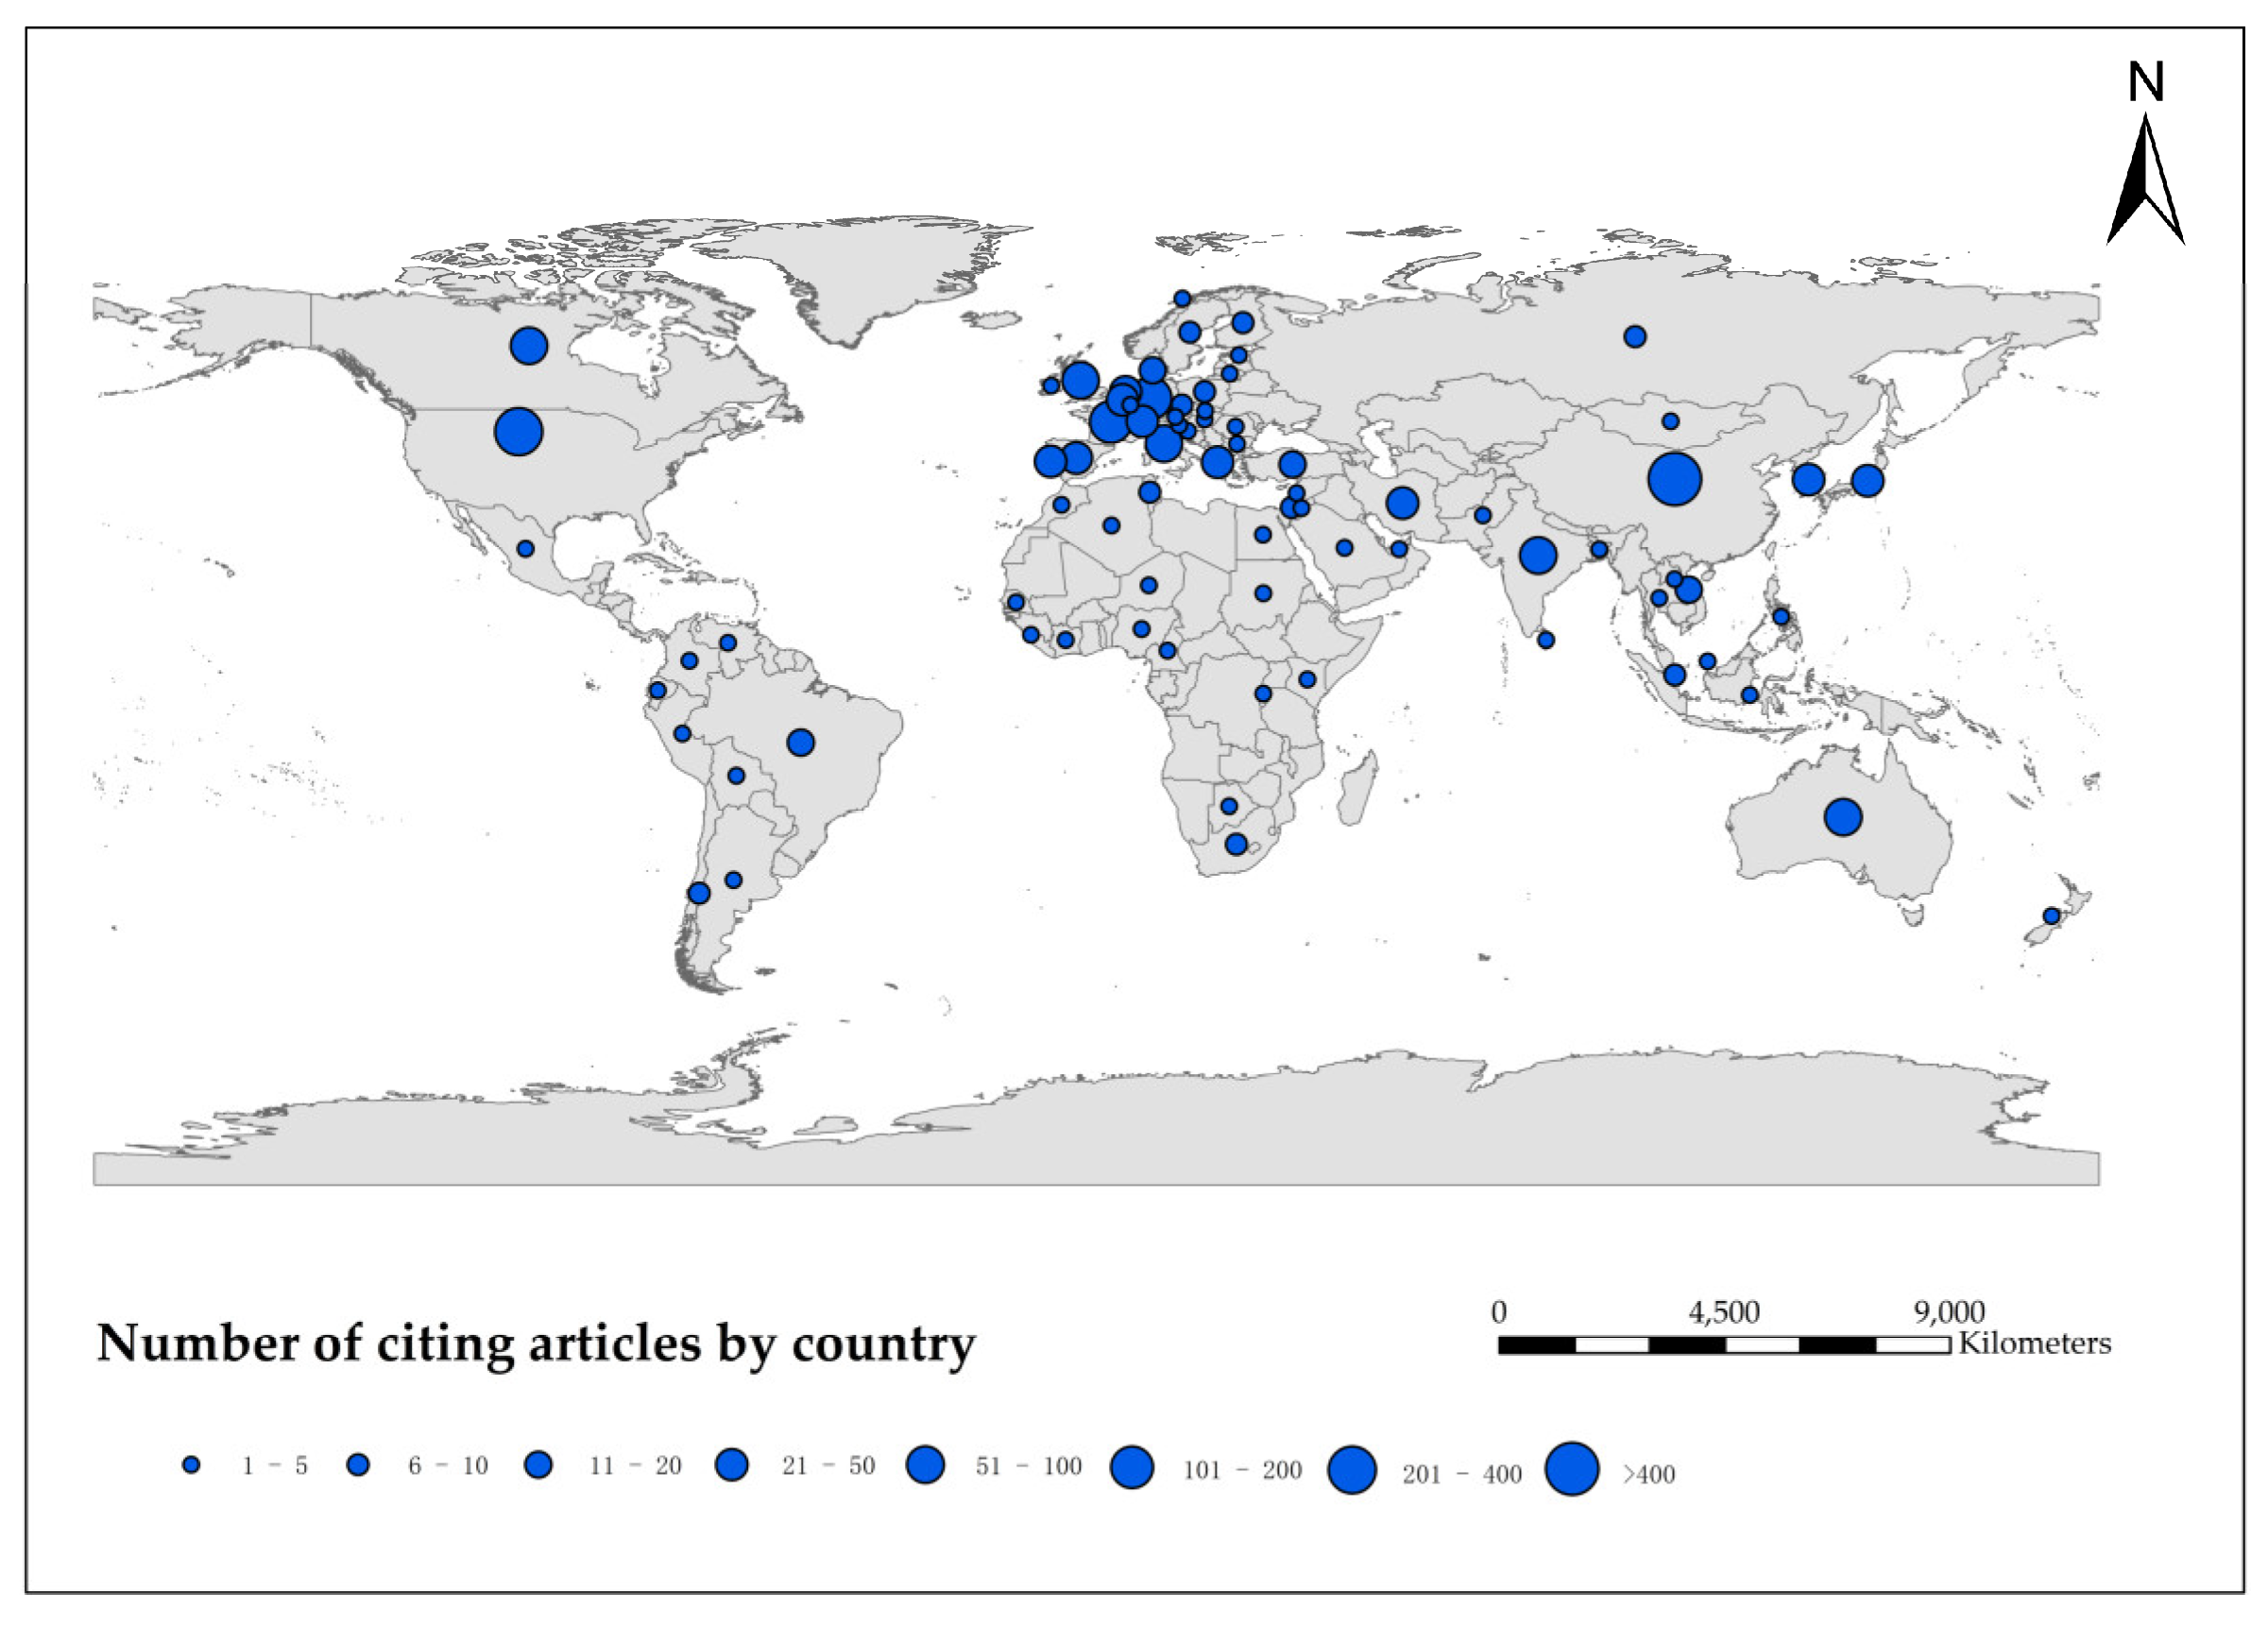
Significant differences exist in academic output contributions among countries in the field of DTC models. Figure 2 presents the number of citing articles from 2000 to 2025 across countries worldwide, revealing the spatial distribution characteristics of this research.
As illustrated in Figure 2, Europe, North America, and East Asia are the three regions with the largest numbers and highest densities of citing articles, forming the main research agglomeration areas. Research outputs have also been observed in most countries worldwide, indicating that this research field has a relatively broad influence. This distribution pattern is closely related to the long-term accumulation of remote sensing infrastructure, the establishment of long-term flux observation networks, and extensive land surface process research in these regions. Europe, North America, and East Asia also host numerous universities and research institutions, where international academic collaboration is relatively active. These factors exhibit strong spatial consistency with the distribution of DTC model research. Among these regions, the number of citing articles from China and the United States far exceeds that from other countries and regions, which is consistent with their sustained investments in satellite remote sensing constellations, large-scale ecological and environmental observation programs, and interdisciplinary research funding.

2.2.3. Research Hotspots and Development Trends

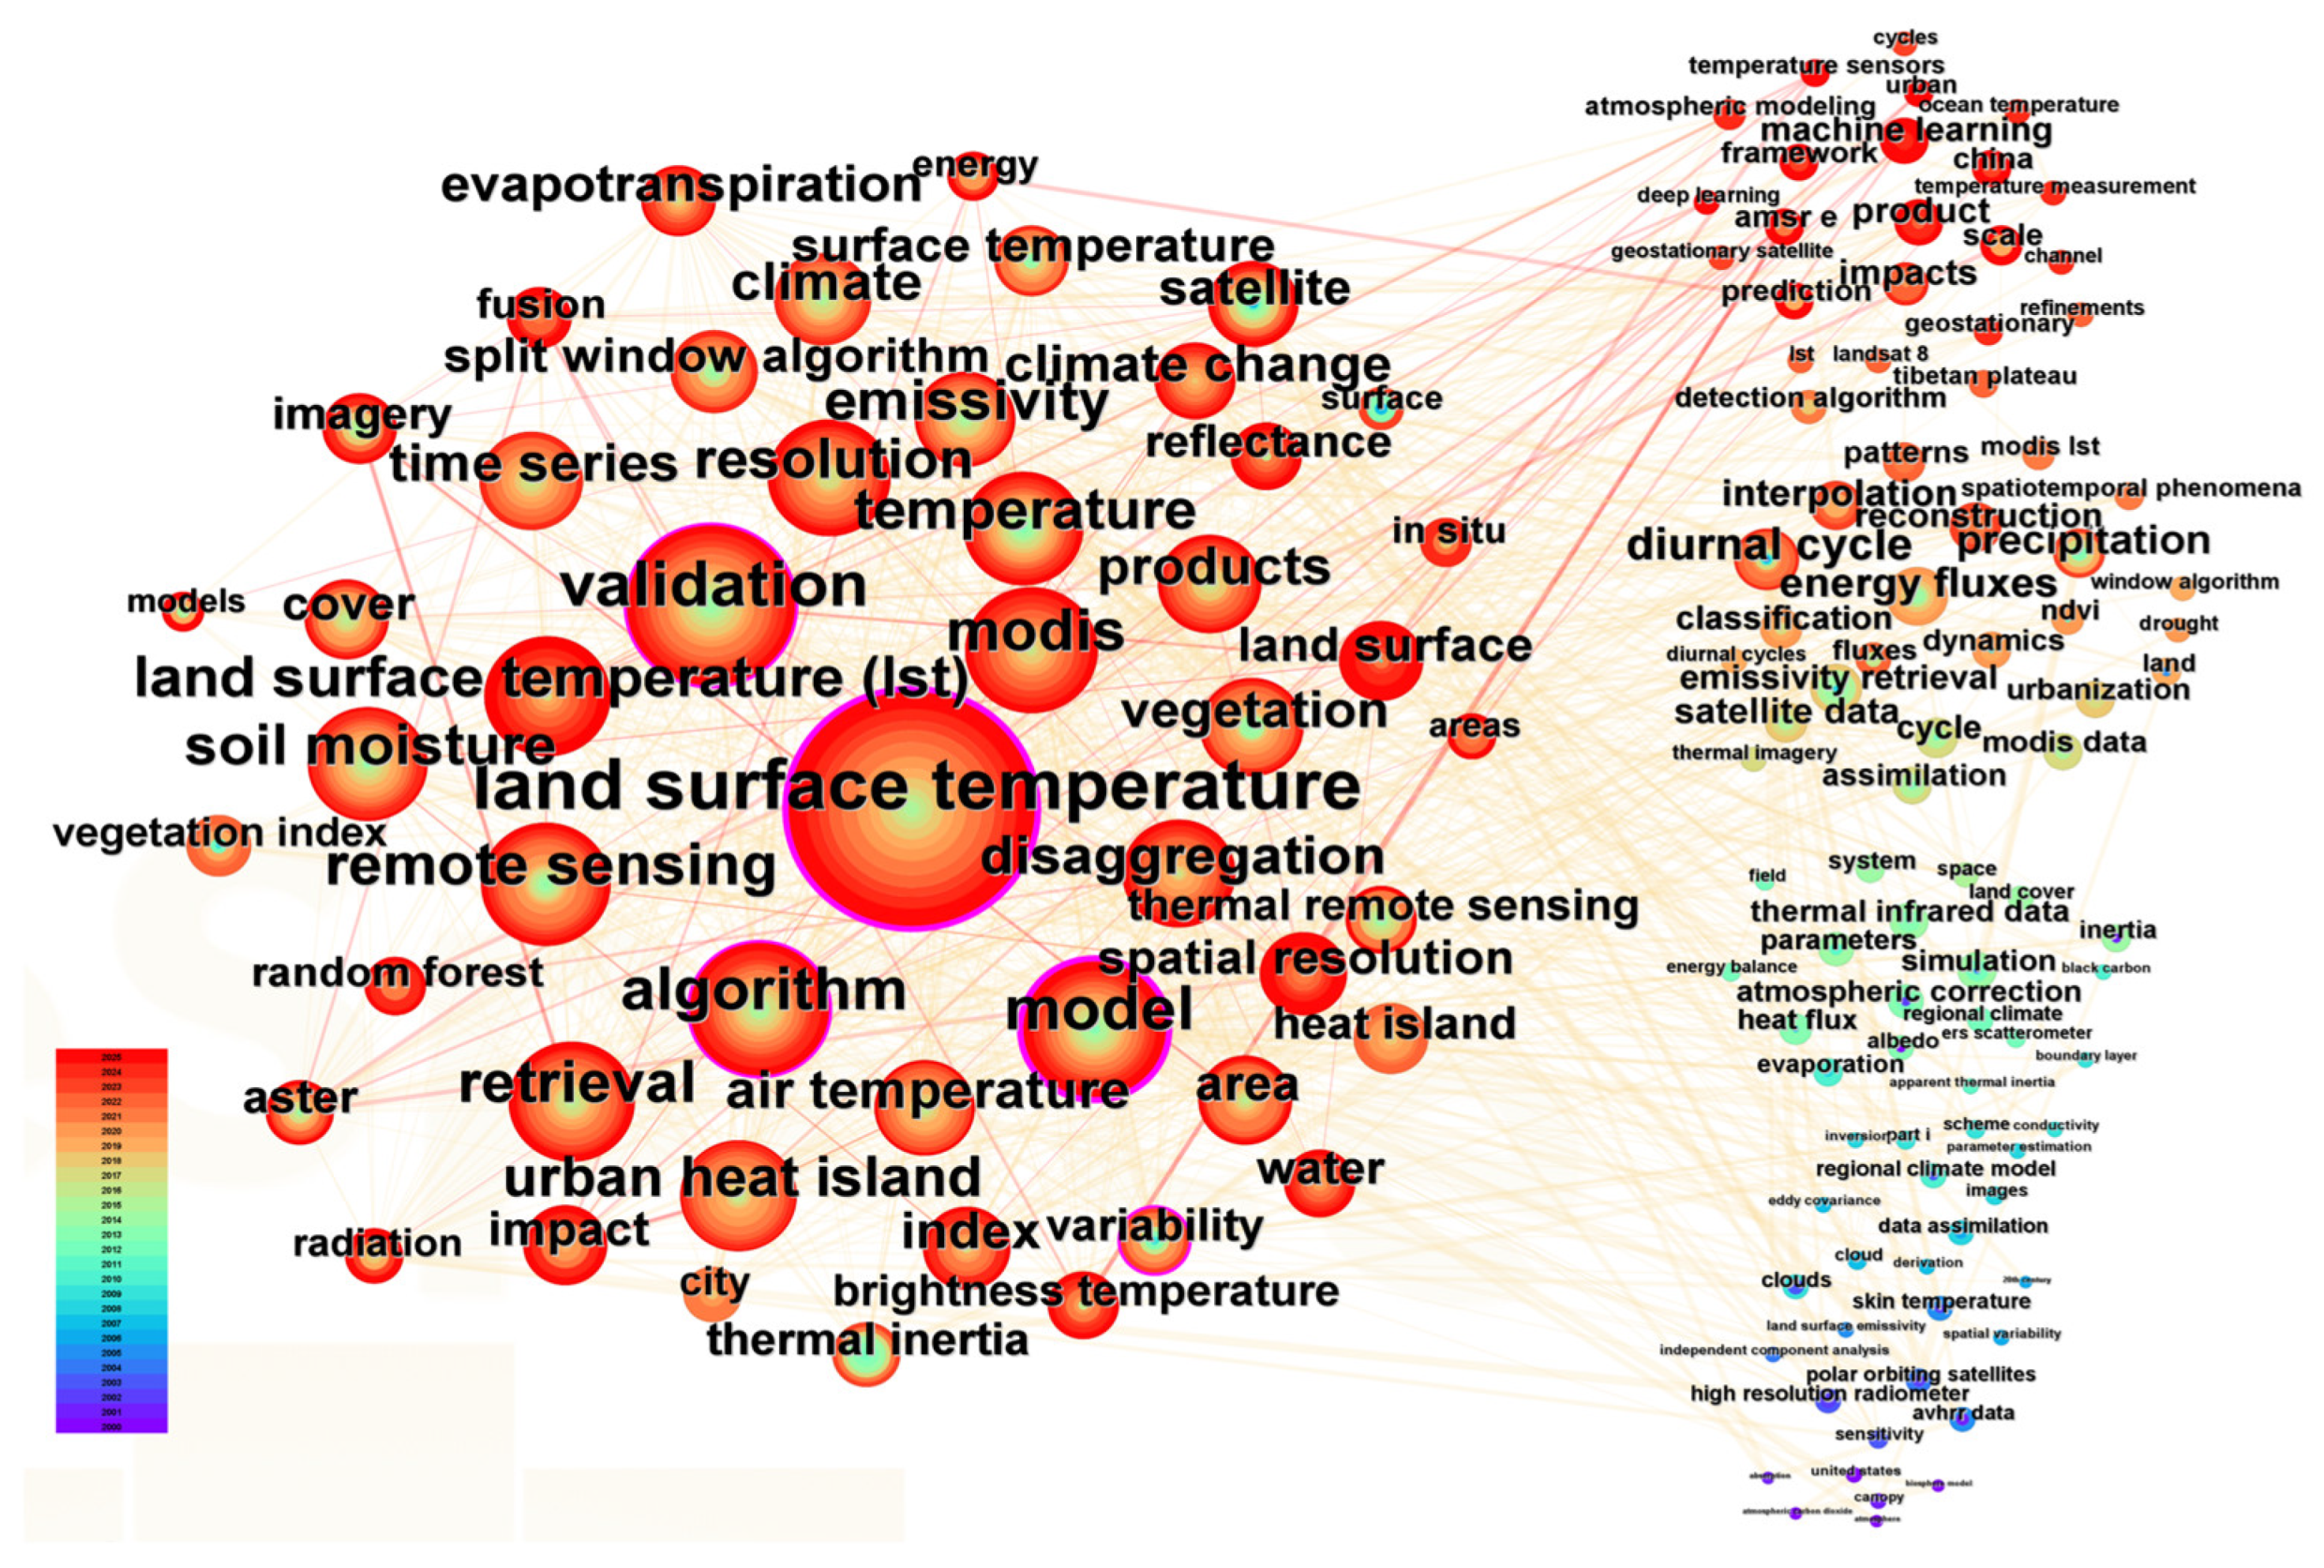
According to the keyword clustering analysis (Figure 3) and the application scenario summary (Table 1), research on the DTC model has evolved into a system that closely integrates methodological studies with practical applications.
In fundamental research, studies have long focused on the physical mechanisms of land surface temperature, surface emissivity characterization, and thermal infrared retrieval methods. Drawing on classic remote sensing data (polar orbiting satellites, AVHRR, MODIS) and ground observations, along with established techniques such as the split window algorithm and independent component analysis, researchers have gradually built a robust theoretical and technical framework. This foundation has provided critical support for improving the accuracy and physical consistency of DTC models. At the application level, research hotspots are highly aligned with practical needs, and the scope of DTC model applications continues to expand. These models are now widely used in disaster and thermal anomaly monitoring, land surface parameter inversion, ecohydrological monitoring, urban thermal environment analysis, climate and atmospheric process simulation, astronomical and planetary exploration, and even public health and socioeconomic remote sensing. The depth and breadth of applications continue to increase, exhibiting strong applicability across diverse scenarios.
From a temporal perspective, relevant research shows distinct phased evolution. Early studies concentrated on basic parameter inversion, radiometric calibration, and thermal data preprocessing, laying a foundation for temperature simulation. Mid-stage research focused on land surface energy processes, regional environmental responses, and multi-source data fusion, advancing practical applications in parameter retrieval and disaster monitoring. In recent years, with the refinement of time-series reconstruction, spatial interpolation, and downscaling methods, as well as the adoption of machine learning and high-temporal-resolution satellite data, research has become increasingly refined and quantitative. Emerging research directions include fine-scale urban thermal analysis, land–atmosphere interaction, and planetary environmental simulation.
Overall, DTC models have evolved from basic temperature-fitting methods to essential tools for continuous temperature observation and land surface process analysis. While the theoretical foundation continues to strengthen, research is advancing toward higher accuracy, finer temporal resolution, and interdisciplinary integration, indicating strong potential for future development and innovation. Meanwhile, the systematic bias introduced by the isotropic surface assumption of traditional models is becoming increasingly prominent as the demand for higher accuracy grows.

3. Limitations of the Traditional DTC Models Under the Isotropic Assumption and Improvement Strategies

3.1. Core Limitations of DTC Models

Although the DTC models have been widely applied in various fields, they still exhibit significant limitations in theoretical assumptions, physical mechanisms, and data adaptability. These limitations make it difficult for DTC models to meet the demands of high-precision, all-weather, and complex surface scenarios.
In practical applications based on satellite remote sensing observations, most DTC models that directly use remotely sensed LST data as input fail to avoid systematic biases caused by viewing directionality. The traditional DTC models are generally built on the idealized assumption of isotropic surface thermal radiation, meaning that the sensor viewing angle does not affect the measured land surface temperature. However, real surfaces possess three-dimensional structures and non-isothermal characteristics. Within the field of view, components such as sunlit soil, shaded soil, sunlit vegetation, and shaded vegetation vary significantly with viewing angle. This variation leads to pronounced apparent temperature differences for the same pixel under different viewing directions [37,38,127,128]. When the viewing direction aligns with the solar direction, the proportion of high-temperature sunlit components increases, causing a hotspot effect [129,130,131]. This phenomenon was confirmed as early as 1962 [132]. Subsequent studies have shown that angle-induced temperature differences can reach 16 K over vegetation canopies [33] and 10 K over urban areas [34,133]. Because traditional models do not account for angular effects, they exhibit marked systematic biases over heterogeneous surfaces such as urban areas, sparse vegetation, and mixed grasslands, while maintaining higher accuracy only over homogeneous surfaces like croplands and contiguous built-up areas [40,82,88,90]. Several methods for correcting thermal radiation directionality have been developed, including radiative transfer models, geometric models, mixture models, and kernel-driven models.
Furthermore, existing DTC models are generally constrained by the clear-sky assumption and fail to handle land surface temperature variations under cloudy conditions. This limitation severely restricts their applicability under cloud cover. Physical models are mostly built on clear-sky energy balance and can hardly reflect the radiative perturbations caused by cloud obscuration. Clouds cause extensive loss of thermal infrared observations and directly alter the surface energy budget and the diurnal temperature pattern, rendering the original DTC structure invalid. Although data-driven models can perform interpolation and gap filling using historical samples, they are heavily dependent on the quantity and representativeness of training data [134]. Moreover, high-quality LST samples under cloudy conditions are difficult to obtain, which further limits the generalization capability of statistical models.
Regarding model structure, there is an inherent contradiction between the number of parameters and the observational constraints. For semi-empirical DTC models, the five- or six-parameter versions can achieve high accuracy. However, reducing them to four-parameter models to fit polar orbiting satellite observations (only four per day) inevitably sacrifices accuracy. Furthermore, the performance of different reduction strategies varies with the data. For quasi-physical models (such as the GEM framework), the number of parameters can be flexibly adjusted from 2 to 12. In general, more parameters lead to higher accuracy, while achieving high accuracy necessitates dense observations (e.g., from geostationary satellites). When only four daily observations from polar orbiters are available, only low-parameter versions can be used, and their accuracy is limited by the observation count.
In addition, the simulation accuracy of DTC models relies heavily on the quality of the input LST data [89,93]. If the original LST contains systematic biases or noise, these errors are directly propagated to the fitted results. Although using official LST products with quality control flags can effectively improve reliability, they still cannot eliminate the inherent angular bias.

3.2. An Effective Approach to Enhancing Model Accuracy Is to Incorporate Angular Effects

Among the many limitations discussed above, the thermal radiation directionality problem is fundamentally different. Issues such as parameter settings, data quality, and clear-sky dependence can be progressively improved through parameter optimization, quality control, and the introduction of auxiliary data (e.g., passive microwave data, reanalysis data) or multi-source fusion, thereby enhancing model-fitting accuracy and applicability. In contrast, directional effects originate from the inherent coupling between three-dimensional surface structure and sensor viewing geometry. Surface temperature observations are strongly coupled with both temporal and angular effects, yet existing thermal infrared satellite products and traditional DTC models typically assume isotropy, neglecting these directional effects. This leads to significant discrepancies in temperature data across different observation angles, particularly over heterogeneous surfaces, directly compromising the spatiotemporal consistency of DTC model inputs and limiting model accuracy under complex surface conditions. The isotropic assumption of traditional DTC models cannot be eliminated by simple parameter adjustments or data preprocessing. It is therefore necessary to explicitly incorporate the angular dimension into the model structure and achieve joint modeling of temporal and angular effects [4,36]. This approach resolves the systematic errors caused by TRD and improves model adaptability and accuracy over complex surfaces. Therefore, coupling angular effects is a promising approach to overcome the accuracy bottleneck of traditional DTC models and has become an important research direction in this field in recent years.

4. Research Progress on DTC Models for Coupling Angular Effects

4.1. Early Attempts to Correct Angular Effects Based on Simple Component Decomposition

In the early 2010s, scholars attempted to integrate temporal and angular effects by incorporating the DTC model into a linear model for directional component decomposition to reduce the influence of observation angle. Quan et al. [102] combined the DTC model with a linear temperature mixture model (LTMM), whereas Duan et al. [82] combined it with a mixing model (DLHM). This approach not only addresses the DTC model’s requirement for at least four daily observations but also treats the DTC of a mixed pixel as a weighted linear combination of component DTCs. Subsequently, Liu et al. [103] proposed a method (hereafter referred to as the LIU2020 model in this study) based on the DTC model and spatial correlations. By leveraging multipixel and multitemporal data, this method enables the separation of soil and vegetation component temperatures at any given time, thereby effectively addressing the directional effects on surface temperature. The LIU2020 model builds on the mixed-pixel surface temperature model proposed by Norman et al. [135] to describe the relationship between mixed-pixel LST and vegetation/soil temperatures, emissivity, and the vegetation cover fraction. It also employs the DTC model to characterize the diurnal variation patterns of individual component temperatures. This reveals the relationship between diurnal surface temperature variations, environmental conditions, and heterogeneous surfaces, providing a basis for studies of regional thermal environment change. However, both models consider only temperature differences caused by object radiative properties. They fail to account for shading and illumination differences caused by the surface’s three-dimensional structure. Consequently, they provide insufficient correction for the directionality of thermal radiation.

4.2. Kernel-Driven Coupling Model with Enhanced Physical Mechanisms

In recent years, to more accurately characterize the spatiotemporal dynamics of LST, researchers have focused on addressing the core need for “temporal–angular effect synergy” by integrating kernel-driven (KD) models of thermal radiation directionality with DTC models [136,137,138]. Unlike previous models that solely considered differences in the radiative properties of land surfaces, these models further incorporated thermal radiation variations between the illuminated and shaded components caused by the three-dimensional structure of the surface. This enables a more realistic and accurate description of the dynamic process of surface temperature variation with time and angle at the physical mechanism level. Simultaneously, by coupling time and angle effects and precisely fitting hotspot phenomena, the fitting results more closely resemble the true dynamic changes in surface temperature.

4.2.1. GUTA-T Model

The application of remote sensing techniques and the DTC model in urban thermal environment research has been multifaceted [139,140,141]. These methods provide crucial support for understanding the patterns of urban thermal environmental changes, optimizing urban planning, and addressing climate change. Their core function lies in simulating and analyzing the diurnal variations in urban surface temperatures to reveal the dynamic characteristics of the urban thermal environment, thereby offering a scientific basis for related decision-making. However, these studies did not account for urban surface anisotropy (UTA) during satellite observations. The complex three-dimensional structure of urban building surfaces, coupled with the variability in materials and their thermal properties, makes this effect particularly pronounced over time.
The GUTA (Geometric model to simulate urban thermal anisotropy) series of models is a geometric modeling system developed for urban land surface thermal radiation directionality. Its core advantage lies in covering urban scenes of different densities through differentiated adaptation of sub-models. Based on key morphological parameters such as building aspect ratio (h/w) and plan density (λp), the models are systematically divided into three sub-models: GUTA-sparse [142], GUTA-osg [143], and GUTA-dense [144], corresponding to sparse, medium-density, and high-density urban areas, respectively. Each sub-model follows a unified linear framework consisting of kernel coefficients and kernel functions:
T θ s , θ v , φ   =   T nadir + f i s o · k i s o θ s , θ v , φ + f o r i · k o r i θ s , θ v , φ + f s h w · k s h w θ s , θ v , φ
In Equation (1), the geometric parameters θs, θv, and φ represent the solar zenith angle, viewing zenith angle, and relative azimuth angle between the sun and the sensor, respectively. These three parameters jointly determine the observation geometry and serve as key inputs for kernel function calculations. The kernel coefficients are as follows: fiso represents the temperature difference between shaded walls and illuminated ground; fori represents the temperature variation amplitude of walls with different orientations; and fshw represents the temperature difference between shaded and illuminated ground. Together, these three coefficients quantify the temperature differences among various urban components and are the core driving factors of thermal anisotropy. The kernel functions kiso, kori, and kshw are defined as follows: the isotropic kernel (kiso) characterizes the angle-independent background temperature contribution of walls; the orientation kernel (kori) captures angle-dependent radiation differences of walls with different orientations; the shadow kernel (kshw) quantifies the radiation contribution of ground shadow areas as a function of viewing angle. Tnadir is the temperature in the nadir direction. The kernel functions of the GUTA model submodels differ and should be selected based on the specific application scenario.
Subsequently, Wang et al. [136] proposed an improved kernel-driven model system, GUTA-T (GUTA-T-sparse/sog/dense), based on the relationship between solar zenith angle and land surface temperature under clear skies. This model parameterizes the kernel coefficients fiso, fori, and fshw in the original model using trigonometric functions that characterize the diurnal variation in the solar zenith angle:
T θ s , θ v , φ   =   T nadir + a sw - ig c o s θ s k iso θ s , θ v , φ + a w s i n 2 θ s k ori θ s , θ v , φ + a sg - ig c o s θ s k shw θ s , θ v , φ
In Equation (2), asw-ig, aw, and asg-ig are model coefficients that describe the diurnal variation processes of the temperature difference between the shaded and illuminated surfaces, the temperature difference between walls of different orientations, and the temperature difference between shaded and illuminated ground surfaces. By relating the temperature difference between shaded and illuminated surfaces to the trigonometric functions of the solar zenith angle, the GUTA-T model captures the temporal dynamics of urban surface temperatures and thermal radiation directionality. It effectively simulates diurnal and seasonal variations, serving as a crucial complement to the DTC model in urban thermal environment studies, and functioning as an efficient tool for urban climate research.
Wang et al. [145] systematically evaluated the GUTA-T model using three parameter determination schemes: forward simulation based on TUF-3D component temperatures (Scheme #1), inversion from known anisotropy (Scheme #2), and inversion from multi-angular MODIS LSTs (Scheme #3). Independent airborne measurements over Toulouse (five flights, effective anisotropy amplitude ~11.9 K) were used for validation. The root mean square errors (RMSEs) between simulated and measured anisotropy were 1.5 K (Scheme #1, TUF-3D), 1.3 K (Scheme #1, field data), 1.2 K (Scheme #2), and 1.0 K (Scheme #3), indicating that the model can capture urban thermal anisotropy with high accuracy, especially when calibrated with multi-angular satellite data.

4.2.2. TEKDM Model

Qin et al. [137] proposed a method that combines a semi-empirical diurnal DTC model with a kernel-driven TRD model, termed TEKDM. The core objective of this model is to address the spatiotemporal inconsistency of LST data caused by thermal radiation anisotropy in remote sensing observations, thereby providing an accurate and efficient technical solution for the angular normalization of multi-satellite LST products. The specific model expression is as follows:
D R T θ s t , θ v t , Δ φ t   =   f iso t + f LSF t · K LSF θ v t + f Chen t · K Chen θ s t , θ v t , Δ φ t ,   B
f iso t = T 0 + T a cos π ω t t m             t sr t t ss
f LSF t = D · f iso t
f Chen t = A · f iso t
K L S F θ v = 1 + 2 c o s θ v 0.96 + 1.92 c o s θ v 1 4 c o s θ v 1 + 2 c o s θ v + 0.15 1 e 0.75 c o s θ v 1.0304
K C h e n θ v , θ s ,   Δ φ ,   B = e ξ θ v , θ s ,   Δ φ ,   B π · B
ξ θ v , θ s ,   Δ φ ,   B = a r c c o s c o s θ v · c o s θ s + s i n θ v · s i n θ s · c o s Δ φ
In Equations (3)–(9), DRT(θs(t), θv(t), Δφ(t)) represents the directional thermal radiation temperature, where θs denotes the solar zenith angle, θv represents the viewing zenith angle, Δφ is the relative azimuth angle, D and A are kernel-driven model coefficients, and B is the hotspot width. T0, Ta, tm, ω, tsr, and tss are DTC parameters, representing the residual temperature around sunrise, temperature amplitude, time of maximum temperature, half-period width, sunrise time, sunset time, and t is the local time, respectively. The parameter t denotes the local time.
The TEKDM model is based on the LSF-Chen model within the general framework of kernel-driven models proposed by Cao et al. [146]. By linearly combining the isotropic kernel, the gap fraction kernel (LSF kernel), and the hotspot kernel (Chen kernel), it fully quantifies the two core driving factors of TRD. The gap fraction effect, which arises from the difference in the visible proportions of vegetation and soil components due to changes in viewing angle, and the hotspot effect. To achieve coupled simulation of temporal and angular effects, the model parameterizes the kernel coefficients in the temporal dimension. The isotropic kernel coefficient fiso(t) is described by a diurnal temperature cycle (DTC) model in the form of a cosine function, representing the baseline temperature in the nadir viewing direction. The gap fraction kernel coefficient fLSF(t) and the hotspot kernel coefficient fChen(t) are linearly linked to fiso(t) through coefficients D and A, respectively, enabling dynamic adaptation of the effect intensities.

4.2.3. VT-KDTC Model

Bian et al. [138] decomposed surface temperature variations into temporal and angular components and proposed a combined visible thermal envelope method (VT-KDTC), which integrates the KD and DTC models to account for surface structural and thermal factors, respectively. In this model, the thermal coefficients of the temporal components (fVI, fBF, and fiso) were simulated using the DTC model, which allowed them to vary dynamically on a daily scale under meteorological forcing. Conversely, the angular components, the vegetation index (VI) and brightness factor (BF), were treated as time-invariant, and their directional anisotropy was simulated via the KD model. The synthesis of these temporal and angular elements yields the complete VT-KDTC model.
T θ v , θ i , φ , t =   f VI t · V I θ v , θ i , φ + f BF t · B F θ v , θ i , φ + f iso , t
VI = ρ NIR ρ red ρ NIR + ρ red
B F = ρ NIR + ρ red 2
For the angular effect section, the combination of Ross–Thick and Li–Sparse–Reciprocal kernels was employed to simulate the angular variation characteristics of the VNIR reflectance as follows:
ρ θ i , θ v , φ   =   f iso + f geo λ · k geo θ i , θ v , φ + f vol λ · k vol θ i , θ v , φ
k g e o θ s , θ v , φ = 1 + c o s ξ s e c θ v s e c θ s s e c θ v + s e c θ s O θ s , θ v 2
k v o l θ s , θ v , φ = π 2 ξ c o s ξ + s i n ξ c o s θ s + s i n θ v π 4
O θ s ,   s e c θ v , t = 1 π t s i n t · c o s t s e c θ s + s e c θ v
c o s t = h b · D 2 + t a n θ s t a n θ v s i n Δ φ 2 s e c θ s + s e c θ v
D = t a n 2 θ s + t a n 2 θ v 2 t a n θ s t a n θ v c o s Δ φ
c o s ξ = c o s θ s c o s θ v + s i n θ s s i n θ v c o s Δ φ
θ s =   t a n 1 b r t a n θ s
θ v = t a n 1 b r t a n θ v
Δ φ = φ s φ v
For the time effect analysis section, the thermal coefficients fVI, fBF, and fiso of the VT-KDTC are parameterized using the DTC model:
f VI t   =   T 0 ,   vi + T a ,   vi c o s π ω t t m ,   vi
f BF t = T 0 ,   bf + T a ,   bf cos π ω t t m ,   bf
f tiso t =   T 0 ,   tiso + T a ,   tiso c o s π ω t t m ,   tiso
In Equations (10)–(25), VI(θv, θi, φ) is the vegetation index, representing surface vegetation coverage and reflecting changes in the proportion of vegetation within the field of view at different observation angles; BF(θv, θs, φ) is the brightness factor, used to reflect surface reflectance characteristics; fVI, fBF, and fiso are thermal coefficients that must satisfy the condition tsrttss during DTC parameterization, consistent with the TEKDM model; kgeo and kvol represent angular kernels reflecting soil and vegetation temperatures, respectively, and a hotspot kernel reflecting solar illumination; ρNIR and ρred denote reflectance in the near-infrared and red bands. The VT-KDTC model, which integrates the KD and DTC approaches, effectively simulates spatiotemporal variations under diverse conditions, achieving significantly improved accuracy compared with the original DTC model. Its framework relies primarily on the vegetation index VI and brightness factor BF to establish connections between VNIR and TIR data, making it more suitable for areas with high vegetation coverage. However, its effectiveness is limited in bare ground or sparsely vegetated urban areas.

4.3. Discussion

4.3.1. Comparative Analysis of the Coupled Models

Although all the aforementioned angular-coupled DTC models aim to simultaneously characterize diurnal variations and thermal radiation anisotropy of land surface temperature under clear-sky conditions, they differ substantially in model formulation, physical representation, and application scope, leading to distinct advantages and inherent limitations. As summarized in Table 2, such differences span multiple key dimensions, including physical assumptions, input data requirements, parameter complexity, and validation strategies. A systematic comparison of these characteristics enables the uncovering of the fundamental trade-offs between physical interpretability, data availability, and scenario adaptability that underpin the development of angular-coupled DTC models.
Based on Table 2, the coupled models can be compared from the following aspects. From the perspective of physical assumptions, DLHM and LIU2020 assume that pixel-level LST is a linearly weighted mixture of component DTCs. This treatment inherently neglects three-dimensional shading and the hotspot effect, which are key manifestations of thermal anisotropy. The simplicity of these models enables full diurnal cycle (day-night) simulation, but it also causes the most significant directional features to be omitted. In contrast, GUTA-T, VT-KDTC, and TEKDM explicitly model the hotspot. Among them, GUTA-T parameterizes component temperature differences as trigonometric functions of the solar zenith angle. This parameterization reproduces the diurnal trend of LST reasonably well but fails to capture phase lags caused by thermal inertia, a limitation confirmed by its airborne validation. VT-KDTC links angular variations to the time-invariant vegetation index (VI) and brightness factor (BF). This design means that the model is mainly suitable for densely vegetated areas and performs less effectively over bare soil or sparsely vegetated regions. TEKDM explicitly separates the gap fraction and the hotspot effects and achieves high-fidelity angular simulation. However, TEKDM assumes that the hotspot width B remains constant within the day, a simplification that lacks strong physical justification, especially under rapidly changing solar illumination.
In terms of data requirements and parameter complexity, DLHM requires only multispectral data and multi-temporal LST (e.g., from MODIS). This makes DLHM suitable for large-scale applications. However, the number of parameters in DLHM increases linearly with the number of days and components, which renders the model impractical for long time series. LIU2020 uses 12 parameters, but its sensitivity to the spatial variability of fractional vegetation cover (FVC) limits its robustness. GUTA-T uses only three parameters, but it relies on high-resolution urban morphological parameters (h/w, λp) that are difficult to obtain globally. VT-KDTC requires multi-angle VNIR reflectance, and TEKDM requires multi-temporal and multi-angle LST. Both requirements restrict the use of these models to regions with overlapping satellite coverage. TEKDM’s seven parameters offer a relatively balanced complexity, but the model is daytime-only and requires at least four clear-sky observations per day from two different viewing angles (e.g., the overlapping zone of GOES-16 and GOES-17). This requirement limits the applicability of TEKDM to areas covered by multiple geostationary satellites.
Regarding validation rigor, GUTA-T is validated using independent airborne multi-angular measurements (five flights over Toulouse, effective anisotropy amplitude ~11.9 K). The validation yields an RMSE of 1.0–1.5 K, which directly demonstrates the model’s ability to simulate urban thermal anisotropy. TEKDM is validated using DART-simulated data (RMSE 0.36 K) and in situ measurements from ten AmeriFlux sites. After angular normalization, the RMSE of GOES-17 LST decreased from 2.6 K to 1.7 K, confirming the effectiveness of TEKDM’s angular correction. VT-KDTC is tested using 12 in situ sites and SCOPE-simulated data. Compared to a DTC model that considers only temporal variations, the overall LST simulation accuracy improves from an RMSE of 0.70 K to 0.42 K. This improvement demonstrates the contribution of coupling angular information to enhancing LST reconstruction. DLHM and LIU2020 rely on cross-validation using simulated data and satellite products (e.g., S-VISSR, SEVIRI). Their ground-based validation remains relatively limited.

4.3.2. Application Limitations of Existing Models

The current research on angular-coupled DTC models remains at an early stage, and their practical applications face multiple constraints. Although physics-based kernel-driven coupling models (e.g., GUTA-T and TEKDM) can simulate land surface temperature variations with high accuracy, they also impose significant practical limitations.
First, these models typically rely on synchronous multi-angle observations from multiple satellites to calibrate kernel function parameters. For example, TEKDM requires at least four clear-sky observations per day from two different viewing angles, such as the overlapping zone of GOES-16 and GOES-17. This dependency makes the models difficult to apply over vast global regions where satellite overlap is absent, severely restricting their scalability.
Second, model construction assumes clear-sky conditions without clouds. This assumption necessitates the exclusion of atmospheric scattering and cloud cover interference in LST observations, leading to limited applicability under complex weather conditions such as cloudiness or rain. Consequently, the models cannot capture the radiative effects of clouds (daytime cooling and nighttime warming), which fundamentally alter diurnal temperature patterns.
Third, the coarse spatial resolution of geostationary satellites (typically 2–5 km) makes it difficult to capture fine-scale thermal heterogeneity at the surface. This limitation hinders their utility for applications that require high spatial detail, such as urban micro-scale thermal environment studies, precision agriculture, or local climate zone analysis.
Fourth, robust validation across diverse scenarios and scales remains lacking. Most existing validations rely heavily on simulated data or a limited number of in situ sites. Few studies have systematically assessed model performance under different land cover types, climate zones, or spatial resolutions. The lack of comprehensive, multi-scale validation undermines confidence in the generalizability of these models.
Most of these coupled models are constructed based on semi-empirical DTC models and therefore share similar limitations with the original models. For instance, they are built on the premise of clear-sky conditions, necessitating the exclusion of atmospheric scattering and cloud cover interference in LST observations, resulting in limited applicability under complex weather conditions such as cloudiness or rain.
The current research remains in its infancy, with practical applications facing numerous constraints and lacking robust validation across diverse scenarios and scales. Although physics-based kernel-driven coupling models can accurately capture real surface temperature variations with higher fitting precision, they impose significant practical limitations. These models typically rely on synchronous multi-angle observations from multiple satellites to calibrate the kernel function parameters, making it difficult to adapt to vast regions globally where satellite overlap is absent. Model construction assumes “clear skies without clouds,” necessitating the exclusion of atmospheric scattering and cloud cover interference in LST observations, resulting in limited applicability under complex weather conditions, such as cloudiness or rain. Additionally, the coarse resolution of geostationary satellites makes it difficult to capture fine-scale thermal heterogeneity at the surface.

4.3.3. Future Research Directions

Cloud cover-induced missing thermal infrared data are a major obstacle to all-weather applications of DTC models. Passive microwave (PMW) remote sensing can penetrate clouds to retrieve land surface temperature, but its spatial resolution is relatively coarse. Wu et al. [147] developed a two-step deep learning framework (TDLF) that first fills orbital gaps in PMW data using a convolutional neural network and then fuses the gap-filled PMW land surface temperature (LST) with thermal infrared (TIR) data using a generative adversarial network, achieving promising accuracy over China. Subsequently, Jia et al. [46] integrated data from multiple geostationary and polar-orbiting satellites to generate the first global hourly, 5 km resolution all-sky LST product. More recently, Song et al. [148] fused PMW data from two polar-orbiting satellites (FY-3D and FY-3F) to further enhance global intraday LST coverage. Xiong et al. [95] utilized the FengYun-3 microwave radiation imagers (MWRI) to achieve all-weather diurnal LST measurements, demonstrating that their multi-satellite constellation can effectively reconstruct the diurnal temperature cycle under cloudy conditions [149]. Future research should further explore multi-source data fusion strategies, including the synergistic use of microwave, thermal infrared, reanalysis, and geostationary data, while developing bias correction and spatial downscaling techniques to overcome systematic discrepancies and spatiotemporal scale mismatches between different data sources, thereby enabling truly all-weather, high-resolution diurnal temperature cycle modeling.
Compared with semi-empirical DTC models, data-driven models demonstrate superior practicality and environmental adaptability [73]. Some researchers have employed advanced machine learning techniques to directly learn nonlinear statistical relationships between LST and various readily available parameters from extensive historical observation datasets [150,151]. These models effectively capture dynamic surface temperature variations while exhibiting greater flexibility in observational conditions and maintaining reasonable simulation accuracy even under complex weather or sparse data scenarios. For instance, the ALIVE framework was extended using Long Short-Term Memory (LSTM) networks and Gradient Boosting Regressor (GBR) to estimate near-real-time LST under both clear and cloudy conditions at a five-minute resolution, achieving good accuracy [152]. Yu et al. [153] developed a solar zenith angle calibration method (SZAC) that uses the cosine of the solar zenith angle as a proxy for incoming surface solar radiation to statistically correct daytime systematic biases in LST products from different satellite platforms. Furthermore, Xia [154] proposed a physics-constrained deep learning hybrid model that incorporates a physical loss function into a convolutional neural network for retrieving surface temperature under non-precipitation clouds, demonstrating superior generalization ability. The LFSR framework further demonstrates that integrating multi-source data (MODIS LST and CLDAS LST) with deep learning can generate gapless all-weather LST with satisfactory accuracy and spatial consistency [149].
Future research should further explore hybrid methods that combine the advantages of data-driven and physics-based DTC models [73], and extend this hybrid modeling concept to DTC models that couple angular effects. The core idea is to leverage, on one hand, the physical interpretability of such models to ensure that temperature variation patterns align with fundamental physical principles such as energy balance and, on the other hand, to harness the strong fitting capability and data adaptability of machine learning to reduce reliance on multi-angle synchronous observations, thereby enhancing model applicability in complex scenarios such as cloudy weather or regions without satellite overlap.

5. Conclusions and Prospects

Traditional DTC models are widely used in various fields such as disaster monitoring, eco-hydrological simulation, and environmental monitoring by generating continuous temperature sequences to fill observational data gaps. However, these traditional DTC models uniformly neglect the impact of thermal radiation directionality, which is the fundamental reason for their insufficient fitting accuracy over complex heterogeneous surfaces. Because high-precision applications demand increasingly accurate measurements, this limitation has become a core bottleneck constraining their development. Coupling angular effects represents an effective approach for enhancing DTC model accuracy, with phased progress already being achieved. Models have evolved from simple component corrections to kernel-driven coupling models integrating three-dimensional structures, significantly improving the fitting accuracy over complex heterogeneous surfaces. Current DTC models still exhibit several shortcomings: reliance on clear-sky assumptions limits their applicability under cloudy conditions, the absence of nighttime angular effect corrections, high demands on observational data, and an incomplete model validation system. Collectively, these issues constrain the application and advancement of the models.
To address the current research limitations and align with evolving trends in remote sensing technology and modeling approaches, future DTC model studies can focus on breakthroughs in the following four aspects:
(1) Innovative multi-source data fusion technology integrates data from multiple polar-orbiting and geostationary satellites to construct an accurate, continuous, multi-angle, multitemporal LST. This approach addresses the limitations of single data sources in balancing spatiotemporal resolution and achieving comprehensive coverage. Additionally, supplementary cloud data from microwave remote sensing and other sources are incorporated to overcome observational constraints.
(2) Overcoming challenges in full-time series continuous fitting by refining nighttime angular-effect corrections enables seamless reconstruction of daily LST variations across all time periods to meet demands for continuous temperature data.
(3) Optimizing model architecture and algorithms requires exploring a hybrid “data-driven + physical mechanism” approach. This involves combining the strong fitting capability of machine learning with the high precision of physical models, thereby constructing a coupled framework that balances accuracy and practical applicability.
(4) Strengthening ground observation systems to establish a multi-scale observation network that integrates ground stations and UAVs. Building a comprehensive and reliable model validation dataset to provide robust data support for model accuracy assessment and optimization.
Although current DTC models still confront multiple challenges, including clear-sky dependence, stringent data requirements, insufficient nighttime angular correction, and imperfect validation frameworks, advances in next-generation remote sensing technologies and hybrid modeling methods may provide viable pathways toward all-weather and high-precision applications. Nevertheless, achieving this goal remains a long-term research task. At present, none of the existing angular-coupled DTC models can fully overcome all these limitations simultaneously. Future progress in these research directions is expected to deliver more reliable data support for global climate and ecological monitoring, as well as to promote the further development of LST remote sensing applications.

Author Contributions

Conceptualization, W.L. and L.T.; methodology, W.L. and L.T.; software, W.L. and Y.D.; validation, W.L., H.H. and L.T.; formal analysis, W.L., Y.D. and L.T.; investigation, W.L., L.T. and Q.S.; resources, W.L., H.H. and Q.S.; data curation, W.L., H.H. and Q.S.; writing—original draft preparation, W.L. and L.T.; writing—review and editing, W.L. and L.T.; visualization, W.L. and L.T.; supervision, W.L. and L.T.; project administration, L.T.; funding acquisition, L.T. All authors have read and agreed to the published version of the manuscript.

Funding

This research was funded by the National Natural Science Foundation of China, grant number: 41801234.

Data Availability Statement

No new data were created or analyzed in this study. Data sharing is not applicable to this article.

Conflicts of Interest

The authors declare no conflicts of interest.

References

  1. Anderson, M.; Norman, J.; Kustas, W.; Houborg, R.; Starks, P.; Agam, N. A thermal-based remote sensing technique for routine mapping of land-surface carbon, water and energy fluxes from field to regional scales. Remote Sens. Environ. 2008, 112, 4227–4241. [Google Scholar] [CrossRef]
  2. Wu, P.; Shen, H.; Zhang, L.; Göttsche, F.-M. Integrated fusion of multi-scale polar-orbiting and geostationary satellite observations for the mapping of high spatial and temporal resolution land surface temperature. Remote Sens. Environ. 2015, 156, 169–181. [Google Scholar] [CrossRef]
  3. Li, Z.-L.; Tang, B.-H.; Wu, H.; Ren, H.; Yan, G.; Wan, Z.; Trigo, I.F.; Sobrino, J.A. Satellite-derived land surface temperature: Current status and perspectives. Remote Sens. Environ. 2013, 131, 14–37. [Google Scholar] [CrossRef]
  4. Li, Z.-L.; Wu, H.; Duan, S.-B.; Zhao, W.; Ren, H.; Liu, X.; Leng, P.; Tang, R.; Ye, X.; Zhu, J. Satellite remote sensing of global land surface temperature: Definition, methods, products, and applications. Rev. Geophys. 2023, 61, e2022RG000777. [Google Scholar] [CrossRef]
  5. Xu, T.; Guo, Z.; Xia, Y.; Ferreira, V.G.; Liu, S.; Wang, K.; Yao, Y.; Zhang, X.; Zhao, C. Evaluation of twelve evapotranspiration products from machine learning, remote sensing and land surface models over conterminous United States. J. Hydrol. 2019, 578, 124105. [Google Scholar] [CrossRef]
  6. Vancutsem, C.; Ceccato, P.; Dinku, T.; Connor, S.J. Evaluation of MODIS land surface temperature data to estimate air temperature in different ecosystems over Africa. Remote Sens. Environ. 2010, 114, 449–465. [Google Scholar] [CrossRef]
  7. Tajfar, E.; Bateni, S.; Lakshmi, V.; Ek, M. Estimation of surface heat fluxes via variational assimilation of land surface temperature, air temperature and specific humidity into a coupled land surface-atmospheric boundary layer model. J. Hydrol. 2020, 583, 124577. [Google Scholar] [CrossRef]
  8. Shen, Y.; Shen, H.; Cheng, Q.; Zhang, L. Generating comparable and fine-scale time series of summer land surface temperature for thermal environment monitoring. IEEE J. Sel. Top. Appl. Earth Obs. Remote Sens. 2020, 14, 2136–2147. [Google Scholar] [CrossRef]
  9. Bright, R.; Davin, E.; O’Halloran, T.; Pongratz, J.; Zhao, K.; Cescatti, A. Local temperature response to land cover and management change driven by non-radiative processes. Nat. Clim. Change 2017, 7, 296–302. [Google Scholar] [CrossRef]
  10. Bechtel, B. A new global climatology of annual land surface temperature. Remote Sens. 2015, 7, 2850–2870. [Google Scholar] [CrossRef]
  11. Fu, P.; Weng, Q. A time series analysis of urbanization induced land use and land cover change and its impact on land surface temperature with Landsat imagery. Remote Sens. Environ. 2016, 175, 205–214. [Google Scholar] [CrossRef]
  12. Chang, Y.; Xiao, J.; Li, X.; Weng, Q. Monitoring diurnal dynamics of surface urban heat island for urban agglomerations using ECOSTRESS land surface temperature observations. Sustain. Cities Soc. 2023, 98, 104833. [Google Scholar] [CrossRef]
  13. Zhang, J.; Tu, L.; Wang, X.; Liang, W. Comparison of Urban Heat Island Differences in the Yangtze River Delta Urban Agglomerations Based on Different Urban–Rural Dichotomies. Remote Sens. 2024, 16, 3206. [Google Scholar] [CrossRef]
  14. Beale, C.; Norouzi, H.; Sharifnezhadazizi, Z.; Bah, A.R.; Yu, P.; Yu, Y.; Blake, R.; Vaculik, A.; Gonzalez-Cruz, J. Comparison of diurnal variation of land surface temperature from GOES-16 ABI and MODIS instruments. IEEE Geosci. Remote Sens. Lett. 2019, 17, 572–576. [Google Scholar] [CrossRef]
  15. Sismanidis, P.; Bechtel, B.; Keramitsoglou, I.; Goettsche, F.; Kiranoudis, C.T. Satellite-derived quantification of the diurnal and annual dynamics of land surface temperature. Remote Sens. Environ. 2021, 265, 112642. [Google Scholar] [CrossRef]
  16. Sharifnezhadazizi, Z.; Norouzi, H.; Prakash, S.; Beale, C.; Khanbilvardi, R. A global analysis of land surface temperature diurnal cycle using MODIS observations. J. Appl. Meteorol. Climatol. 2019, 58, 1279–1291. [Google Scholar] [CrossRef]
  17. Price, J.C. On the analysis of thermal infrared imagery: The limited utility of apparent thermal inertia. Remote Sens. Environ. 1985, 18, 59–73. [Google Scholar] [CrossRef]
  18. Carlson, T.N.; Boland, F.E. Analysis of urban-rural canopy using a surface heat flux/temperature model. J. Appl. Meteorol. Climatol. 1978, 17, 998–1013. [Google Scholar] [CrossRef]
  19. Tomlinson, C.J.; Chapman, L.; Thornes, J.E.; Baker, C. Remote sensing land surface temperature for meteorology and climatology: A review. Meteorol. Appl. 2011, 18, 296–306. [Google Scholar] [CrossRef]
  20. Luo, Y.; Zhu, S.; Li, Y.; Zhang, G.; Xu, Y. Analyzing the Influence of Missing Periods on the Time Dimensional Reconstruction ofSummer Land Surface Temperature in the Heihe River Basin Using FY-4A AGRI Data. J. Geo-Inf. Sci. 2024, 26, 709–724. [Google Scholar]
  21. Zhao, W.; Li, Z.L. Sensitivity study of soil moisture on the temporal evolution of surface temperature over bare surfaces. Int. J. Remote Sens. 2013, 34, 3314–3331. [Google Scholar] [CrossRef]
  22. Wang, Y.; Peng, J.; Song, X.; Leng, P.; Ludwig, R.; Loew, A. Surface soil moisture retrieval using optical/thermal infrared remote sensing data. IEEE Trans. Geosci. Remote Sens. 2018, 56, 5433–5442. [Google Scholar] [CrossRef]
  23. Yamamoto, Y.; Ichii, K.; Ryu, Y.; Kang, M.; Murayama, S.; Kim, S.-J.; Cleverly, J.R. Detection of vegetation drying signals using diurnal variation of land surface temperature: Application to the 2018 East Asia heatwave. Remote Sens. Environ. 2023, 291, 113572. [Google Scholar] [CrossRef]
  24. Wen, J.; Fisher, J.B.; Parazoo, N.C.; Hu, L.; Litvak, M.E.; Sun, Y. Resolve the clear-sky continuous diurnal cycle of high-resolution ECOSTRESS evapotranspiration and land surface temperature. Water Resour. Res. 2022, 58, e2022WR032227. [Google Scholar] [CrossRef]
  25. Huang, F.; Zhan, W.; Liu, Z.; Du, H.; Dong, P.; Wang, X. Satellite-based estimation of monthly mean hourly 1-km urban air temperature using a diurnal temperature cycle model. Remote Sens. Environ. 2024, 315, 114453. [Google Scholar] [CrossRef]
  26. Su, B.; Zhan, W.; Du, H.; Jiang, S.; Wang, C.; Dong, P.; Wang, C.; Liu, Z. Diurnal differences between surface and canopy heat islands in major provincial capital cities of China. Natl. Remote Sens. Bull. 2024, 28, 1885–1898. [Google Scholar]
  27. Wan, Z. New refinements and validation of the MODIS Land-Surface Temperature/Emissivity products. Remote Sens. Environ. 2008, 112, 59–74. [Google Scholar] [CrossRef]
  28. Ermida, S.L.; Trigo, I.F.; Dacamara, C.C.; Göttsche, F.M.; Olesen, F.S.; Hulley, G. Validation of remotely sensed surface temperature over an oak woodland landscape—The problem of viewing and illumination geometries. Remote Sens. Environ. 2014, 148, 16–27. [Google Scholar] [CrossRef]
  29. Norman, J.M.; Becker, F. Terminology in thermal infrared remote sensing of natural surfaces. Agric. For. Meteorol. 1995, 77, 153–166. [Google Scholar] [CrossRef]
  30. Lagouarde, J.-P.; Ballans, H.; Moreau, P.; Guyon, D.; Coraboeuf, D. Experimental study of brightness surface temperature angular variations of maritime pine (Pinus pinaster) stands. Remote Sens. Environ. 2000, 72, 17–34. [Google Scholar] [CrossRef]
  31. Lagouarde, J.-P.; Irvine, M. Directional anisotropy in thermal infrared measurements over Toulouse city centre during the CAPITOUL measurement campaigns: First results. Meteorol. Atmos. Phys. 2008, 102, 173–185. [Google Scholar]
  32. Coll, C.; Galve, J.M.; Niclòs, R.; Valor, E.; Barberà, M.J. Angular variations of brightness surface temperatures derived from dual-view measurements of the Advanced Along-Track Scanning Radiometer using a new single band atmospheric correction method. Remote Sens. Environ. 2019, 223, 274–290. [Google Scholar]
  33. Kimes, D. Remote sensing of row crop structure and component temperatures using directional radiometric temperatures and inversion techniques. Remote Sens. Environ. 1983, 13, 33–55. [Google Scholar] [CrossRef]
  34. Lagouarde, J.-P.; Hénon, A.; Kurz, B.; Moreau, P.; Irvine, M.; Voogt, J.; Mestayer, P. Modelling daytime thermal infrared directional anisotropy over Toulouse city centre. Remote Sens. Environ. 2010, 114, 87–105. [Google Scholar] [CrossRef]
  35. Na, Q.; Li, H.; Cao, B.; Qin, B.; Zheng, L.; Bian, Z.; Du, Y.; Xiao, Q.; Liu, Q. Comprehensive Analysis of Current 1-km Land Surface Temperature Products in Sparsely Vegetated Area: T-Based Evaluation, Thermal Anisotropy, and Joint Application. IEEE Trans. Geosci. Remote Sens. 2024, 62, 1–14. [Google Scholar] [CrossRef]
  36. Cao, B.; Liu, Q.; Du, Y.; Roujean, J.-L.; Gastellu-Etchegorry, J.-P.; Trigo, I.F.; Zhan, W.; Yu, Y.; Cheng, J.; Jacob, F. A review of earth surface thermal radiation directionality observing and modeling: Historical development, current status and perspectives. Remote Sens. Environ. 2019, 232, 111304. [Google Scholar] [CrossRef]
  37. Wei, L.; Jiang, X.; Wu, H.; Ru, C. Review of Urban Thermal Radiation Anisotropy. J. Geo-Inf. Sci. 2022, 24, 617–630. [Google Scholar]
  38. Chen, Y.; Wu, J.; Wang, D. Review of the Study on Generalized Computer Simulation of LandSurface Thermal Anisotropy. Adv. Earth Sci. 2018, 33, 555–567. [Google Scholar]
  39. Duan, S.-B.; Li, Z.-L.; Wang, N.; Wu, H.; Tang, B.-H. Evaluation of six land-surface diurnal temperature cycle models using clear-sky in situ and satellite data. Remote Sens. Environ. 2012, 124, 15–25. [Google Scholar] [CrossRef]
  40. Meng, X.; Liu, H.; Cheng, J. Evaluation and characteristic research in diurnal surface temperature cycle in China using FY-2F data. J. Remote Sens. 2019, 23, 570–581. [Google Scholar]
  41. Jia, A.; Liang, S.; Wang, D.; Mallick, K.; Zhou, S.; Hu, T.; Xu, S. Advances in methodology and generation of all-weather land surface temperature products from polar-orbiting and geostationary satellites: A comprehensive review. IEEE Geosci. Remote Sens. Mag. 2024, 12, 218–260. [Google Scholar] [CrossRef]
  42. Aires, F.; Prigent, C.; Rossow, W.B. Temporal interpolation of global surface skin temperature diurnal cycle over land under clear and cloudy conditions. J. Geophys. Res. Atmos. 2004, 109, D04313. [Google Scholar] [CrossRef]
  43. Jin, M.; Dickinson, R.E. Interpolation of surface radiative temperature measured from polar orbiting satellites to a diurnal cycle: 1. Without clouds. J. Geophys. Res. Atmos. 1999, 104, 2105–2116. [Google Scholar] [CrossRef]
  44. Zhan, W.; Chen, Y.; Voogt, J.; Zhou, J.; Wang, J.; Liu, W.; Ma, W. Interpolating diurnal surface temperatures of an urban facet using sporadic thermal observations. Build. Environ. 2012, 57, 239–252. [Google Scholar] [CrossRef]
  45. Zhan, W.; Zhou, J.; Ju, W.; Li, M.; Sandholt, I.; Voogt, J.; Yu, C. Remotely sensed soil temperatures beneath snow-free skin-surface using thermal observations from tandem polar-orbiting satellites: An analytical three-time-scale model. Remote Sens. Environ. 2014, 143, 1–14. [Google Scholar] [CrossRef]
  46. Jia, A.; Liang, S.; Wang, D.; Ma, L.; Wang, Z.; Xu, S. Global hourly, 5 km, all-sky land surface temperature data from 2011 to 2021 based on integrating geostationary and polar-orbiting satellite data. Earth Syst. Sci. Data 2023, 15, 869–895. [Google Scholar] [CrossRef]
  47. Duan, S.-B.; Li, Z.-L.; Tang, B.-H.; Wu, H.; Tang, R. Direct estimation of land-surface diurnal temperature cycle model parameters from MSG–SEVIRI brightness temperatures under clear sky conditions. Remote Sens. Environ. 2014, 150, 34–43. [Google Scholar] [CrossRef]
  48. Xue, Y.; Cracknell, A. Advanced thermal inertia modelling. Int. J. Remote Sens. 1995, 16, 431–446. [Google Scholar] [CrossRef]
  49. Wang, K.; Li, Z.; Cribb, M. Estimation of evaporative fraction from a combination of day and night land surface temperatures and NDVI: A new method to determine the Priestley–Taylor parameter. Remote Sens. Environ. 2006, 102, 293–305. [Google Scholar] [CrossRef]
  50. Kahle, A.B. A simple thermal model of the earth’s surface for geologic mapping by remote sensing. J. Geophys. Res. 1977, 82, 1673–1680. [Google Scholar] [CrossRef]
  51. Dickinson, R.E.; Henderson-Sellers, A.; Kennedy, P.J. Biosphere-Atmosphere Transfer Scheme (BATS) Version 1e as Coupled to the NCAR Community Climate Model; NCAR Technical Note; National Center for Atmospheric Research: Boulder, CO, USA, 1993. [Google Scholar]
  52. Jin, M. Interpolation of surface radiative temperature measured from polar orbiting satellites to a diurnal cycle: 2. Cloudy-pixel treatment. J. Geophys. Res. Atmos. 2000, 105, 4061–4076. [Google Scholar] [CrossRef]
  53. Pratt, D.; Foster, S.J.; Ellyett, C.D. A calibration procedure for Fourier series thermal inertia models. Photogramm. Eng. Remote Sens. 1980, 46, 529–538. [Google Scholar]
  54. Watson, K. Geologic applications of thermal infrared images. Proc. IEEE 1975, 63, 128–137. [Google Scholar] [CrossRef]
  55. Watson, K. Regional thermal-inertia mapping from an experimental satellite. Geophysics 1982, 47, 1681–1687. [Google Scholar] [CrossRef]
  56. Watson, K. A diurnal animation of thermal images from a day–night pair. Remote Sens. Environ. 2000, 72, 237–243. [Google Scholar] [CrossRef]
  57. Cracknell, A.; Xue, Y. Dynamic aspects study of surface temperature firom remotely-sensed data using advanced thermal inertia model. Remote Sens. 1996, 17, 2517–2532. [Google Scholar] [CrossRef]
  58. Price, J.C. Thermal inertia mapping: A new view of the earth. J. Geophys. Res. 1977, 82, 2582–2590. [Google Scholar] [CrossRef]
  59. Sagalovich, V.; Fal’kov, E.Y.; Tsareva, T. Determination of diurnal soil-temperature cycles using remote sensing data. Mapp. Sci. Remote Sens. 2002, 39, 46–55. [Google Scholar] [CrossRef]
  60. Sobrino, J.; El Kharraz, M. Combining afternoon and morning NOAA satellites for thermal inertia estimation: 1. Algorithm and its testing with hydrologic atmospheric pilot experiment-Sahel data. J. Geophys. Res. Atmos. 1999, 104, 9445–9453. [Google Scholar] [CrossRef]
  61. Sobrino, J.; El Kharraz, M. Combining afternoon and morning NOAA satellites for thermal inertia estimation: 2. Methodology and application. J. Geophys. Res. Atmos. 1999, 104, 9455–9465. [Google Scholar] [CrossRef]
  62. Zhan, W.; Chen, Y.; Zhou, J.; Wang, J.; Liu, W.; Voogt, J.; Zhu, X.; Quan, J.; Li, J. Disaggregation of remotely sensed land surface temperature: Literature survey, taxonomy, issues, and caveats. Remote Sens. Environ. 2013, 131, 119–139. [Google Scholar] [CrossRef]
  63. Huang, F.; Zhan, W.; Duan, S.-B.; Ju, W.; Quan, J. A generic framework for modeling diurnal land surface temperatures with remotely sensed thermal observations under clear sky. Remote Sens. Environ. 2014, 150, 140–151. [Google Scholar] [CrossRef]
  64. Ignatov, A.; Gutman, G. Monthly mean diurnal cycles in surface temperatures over land for global climate studies. J. Clim. 1999, 12, 1900–1910. [Google Scholar] [CrossRef]
  65. Zakšek, K.; Oštir, K. Downscaling land surface temperature for urban heat island diurnal cycle analysis. Remote Sens. Environ. 2012, 117, 114–124. [Google Scholar] [CrossRef]
  66. Coops, N.C.; Duro, D.C.; Wulder, M.A.; Han, T. Estimating afternoon MODIS land surface temperatures (LST) based on morning MODIS overpass, location and elevation information. Int. J. Remote Sens. 2007, 28, 2391–2396. [Google Scholar] [CrossRef]
  67. Crosson, W.L.; Al-Hamdan, M.Z.; Hemmings, S.N.; Wade, G.M. A daily merged MODIS Aqua–Terra land surface temperature data set for the conterminous United States. Remote Sens. Environ. 2012, 119, 315–324. [Google Scholar] [CrossRef]
  68. Van den Bergh, F.; Frost, P. A multi temporal approach to fire detection using MSG data. In Proceedings of the International Workshop on the Analysis of Multi-Temporal Remote Sensing Images; IEEE: New York, NY, USA, 2005; pp. 156–160. [Google Scholar]
  69. Udahemuka, G.; Van Den Bergh, F.; van Wyk, B.; van Wyk, M. Robust fitting of diurnal brightness temperature cycle. In Proceedings of the 18th Annual Symposium of the Pattern Recognition Association of South Africa (PRASA), Pietermaritzburg, South Africa, 28–30 November 2007; pp. 28–30. [Google Scholar]
  70. van den Bergh, F.; Udahemuka, G.; van Wyk, B.J. Potential fire detection based on Kalman-driven change detection. In Proceedings of the 2009 IEEE International Geoscience and Remote Sensing Symposium; IEEE: New York, NY, USA, 2009; pp. IV-77–IV-80. [Google Scholar]
  71. Roberts, G.; Wooster, M. Development of a multi-temporal Kalman filter approach to geostationary active fire detection & fire radiative power (FRP) estimation. Remote Sens. Environ. 2014, 152, 392–412. [Google Scholar]
  72. Hally, B.; Wallace, L.; Reinke, K.; Jones, S. A broad-area method for the Diurnal characterisation of upwelling medium wave infrared radiation. Remote Sens. 2017, 9, 167. [Google Scholar] [CrossRef]
  73. Trihantoro, N.F.; Reinke, K.J.; Jones, S.D. Balancing accuracy and feasibility in diurnal temperature modeling: A comparison of data-driven and physical-based models using geostationary satellite observations. Remote Sens. Environ. 2025, 329, 114902. [Google Scholar] [CrossRef]
  74. Xie, Z.; Song, W.; Ba, R.; Li, X.; Xia, L. A spatiotemporal contextual model for forest fire detection using Himawari-8 satellite data. Remote Sens. 2018, 10, 1992. [Google Scholar] [CrossRef]
  75. Parton, W.J.; Logan, J.A. A model for diurnal variation in soil and air temperature. Agric. Meteorol. 1981, 23, 205–216. [Google Scholar] [CrossRef]
  76. Schädlich, S.; Göttsche, F.; Olesen, F.-S. Influence of land surface parameters and atmosphere on METEOSAT brightness temperatures and generation of land surface temperature maps by temporally and spatially interpolating atmospheric correction. Remote Sens. Environ. 2001, 75, 39–46. [Google Scholar] [CrossRef]
  77. Göttsche, F.-M.; Olesen, F.S. Modelling of diurnal cycles of brightness temperature extracted from METEOSAT data. Remote Sens. Environ. 2001, 76, 337–348. [Google Scholar] [CrossRef]
  78. Van den Bergh, F.; Van Wyk, M.; Van Wyk, B.; Udahemuka, G. A comparison of data-driven and model-driven approaches to brightness temperature diurnal cycle interpolation. SAIEE Afr. Res. J. 2006, 98, 81–86. [Google Scholar] [CrossRef]
  79. Jiang, G.-M.; Li, Z.-L.; Nerry, F. Land surface emissivity retrieval from combined mid-infrared and thermal infrared data of MSG-SEVIRI. Remote Sens. Environ. 2006, 105, 326–340. [Google Scholar] [CrossRef]
  80. Inamdar, A.K.; French, A.; Hook, S.; Vaughan, G.; Luckett, W. Land surface temperature retrieval at high spatial and temporal resolutions over the southwestern United States. J. Geophys. Res. Atmos. 2008, 113, D07107. [Google Scholar] [CrossRef]
  81. Göttsche, F.-M.; Olesen, F.-S. Modelling the effect of optical thickness on diurnal cycles of land surface temperature. Remote Sens. Environ. 2009, 113, 2306–2316. [Google Scholar] [CrossRef]
  82. Duan, S.-B.; Li, Z.-L.; Wu, H.; Tang, B.-H.; Jiang, X.; Zhou, G. Modeling of day-to-day temporal progression of clear-sky land surface temperature. IEEE Geosci. Remote Sens. Lett. 2013, 10, 1050–1054. [Google Scholar] [CrossRef]
  83. Sun, D.; Pinker, R. Implementation of GOES-based land surface temperature diurnal cycle to AVHRR. Int. J. Remote Sens. 2005, 26, 3975–3984. [Google Scholar] [CrossRef]
  84. Wan, Z.; Wang, P.; Li, X. Using MODIS land surface temperature and normalized difference vegetation index products for monitoring drought in the southern Great Plains, USA. Int. J. Remote Sens. 2004, 25, 61–72. [Google Scholar] [CrossRef]
  85. Imhoff, M.L.; Zhang, P.; Wolfe, R.E.; Bounoua, L. Remote sensing of the urban heat island effect across biomes in the continental USA. Remote Sens. Environ. 2010, 114, 504–513. [Google Scholar] [CrossRef]
  86. Sruthi, S.; Aslam, M.M. Agricultural drought analysis using the NDVI and land surface temperature data; a case study of Raichur district. Aquat. Procedia 2015, 4, 1258–1264. [Google Scholar] [CrossRef]
  87. Duan, S.-B.; Li, Z.-L.; Tang, B.-H.; Wu, H.; Tang, R.; Bi, Y.; Zhou, G. Estimation of diurnal cycle of land surface temperature at high temporal and spatial resolution from clear-sky MODIS data. Remote Sens. 2014, 6, 3247–3262. [Google Scholar] [CrossRef]
  88. Hong, F.; Zhan, W.; Göttsche, F.-M.; Liu, Z.; Zhou, J.; Huang, F.; Lai, J.; Li, M. Comprehensive assessment of four-parameter diurnal land surface temperature cycle models under clear-sky. ISPRS J. Photogramm. Remote Sens. 2018, 142, 190–204. [Google Scholar] [CrossRef]
  89. Chang, Y.; Ding, Y.; Zhao, Q.; Zhang, S. A comprehensive evaluation of 4-parameter diurnal temperature cycle models with in situ and MODIS LST over Alpine Meadows in the Tibetan Plateau. Remote Sens. 2019, 12, 103. [Google Scholar] [CrossRef]
  90. Lu, L.; Zhou, X. A Four-Parameter Model for Estimating Diurnal Temperature Cycle From MODIS Land Surface Temperature Product. J. Geophys. Res. Atmos. 2021, 126, e2020JD033855. [Google Scholar] [CrossRef]
  91. Wang, Y.; Jin, S. Diurnal temperature cycle models and performances on Martian surface using in-situ and satellite data. Planet. Space Sci. 2025, 260, 106100. [Google Scholar] [CrossRef]
  92. Udahemuka, G.; Van Wyk, B.J.; Hamam, Y. Characterization of background temperature dynamics of a multitemporal satellite scene through data assimilation for wildfire detection. Remote Sens. 2020, 12, 1661. [Google Scholar] [CrossRef]
  93. Sara, K.; Rajasekaran, E. High spatiotemporal resolution land surface temperature reveals fine-scale hotspots during heatwave events over India. Environ. Res. Commun. 2025, 7, 035027. [Google Scholar] [CrossRef]
  94. Lu, Y.; Zhan, W.; Hu, C. Detecting and quantifying oil slick thickness by thermal remote sensing: A ground-based experiment. Remote Sens. Environ. 2016, 181, 207–217. [Google Scholar] [CrossRef]
  95. Xiong, Y.; Zhao, T.; Lü, H.; Peng, Z.; Zheng, J.; Bai, Y.; Yao, P.; Guo, P.; Song, P.; Wei, Z. FengYun-3 meteorological satellites’ microwave radiation Imagers enhance land surface temperature measurements across the diurnal cycle. ISPRS J. Photogramm. Remote Sens. 2025, 222, 204–224. [Google Scholar] [CrossRef]
  96. Leng, P.; Song, X.; Li, Z.; Ma, J.; Zhou, F.; Li, S. Bare surface soil moisture retrieval from the synergistic use of optical and thermal infrared data. Int. J. Remote Sens. 2014, 35, 988–1003. [Google Scholar] [CrossRef]
  97. Leng, P.; Song, X.; Duan, S.-B.; Li, Z.-L. Preliminary validation of two temporal parameter-based soil moisture retrieval models using a satellite product and in situ soil moisture measurements over the REMEDHUS network. Int. J. Remote Sens. 2016, 37, 5902–5917. [Google Scholar] [CrossRef]
  98. Liu, H.; Duan, S.; Shao, K.; Chen, Y.; Han, X. Combining thermal inertia and a diurnal temperature difference cycle model to estimate thermal inertia from MSG-SEVIRI data. Int. J. Remote Sens. 2015, 36, 4808–4819. [Google Scholar] [CrossRef]
  99. Cheng, M.Y.; Shi, L.; Jiao, X.; Nie, C.; Liu, S.; Yu, X.; Bai, Y.; Liu, Y.; Liu, Y.; Song, N. Up-scaling the latent heat flux from instantaneous to daily-scale: A comparison of three methods. J. Hydrol. Reg. Stud. 2022, 40, 101057. [Google Scholar] [CrossRef]
  100. Athira, K.; Rajasekaran, E.; Sara, K.; Boulet, G.; Kustas, W.P.; Nigam, R.; Bhattacharya, B.K.; Alfieri, J.G.; Prueger, J.H.; Alsina, M.M. Modelling the diurnal cycle of evapotranspiration using remote sensing models–are we there yet? Int. J. Remote Sens. 2025, 46, 9179–9212. [Google Scholar] [CrossRef]
  101. French, A.N.; Hunsaker, D.J.; Clarke, T.R. Forecasting Spatially Distributed Cotton Evapotranspiration by Assimilating Remotely Sensed and Ground-Based Observations. J. Irrig. Drain. Eng. 2012, 138, 984–992. [Google Scholar] [CrossRef]
  102. Quan, J.; Chen, Y.; Zhan, W.; Wang, J.; Voogt, J.; Li, J. A hybrid method combining neighborhood information from satellite data with modeled diurnal temperature cycles over consecutive days. Remote Sens. Environ. 2014, 155, 257–274. [Google Scholar] [CrossRef]
  103. Liu, X.; Tang, B.-H.; Li, Z.-L.; Zhou, C.; Wu, W.; Rasmussen, M.O. An improved method for separating soil and vegetation component temperatures based on diurnal temperature cycle model and spatial correlation. Remote Sens. Environ. 2020, 248, 111979. [Google Scholar] [CrossRef]
  104. Song, L.; Liu, S.; Kustas, W.P.; Zhou, J.; Ma, Y. Using the surface temperature-albedo space to separate regional soil and vegetation temperatures from ASTER data. Remote Sens. 2015, 7, 5828–5848. [Google Scholar] [CrossRef]
  105. Liu, X.; Li, Z.L.; Duan, S.B.; Leng, P.; Si, M. Retrieval of global surface soil and vegetation temperatures based on multisource data fusion. Remote Sens. Environ. 2025, 318, 114564. [Google Scholar] [CrossRef]
  106. Budhiraja, B.; Agrawal, G.; Pathak, P. Urban heat island effect of a polynuclear megacity Delhi–Compactness and thermal evaluation of four sub-cities. Urban Clim. 2020, 32, 100634. [Google Scholar] [CrossRef]
  107. Guan, Y.; Quan, J.; Ma, T.; Cao, S.; Xu, C.; Guo, J. Identifying major diurnal patterns and drivers of surface urban heat island intensities across local climate zones. Remote Sens. 2023, 15, 5061. [Google Scholar] [CrossRef]
  108. Liu, Z.; Zhan, W.; Wu, Y.; Li, J.; Du, H.; Li, L.; Wang, S.; Wang, C. Assessment of instantaneous sampling on quantifying satellite-derived surface urban heat islands: Biases and driving factors. Remote Sens. Environ. 2025, 318, 114608. [Google Scholar] [CrossRef]
  109. Zhou, J.; Chen, Y.; Zhang, X.; Zhan, W. Modelling the diurnal variations of urban heat islands with multi-source satellite data. Int. J. Remote Sens. 2013, 34, 7568–7588. [Google Scholar] [CrossRef]
  110. Liu, Z.; Zhan, W.; Lai, J.; Bechtel, B.; Lee, X.; Hong, F.; Li, L.; Huang, F.; Li, J. Taxonomy of seasonal and diurnal clear-sky climatology of surface urban heat island dynamics across global cities. ISPRS J. Photogramm. Remote Sens. 2022, 187, 14–33. [Google Scholar] [CrossRef]
  111. Zhan, W.; Ju, W.; Hai, S.; Ferguson, G.; Quan, J.; Tang, C.; Guo, Z.; Kong, F. Satellite-derived subsurface urban heat island. Environ. Sci. Technol. 2014, 48, 12134–12140. [Google Scholar] [CrossRef]
  112. Zhang, Y.; Li, Q.; Wang, H.; Du, X.; Huang, H. Community scale livability evaluation integrating remote sensing, surface observation and geospatial big data. Int. J. Appl. Earth Obs. Geoinf. 2019, 80, 173–186. [Google Scholar] [CrossRef]
  113. Ji, M.; Xu, Y.; Zhu, S.; Zhang, Y.; Xin, Y.; Mo, Y. Exploring the potential of UAV-based thermal imagery for monitoring diurnal variations in the microscale urban thermal environment. Energy Build. 2025, 347, 116375. [Google Scholar] [CrossRef]
  114. Zhao, H.; Zhou, Y.; Li, X.; Liu, C.; Chen, X. The influence of wind speed on infrared temperature in impervious surface areas based on in situ measurement data. GISci. Remote Sens. 2019, 56, 843–863. [Google Scholar] [CrossRef]
  115. Gholamnia, M.; Alavipanah, S.K.; Boloorani, A.D.; Hamzeh, S.; Kiavarz, M. A new method to model diurnal air temperature cycle. Theor. Appl. Climatol. 2019, 137, 229–238. [Google Scholar] [CrossRef]
  116. Gholamnia, M.; Alavipanah, S.K.; Darvishi Boloorani, A.; Hamzeh, S.; Kiavarz, M. Diurnal air temperature modeling based on the land surface temperature. Remote Sens. 2017, 9, 915. [Google Scholar] [CrossRef]
  117. Peterson, J.; Sembroski, G.; Dutta, A.; Remocaldo, C. Self-consistent Atmosphere Representation and Interaction in Photon Monte Carlo Simulations. Astrophys. J. 2024, 964, 124. [Google Scholar] [CrossRef]
  118. Jia, L.; Xu, Y.; Duan, M. Explosive formation of secondary organic aerosol due to aerosol-fog interactions. Sci. Total Environ. 2023, 866, 161338. [Google Scholar] [CrossRef] [PubMed]
  119. Lieberherr, G.; Wunderle, S. Lake Surface Water Temperature Derived from 35 Years of AVHRR Sensor Data for European Lakes. Remote Sens. 2018, 10, 990. [Google Scholar] [CrossRef]
  120. Peng, Z.; Liu, S.; Liu, R.; He, X.; Ma, J.; Xu, Z.; Zhou, J.; Wu, D. Simulating oasis-desert interactions in artificial and natural oasis-desert areas: Integration of remote sensing data and CFD methodology. Agric. For. Meteorol. 2025, 367, 110516. [Google Scholar] [CrossRef]
  121. Li, D.; Rodriguez-Cassola, M.; Prats-Iraola, P.; Dong, Z.; Wu, M.; Moreira, A. Modelling of tropospheric delays in geosynchronous synthetic aperture radar. Sci. China Inf. Sci. 2017, 60, 060307. [Google Scholar] [CrossRef]
  122. Nie, C.; Liao, J.; Shen, G.; Duan, W. Simulation of the land surface temperature from moon-based Earth observations. Adv. Space Res. 2019, 63, 826–839. [Google Scholar] [CrossRef]
  123. Ravindra, R.K.B. Thermal characteristics of a classical solar telescope primary mirror. New Astron. 2011, 16, 328–336. [Google Scholar] [CrossRef]
  124. Banyal, R.K.; Ravindra, B.; Chatterjee, S. Opto-thermal analysis of a lightweighted mirror for solar telescope. Opt. Express 2013, 21, 7065–7081. [Google Scholar] [CrossRef]
  125. Gu, N.; Li, C.; Cheng, Y.; Rao, C. Thermal control for light-weighted primary mirrors of large ground-based solar telescopes. J. Astron. Telesc. Instrum. Syst. 2019, 5, 014005. [Google Scholar] [CrossRef]
  126. Browne, C.; Matteson, D.S.; McBride, L.; Hu, L.; Liu, Y.; Sun, Y.; Wen, J.; Barrett, C.B. Multivariate random forest prediction of poverty and malnutrition prevalence. PLoS ONE 2021, 16, e0255519. [Google Scholar] [CrossRef] [PubMed]
  127. Voogt, J.A.; Oke, T. Effects of urban surface geometry on remotely-sensed surface temperature. Int. J. Remote Sens. 1998, 19, 895–920. [Google Scholar] [CrossRef]
  128. Zhang, J.; Li, X.; Yao, F.; Li, X. The Progress in Retrieving Land Surface Temperature Based on Thermal Infaraed and Microwave Remote Sensing Technologies. Spectrosc. Spectr. Anal. 2009, 29, 2103–2107. [Google Scholar]
  129. Jupp, D.L.B.; Strahler, A.H. A hotspot model for leaf canopies. Remote Sens. Environ. 1991, 38, 193–210. [Google Scholar] [CrossRef]
  130. Zhao, L.; Gu, X.; Yu, T.; Wan, W.; Zhang, L.; Xie, Y. A directional thermal radiance modelfor multiple scattering over surfaces. J. Infrared Millim. Waves 2012, 31, 528–535. [Google Scholar] [CrossRef]
  131. Ma, W.; Chen, Y.; Zhan, W.; Zhou, J. Thermal anisotropy model for simulated three dimensional urban targets. J. Remote Sens. 2013, 17, 62–76. [Google Scholar]
  132. Monteith, J.L.; Szeicz, G. Radiative temperature in the heat balance of natural surfaces. Q. J. R. Meteorol. Soc. 1962, 88, 496–507. [Google Scholar] [CrossRef]
  133. Lagouarde, J.-P.; Bach, M.; Sobrino, J.A.; Boulet, G.; Briottet, X.; Cherchali, S.; Coudert, B.; Dadou, I.; Dedieu, G.; Gamet, P. The MISTIGRI thermal infrared project: Scientific objectives and mission specifications. Int. J. Remote Sens. 2013, 34, 3437–3466. [Google Scholar] [CrossRef]
  134. He, K.; Zhao, W.; Liu, X.; Liu, J. Sensitivity analysis of the training set to the performance of the machine learning-based land surface temperature reconstruction for cloud covered pixels. Natl. Remote Sens. Bull. 2021, 25, 1722–1734. [Google Scholar]
  135. Norman, J.M.; Kustas, W.P.; Humes, K.S. Source approach for estimating soil and vegetation energy fluxes in observations of directional radiometric surface temperature. Agric. For. Meteorol. 1995, 77, 263–293. [Google Scholar] [CrossRef]
  136. Wang, D.; Chen, Y.; Voogt, J.A.; Krayenhoff, E.S.; Wang, J.; Wang, L. An advanced geometric model to simulate thermal anisotropy time-series for simplified urban neighborhoods (GUTA-T). Remote Sens. Environ. 2020, 237, 111547. [Google Scholar] [CrossRef]
  137. Qin, B.; Chen, S.; Cao, B.; Yu, Y.; Yu, P.; Na, Q.; Hou, E.; Li, D.; Jia, K.; Yang, Y. Angular normalization of GOES-16 and GOES-17 land surface temperature over overlapping region using an extended time-evolving kernel-driven model. Remote Sens. Environ. 2025, 318, 114532. [Google Scholar] [CrossRef]
  138. Bian, Z.; Zhong, S.; Roujean, J.-L.; Liu, X.; Duan, S.; Li, H.; Cao, B.; Li, R.; Du, Y.; Xiao, Q. An integrated method for angular and temporal reconstruction of land surface temperatures. Remote Sens. Environ. 2024, 313, 114357. [Google Scholar] [CrossRef]
  139. Dong, P.; Jiang, S.; Zhan, W.; Wang, C.; Miao, S.; Du, H.; Li, J.; Wang, S.; Jiang, L. Diurnally continuous dynamics of surface urban heat island intensities of local climate zones with spatiotemporally enhanced satellite-derived land surface temperatures. Build. Environ. 2022, 218, 109105. [Google Scholar] [CrossRef]
  140. Zhang, X.; Zhan, W.; Miao, S.; Du, H.; Wang, C.; Jiang, S. Spatiotemporal patterns of surface urban heat island area across global major cities based on diurnal temperature cycle model. Remote Sens. Technol. Appl. 2023, 38, 842–854. [Google Scholar] [CrossRef]
  141. Fang, Y.; Zhan, W.; Huang, F.; Gao, L.; Quan, J.; Zou, Z. Hourly variation of surface urban heat island over the Yangtze River Delta urbanagglomeration. Adv. Earth Sci. 2017, 32, 187–198. [Google Scholar]
  142. Wang, D.; Chen, Y.; Zhan, W. A geometric model to simulate thermal anisotropy over a sparse urban surface (GUTA-sparse). Remote Sens. Environ. 2018, 209, 263–274. [Google Scholar] [CrossRef]
  143. Wang, D.; Chen, Y.; Cui, Y.; Sun, H. A geometric model to simulate urban thermal anisotropy for simplified neighborhoods. IEEE Trans. Geosci. Remote Sens. 2018, 56, 4930–4944. [Google Scholar] [CrossRef]
  144. Wang, D.; Chen, Y. A geometric model to simulate urban thermal anisotropy in simplified dense neighborhoods (GUTA-Dense). IEEE Trans. Geosci. Remote Sens. 2019, 57, 6226–6239. [Google Scholar] [CrossRef]
  145. Wang, D.; Hu, L.; Voogt, J.A.; Chen, Y.; Zhou, J.; Chang, G.; Quan, J.; Zhan, W.; Kang, Z. Simulation of urban thermal anisotropy at remote sensing pixel scales: Evaluating three schemes using GUTA-T over Toulouse city. Remote Sens. Environ. 2024, 300, 113893. [Google Scholar] [CrossRef]
  146. Cao, B.; Roujean, J.-L.; Gastellu-Etchegorry, J.-P.; Liu, Q.; Du, Y.; Lagouarde, J.-P.; Huang, H.; Li, H.; Bian, Z.; Hu, T. A general framework of kernel-driven modeling in the thermal infrared domain. Remote Sens. Environ. 2021, 252, 112157. [Google Scholar] [CrossRef]
  147. Wu, P.; Su, Y.; Duan, S.-b.; Li, X.; Yang, H.; Zeng, C.; Ma, X.; Wu, Y.; Shen, H. A two-step deep learning framework for mapping gapless all-weather land surface temperature using thermal infrared and passive microwave data. Remote Sens. Environ. 2022, 277, 113070. [Google Scholar] [CrossRef]
  148. Song, P.; Wang, M.; Xu, R.; Chen, L.; Liao, J.; Wu, S.; Li, G.; Hu, X. Global intraday land surface temperature estimation of enhanced coverage by fusion of passive microwave data between different polar orbits. Int. J. Appl. Earth Obs. Geoinf. 2025, 144, 104873. [Google Scholar] [CrossRef]
  149. Li, C.; Wu, P.; Duan, S.-B.; Jia, Y.; Sun, S.; Shi, C.; Yin, Z.; Li, H.; Shen, H. LFSR: Low-resolution filling then super-resolution reconstruction framework for gapless all-weather MODIS-like Land Surface Temperature generation. Remote Sens. Environ. 2025, 319, 114637. [Google Scholar] [CrossRef]
  150. Ma, J.; Guo, J.; Wu, J.; Shen, H. A Two-Step Framework for Generating 0.01°, Hourly, and Gapless Land Surface Temperature. IEEE J. Sel. Top. Appl. Earth Obs. Remote Sens. 2024, 18, 1607–1625. [Google Scholar] [CrossRef]
  151. Du, H.; Zhan, W.; Liu, Z.; Wang, C.; Huang, F. A universal yet easy-to-use data-driven method for angular normalization of directional land surface temperatures acquired from polar orbiters across global cities. Remote Sens. Environ. 2025, 328, 114840. [Google Scholar] [CrossRef]
  152. Ranjbar, S.; Losos, D.; Hoffman, S.; Arabi, S.; Desai, A.; Stoy, P.C. Near real-time mapping of all-sky land surface temperature from GOES-R using machine learning. J. Geophys. Res. Mach. Learn. Comput. 2025, 2, e2024JH000464. [Google Scholar] [CrossRef]
  153. Yu, Y.; Renzullo, L.J.; McVicar, T.R.; Van Niel, T.G.; Cai, D.; Tian, S.; Ma, Y. Solar zenith angle-based calibration of Himawari-8 land surface temperature for correcting diurnal retrieval error characteristics. Remote Sens. Environ. 2024, 308, 114176. [Google Scholar] [CrossRef]
  154. Xia, H. Geographically constrained machine Learning-Based Kernel-Driven method for downscaling of All-Weather land surface temperature. Remote Sens. 2025, 17, 1413. [Google Scholar] [CrossRef]
Figure 1. Annual number of citing articles related to DTC models from 2000 to 2025.
Remotesensing 18 01539 g001
Figure 2. Global distribution of citing articles on DTC models from 2000 to 2025. Circle sizes represent different class intervals of the number of citing articles per country.
Remotesensing 18 01539 g002
Figure 3. A keyword clustering network for the DTC model field. Node size corresponds to keyword frequency, with larger nodes indicating higher research prominence. The node color gradients illustrate the temporal evolution of hotspots: warm colors represent recent themes, while cool colors denote earlier topics. Due to the default keyword standardization in CiteSpace, some acronyms (e.g., MODIS) appear in lowercase. To maintain data transparency and originality, the original software output format is retained.
Remotesensing 18 01539 g003
Table 1. Application fields and core functions of DTC models.
Research FieldsSpecific Application ScenariosCore Function of the DTC ModelCitation
Disaster and thermal
anomaly
monitoring
Wildfire monitoringConstructs the non-fire diurnal background
temperature and wildfire anomalies are detected via deviations from observed values.
Roberts and Wooster [71], Trihantoro et al. [73], Xie et al. [74], Udahemuka et al. [92]
Extreme heatwave
monitoring
Reconstruct complete daily LST variations to
accurately estimate risk indicators such as daily
maximum/minimum temperatures and diurnal
temperature range.
Sara and Rajasekaran [93]
Marine surface oil
monitoring
Smooths daily brightness temperature curves to
extract effective temperature difference signals
for oil film identification and quantification.
Lu et al. [94]
Dynamic monitoring of surface freezing/thawing statusReconstruct continuous diurnal temperature
variations to distinguish temperature
characteristics under frozen and thawed
conditions.
Xiong et al. [95]
Surface
parameter
inversion and ecohydrological monitoring
Soil hydrothermal
parameter inversion
Fits the diurnal dynamics of LST and radiation to
extract key feature parameters.
Zhao and Li [21], Wang et al. [22], Zhan et al. [45], Leng et al. [96], Leng et al. [97], Liu et al. [98]
Evapotranspiration
estimation
Filling observational gaps to provide a model
inputs; quantifying surface thermal
characteristics’ response to drought.
Yamamoto et al. [23], Wen et al. [24], Cheng et al. [99], Athira et al. [100], French et al. [101]
Vegetation–soil
component temperature separation
Fitting independent diurnal temperature variation curves for each component transforms the separation
problem of solving for stable DTC parameters.
Quan et al. [102], Liu et al. [103], Song et al. [104], Liu et al. [105]
Urban thermal environmentUrban heat island
monitoring
Interpolation of sparse instantaneous observations into a continuous time series to support
hourly-resolution analysis.
Zakšek and Oštir [65], Budhiraja et al. [106], Guan et al. [107], Liu et al. [108], Zhou et al. [109], Liu et al. [110], Zhan et al. [111]
Urban thermal comfort and livability assessmentFilling data gaps to generate continuous LST
diurnal variations for extracting thermal comfort
duration.
Zhang et al. [112]
Observation of urban
microscale thermal
heterogeneity
Fitting temperature diurnal curves based on
limited observations to reveal micro-scale thermal
dynamics.
Ji et al. [113]
Wind speed effect
correction for urban
surface infrared
temperature
measurements
Separating wind speed effects by simulating ideal
temperature variations without wind interference as a baseline.
Zhao et al. [114]
Climate and
atmospheric
environment
Air temperature
Estimation
Generate spatially continuous, high-resolution
near-surface air temperature data using the
relationship between LST and the DTC parameter.
Gholamnia et al. [115], Gholamnia et al. [116]
Atmospheric correctionProvide precise diurnal temperature variation data as boundary conditions to enhance the realism of
atmospheric optical property simulations.
Peterson et al. [117]
Atmospheric pollution process researchSimulates diurnal temperature variations to
provide temperature-driven time-series data.
Jia et al. [118]
Lake surface
temperature monitoring
Corrects observation time inconsistencies caused by orbital drift in long-term satellite data series.Lieberherr and Wunderle [119]
Land-atmosphere
interactions in arid
regions
Characterizing heterogeneous surface thermal
contrast to provide a refined thermal boundary
conditions for microclimates.
Peng et al. [120]
Synthetic aperture
radar tropospheric delay correction
Simulating the diurnal dynamics of
meteorological parameters to quantify their
deterministic effects on radar signal propagation.
Li et al. [121]
Astronomy and planetary Deep space exploration environment simulationReconstruction of continuous diurnal temperature
variations based on extremely limited observational data help fill gaps in our understanding of
extraterrestrial environments
Wang and Jin [91], Nie et al. [122]
Thermal control
system for astronomical
telescopes
Simulating environmental temperature variations to optimize telescope thermal control parametersRavindra [123], Banyal et al. [124], Gu et al. [125]
Public health and
socioeconomic
Remote sensing
prediction and early warning of poverty and malnutrition
Filling monthly surface temperature data gaps, with anomalies serving as key climate stress indicators for predictive models.Browne et al. [126]
Table 2. Comparative analysis of five DTC models coupling angular effects.
ModelDLHMLIU2020GUTA-TVT-KDTCTEKDM
Physical
assumptions
Mixed pixel LST is a linearly weighted sum of the
components
temperatures.
Same as DLHM, but only for soil/vegetation components.The temperature
differences between shaded and
illuminated surfaces that drive UTA vary with trigonometric functions of SZA.
Temperature = DTC (time)
+ VNIR kernel
(angle); VI/BF
angular terms are time-invariant.
Directionality driven by gap fraction & hotspot; kernel
coefficients are time-
varying, but hotspot width B is constant within a day.
Data
requirements
Multispectral data and multi-temporal LST.Multi-temporal LST and FVC.High-resolution
urban morphological
parameters (h/w, λp), and multi-angle LST.
VNIR multi-angle reflectance, and multi-temporal LST.Multi-temporal and multi-angle LST.
Unknown
parameters
Total parameters
grow with the number of days N and
components I: I × (5N + 1) + 1.
12 parameters: T0, Ta, tm, ts, δT, ω for soil and vegetation.3 parameters:
asw-ig, aw, asg-ig.
12 parameters:
angular: fiso, fgeo, fvol;
temporal: T0, Ta, tm for fVI, fBF, fiso.
7 parameters: 4 DTC parameters: T0, Ta, ω, tm; 3 angular
parameters: D, A, B.
Day–night
capability
Day and nightDay and nightDaytimeDaytimeDaytime
Model
validation
Simulation + MODIS
+ S-VISSR cross
validation
+ inter-model
comparison.
Simulation
+ SEVIRI + 1
in situ site.
TUF3D + SUM
synthetic data + MODIS multi-angular LST + airborne measurements.
SCOPE dataset
+ AHI/SLSTR
+ 12 in situ sites
+ inter-model
Comparison.
DART simulated
dataset + GOES-16/17
+ 10 AmeriFlux sites.
Sensitivity to land cover heterogeneityModerate: it is stable for 2-EM in
homogeneous
agricultural areas, while the accuracy
degrades for 4-EM in highly heterogeneous
regions.
Moderate: it is sensitive to FVC
spatial
variability.
High: it requires fine
urban parameters;
errors increase
significantly when streets have a
dominant orientation.
Medium–high: it depends on VI; poor performance over bare soil, sparse urban, or low-vegetation
areas.
High: it can adapt well to complex vegetation and heterogeneous surfaces.
Applicable scenariosRegional scale, and 2-EM strategy outperforms 4-EM.Regional/global areas with
significant
vegetation cover changes.
Urban neighborhoods of varying densities.High-vegetation areas (cropland, forest).Overlapping regions of geostationary
satellites (extendable to polar-orbiting
constellations).
Disclaimer/Publisher’s Note: The statements, opinions and data contained in all publications are solely those of the individual author(s) and contributor(s) and not of MDPI and/or the editor(s). MDPI and/or the editor(s) disclaim responsibility for any injury to people or property resulting from any ideas, methods, instructions or products referred to in the content.