Article

New Insights into the Site of Madonna del Piano (Castro dei Volsci, Italy) Through a Combined Use of Drone-Acquired LIDAR Data, Laser Scanning, Photogrammetry, Historical Aerial Imagery Analysis, Geophysical Investigations and Archaeological Analysis


by
Andrea Angelini
1,
Giovanni Caratelli
1,
Marilena Cozzolino
2,*,
Vincenzo Gentile
3,
Paolo Mauriello
3,
Giorgia Pietropaolo
4,
Daniela Quadrino
5 and
Eleonora Scopinaro
1
1
Institute of Heritage Sciences (ISPC), National Research Council of Italy, Via Salaria Km. 29,300, Monterotondo St., 00015 Rome, Italy
2
Department of Biosciences and Territory, University of Molise, C.da Fonte Lappone, 86090 Pesche, Italy
3
Department of Agricultural, Environmental and Food Sciences, University of Molise, Via De Sanctis Snc, 86100 Campobasso, Italy
4
Department of Architecture and Industrial Design, University of Campania “Luigi Vanvitelli”, Via S. Lorenzo, 31, 81031 Aversa, Italy
5
Superintendency of Archaeology, Fine Arts, and Landscape for the Provinces of Frosinone and Latina, Ministry of Culture, Piazza Angelo Celli, 1, 04100 Latina, Italy
*
Author to whom correspondence should be addressed.
Remote Sens. 2026, 18(10), 1526; https://doi.org/10.3390/rs18101526
Submission received: 6 March 2026 / Revised: 24 April 2026 / Accepted: 4 May 2026 / Published: 12 May 2026

Highlights

What are the main findings?
  • New information about the archaeological site at Madonna del Piano was obtained using Light Detection And Ranging (LiDAR) scans, historical aerial photogrammetry, geophysical prospections, 3D surveys of visible structures, and archival research.
  • The buildings’ functions, relationships, and structure were made clear, and the results were placed in a broader geographic context.
What are the implications of the main findings?
  • An integrated, multi-scale, and multi-sensor approach improves the effectiveness of the reanalysis of complex archaeological contexts.
  • The multi-methodological approach allows for more realistic and valid management of an archaeological site under study.

Abstract

The archaeological remains of the Roman villa at Madonna del Piano are situated at the foot of the hill on which the municipality of Castro dei Volsci (Italy) now stands. This crucial region guarantees access to the coastal areas and is situated between the Via Latina and the Amaseno Valley. The first signs of the existence of archaeological structures can be seen in several historic aerial images, where anomalies are readily visible. The remnants of an imperial-era villa with varying periods of occupation were discovered during excavations carried out between the mid-1980s and the early 1990s. These remnants can now be identified in three distinct complexes that were previously linked as a component of a single complex. Given the site’s importance, a research project based on numerous studies and multi-scale approaches was launched in 2024 to collect new data and fill any knowledge gaps. The technique focused on the villa and its surroundings using LiDAR scans, geophysical prospections, 3D surveys of visible structures, archival research, and historical aerial photogrammetry. The findings provide new insight into the settlement by clarifying and elucidating its structure, relationships, and roles of the three complexes, and placing the results within a broader geographical context.

1. Introduction

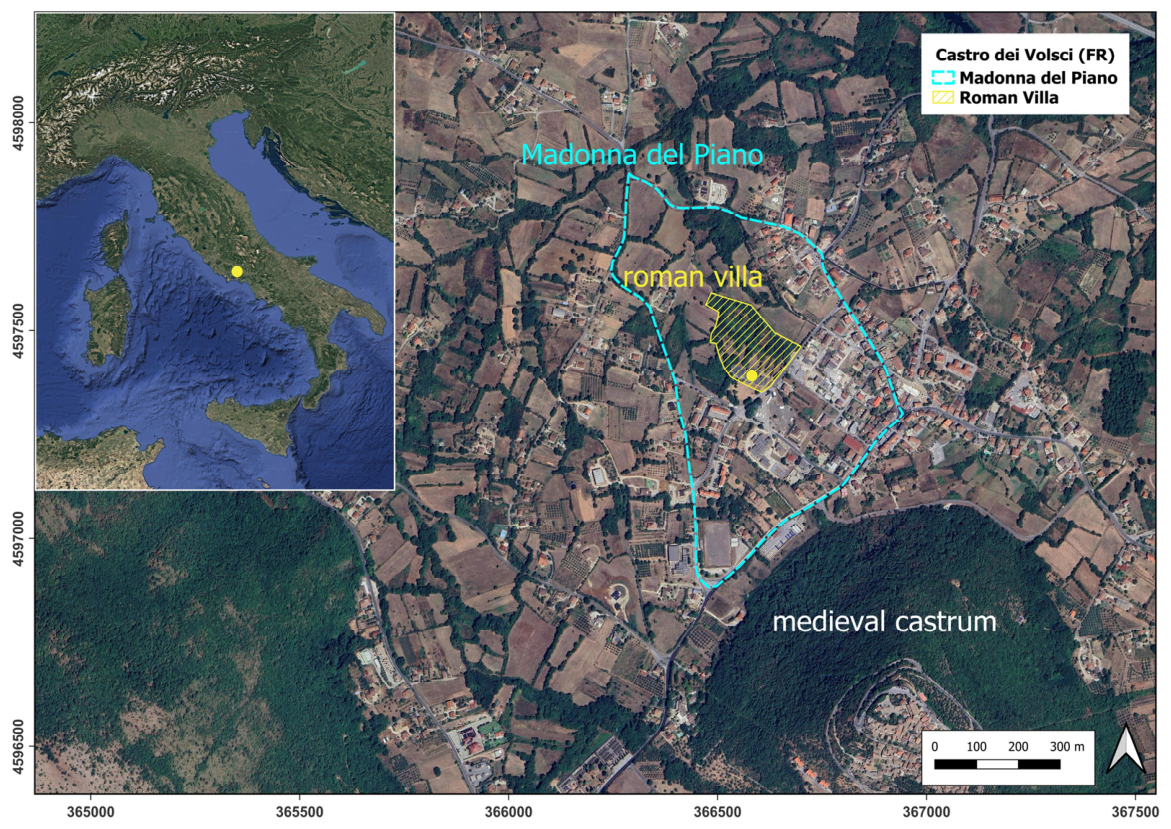
This paper summarizes the main results of research carried out through diagnostic methods since 2024 at the archaeological site of the Roman villa at Madonna del Piano, in the municipality of Castro dei Volsci (Frosinone, Lazio Region, Italy) (Figure 1). The remains of this multi-layered villa, placed at the foot of the hill where the medieval castrum was later established [1], are almost one kilometer from the right bank of the river Sacco. According to the sources, this location is strategically significant and has been inhabited since prehistoric times [2,3]. In fact, two crucial interregional routes converged here: the Via Latina, which represented one of the most important axes connecting Lazio and Campania in the valley with the same name; and the Amaseno valley, which ensured easy access to the sea and the coastal plains by dividing the Lepini and Ausoni mountains [4,5].
The archaeological remains span over 7 hectares and have features that attest to their remarkable monumentality in a peripheral area of the modern city. However, the ownership of the villa is still unknown despite the consistency and quality of the material evidence, like in other recent cases without written attestations. In the 1960s, the site was discovered. An article published in the newspaper Il Mattino described a series of structural discoveries, citing evidence of unintentional finds in various parts of the Castro dei Volsci area. Because parts of the so-called “Baths of Nerva” were already clearly visible, this led to a renewed interest in the region. The initial local investigation was started based on the information in this document, with the specific goal of recovering the aerial photos of the villa that were displayed when the article was published, if possible.
However, it would take some 20 years for the first systematic archaeological investigations to start. These investigations were carried out by the Archaeological Superintendency for Lazio in collaboration with the municipal government, which went ahead and expropriated the area. This cooperation served as the catalyst for the start of archaeological excavation expeditions, which lasted for roughly 10 years (1984–1994). Several restoration and conservation initiatives also contributed to the current state of the art. These interventions allowed for the development of a visiting route and the construction of a municipal museum next to the archaeological area to display the artifacts discovered on the site [6].
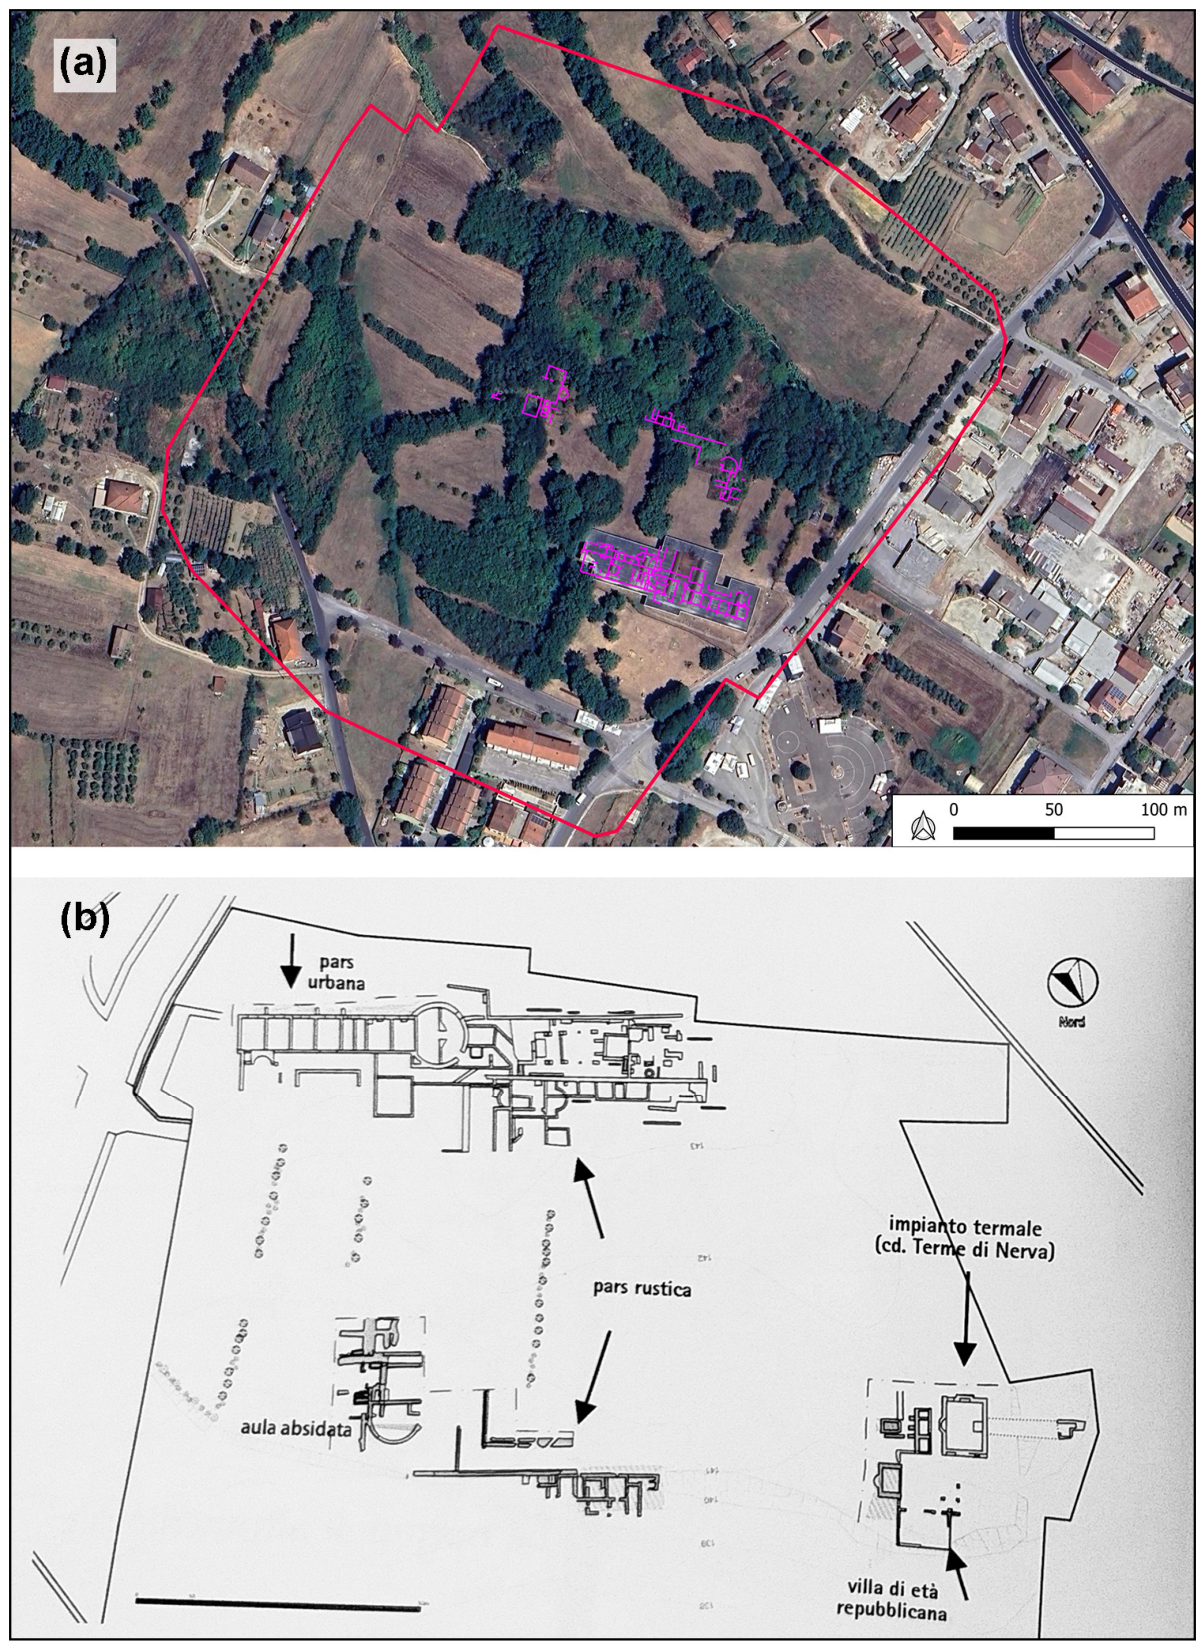
The eras of archaeological campaigns in the three distinct complexes identified (CF1, CF2, CF3, Figure 2) could be roughly reconstructed from the excavation documentation.
The area of the villa was inhabited for a considerable amount of time, from the end of the 1st century BC to the 9th century, as shown by the wide variety of building techniques seen in the walls of the three buildings, indicative of a lengthy occupation marked by multiple repairs. A thorough methodological approach, beginning with a reflection on the evidence of the many building periods, could not be disregarded in the re-examination of the site due to the unique stratigraphic complexity. The first comprehensive site plans were presented at the Archaeology of Lazio conferences between the 1980s and 1990s as a result of the research, which mostly focused on the eastern portion of CF1.
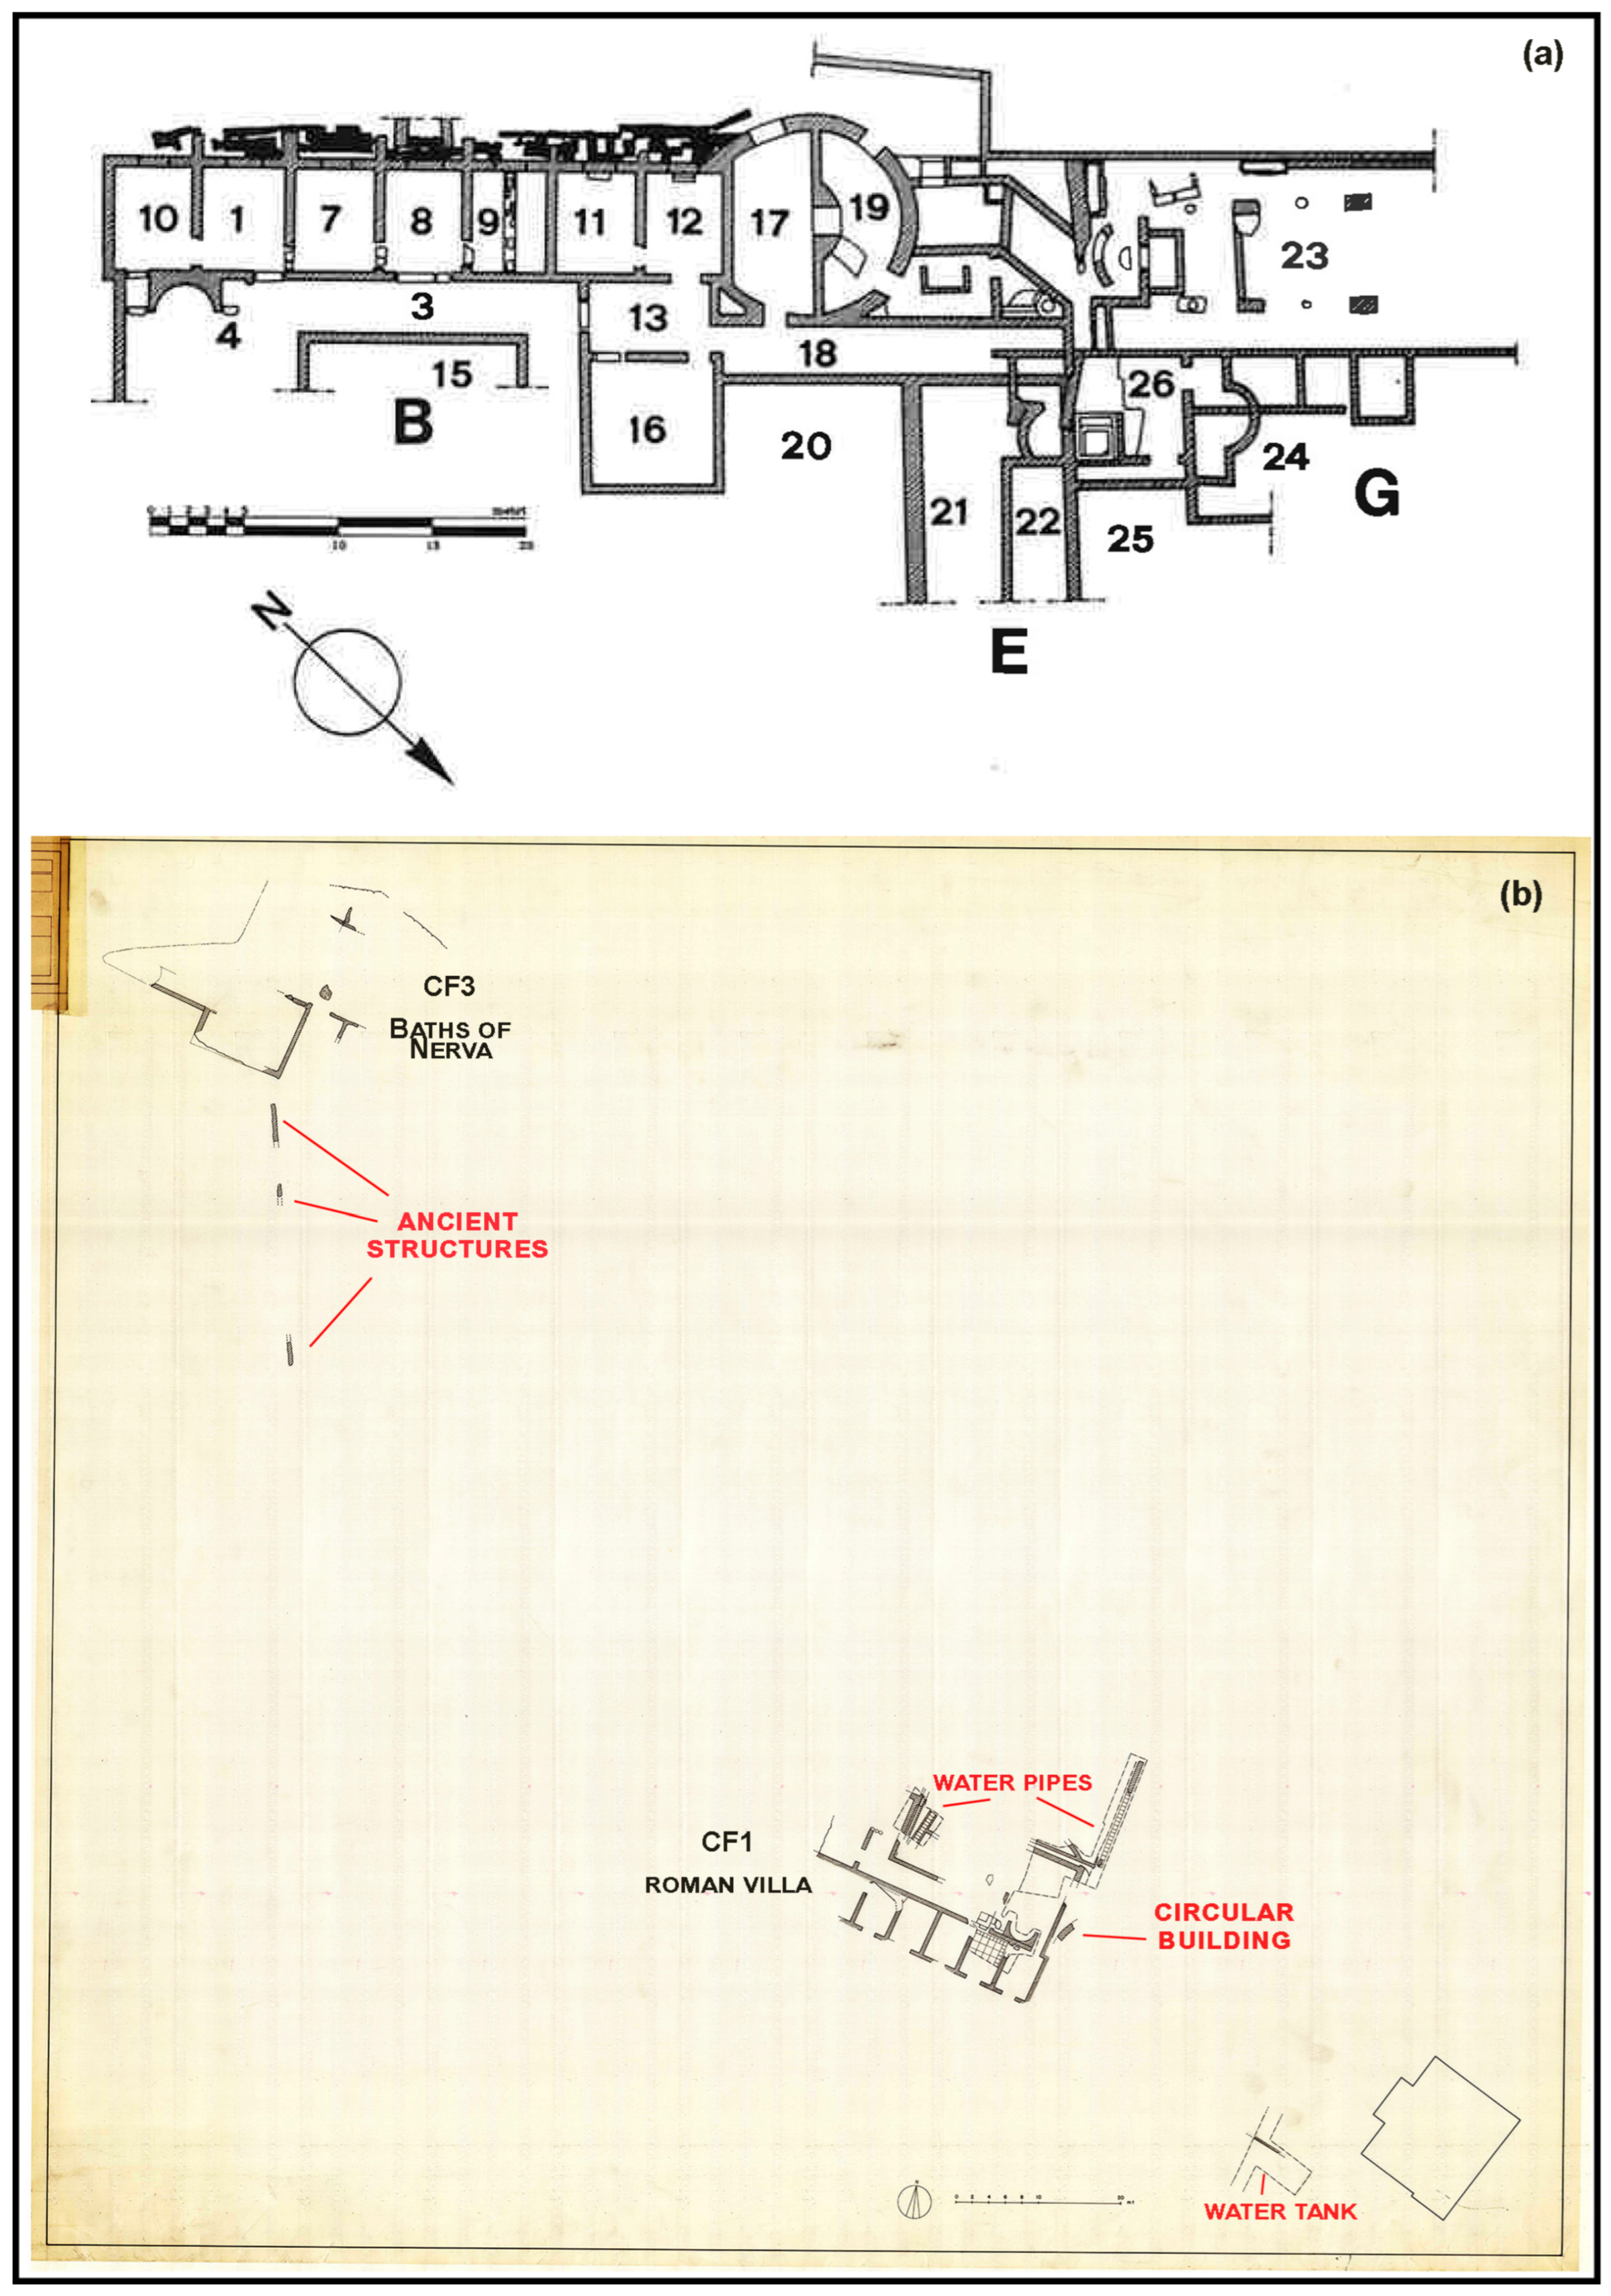
In addition to the published plans pertaining to the excavations conducted in CF1, the documentation available from the Superintendency’s documentation includes several planimetric surveys (general plans at 1:100 and 1:200) and detailed analyses of some hydraulic structures found in the excavation area (1:50, 1:20). Several drawings from 2008 show the entire site, including the three complexes, in a comprehensive view of the archaeological area.
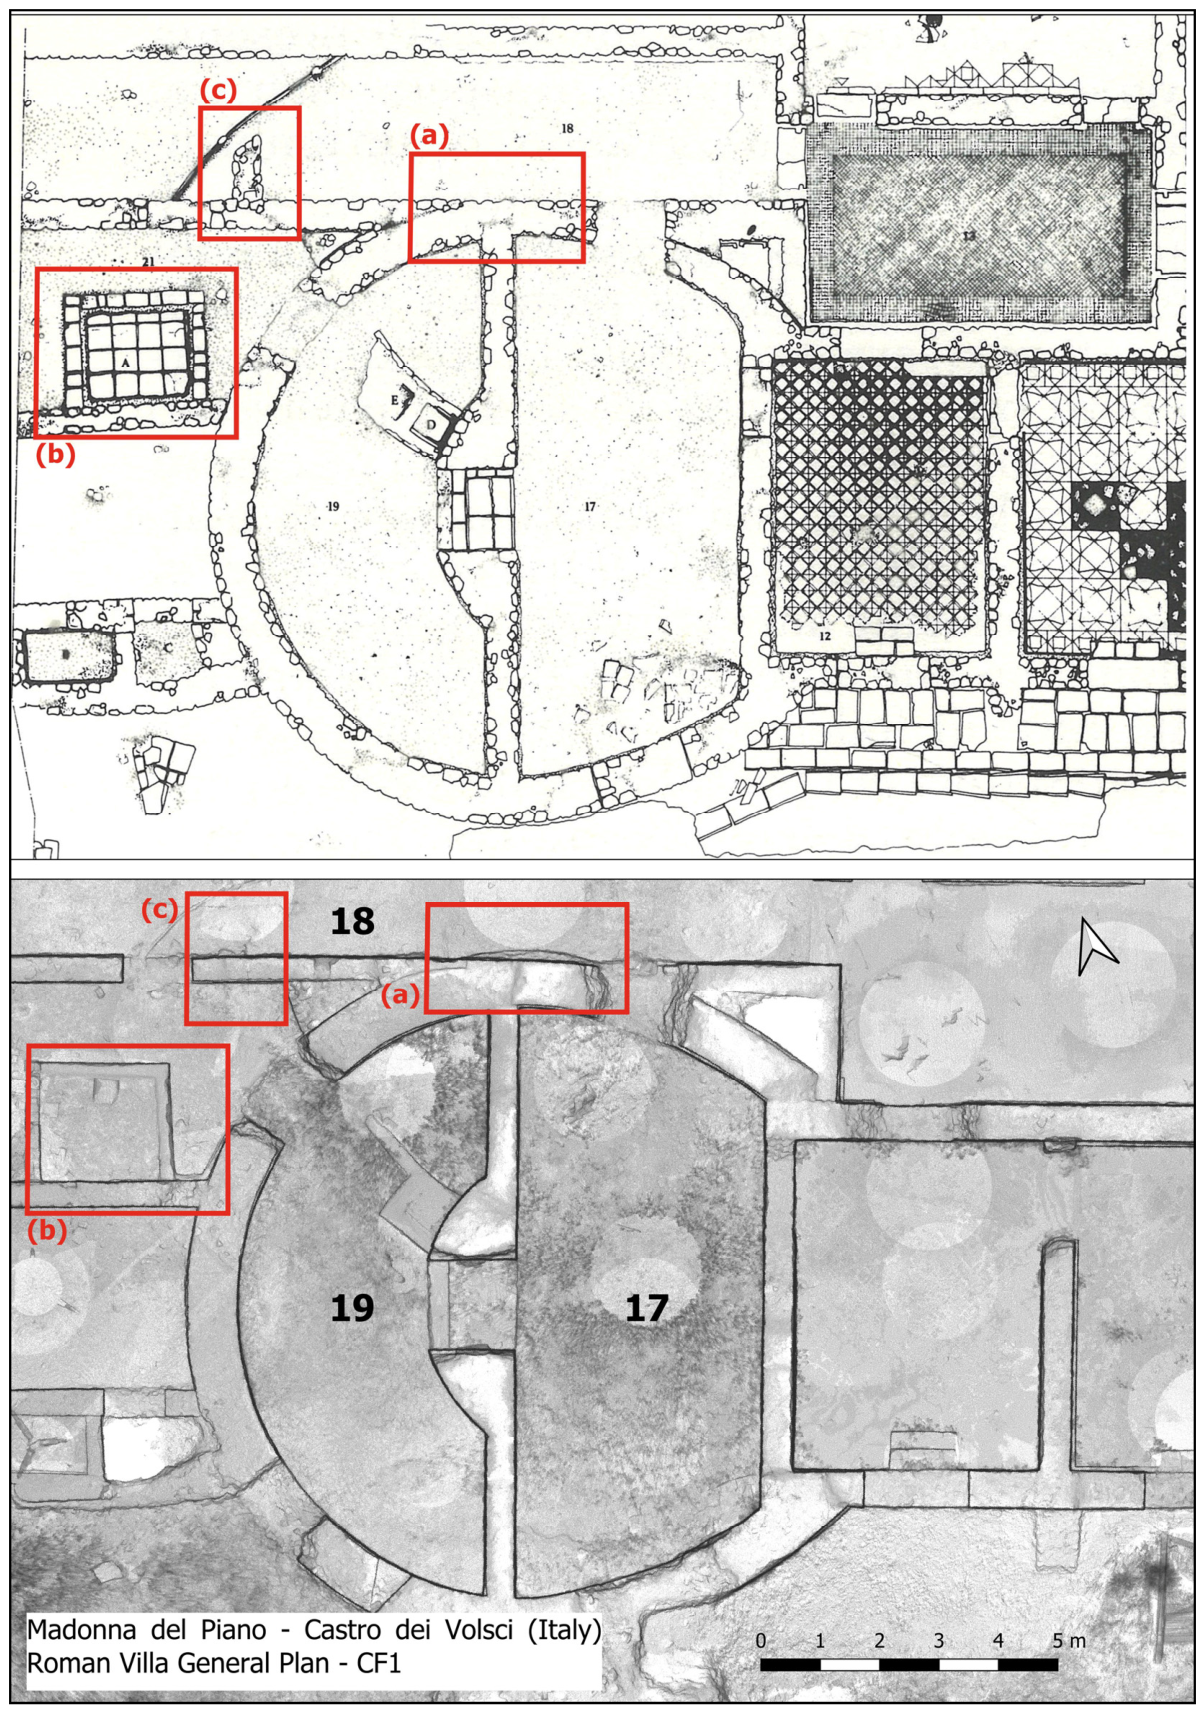
The documentary analysis revealed that the synthetic information is insufficient to ensure accurate archaeological interpretations because it provides a generic overview of this part of the villa (Figure 3a). In other cases, although the scales were too high, it was still possible to see more details about areas of the excavation that had been covered over and were hence invisible (Figure 3b). Important information that ran the risk of staying in the Superintendency’s archives might be verified thanks to this method. The most recent surveys, conducted in 2008, represent the villa as a whole and do not account for the many wall structures that comprise it, thereby contributing no valuable information to its study.
Through experimental survey tools and digital representation of the archaeological site, the project’s renewed archaeological survey work, along with critical observation of the existing structure, aims to learn about, protect, conserve, and value the Roman villa. A variety of surveys and analysis techniques, such as historical aerial photography, LiDAR (Light Detection And Ranging) surveys, Ground-Penetrating Radar (GPR) prospections, 3D modeling, and available historical and digital cartography, were incorporated into the chosen methodological approach. A territorial strategy was selected, combining the analysis of historical and photographic archive documents, reconnaissance activities, and in situ surveys within a unified methodological framework. This approach, widely used today in the archaeological field [7,8] and landscape archaeology [9,10,11,12], reflects a broader shift toward multi-scalar and interdisciplinary territorial analysis developed in Mediterranean archaeology [13,14,15]. In recent years, this framework has been further strengthened by the increasing availability of high-resolution digital datasets, open-access cartographic archives, and remote sensing platforms, which have allowed the integration of heterogeneous territorial data in ways previously unattainable [16,17,18,19].
In the last decades, LiDAR has become an increasingly important tool in Italian archaeological research, particularly in landscape-scale investigations of settlement patterns, infrastructure, and villa complexes. Numerous projects in central Italy have demonstrated the effectiveness of airborne laser scanning for identifying previously unknown archaeological features, including road systems and settlement structures in regions such as the Ager Faliscus and other areas of Lazio [20,21,22]. The increasing availability of national LiDAR datasets has significantly expanded opportunities for archaeological analysis. Yet, these datasets often vary in spatial resolution, vegetation filtering protocols, and acquisition density, which can affect their interpretative reliability at the site scale [23]. In the Lazio Region specifically, multi-scalar LiDAR studies, such as those conducted in the Monti Aurunci region, have demonstrated the value of high-resolution datasets for detecting subtle archaeological features otherwise difficult to identify through traditional survey [24]. Consequently, while national LiDAR coverage provides an essential baseline, locally acquired higher-resolution datasets remain necessary for detailed topographic analysis and the identification of low-relief architectural features.
GPR prospections have been widely applied in archaeological investigations across Lazio and nearby regions, particularly in the study of Roman and Etruscan settlement landscapes. Recent projects in northern Lazio, including investigations at Pyrgi and Veio, have demonstrated the effectiveness of GPR for identifying buried architectural remains and refining archaeological interpretations of settlement organization [25]. Similarly, integrated geophysical approaches combining radar with other techniques have been successfully employed in major villa contexts such as Hadrian’s Villa, where subsurface tunnel networks and architectural features were mapped without extensive excavation [26]. More broadly, research conducted by institutions such as the British School at Rome has highlighted the value of integrated geophysical survey strategies in the reconstruction of urban and peri-urban landscapes, particularly in projects such as Falerii Novi, where LiDAR and geophysical survey data have been combined to enhance spatial interpretation [27,28]. These examples demonstrate that the use of GPR within the present study follows well-established methodological traditions in central Italian archaeology and Roman villa research. Furthermore, the interoperability of data across platforms ensures useful results for the overall state of knowledge and for in-depth analysis of the territory from various perspectives [29,30]. The activities provided for by the project are as follows:
  • territorial studies for reconstructing the relevant topographical context through the analysis of the ancient remains still visible;
  • non-invasive analysis of traces and anomalies on the ground to discover still buried archaeological structures;
  • indirect instrumental survey activities for a new archaeological representation and the georeferencing of the numerical model of the area;
  • generation of a digital photogrammetric model of the area with the goal of extracting orthophotos for various types of mapping and research, which can be used for study purposes and mapping of various kinds;
  • study of masonry stratigraphy with the aim of identifying a relative date of the archaeological site by examining construction techniques;
  • characterization of the masonry’s changes, including the identification and mapping of the various materials used and the relative pathologies of degradation, with the goal of creating conservative restoration measures;
  • development of an experimental system that projects archive photos onto the site’s numerical model to compare what is visible now with what was documented in the 1990s.
The primary goal of this study is to enhance the knowledge of the Roman villa of Madonna del Piano by combining multisource and multiscale datasets into a single spatial framework. Specifically, the research aims to reconstruct the topographical context, identify previously undiscovered buried structures through non-invasive methods, produce precise 3D representations of visible remains, examine masonry stratigraphy, and incorporate archival documentation to support the reconstruction of the architectural and functional evolution of the site. Over the last two years, research on the site has enabled significant archaeological data, providing new insights into unexplored topics. New interesting interpretations that had not been previously thought of have emerged throughout the fieldwork, when combined with graphical elaborations and an analysis of the edited data.

2. Materials and Methods

Since 2024, both historical data and new data obtained using a top-down, multi-method, and multi-scale approach have undergone thorough examination and processing. The general idea for studying the area was to use as much raster and vector data as possible, and integrate it into a GIS (Geographical Information System) platform. If the comparison of various data sources occurs at overlapping levels, the analysis of archaeological anomalies in the area can be emphasized. Within certain limits, these overlays in a GIS system provide a more immediate reading of anomalies or elements that are typically hard to notice. It was therefore decided to integrate and analyze the historical cartography of the region and the digital cartography available in online repositories, as well as to incorporate all the data (raster and vector) into a GIS system (QGIS Geographic Information System (QGIS Development Team, 2024), Open Source Geospatial Foundation Project, https://www.osgeo.org/, accessed on 15 December 2025). The materials and methods used during the fieldwork are briefly described in the sections that follow.

2.1. Use of LiDAR Technology

The first phase of the research focused on the use of online digital cartography, specifically digital terrain models derived from LiDAR technology. LiDAR and interferometric data covering nearly all of Italy at different resolutions, particularly with a 1 m and 2 m grid resolution (for the coasts), for generating detailed models, are now available on the website of the Ministry of the Environment and Energy Security (MASE) (https://sim.mase.gov.it/portalediaccesso/mappe/#/viewer/new, accessed on 15 October 2025). DSM (Digital Surface Model) and the DTM (Digital Terrain Model) raster data were acquired for the Madonna del Piano area with a 1 m grid resolution. The grids associated with the raster represent a very useful basic tool for additional geomorphological processing of the territory and the creation of thematic maps, which can be linked to the area’s vector data, which are accessible online on the Open Data Lazio portal (https://dati.lazio.it/dataset/?tags=CTR, accessed on 10 September 2025). After this step, it was planned to use a LiDAR-equipped drone to perform a preliminary, detailed flight of the villa area. This was required for a detailed examination of the site because the archeological area was covered by dense scrub vegetation in certain key locations. The flight was performed with the DJI Matrice 300 RTK aircraft (DJI Science and Technologies Ltd., Shenzhen, China), equipped with the Zenmuse L1 LiDAR (DJI Science and Technologies Ltd., Shenzhen, China), used for mapping and 3D modeling of the territory. The system has a detection range of 450 m with 80% reflectivity and can detect up to 240,000 points per second in single-mode and up to 480,000 points per second in multi-mode. The LiDAR was positioned at an altitude of 70 m with the sensor inclined at 70°. The flight was conducted at a speed of 3 m/s at an intersection within a regular grid with a 60% overlap of the strips. The RTK (Real-Time Kinematic) system ensures the correct positioning of the LiDAR along the predefined trajectory. The DJI Terra software (V5.0.2) (Shenzhen, China) was used to process the point cloud. Once the point cloud was generated, a workflow completely based on open-source tools was used to segment the point cloud and improve the obtained results [31]. The workflow was developed using CloudCompare software (V2.13.2) (Telecom Paris Tech and R&D division of EDF, Paris, France) to achieve the following: outlier removal and resampling; automatic ground classification (CSF) [32]; noise reduction with SOR; generation of raster products; Digital Terrain Model (DTM); and Digital Surface Model (DSM).

2.2. Analysis of Historical Cartography

Every historical map of the area was carefully examined. In the majority of Frutaz’s maps of Lazio, many details are obscured, and frequently just the toponym “Castro” is identifiable, referring to the medieval center’s fortified core rather than the lowland settlement where the villa developed [33]. The 1851 Vienna IGM map, in addition to the location of the hilltop settlement, also includes the toponyms “Madonna del Piano” and “Ponte Falascoso”.
The Gregorian Cadastre has a good representation of the Castro dei Volsci region, which was part of the Papal States. The State Archives of Frosinone has previously digitized the land registry data, which is reasonably comprehensive [34]. The Castro dei Volsci area is depicted in the original maps (1:2.000) and in the so-called “small maps” (1:4.000 or 1:8.000), which are reduced maps of the various localities in the municipality, including Madonna del Piano. The maps were georeferenced on Google’s digital cartography using the QGIS GDAL Tool georeferencer in order to further analyze the differences with the current territory.
As is widely known, georeferencing requires identifying homologous points to solve the equations underlying the raster image’s rototranslation processes. Finding similar points on two images that are so far apart in time is the most challenging. For this reason, the first georeferencing process was carried out using the Madonna del Piano map, where the town’s extension was larger, and there was more information on still-existing landmarks. In this case, some points relating to existing road intersections, geometrically distributed evenly across the entire territory, were used. The resulting georeferencing had a limited projection deviation, taking into account the differences in resolution and scale between the two images.
With the digitized, detailed maps, second-order georeferencing was performed based on the map rather than on the Google digital cartography. In this way, the two tables of interest in the Madonna del Piano area were correctly georeferenced, verifying persistence and discontinuity in the survey area.

2.3. Photointerpretation of Historical Aerial Photographs

Historical aerial photographs of the Madonna del Piano area, taken between 1944 and 1954 [35], were collected and systematically analyzed. This was crucial, as they documented the villa’s layout prior to the excavations. Part of the sequence is also mentioned in the news item from the 1960s cited before, which already made the complex’s layout very evident.
Once more, online archives provided valuable support for the research. The area of Castro dei Volsci was recognized using the webGIS interface of the Central Institute for Cataloging and Documentation (ICCD) (http://www.iccd.beniculturali.it/, accessed on 12 May 2025), which offers access to the National Aerial Photo Archive. The 15 photos on the list were taken between 1944 and 1954 at different altitudes and with varied extensions.
In addition to the web interface, there are photo indexes on IGM maps. These frequently include additional flights and swipes from other eras and at lower altitudes, which preserve a high resolution for archaeological photointerpretation.
Images from the 1944 and 1945 Royal Air Force (RAF), the 1954 Base Flight, and the 1975 photos obtained by the Aerial Photography and Photogrammetric Surveys Company (S.A.R.A.) have all been identified for the Madonna del Piano area; all of these photos date before the excavation activities carried out in the 1980s.
The 1945 RAF aerial swipe, which was taken at a lower altitude than the other existing ones, clearly shows the region surrounding the villa. The RAF images, in this case, have a scale of 1:15.000 and were shot from an altitude of 7.000 m above sea level, whilst the 1954 Base Flight photos are quite sharp, but the resolution compromises their readability because they were taken at a scale of 1:35.000.
The QGIS platform was used to georeference the photos after they had been recognized. The images have good definition and contrast for data interpretation, and the projection deviation was quite minimal. The images exhibit adequate contrast and definition for data interpretation.

2.4. Geophysical Prospections

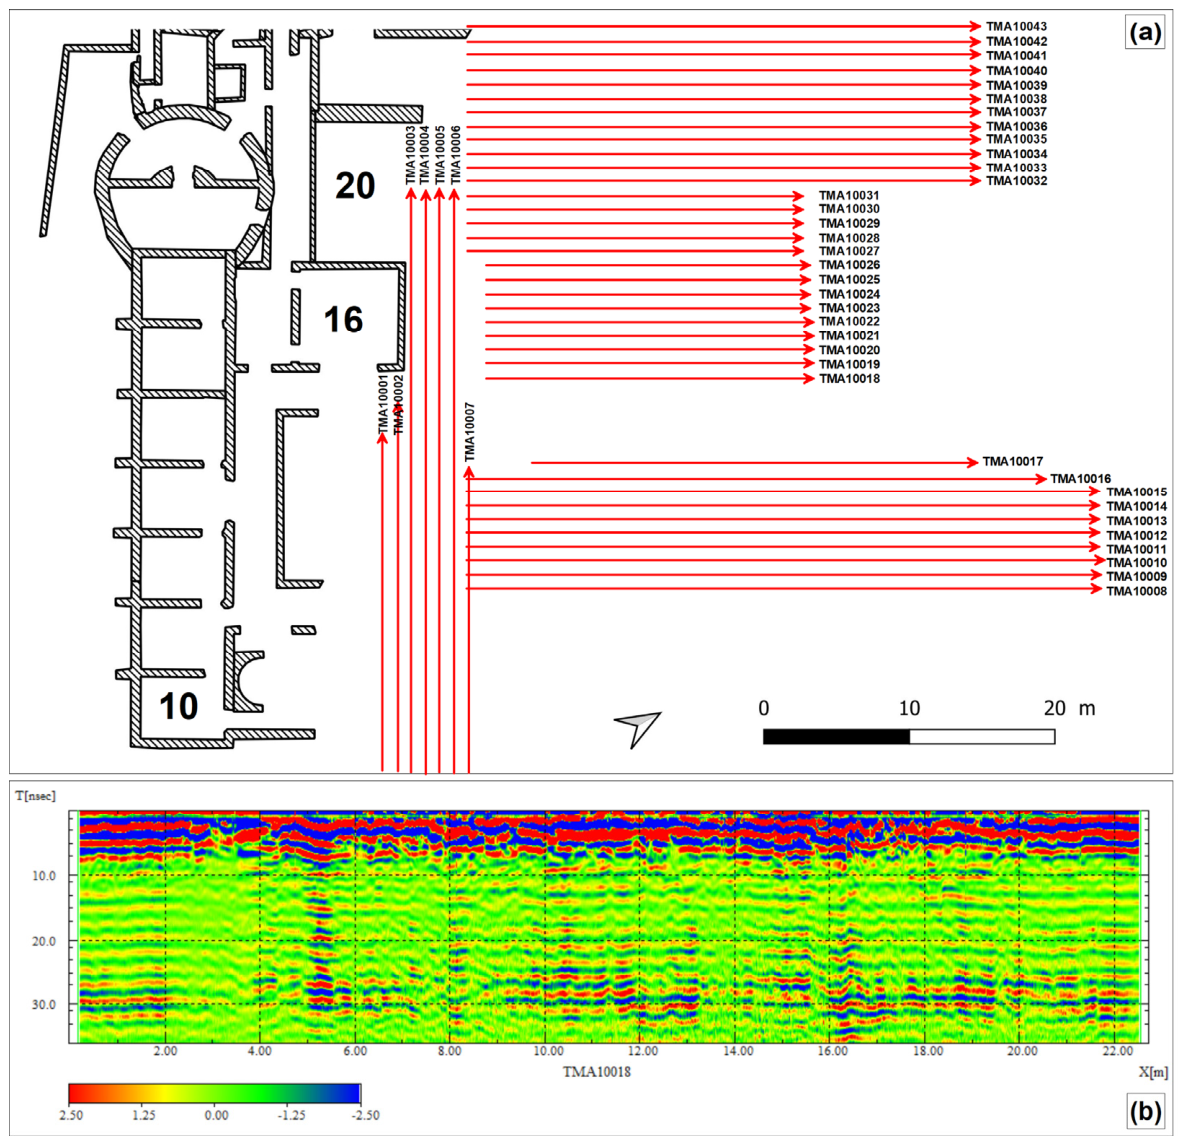
In order to confirm the existence of subsurface structures, GPR investigations were conducted in CF1’s northern sector. The GPR method was considered more appropriate than the magnetometric, electromagnetic, and geoelectric approaches due to the requirement for a quick, shallow (within 1–2 m in depth), high-resolution investigation in the presence of interference from the metal structure covering the excavation. During data collection, the RIS K2 Georadar (IDS GeoRadar s.r.l., Pisa, Italy) was employed, fitted with a multi-frequency TRMF antenna (200–600 MHz). The survey covered the area using a regular grid of 43 profiles spaced 1 m apart, as reported in Figure 4a, considering the total size of the investigation area and the investigative aims.
Radar reflections on each line were collected as 16-bit data in a time window of 90 ns, capturing 512 samples per radar scan at 25 scans per mark (unit/marker, 1). The frequency of 600 MHz provided the higher resolution and was therefore considered optimal for subsequent processing. Raw data were analyzed using the IdsGred_5.2 [36] and GPR − SLICE 7.0 software [37] utilizing conventional methodological approaches: data and trace editing, subtraction of the dc-drift (wobble) in the data, time-zero correction, bandpass filter, background removal, and automatic gain. No clear and unambiguous hyperbolic diffractions suitable for quantitative velocity estimation were identified in the radargrams. As shown in the example reported in Figure 4b, most reflections are characterized by shallow, laterally continuous or diffuse patterns rather than discrete point-source responses. Such variability is commonly associated with mixed archaeological deposits, structural remains, and collapsing materials, which typically produce heterogeneous electromagnetic properties [38,39]. For this reason, formal hyperbola fitting was not systematically applied. Published studies indicate that typical radar velocities in mixed soil–masonry archaeological contexts commonly range between approximately 0.08 and 0.12 m/ns, depending on moisture content and soil composition [39,40]. These reference values were used only to provide indicative depth ranges, while interpretation in the manuscript is primarily based on two-way travel time (ns), following the approach used in other heterogeneous archaeological contexts [41,42]. In order to give an idea of the depth of investigation, an average velocity of about 0.1 m/ns was considered, giving a depth scale ranging from 0 to 1.5 m. Migration tests were considered but not systematically implemented.

2.5. Three-Dimensional Terrestrial Survey

The first step was to conduct a new survey of CF1, as the currently available documentation is incomplete and inaccurate from a geometric point of view; in addition, the structures are not represented at the proper archaeological scales to enable precise technical analyses.
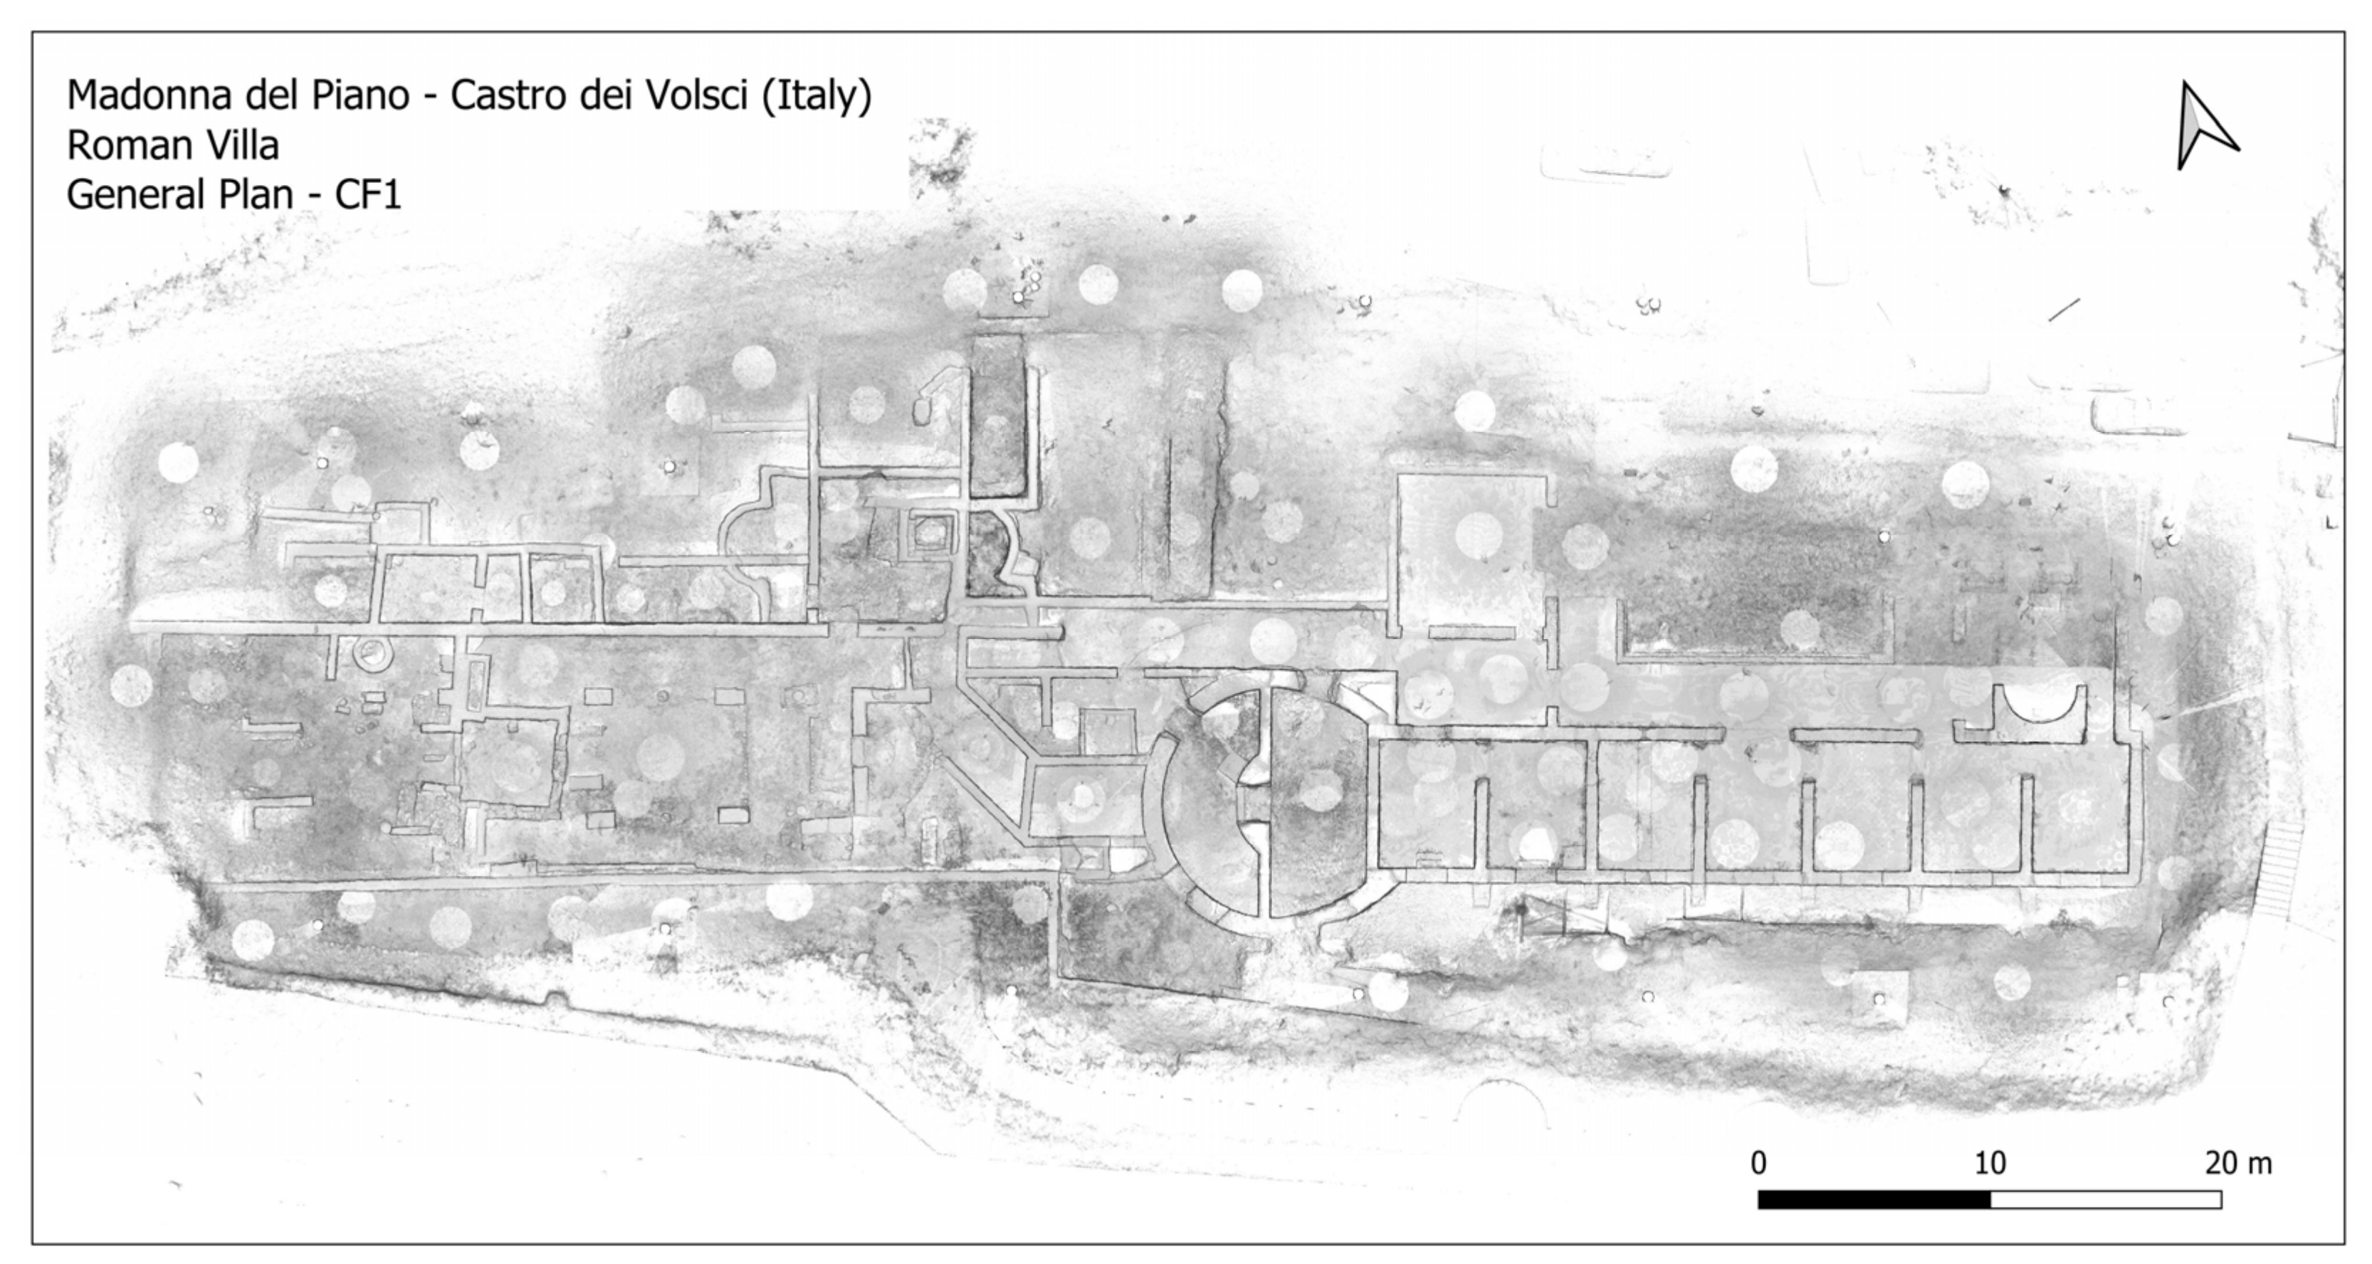
The 3D geometric survey activities aimed to represent in great detail every structure of the archaeological complex that is currently visible. Therefore, the terrestrial laser equipment (Faro 120/330 Laser Scanner, (Faro Company, Lake Mary, FL, USA)) and multi-image photogrammetry was implemented for the survey of the wall facades and mosaics [43]. More than 100 scans of the CF1 were performed with a resolution of 1 point every 6 mm to 10 m. JRC Reconstructor software (V4.4.2) (Gexcel, Brescia) was used to process data. The clouds were pre-processed by applying noise-removal filters and computing confidence and normals for definition of planes. After standard filters were applied, ICP algorithms were used to orient and align the clouds with an average overall deviation of 3 mm. In order to provide an adequate archaeological representation of the area, the laser survey was also used to obtain a planimetric view of the entire complex through a high-definition representation (X-ray representation, resolution of 2 mm/pixel), which highlights the apparent contours and edges and brings out the main lines of the structure with extreme clarity.
The structures that had emerged and already been excavated in the 1990s were surveyed and integrated into the overall study. Having a 3D numerical model that could be edited and implemented over time was advantageous [44]. A reflex/mirrorless camera with fixed optics (14 mm, 28 mm, and 50 mm) allowed to survey the features of every wall face in the area for a comprehensive high-definition graphic representation through the use of multi-image photogrammetry.
A GNSS survey (Geomax) and a total station (Leica TS06+) survey were used to integrate the geometric survey. Specifically, a 15-point GPS network was inserted within the area of the villa in order to eventually encompass CF2 and CF3 inside the Gauss-Boaga projection system, which is where the majority of the Lazio Region database’s data are oriented.
On the other hand, the use of the total station allowed verifying the error deviation (2 mm) between the various scans and their reciprocal registration at specific points of the villa.
The study and technical analysis of the archaeological structures were based on the 3D survey activities, which allowed for the real-time measurement and control of scattered measurements on the villa, especially the relationship of the elevations between the various USMs (Masonry Stratigraphic Units) identified, even in very remote areas. The planimetric restitution enabled the visualization of several anomalies and differences with previous surveys, resulting in a more objective and logical description of the monumental complex’s building process.

2.6. An Innovative Approach to Archival Photography for the Analysis of Construction Techniques

From the beginning, there have been analytical challenges in interpreting the wall stratigraphy in the Madonna del Piano archaeological area, particularly in the southeastern sector that corresponds to the Roman villa’s pars urbana. The restoration work carried out during the site’s first excavation campaign, which took place between 1984 and 1992, is the main cause of complexity. These interventions, which frequently came at the expense of preserving the masonry’s authenticity, were intended not only to guarantee the structural stability of the remains but also, perhaps more decisively, to provide a uniform and aesthetically pleasing appearance of the wall structures. After a closer examination, it was revealed that the same limestone blocks that were typical of the original opus incertum stonework, the building complex’s predominant construction method, had been used to both fill existing voids and build a crowning course. This clear disregard for the principle of distinguishability made it a difficult challenge to discern between modern restorations and original Roman masonry. A few restoration date marks and minor undercutting in the 1990-rebuilt masonry sections are insufficient to differentiate later additions from the Roman structures. Although this approach was likely required to restore the masonry’s overall cohesiveness, it extended beyond targeted repairs and ultimately altered the entire wall surface.
For this reason, a reliable interpretation and assessment of the pars urbana masonry required systematic comparison with excavation records, particularly the photographic documentation preserved in the archive of the Superintendency (SABAP Archive), a comparatively unexplored collection produced by regular photographic campaigns documenting excavations, restorations, and finds from sites under its jurisdiction [45,46,47,48,49,50].
In peripheral areas, such as the Madonna del Piano site, where interventions were frequently conducted by non-specialist archaeologists, restorations were carried out hastily, and documentation was inadequate or inconsistent, photographic records represent the only reliable source for documenting the original condition and appearance of the site’s masonry at the time of excavation. Additionally, they are also essential tools for reconstructing the history of excavation, understanding the order of interventions, tracing the transformation of archaeological contexts over time, and supporting a more accurate interpretation of the remains and their stratigraphy.
The negatives of approximately 1380 images from photographic campaigns conducted at the site between 1984 and 1993 are preserved in the SABAP Archive. As part of the present research project, they were digitized in the spring of 2024 and then organized according to two main criteria: the year they were taken and the subject depicted. A high-resolution copy of the digitized images was deposited in the archive.
As part of the investigation, an innovative approach to wall facings study was tested by projecting historical images from the SABAP archive directly onto the current 3D laser-scanned digital model. This approach allowed for the integration of both qualitative and quantitative construction technique analysis. The aim was to select and use images from the 1990s photographic archive as a tool for projecting that era’s data onto the present numerical model. Several projection tests were performed for the occasion. Through the image mapping procedure (performed with JRC Reconstructor), a perspective image of the archive could be associated with the numerical model by using the principles of projective geometry [51]. Establishing correspondences between the image of interest and the numerical model composed of point coordinates was required in order to ascertain this biunivocal relationship. This process was carried out using the image calibration procedure. Determining the correspondence of a number of homologous points between the numerical model and the available image is required to fulfill the calibration [52]. As a result, it was required to identify at least 11 homologous points for every image, which is a challenging task considering the difference in resolution between the numerical model and the available images. Additional variables were also added to this problem due to the many types of acquisition performed at various angles. The image could be projected onto the model within the virtual space once these parameters were defined. The image mapping process is simple to perform when the numerical and photographic data are temporally coeval and acquired during the same survey time. It becomes significantly more difficult when the temporal distance is large and the context is different, as in this case.

2.7. Analysis and Classification of Building Techniques

In the framework of architectural conservation and restoration, masonry analysis was adopted as the main methodological tool for interpreting construction phases and site transformations [53,54,55]. Research on construction techniques has become a very specialized field in Italy, particularly for Late Antique and Medieval masonry. Donatella Fiorani’s studies on medieval construction techniques in the region are the main source used to interpret the site’s later phases [56].
In order to ensure an accurate and systematic cataloging, the investigation process was structured into five main phases with the goal of identifying, documenting, and contextualizing the different techniques, possible variants, and materials employed:
  • Phase 1—Identification of homogeneous masonry sections. Standing walls were examined to identify areas with distinct construction features, considering building elements, laying methods, and mortar characteristics. Direct observation was integrated with archival photographs to distinguish original surfaces from altered or reconstructed areas and to record later modifications.
  • Phase 2—Documentation and cataloging of different construction techniques and materials. The identified sections were documented through a graphic and photographic survey and recorded in catalog forms, integrating field and archival data on the 3D model. This supported the distinction between original and reconstructed portions, and the assessment of conservation conditions, materials, and workmanship.
  • Phase 3—Comparative analysis with documented construction techniques. The identified techniques were compared with those documented in the scientific literature from related chronological and geographical contexts, with attention to construction methods, material reuse, architectural solutions, and mortar composition.
  • Phase 4—Integration with archaeological stratigraphy. The collected data were correlated with archaeological stratigraphy to ensure chronological consistency and refine the diachronic reconstruction of the building phases.
  • Phase 5—Selection of sampling points for specific analyses. Sampling points were selected for targeted analyses of mortars, plasters, and other construction materials. Chemical, petrographic, and isotopic analyses were planned to refine the characterization of materials and construction techniques, with results feeding back into the comparative framework (Phase 3).

3. Results

The integrated analysis of raw data, interoperability, and critical interdisciplinary interpretation has highlighted important results for the Roman villa.
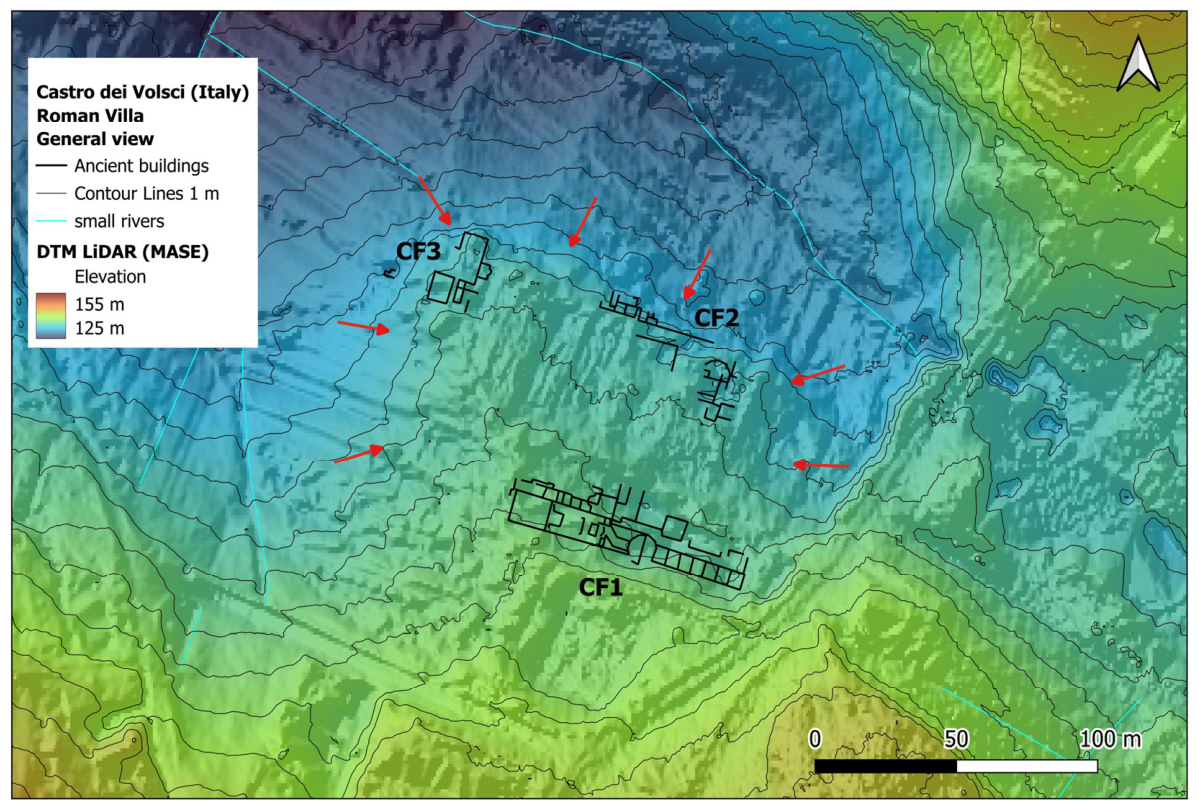
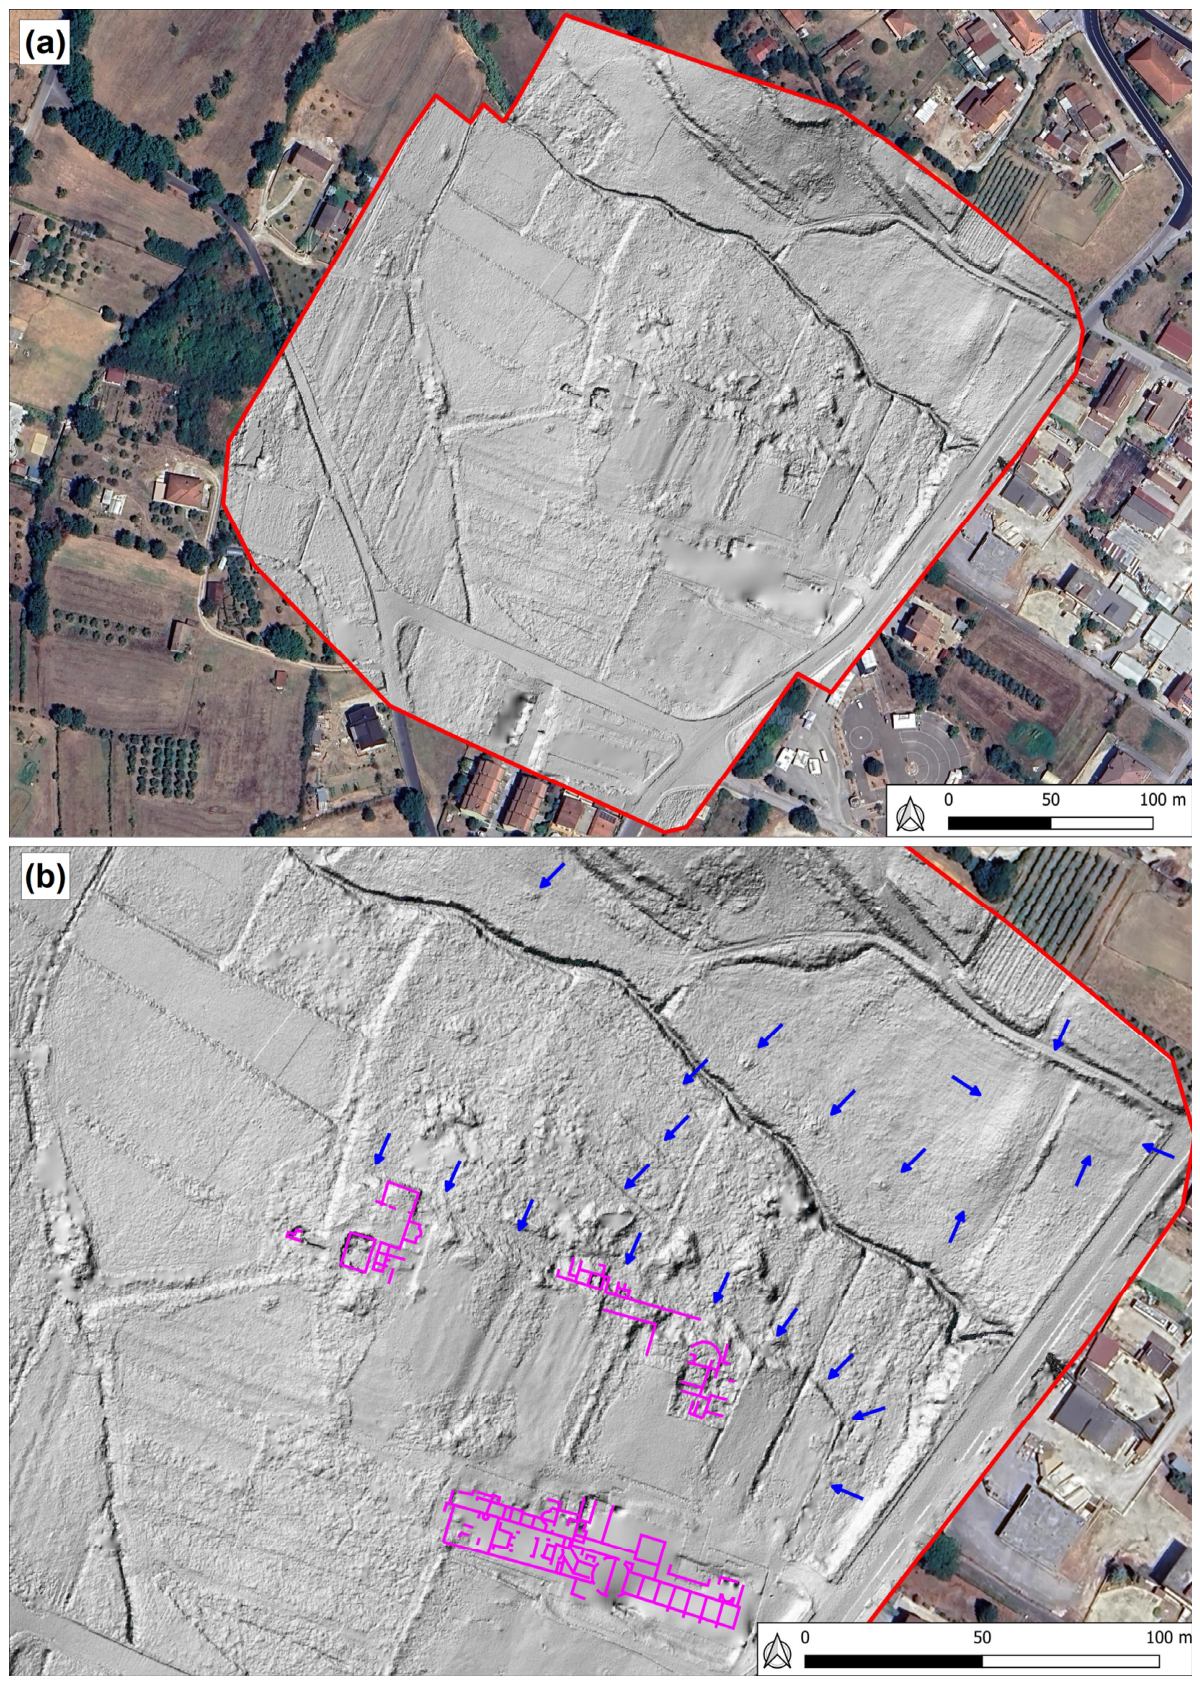
Figure 5 displays the DTM processed with a 1 m resolution grid using raster data for the Madonna del Piano area that may be found on the MASE website. The DTM analysis, integrated with the derivation of the contour lines, allowed for the exact delimitation of the villa’s planting plateau (shown by red arrows). The result is methodologically relevant due to the model’s high resolution and its ability to interpolate even in the presence of vegetation. Even if the resolution makes it impossible to define the presence of structures, some anomalies can be found.
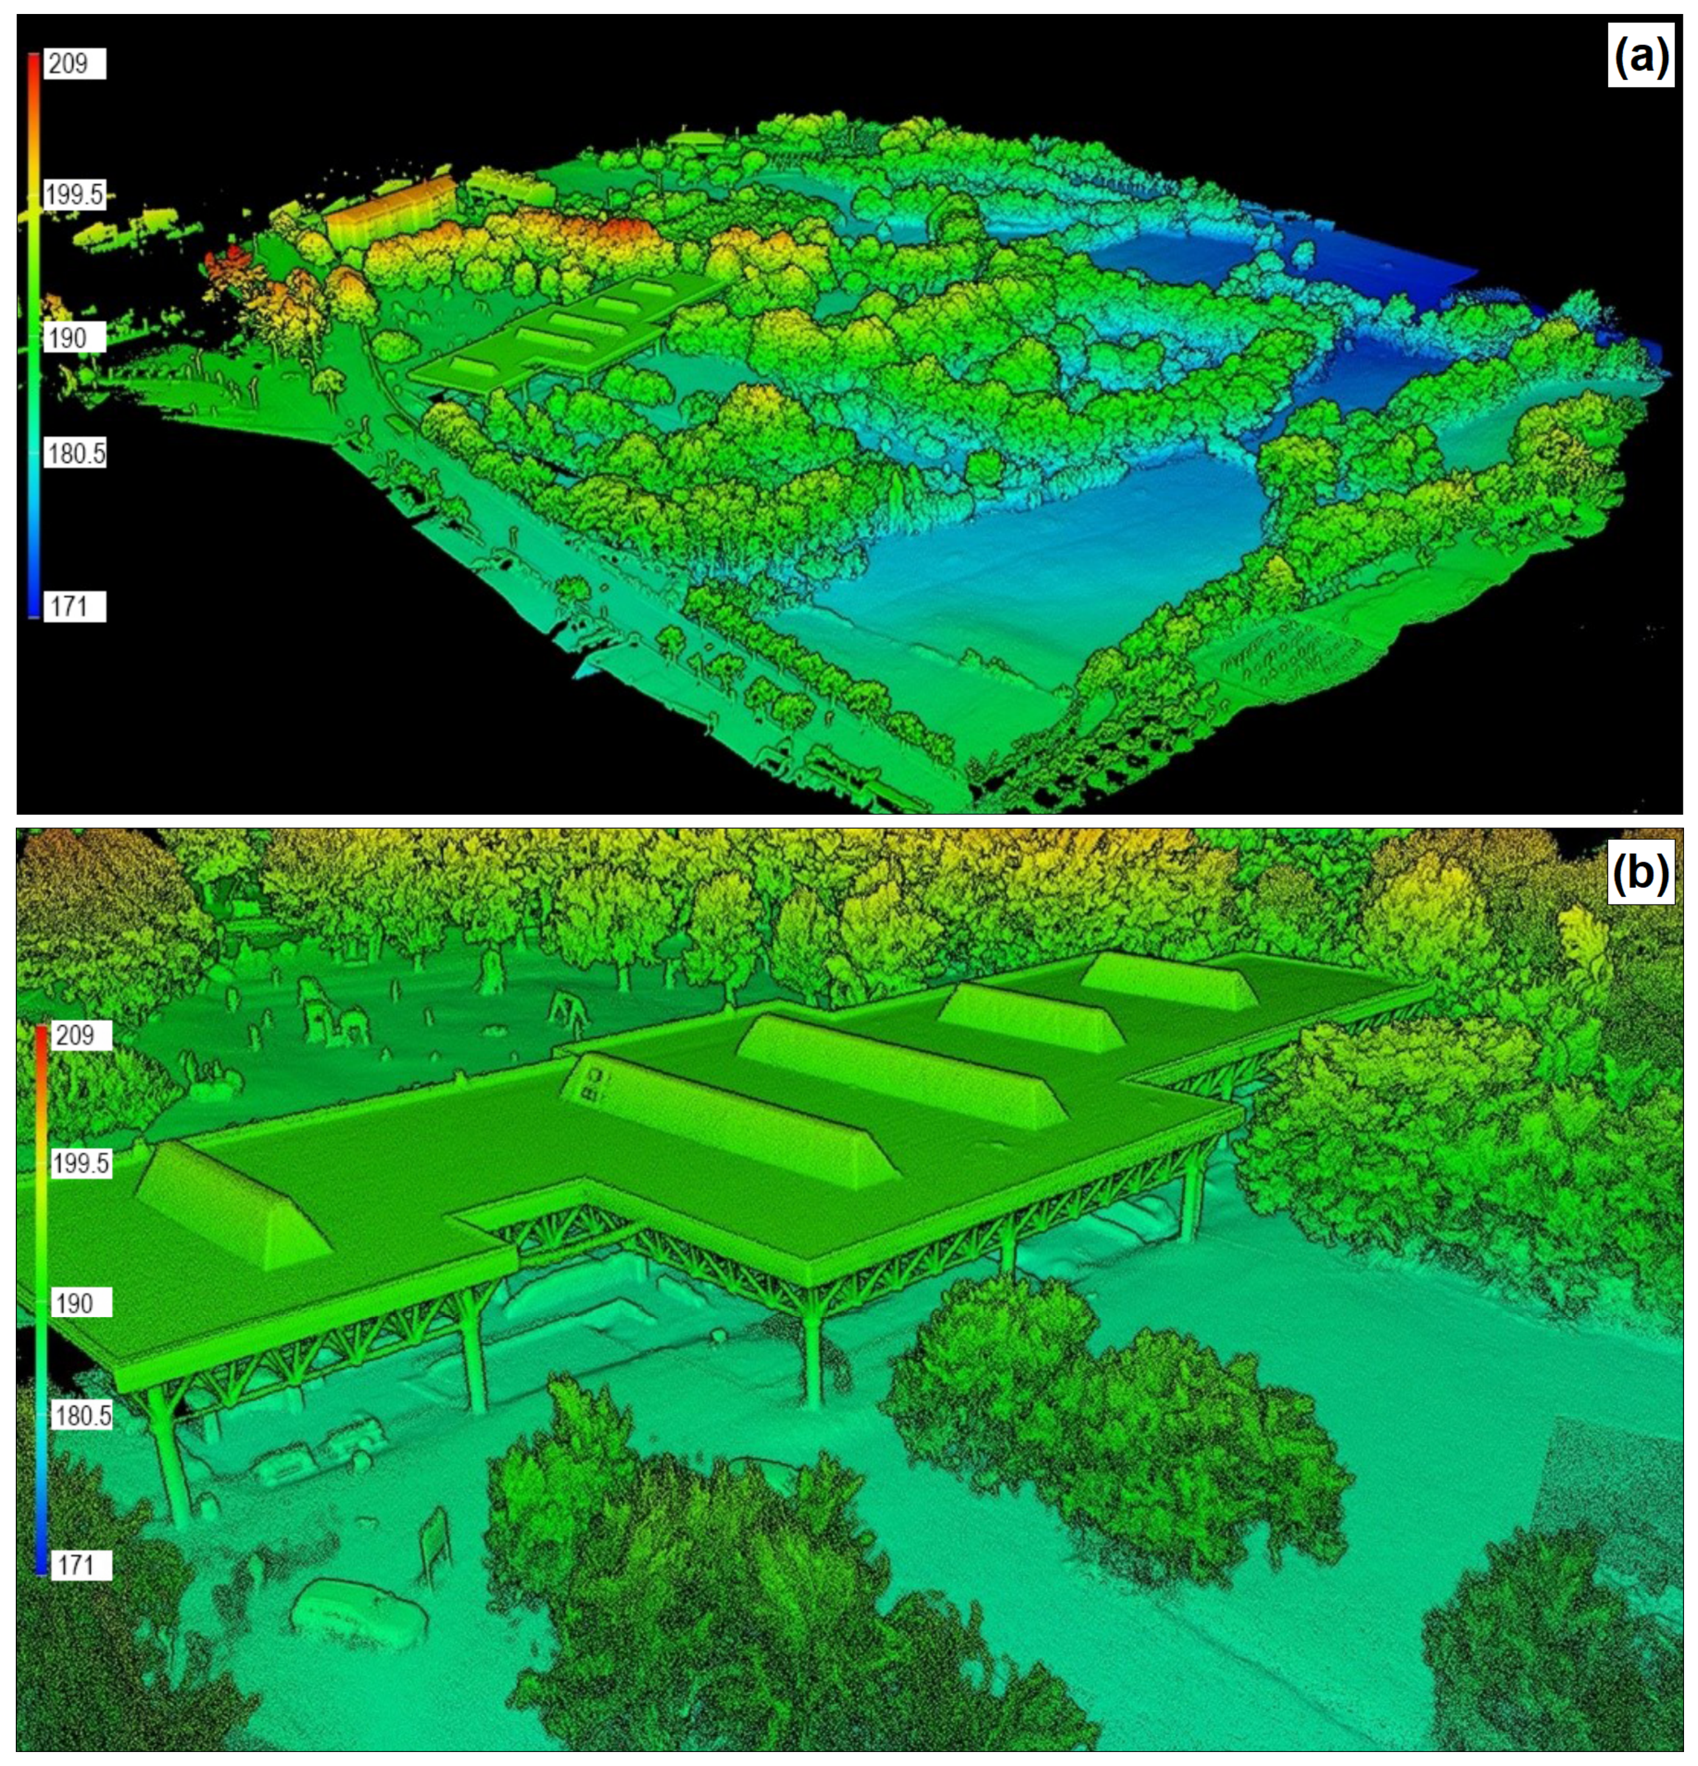
UAV-based LiDAR survey led to the acquisition of 280 million points. Figure 6 shows the overall area surveyed in the initial survey campaign, as well as a detail of the resolution used during filming.
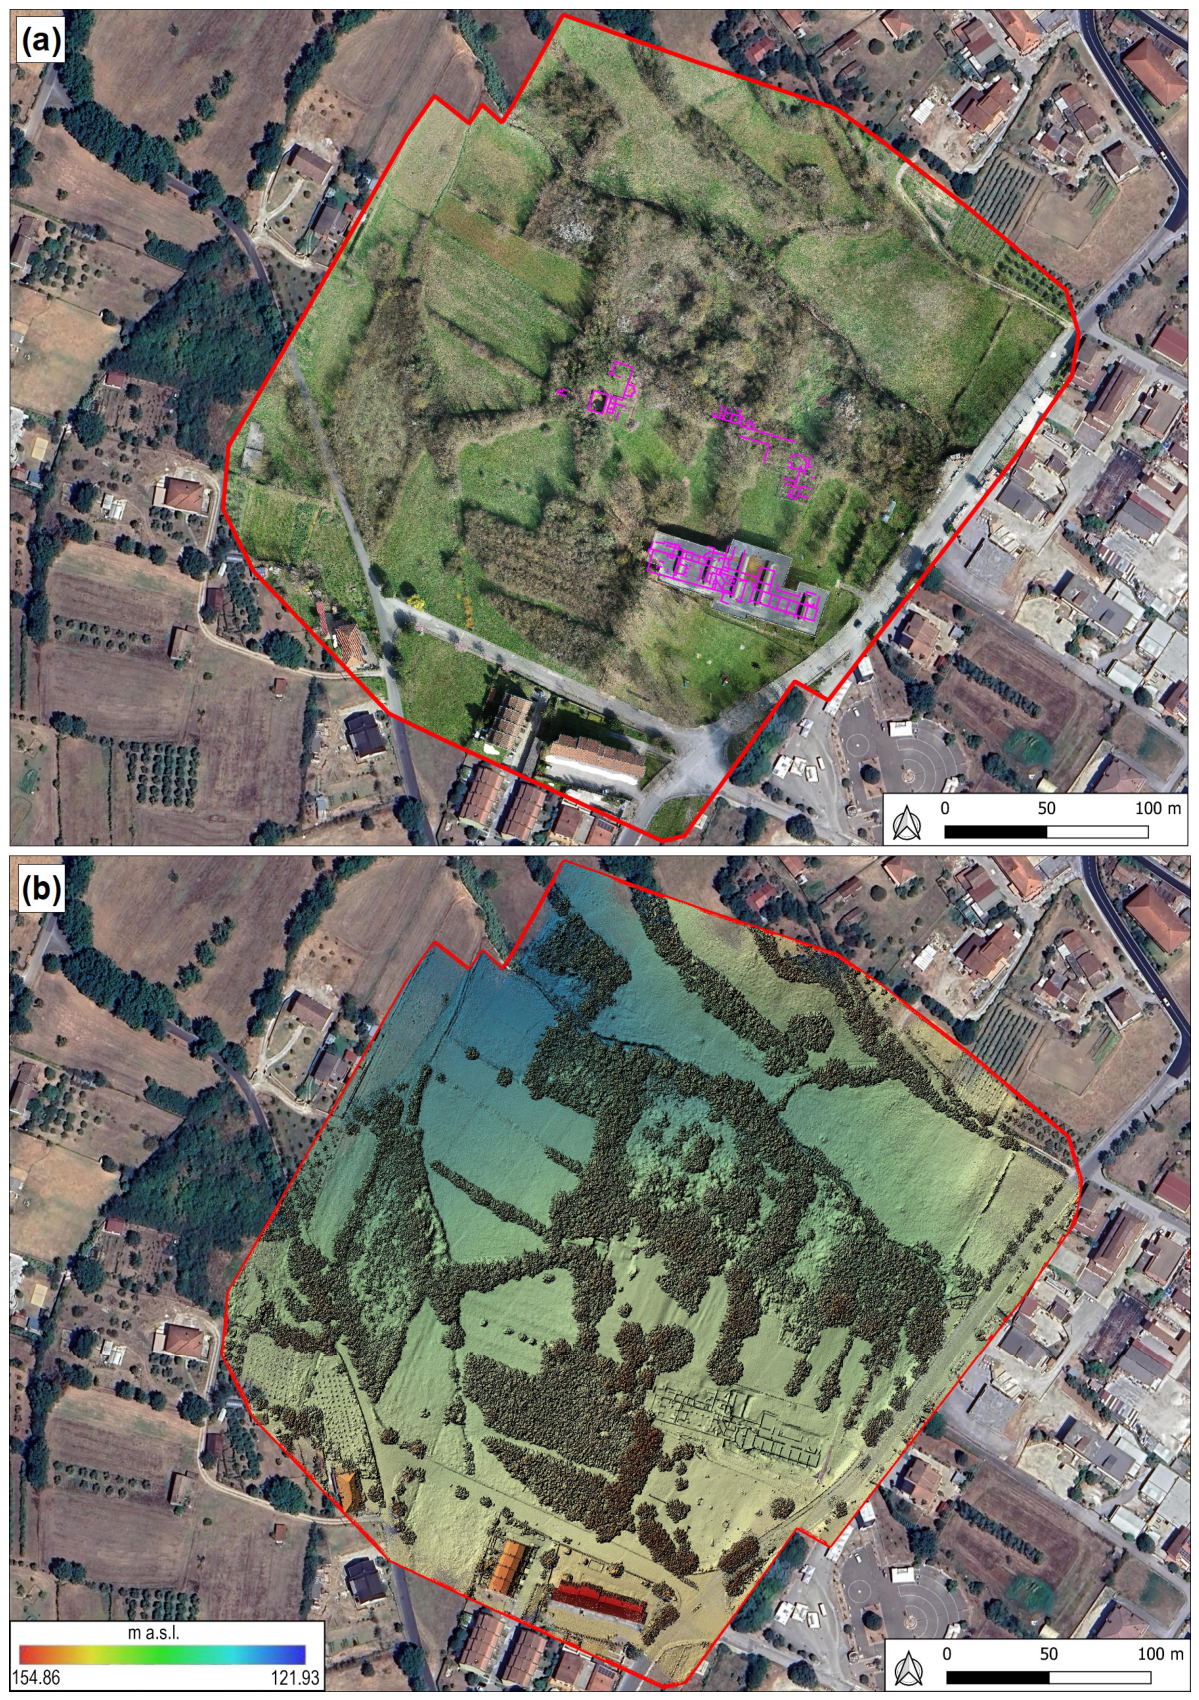
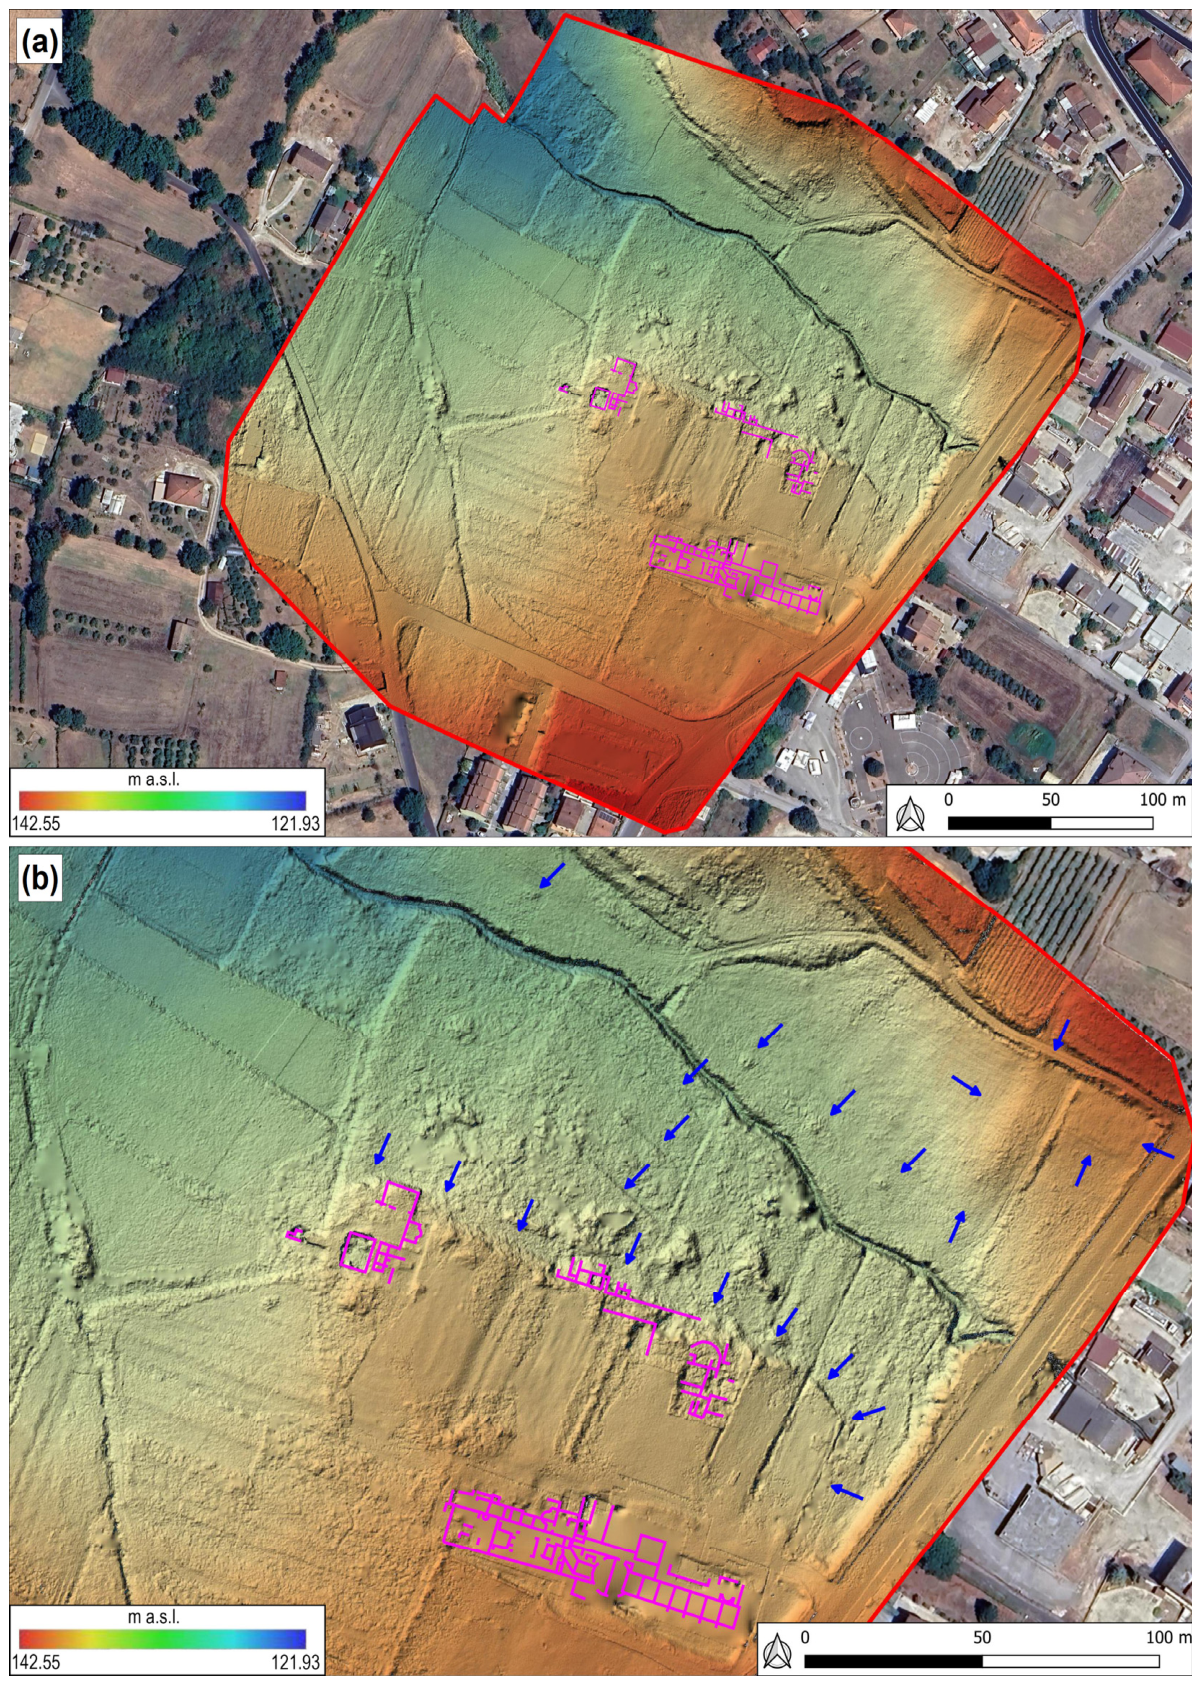
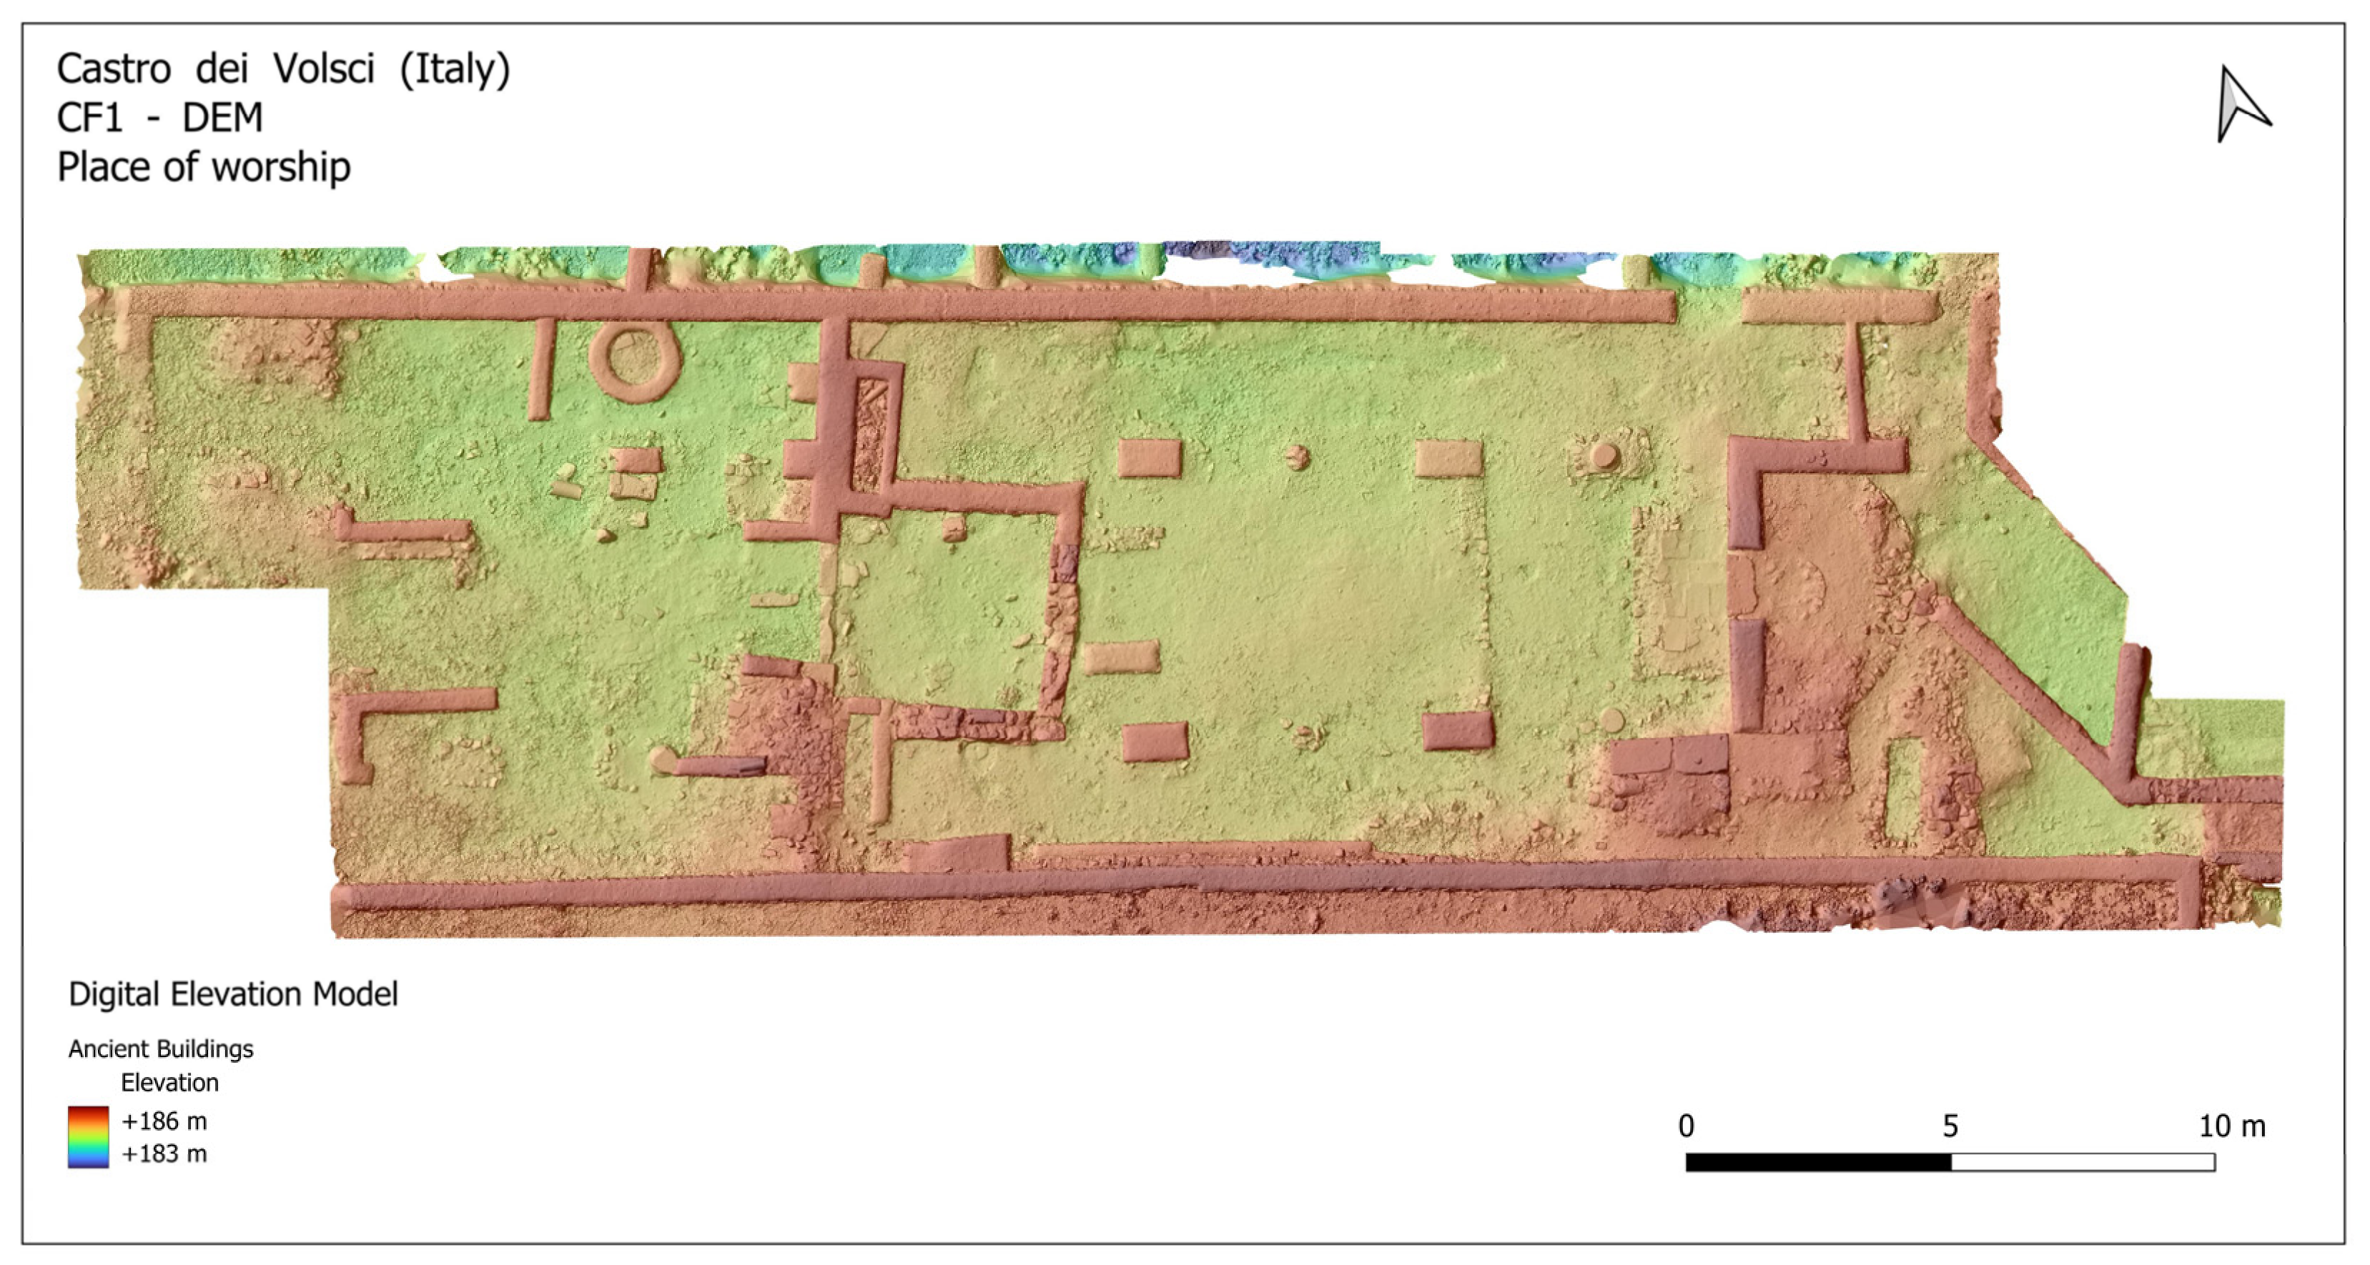
The UAV-based LiDAR survey provided an extremely detailed representation of the study area’s surface morphology, revealing features that would have remained invisible without a penetrative technology. GIS analysis of the generated models made it possible to identify potential archaeological structures and significantly improve the understanding of the villa’s layout and the surroundings. The processed data allowed to generate the orthophoto of the area (Figure 7a), the DEM (Figure 7b), a highly defined DTM with a resolution of 0.2 m (Figure 8) and a related shaded map with a scale exaggeration factor (Z) slightly higher than the standard value (1) for a better reading of the discontinuities present on the site (Figure 9). In order to obtain a comprehensive representation of the area, in Figure 7b, the DEM was additionally integrated with terrestrial laser scanning (TLS) data from CF1, obviously accounting for the varying margins of error in recording the point clouds and the accuracy of the two systems.
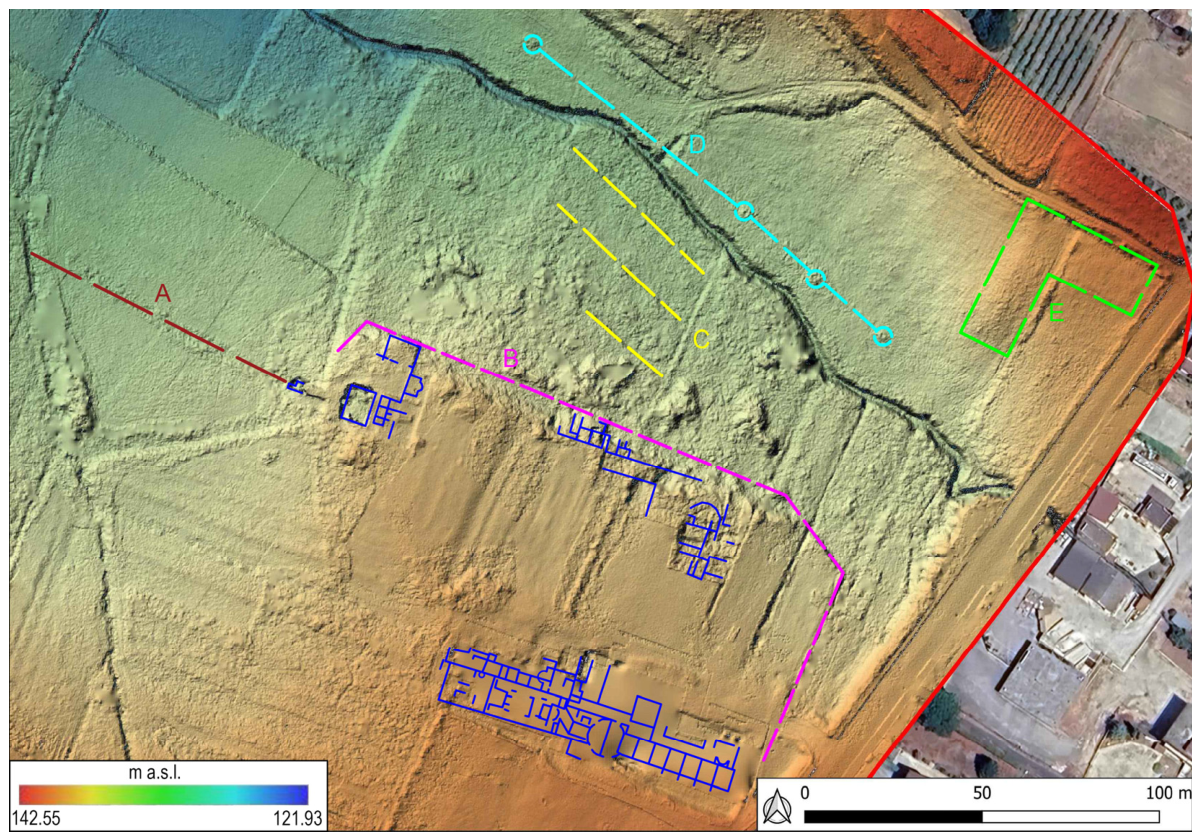
Figure 10 depicts the main anomalies discovered, which may help identify the Roman villa’s extension as well as other anomalies that are probably connected to further ground-level structures. The integration of archaeological features identified in the field with morphometric anomalies detected through LiDAR analysis, represented in the DEM and DSM models, allowed for the recognition of five main anomalies (A–B–C–D–E), interpretable as potential buried structures of various types and functions (Figure 10).
Anomaly A was detected for a total length of approximately 80 m and was oriented southeast–northwest. Starting from the thermal complex (Baths of Nerva), it aligns with the path of a channel. The underground structure, which was previously identified through surface surveying, may be interpreted as a component of a water-management system that is linked to the thermal installation.
Anomaly B, with sharply defined boundaries, appears to correspond to the plateau on which the villa stands. It is clearly recognizable in the chromatically scaled DSM and has an elevation that is noticeably greater than the surrounding terrain.
There are two further anomalies north of the channel. The first (D), which is oriented southeast–northwest and approximately 123 m long, may likewise be interpreted as a water-management element. Along its path, a number of circular anomalies with an average diameter of 4.50 m that are regularly spaced at intervals of about 20 m are also observed.
The letter C identifies three parallel lines with a NW-SE orientation.
Lastly, Anomaly E, which is located northeast of the investigation area, has an elevation that is significantly higher than the surrounding terrain. With an L-shaped layout and a total area of about 1.000 m2, it may be a significant structure that needs more research.
Current cadastral data was also uploaded to better identify these divisions (ancient and modern) and conduct a more thorough analysis of the results to solve some ambiguities and continue the overlay process between raster and vector data.
From the data integration, several considerations can be made:
  • The details of the LiDAR survey, when compared to the online survey, validate the plateau’s perimeter with a total area of about 2 hectares on which the three complexes are located.
  • Additional anomalies were discovered over a wider area in the villa’s northern sector, which may be attributable to underground structures and require a precise field assessment.
  • Within the integrated data analysis, particular emphasis was given to ancient water management and the hydrography of the region. The interest is due to the presence of the thermal baths in CF3 and a series of hydraulic structures pertaining to CF1. Furthermore, a water spring that is still in use is located approximately 500 m from the villa. This constitutes the complex’s hydraulic infrastructure, along with the drainage and control systems within the villa and bath complex. Furthermore, the plateau slopes northwest, and the level difference between CF1 and CF3, which are approximately 100 m apart, is about 1.5 m, which favors the flow of water in this direction. The place name “Via del Formello” refers to the location of the water spring and stream that were already noted in the Gregorian Cadastre.
Based on available WMS (Web Map Service) data, the main water spring has a current flow rate between 250 and 1000 L/s; a second, smaller water spring has also been recorded to the southwest of the system, which is likely not used by the villa, given its greater distance. The proximity of the water spring and the stream that flows through the present-day village, north of the villa, must have influenced the choice of site. The site plateau still has a natural slope, but retaining walls on its north side raise it by approximately 2 m. Therefore, it is plausible that the stream’s waters were collected through one or more intake points and distributed towards the thermal sector (CF3) as well as the CF1 area, where lead pipes coming from the east are still visible. The intake conduit from the stream has not yet been identified, likely because it was obliterated by the development of the modern village; however, sources relating to excavations in the 1980s report the presence of a cistern near CF1, east of the villa’s current entrance, beyond the modern road (Figure 3b).
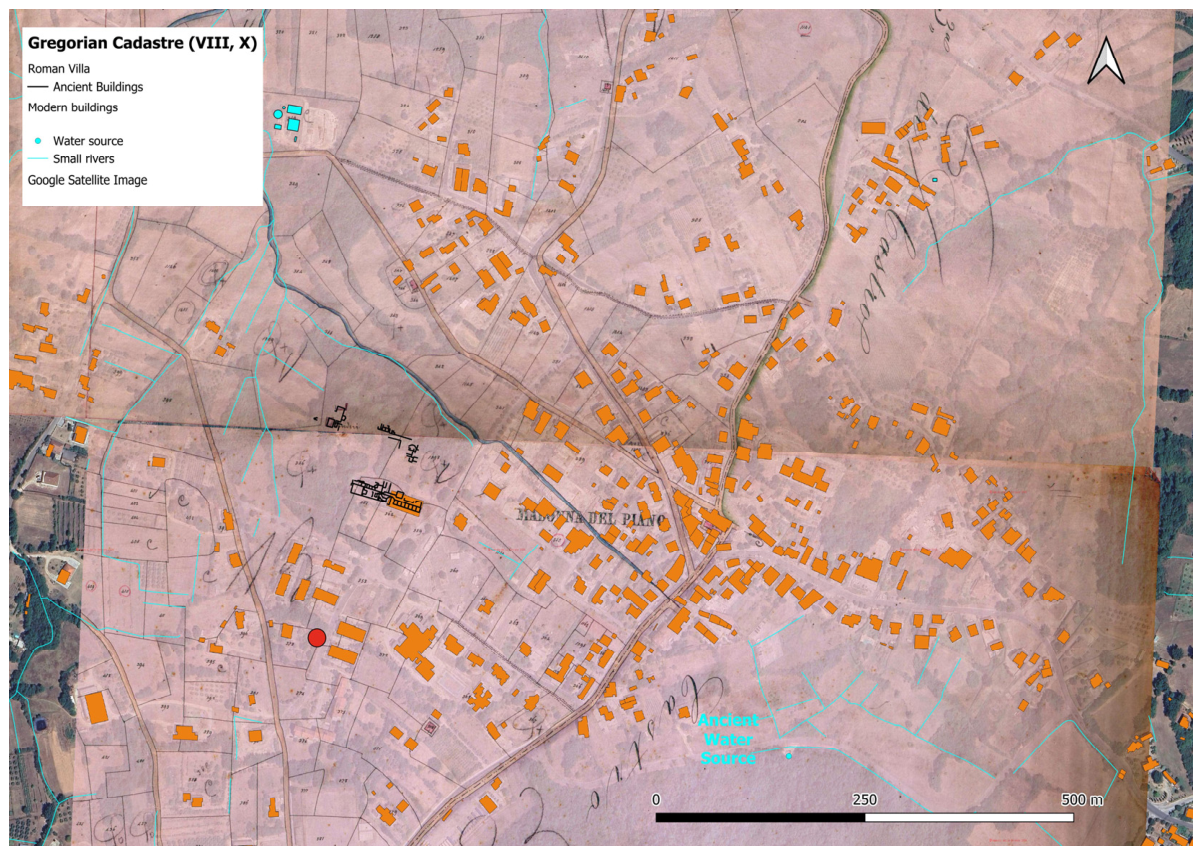
A qualitative analysis of historical cartography using the image transparency and overlay options revealed a series of interesting information (Figure 11 and Figure 12):
  • The ruins associated with the “Baths of Nerva” (CF3) were visible as early as the 19th century, which probably facilitated illegal activities at least as early as the 1960s. Furthermore, some structures that are plausibly related to the retaining walls surrounding the villa on the north side can be observed north of the baths;
  • The presence of the Falascoso bridge, which is located in a different position than the one identified on the IGM map of Vienna [33]; this discrepancy poses problems in identifying this bridge, which has not yet been confirmed by the crossing points investigated in the area;
  • The presence of the spring water canal near which the modern settlement later developed in the area east of the current villa;
  • The Gregorian Cadastre represents the Madonna del Piano area as not yet urbanized. Therefore, the use of stone materials in the foundations of some houses aligned along the still-active spring-fed stream can likely be traced back to the settlement’s later construction phases. The water channel, which is a tributary of the Sacco river oriented east–west toward the villa, is the only recognizable pre-existing structure. Finally, there are discrepancies between the stream’s course observed on current digital maps and on historical maps, which are likely due to both inaccuracies in the non-contemporaneous graphic rendering and subsequent adjustments to the course in the northern portion of the site;
  • The current road system connecting the main road to the site is completely absent, and the “ancient” routes are no longer visible, requiring field surveys. Furthermore, portions of the area’s cadastral boundaries are still visible, partially mirroring the current ones.
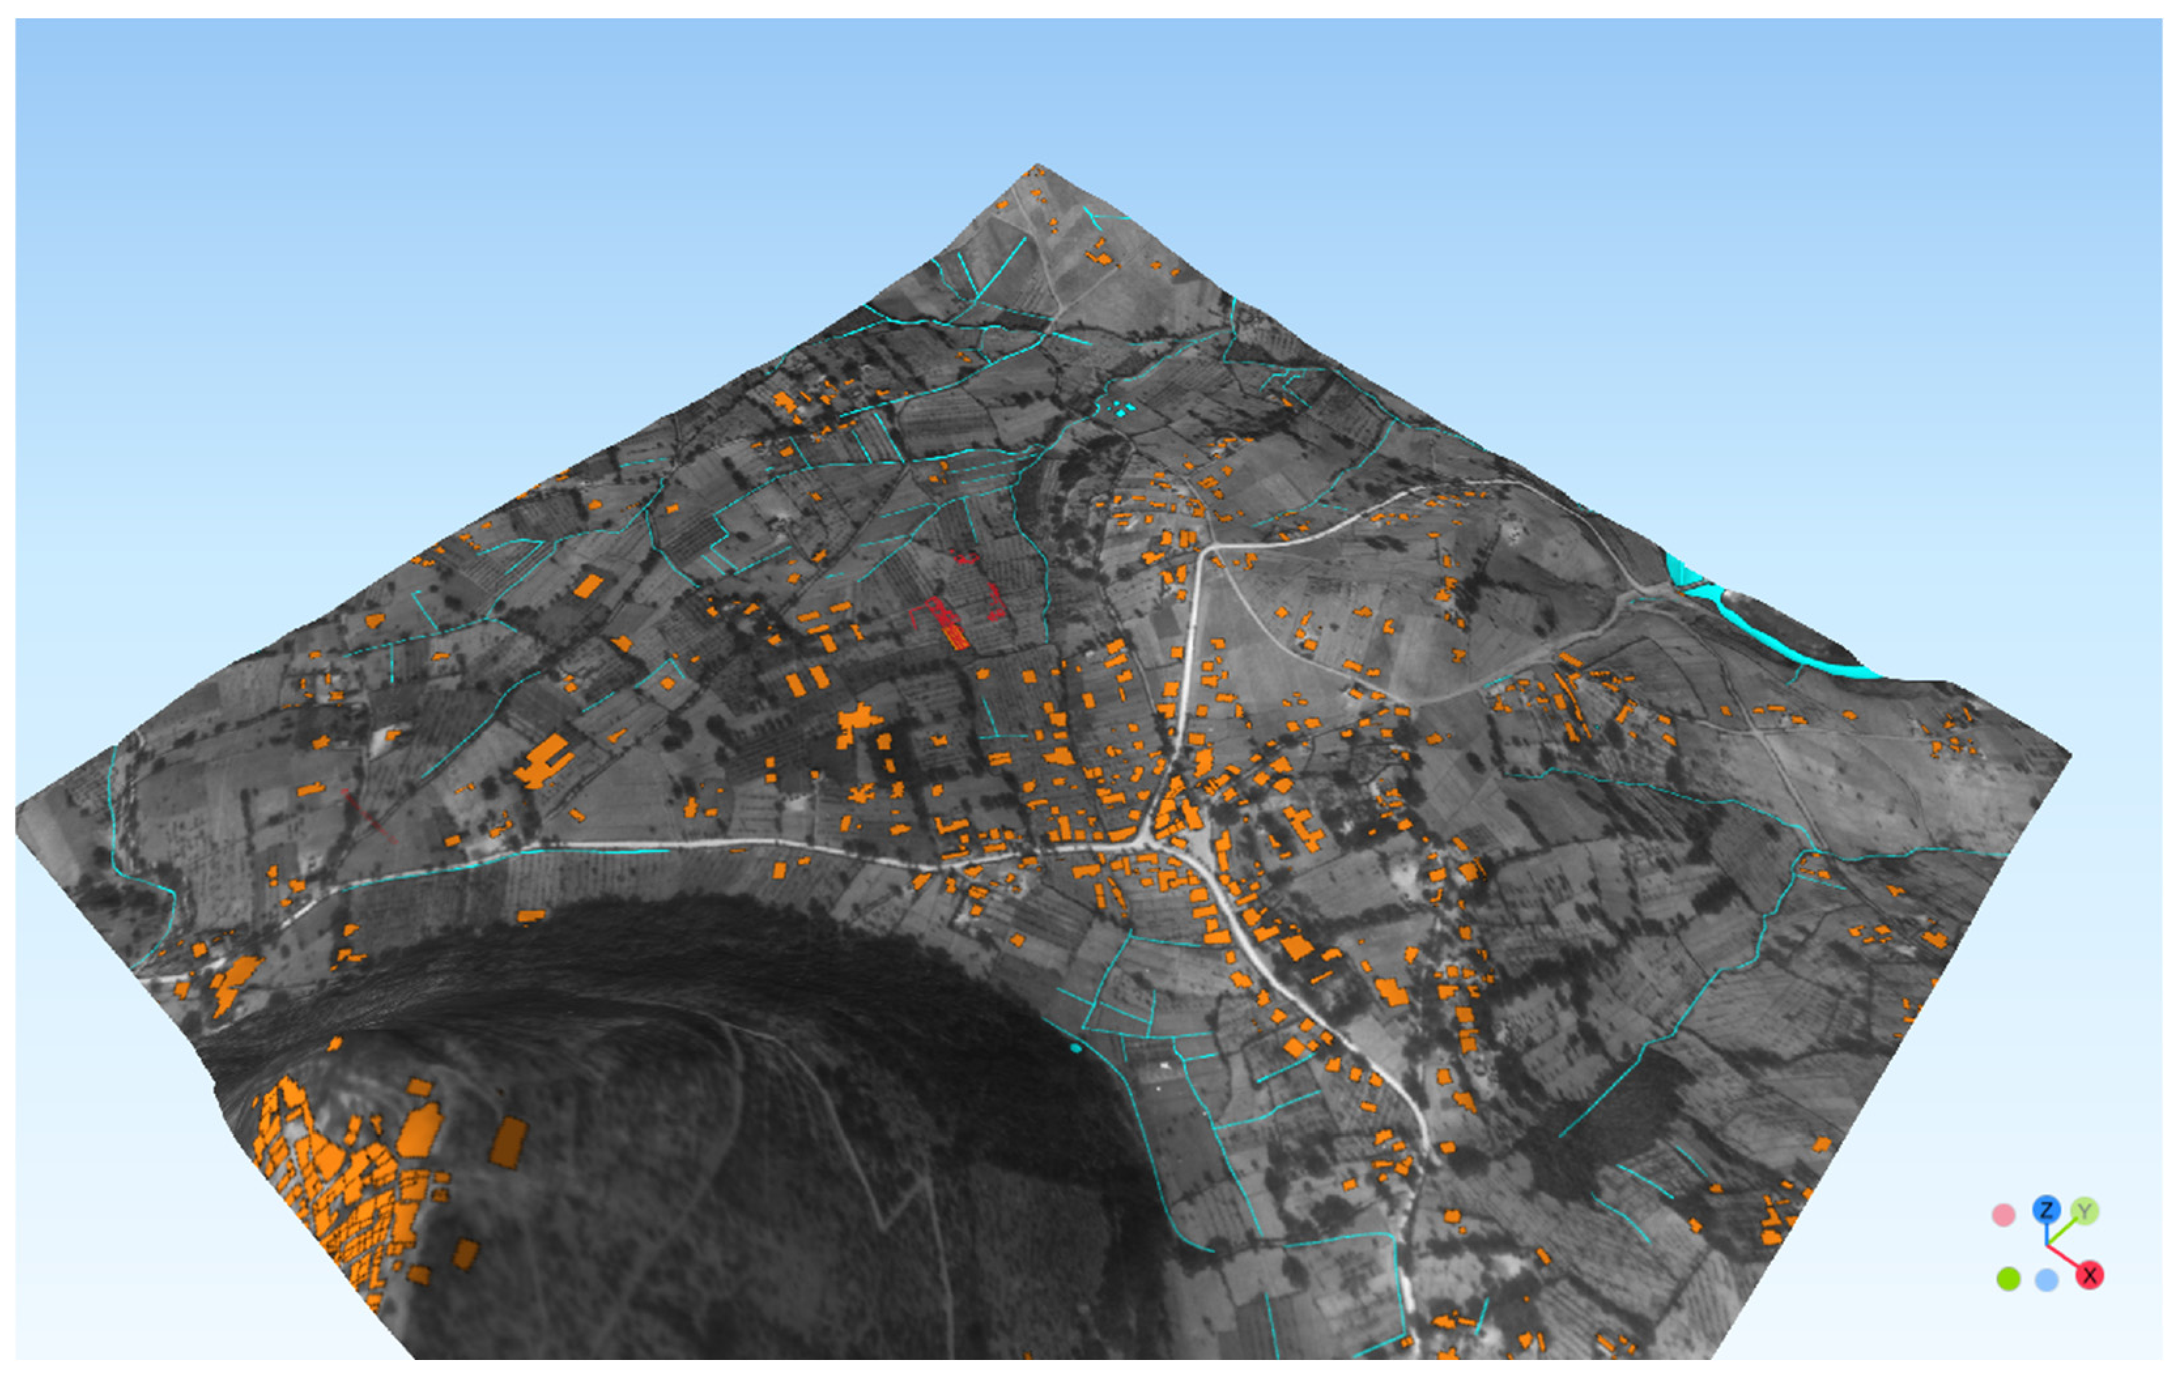
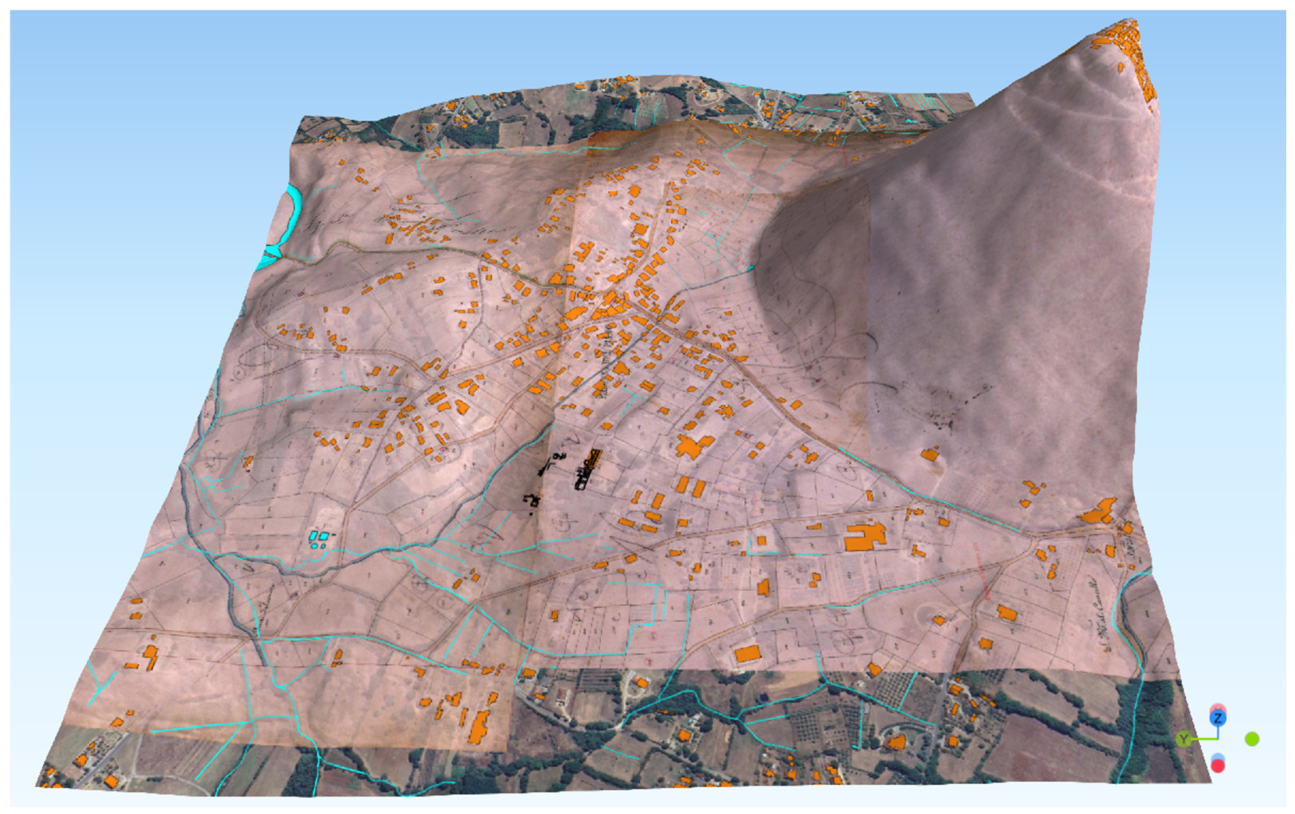
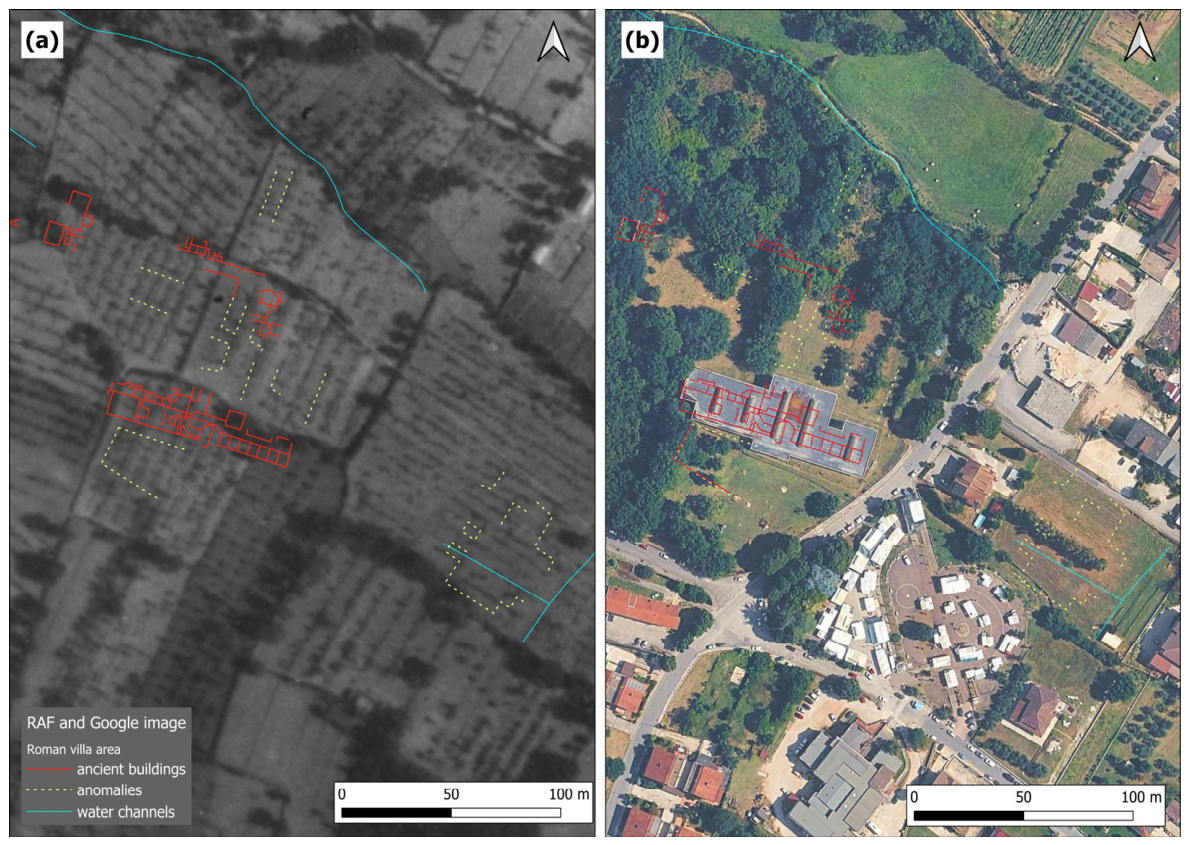
The analysis of the historical aerial photograph is based on their observation and interpretation with respect to the anomalies found in the excavated areas that revealed the villa’s structure. Figure 13 shows a historical aerial photograph projected onto current cartography and the digital terrain model for a 2.5D view of the area. Figure 14 depicts, in red, the main lines of the three complexes; the lines that trace the presence of archaeological anomalies (the most evident ones) and, which follow, to a certain extent, the orientation of those already excavated, are dotted in yellow. It is also possible to verify that the current Madonna del Piano site was built after 1945. Some traces and alignments of vegetation also suggest possible ancient structures in this area, partially confirmed by the discovery of a cistern in the 1980s.
By overlaying the anomalies of the georeferenced aerial photo on the Google digital image, some traces become visible in a part of the modern village that has remained undeveloped. This “building gap” does not appear to be accidental and could indicate an area untouched by recent transformations, potentially rich in archaeological evidence. A post-ancient roadway that runs along the southern side of CF1 was recently discovered during site cleanup operations. This discovery provides a key to understanding some of the observed traces, which appear to fall within the relevant infrastructure corridor. However, this hypothesis has to be verified in situ.
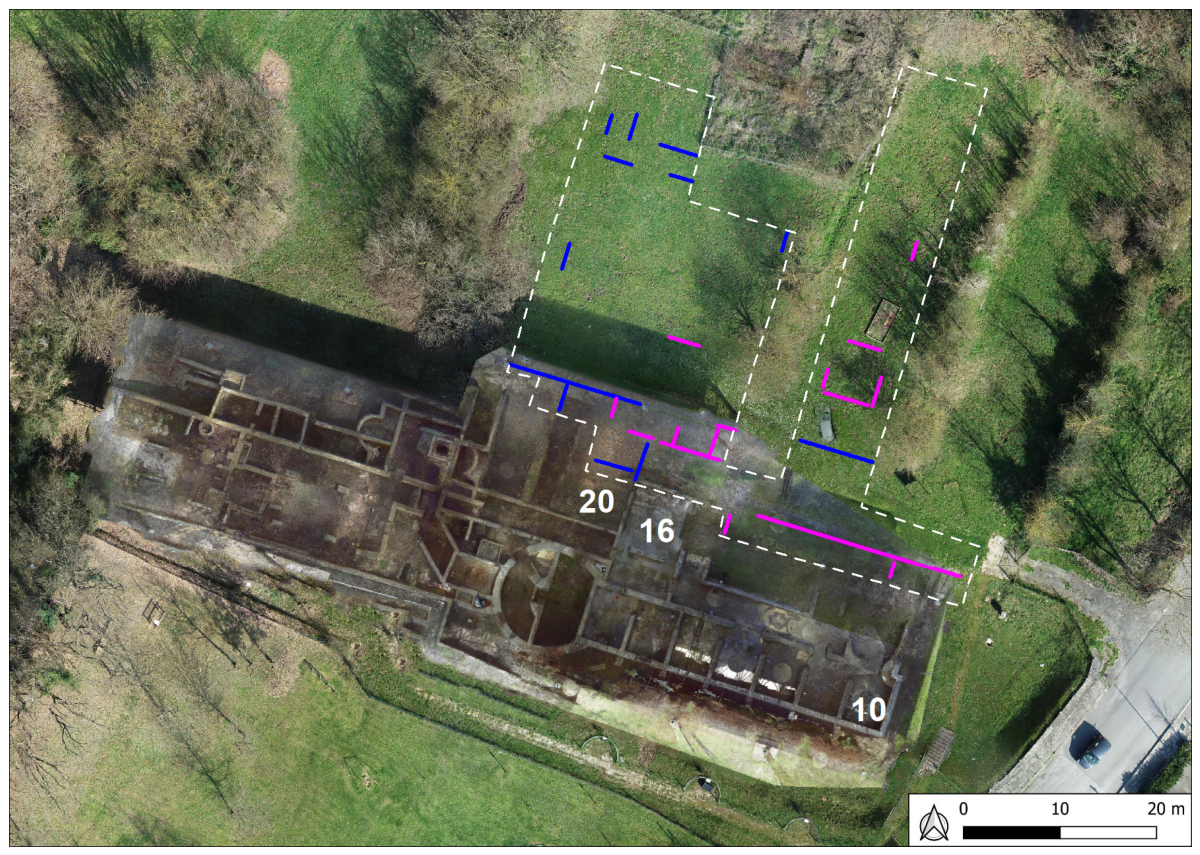
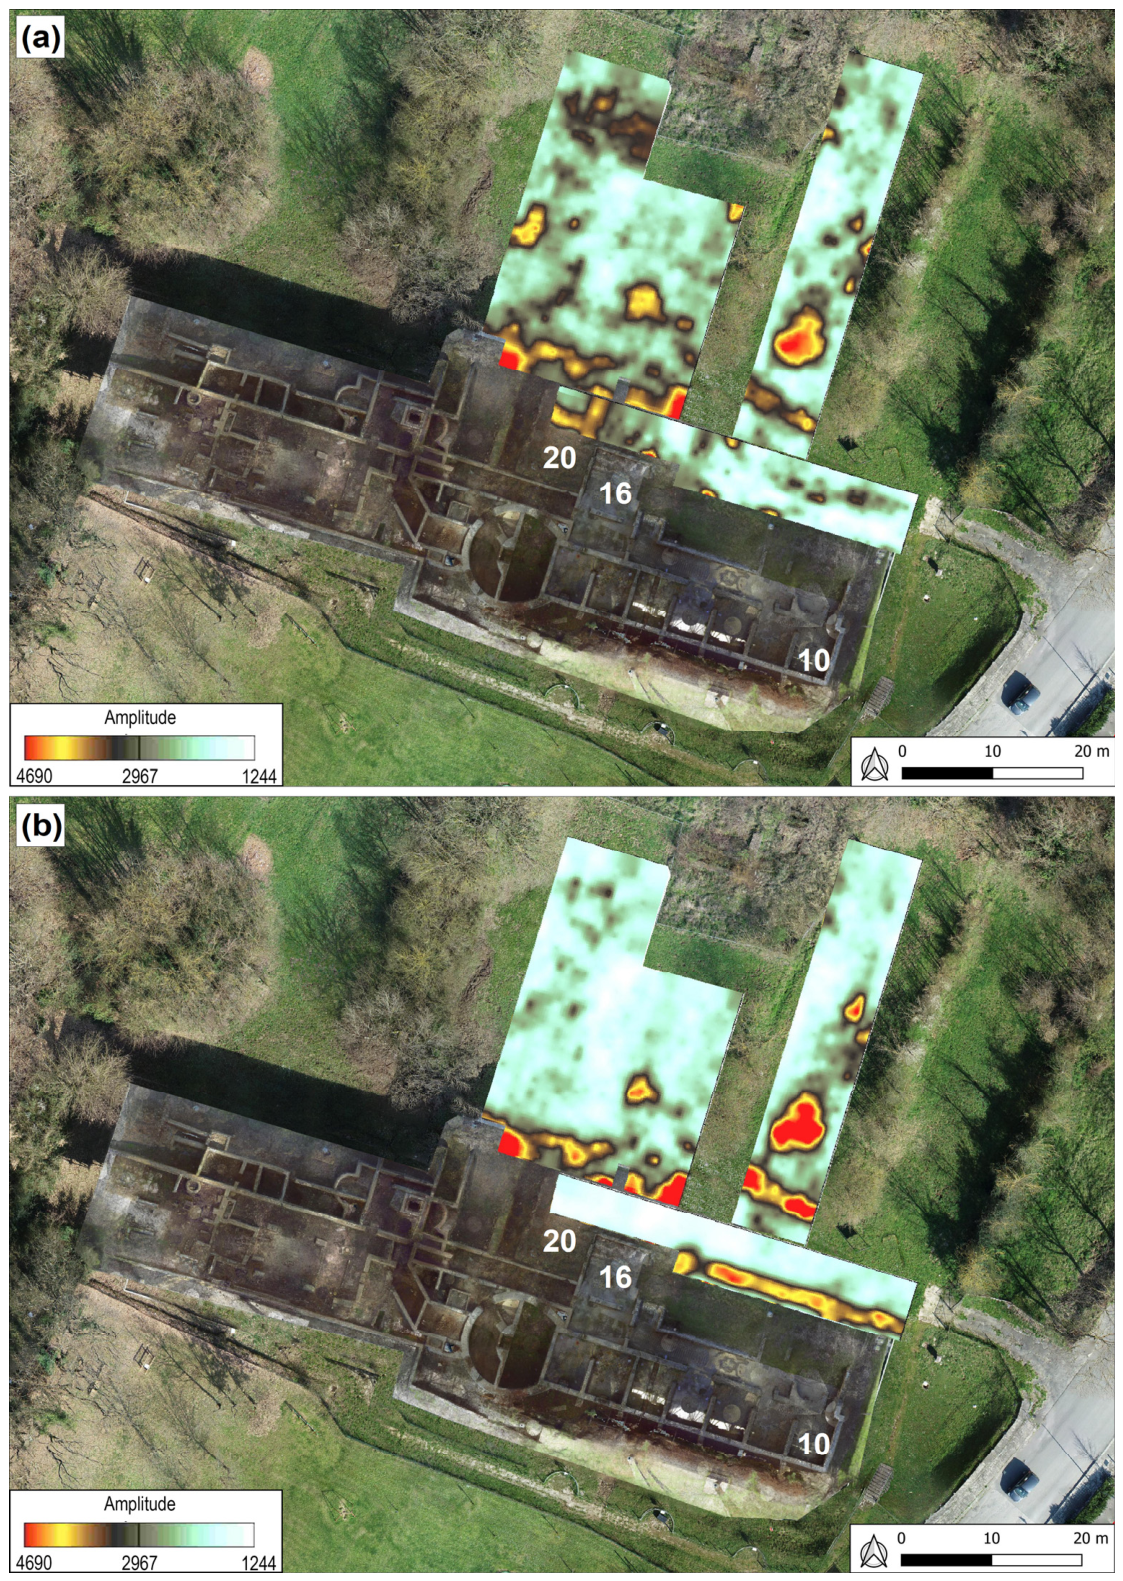
Ground-penetrating radar surveys that were carried out in the northern sector of CF1 have revealed probable buried structures at two different levels. The results in Figure 15 are overlaid on the orthophotography of excavated structures for better readability. Figure 16 provides an interpretation of the GPR anomalies. Shallow anomalies are highlighted in blue, while deeper ones are indicated in magenta. The dashed white polygon delimits the area being investigated by GPR.
The linear anomalies that are emphasized within the examined region exhibit a clear connection with the wall constructions that have already been discovered in the southern sections of the excavation, especially in rooms 16 and 20. The presence of a wall structure that encloses the enormous space identified to the north of the rooms already excavated is suggested by a series of deep linear anomalies (magenta) in the middle sector of the examined area that reach east–west and continue the northern wall of room 16. The extension of room 10’s eastern wall is in line with further deep-linear anomalies in the eastern sector, which are primarily arranged in a north–south orientation. This suggests the existence of a structural barrier defining the eastern edge of the open area. Some surface anomalies (blue) in the polygon’s northern sector reveal the existence of additional rooms that have not yet been excavated. These anomalies are consistent with the presence of rooms comparable in size to those that have already been found. Overall, the distribution and orientation of the anomalies point to a likely northward extension of the architectural layout, with the addition of additional rooms and wall structures that seem to fit the previously established planimetric organization.
Figure 17 reports an updated plan made by a laser scanner and processed with X-ray algorithms [57]. It allows viewing the apparent contours of structures in great detail.
In particular, the new survey approach made it possible to correctly interpret the relationship between the masonry structures that had never been highlighted before, as in the case of the circular structure (17, 19, 18, Figure 18, [58]) In this case, the representations describe the masonry structure as unique, while the circular arch of the foundation of the main masonry structure on which the other probably subsequently rested is clearly visible.
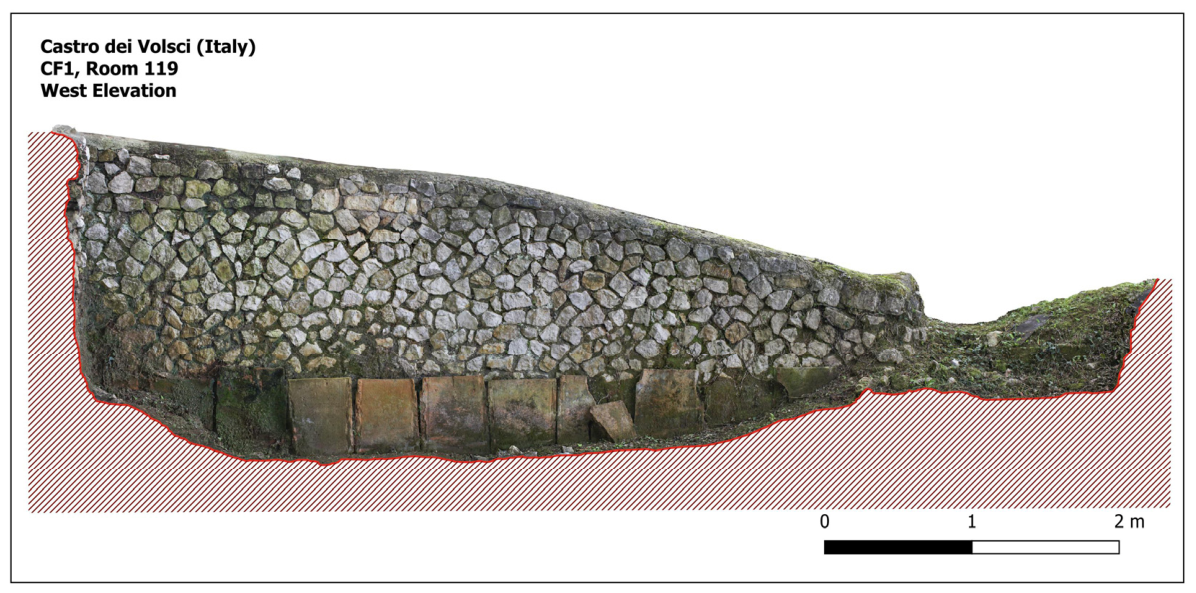
The details of every wall face in the area were produced thanks to the use of multi-image photogrammetry (Figure 19). The masonry USMs were defined graphically in a GIS platform using orthophotos at extremely high resolution. It will be possible to link an attribute table to wall vestments in order to perform statistical and spatial analyses between different walls.
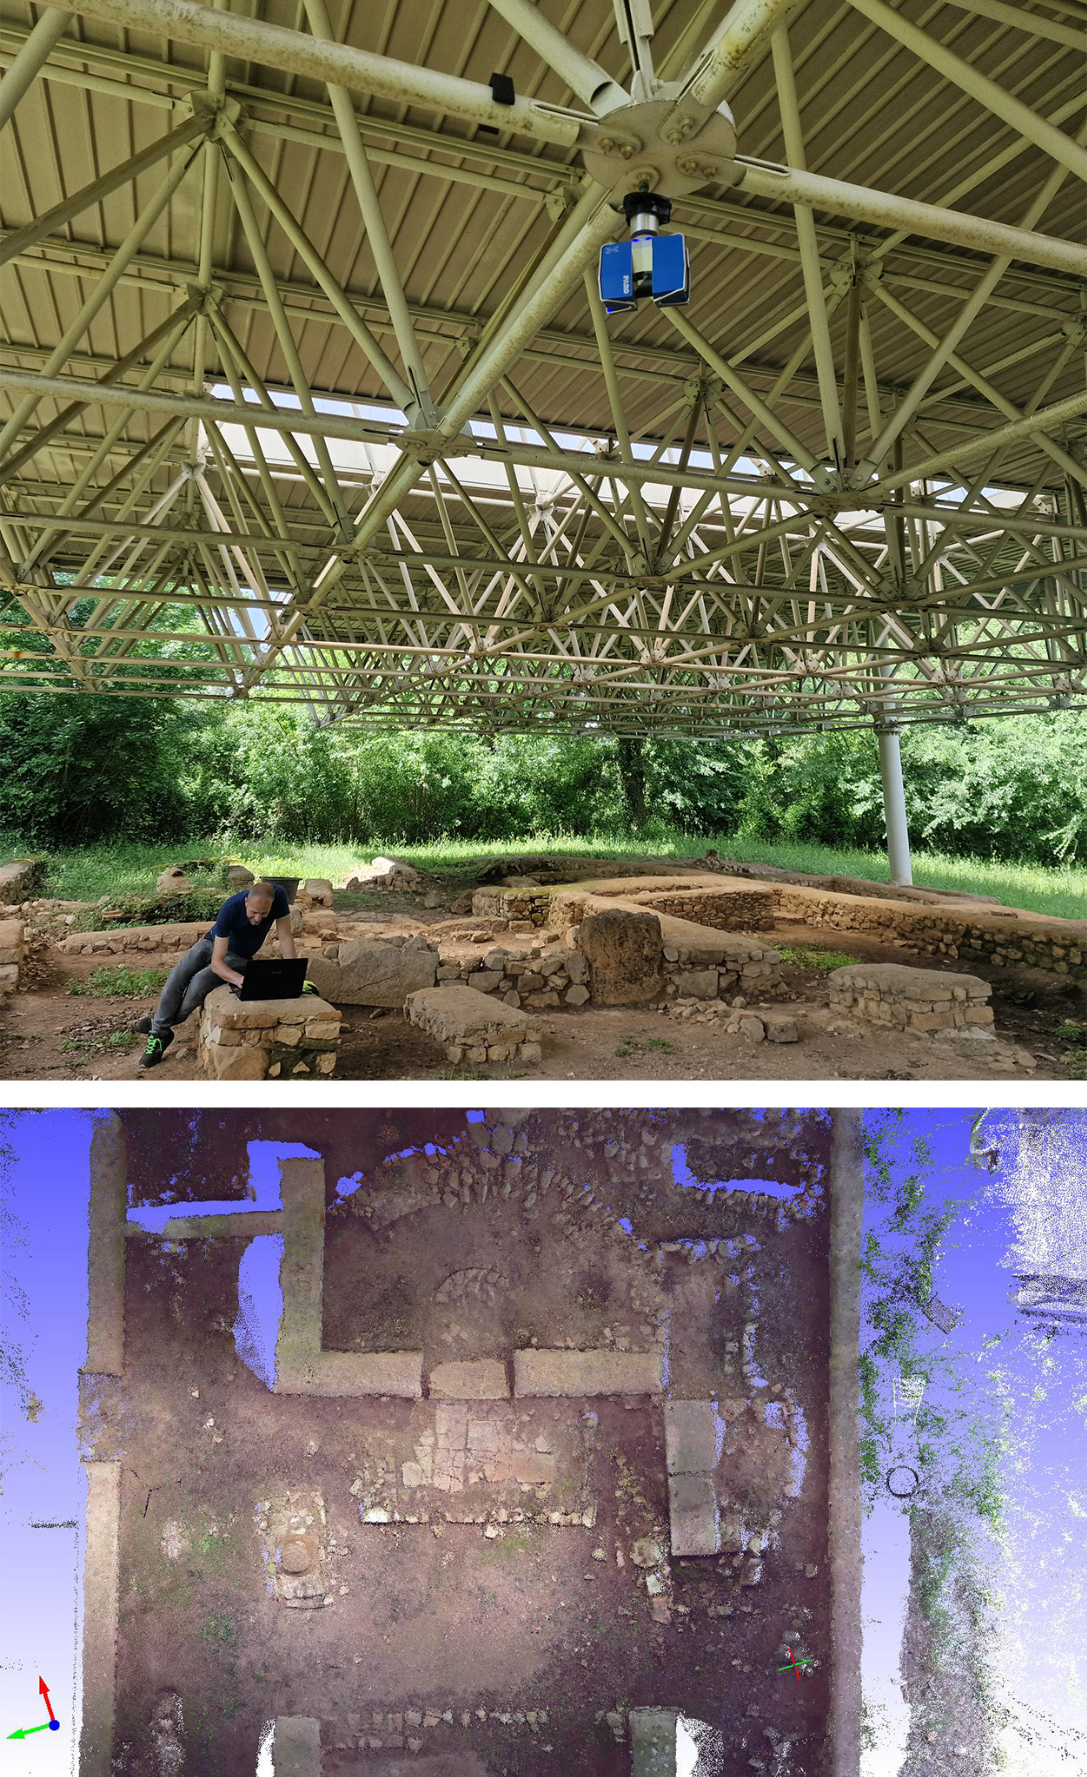
The CF1 complex is covered by a protective tubular structure that allows the laser instrument to be hooked upside down. As already highlighted in other papers [59], this system’s placement on the grid’s intersections allowed for the planimetry to be surveyed with a higher measurement and colorimetric quality. In this case, the tubular structure’s grid and the inverted positioning ensured a better result (Figure 20). The figure shows the part of the Christian cult building, with the scan mounted upside down on the top and the outcome on the bottom. The low incidence of the rays ensures greater accuracy of the shape and graphically eliminates the cone of shadow present on the scans.
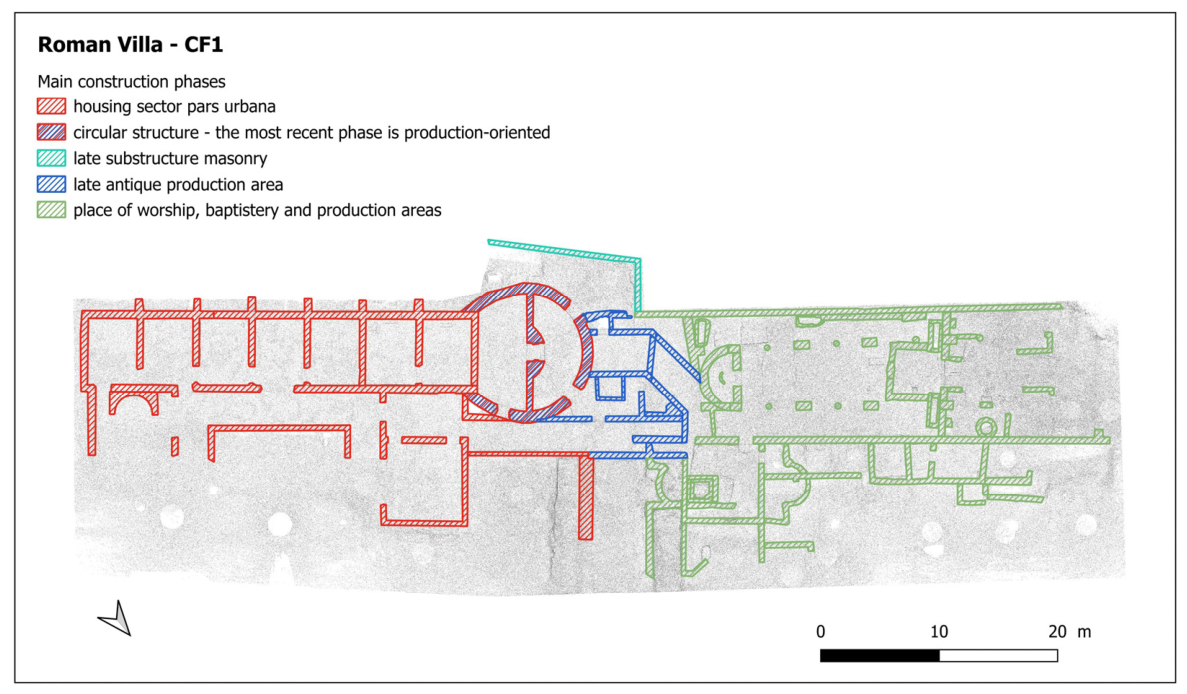
This recognition activity, destined to flow into a general stratigraphic diagram, laid the foundations for a new interpretation of the villa’s chronological phases (must be understood, of course, in terms of relative chronology (Figure 21)).
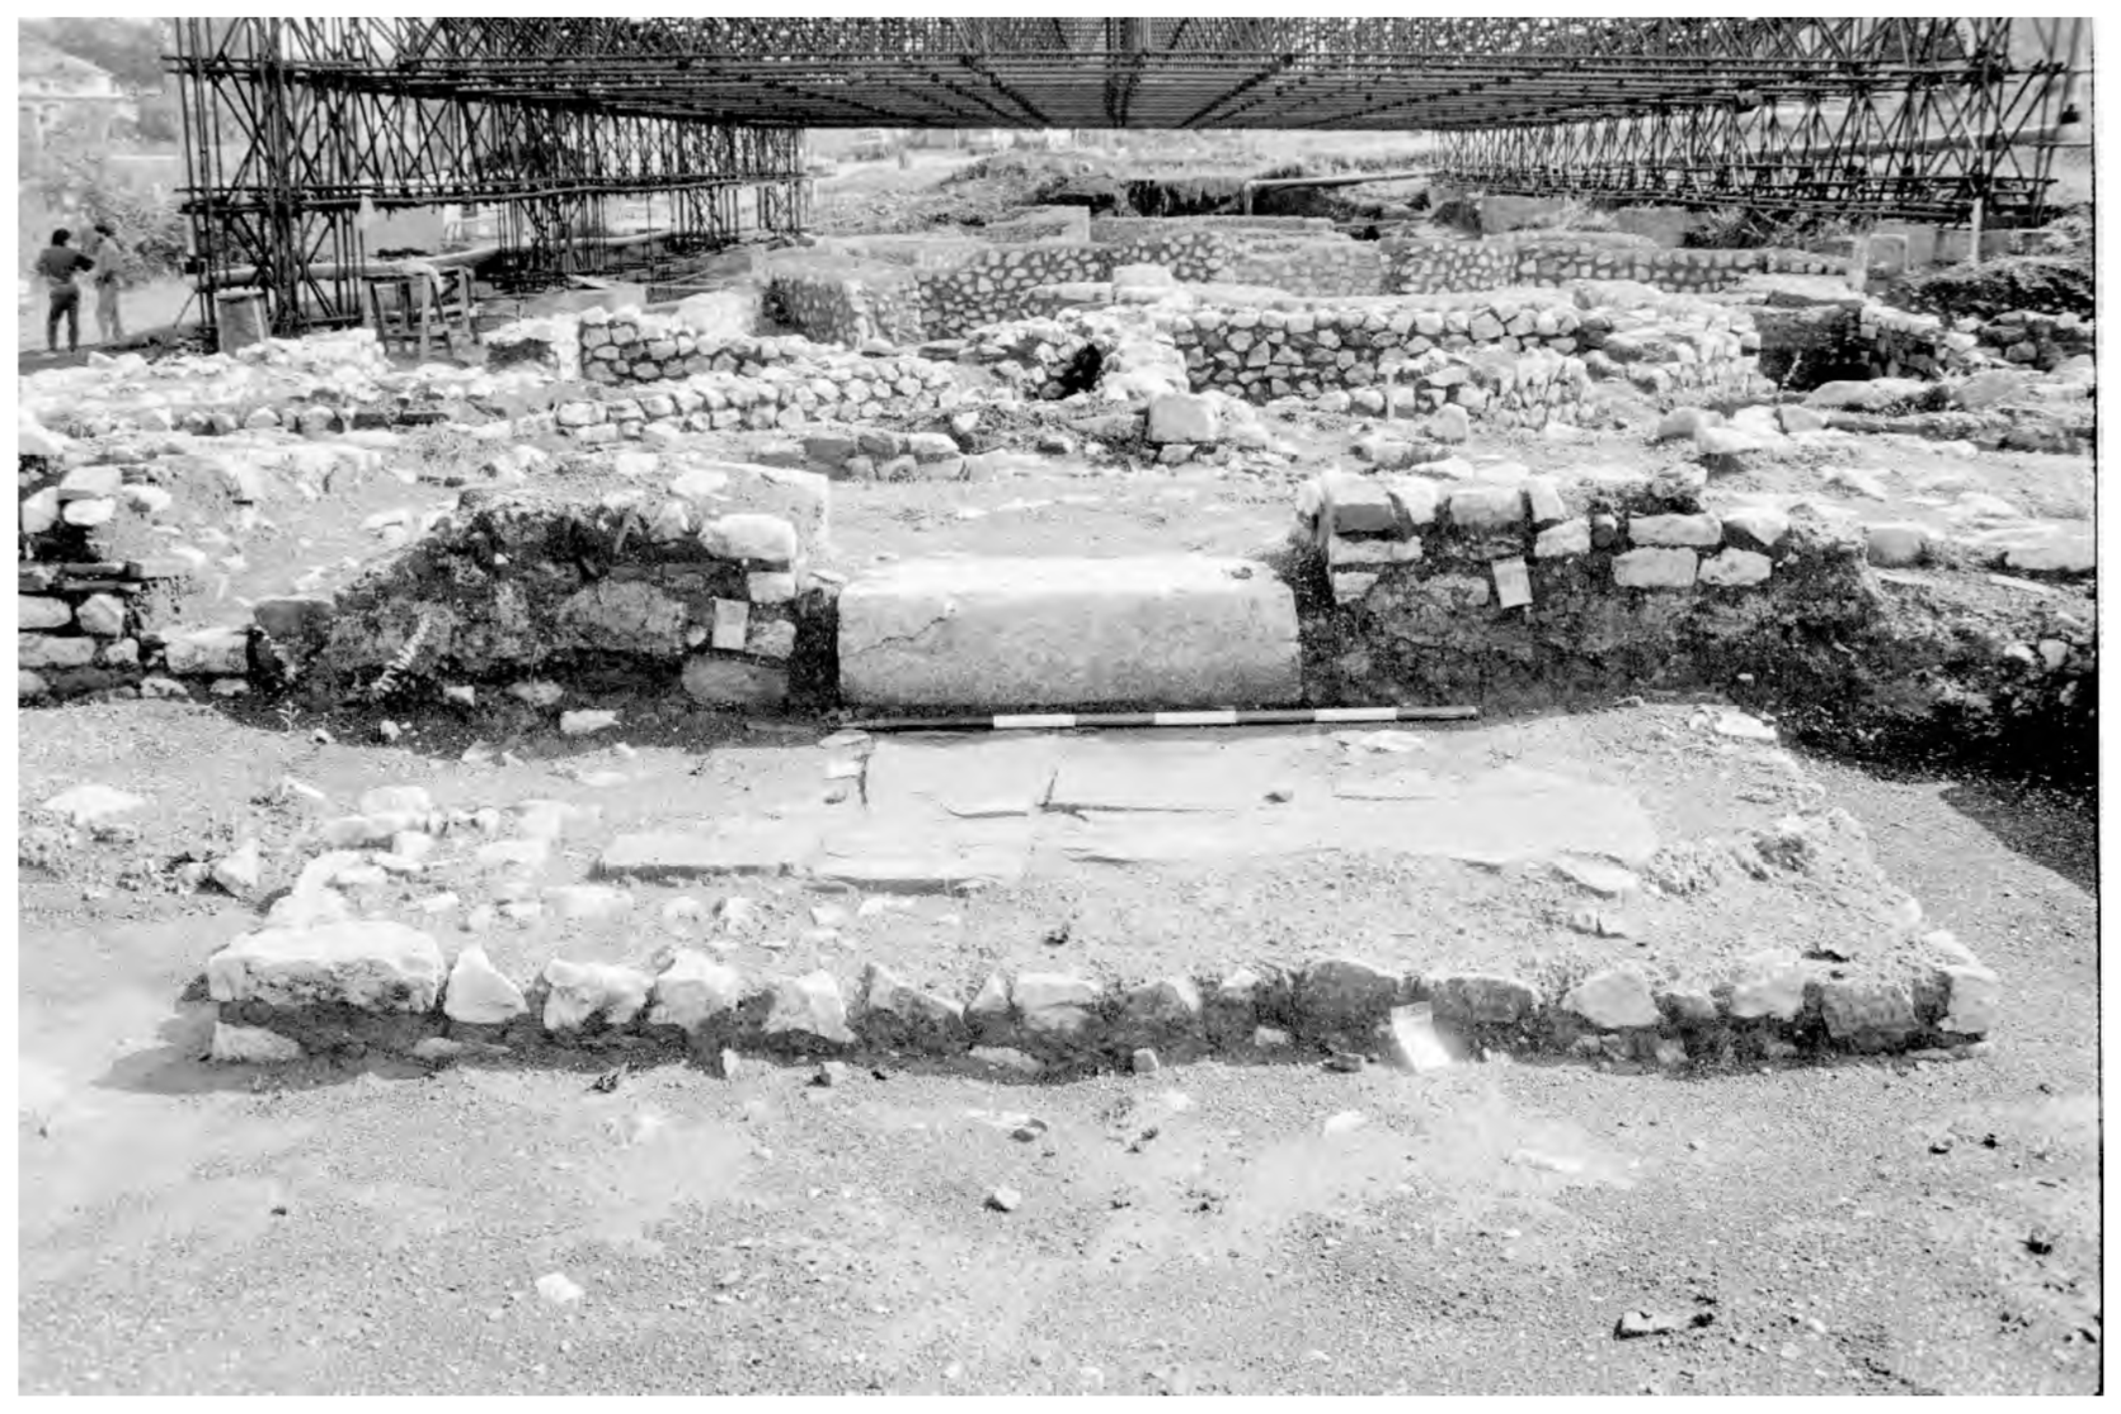
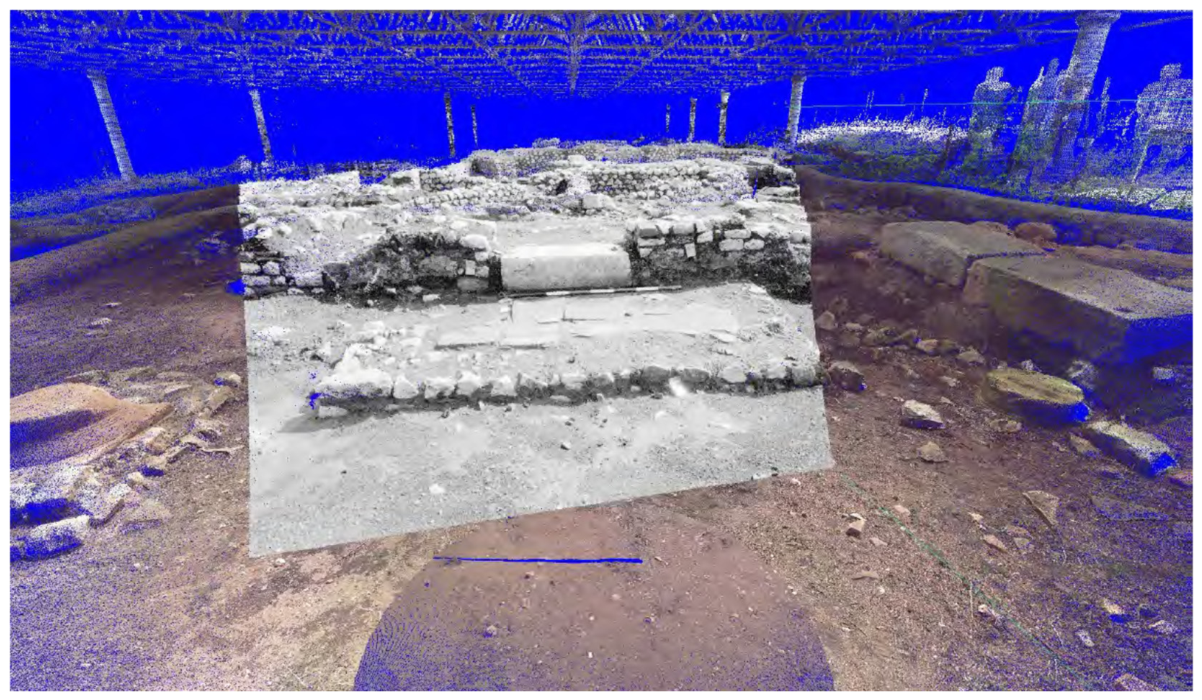
Figure 22 and Figure 23 show the projection of images from the historical photographic archive of the Superintendency directly onto the digital point cloud model. Both qualitative and quantitative, he results are significant. While the qualitative value lies in the enhanced appreciation of the historical and archaeological documentation, the most remarkable outcome is the quantitative potential.
Metric analyses that are highly useful for studying and investigating construction techniques, restoration interventions, and the current state of masonry conservation can be carried out by projecting the image into the numerical model. In fact, it is possible to integrate the areas that have undergone substantial transformations and perform an analytical evaluation of the differences using such a system. However, the tests also revealed some limitations:
  • selection of suitable photographs: the first step is to filter and recognize the suitable photographic documentation available in the archive. Not every image has the minimum necessary qualities to be projected correctly. Therefore, it is uncertain whether the entire archaeological complex can be mapped;
  • the resolutions of images: the scans were made directly from the negatives (slides) using suitable scanners so that the final resolutions were appropriate for the type of procedure to be applied;
  • identification of homologous points: in order to solve the perspective projection, at least 11 homologous points are required between the model and the image (both internal and external orientation). These points must be well distributed geometrically within the photograph and at specific points, such as edges or highly recognizable elements. Archaeological structures with homogeneous materials frequently prevent proper correspondence, which clearly affects the final result.
Despite these challenges, the projections returned some very interesting information. For example, Figure 22 shows a wall behind the presbytery that is not included in any drawing, in addition to highlighting the differences between the current state and the original condition during the excavation. This enables us to quantitatively reconstruct the parts of the villa that are useful for understanding the various phases chronologically and for guiding future excavations.
The methodology of investigation described so far, combined with an in-depth analysis of the graphic documentation, allowed us to define some key steps useful for the archaeological understanding of the area, which undoubtedly presents many aspects that are still unclear. This study can certainly not be exhaustive of all the wall structures present on the site; however, it has focused on the structures of the Christian cult building, which is the least studied and has the most complex architectural articulation (Figure 24).
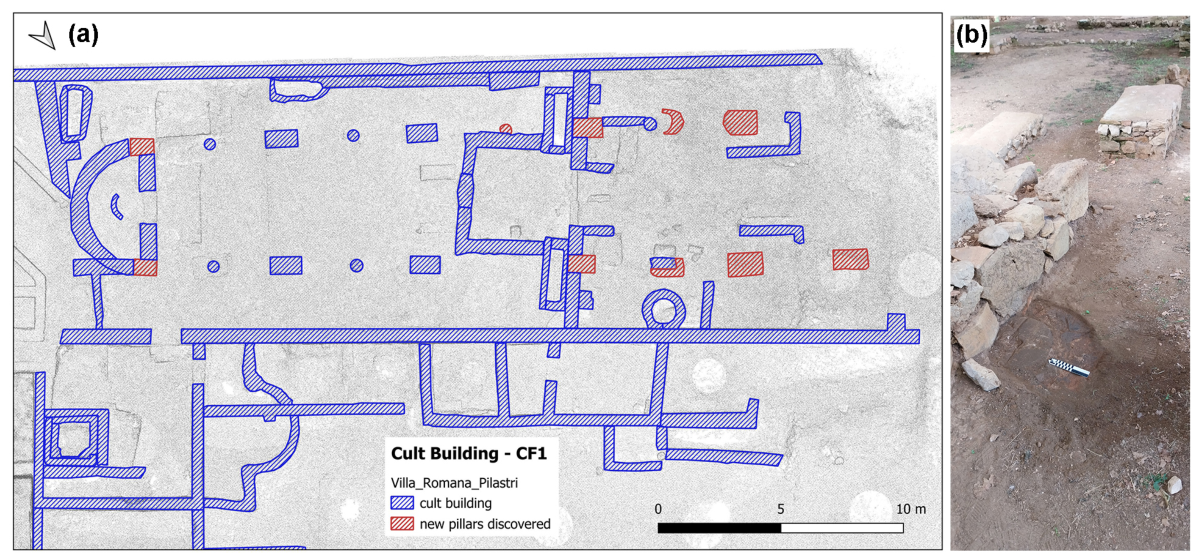
In the western half of CF1, corresponding to the Christian cult building, the state of knowledge is rather fragmented. The wall remains, only 40 cm above the ground level, do not facilitate a fully satisfactory reading and interpretation. Nevertheless, unlike the pars urbana, this part of the villa does not appear to have undergone excessively invasive restoration, leaving significant areas available for detailed analysis. In particular, the presence of the pillars and columns related to the division into three naves belonging to one of the church’s phases is one of the elements that has received the most attention. In fact, the church’s tripartite plan is characterized by several pillars that alternate with columns and an apse (Figure 25). Field analyses, combined with the study and detailed survey, allowed the identification of the visible remains of the pillars, as well as further elements of the same type incorporated in other structures and completely ignored in previous investigations [1,58].
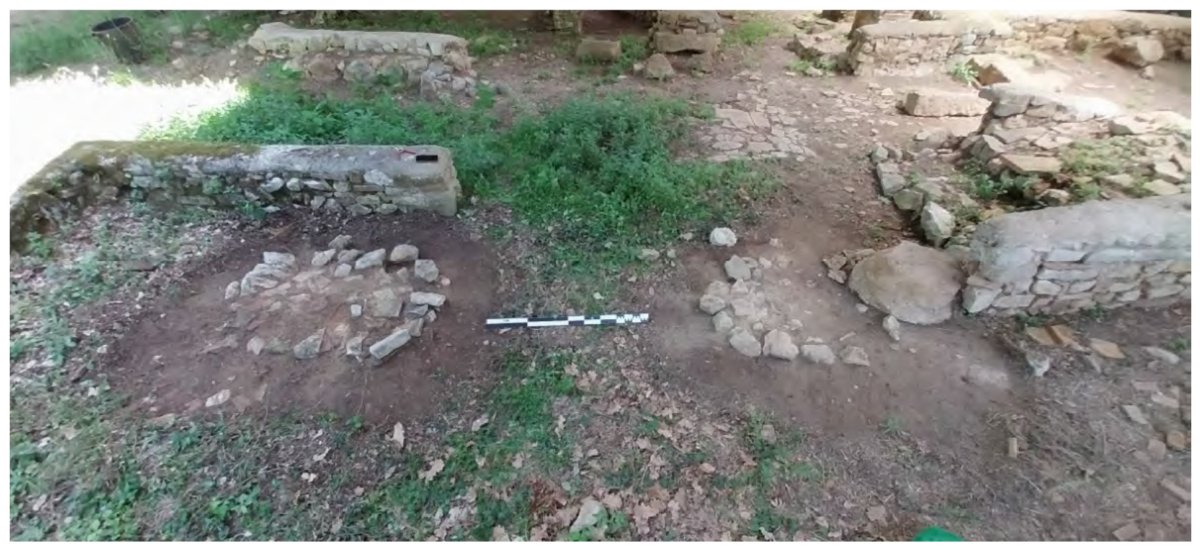
Based on their geometric alignment, size, and interaxial spacing, it was possible to assume from the uploaded plan that there were additional pillars than those visible that were visible. For example, two pillars embedded in the masonry can be seen in the presbytery area. Both the south pillar’s plan and the north pillar’s elevation show the limits that are characterized precisely by a clear discontinuity. This discontinuity is evident when compared to archive photos, even if there is also a good portion of reconstructed masonry (Figure 22). The two pillars appear to support the apsidal structure at the back. Two other pillars of similar dimensions are instead incorporated in the façade masonry, which separates the tripartite space from the space in front of the building (Figure 25). In addition, a further column base was identified on the right aisle (Figure 25), placed exactly at the intended distance (approximately 3 m), and its upper part was removed to create space for the much later enclosing wall. The base grooves for the casting of molten lead to fix the upper rochus and features a pavement on its sides, perhaps in marble crustae, which would need further investigation. However, nothing was found on the opposite side, as the ground is at a lower elevation of about 18 cm. The presence of a column can probably also be assumed on this side: a fragment of it may have fallen inside the adjacent room, the base of which, however, has been completely removed.
To the west of the façade wall, additional elements totalling 12 pillars and 8 columns were found (compared to the four pillars and four columns that have been published so far, Figure 26).
This highlights the cult building’s complexity and monumentality, which is completely different from what has been imagined so far. In any case, the depth of the pillars in the subsoil remains to be investigated in relation to the pre-existence of the Roman villa in the pars rustica; furthermore, the relationship between the pillars and the apsidal area needs to be defined. Only excavation activity will provide further answers. An initial metric-proportional analysis revealed the traces of a subdivision of the spaces into compositional modules with a square base, according to units of measurement that can still be traced back to the Roman foot. The irregularities were evidently due to the need to set the layout on pre-existing structures and to the nature of the building materials, almost all of which were reused. The distance between the pillars and columns is 2.95 m (about 10 Roman feet), the distance between a series of pillars is 5.75 m (about 20 Roman feet), and the distance between a series of columns is 5.85 m [60]. The arrangement of the pillars, columns, and perimeter walls suggests a basilica-type layout, divided into three naves. The central nave is twice the size of the side naves with a repetition of the module, although the general orientation of the pillars, columns, and perimeter walls tends to diverge towards the south.
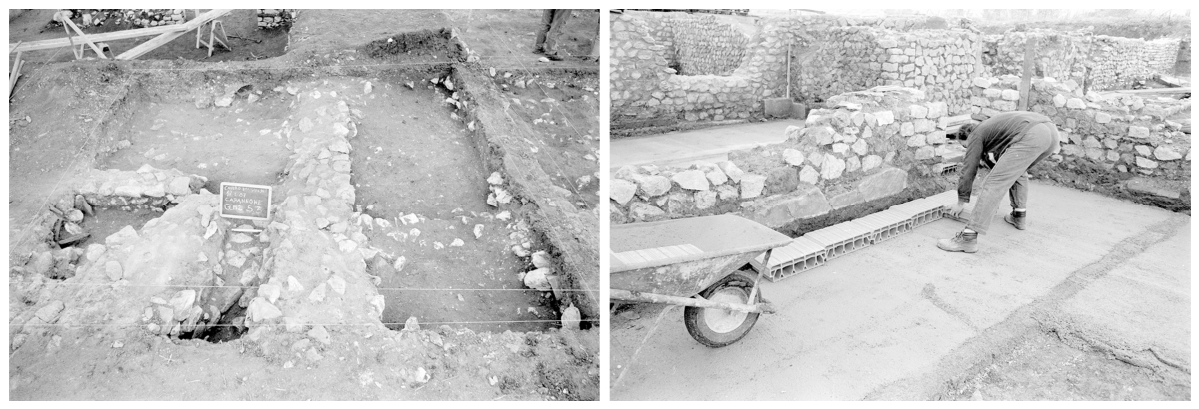
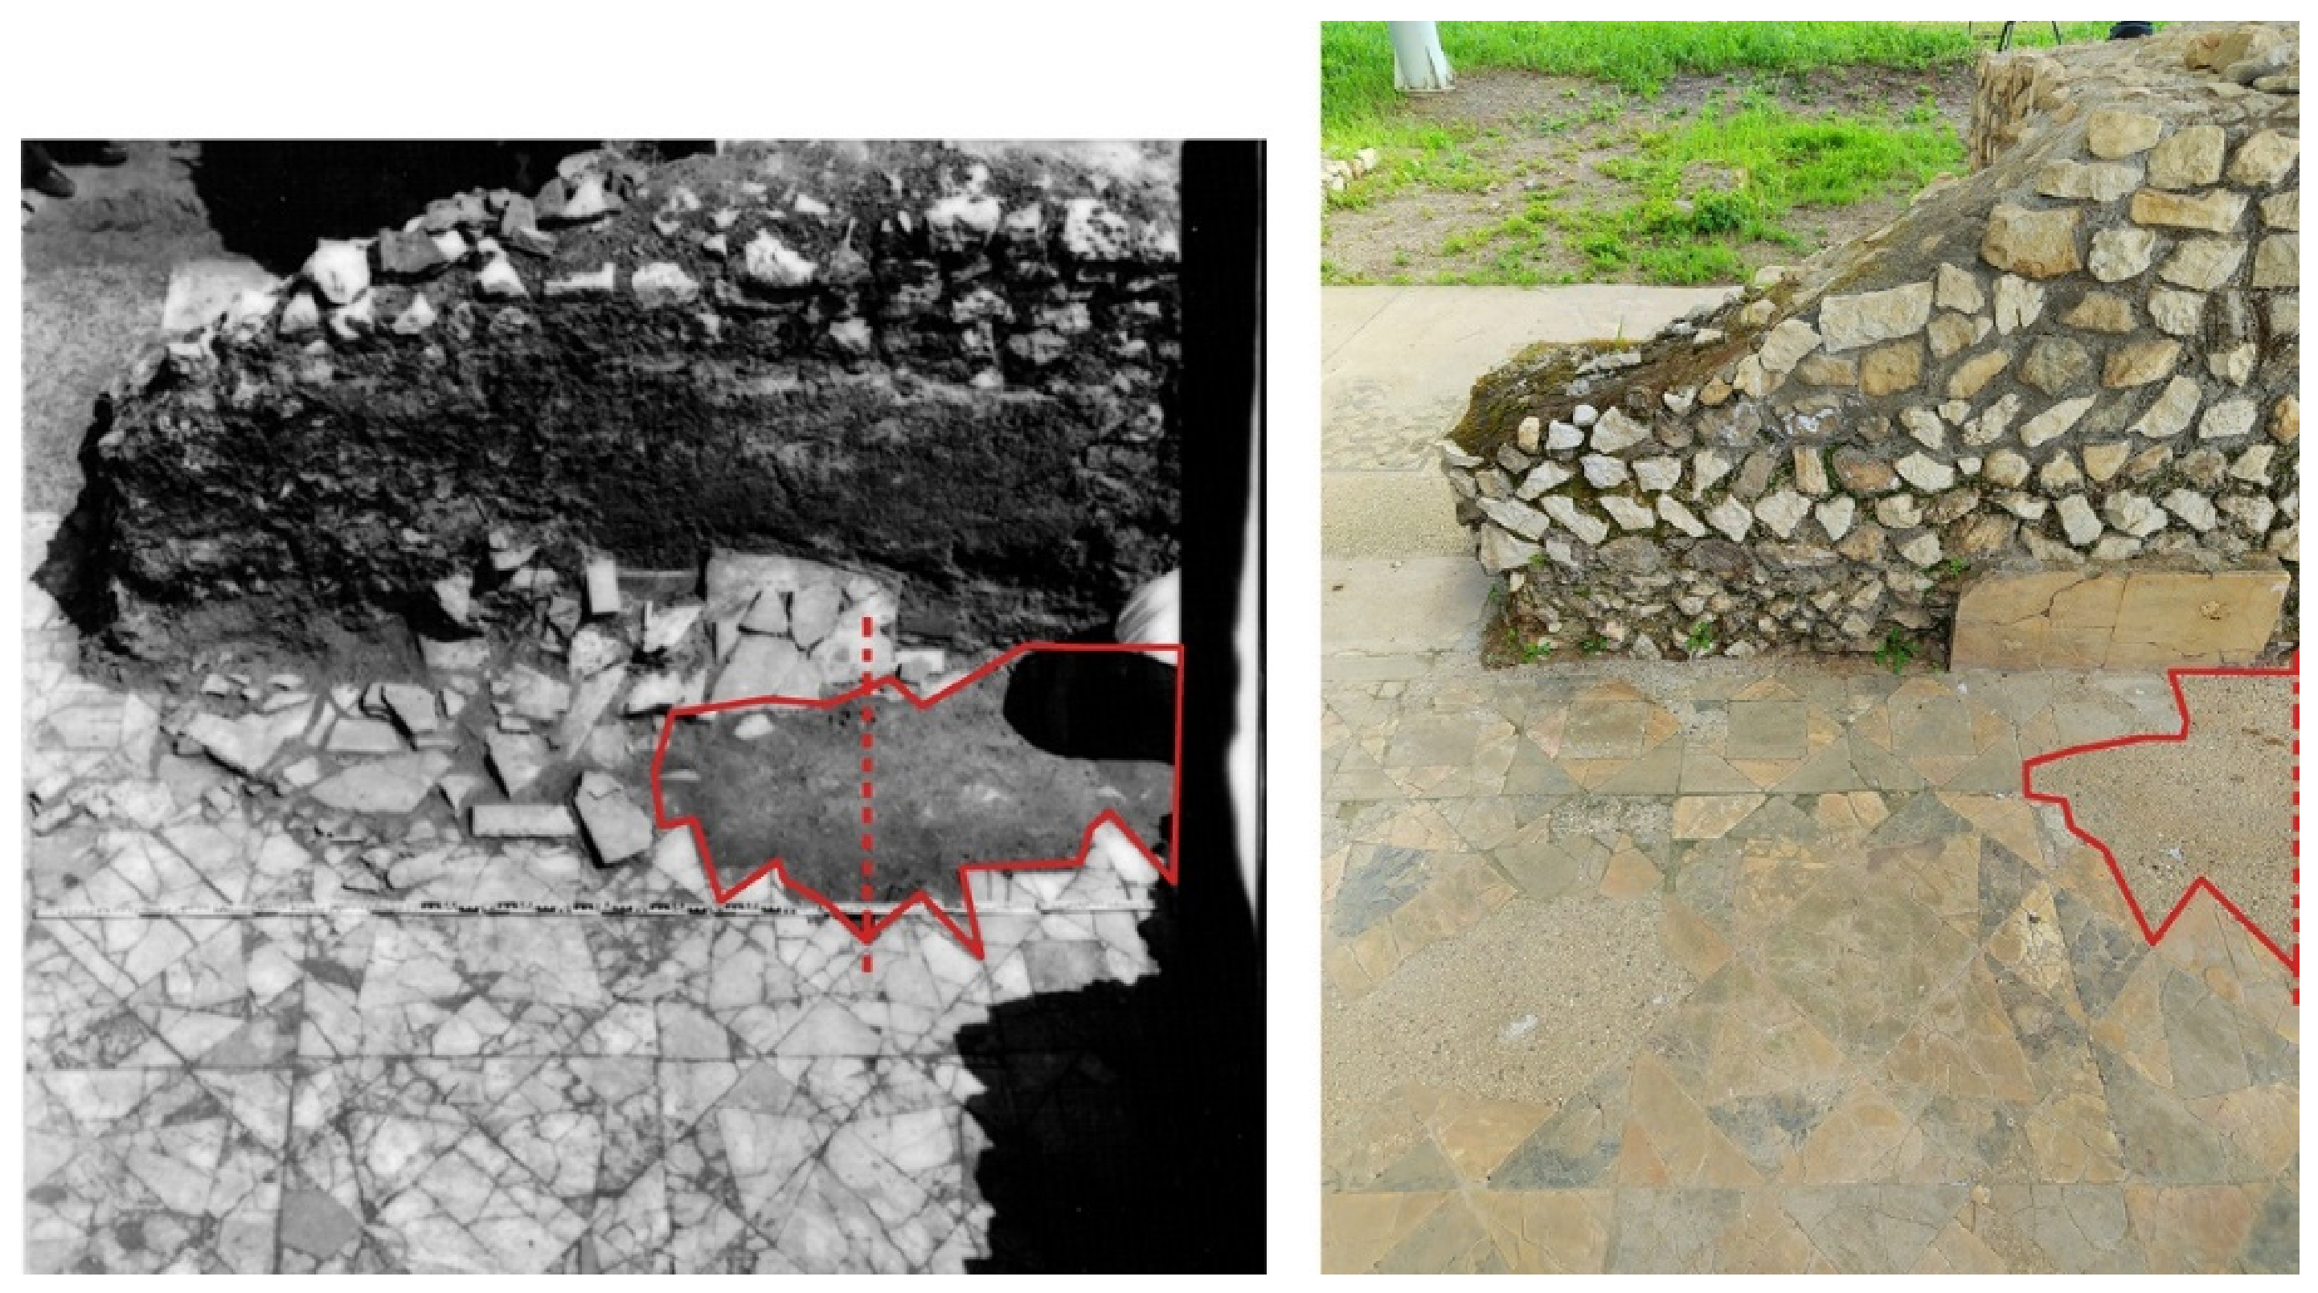
The analysis of SABAP’s Archive photographic documentation, carried out in part using the tool for projecting images onto a digital model, enabled the recovery of valuable information not only about the site’s condition before restoration, but also concerning the excavation methods and the specific nature of the interventions carried out during the restoration works (Figure 27).
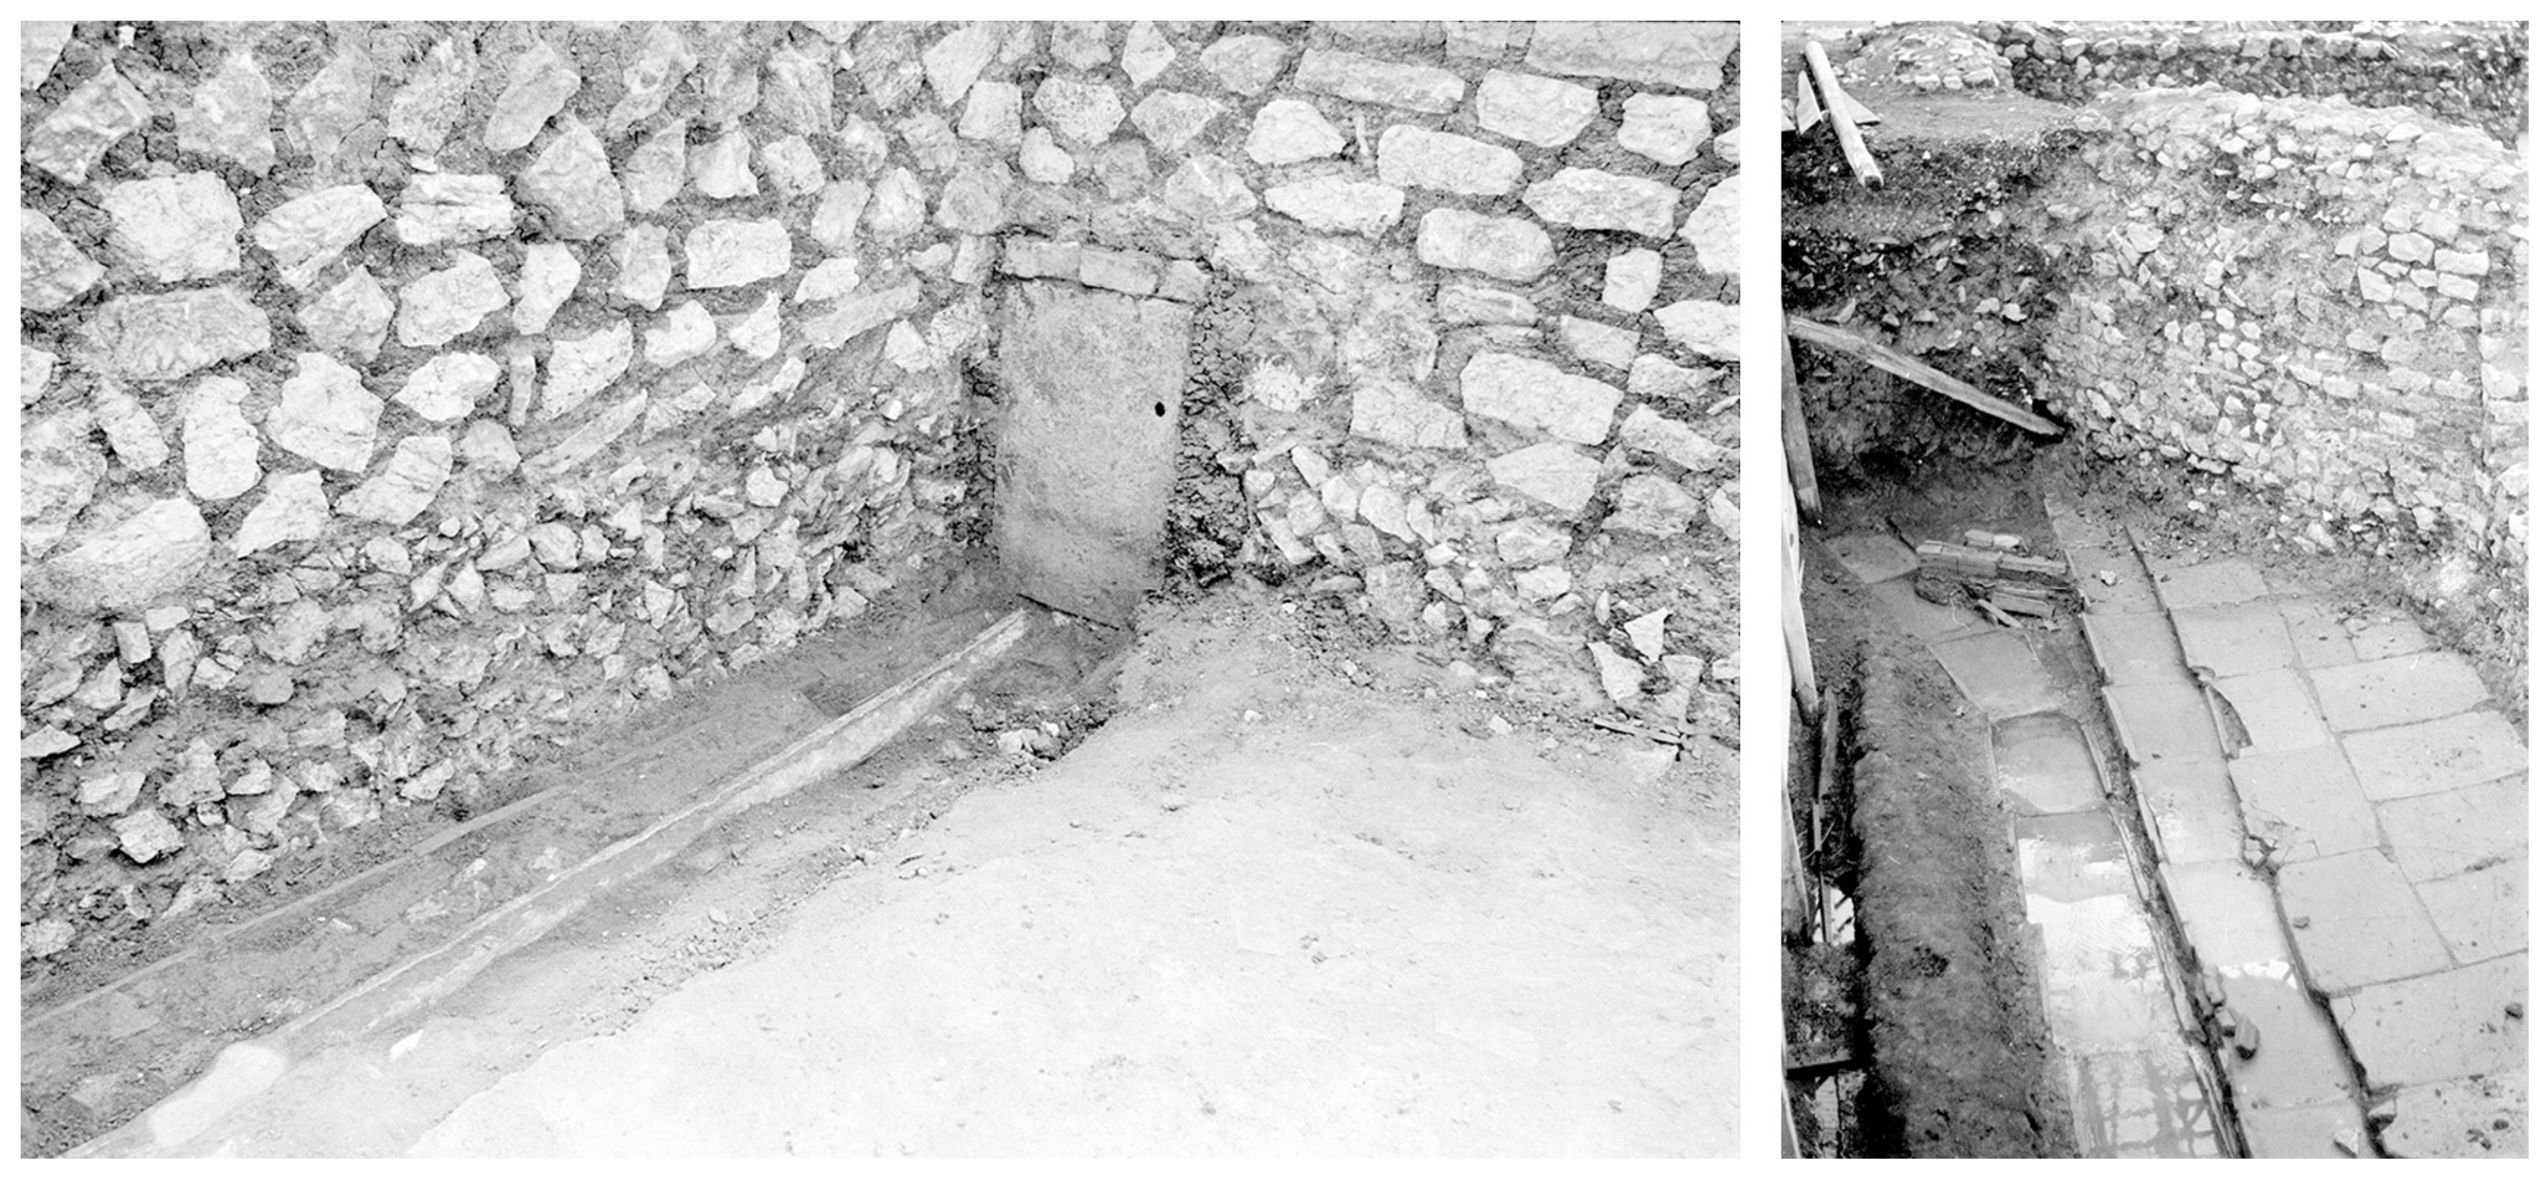
The photographs revealed two parts of an ancient water drainage system no longer visible today. The first was only visible during the temporary removal of the floor mosaics for conservation purposes, and it has since been covered after the decorative flooring was reinstalled. The second section is currently obscured by deposited soil and invasive vegetation (Figure 28).
Comparison between archival images and the current state of the wall structures clarified previous uncertainties and highlighted new issues related to the preservation and legibility of the original wall facings. For instance, while an initial in situ visual analysis suggested that only the upper two courses of stone blocks in the pars urbana walls had been reconstructed following the excavation campaigns, archival photographs revealed a far more extensive intervention.
One example is the north wall of Room 5, where just three original courses remain above the foundation. The current wall results from a complete reconstruction, during which a significant portion of the original plaster facing was lost (Figure 29). Reconstruction likely used collapsed material recovered during excavation.
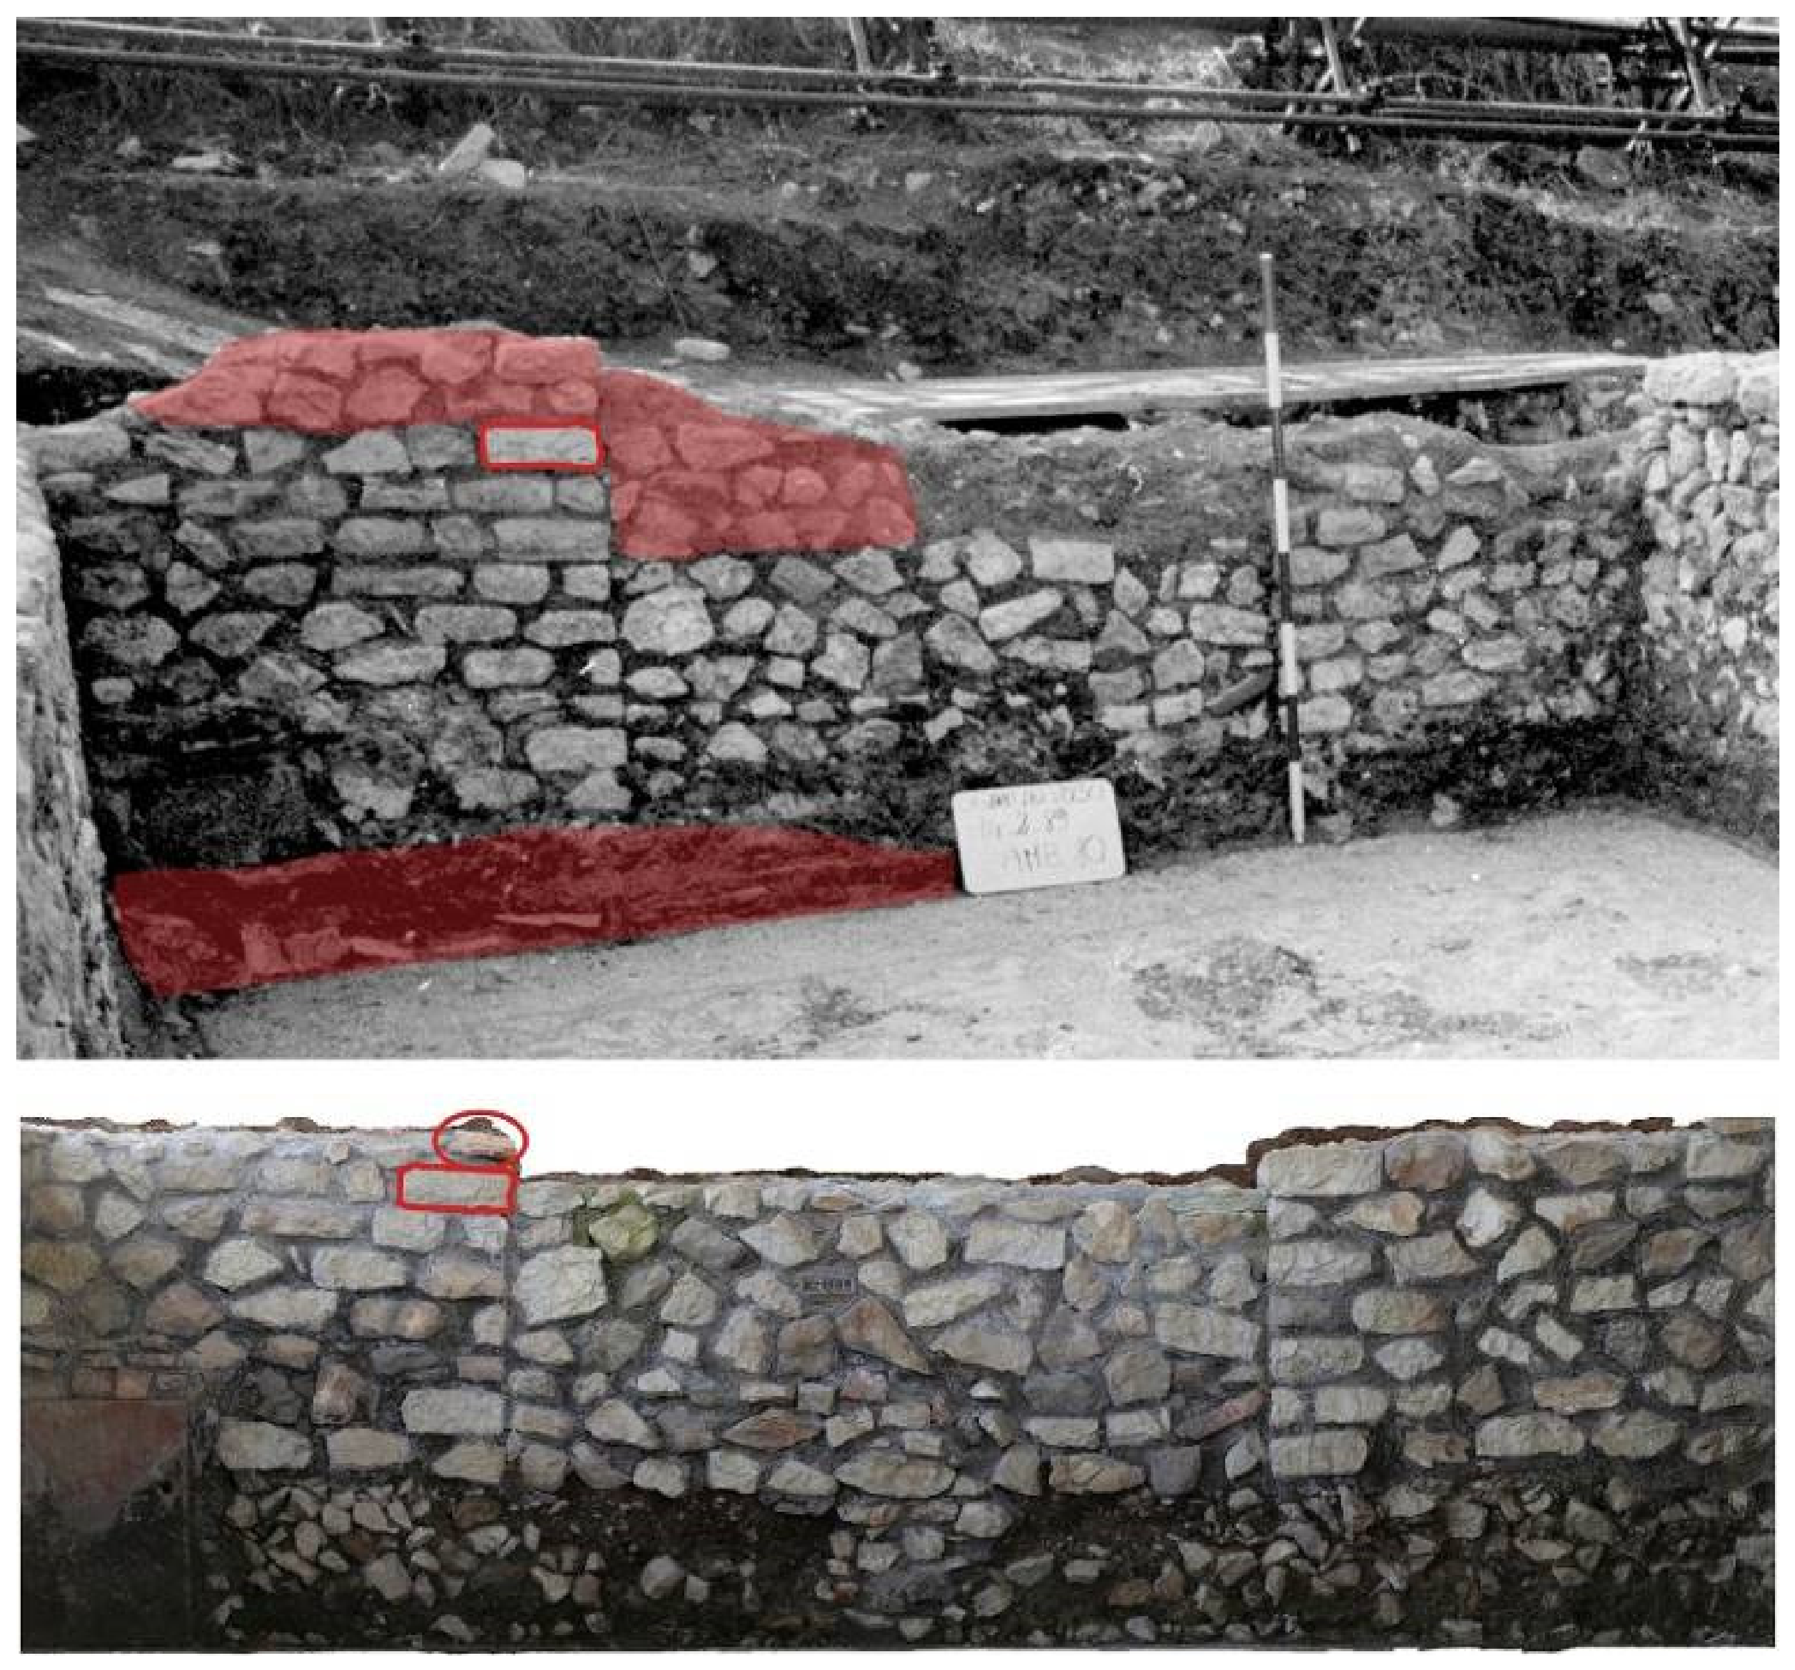
Areas where original stones had been dismantled and replaced were identified in addition to reconstructed sections. A photograph of the east wall of Room 1 shows that the third course from the top was composed of smaller, elongated stone blocks that were markedly different from the average size of the other elements forming the rest of the masonry. A comparison with the current state reveals that these pieces were replaced, particularly on the left side (Figure 30). As will be discussed, this intervention, combined with the use of modern cement mortar to cover similar pseudo-horizontal courses composed of smaller stones in other areas of the villa’s structures, has obscured a significant and distinctive construction technique, which is now unreadable in the material fabric of the walls.
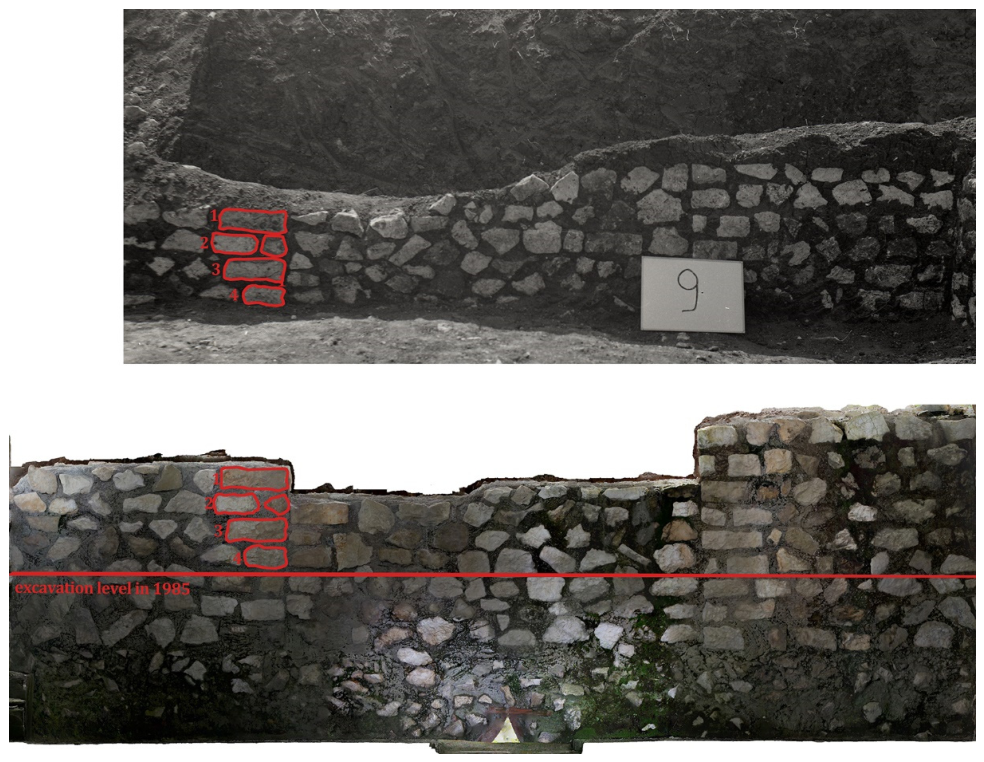
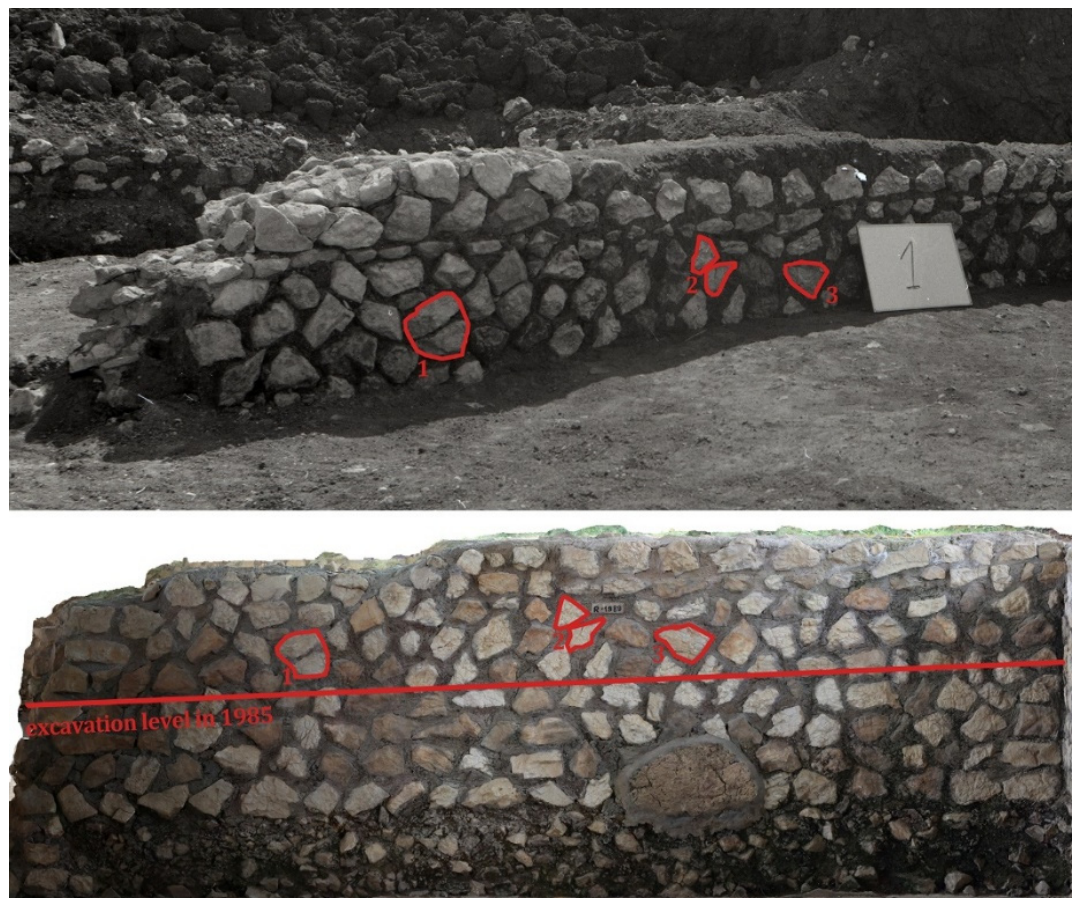
In the south wall of Room 9, five irregular stones forming part of the infill masonry, resting on blocks 1–4, were dismantled and replaced with three regular parallelepiped blocks (Figure 31). In other cases, such as in the south wall of Room 10 (Figure 32), both the original stonework and the wall plaster were removed and never reinstated. The latter wall also features a brick insertion in the upper left corner, which is part of the modern restoration phase and is not indicative of opus mixtum. Considering it original could lead to a misinterpretation of the building’s chronology, as brick is frequently used with limestone blocks in later repairs and wall segments (Figure 32).
On the other hand, the pseudo-parallelepiped blocks found in the corner sections defining the openings of the southern walls of Rooms 10, 1, 7, 8, 9, 11, and 12 appear to be original. The lower parts of these openings were most likely sealed during the villa’s initial construction phase (Figure 31 and Figure 32). These elements are an exception within the general masonry fabric, which is otherwise characterized by irregular stone blocks.
The methodological approach has made it possible to identify the original masonry and building techniques of the pars urbana. This process has proven essential for achieving a more accurate classification of wall types and, more importantly, for enabling comparative analysis with the structures in the pars rustica, which were either less extensively restored or left unaltered. The workflow was improved by integrating archival photographs with the results of new survey campaigns. High-resolution restitutions of wall facings generated through multi-image photogrammetry allow direct comparison between past and present masonry conditions. Furthermore, as discussed, this comparison becomes even more accurate using image mapping techniques, in which historical photographs are projected onto the 3D numerical model.
The data collected so far through the analysis of archival photographs have proven fundamental not only for reconstructing the building history and transformations of the complex, and for establishing both absolute and relative chronologies, but also for guiding further diagnostic operations, such as identifying optimal sampling points for mortar analysis.
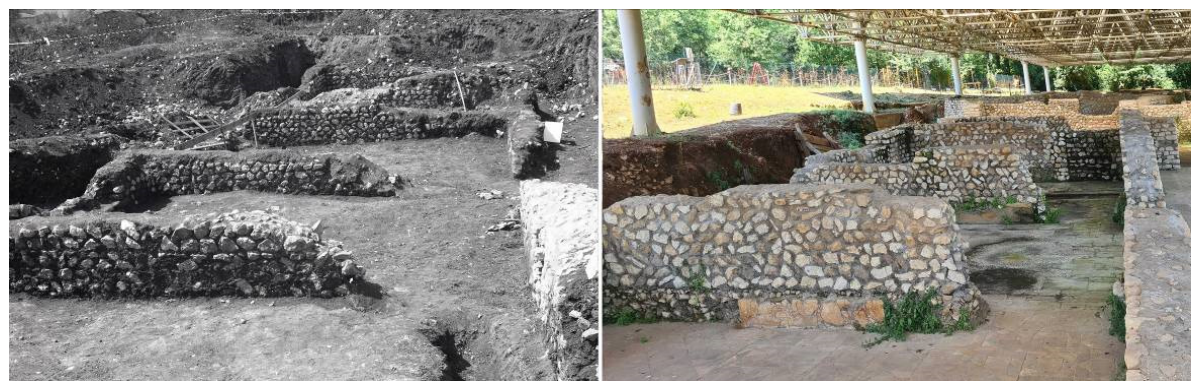
The recognition and classification of masonry techniques were significantly affected by the current state of conservation and restoration interventions carried out in the 1990s (Figure 33 and Figure 34).
These interventions partially reduced the legibility of stratigraphic discontinuities between construction phases, resulting in a perceptible “flattening” of the structures’ dynamic character. The interventions involved the reuse of local building elements and the extensive application of cement-based mortars, which contributed to a more homogeneous appearance of the masonry surfaces and affected their material behavior, including transpiration and salt migration [61]. In this context, archival photographs proved essential for comparing historical conditions with the current state and for the ex-post evaluation of past conservation and restoration actions.
The initial classification of the masonry was primarily based on laying techniques and elements, as a material largely reflects local availability rather than chronological specificity, with the exception of brick use [59]. By integrating construction techniques with architectural and stratigraphic analysis, three main techniques were identified, each articulated into several variants.
The predominant material at the site is local compact limestone, mainly employed as rough-hewn stones and blocks, followed by brick elements and reused travertine c. Tool marks indicate the use of at least six main tools: mallet, pointed pick, and hammer for direct percussion, and chisel, point chisel, and gradina for indirect percussion, although surface alteration sometimes hampers precise identification.
Primary-use limestone elements, mainly associated with Roman structures, were likely quarried locally and roughly shaped on site, with greater care observed in horizontal courses and corners, though finishes generally remain coarse and reflect variable workmanship. In contrast, Late Antique and Early Medieval construction relied predominantly on reused materials—bricks, squared travertine, and limestone from earlier structures—occasionally reworked for adjustment, reflecting pragmatic strategies linked to availability rather than standardized procedures [56].
Dimensional characteristics proved useful for assessing construction practices and workmanship, but were limited by the inherent variability of opus incertum and the lack of standardized stone-working constraints in medieval structures in this region [62].
Two main principal architectural configurations can be distinguished: the first corresponds to a Roman extra urban villa characterized by tripartite masonry in opus incertum; the second, instead, concerns a refunctionalization of the area, particularly the western sector of the building complex, with the construction of a religious building, characterized by the reuse of ancient building material and the employment of techniques attributable to opus vittatum and opus incertum with brick insertions. This second phase presents evidence referable to the Late Antique and Early Middle Ages; it could be ascribed to a period between the mid-6th century, based on analogies with the nearby site of Villa Magna [63], and at least the 9th century, in reference to the ceramic materials found during the excavations of the 1980s.
All structures attributable to the Roman phase of CF1 appear to be variants of opus incertum. This technique reached its highest diffusion between the 2nd and 1st centuries BC [64] and was largely replaced by opus reticulatum from the second half of the 1st century BC [65]. These considerations may be placed in dialogue with the dating proposed by Maria Concetta Laurenti, which is based on the stylistic analysis of the mosaic floors in the eastern sector. In her proposal, the first building stage, including the peristyle and the adjacent rooms, is referred to the 2nd century, while a subsequent intervention, associated with the apsidal room on the eastern side of the peristyle, is assigned to a period between the 3rd and 4th centuries [66].
Within the Roman phase, three distinct variants of opus incertum were identified. The first, attributable to the initial construction phase, is characterized by the presence of leveling courses and quoins, never placed at the external angles, and occasional short herringbone courses. The second variant, also belonging to the first phase, lacks leveling courses, quoins, or any other structural regularization, and is typically used in small wall sections, such as infills or secondary partitions. The third variant, attributable to the second construction phase, is distinguished by slightly more regular blocks, more homogeneous courses, and the systematic use of quoins (Figure 35a–c).
The masonry of rooms 10, 1, 7, 8, 9, 11, 12, 17, and 19 (Figure 3) corresponds to the first variant of opus incertum and is composed of elements whose dimensions vary according to their specific functions. An additional constructional feature of interest is the occasional deviation from the typical irregular pattern of opus incertum: short herringbone courses, extending for 2 to 4 courses at a time, appear sporadically along entire wall sections, repeating in an apparently random arrangement.
The infill structures of the southern walls of rooms 10, 1, 7, 8, 9, 11, and 12 (Figure 3) belong to the second variant of opus incertum, which lacks leveling courses and quoins and exhibits a less refined execution. Despite these differences, stratigraphic relationships indicate that this variant belongs to the same construction phase as the load-bearing walls, probably representing a subsequent construction stage.
The apsidal structure, identified as room 5, represents the third variant of opus incertum. While still employing this technique, the masonry shows greater homogeneity in stone arrangement, size, and finishing, together with the systematic use of quoins. Horizontal courses are no longer clearly identifiable, possibly due to the more regular organization of the facing. Stratigraphic evidence confirms that this structure postdates the earlier Roman rooms against which it abuts.
The presence of reused brick elements seems to characterize the post-classical structures of the complex, relating to phases of reuse and refunctionalization of the site that can be ascribed to the period between the 6th and at least the 9th century. Particularly evident today are: some portions of the pars urbana (e.g., the infill walls of rooms 11 and 12); the façade wall of the religious building (room 105) and some of its associated spaces (rooms 107 to 112); and the wall that currently delimits part of the southern area (room 101).
The infill walls of rooms 11 (east side) and 12 (west side), which are located respectively on the east (closure toward room 9), north (closure toward the peristyle), and west (closure toward room 17) sides, present a tripartite structure and facings made with a technique comparable to opus vittatum. These consist of reused brick elements arranged in courses alternating with limestone rough stones and small blocks in variable proportions. For example, on the west-facing wall closing rooms 11 and 9, a limestone-brick sequence can be observed: initially 2:2, then 2:1, and finally 1:1 in the third band, which is unfortunately interrupted—like most of the other structures—by collapses (Figure 35d).
The church façade masonry, in its apparently proto-Romanesque configuration, preserves only a few courses, laid in a 1:1 limestone-brick alternation. The execution technique is less accurate, despite the importance of the wall that most likely would have been plastered and perhaps also painted. This hypothesis is supported by the discovery of a small plaster fragment in the northern portion of what must have been the entrance (Figure 36).
Due to the limited differentiation in the materials and surface treatment, further refinement of the construction and design phases relies on the combined analysis of stratigraphy, architectural typology, written sources, and mortar analyses.

4. Discussion

The results of the integrated multimethod and multiscale approach confirm the efficacy of combining geomatic, geophysical, archival, and architectural analyses for the interpretation of complex archaeological systems. This study’s methodological strength is its progressive integration of diverse information sources under a single spatial framework, which allows for consistent interpretation from territorial to architectural scales instead of depending on isolated datasets. This interoperability significantly enhanced the precision of spatial and morphological reconstruction and revealed the relationships between geomorphological, architectural, and constructive evidence. The combined approach provided a comprehensive understanding of the villa’s layout, its hydraulic organization, and the sequence of transformations that shaped the site over time. The initial morphometric examination of the study area provided a basic foundation for understanding the spatial structure of the villa complex. The DTM derived from regional LiDAR datasets (Figure 4) enabled the precise identification of the plateau containing the archaeological complex, confirming its geomorphological suitability for settlement. The resultant contour analysis showed slight topographic discontinuities that might point to anthropogenic changes, although the spatial resolution prevented direct architecture identification. UAV-based LiDAR acquisition (Figure 5) produced a high-density point cloud with more than 280 million points, significantly improving interpretive capability. The generated elevation and orthophoto models (Figure 6a,b, Figure 7, and Figure 8) greatly improved the visibility of topographic features that would otherwise be hidden by vegetation or contemporary alterations. By combining TLS measurements from CF1 (Figure 6b) with UAV-derived DEM data, spatial continuity between landscape scale and building scale representations was guaranteed, lowering point-cloud alignment errors and enhancing model dependability. One of the most important results of the integrated study is the interpretation of morphometric anomalies found in the DEM and DSM models (Figure 9). The theory of a larger geographical extension of the villa beyond the presently excavated sections is supported by the discovery of five significant anomalies (A–E), which are spatially congruent with known architectural alignments.
Important information about changes in the terrain and the dynamics of settlement was obtained through the georeferencing and comparative study of historical mapping. The identification of structural features that were already visible in the nineteenth century, such as the retaining structures north of the villa and the remains connected to the thermal complex (CF3), was made possible by the integration of the Gregorian Cadastre maps within the GIS environment (Figure 11 and Figure 12). Significant landscape changes are highlighted by the differences between past hydrographic configurations and current topography, which are probably related to both natural geomorphological processes and human interventions. The idea that the villa complex is served by a structured hydraulic system is supported by historical sources that show an east–west orientated water route. This view is in line with earlier geoarchaeological methods that highlighted how hydrological systems influenced the placement and structure of settlements [7].
Before contemporary excavation efforts, historical aerial photos were crucial in reconstructing the ancient terrain. A 2.5D depiction of the landscape was created by projecting RAF aerial footage onto the digital terrain model (Figure 13). This allowed for the identification of structure alignments and vegetation anomalies that corresponded to buried features. Additional architectural units associated with previously excavated structures may be present, as indicated by the discovery of linear anomalies and spatial alignments (Figure 14). The idea of preserved ancient deposits is further supported by the preservation of similar alignments within underdeveloped areas of the contemporary village. The significance of historical aerial photointerpretation in archaeological prospection is confirmed by this method, especially when combined with contemporary geographical datasets. Additionally, the reconstruction of structural conditions that are no longer apparent today was achieved by the integration of digital models with archival photographic data, which aided in the understanding of earlier excavation stages and restoration efforts. Direct autoptic observation in certain cases would not have captured the full complexity of the constructional chronology, given the extent of restoration interventions carried out during previous excavation campaigns, which substantially altered the legibility of the original wall facings in the pars urbana. The systematic projection of archival photographs from the SABAP collection onto the three-dimensional laser-scanned model enabled a quantitative reassessment of the original masonry conditions, revealing interventions that had gone undetected in previous analyses and preventing potential misinterpretations of the constructional chronology.
This integrated workflow also proved decisive in the study of the religious building, where the combination of high-resolution laser scanning, photogrammetric survey, and metric-proportional analysis led to the identification of a far greater number of pillars and columns than previously documented, substantially revising the understood complexity and monumentality of this sector. The resulting stratigraphic sequence could not have been established without the convergence of evidence from masonry analysis, archival documentation, and three-dimensional survey, confirming the analytical value of systematic methodological integration in contexts marked by extensive post-excavation alteration. Ground Penetrating Radar (GPR) prospections allowed the identification of the presence of subterranean structures in line with previously discovered architectural aspects, such as the closure of room 20 and additional structural units north of room 16, at depths of roughly 0.5 m and 0.75 m (Figure 15 and Figure 16). The trustworthiness of the interpretations was much improved by incorporating GPR data into the spatial framework created from LiDAR and photogrammetric datasets.
Updated plans (Figure 17) were obtained by high-resolution laser scanning and photogrammetric documentation, which improved the visualization of structural linkages that had not been recorded in prior surveys. Specifically, the use of X-ray visualization methods enabled the finding of interior discontinuities in brick structures, which improved the accuracy of architectural sequence interpretation. An important illustration of how integrated survey methods can refute preconceived notions is the reinterpretation of the circular structure (Figure 18). The new research showed discrete structural phases, indicating numerous building or reuse occurrences, in contrast to earlier renderings that depicted the structure as a single architectural unit. Throughout the integrated analysis, a recurrent theme was the spatial link between the villa complex and adjacent water resources. Morphological gradients identified in elevation models indicate a natural slope facilitating water flow between CF1 and CF3, supporting the interpretation of a structured hydraulic distribution system. This theory is supported by the discovery of springs and conduits in historical records, which point to the existence of a sophisticated water management system that serves the thermal and residential sectors.

5. Conclusions

This study demonstrates the effectiveness of an integrated, multi-scale, and multi-sensor approach for the reanalysis of complex archaeological contexts, using the Roman villa of Madonna del Piano as a case study. The combined use of UAV-based LiDAR, terrestrial laser scanning, close-range photogrammetry, GPR prospection, historical aerial imagery, archival documentation, and architectural analysis significantly enhanced the understanding of both the spatial organization of the site and its long-term transformation processes.
From a landscape perspective, LiDAR-derived models and GIS-based analyses enabled a precise definition of the villa’s plateau, the identification of previously unrecognized anomalies, and a clearer reconstruction of the relationships between the settlement, hydraulic infrastructure, and surrounding landscape. At the architectural scale, high-resolution 3D surveys, combined with the systematic integration of archival photographs, proved crucial for overcoming interpretative limitations caused by past restoration interventions, allowing a more reliable reading of masonry stratigraphy and construction techniques.
The integration of multi-scale data is increasingly becoming the preferred tool for studying not only the structure but also the territory in a global view of the villa system. The integration of the various numerical surveys into the same reference system made it possible to perform a detailed technical analysis of the different parts of the villa. The data can thus be inspected at different levels of detail in a comprehensive and homogeneous set of relationships. The technical analysis of the structures was thus able to extend both to the overall view and to the individual parts analyzed.
The analysis of building techniques enabled a refined reconstruction of the constructional sequence documented in the examined areas, beginning with the earliest masonry characterized by multiple variants of opus incertum and extending to later phases of reuse and refunctionalization between Late Antiquity and the Early Middle Ages, marked by extensive material reuse and mixed techniques comparable to opus vittatum. The integration of stratigraphic observations, construction analysis, and comparative data further allowed the identification of distinct variants within the same building techniques, providing a deeper understanding of construction practices and framing these phases within a coherent regional and chronological context. Future research will focus on targeted material analyses, particularly mortars, to further refine the chronological framework, as well as on field verification of the anomalies detected through remote sensing. In this perspective, the Madonna del Piano case study provides not only new insights into a complex rural villa system but also a transferable methodological model for integrated archaeological investigation and heritage management.

Author Contributions

Investigation, A.A., G.C., M.C., V.G., P.M., G.P., D.Q. and E.S.; data curation, A.A., G.C., M.C., V.G., P.M., G.P., D.Q. and E.S.; conservation-related analysis and the study of masonry techniques, G.P. and E.S.; writing—original draft preparation, A.A., G.C., M.C., V.G., P.M., G.P., D.Q. and E.S.; writing—review and editing, A.A., G.C., M.C., V.G., P.M., G.P., D.Q. and E.S.; supervision, A.A.; M.C., P.M. and D.Q.; project administration, A.A.; P.M. and D.Q. All authors have read and agreed to the published version of the manuscript.

Funding

This research was funded by the Superintendency of Archaeology, Fine Arts, and Landscape for the provinces of Frosinone and Latina, Ministry of Culture (SABAP) in a joint project research with CNR-ISPC and University of Molise: Conoscenza, tutela, conservazione e valorizzazione attraverso strumenti sperimentali di rappresentazione digitale del sito archeologico della villa romana in località Casale di Madonna del Piano—Castro dei Volsci (FR) (Knowledge, protection, conservation, and enhancement through experimental tools for the digital representation of the archaeological site of the Roman villa in Casale di Madonna del Piano—Castro dei Volsci (FR))—CUP F77B22000230001.

Data Availability Statement

The raw data of this article will be made available by the authors on request.

Conflicts of Interest

The authors declare no conflicts of interest.

References

  1. Pietrobono, S. Carta archeologica medievale. Frosinone (Medieval archaeological map. Frosinone). Quad. Archeol. Mediev. 2006, VIII, F. 159-I. [Google Scholar]
  2. Sebastiani Del Grande, P. Preistoria e protostoria del Lazio meridionale (Prehistory and protohistory of southern Lazio). In Terra dei Volsci. Miscellanea 1; Tipolitografia Pontone: Cassino, Italy, 1995; pp. 5–32. [Google Scholar]
  3. Biddittu, I. Giacimenti pre-acheuleani di Castro dei Volsci (Frosinone) (Pre-Acheulean sites at Castro dei Volsci (Frosinone)). In Memorie dell’Istituto Italiano di Paleontologia Umana; Istituto Italiano di Paleontologia Umana: Roma, Italy, 1974; Volume 2, pp. 51–60. [Google Scholar]
  4. Coarelli, F. Italia Centrale (Central Italy); La Terza: Roma-Bari, Italy, 1985. [Google Scholar]
  5. Avilia, F.; Bruto, M.L. Il territorio di Castro dei Volsci: Note preliminari (The territory of Castro dei Volsci: Preliminary notes). In Terra dei Volsci. Annali; Museo archeologico comunale: Frosinone, Italy, 1998; Volume 1, pp. 59–72. [Google Scholar]
  6. Fenelli, M.; Pascucci, P. (Eds.) Il Museo Civico Archeologico di Castro dei Volsci (The Castro dei Volsci Municipal Archaeological Museum); EDR: Roma, Italy, 2009. [Google Scholar]
  7. Loreto, R.; Marcolongo, B. Manuale di Geoarcheologia. Un Approccio Geomorfologico da Remoto (A Handbook of Geoarchaeology: A Geomorphological Approach Using Remote Sensing); Uniorpress: Napoli, Italy, 2023. [Google Scholar]
  8. Angelini, A.; Cozzolino, M.; Gabrielli, R.; Gentile, V.; Mauriello, P. Geophysical and Geomatic Methods for the Knowledge, Conservation, and Management of Jordanian Cultural Heritage. Geosciences 2023, 13, 349. [Google Scholar] [CrossRef]
  9. Campana, S.; Piro, S. (Eds.) Seeing the Unseen: Geophysics and Landscape Archaeology; Taylor & Francis: London, UK, 2009. [Google Scholar]
  10. Opitz, R.; Cowley, D. (Eds.) Interpreting Archaeological Topography: Airborne Laser Scanning, 3D Data and Ground Observation; Oxbow Books: Oxford, UK, 2013. [Google Scholar]
  11. Verhoeven, G. Are we there yet? A review of archaeological passive aerial photography. Archaeol. Prospect. 2017, 24, 67–91. [Google Scholar]
  12. Doneus, M.; Briese, C.; Fera, M.; Janner, M. Archaeological prospection of forested areas using full-waveform airborne laser scanning. J. Archaeol. Sci. 2013, 40, 1046–1058. [Google Scholar] [CrossRef]
  13. Barker, G. A Mediterranean Valley: Landscape Archaeology and Annales History in the Biferno Valley; Leicester University Press: London, UK, 1995. [Google Scholar]
  14. Witcher, R. Globalisation and Roman Imperialism: Perspectives from the Roman World. J. Rom. Archaeol. 2000, 13, 213–225. [Google Scholar]
  15. Attema, P.; Burgers, G.; van Leusen, M. Regional Pathways to Complexity: Settlement and Land Use Dynamics in Early Italy; Amsterdam University Press: Amsterdam, The Netherlands, 2010. [Google Scholar]
  16. Lasaponara, R.; Masini, N. Satellite Remote Sensing: A New Tool for Archaeology; Springer: Dordrecht, The Netherlands, 2012. [Google Scholar]
  17. Parcak, S. Satellite Remote Sensing for Archaeology; Routledge: London, UK, 2009. [Google Scholar]
  18. Campana, S. Drones in Archaeology: State-of-the-Art and Future Perspectives. Archaeol. Prospect. 2017, 24, 275–296. [Google Scholar] [CrossRef]
  19. Opitz, R.; Herrmann, J. Recent trends and long-standing problems in archaeological remote sensing. J. Comput. Appl. Archaeol. 2018, 1, 19–41. [Google Scholar] [CrossRef]
  20. Campana, S.; Bianchi, G.; Fichera, A.; Lai, L.; Sordini, M. 3D recording and total archaeology: From landscapes to historical buildings. Int. J. Herit. Digit. Era 2012, 1, 443–460. [Google Scholar] [CrossRef]
  21. Cifani, G.; Opitz, R.; Stoddart, S. Mapping the Ager Faliscus road-system: The contribution of LiDAR survey. J. Rom. Archaeol. 2007, 20, 169–186. [Google Scholar]
  22. Opitz, R.; Stoddart, S. Mapping Archaeological Landscapes from Space; Cambridge University Press: Cambridge, UK, 2015. [Google Scholar]
  23. Vinci, G.; Vanzani, F.; Fontana, A.; Campana, S. LiDAR Applications in Archaeology: A Systematic Review. Archaeol. Prospect. 2024, 32, 81–101. [Google Scholar] [CrossRef]
  24. Vanni, E.; Cirigliano, G.P.; Cmmisola, A.; Zocco, S. Revealing the (un.) known in marginal landscapes. Multi-scalar LiDAR applications in the Monti Aurunci (Latium). Archeol. E Calc. 2025, 36. [Google Scholar]
  25. Troiano, M.; Mastrogiuseppe, M.; Furiassi, G.; Frezza, F.; Michetti, L.M.; Conti, A.; Bonadies, M.; Belelli Marchesini, B. Ground Penetrating Radar (GPR) and Archaeological Excavation in Northern Lazio Between Coastal Landscapes and Tufa Plateaux: New Perspectives Between Pyrgi and Veio (Rome). In Proceedings of the GPR Italy Conference 2025, Rome, Italy, 10–12 September 2025. [Google Scholar]
  26. Piro, S.; Campana, S.; Deiana, R.; Goodman, D.; Nishimura, Y. Integrated geophysical survey at Hadrian’s Villa (Tivoli, Italy). Remote Sens. 2019, 11, 1629. [Google Scholar]
  27. Keay, S.; Millett, M.; Poppy, S.; Robinson, J.; Taylor, J.; Terrenato, N. Falerii Novi: A new survey of the walled area. Pap. Br. Sch. Rome 2000, 68, 1–93. [Google Scholar] [CrossRef]
  28. Hay, S. Geophysics projects. Pap. Br. Sch. Rome 2015, 83, 294–298. [Google Scholar] [CrossRef]
  29. Gillings, M.; Hacıgüzeller, P.; Lock, G. (Eds.) Archaeological Spatial Analysis: A Methodological Guide; Routledge: London, UK, 2018. [Google Scholar]
  30. Kansa, E.C.; Kansa, S.W. We all know that a 14 is a sheep: Data publication and professionalism in archaeological communication. J. Archaeol. Method Theory 2013, 20, 4–5. [Google Scholar] [CrossRef]
  31. Letard, M.; Lague, D.; Le Guennec, A.; Lefèvre, S.; Feldmann, B.; Leroy, P.; Corpetti, T. 3DMASC: Accessible, explainable 3D point clouds classification. Application to Bi-spectral Topo-bathymetric lidar data. ISPRS J. Photogramm. Remote Sens. 2024, 207, 175–197. [Google Scholar] [CrossRef]
  32. Zhang, W.; Qi, J.; Wan, P.; Wang, H.; Xie, D.; Wang, X.; Yan, G. An Easy-to-Use Airborne LiDAR Data Filtering Method Based on Cloth Simulation. Remote Sens. 2016, 8, 501. [Google Scholar] [CrossRef]
  33. Frutaz, A.P. Le Carte del Lazio (The Maps of Lazio); Istituto di Studi Romani: Roma, Italy, 1972. [Google Scholar]
  34. Archivio di Stato di Frosinone (ASFR). Catasto Gregoriano (Gregorian Cadastre), Castro dei Volsci, Mappe Madonna del Piano, fogli VIII, X.
  35. Ceraudo, G.; Shepherd, E. Italian aerial photographic archives: Holdings and case studies. In Landscapes Through the Lens: Aerial Photographs and the Historic Environment; Cowley, D.C., Standring, R.A., Abicht, M.J., Eds.; Oxbow Books: Oxford, UK, 2010; pp. 237–246. [Google Scholar]
  36. Available online: https://idsgeoradar.com/ (accessed on 14 December 2025).
  37. Goodman, D. GPR-SLICE. Ground Penetrating Radar Imaging Software. User’s Manual; Geophysical Archaeometry Laboratory: Woodland Hills, CA, USA, 2004. [Google Scholar]
  38. Neal, A. Ground-penetrating radar and its use in sedimentology: Principles, problems and progress. Earth-Sci. Rev. 2004, 66, 261–330. [Google Scholar] [CrossRef]
  39. Conyers, L.B. Ground-Penetrating Radar for Archeology, 3rd ed.; AltaMira Press: Lanham, MD, USA, 2013. [Google Scholar]
  40. Goodman, D.; Piro, S. GPR Remote Sensing in Archaeology; Springer: Berlin/Heidelberg, Germany, 2013. [Google Scholar]
  41. Cozzolino, M.; Gentile, V.; Giordano, C.; Mauriello, P. Imaging Buried Archaeological Features through Ground Penetrating Radar: The Case of the Ancient Saepinum (Campobasso, Italy). Geosciences 2020, 10, 225. [Google Scholar] [CrossRef]
  42. Cozzolino, M.; Di Giovanni, E.; Gentile, V.; Mauriello, P.; Pizzano, N. Ground-Penetrating Radar Survey for the Study of the Church of Saint Cosma in Helerito (Tagliacozzo, L’Aquila, Italy). Geosciences 2020, 10, 244. [Google Scholar] [CrossRef]
  43. Calisi, D.; Botta, S.; Cannata, A. Integrated Surveying, from Laser Scanning to UAV Systems, for Detailed Documentation of Architectural and Archeological Heritage. Drones 2023, 7, 568. [Google Scholar] [CrossRef]
  44. Lindenbergh, R.; Anders, K.; Campos, M.; Czerwonka-Schröder, D.; Höfle, B.; Kuschnerus, M.; Vos, S. Permanent terrestrial laser scanning for near-continuous environmental observations: Systems, methods, challenges and applications. ISPRS Open J. Photogramm. Remote Sens. 2025, 17, 100094. [Google Scholar] [CrossRef]
  45. Available online: https://sabapfrlt.cultura.gov.it/servizio/archivio-fotografico/ (accessed on 12 October 2025).
  46. Spiazzi, A.M.; Bertaglia, E. (Eds.) Gli Archivi Fotografici Delle Soprintendenze: Tutela e Storia; Territori Veneti e Limitrofi (The Photographic Archives of the Superintendence: Preservation and History; the Territories of Veneto and Neighbouring Areas); Atti Della Giornata di Studio; Terra Ferma: Vicenza, Italy, 2010. [Google Scholar]
  47. Zizi, L. L’Archivio fotografico della Soprintendenza speciale per i beni archeologici di Roma (The Photographic Archive of the Special Superintendency for Archaeological Heritage in Rome). In Proceedings of the Convegno Immagini e Memoria: Gli Archivi Fotografici di Istituzioni Culturali Della Città di Roma; Fabjan, B., Ed.; Palazzo Barberini: Roma, Italy, 2012; pp. 85–92. [Google Scholar]
  48. Falsini, M.L. L’Archivio fotografico della Soprintendenza per i beni archeologici dell’Etruria meridionale (The Photographic Archive of the Superintendency for Archaeological Heritage of Southern Etruria). In Proceedings of the Convegno Immagini e Memoria: Gli Archivi Fotografici di Istituzioni Culturali Della Città di Roma; Fabjan, B., Ed.; Palazzo Barberini: Roma, Italy, 2012; pp. 93–100. [Google Scholar]
  49. Cajano, E. L’Archivio fotografico della Soprintendenza per i beni architettonici e paesaggistici per il Comune di Roma: Storia e tutela della città (The Photographic Archive of the Superintendency for Architectural and Landscape Heritage for the Municipality of Rome: The history and conservation of the city). In Proceedings of the Immagini e Memoria: Gli Archivi Fotografici di Istituzioni Culturali Della Città di Roma; Fabjan, B., Ed.; Palazzo Barberini: Roma, Italy, 2012; pp. 101–110. [Google Scholar]
  50. Sorrentino, C. Archeologia in archivio. I fondi fotografici delle Soprintendenze e il caso di Ostia Antica (Archaeology in the archives. The photographic collections of the Superintendencies and the case of Ostia Antica). Anal. Archaeol. 2018, 4, 223–253. [Google Scholar]
  51. Dostal, C.; Yamafune, K. Photogrammetric texture mapping: A method for increasing the Fidelity of 3D models of cultural heritage materials. J. Archaeol. Sci. Rep. 2018, 18, 430–436. [Google Scholar] [CrossRef]
  52. Carnevali, L.; Carpiceci, M.; Angelini, A. A new protocol for texture mapping process and 2D representation of rupestrian architecture. Int. Arch. Photogramm. Remote Sens. Spat. Inf. Sci. 2018, XLII-2, 209–215. [Google Scholar] [CrossRef][Green Version]
  53. Carbonara, G. Restauro Architettonico—Principi e Metodo (Architectural Restoration—Principles and Methods), 1st ed.; M.E. Architectural Book and Review: Rome, Italy, 2012. [Google Scholar]
  54. Doglioni, F.; Ciarocchi, M. Stratigrafia e Restauro: Tra Conoscenza e Conservazione Dell’architettura; Idee, Strumenti ed Esperienze per il Restauro (Stratigraphy and Restoration: Between Architectural Knowledge and Conservation; Ideas, Tools and Experiences in Restoration); LINT: Trieste, Italy, 1997. [Google Scholar]
  55. D’Onofrio, M.; Quintavalle, A.C.; Bertelli, G. (Eds.) Rilavorazione Dell’antico nel Medioevo; I Libri di Viella Arte (The Reinterpretation of Antiquity in the Middle Ages; The Books of Viella Arte), 1st ed.; Viella: Roma, Italy, 2003. [Google Scholar]
  56. Fiorani, D. Tecniche Costruttive Murarie Medievali: Il Lazio Meridionale; Storia della Tecnica Edilizia e Restauro dei Monumenti (Medieval Masonry Construction Techniques: Southern Lazio; History of Building Techniques and the Restoration of Monuments); L’Erma di Bretschneider: Roma, Italy, 1996. [Google Scholar]
  57. Angelini, A.; Cozzolino, M.; Gabrielli, R.; Gentile, V.; Mauriello, P. Three-Dimensional Modeling and Non-Invasive Diagnosis of a Huge and Complex Heritage Building: The Patriarchal Basilica of Santa Maria Assunta in Aquileia (Udine, Italy). Remote Sens. 2023, 15, 2386. [Google Scholar] [CrossRef]
  58. Angelini, A.; Gabrielli, R.; Quadrino, D.; Rascaglia, G.; Scopinaro, E. Trasformazioni e riusi nella villa in loc. Madonna del Piano a Castro dei Volsci (FR): L’integrazione laser scanner e fotogrammetria per la ricostruzione delle fasi insediative tardoantiche e altomedievali (Transformations and reuses at the Villa in Madonna del Piano, Castro dei Volsci (FR): The integration of laser scanning and photogrammetry for the reconstruction of Late Antique and Early Medieval settlement phases). In Le ville del Lazio Alla Fine Dell’antichità. Insediamento, Attività Produttive, Cultura (Villas in Lazio at the End of Antiquity. Settlement, Productive Activities, Culture); EUC-Edizioni Università di Cassino: Cassino, Italy, 2023; pp. 159–196. [Google Scholar]
  59. Gabrielli, R.; Portarena, D.; Franceschinis, M. Tecniche di documentazione dei tappeti musivi del sito archeologico di Umm al-Rasas Kastron Mefaa (Giordania) (Documentation techniques for mosaic floors at the archaeological site of Umm al-Rasas Kastron Mefaa (Jordan)). Archeol. E Calc. 2017, 28, 201–218. [Google Scholar]
  60. Salvatori, M. Manuale di Metrologia. Per Architetti Studiosi di Storia Dell’architettura e Archeologi in Italia (Handbook of Metrology for Architects, Architectural Historians, and Archaeologists in Italy); Liguori: Napoli, Italy, 2006. [Google Scholar]
  61. Torraca, G. Lectures on Materials Science for Architectural Conservation; The Getty Conservation Institute: Los Angeles, CA, USA, 2009. [Google Scholar]
  62. Esposito, D. Tecniche Costruttive Murarie Medievali: Murature “a Tufelli” in Area Romana; Storia della Tecnica Edilizia e Restauro dei Monumenti (Medieval Masonry Construction Techniques: ‘Tufelli’ Masonry in the Roman area; History of Building Techniques and the Restoration of Monuments); “L’Erma” di Bretschneider: Roma, Italy, 1998. [Google Scholar]
  63. Fentress, E.; Goodson, C. Villamagna (FR): L’eredità di una villa imperiale in epoca bizantina e medievale (Villamagna (FR): The legacy of an imperial villa in the Byzantine and medieval epoch). Archeol. Mediev. 2012, 39, 57–86. [Google Scholar]
  64. Pollio, V.; Gros, P.; Corso, A.; Romano, E. De Architectura: I Millenni; Giulio Einaudi: Torino, Italy, 1997. [Google Scholar]
  65. Adam, J.P. L’ Arte Di Costruire Presso i Romani; Biblioteca di Archeologia (The Art of Building Among the Romans), 2nd ed.; Longanesi: Milano, Italy, 1990. [Google Scholar]
  66. Laurenti, M.C. La villa romana di Casale a Castro dei Volsci (The Roman villa of Casale at Castro dei Volsci). In Papers of the Fourth Conference of Italian Archaeology, v 4; Herring, E., Whitehouse, R., Wilkins, J., Eds.; University of London: London, UK, 1992; pp. 119–144. [Google Scholar]
Figure 1. Location of Castro dei Volsci (Italy) and view of the archaeological site of Madonna del Piano and the medieval castrum on Google Cartography (Image © 2026 Airbus).
Remotesensing 18 01526 g001
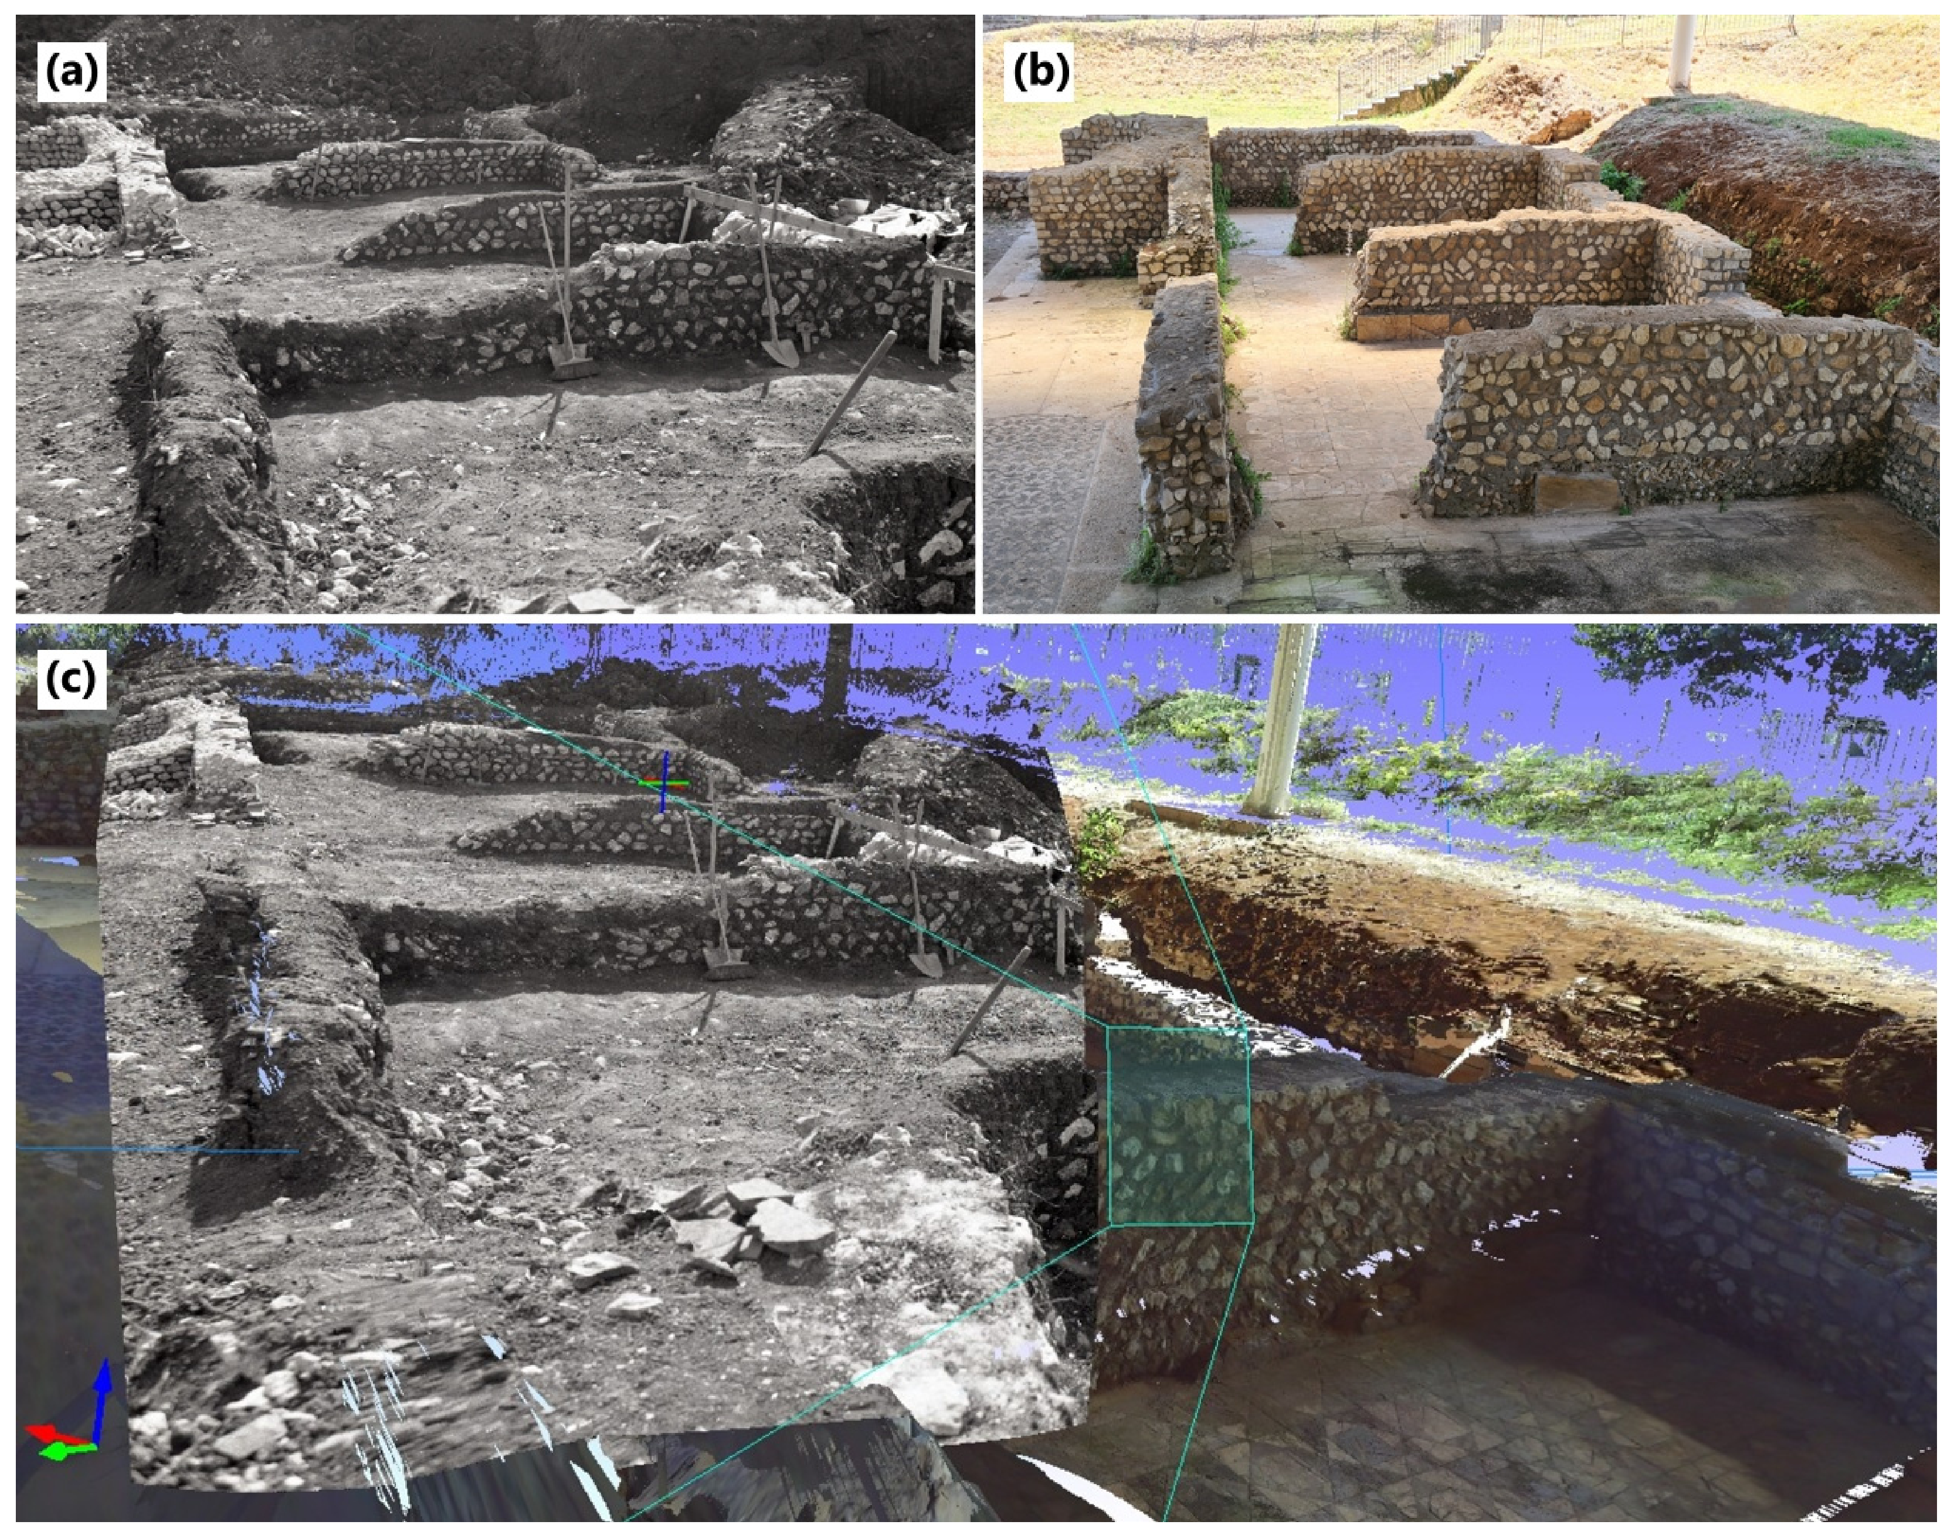
Figure 2. Area of Madonna del Piano with indication of the investigated area (in red) and the three main sectors highlighted in magenta (Google Image © 2026 Airbus) (a) and general plan of the archaeological area (SABAP FR-LT Archive) (b).
Remotesensing 18 01526 g002
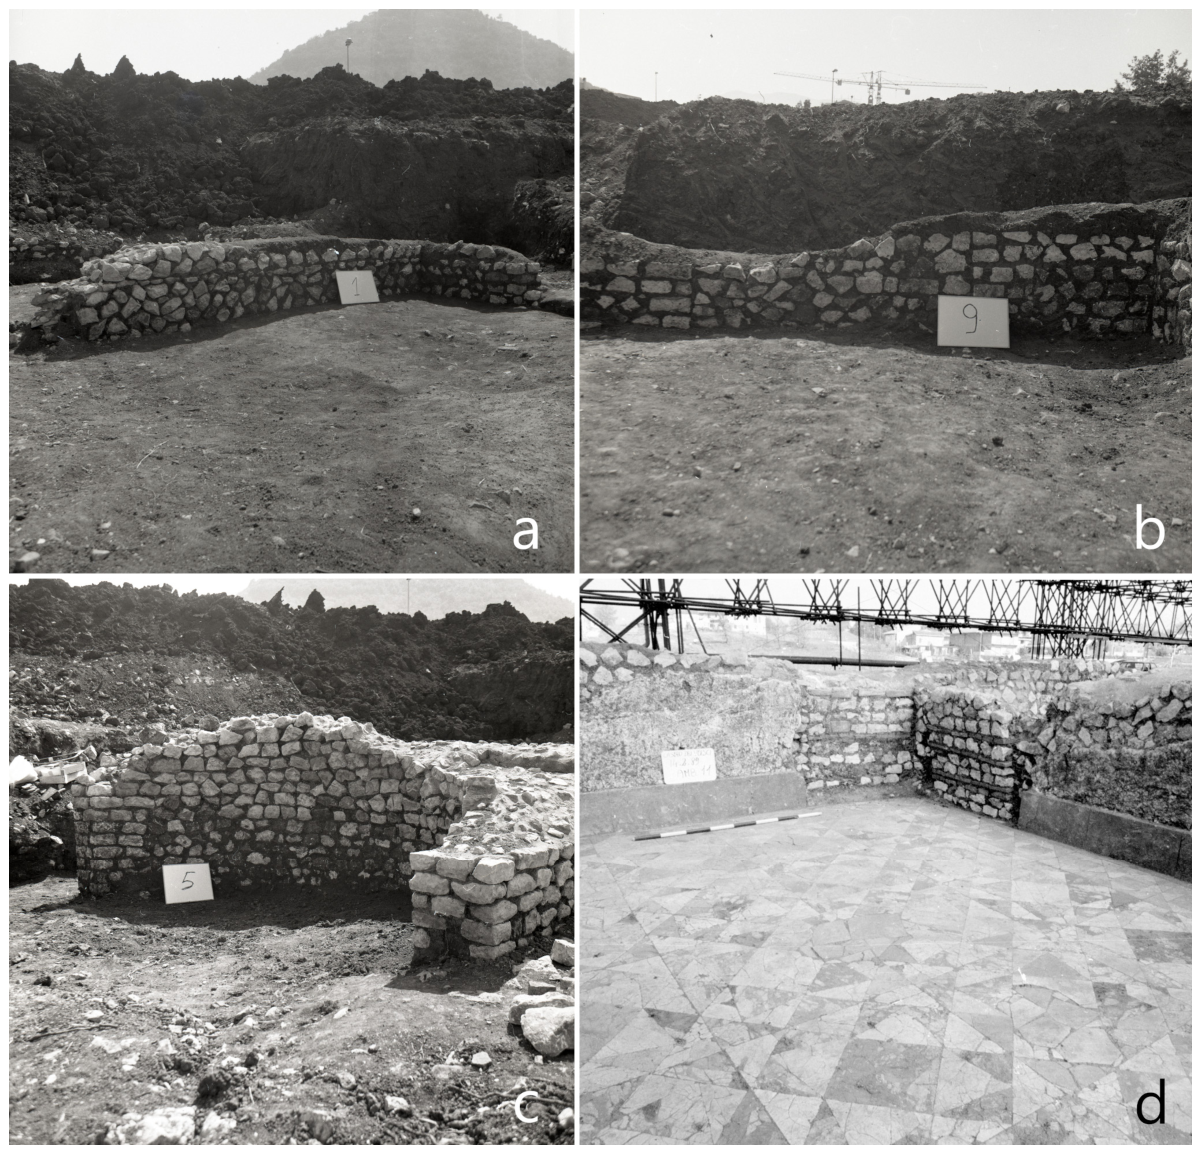
Figure 3. General plan of the villa, as seen inside the civic museum of Castro dei Volsci. No detailed surveys of the religious part (west) have been published. Numbers and letters indicate rooms of the structure (a); General plan of the excavations carried out in the 1980s, with some structures no longer visible to be integrated into the current survey (Superintendency archive III_6, scan 1867, 1985) (b).
Remotesensing 18 01526 g003
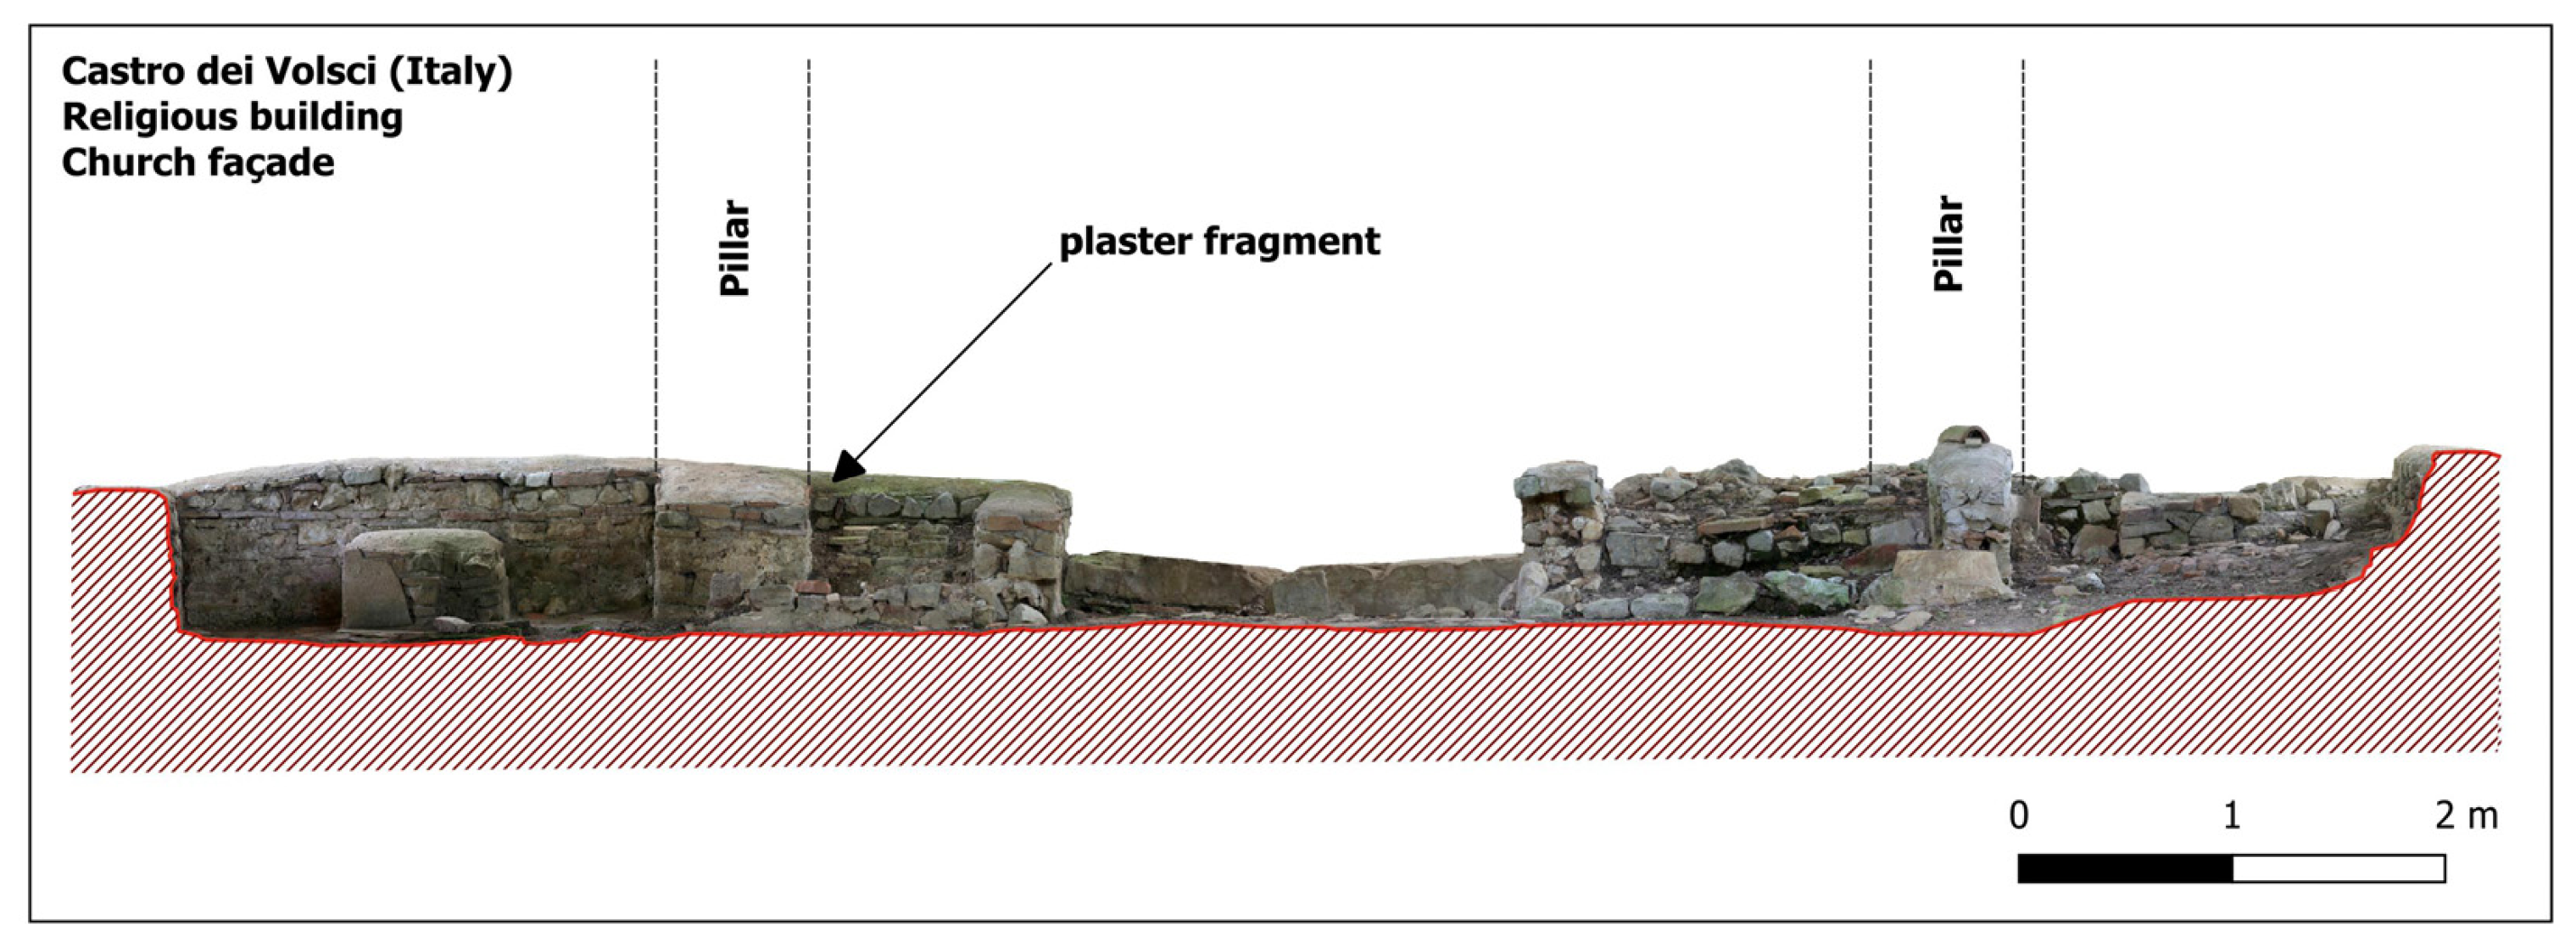
Figure 4. Grid of GPR data acquisition (a) and an example of radargram (Line TMA10018) (b).
Remotesensing 18 01526 g004
Figure 5. DTM of the area processed using QGIS from the LiDAR data available on the MASE website. The data resolution is 1 m for the Castro dei Volsci area (data provided by the Ministry of the Environment and Energy Security, License CC BY 4.0, https://creativecommons.org/licenses/by/4.0/ (accessed on 1 April 20025)). The villa’s planting plateau is indicated with red arrows.
Remotesensing 18 01526 g005
Figure 6. Raw data acquired with the Zenmuse L1 LiDAR instrument: the overall area surveyed in this first survey campaign (a) and a detail showing the resolution used during filming (b).
Remotesensing 18 01526 g006
Figure 7. General orthophoto of the area with the archaeological structures (magenta color) (a) and the DEM integrated with the scanned structures of CF1 (b). The investigated area is indicated with the red polygon.
Remotesensing 18 01526 g007
Figure 8. General shaded map with the DTM (a) and an enlargement of the area (b) with the various anomalies reported (blue arrows), some of which are certainly attributable to the structures of the villa, others requiring field verification (Google Image © 2026 Airbus). The investigated area is indicated with the red polygon and the archaeological structures with magenta lines.
Remotesensing 18 01526 g008
Figure 9. The image shows the general shaded map (a) and an enlargement of the area (b) with the various anomalies reported (blue arrows), some of which are certainly attributable to the structures of the villa, others requiring field verification (Google Image © 2026 Airbus). The investigated area is indicated with the red polygon and the archaeological structures with magenta lines.
Remotesensing 18 01526 g009
Figure 10. Shaded map with the DTM with interpretation of anomalies (Google Image © 2026 Airbus). The investigated area is indicated with the red polygon and the archaeological structures with blue lines. Anomalies are signed in orange (A), magenta (B), yellow (C), light blue (D) and green (E).
Remotesensing 18 01526 g010
Figure 11. Maps of the Gregorian Cadastre (State Archives of Frosinone, Gregorian Cadastre, Castro dei Volsci, sheet I, Madonna del Piano, sheets VIII, X) georeferenced on Google Digital Cartography (Image © 2026 Airbus) overlayed with DTM and with modern buildings (The Revenue Agency—Central Directorate for Land Registry, Cartographic, and Real Estate Advertising Services CC BY 4.0).
Remotesensing 18 01526 g011
Figure 12. Detail of the Gregorian Cadastre (State Archives of Frosinone, Gregorian Cadastre, Castro dei Volsci, Madonna del Piano, sheets VIII, X) for the area of interest with modern buildings (The Revenue Agency—Central Directorate for Land Registry, Cartographic, and Real Estate Advertising Services CC BY 4.0, Google Image © 2026 Airbus).
Remotesensing 18 01526 g012
Figure 13. Historical aerial photograph projected onto the digital terrain model for a 2.5D view of the area and modern buildings (The Revenue Agency—Central Directorate for Land Registry, Cartographic, and Real Estate Advertising Services CC BY 4.0, ICCD—Archivio Aerofototeca Nazionale—Mediterranean Allied Photographic Reconnaissance Wing (MAPRW)—RAF—Date: 30 July 1945, Flight 1530 RAF (for MAPRW) of 30 July 1945, Strip: 6804, Frames 4093).
Remotesensing 18 01526 g013
Figure 14. On the left (a), the projected image, the anomalies and alignments highlighted in yellow; on the right (b), the same ones projected onto Google cartography (Image © 2026 Airbus) for their positioning with respect to the current context (ICCD—Archivio Aerofototeca Nazionale—Mediterranean Allied Photographic Reconnaissance Wing (MAPRW)—RAF—Date: 30 July 1945, Flight 1530 RAF (for MAPRW) of 30 July 1945, Strip: 6804, 4093 Frame).
Remotesensing 18 01526 g014
Figure 15. GPR slices obtained using a 600 MHz antenna, showing anomalies at approximately 0.5 m in depth (a) and 0.75 m in depth (b). Numbers refer to rooms reported in Figure 3a.
Remotesensing 18 01526 g015
Figure 16. Interpretation of GPR anomalies. Blue lines indicate shallow features, while deeper anomalies are marked in magenta. The white dotted polygon outlines the surveyed area. Numbers refer to rooms reported in Figure 3a.
Remotesensing 18 01526 g016
Figure 17. Updated general plan of CF1 complex of the Roman villa represented with X-ray algorithm.
Remotesensing 18 01526 g017
Figure 18. Integration and differences between the survey of the 1980s and the current situation. The image shows a significant USMs difference between the two drawings (a); some parts visible at that time have to be integrated for the final representation (b, c). Numbers refer to rooms reported in Figure 3a.
Remotesensing 18 01526 g018
Figure 19. Example of an orthophoto generated using multi-image photogrammetry techniques, CF1, room 119, west elevation.
Remotesensing 18 01526 g019
Figure 20. A laser scanner survey was performed with the instrument mounted upside down.
Remotesensing 18 01526 g020
Figure 21. Preliminary representation of the main construction phases of the Roman villa at Castro dei Volsci, CF1.
Remotesensing 18 01526 g021
Figure 22. Area in front of the presbytery inside the church during the excavation (Photo inv. n. L91.6303-0001, SABAP FR-LT Archive).
Remotesensing 18 01526 g022
Figure 23. The Image from the photographic archive has been projected onto the laser scanner numerical model to achieve quantitative information about the 1980s excavation (Photo inv. n. L91.6303-0001, SABAP FR-LT Archive).
Remotesensing 18 01526 g023
Figure 24. DEM of the Christian cult building area with a resolution of 0.002 m that shows the architectural articulation and archaeological traces.
Remotesensing 18 01526 g024
Figure 25. The image shows the current presence of pillars and columns inside the church. In red, the new interpretations and discoveries made thanks to the 3D survey (a). On the right, the photo of the recent discovery of the base of a column in the church area (b).
Remotesensing 18 01526 g025
Figure 26. Further pillar bases were identified during cleaning operations in the area of the cult building.
Remotesensing 18 01526 g026
Figure 27. Madonna del Piano archaeological site during the 1987 excavation campaign (Photo L/87.916 SABAP FR-LT Archive) (left), and during the restoration of the floors in the pars urbana of the Roman villa in 1991 (Photo L/91.394 SABAP FR-LT Archive) (right).
Remotesensing 18 01526 g027
Figure 28. View of the Room 10 showing ancient water canalization visible after the temporary removal of the floor mosaics in 1989 (Photo L/89.6407 SABAP FR-LT Archive) (left), and view of the southern sector of the pars urbana showing tile-built drainage channels near the circular wall of Room 17 (1991) (Photo L/89.690 SABAP FR-LT Archive) (right).
Remotesensing 18 01526 g028
Figure 29. North wall of Room 5. (Left) during the excavations (1984) (Photo a/84.779 SABAP FR-LT Archive); (Right) current condition (2025). The solid red line indicates the area of the missing part, the dashed one is the reference limit between the two images.
Remotesensing 18 01526 g029
Figure 30. East wall of room 1, with preserved original blocks highlighted. (Top) during the excavations (1985) (Photo a/85.1071 SABAP FR-LT Archive); (Bottom) current condition (2025).
Remotesensing 18 01526 g030
Figure 31. South wall of Room 9 with preserved original blocks highlighted. (Top) during the excavations (1985) (Photo A/85.1093 SABAP FR-LT Archive); (Bottom) current condition (2025).
Remotesensing 18 01526 g031
Figure 32. South wall of Room 10. Highlighted in red in the historical image are the masonry courses and plaster covering the foundation, which were subsequently removed. Circled in red in the survey image is a brick insert absent from the earlier photograph, and thus attributed to restoration work. (Top) during the excavations (1989) (Photo L/89.650 SABAP FR-LT Archive); (Bottom) current state (2025).
Remotesensing 18 01526 g032
Figure 33. Madonna del Piano archaeological site before and after the late 20th-century restoration intervention. (Left) during the excavations (1985) (Photo A/85.1097 SABAP FR-LT Archive); (Right) current condition (2025).
Remotesensing 18 01526 g033
Figure 34. Madonna del Piano archaeological site before ((a), 1985) and after the late 20th-century restoration intervention ((b), 2025). In the bottom (c), the texture mapping process of the archive image (Photo A/85.1082 SABAP FR-LT Archive).
Remotesensing 18 01526 g034
Figure 35. Overview of masonry techniques and variants: (a) opus incertum with quoin blocks and leveling courses [Room 1] (1985) (Photo A/85.1071 SABAP FR-LT Archive); (b) opus incertum infill without quoins and leveling courses [Room 9] (Photo A/85.1093 SABAP FR-LT Archive); (c) third variant of opus incertum with more homogeneous arrangement [Room 5] (Photo A/85.1090 SABAP FR-LT Archive); (d) masonry comparable to opus vittatum with reused bricks and limestone elements [Rooms 11–12] (Photo L89.668 SABAP FR-LT Archive).
Remotesensing 18 01526 g035
Figure 36. Church façade masonry with a preserved plaster fragment on the left side of the entrance.
Remotesensing 18 01526 g036
Disclaimer/Publisher’s Note: The statements, opinions and data contained in all publications are solely those of the individual author(s) and contributor(s) and not of MDPI and/or the editor(s). MDPI and/or the editor(s) disclaim responsibility for any injury to people or property resulting from any ideas, methods, instructions or products referred to in the content.