MSPaDet: A Multi-Scale Phase-Aware Denoising Method for Target Detection in SAR Images


Highlights
- Explicit phase-coherent multi-scale frequency decomposition provides a principled mechanism for separating weak SAR targets from clutter, as it suppresses low-coherence speckle responses while preserving structurally meaningful directional cues.
- Joint modeling of phase and energy is shown to yield a more discriminative and structurally stable representation than single-cue enhancement, enabling more faithful characterization of weak, irregular, and anisotropically scattered targets under complex background interference.
- The results suggest that SAR target detection can benefit from moving beyond purely spatial enhancement or coarse magnitude-based frequency selection toward explicit phase-aware, direction-sensitive, and multi-scale representation learning.
- By improving the structural fidelity and stability of target representations under speckle, clutter, and anisotropic scattering, the proposed strategy offers a practically meaningful route toward more reliable SAR perception in Earth observation, maritime surveillance, and safety-critical monitoring applications.
Abstract
1. Introduction
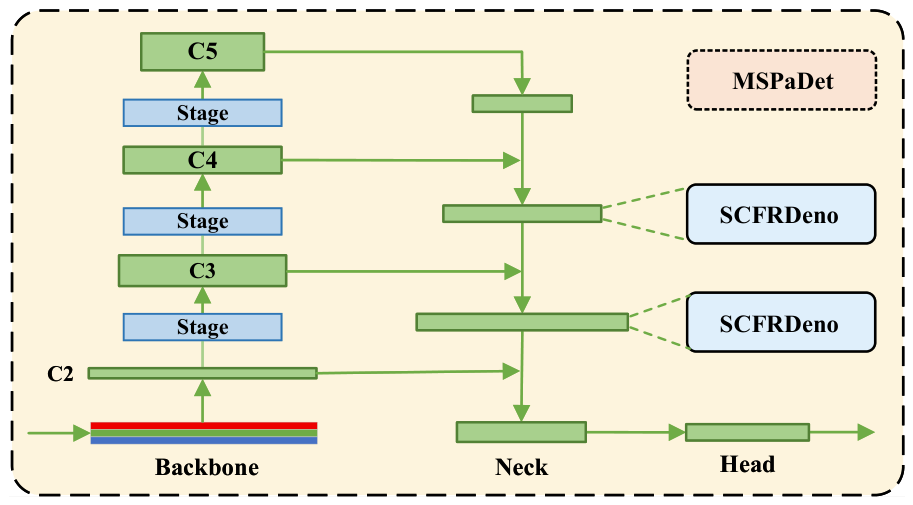
- We propose MSPaDet, a phase-aware detection framework using DTCWT for explicit directional sub-band modulation to enhance weak targets in speckle noise.
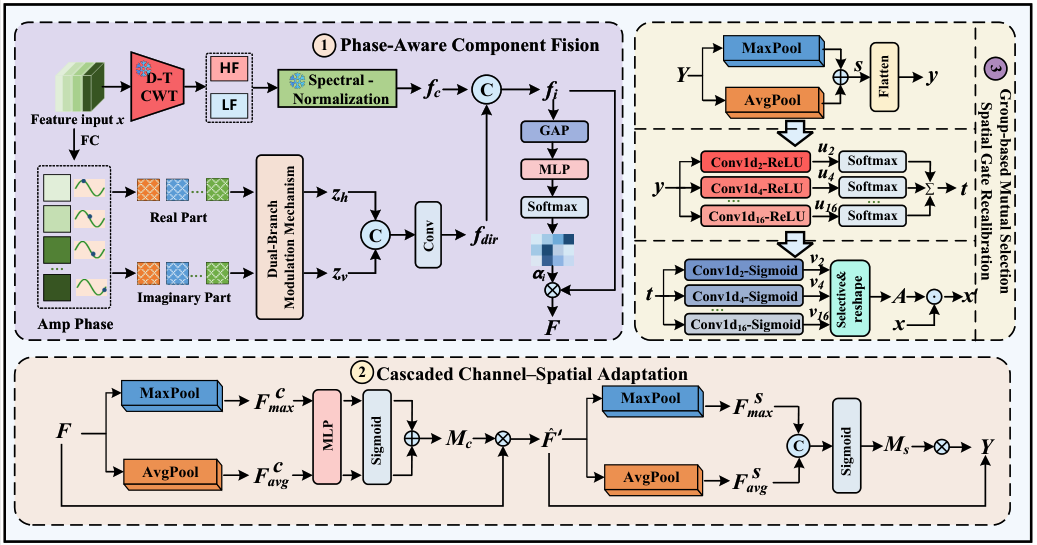
- We introduce SCFRDeno–PaSCA, which leverages phase consistency, local energy, and phase-direction cues for sub-band denoising and input-adaptive refinement.
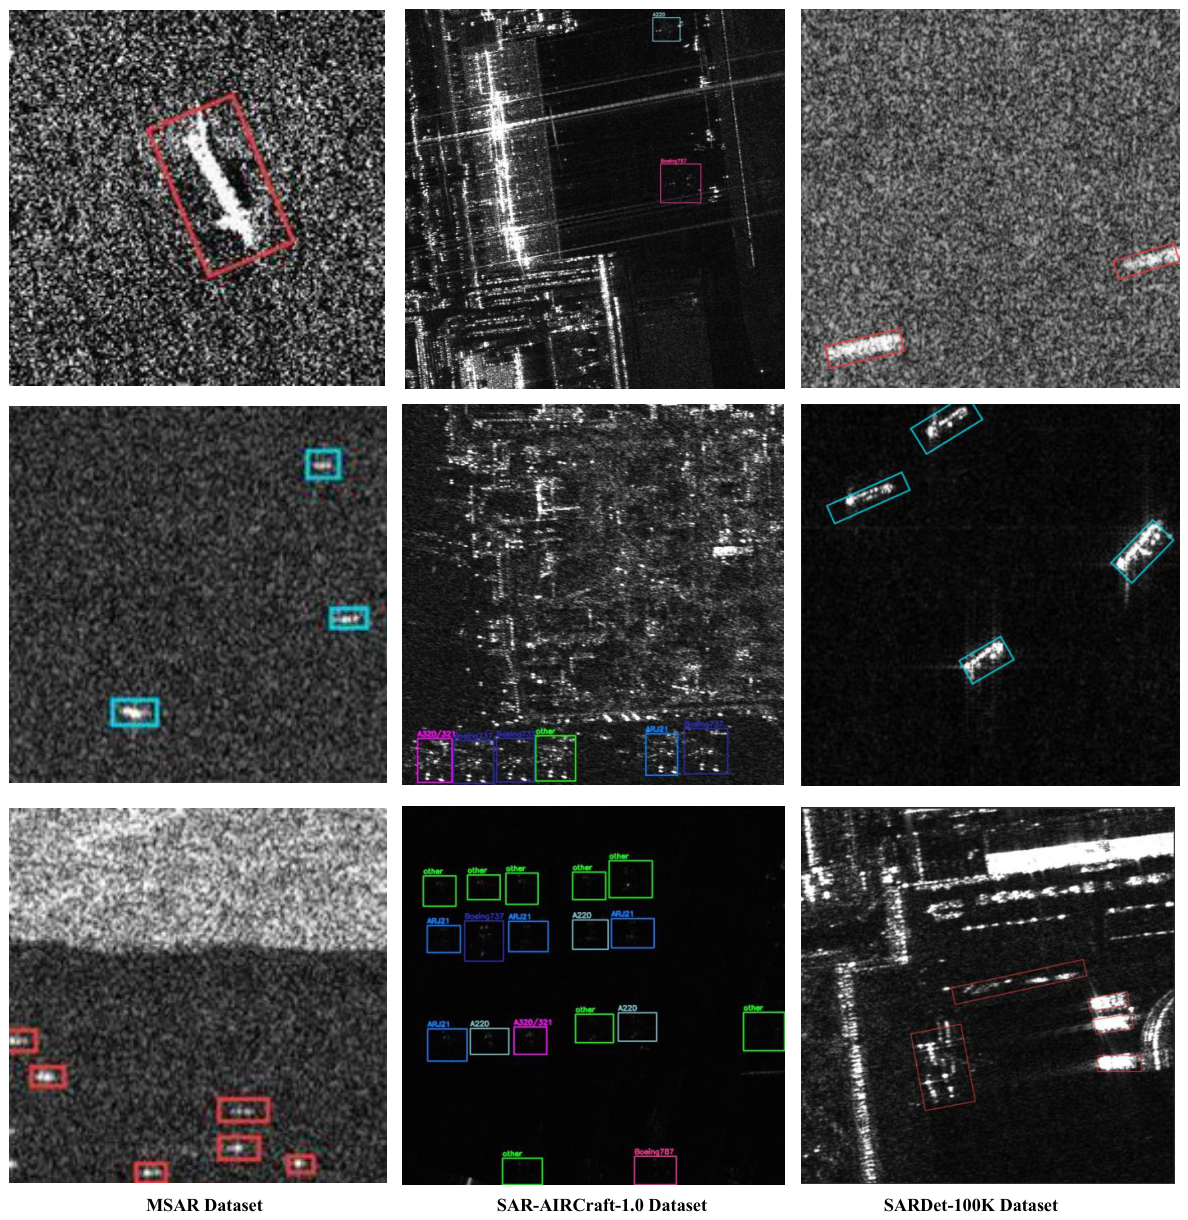
- Experiments on MSAR, SAR-Aircraft-1.0, and SARDet-100K show superior accuracy and robustness with modest overhead, confirming practical utility.
2. Related Work
2.1. Object Detection in SAR Imagery
2.2. Adaptive Enhancement and Frequency-Domain Modulation
3. Method
3.1. Overview
3.2. SCFRDeno
| Algorithm 1 SCFRDeno |
|
- ➀
- DTCWT decomposition. SCFRDeno adopts Dual-Tree Complex Wavelet Transform (DTCWT) to obtain a multi-scale, multi-orientation complex representation. In the one-dimensional case, the low-pass and high-pass decompositions at the c-th layer areThe complex wavelet coefficient is formed by the real and imaginary outputs:In the two-dimensional case, six directional sub-bands are obtained via separable row–column filtering, producing complex coefficientsAt each scale, DTCWT yields six oriented high-pass sub-bands along with a low-pass residual. The amplitude and phase are computed as
- ➁
- Phase consistency and sub-band reweighting. We measure local phase coherence on each directional sub-band usingwhere is a spatial neighborhood. In practical applications, is defined as a local window on each directional sub-band ( in this paper). We then apply phase-aware re-weighting to suppress low-coherence sub-band components:
- ➂
- Normalization and feature aggregation. To prevent high-energy amplitude components from dominating subsequent feature learning while preserving phase information for structural orientation characterization, normalization is applied only to the amplitude:The normalized coefficients preserve phase information for structural characterization. We concatenate the real and imaginary parts of all scales and orientations along the channel dimension to obtain a multi-scale, multi-directional complex representation. Here, “phase-aware” refers to the analytic sub-band phase of the DTCWT coefficients, which encodes local orientation and phase coherence, rather than the electromagnetic phase of raw complex SAR measurements.The concatenated features are then compressed and aligned using convolutions to produce . In MSPaDet, is refined by PaSCA and passed to the detection head for classification and localization.
3.3. PaSCA
- ➀
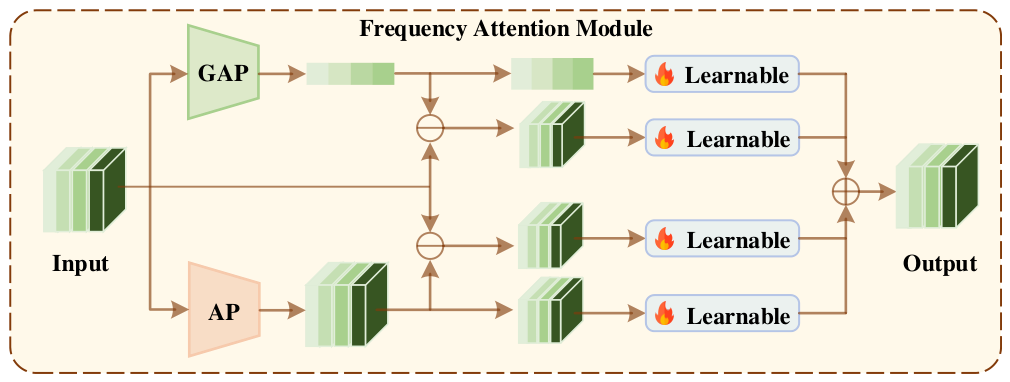
- Phase-aware component fusion. To better accommodate anisotropic scattering and speckle interference, we model intermediate features with an amplitude–phase representation and perform direction-aware fusion. Given input featuresmapped to the complex plane, each component is represented as a complex wavewhere represents the characteristic amplitude, while denotes phase information used to describe structural orientation. The phase is generated through a lightweight per-channel mappingwhere , the phase estimation module outputs , and its learnable parameters satisfy . According to Euler’s formula, the complex waveform can be decomposed into real and imaginary partsTo capture directional variability, we employ two directional brancheswhere and . The learnable projection weights are defined as , and the modulated outputs satisfy . When two waveforms are superimposed, the resulting amplitude is influenced by their phase difference:This motivates phase-modulated aggregation:In implementation, we concatenate the two directional outputs and obtain a compact direction-aware featureWe further introduce a channel-semantic branch and compute branch weights via global pooling and a two-layer MLP:The final fused feature is obtained by adaptive aggregation:
- ➁
- Cascaded channel–spatial adaptation. We apply a lightweight two-stage correction on F to enhance salient targets and suppress background interference. First, channel statistics are computed by global average pooling and global max pooling:They are fed into a shared two-layer MLP:yielding the channel attention mapThe channel-enhanced feature isNext, we compute channel-wise average and max mapsand obtain the spatial attention mapFinally, spatial correction is applied as
- ➂
- Group-wise spatial gating. To further accommodate heterogeneous clutter and spatially varying noise sensitivity, we introduce group-wise spatial gating for finer-grained region selection. Given an input feature mapwe first construct a compact spatial descriptorWe generate multi-granularity candidates with and compute grouping featuresA micro-selective operator performs soft selection over candidatesWe then construct another candidate set and generate gate candidates conditioned on t:The final gate vector is obtained byFinally, we reshape and apply the spatial gate:
4. Experiments
4.1. Setup
4.1.1. Dataset
4.1.2. Implementation Details
4.2. Test Results
4.2.1. Results on the MSAR Dataset
4.2.2. Results on the SAR-Aircraft-1.0 Dataset
4.2.3. Results on the SARDet-100K Dataset
4.2.4. Cross-Dataset Transfer Evaluation
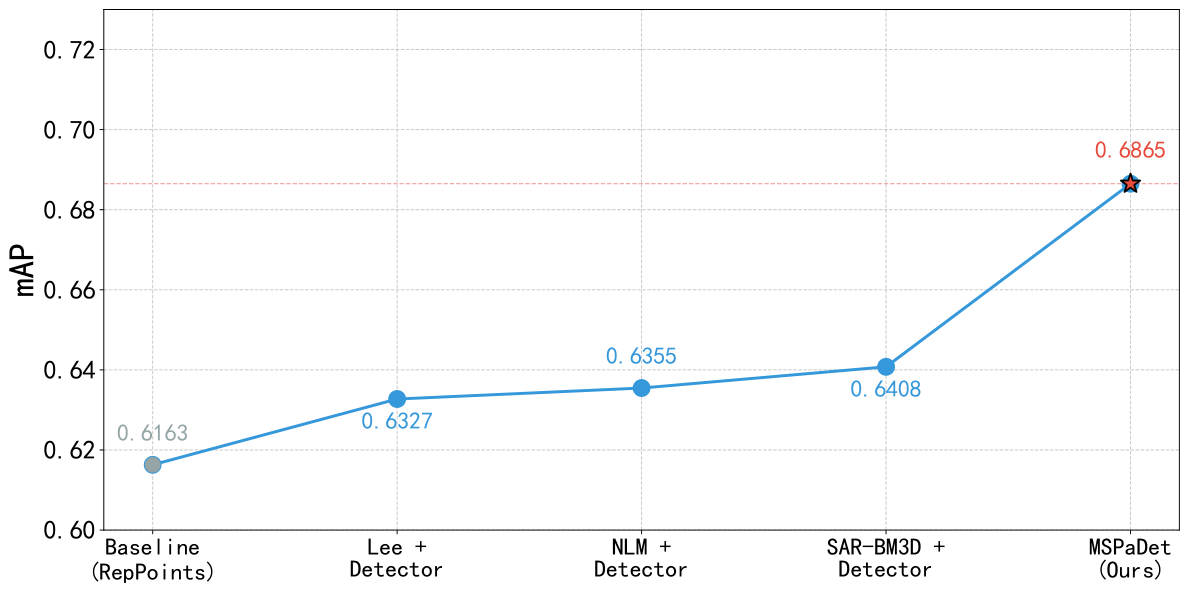
4.2.5. Comparison with Traditional Despeckling-Based Detection Pipelines
4.3. Ablation Study
4.3.1. Ablation on Frequency-Domain Modeling
4.3.2. Ablation Study of Dual-Branch Modeling
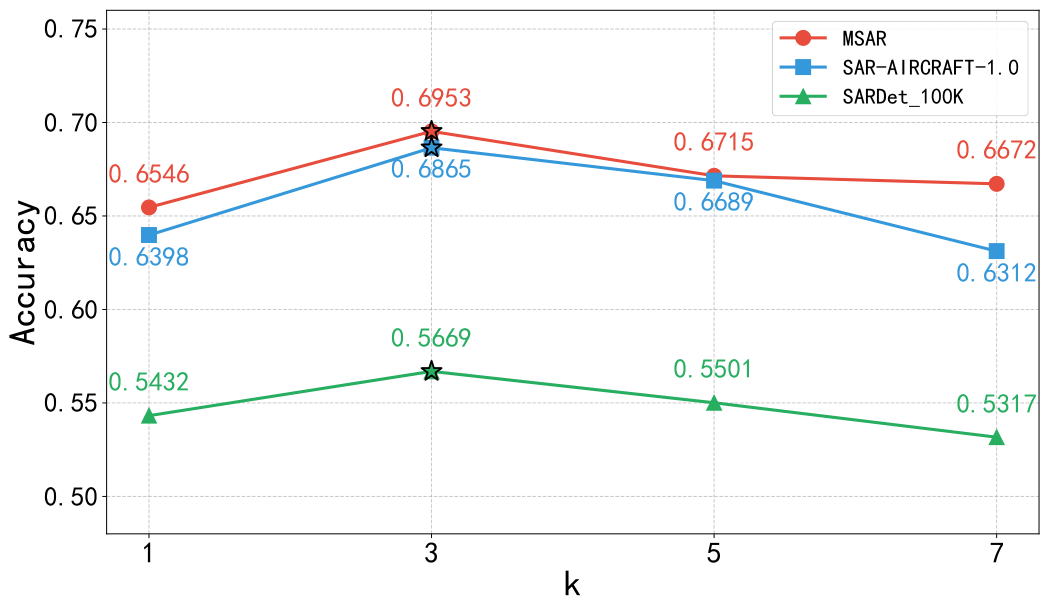
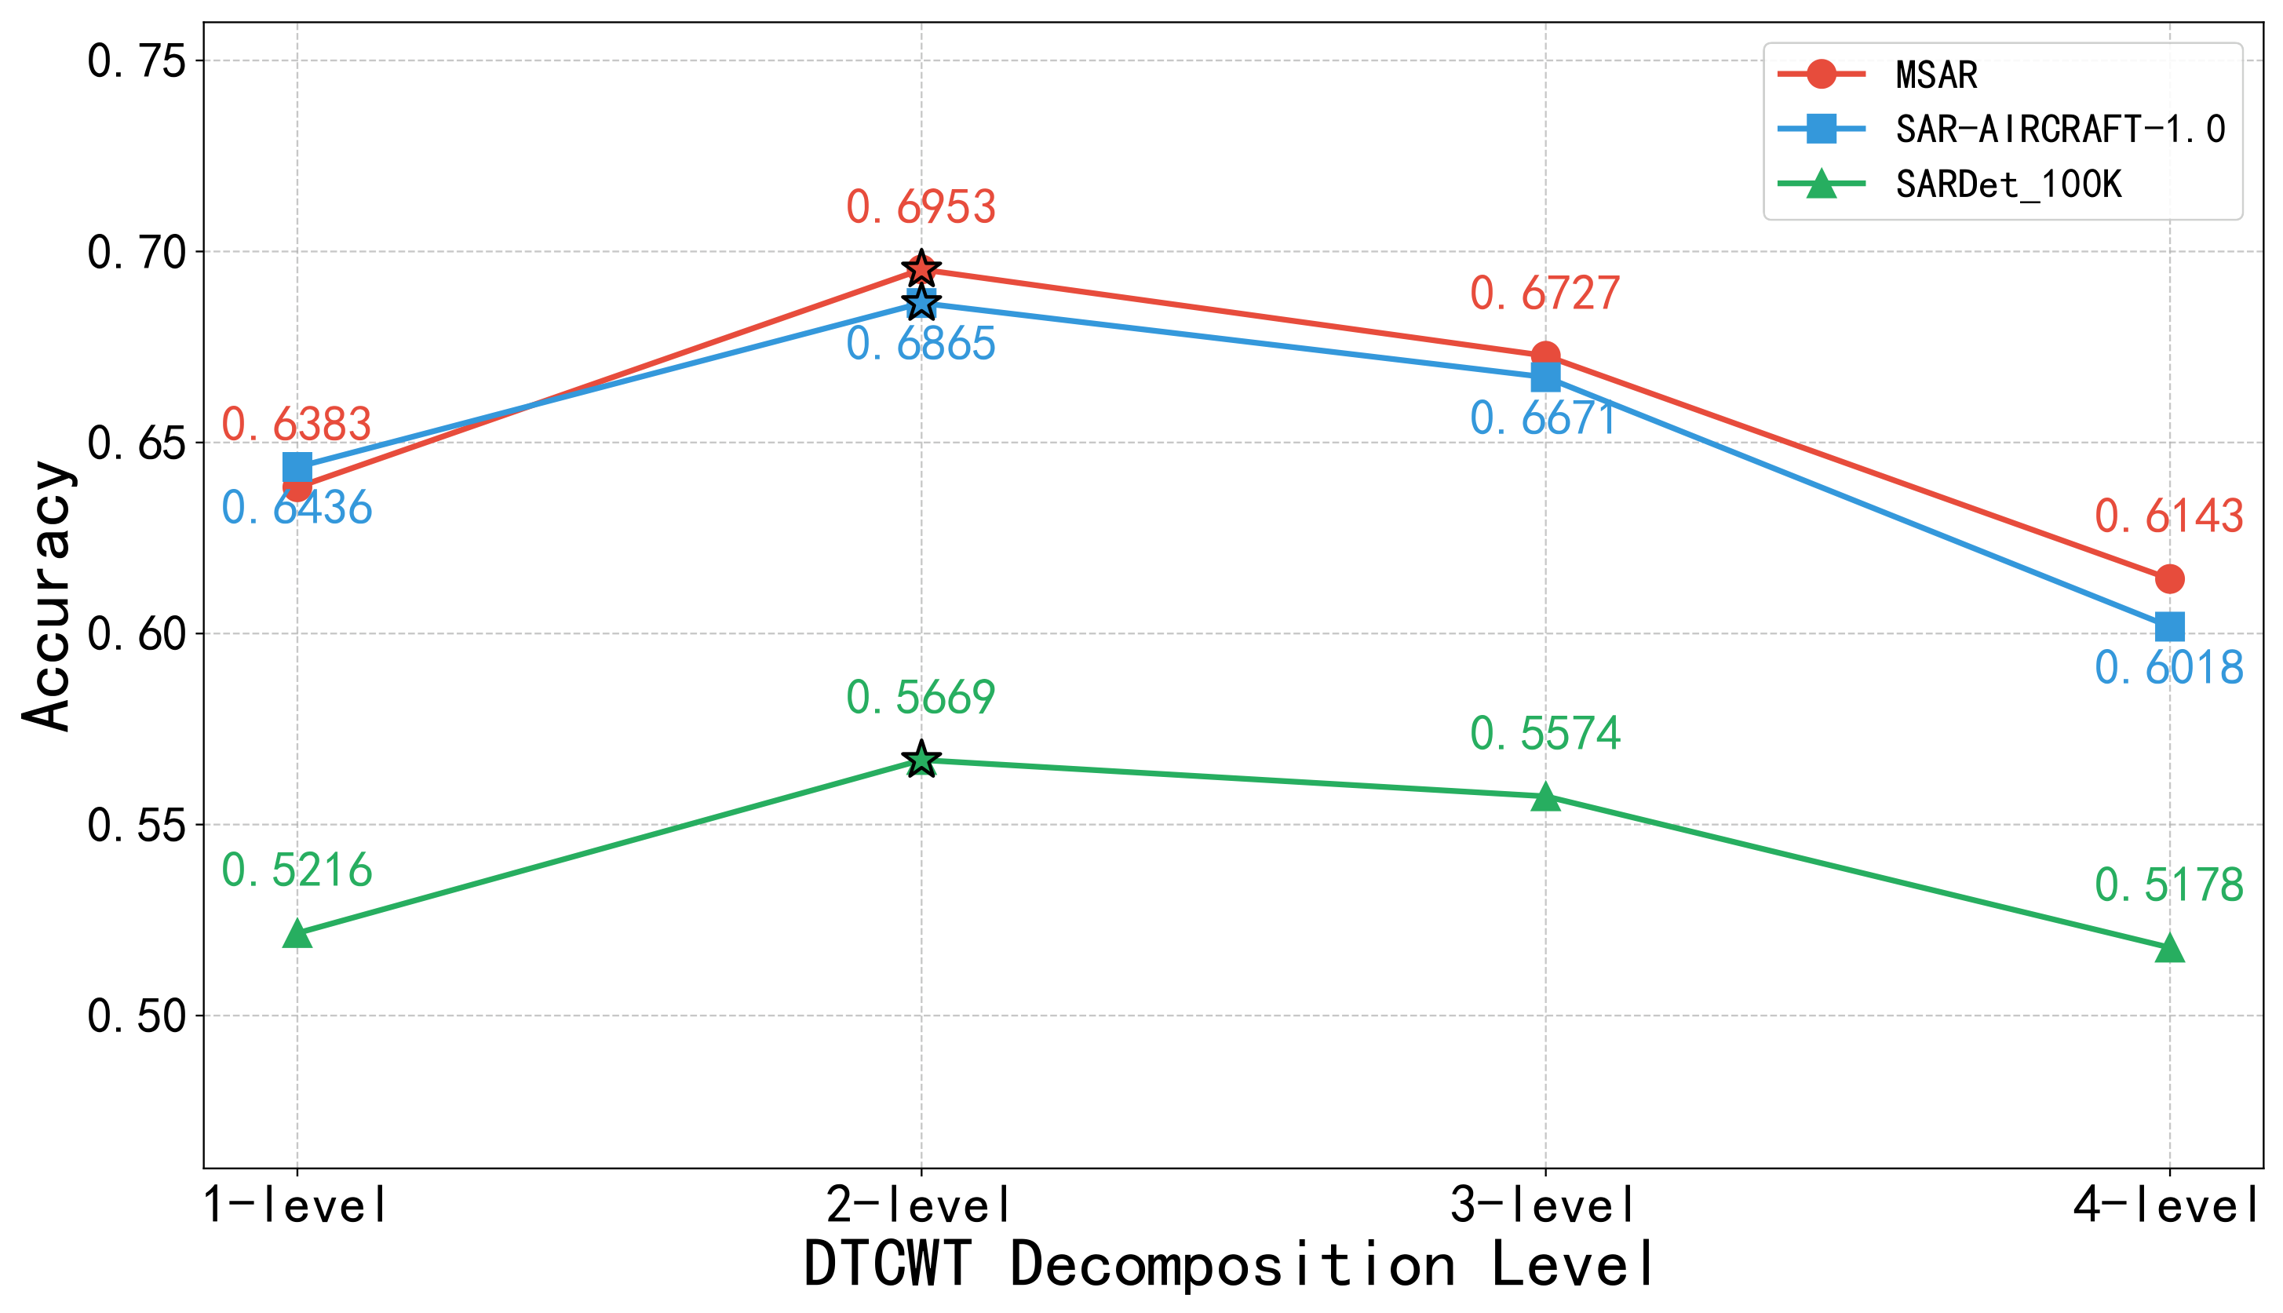
4.3.3. Sensitivity Analysis of Key Hyperparameters
4.3.4. Complexity Analysis
4.4. Visualization of Detection Results
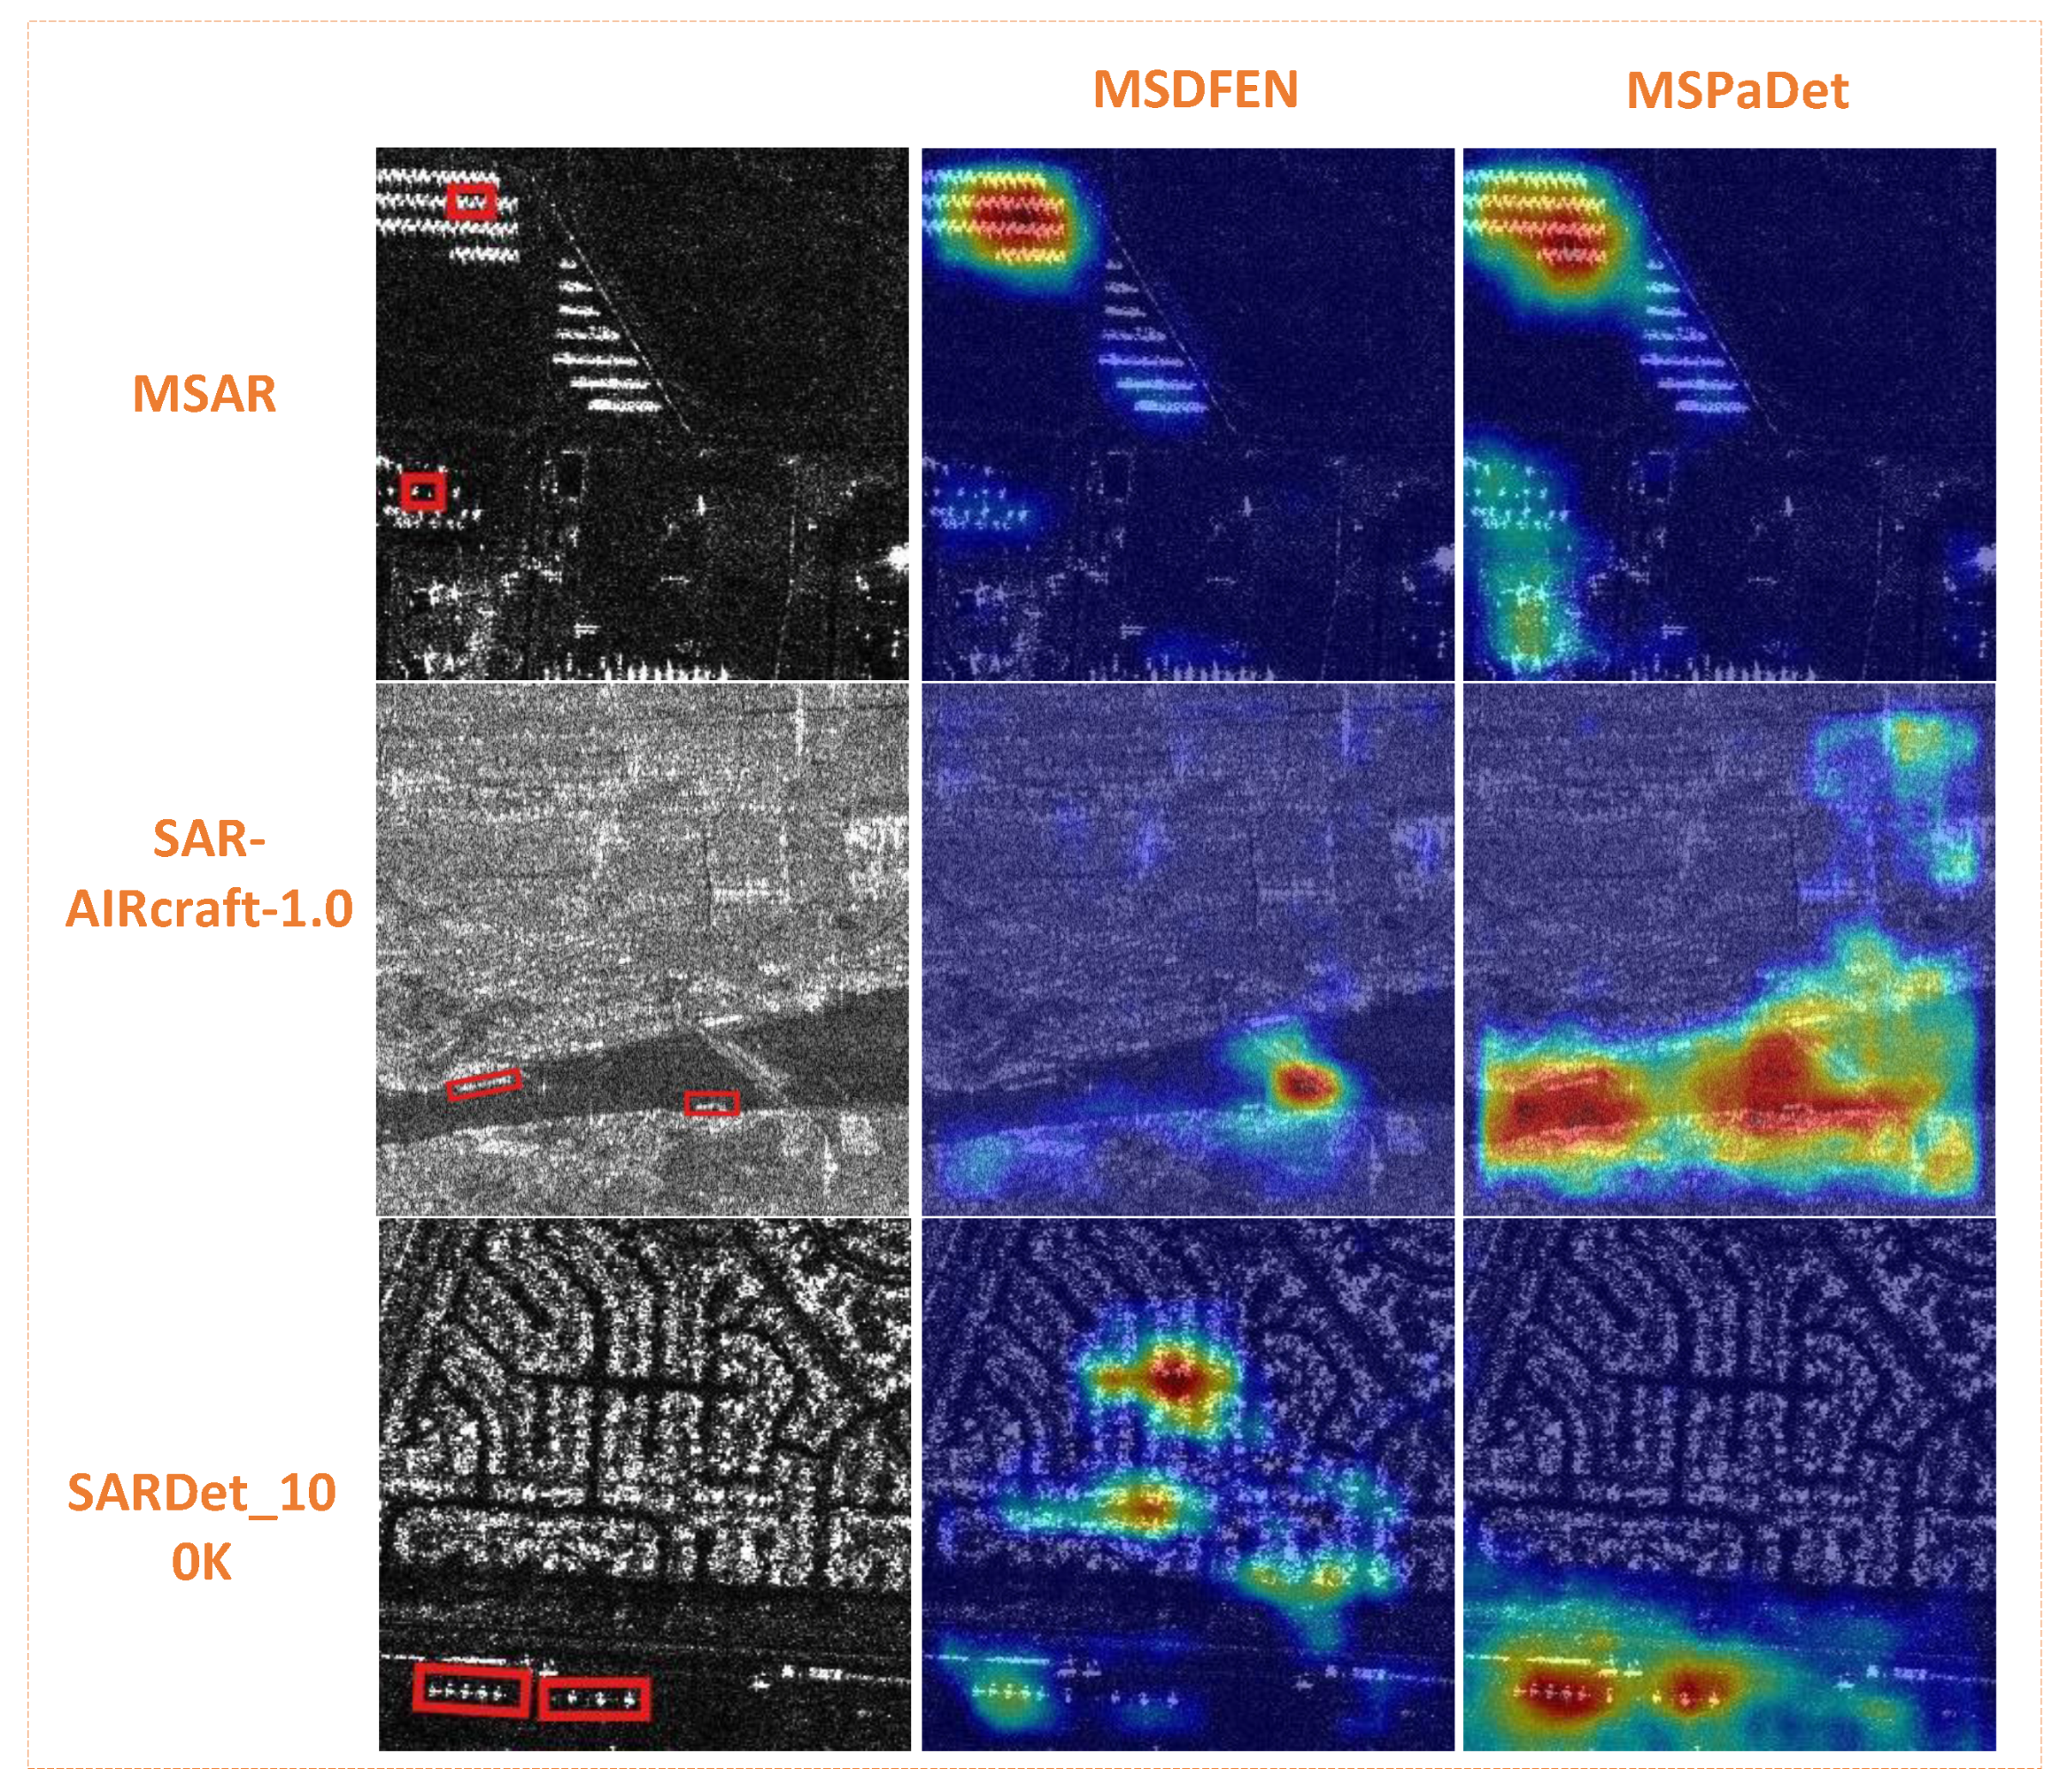
4.4.1. Small-Target Analysis and Feature Visualization
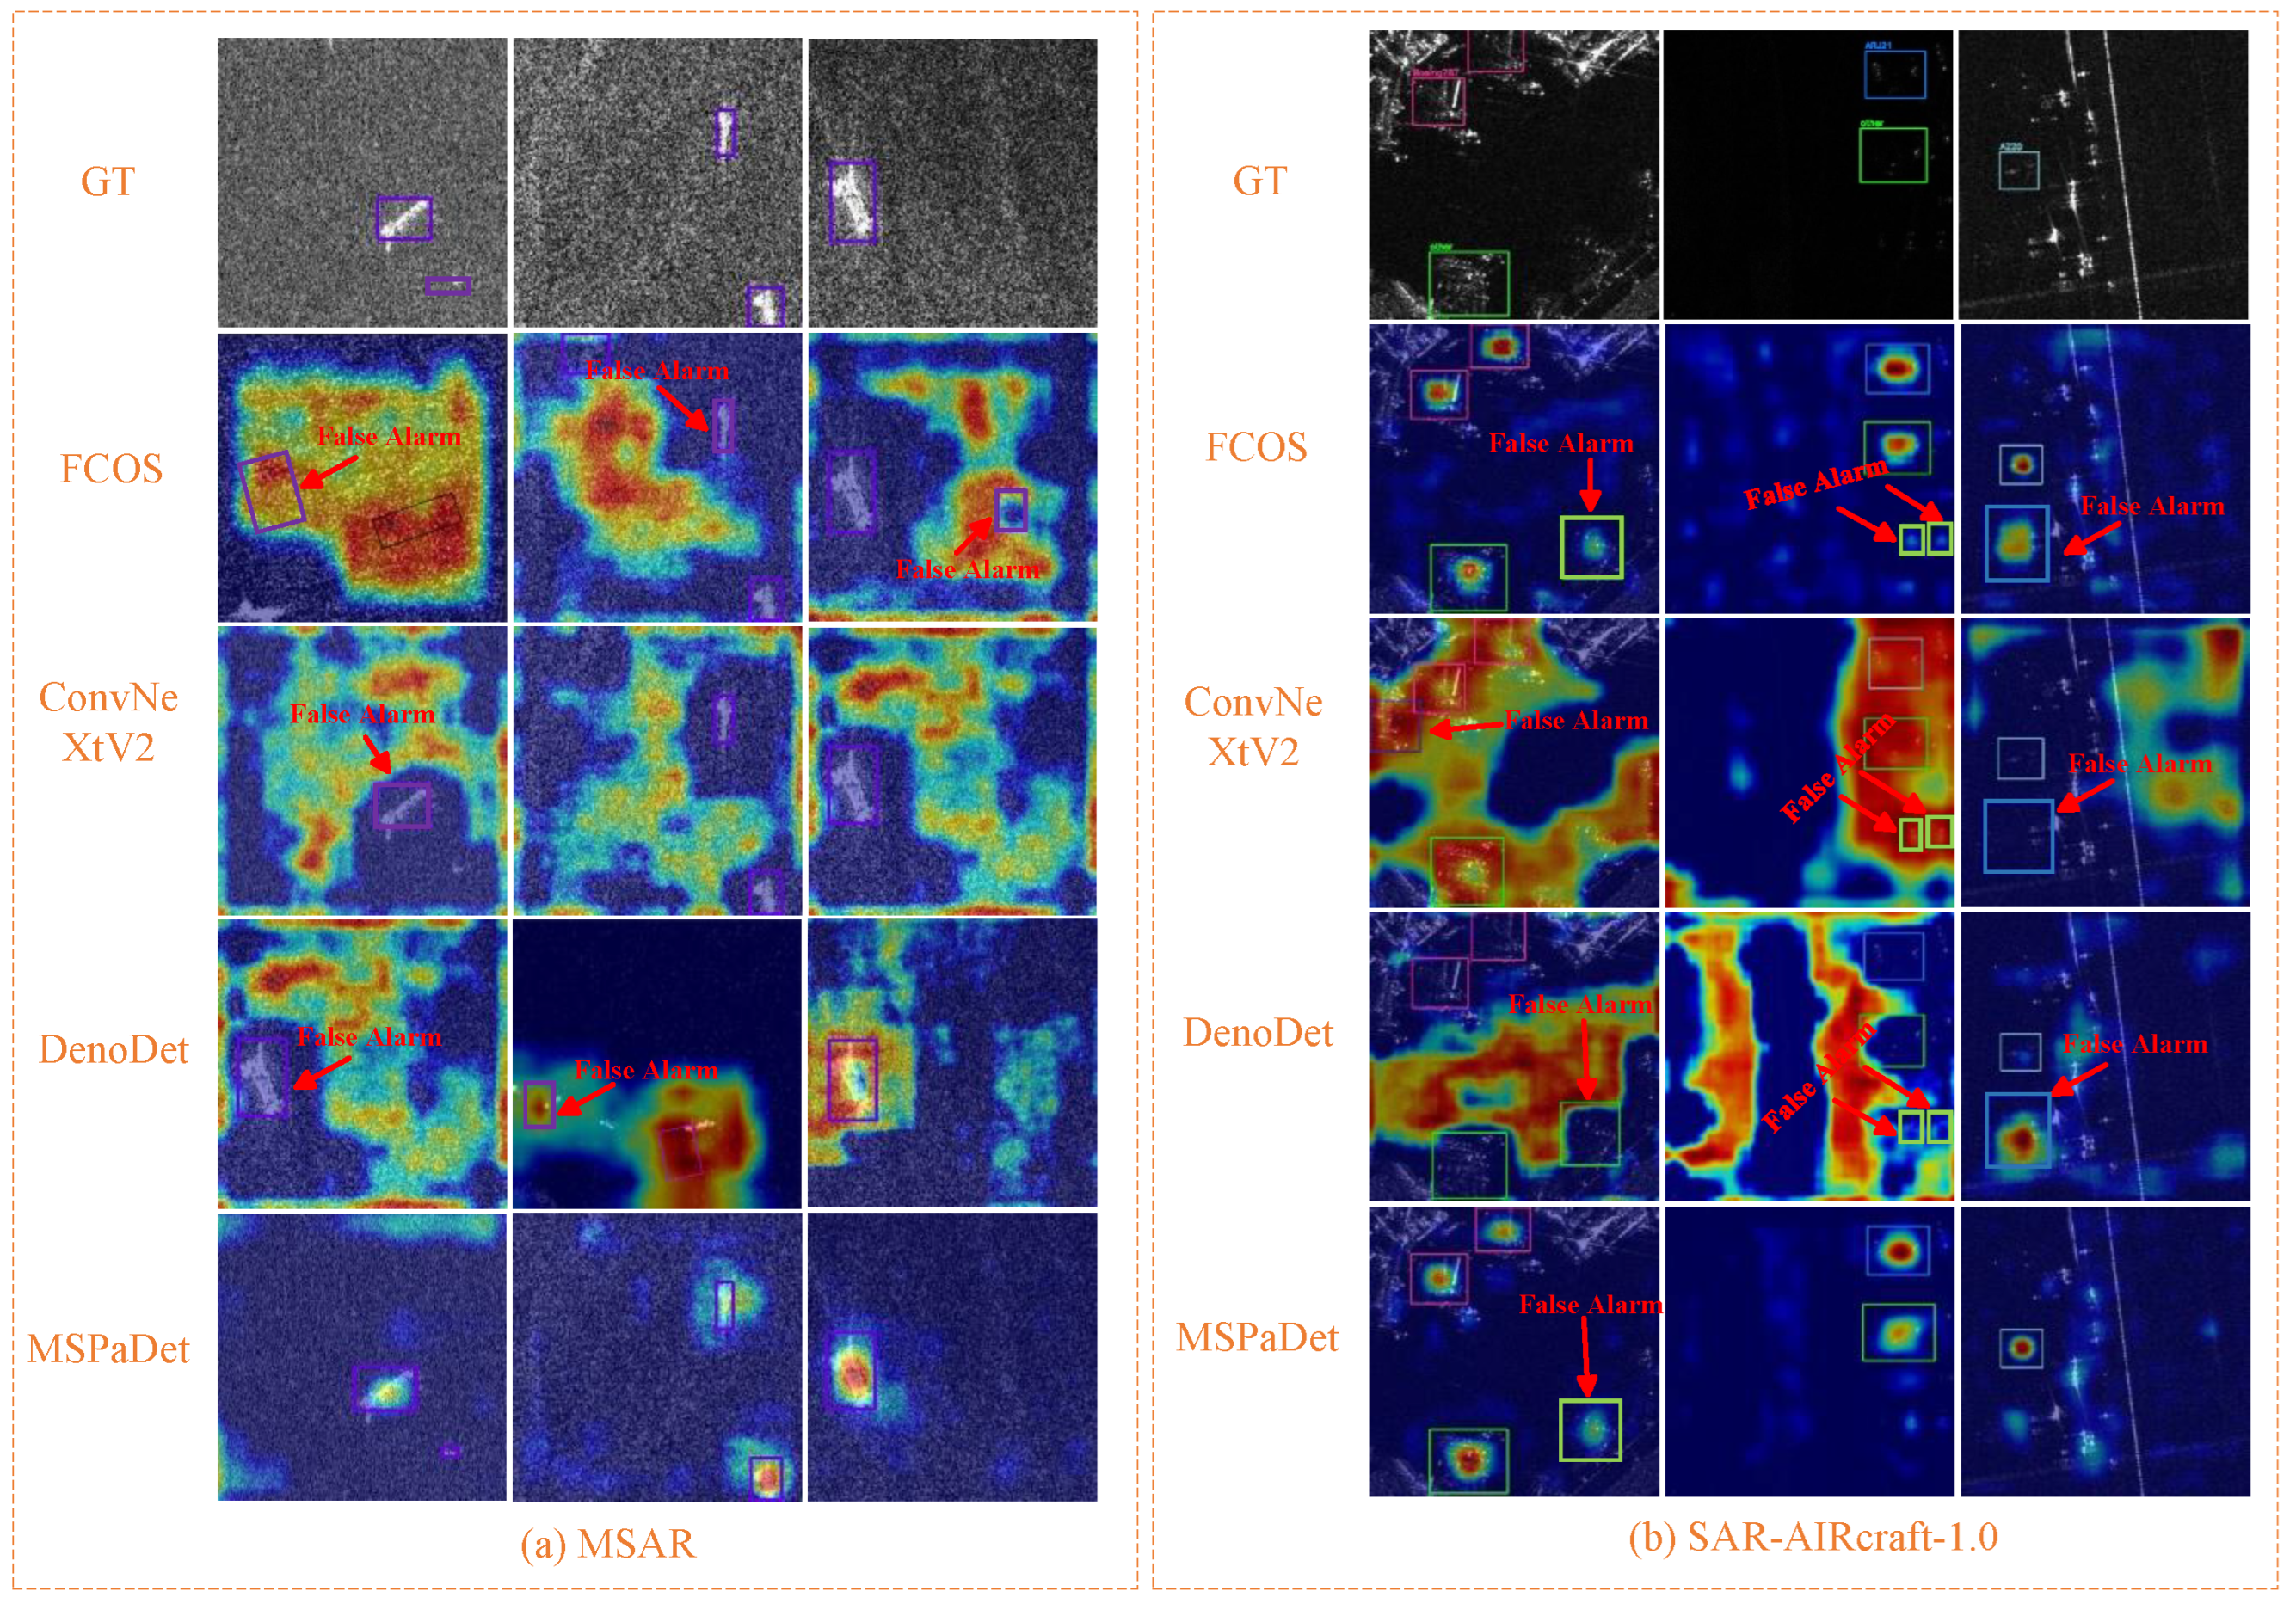
4.4.2. False Positive Cases
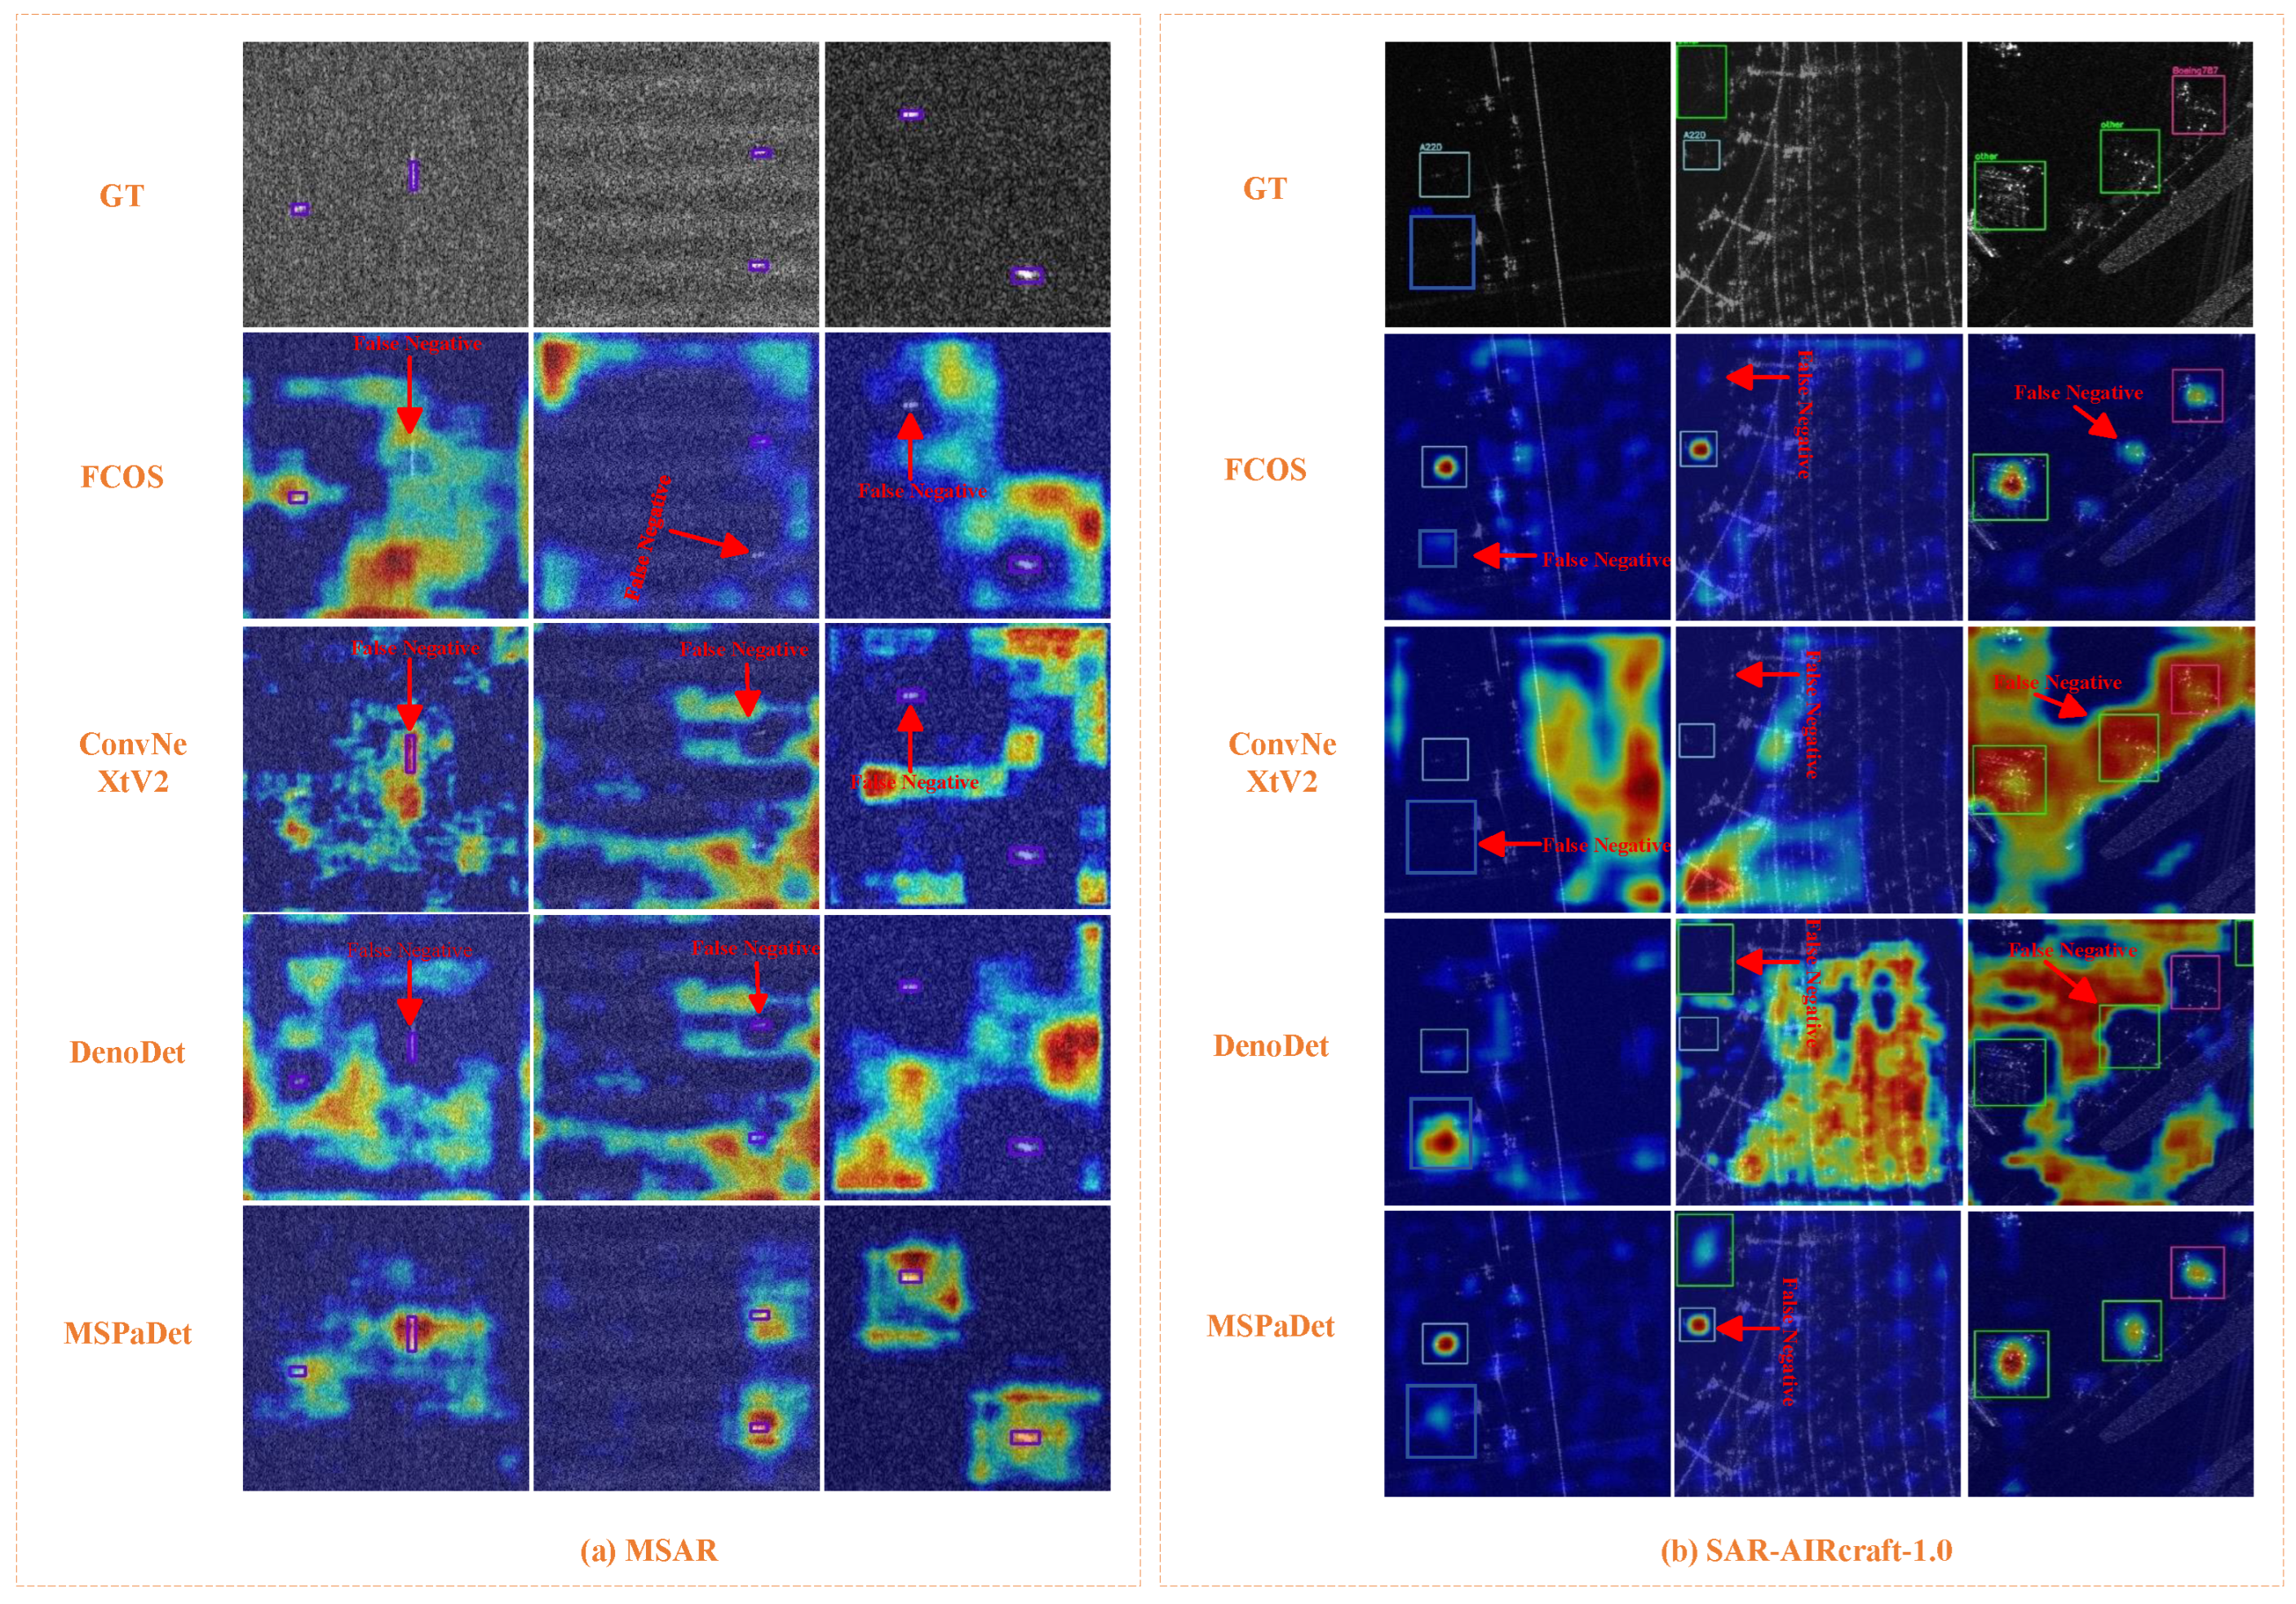
4.4.3. Miss Detection Cases
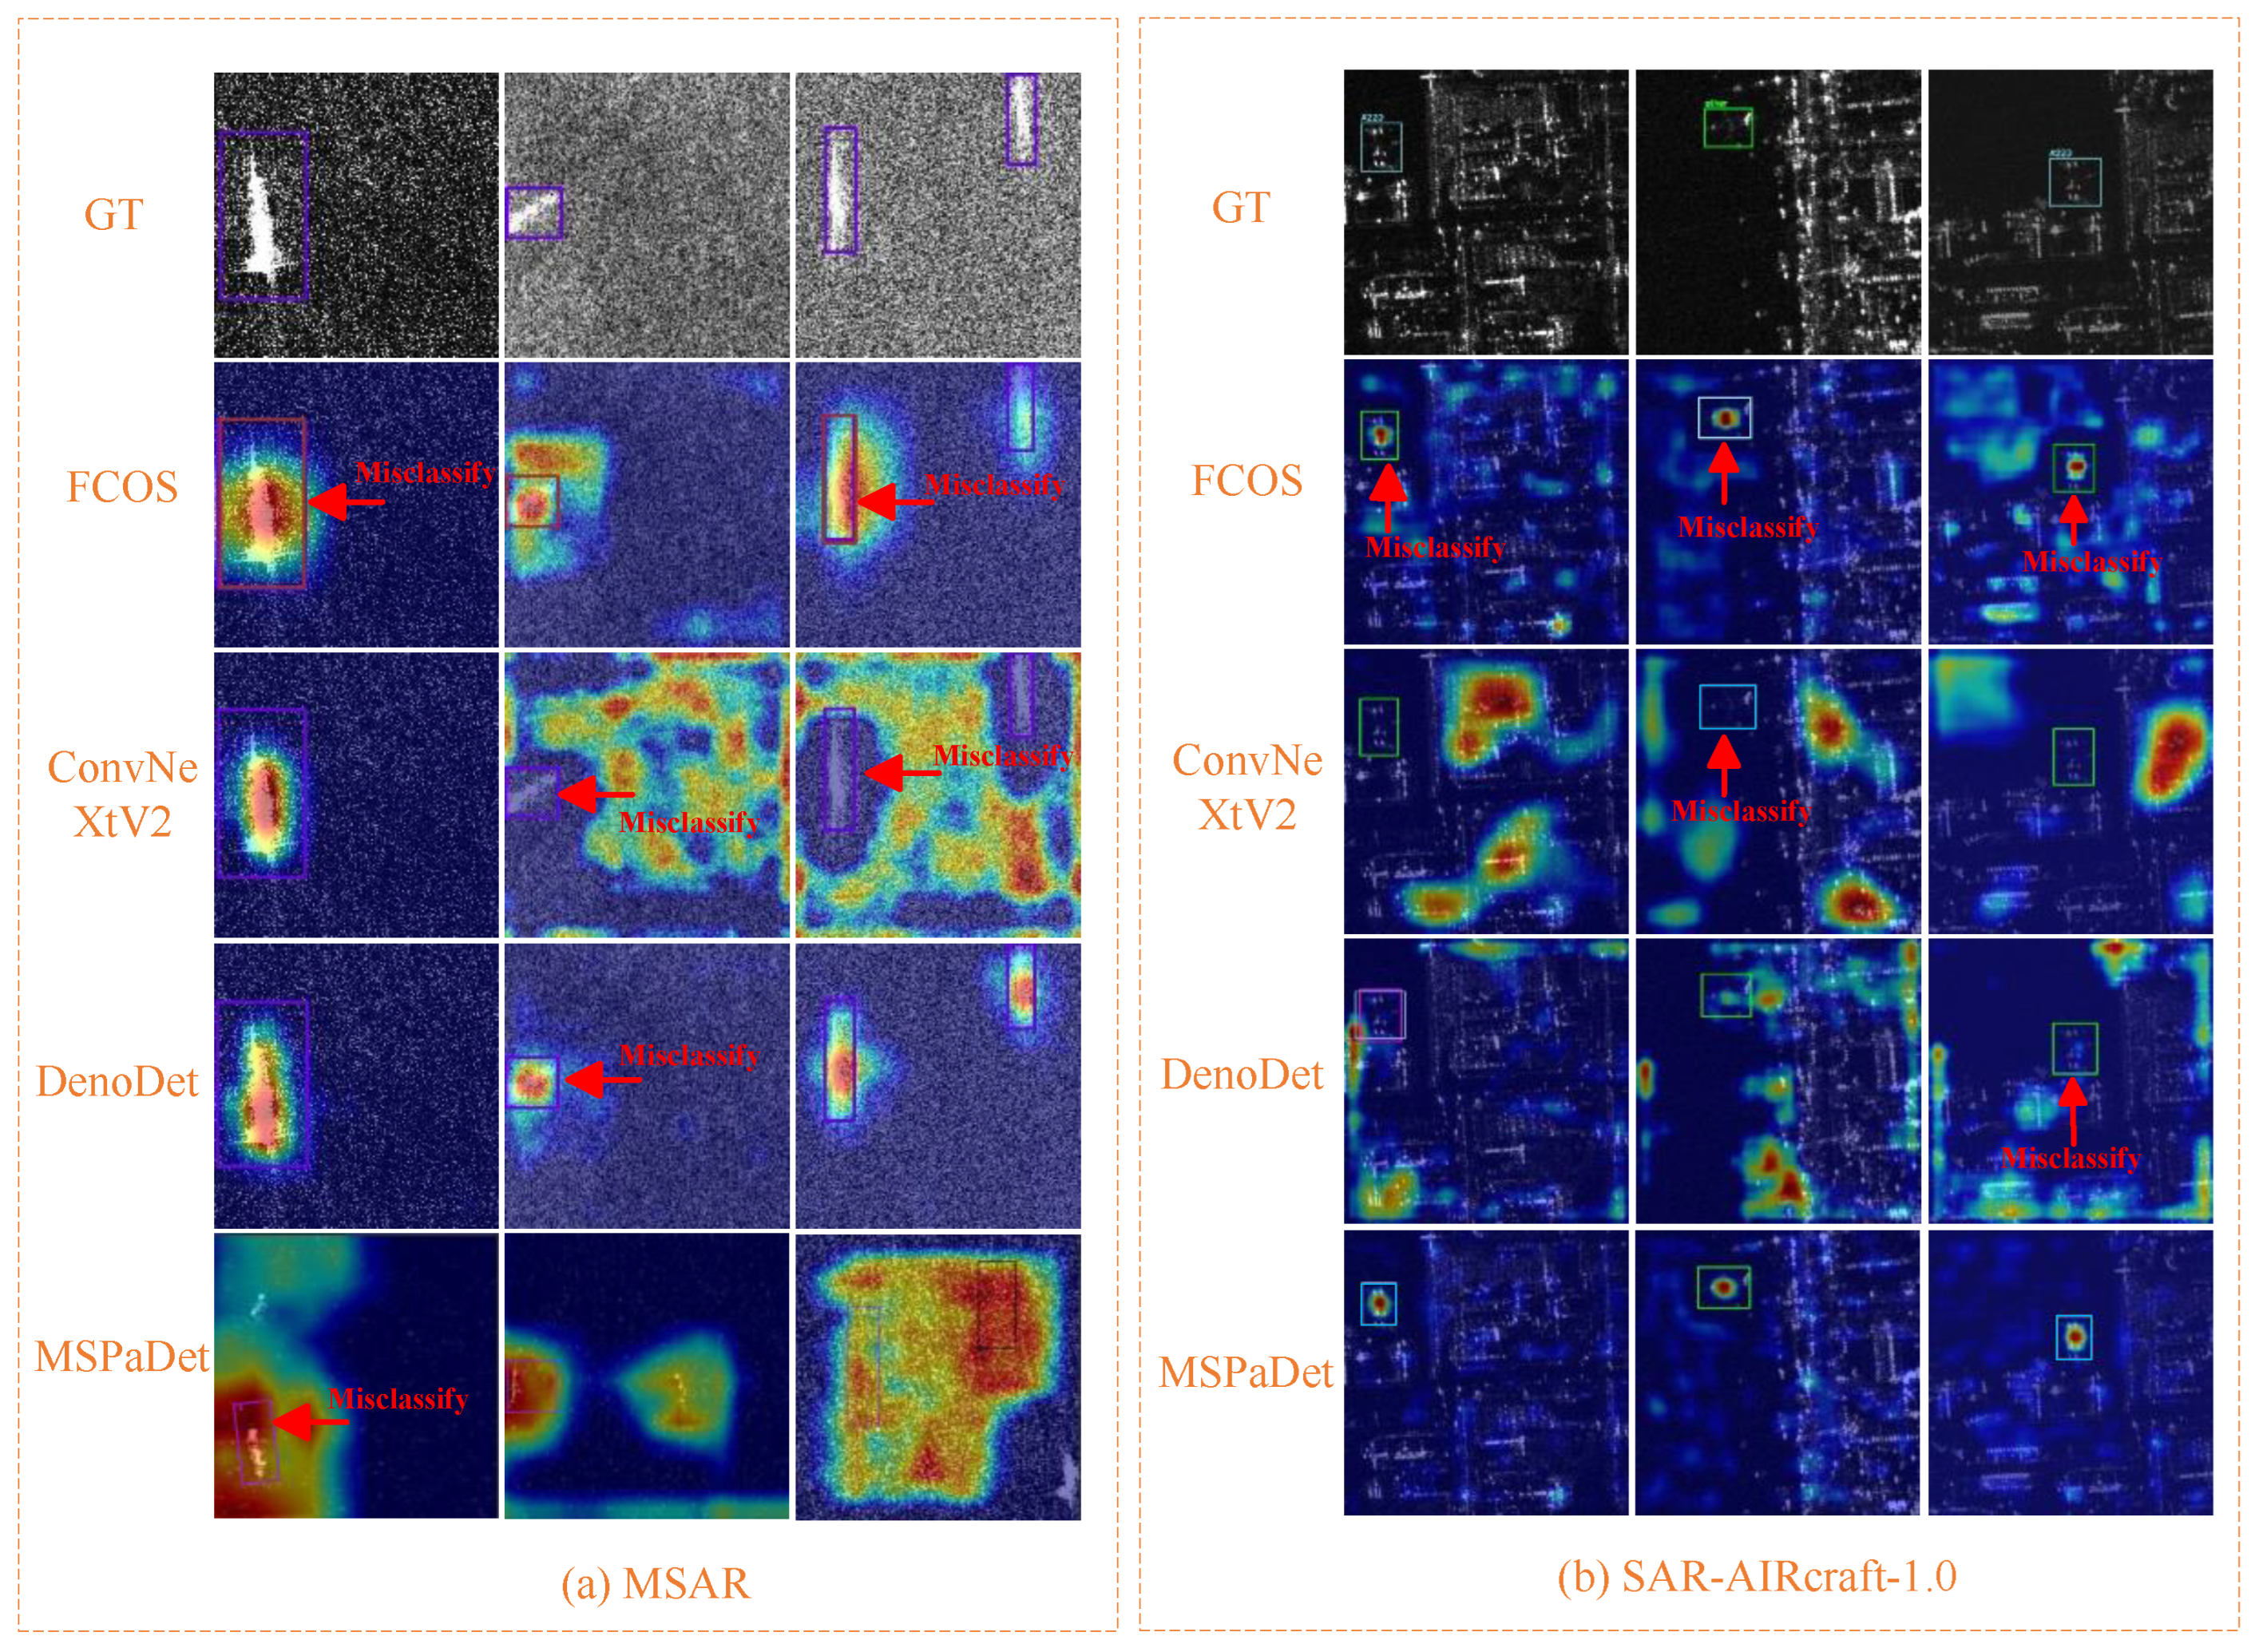
4.4.4. Misclassification
5. Discussion
6. Conclusions
Author Contributions
Funding
Data Availability Statement
Acknowledgments
Conflicts of Interest
References
- Tirandaz, Z.; Akbarizadeh, G.; Kaabi, H. PolSAR Image Segmentation Based on Feature Extraction and Data Compression Using Weighted Neighborhood Filter Bank and Hidden Markov Random Field–Expectation Maximization. Measurement 2020, 153, 107432. [Google Scholar] [CrossRef]
- Quan, S.; Zhang, T.; Xing, S.; Wang, X.; Yu, Q. Maritime Ship Detection with Concise Polarimetric Characterization Pattern. Int. J. Appl. Earth Obs. Geoinf. 2024, 131, 103954. [Google Scholar] [CrossRef]
- Chen, S.; Cui, X.; Wang, X.; Xiao, S. Speckle-Free SAR Image Ship Detection. IEEE Trans. Image Process. 2021, 30, 5969–5983. [Google Scholar] [CrossRef]
- Yasir, M.; Liu, S.; Xu, M.; Wan, J.; Sheng, H.; Nazir, S.; Zhang, X.; Isiacik Colak, A.T. YOLOv8-BYTE: Ship Tracking Algorithm Using Short-Time Sequence SAR Images for Disaster Response Leveraging GeoAI. Int. J. Appl. Earth Obs. Geoinf. 2024, 128, 103771. [Google Scholar] [CrossRef]
- Karwowska, K.; Slesinski, J.; Wierzbicki, D. Effectiveness of YOLO Variants for Small Object Detection in SAR Images Using a New Dataset. Sci. Rep. 2025, 15, 45405. [Google Scholar] [CrossRef]
- Liu, W.; Qin, J. Focus and Learn: Boosting Deep Multi-View Clustering via Hard Instance Awareness. Inf. Fusion 2026, 127, 103724. [Google Scholar] [CrossRef]
- Wu, B.; Liu, C.; Chen, J. A Review of Spaceborne High-Resolution Spotlight/Sliding Spotlight Mode SAR Imaging. Remote Sens. 2025, 17, 38. [Google Scholar] [CrossRef]
- Wang, Y.; Li, J.; Yang, J.; Sun, B. A Novel Spaceborne Sliding Spotlight Range Sweep Synthetic Aperture Radar: System and Imaging. Remote Sens. 2017, 9, 783. [Google Scholar] [CrossRef]
- Zhang, Z.; Yu, W.; Zheng, M.; Zhao, L.; Zhou, Z.X. Phase Mismatch Calibration for Dual-Channel Sliding Spotlight SAR-GMTI. Remote Sens. 2022, 14, 617. [Google Scholar] [CrossRef]
- Liu, T.; Yang, Z.; Marino, A.; Gao, G.; Yang, J. Robust CFAR Detector Based on Truncated Statistics for Polarimetric Synthetic Aperture Radar. IEEE Trans. Geosci. Remote Sens. 2020, 58, 6731–6747. [Google Scholar] [CrossRef]
- Zalpour, M.; Akbarizadeh, G.; AlaeiSheini, N. A New Approach for Oil Tank Detection Using Deep Learning Features with Control False Alarm Rate in High-Resolution Satellite Imagery. Int. J. Remote Sens. 2020, 41, 2239–2262. [Google Scholar] [CrossRef]
- Tang, G.; Zhao, H.; Claramunt, C.; Zhu, W.; Wang, S.; Wang, Y.; Ding, Y. PPA-Net: Pyramid Pooling Attention Network for Multi-Scale Ship Detection in SAR Images. IEEE Trans. Pattern Anal. Mach. Intelling 2023, 15, 2855. [Google Scholar] [CrossRef]
- Mao, Q.; Li, Y.; Zhu, Y. A Hierarchical Feature Fusion and Attention Network for Automatic Ship Detection from SAR Images. IEEE J. Sel. Top. Appl. Earth Obs. Remote Sens. 2024, 17, 13981–13994. [Google Scholar] [CrossRef]
- Wang, H.; Shi, J.; Karimian, H.; Liu, F.; Wang, F. YOLOSAR-Lite: A Lightweight Framework for Real-Time Ship Detection in SAR Imagery. Int. J. Digit. Earth 2024, 17, 2405525. [Google Scholar] [CrossRef]
- Li, Y.; Li, X.; Li, W.; Hou, Q.; Liu, L.; Cheng, M.; Yang, J. SARDet-100K: Towards Open-Source Benchmark and ToolKit for Large-Scale SAR Object Detection. In Proceedings of the Advances in Neural Information Processing Systems (NeurIPS), Vancouver, BC, Canada, 10–15 December 2024. [Google Scholar]
- Zhang, X.; Yang, X.; Li, Y.; Yang, J.; Cheng, M.; Li, X. RSAR: Restricted State Angle Resolver and Rotated SAR Benchmark. In Proceedings of the IEEE/CVF Conference on Computer Vision and Pattern Recognition (CVPR), Nashville, TN, USA, 10–17 June 2025. [Google Scholar]
- Du, Y.; Chen, Y.; Huang, L.; Yang, Y.; Ghamisi, P.; Du, Q. SUMMIT: A SAR Foundation Model with Multiple Auxiliary Tasks Enhanced Intrinsic Characteristics. Int. J. Appl. Earth Obs. Geoinf. 2025, 141, 104624. [Google Scholar] [CrossRef]
- Ma, W.; Yang, X.; Zhu, H.; Wang, X.; Yi, X.; Wu, Y.; Hou, B.; Jiao, L. NRENet: Neighborhood Removal-and-Emphasis Network for Ship Detection in SAR Images. Int. J. Appl. Earth Obs. Geoinf. 2024, 131, 103927. [Google Scholar] [CrossRef]
- Zhang, T.; Zhang, X.; Ke, X.; Zhan, X.; Shi, J.; Wei, S.; Pan, D.; Li, J.; Su, H.; Zhou, Y.; et al. LS-SSDD-v1.0: A Deep Learning Dataset Dedicated to Small Ship Detection from Large-Scale Sentinel-1 SAR Images. Remote Sens. 2020, 12, 2997. [Google Scholar] [CrossRef]
- Ke, X.; Zhang, T.; Shao, Z. Scale-aware dimension-wise attention network for small ship instance segmentation in synthetic aperture radar images. J. Appl. Remote Sens. 2023, 17, 046504. [Google Scholar] [CrossRef]
- Lee, J.S. Speckle Analysis and Smoothing of Synthetic Aperture Radar Images. Comput. Graph. Image Process. 1981, 17, 24–32. [Google Scholar] [CrossRef]
- Parrilli, S.; Poderico, M.; Angelino, C.V.; Verdoliva, L. A Nonlocal SAR Image Denoising Algorithm Based on LLMMSE Wavelet Shrinkage. IEEE Trans. Geosci. Remote Sens. 2012, 50, 606–616. [Google Scholar] [CrossRef]
- Argenti, F.; Lapini, A.; Bianchi, T.; Alparone, L. A Tutorial on Speckle Reduction in Synthetic Aperture Radar Images. IEEE Geosci. Remote Sens. Mag. 2013, 1, 6–35. [Google Scholar] [CrossRef]
- Li, J.; Yu, Z.; Yu, L.; Cheng, P.; Chen, J.; Chi, C. A Comprehensive Survey on SAR ATR in Deep-Learning Era. Remote Sens. 2023, 15, 1454. [Google Scholar] [CrossRef]
- Zhou, Z.; Cui, Z.; Tang, K.; Tian, Y.; Pi, Y.; Cao, Z. Gaussian Meta-Feature Balanced Aggregation for Few-Shot Synthetic Aperture Radar Target Detection. ISPRS J. Photogramm. Remote Sens. 2024, 208, 89–106. [Google Scholar] [CrossRef]
- Ying, L.; Miao, D.; Zhang, Z. A Robust One-Stage Detector for SAR Ship Detection with Sequential Three-Way Decisions and Multi-Granularity. Inf. Sci. 2024, 667, 120436. [Google Scholar] [CrossRef]
- Shen, Y.F.; Gao, Q. DS-YOLO: A SAR Ship Detection Model for Dense Small Targets. Radioengineering 2025, 34, 407–421. [Google Scholar] [CrossRef]
- Xu, X.; Zhang, X.; Zhang, T. Lite-YOLOv5: A Lightweight Deep Learning Detector for On-Board Ship Detection in Large-Scene Sentinel-1 SAR Images. Remote Sens. 2022, 14, 1018. [Google Scholar] [CrossRef]
- Yasir, M.; Liu, S.; Pirasteh, S.; Xu, M.; Sheng, H.; Wan, J.; de Figueiredo, F.A.P.; Aguilar, F.J.; Li, J. YOLOShipTracker: Tracking Ships in SAR Images Using Lightweight YOLOv8. Int. J. Appl. Earth Obs. Geoinf. 2024, 134, 104137. [Google Scholar] [CrossRef]
- Dong, J.; Feng, J.; Tang, X. OptiSAR-Net: A Cross-Domain Ship Detection Method for Multisource Remote Sensing Data. IEEE Trans. Geosci. Remote Sens. 2024, 62, 4709311. [Google Scholar] [CrossRef]
- Xu, W.; Guo, Z.; Huang, P.; Tan, W.; Gao, Z. Towards Efficient SAR Ship Detection: Multi-Level Feature Fusion and Lightweight Network Design. Remote Sens. 2025, 17, 2588. [Google Scholar] [CrossRef]
- He, S. Multiscale Task-Decoupled Oriented SAR Ship Detection Based on a Size-Aware Balanced Strategy. Remote Sens. 2025, 17, 2257. [Google Scholar] [CrossRef]
- Wu, B.; Liu, C.; Chen, Z.; Zhang, S.; Chen, J. A Novel Star Feature Decoupling Network for Multiscale SAR Image Ship Detection. IEEE J. Sel. Top. Appl. Earth Obs. Remote Sens. 2026. [Google Scholar] [CrossRef]
- Sun, Z.; Leng, X.; Zhang, X.; Zhou, Z.; Xiong, B.; Ji, K.; Kuang, G. Arbitrary-Direction SAR Ship Detection Method for Multiscale Imbalance. IEEE Trans. Geosci. Remote Sens. 2025, 63, 5208921. [Google Scholar] [CrossRef]
- Chen, B.; Xue, F.; Song, H. Lightweight Transformer Detector for SAR Ship Detection. IEEE Trans. Pattern Anal. Mach. Intelling 2024, 16, 237. [Google Scholar] [CrossRef]
- Zhang, Y.; Chi, J.; Yang, G.; Chen, C.; Yu, T. SAR-NanoShipNet: A Scale-Adaptive Network for Robust Small Ship Detection in SAR Imagery. ISPRS J. Photogramm. Remote Sens. 2026, 232, 262–279. [Google Scholar] [CrossRef]
- Zhao, S.; Luo, Y.; Zhang, T.; Guo, W.; Zhang, Z. A Domain Specific Knowledge Extraction Transformer Method for Multisource Satellite-Borne SAR Images Ship Detection. ISPRS J. Photogramm. Remote Sens. 2023, 198, 16–29. [Google Scholar] [CrossRef]
- Yang, Y.; Chen, J.; Sun, L.; Zhou, Z.; Huang, Z.; Wu, B. Unsupervised Domain-Adaptive SAR Ship Detection Based on Cross-Domain Feature Interaction and Data Contribution Balance. Remote Sens. 2024, 16, 420. [Google Scholar] [CrossRef]
- Li, D.; Liang, Q.; Liu, H.; Liu, Q.; Liu, H.; Liao, G. A Novel Multidimensional Domain Deep Learning Network for SAR Ship Detection. IEEE Trans. Geosci. Remote Sens. 2022, 60, 5203213. [Google Scholar] [CrossRef]
- Ding, X.; Zhang, X.; Han, J.; Ding, G. Scaling up Your Kernels to 31 × 31: Revisiting Large Kernel Design in CNNs. In Proceedings of the IEEE/CVF Conference on Computer Vision and Pattern Recognition (CVPR), New Orleans, LA, USA, 18–24 June 2022; IEEE: New York, NY, USA, 2022; pp. 11963–11975. [Google Scholar] [CrossRef]
- Wang, W.; Dai, J.; Chen, Z.; Huang, Z.; Li, Z.; Zhu, X.; Hu, X.; Lu, T.; Lu, L.; Li, H.; et al. InternImage: Exploring Large-Scale Vision Foundation Models with Deformable Convolutions. In Proceedings of the 2022 IEEE/CVF Conference on Computer Vision and Pattern Recognition (CVPR), New Orleans, LA, USA, 18–24 June 2022; IEEE: New York, NY, USA, 2022; pp. 14408–14419. [Google Scholar]
- Zhang, X.; Liu, C.; Yang, D.; Song, T.; Ye, Y.; Li, K.; Song, Y. RFAConv: Innovating Spatial Attention and Standard Convolutional Operation. arXiv 2024, arXiv:2304.03198. [Google Scholar] [CrossRef]
- Cui, Y.; Tao, Y.; Bing, Z.; Ren, W.; Gao, X.; Cao, X.; Huang, K.; Knoll, A. Selective Frequency Network for Image Restoration. In Proceedings of the Eleventh International Conference on Learning Representations (ICLR), Kigali, Rwanda, 1–5 May 2023. [Google Scholar]
- Pham, C.; Nguyen, V.; Le, T.; Phung, D.; Carneiro, G.; Do, T. Frequency Attention for Knowledge Distillation. In Proceedings of the IEEE/CVF Winter Conference on Applications of Computer Vision (WACV), Waikoloa, HI, USA, 3–8 January 2024; IEEE: New York, NY, USA, 2024; pp. 2277–2286. [Google Scholar] [CrossRef]
- Chen, J.; Duanmu, C.; Long, H. Large Kernel Frequency-Enhanced Network for Efficient Single Image Super-Resolution. In Proceedings of the IEEE/CVF Conference on Computer Vision and Pattern Recognition Workshops (CVPRW), Seattle, WA, USA, 17–18 June 2024; IEEE: New York, NY, USA, 2024; pp. 6317–6326. [Google Scholar] [CrossRef]
- Ni, K.; Wang, P.; Zheng, Z.; Zhong, Y. Complex-valued mix transformer for SAR ship detection. ISPRS J. Photogramm. Remote Sens. 2026, 231, 1–16. [Google Scholar] [CrossRef]
- Tian, Z.; Wu, Q.; Xu, J.; Zhong, Y. FCOS: Fully Convolutional One-Stage Object Detection. In Proceedings of the IEEE/CVF International Conference on Computer Vision (ICCV), Seoul, Republic of Korea, 27 October–2 November 2019; IEEE: New York, NY, USA, 2019; pp. 9627–9636. [Google Scholar] [CrossRef]
- Li, X.; Wang, W.; Wu, L.; Chen, S.; Hu, X.; Li, J.; Tang, J.; Yang, J. Generalized Focal Loss: Learning Qualified and Distributed Bounding Boxes for Dense Object Detection. In Proceedings of the 34 International Conference on Neural Information Processing Systems (NeurIPS), Vancouver, BC, Canada, 6–12 December 2020. [Google Scholar]
- Yang, Z.; Liu, S.; Hu, H.; Wang, L.; Lin, S. RepPoints: Point Set Representation for Object Detection. In Proceedings of the IEEE/CVF International Conference on Computer Vision (ICCV), Seoul, Republic of Korea, 27 October –2 November 2019; IEEE: New York, NY, USA, 2019; pp. 9657–9666. [Google Scholar] [CrossRef]
- Zhou, X.; Wang, D.; Krähenbühl, P. Objects as Points. arXiv 2019, arXiv:1904.07850. [Google Scholar] [CrossRef]
- Wang, W.; Chen, K.; Kim, P.; Yoon, K.; Liu, Z.; Joo, K.; Liu, Y.-H. Pyramid Vision Transformer: A Versatile Backbone for Dense Prediction Without Convolution. In Proceedings of the IEEE/CVF International Conference on Computer Vision (ICCV), Montreal, QC, Canada, 10–17 October 2021; IEEE: New York, NY, USA, 2021; pp. 568–578. [Google Scholar] [CrossRef]
- Lin, T.-Y.; Goyal, P.; Girshick, R.; He, K.; Dollár, P. Focal Loss for Dense Object Detection. In Proceedings of the IEEE/CVF International Conference on Computer Vision (ICCV), Venice, Italy, 22–29 October 2017; IEEE: New York, NY, USA, 2017; pp. 2980–2988. [Google Scholar]
- Feng, C.; Zhong, Y.; Gao, Y.; Scott, M.R.; Huang, W. TOOD: Task-Aligned One-Stage Object Detection. In Proceedings of the IEEE/CVF International Conference on Computer Vision (ICCV), Montreal, QC, Canada, 10–17 October 2021; IEEE: New York, NY, USA, 2021; pp. 3490–3499. [Google Scholar] [CrossRef]
- Chen, Z.; Yang, C.; Li, Q.; Zhao, F.; Zha, Z.; Wu, F. Dicentang: Your Dense Object Detector. In Proceedings of the 29th ACM International Conference on Multimedia (ACM MM), Virtual Event, China, 20–24 October 2021; Association for Computing Machinery: New York, NY, USA, 2021; pp. 4939–4948. [Google Scholar]
- Chen, Q.; Wang, Y.; Yang, T.; Zhang, X.; Cheng, J.; Sun, J. You Only Look One-Level Feature. In Proceedings of the IEEE/CVF Conference on Computer Vision and Pattern Recognition (CVPR), Nashville, TN, USA, 20–25 June 2021; IEEE: New York, NY, USA, 2021; pp. 13039–13048. [Google Scholar] [CrossRef]
- Ge, Z.; Liu, S.; Wang, F.; Li, Z.; Sun, J. YOLOX: Exceeding YOLO Series in 2021. arXiv 2021, arXiv:2107.08430. [Google Scholar] [CrossRef]
- Zhang, M.; Zhu, Y.; Li, L.; Guo, J.; Liu, Z.; Li, Y. S4Det: Breadth and Accurate Sine Single-Stage Ship Detection for Remote Sense SAR Imagery. Remote Sens. 2025, 17, 900. [Google Scholar] [CrossRef]
- Liu, Z.; Mao, H.; Wu, C.; Feichtenhofer, C.; Darrell, T.; Xie, S. A ConvNet for the 2020s. In Proceedings of the IEEE/CVF Conference on Computer Vision and Pattern Recognition (CVPR), New Orleans, LA, USA, 18–24 June 2022; IEEE: New York, NY, USA, 2022; pp. 11976–11986. [Google Scholar]
- Woo, S.; Debnath, S.; Hu, R.; Chen, X.; Liu, Z.; Kweon, I.S.; Xie, S. ConvNeXt V2: Co-Designing and Scaling ConvNets with Masked Autoencoders. In Proceedings of the IEEE/CVF Conference on Computer Vision and Pattern Recognition (CVPR), Vancouver, BC, Canada, 17–24 June 2023; IEEE: New York, NY, USA, 2023; pp. 16133–16142. [Google Scholar]
- Carion, N.; Massa, F.; Synnaeve, G.; Usunier, N.; Kirillov, A.; Zagoruyko, S. End-to-End Object Detection with Transformers. In Proceedings of the European Conference on Computer Vision (ECCV), Glasgow, UK, 23–28 August 2020; Springer: Cham, Switzerland, 2020; pp. 213–229. [Google Scholar] [CrossRef]
- Zhang, M.; Li, Y.; Guo, J.; Li, Y.; Gao, X. BurgsVO: Burgs-Associated Vertex Offset Encoding Scheme for Detecting Rotated Ships in SAR Images. Remote Sens. 2025, 17, 388. [Google Scholar] [CrossRef]
- Liu, S.; Li, F.; Zhang, H.; Yang, X.; Qi, X.; Su, H.; Zhu, J.; Zhang, L. DAB-DETR: Dynamic Anchor Boxes are Better Queries for DETR. In Proceedings of the International Conference on Learning Representations, Online, 25–29 April 2022. [Google Scholar]
- Meng, D.; Chen, X.; Fan, Z.; Zeng, G.; Li, H.; Yuan, Y.; Sun, L.; Wang, J. Conditional DETR for Fast Training Convergence. In Proceedings of the IEEE/CVF International Conference on Computer Vision, Montreal, QC, Canada, 10–17 October 2021; IEEE: New York, NY, USA, 2021; pp. 3651–3660. [Google Scholar] [CrossRef]
- Zhou, J.; Xiao, C.; Peng, B.; Liu, Z.; Liu, L.; Liu, Y.; Li, X. DiffDet4SAR: Diffusion-Based Aircraft Target Detection Network for SAR Images. IEEE Geosci. Remote Sens. Lett. 2024, 21, 4007905. [Google Scholar] [CrossRef]
- Wang, T.; Zeng, Z.; Zhou, S.; Xu, Q. A Multi-Scale Discrete Feature Enhancement Network with Augmented Reversible Transformation for SAR Automatic Target Recognition. IEEE J. Sel. Top. Appl. Earth Obs. Remote Sens. 2025, 18, 5135–5156. [Google Scholar] [CrossRef]
- Dai, Y.; Zou, M.; Li, Y.; Li, X.; Ni, K.; Yang, J. DenoDet: Attention as Deformable Multi-Subspace Feature Denoising for Target Detection in SAR Images. arXiv 2024, arXiv:2406.02833. [Google Scholar] [CrossRef]
- Zhang, M.; Yang, Z.; Guo, J.; Li, Y. PDE-Guided Diverse Feature Learning for SAR Rotated Ship Detection. Remote Sens. 2025, 17, 2998. [Google Scholar] [CrossRef]
- Zhang, S.; Chi, C.; Yao, Y.; Lei, Z.; Li, S.Z. Bridging the Gap Between Anchor-Based and Anchor-Free Detection via Adaptive Training Sample Selection. In Proceedings of the IEEE/CVF Conference on Computer Vision and Pattern Recognition, Seattle, WA, USA, 13-19 June 2020; IEEE: New York, NY, USA, 2020; pp. 9759–9768. [Google Scholar] [CrossRef]







| Dataset | Resolution | Band | Polarization | Satellites/Sensors |
|---|---|---|---|---|
| MSAR | ≤1 m | C | HH/HV/VH/VV | HISEA-1 |
| SAR-Aircraft-1.0 | 1 m | C | Single | GF-3 |
| SARDet-100K | 0.1–25 m | C/Ka/Ku/X | HH/HV/VH/VV/Single | Airborne SAR; GF-3; |
| HISEA-1; RadarSat-2; | ||||
| S-1; TerraSAR-X; | ||||
| PALSAR-2 |
| Method | Pre. | #P↓ | FLOPs↓ | AP’07 | AP’12 | ||||||||
|---|---|---|---|---|---|---|---|---|---|---|---|---|---|
| mAP | Ship | Air | Brg | Oil | mAP | Ship | Air | Brg | Oil | ||||
| One-stage | |||||||||||||
| FCOS [47] | IN | 32.12 M | 12.89 G | 66.22 | 87.87 | 42.42 | 72.62 | 61.98 | 68.55 | 88.56 | 43.33 | 75.34 | 66.97 |
| GFL [48] | IN | 32.27 M | 13.08 G | 65.94 | 87.91 | 40.86 | 72.75 | 62.24 | 67.61 | 88.96 | 39.84 | 75.67 | 65.98 |
| RepPoints [49] | IN | 36.82 M | 12.12 G | 48.01 | 76.68 | 7.79 | 49.83 | 57.51 | 46.92 | 80.76 | 1.88 | 49.94 | 57.84 |
| CenterNet [50] | IN | 32.12 M | 12.88 G | 65.88 | 88.57 | 39.75 | 73.61 | 61.62 | 67.95 | 89.80 | 39.94 | 75.75 | 66.31 |
| PVT-T [51] | IN | 21.39 M | 10.10 G | 28.42 | 57.58 | 8.84 | 10.23 | 37.04 | 24.95 | 58.34 | 0.22 | 5.47 | 35.75 |
| RetinaNet [52] | IN | 36.39 M | 13.14 G | 32.41 | 62.73 | 1.42 | 22.17 | 45.54 | 32.02 | 63.67 | 1.66 | 19.78 | 45.27 |
| TOOD [53] | IN | 32.03 M | 12.62 G | 65.28 | 87.74 | 41.48 | 69.70 | 62.19 | 67.02 | 88.58 | 40.94 | 72.61 | 65.94 |
| DDOD [54] | IN | 32.27 M | 29.02 G | 59.50 | 85.29 | 61.86 | 70.12 | 20.74 | 61.01 | 87.45 | 65.39 | 73.49 | 17.73 |
| YOLOF [55] | IN | 42.41 M | 6.58 G | 45.09 | 68.09 | 7.79 | 57.51 | 46.95 | 43.29 | 70.42 | 1.01 | 58.77 | 44.95 |
| YOLOX [56] | IN | 8.94 M | 2.13 G | 67.10 | 88.59 | 62.19 | 60.16 | 57.44 | 69.12 | 89.31 | 65.76 | 63.23 | 58.19 |
| S4 Det [57] | IN | 32.72 M | 12.09 G | 64.01 | 86.64 | 37.50 | 69.73 | 62.19 | 65.26 | 87.91 | 35.44 | 71.82 | 65.86 |
| Two-stage | |||||||||||||
| ConvNeXt [58] | IN | 45.06 M | 26.39 G | 55.22 | 80.04 | 62.27 | 70.77 | 7.79 | 56.10 | 83.99 | 65.79 | 75.82 | 0.10 |
| ConvNeXtV2 [59] | IN | 105.00 M | 40.71 G | 55.08 | 80.06 | 62.29 | 70.18 | 7.79 | 56.00 | 84.16 | 65.55 | 73.56 | 0.70 |
| LSKNet [60] | IN | 30.98 M | 22.52 G | 56.83 | 80.01 | 62.31 | 77.21 | 7.79 | 57.44 | 85.56 | 65.75 | 77.42 | 1.04 |
| BurgsVO [61] | IN | 63.10 M | 45.62 G | 66.97 | 88.66 | 40.69 | 70.98 | 67.53 | 68.53 | 89.07 | 41.97 | 76.86 | 66.22 |
| End2End | |||||||||||||
| DAB-DETR [62] | IN | 43.70 M | 10.49 G | 42.58 | 78.95 | 2.17 | 50.90 | 38.31 | 42.87 | 82.90 | 0.28 | 51.06 | 37.26 |
| Conditional DETR [63] | IN | 43.35 M | 9.79 G | 40.96 | 77.33 | 8.50 | 52.83 | 25.17 | 38.71 | 81.56 | 1.30 | 53.04 | 20.34 |
| DiffDet4 SAR [64] | IN | 53.23 M | 12.89 G | 68.37 | 87.21 | 46.14 | 76.01 | 61.26 | 68.52 | 88.12 | 44.27 | 77.30 | 66.51 |
| MSDFEN [65] | IN | 40.23 M | 13.41 G | 68.38 | 87.43 | 45.23 | 77.03 | 63.81 | 68.73 | 88.84 | 45.37 | 78.50 | 66.96 |
| DenoDet [66] | IN | 34.23 M | 12.89 G | 68.60 | 88.10 | 46.57 | 77.62 | 62.11 | 69.91 | 89.44 | 44.77 | 78.30 | 67.11 |
| MSPaDet (Ours) | IN | 27.25 M | 7.75 G | 69.53 | 89.35 | 48.6 | 76.92 | 63.25 | 70.25 | 90.05 | 49.3 | 77.32 | 64.45 |
| Method | Pre. | FLOPs | Average Precision (AP’07) | Average Precision (AP’12) | ||||||||||||||
|---|---|---|---|---|---|---|---|---|---|---|---|---|---|---|---|---|---|---|
| mAP | A220 | A320 | A330 | ARJ21 | B737 | B787 | Other | mAP | A220 | A320 | A330 | ARJ21 | B737 | B787 | Other | |||
| One-stage | ||||||||||||||||||
| FCOS [47] | IN | 51.58 G | 57.13 | 56.77 | 87.69 | 58.15 | 57.60 | 34.56 | 46.87 | 58.29 | 58.26 | 59.13 | 89.66 | 59.11 | 57.52 | 33.86 | 47.55 | 61.00 |
| GFL [48] | IN | 32.27 G | 61.40 | 54.40 | 81.84 | 87.38 | 57.03 | 40.66 | 56.32 | 52.14 | 62.94 | 55.69 | 85.11 | 89.25 | 60.60 | 40.48 | 56.61 | 52.88 |
| RepPoints [49] | IN | 48.50 G | 61.63 | 58.77 | 84.25 | 80.78 | 55.78 | 36.00 | 54.23 | 61.60 | 62.59 | 60.22 | 87.53 | 81.41 | 57.38 | 34.51 | 54.30 | 62.79 |
| TOOD [53] | IN | 50.53 G | 57.16 | 48.44 | 76.70 | 86.36 | 55.01 | 29.86 | 48.31 | 55.45 | 57.48 | 48.31 | 78.41 | 88.49 | 55.01 | 28.41 | 48.00 | 55.71 |
| DDOD [54] | IN | 45.60 G | 57.16 | 47.52 | 81.84 | 90.62 | 54.45 | 29.81 | 39.04 | 56.89 | 57.60 | 46.94 | 85.95 | 90.81 | 55.90 | 29.33 | 36.90 | 57.37 |
| YOLOF [55] | IN | 26.33 G | 60.75 | 54.74 | 85.25 | 83.31 | 55.50 | 30.80 | 54.14 | 61.49 | 62.21 | 55.47 | 89.35 | 85.81 | 57.87 | 28.85 | 54.92 | 63.21 |
| YOLOX [56] | IN | 8.53 G | 58.15 | 58.43 | 84.11 | 92.04 | 46.51 | 18.69 | 51.13 | 56.17 | 59.55 | 59.41 | 85.77 | 92.38 | 50.01 | 17.38 | 55.15 | 56.76 |
| S4 Det [57] | IN | 48.39 G | 64.67 | 59.44 | 89.41 | 89.75 | 59.79 | 41.91 | 50.96 | 57.43 | 65.15 | 62.50 | 90.07 | 90.64 | 59.26 | 39.13 | 55.26 | 58.93 |
| Two-stage | ||||||||||||||||||
| PRDet [67] | IN | 51.00 G | 65.37 | 52.37 | 90.82 | 92.01 | 63.15 | 42.77 | 58.89 | 57.59 | 66.35 | 53.26 | 91.08 | 92.23 | 66.16 | 43.71 | 59.60 | 58.38 |
| ConvNeXt [58] | IN | 63.85 G | 61.91 | 57.94 | 86.75 | 92.03 | 63.85 | 33.08 | 43.56 | 56.14 | 61.48 | 58.01 | 88.21 | 92.16 | 62.11 | 30.67 | 43.56 | 55.61 |
| ConvNeXt V2 [59] | IN | 0.12 T | 62.54 | 55.63 | 88.27 | 91.66 | 54.23 | 30.78 | 56.88 | 60.32 | 63.22 | 57.21 | 89.38 | 91.80 | 54.43 | 28.74 | 57.69 | 63.26 |
| LSKNet [60] | IN | 53.73 G | 62.08 | 53.65 | 93.56 | 91.33 | 53.35 | 31.84 | 51.34 | 59.48 | 62.76 | 54.32 | 93.71 | 91.71 | 55.30 | 30.06 | 51.97 | 62.29 |
| End2End | ||||||||||||||||||
| DAB-DETR [62] | IN | 28.94 G | 48.12 | 54.32 | 82.89 | 13.34 | 56.76 | 29.02 | 48.84 | 51.65 | 48.66 | 55.30 | 85.60 | 13.47 | 58.11 | 27.70 | 48.54 | 51.92 |
| Conditional DETR [63] | IN | 28.09 G | 56.75 | 48.24 | 83.88 | 73.33 | 56.25 | 31.94 | 55.95 | 47.69 | 57.52 | 48.77 | 87.80 | 74.97 | 56.57 | 30.42 | 56.49 | 47.64 |
| DiffDet4 SAR [64] | IN | 50.49 G | 67.46 | 63.22 | 91.14 | 90.87 | 56.08 | 45.32 | 60.24 | 65.35 | 69.06 | 66.03 | 91.93 | 92.34 | 57.30 | 47.35 | 61.24 | 67.21 |
| MSDFEN [65] | IN | 73.27 G | 67.22 | 64.32 | 88.76 | 90.65 | 55.21 | 44.82 | 60.84 | 65.97 | 69.34 | 66.03 | 92.93 | 92.34 | 57.30 | 46.35 | 62.24 | 68.21 |
| DenoDet [66] | IN | 48.53 G | 63.10 | 59.32 | 85.04 | 88.32 | 54.08 | 40.82 | 50.54 | 63.55 | 64.06 | 61.03 | 87.93 | 89.34 | 55.30 | 39.35 | 50.24 | 65.21 |
| MSPaDet (Ours) | IN | 68.38 G | 68.65 | 65.73 | 91.49 | 92.04 | 56.34 | 45.40 | 62.33 | 67.22 | 69.78 | 68.01 | 92.54 | 92.34 | 57.29 | 46.51 | 63.58 | 68.19 |
| Method | Pre. | FLOPs | #Params↓ | mAP | AP@50 | AP@75 | APs | APm | APl | Ship | Aircraft | Car | Tank | Bridge | Harbor |
|---|---|---|---|---|---|---|---|---|---|---|---|---|---|---|---|
| One-stage | |||||||||||||||
| FCOS [47] | IN | 51.57 G | 32.13 M | 52.52 | 85.82 | 54.93 | 47.01 | 66.13 | 57.82 | 59.79 | 55.44 | 60.75 | 41.78 | 34.17 | 63.44 |
| GFL [48] | IN | 52.36 G | 32.27 M | 54.71 | 84.86 | 58.57 | 49.14 | 66.99 | 60.15 | 63.62 | 57.33 | 61.99 | 44.50 | 36.11 | 64.74 |
| RepPoints [49] | IN | 48.49 G | 36.82 M | 51.36 | 86.13 | 53.69 | 46.36 | 62.96 | 53.48 | 60.55 | 55.20 | 60.83 | 40.39 | 34.82 | 56.41 |
| ATSS [68] | IN | 51.57 G | 32.13 M | 54.65 | 87.30 | 57.95 | 49.59 | 67.64 | 58.67 | 61.23 | 55.64 | 61.47 | 45.90 | 36.92 | 67.18 |
| PVT-T [51] | IN | 42.19 G | 21.43 M | 45.80 | 77.25 | 48.70 | 37.71 | 59.23 | 53.05 | 53.00 | 52.61 | 58.73 | 29.90 | 22.21 | 58.81 |
| TOOD [53] | IN | 50.52 G | 30.03 M | 54.35 | 86.58 | 58.11 | 49.90 | 66.42 | 58.30 | 61.98 | 55.31 | 62.23 | 45.66 | 36.34 | 64.94 |
| DDOD [54] | IN | 45.58 G | 32.21 M | 53.72 | 86.34 | 56.93 | 49.03 | 64.40 | 57.72 | 62.09 | 55.78 | 62.18 | 43.68 | 36.04 | 62.57 |
| YOLOF [55] | IN | 26.32 G | 42.46 M | 42.53 | 74.65 | 42.88 | 33.43 | 55.89 | 53.27 | 52.32 | 52.34 | 52.41 | 22.56 | 23.44 | 52.12 |
| YOLOX [56] | IN | 8.53 G | 8.94 M | 33.78 | 66.47 | 31.01 | 28.19 | 42.76 | 28.65 | 45.78 | 46.53 | 53.13 | 25.96 | 12.84 | 18.65 |
| S4 Det [57] | IN | 48.38 G | 32.72 M | 55.71 | 87.02 | 59.02 | 50.07 | 68.09 | 60.69 | 64.84 | 58.54 | 64.67 | 44.78 | 36.81 | 64.98 |
| Two-stage | |||||||||||||||
| ConvNeXt [58] | IN | 63.84 G | 45.07 M | 52.85 | 85.22 | 56.98 | 45.37 | 64.25 | 58.31 | 60.25 | 57.05 | 61.83 | 37.82 | 36.51 | 63.65 |
| ConvNeXtV2 [59] | IN | 0.12 T | 0.11 G | 53.61 | 85.71 | 58.60 | 47.33 | 64.37 | 59.27 | 61.18 | 55.53 | 62.93 | 39.35 | 38.86 | 63.79 |
| BurgsVO [61] | IN | 63.97 G | 45.20 M | 53.98 | 85.35 | 57.98 | 47.63 | 66.38 | 60.44 | 61.38 | 58.31 | 62.83 | 38.82 | 37.90 | 64.65 |
| End2End | |||||||||||||||
| DAB-DETR [62] | IN | 28.94 G | 43.70 M | 43.01 | 77.84 | 42.80 | 34.52 | 56.04 | 52.32 | 52.86 | 50.02 | 49.17 | 23.76 | 28.17 | 54.77 |
| DiffDet4 SAR [64] | IN | 69.82 G | 54.74 M | 55.79 | 85.51 | 59.46 | 50.33 | 67.40 | 60.30 | 64.81 | 57.06 | 63.79 | 45.56 | 36.22 | 66.94 |
| MSDFEN [65] | IN | 82.73 G | 75.78 M | 56.12 | 86.21 | 59.87 | 50.51 | 68.38 | 61.22 | 65.21 | 58.36 | 64.16 | 46.23 | 37.73 | 65.07 |
| DenoDet [66] | IN | 52.69 G | 65.78 M | 55.32 | 85.51 | 59.25 | 50.33 | 67.40 | 60.30 | 64.61 | 57.06 | 63.36 | 45.49 | 36.09 | 66.87 |
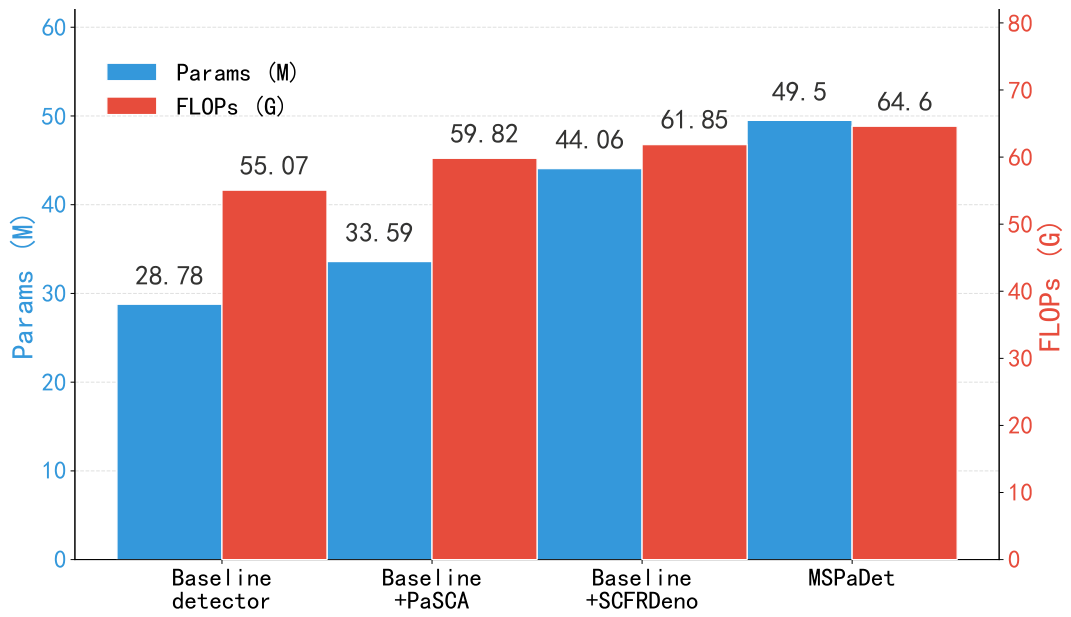
| MSPaDet (Ours) | IN | 64.60 G | 49.50 M | 56.69 | 86.32 | 61.17 | 50.80 | 68.30 | 62.50 | 65.94 | 58.33 | 64.32 | 45.13 | 37.81 | 68.50 |
| Category | Metric | Score |
|---|---|---|
| In-domain reference | ||
| SAR-Aircraft-1.0 | mAP | 0.6865 |
| SARDet-100K | mAP | 0.5833 |
| Cross-dataset transfer | ||
| SAR-Aircraft-1.0 → SARDet-100K (aircraft subset) | AP | 0.4101 |
| SAR-Aircraft-1.0 → SARDet-100K (aircraft subset) | Recall | 0.6100 |
| DTCWT/Norm. | Phase Reweight | FP | MSAR | SAR-Aircraft-1.0 | SARDet-100K | |||||
|---|---|---|---|---|---|---|---|---|---|---|
| FPS | mAP(07) | mAP(12) | FPS | mAP(07) | mAP(12) | FPS | mAP | |||
| × | × | 32 | 230.4 | 65.52 | 66.85 | 167.6 | 61.63 | 62.76 | 101.3 | 53.21 |
| × | ✓ | 32 | 230.1 | 66.88 | 67.09 | 167.4 | 63.01 | 63.40 | 102.4 | 54.91 |
| ✓ | × | 32 | 225.0 | 66.64 | 68.26 | 167.3 | 59.72 | 60.49 | 101.4 | 53.81 |
| ✓ | × | 64 | 220.3 | 66.71 | 68.57 | 152.3 | 60.58 | 61.05 | 101.3 | 54.32 |
| ✓ | ✓ | 32 | 215.0 | 68.52 | 70.31 | 166.4 | 67.64 | 68.61 | 101.9 | 55.68 |
| DTCWT/Norm. | PaSCA | MSAR | SAR-Aircraft-1.0 | SARDet-100K | ||
|---|---|---|---|---|---|---|
| mAP(07) | mAP(12) | mAP(07) | mAP(12) | mAP | ||
| × | × | 66.52 | 67.85 | 61.63 | 62.76 | 51.66 |
| ✓ | × | 67.86 | 68.81 | 64.20 | 64.84 | 54.30 |
| ✓ | ✓ | 69.53 | 70.25 | 68.65 | 69.78 | 56.69 |
Disclaimer/Publisher’s Note: The statements, opinions and data contained in all publications are solely those of the individual author(s) and contributor(s) and not of MDPI and/or the editor(s). MDPI and/or the editor(s) disclaim responsibility for any injury to people or property resulting from any ideas, methods, instructions or products referred to in the content. |
© 2026 by the authors. Licensee MDPI, Basel, Switzerland. This article is an open access article distributed under the terms and conditions of the Creative Commons Attribution (CC BY) license.
Share and Cite
Chen, N.; Xiang, X.; Luo, Y. MSPaDet: A Multi-Scale Phase-Aware Denoising Method for Target Detection in SAR Images. Remote Sens. 2026, 18, 1513. https://doi.org/10.3390/rs18101513
Chen N, Xiang X, Luo Y. MSPaDet: A Multi-Scale Phase-Aware Denoising Method for Target Detection in SAR Images. Remote Sensing. 2026; 18(10):1513. https://doi.org/10.3390/rs18101513
Chicago/Turabian StyleChen, Naxiong, Xuyu Xiang, and Yuanjing Luo. 2026. "MSPaDet: A Multi-Scale Phase-Aware Denoising Method for Target Detection in SAR Images" Remote Sensing 18, no. 10: 1513. https://doi.org/10.3390/rs18101513
APA StyleChen, N., Xiang, X., & Luo, Y. (2026). MSPaDet: A Multi-Scale Phase-Aware Denoising Method for Target Detection in SAR Images. Remote Sensing, 18(10), 1513. https://doi.org/10.3390/rs18101513