Highlights
What are the main findings?
- MultiVeg is the first satellite-based very high-resolution (0.5 m) multi-class vegetation segmentation benchmark constructed from KOMPSAT-3 and 3A imagery, providing multispectral (blue, green, red, and near-infrared) image patches with reliable annotations generated by remote sensing image analysis experts.
- Comprehensive experiments using CNN- and Transformer-based segmentation models demonstrate that the proposed dataset enables accurate segmentation of diverse vegetation types across complex Earth surfaces.
What are the implications of the main findings?
- MultiVeg enables consistent vegetation monitoring and urban ecological management by providing detailed mapping of heterogeneous vegetation distributions identifiable in very high-resolution satellite imagery.
- The dataset provides a foundation for developing advanced deep learning models for vegetation analysis and environmental monitoring using very high-resolution satellite imagery.
Abstract
Vegetation segmentation in Very High-Resolution (VHR) satellite imagery has become an essential task for ecological monitoring, supporting diverse applications such as large-scale vegetation conservation and detailed segmentation of small local areas. In particular, multi-class vegetation segmentation, which distinguishes various vegetation types beyond simple binary segmentation of vegetation and non-vegetation, enables detailed analysis of subtle ecosystem changes and has gained increasing importance. However, the annotation of VHR satellite imagery requires extensive time and effort, resulting in a lack of datasets for vegetation segmentation, especially those including multi-class annotations. To address this limitation, this study proposes MultiVeg, a deep learning dataset based on VHR satellite imagery for detailed multi-class vegetation segmentation. MultiVeg includes preprocessed 0.5 m resolution images collected by the KOMPSAT-3 and 3A satellites from 2014 to 2023, covering diverse environments such as urban, agricultural, and forest regions. Each image was carefully annotated by experts into three semantic classes, which are Background, Tree, and Low Vegetation, and validated through a structured quality check process. To verify the effectiveness of MultiVeg, seven representative semantic segmentation models, including convolutional neural network and Transformer-based architectures, were trained and comparatively analyzed. The results demonstrated consistent segmentation performance across all classes, confirming that MultiVeg is a high-quality and reliable dataset for deep learning-based multi-class vegetation segmentation research using VHR satellite imagery. The MultiVeg will be publicly available through GitHub (release v1.0), serving as a valuable resource for advancing deep leaning-based vegetation segmentation research in the remote sensing field.
1. Introduction
In recent years, forest degradation, rapid urban expansion, and climate change–driven shifts in vegetation distribution threaten the stability of the global ecosystem, and an unprecedented demand for precise and ongoing vegetation monitoring has arisen [1,2,3]. Vegetation is an essential element of terrestrial ecosystems: it absorbs atmospheric carbon dioxide and releases oxygen through photosynthesis, while also providing vital ecological tasks including regulation of the hydrological cycle, soil conservation, and climate moderation [4]. In human–nature interactions, vegetation directly supports human well-being by removing air pollutants, reducing particulate matter, and mitigating urban heat-island effects, thereby contributing to urban ecosystem resilience [5].
However, accelerated urbanization and industrialization have been eroding the structural connectivity of entire green spaces. In urban regions, the rapid land cover transformation driven by high-density building development and the fragmentation of large vegetation areas into smaller, isolated patches has led to a notable decline in green spaces [6]. Similar processes also occur in croplands and forests; vegetation loss in these two regions can induce even greater ecological deterioration than in city centers. Collectively, vegetation monitoring across urban, forested, and agricultural landscapes emerged as a key priority for sustainable development.
Remote sensing enables efficient, repeated observation over large areas and is therefore widely employed for monitoring tasks across ecology and urbanization [7,8]. These tasks in remote sensing have traditionally been addressed as segmentation problems, in which pixels or regions are grouped based on spectral, textural, or spatial features. They were performed using conventional image processing techniques, such as thresholding and clustering, as well as machine learning methods like Random Forest [9,10]. Nevertheless, such conventional approaches exhibit inherent limitations in capturing complex spatial patterns and contextual information among objects [11]. In recent years, deep learning–based semantic segmentation has emerged as the dominant framework, allowing neural networks to automatically learn hierarchical and discriminative features from large-scale datasets and classify pixels into meaningful categories [12,13]. However, most deep learning models are supervised and therefore highly dependent on well-constructed training datasets [14]. In the absence of task-matched data, these models cannot be effectively utilized; moreover, model accuracy can vary substantially with dataset quality. Dataset scale is also a crucial factor, as high-performing models generally favor large datasets [15]. However, creating such datasets requires extensive annotation effort, time, and cost that often exceed the capacity of individual researchers [16]. This challenge becomes more pronounced in Very High-Resolution (VHR) imagery, which provides spatial resolutions of sub-meter [17,18]. These detail levels, complex surface patterns and subtle textural variations make annotation particularly demanding. As the importance of datasets has grown and the limitations of individual curation have become evident, a variety of organizations, national agencies, research institutes, and universities have begun releasing publicly available datasets for diverse deep learning applications [19,20,21].
Despite these advances, vegetation segmentation remains a relatively underrepresented domain within remote sensing. While numerous datasets have been developed for general land-cover classification, those specifically designed for detailed vegetation analysis are still limited. In particular, the inclusion of the Near-InfraRed (NIR) band, which provides essential spectral cues for distinguishing vegetation from spectrally similar non-vegetated surfaces, is often missing in existing datasets. Moreover, annotating VHR satellite imagery for vegetation segmentation requires expert knowledge to interpret fine-scale textures and boundaries, making large-scale dataset construction particularly challenging. As a result of these limitations, existing satellite-based vegetation segmentation datasets frequently rely on medium- to high-resolution sensors such as Sentinel [22] or adopt a binary classification scheme distinguishing vegetation from non-vegetation [23]. Some datasets provide multiple vegetation classes [24], but most were designed for Land-Use and Land-Cover (LULC) mapping, where vegetation constitutes only a small proportion compared with other classes, limiting their applicability to vegetation-focused segmentation.
To bridge this gap, we construct a new vegetation-segmentation dataset derived from VHR satellite imagery. This paper presents MultiVeg, a multi-class vegetation segmentation dataset. It contains 6677 image patches of 512 × 512 pixels, derived from VHR satellite imagery collected over major metropolitan and suburban environments in Republic of Korea. Each patch has a ground sample distance of 50 cm and includes four spectral bands. The data are radiometrically preprocessed and released in a format harmonized with common open-source datasets, enabling cross-dataset fusion. When used standalone, MultiVeg supports training and fair benchmarking of a wide range of segmentation models. By providing a standardized and high-quality dataset, MultiVeg aims to advance research on fine-grained vegetation understanding and contribute the development of more robust and generalizable deep learning models for remote sensing applications.
The structure of this paper is as follows: Section 2 reviews existing remote sensing datasets with and without NIR bands for vegetation segmentation. Section 3 introduces the proposed MultiVeg dataset, including image collection, preprocessing, and characteristic analysis. Section 4 describes the experimental setup and presents both quantitative and qualitative results obtained from multiple semantic segmentation models. Section 5 provides a discussion of the findings, and Section 6 concludes the paper with a summary and directions for future work.
2. Related Work
2.1. Remote Sensing Datasets for Vegetation Segmentation Without Near-Infrared Band
Recently, the role of dataset has become increasingly important in deep learning research. To improve research efficiency and accelerate technological progress, publicly available datasets have been released across various application domains. In the field of remote sensing, most publicly available datasets have been developed for LULC classification rather than for the segmentation of specific objects. These datasets generally aim to segment or classify a wide range of surface categories over large geographic areas, and most of them are constructed using only the visible spectral bands, which are Red, Green, Blue (RGB).
Representative RGB-based LULC datasets include DeepGlobe [25], which provides six land-cover classes based on satellite imagery collected from multiple regions worldwide. The classes are urban, agriculture, rangeland, water, barren, and forest. LandCover.ai [26] was created from airborne orthophotos captured over Poland and defines four classes including building, woodland, water, and road. Love DA [27] was built using imagery obtained from the Google Earth platform and includes six classes, which are building, road, water, barren, forest, and agriculture. OpenEarthMap [28] consists of RGB image patches collected from 44 countries and provides eight classes including bare land, rangeland, developed space, road, tree, water, agricultural land, and building.
Among these datasets, some such as DeepGlobe and LoveDA contain class definitions that enable multi-class vegetation segmentation. However, most LULC datasets are designed mainly for urban surface classification or segmentation rather than for detailed vegetation mapping, and therefore they are not optimized for vegetation segmentation tasks. In addition to class composition, the spectral configuration of these datasets is also limited for vegetation analysis. Vegetation typically appears as clusters of trees, shrubs, and grasses that exhibit irregular boundaries and low morphological consistency in aerial and satellite images. As a result, spectral discrimination becomes an important factor in vegetation mapping. RGB-only datasets do not include diagnostic spectral bands such as NIR, which are necessary for distinguishing vegetation from non-vegetated surfaces including shadows, asphalt, and water [29,30]. This limitation reduces the separability between vegetated and non-vegetated regions and often leads to spectral ambiguity within similar classes.
2.2. Remote Sensing Datasets for Vegetation Segmentation with Near-Infrared Band
To overcome the limitations of RGB-only datasets, especially the spectral confusion between vegetation and visually similar non-vegetated surfaces, we review datasets that include an NIR band. In the NIR region, pigment absorption is low, while strong multiple scattering within the leaf mesophyll produces high reflectance in vegetation [31]. Additionally, water absorption is relatively low compared with the SWIR region, rendering NIR a highly diagnostic indicator of vegetation structure and condition [32,33].
The representative NIR-inclusive datasets summarized in Table 1, built with different sensors, resolution, and objectives, have collectively improved the spectral separability of vegetation segmentation. For example, ISPRS Vaihingen and Potsdam datasets [34] provide finely annotated tree and low vegetation classes in German urban scenes using VHR airborne color-infrared and RGB with NIR imagery, while LandCoverNet [35] offers global multispectral labels derived from all Sentinel-2 bands at medium resolution. DynamicEarthNet [36] and WUSU [24] introduce multi-temporal information to capture seasonal and phenological variation in crops and vegetation, and Five-Billion-Pixels [37] spans vegetation-related LULC classes across China from large-scene Gaofen-2 RGB with NIR imagery.
Despite these advances, there remains a scarcity of datasets that consistently cover diverse national land cover contexts (urban, forest, and agriculture) with VHR NIR-inclusive satellite imagery, while simultaneously providing sufficient sample size and expert, high-quality manual annotations. Existing NIR-inclusive datasets have undoubtedly contributed to improving vegetation segmentation by enhancing the spectral separability between vegetated and non-vegetated surfaces. Most existing datasets were originally developed for LULC classification, resulting in a limited representation of vegetation samples. Furthermore, the satellite imagery used in most existing datasets has spatial resolutions lower than 1 m, limiting their ability to accurately represent detailed vegetation structures. Among the datasets built using RGB with NIR imagery at sub-meter resolution, most are based on imagery acquired from airborne platforms, with Zurich Summer [38] being the only known example constructed using satellite imagery. Another limitation is that most datasets are collected during periods of peak vegetation health, which restricts their applicability to scenarios involving low vegetation vitality. The MultiVeg dataset was designed to address these gaps. Specifically, it offers the following contributions:
- (a)
- The proposed dataset includes diverse vegetation samples across urban, forest, and agricultural regions, making it suitable for fine-grained vegetation segmentation.
- (b)
- It provides sub-meter spatial resolution satellite imagery, enabling fine-grained capture of vegetation structure and supports the development of high-performing models.
- (c)
- MultiVeg consists of numerous scenes acquired under varying seasonal and illumination conditions, reflecting real-world vegetation dynamics and supporting better model generalization.
- (d)
- All annotations in MultiVeg were produced by experts in remote sensing image analysis, ensuring high-quality ground truth for reliable vegetation segmentation.

Table 1.
Comparison of publicly available remote sensing land-cover semantic segmentation datasets including vegetation classes.
Table 1.
Comparison of publicly available remote sensing land-cover semantic segmentation datasets including vegetation classes.
| Dataset | Year | Spectral Bands | Number of Images | Image Size (Pixel) | Coverage | Image Source | Spatial Resolution (m) | |
|---|---|---|---|---|---|---|---|---|
| RGB-only | DeepGlobe [25] | 2018 | R, G, B | 1146 | 2448 × 2448 | Global | Satellite | 0.5 |
| LandCover.ai [26] | 2020 | R, G, B | 41 | ≈9000 × 9500 ≈4200 × 4700 | Poland | Airborne | 0.25/0.5 | |
| LoveDA [27] | 2021 | R, G, B | 5987 | 1024 × 1024 | China | Google Earth | 0.3 | |
| OpenEarthMap [28] | 2023 | R, G, B | 5000 | 1024 × 1024 | Global | Satellite, Airborne | 0.25–0.5 | |
| NIR-inclusive | ISPRS Vaihingen [34] | 2013 | NIR, R, G | 33 | Variable (≈2–3k per side) | Germany | Airborne | 0.09 |
| ISPRS Potsdam [34] | 2013 | NIR, R, G, B | 38 | 6000 × 6000 | Germany | Airborne | 0.05 | |
| SAT-4 [39] | 2015 | NIR, R, G, B | 500,000 | 28 × 28 | USA | Airborne | 1 | |
| Zurich Summer [38] | 2015 | NIR, R, G, B | 20 | Variable (≈1000 × 1150) | Switzerland | Satellite | 0.61 | |
| LandCoverNet [35] | 2020 | S2 B01– B12 * | 8941 | 256 × 256 | Global | Satellite | 10 | |
| Agriculture-Vision [20] | 2020 | NIR, R, G, B | 94,986 | 512 × 512 | USA | Airborne | 0.1/0.15/0.2 | |
| DynamicEarthNet [36] | 2022 | NIR, R, G, B | 54,750 | 1024 × 1024 | Global | Satellite | 3 | |
| Five-Billion-Pixels [37] | 2023 | NIR, R, G, B | 150 | 7200 × 6800 | China | Satellite | 4 | |
| WUSU [24] | 2023 | NIR, R, G, B | 6 | 6358 × 6382 7025 × 5500 | China | Satellite | 1 | |
| MultiVeg (ours) | 2025 | NIR, R, G, B | 9348 | 512 × 512 | Republic of Korea | Satellite | 0.5 | |
* Includes red-edge and short-wave infrared bands; non-10 m bands were up sampled to 10 m via nearest neighbor interpolation.
3. MultiVeg Dataset
In this section, we describe in detail the construction process of the MultiVeg dataset proposed in this study, including preprocessing and annotation methods, its main characteristics, and a characteristic analysis on the final dataset. MultiVeg is built on VHR satellite imagery and is designed to facilitate accurate and consistent semantic segmentation of various forms of vegetation present on the Earth’s surface, including urban greenery, agricultural crops, and forest vegetation.
3.1. Image Collection
The MultiVeg dataset is composed of images captured by the optical sensors onboard the KOMPSAT-3 and KOMPSAT-3A satellites operated by the Korea Aerospace Research Institute. Both sensors provide four spectral bands: Red, Green, Blue, and NIR. KOMPSAT-3 imagery has a spatial resolution of 2.8 m for multispectral images and 0.7 m for the panchromatic images, while KOMPSAT-3A offers 2.2 m multispectral and 0.55 m panchromatic resolution [40]. Detailed information about the KOMPSAT series is provided in Table 2.
Table 2.
Detailed specification of KOMPSAT-3 and 3A satellites.
MultiVeg was constructed by selecting only high-quality images suitable for vegetation segmentation from those collected over approximately ten years, between 2014 and 2023, since KOMPSAT-3 began official operation. In the selection process, factors such as season, imaging conditions, and cloud coverage were thoroughly considered, and any images in which ground cover was not clearly discernible (for example, due to heavy rain or fog) were excluded. As a result, the dataset primarily includes images from spring, summer, and autumn, when vegetation is mostly activated, and it is designed to reflect changes in vegetation density, color, and shading across different seasons.
3.2. Dataset Overview
In this study, we introduce MultiVeg, a multi-class vegetation segmentation dataset designed to support accurate and consistent segmentation of diverse forms of vegetation observed in VHR satellite imagery. Whereas existing satellite-based vegetation datasets often provide only images with high vegetation health, MultiVeg is designed to reflect a variety of real-world visual conditions by including images across different seasons, illumination levels, and tilt angles of sensors. It was constructed from imagery of Seoul, Incheon, and Jeju Island regions selected as representative urban, agricultural, and forest areas across Republic of Korea (Figure 1).
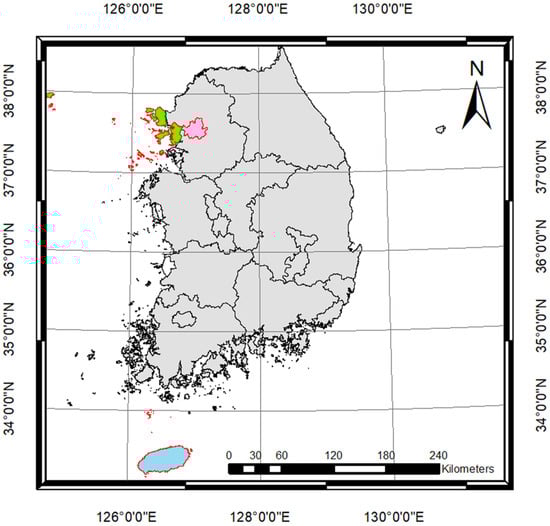
Figure 1.
Geographic distribution of the study areas used for constructing the MultiVeg dataset, including Seoul (pink), Incheon (green), and Jeju Island (sky-blue) regions across Republic of Korea.
The key characteristics of MultiVeg are as follows:
- Data collection period: Composed of satellite images collected over 10 years (2014–2023), encompassing seasonal variations spring (March–May), summer (June–August), autumn (September–November), and winter (December–February).
- Spatial coverage: Includes major urban areas (Seoul, Incheon) as well as natural, suburban and rural regions (Jeju Island), covering diverse land cover environments such as cities, farmlands, and forests.
- Data unit: Provided at the patch level, with each patch being 512 × 512 pixels. Each patch consists of a 4-band image (RGB + NIR) and a corresponding vegetation segmentation label mask.
- Label classes: Every patch is annotated with three semantic classes Background, Low Vegetation, and Tree and the definition of each class is provided (Figure 2 for a summary of class definitions and example images).
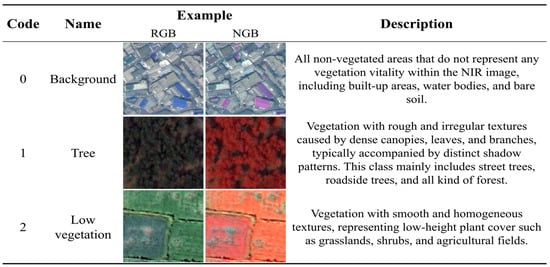 Figure 2. Example patches and class description in the MultiVeg dataset.
MultiVeg’s labeling scheme is defined with consideration for the level of detail that is visually distinguishable in VHR satellite images. Although the pansharpened KOMPSAT-3 and 3A imagery provides a very high spatial resolution of approximately 0.7, 0.55 m each, this is still insufficient to reliably identify individual plant species or very fine vegetation categories. Therefore, MultiVeg focuses on class distinctions that can be made visually from satellite imagery. For this reason, vegetation in the MultiVeg dataset is categorized into Tree and Low Vegetation, whereas non-vegetation areas are labeled as Background. Importantly, these classes are distinguished not by the absolute height of the vegetation or its species, but by the texture and spatial context observable in the imagery. Since satellite images are inherently two-dimensional and do not provide height information that Light Detection and Ranging (LiDAR) data can provide, the class definitions rely exclusively on texture information present in the imagery. For example, the Tree class is characterized by a rough and irregular texture with distinct shadow patterns caused by tree canopies and branches, whereas the Low Vegetation class (e.g., grass, shrubs, pasture, or crops) appears with a smooth, homogeneous texture. The texture-based annotation criteria used in MultiVeg are clearly illustrated in Figure 3. By leveraging these visual criteria, we ensured a consistent and reproducible labeling standard that is independent of the actual vegetation height or species.
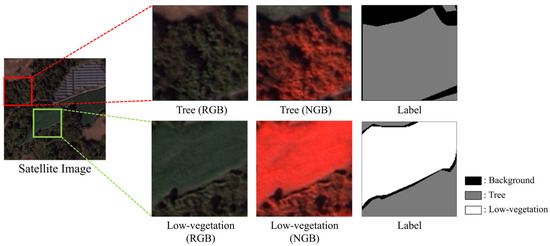
Figure 3.
Illustration of the texture-based annotation criteria used in the MultiVeg dataset.
To ensure that models trained on MultiVeg achieve both high segmentation accuracy and robust generalization, the dataset includes imagery captured under a wide range of environmental conditions. As noted, MultiVeg contains images from multiple seasons, which introduce diversity in illumination and sensor tilt angles. Moreover, the dataset encompasses everything from small vegetation objects in city centers (such as street trees, park lawns, and traffic island plantings) to large contiguous vegetation areas in forests and farmlands, thereby covering a high degree of surface complexity. These characteristics allow a model trained on MultiVeg to understand the spatial structures and spectral features of vegetation across complex landscapes where urban and natural environments intermix. We expect that MultiVeg will serve as a valuable dataset for developing and evaluating remote sensing-based vegetation segmentation models.
3.3. Image Processing
All images in MultiVeg are processed through a series of preprocessing steps, as outlined in the flowchart in Figure 4. The process includes pansharpening, radiometric normalization, image tiling, annotation, and quality checking.
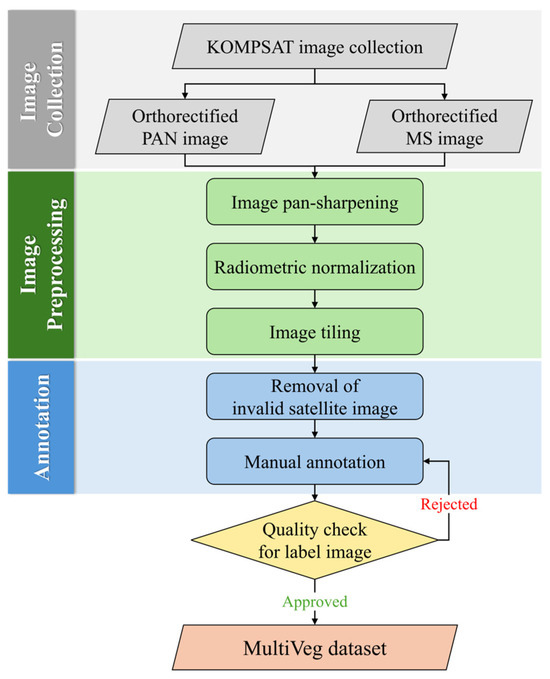
Figure 4.
Image processing workflow for constructing the MultiVeg dataset.
As mentioned, the KOMPSAT-3 and 3A satellites provide both multispectral and panchromatic bands simultaneously, with the panchromatic image having higher spatial resolution than the multispectral images. We applied Gram–Schmidt pansharpening to fuse the fine spatial details of the panchromatic image into the multispectral image [41], thereby preserving the spectral characteristics of vegetation while also capturing small vegetation objects in urban areas, such as street trees and grass and shrubs commonly found in parks, with greater spatial detail. After pansharpening, each multispectral image achieves a spatial resolution of approximately 0.7 m for KOMPSAT-3 and 0.55 m for KOMPSAT-3A. To enable the combined use of images from both satellites within MultiVeg, an additional resampling step was performed to reconcile the slight difference in resolution. Specifically, we applied bilinear resampling to unify the spatial resolution of all images to 0.5 m, ensuring spatial consistency between images and minimizing shape distortion of vegetation objects across the dataset.
MultiVeg is composed of satellite imagery collected from multiple scenes captured over Seoul, Incheon, and Jeju Island of Republic of Korea. Because these images were acquired at different times, variations in the sun’s elevation and azimuth angles result in differing illumination conditions between scenes. Additionally, within each scene, illumination can be affected not only by the sun’s position but also by the satellite sensor’s tilt angle at the time of capture. These differences in lighting and viewing geometry can cause the same type of vegetation to exhibit different reflectance values from image to image, potentially leading to mis-segmentation during analysis. To solve this problem, we applied a 1% linear stretch to the imagery, normalizing each image’s Digital Number (DN) values to the 1st–99th percentile range. This process effectively removed extremely high and low values and homogenized the brightness and contrast across the dataset. This process reduces segmentation errors that might occur in extremely bright or dark regions and mitigates quality disparities between images taken under varying illumination conditions.
We applied a 1% linear stretch to each 16-bit band and simultaneously converted the imagery to 8-bit to maintain radiometric consistency. Although this linear transformation helps preserve relative radiometric relationships between pixels, reducing the bit depth from 16 to 8 inevitably introduces some loss of numerical precision. Nonetheless, this trade-off is widely accepted in deep learning workflows, as the 8-bit format improves compatibility with existing datasets, reduces storage requirements, and accelerates training. Previous studies in remote sensing and biomedical image analysis have shown that, when normalization is applied, models trained on 8-bit and 16-bit imagery often achieve comparable performance [42,43]. Even without normalization, the accuracy gap remains modest, while 16-bit inputs significantly increase memory usage and training time. These findings underscore the practical balance between accuracy and computational efficiency, supporting our decision to provide the dataset in 8-bit format for general use.
Once radiometric and spatial preprocessing had been completed, image tiling was performed. Image tiling refers to the process of dividing images into patches of specified sizes to create a format suitable for deep learning model training. As noted earlier in Table 2, previous studies have provided image patches ranging from as small as 32 × 32 pixels to as large as 1024 × 1024 pixels. Patch size has a direct impact on model training efficiency and performance. If the patches are too small, they might not contain entire objects or sufficient contextual information, thereby leading to a loss of spatial context. In contrast, patches that are too large increase computational load and may be inefficient on common GPU hardware. Considering these factors, we chose a patch size of 512 × 512 pixels for MultiVeg. This size is large enough to encompass the full extent of individual vegetation objects along with their surrounding context, yet still small enough to maintain a reasonable computational load during training. Moreover, 512 × 512 patches have been widely used in remote sensing semantic segmentation research and have been found effective in preserving object continuity and capturing fine edge [44]. Therefore, we adopted the same patch size when dividing the imagery for the construction of MultiVeg.
Subsequently, all image patches were manually annotated by remote sensing experts using the open-source labeling tool LabelMe [45]. As mentioned earlier, the Tree class is characterized by a rough, irregular texture due to the structure of leaves and branches, whereas the Low Vegetation class (including grass, shrubs, and cultivated fields) exhibits a smooth and homogeneous texture. This texture-based criterion provided a reliable visual indicator that serves as a proxy for vegetation height, allowing us to effectively distinguish irregular vegetative structures and minimize human error during annotation. However, some of cases shown Low Vegetation areas displayed vegetation forms that produced a slightly rough texture resembling that of the Tree class. Additionally, some Background areas exhibited reflectance characteristics that could be misinterpreted as healthy vegetation (e.g., bright pixel values in NGB images). In such borderline cases, the final class assignment was determined through cross-validation and consensus discussions among multiple annotators to ensure labeling consistency. This approach was crucial for maintaining labeling consistency in complex VHR satellite imagery and for minimizing confusion at class boundaries.
Once annotation was completed a quality check was performed to identify and remove unsuitable patches that could negatively impact model training. The following criteria were used for quality control, and representative examples of each criterion are illustrated in Figure 5.
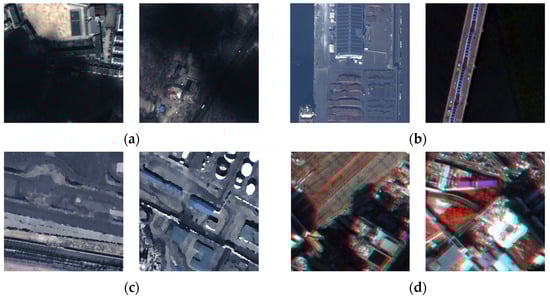
Figure 5.
Examples of image patches corresponding to each quality check case (a–d): (a) shadow and occlusion area, (b) entirely covered by non-vegetation areas, (c) blurred or obscured areas, (d) exhibiting radiometric distortion or extreme reflectance artifacts.
- A.
- Patches containing vegetation present in shadowed areas (e.g., shadows cast by clouds or tall buildings).
- B.
- Patches fully covered by non-vegetation surfaces, which provide no meaningful information for model training.
- C.
- Patches where parts of the image are blurred or obscured due to military or national security facilities.
- D.
- Patches exhibiting radiometric distortion or extreme reflectance artifacts caused by sensor noise or saturation.
All annotated patches were thoroughly inspected by human operators according to the above criteria. In the case of Figure 5a, if only a portion of a patch was covered by occlusion, the corresponding area was labeled as non-vegetation even when vegetation was partially visible, and the patch was therefore retained in the MultiVeg dataset. In contrast, the cases shown in Figure 5b–d were excluded from the MultiVeg dataset, as such conditions could negatively affect the model training process. Furthermore, the annotations were additionally validated to ensure their compliance with the labeling criteria of MultiVeg, thereby minimizing potential human errors during annotation and improving the overall quality of the label data.
After completing the annotation process, we conducted an Inter-Annotator Agreement (IAA) analysis to assess the quality of the constructed label data. IAA is a representative methodology for quantitatively measuring the degree of agreement among annotators [46,47], and Kappa-based metrics are particularly widely used because they compensate for chance agreement arising from class distribution [48]. In this study, three independent annotation results produced under the same guideline were utilized, and Fleiss’s Kappa [49], which is suitable for multi-annotator settings, was employed to evaluate the overall consistency of the labels. Equation (1) computes the marginal class proportion, while Equation (2) derives the expected chance agreement based on this distribution. Equation (3) estimates the class-wise observed agreement, and Equation (4) aggregates these values to obtain the mean observed agreement. Finally, Equation (5) yields Fleiss’s Kappa by correcting the observed agreement for chance.
where denotes the total number of pixels included in the evaluation, and represents the number of annotators who provided labels for each class (in this study, ). The label set consists of semantic classes, and thus in our experimental setting. For each class , indicates the number of annotators who assigned that item to class . Using these counts, represents the marginal proportion of class across all annotations. The term denotes the observed agreement among annotators for class , and is the mean observed agreement computed over all classes. The expected agreement is derived from the class distribution and reflects the probability of annotators agreeing purely by chance. Finally, is Fleiss’s Kappa, which quantifies the chance-corrected inter-annotator agreement.
In this study, a total of 30 patches were randomly selected, and Fleiss’s Kappa was computed based on the labels independently produced by three annotators. The marginal class proportions were 0.4259 for Background, 0.3958 for Tree, and 0.1783 for Low Vegetation, indicating that the three classes were utilized in a realistic and balanced manner within the dataset (Table 3). The mean observed agreement was 0.7587, meaning that approximately 75.9% of all pixels received identical labels across annotators. In contrast, the expected agreement , which reflects the probability of annotators agreeing purely by chance based on the class distribution, was 0.3698, suggesting that about 36.9% of agreement could occur without intentional consensus (Table 4).
Table 3.
Experimental Setup for Inter-Annotator Agreement Analysis.
Table 4.
Inter-Annotator Agreement Analysis Results Based on Fleiss’s Kappa.
After correcting for chance agreement, the resulting Fleiss’s Kappa was 0.6172. According to widely accepted interpretations of the Kappa coefficients [50,51], values between 0.61 and 0.80 correspond to substantial agreement, indicating that the constructed label dataset exhibits a high level of inter-annotator consistency and reliability. Considering that pixel-wise segmentation of VHR imagery often leads to annotator variability, particularly along fine-grained object boundaries, the obtained Kappa value demonstrates that the MultiVeg annotations has sufficiently robust quality. This result indicates that the annotation guidelines were applied effectively and that the resulting labels are appropriate for use as ground-truth data in vegetation segmentation model training.
3.4. Characteristic Analysis
Consequently, the MultiVeg dataset consists of a total of 6677 image patches, each provided as a 512 × 512-pixel PNG format. To allow users flexibility for different training scenarios, the dataset is not pre-divided into training, validation, or test sets. Instead, all patches are supplied within an image folder, and their corresponding label files are stored in a separate label folder. Users can partition the data as needed for model development and evaluation. Each image patch is paired with its ground-truth vegetation label mask, ensuring that experiments conducted with this dataset are reproducible.
Out of the 6677 image patches, approximately 42.8% (2859 patches) were collected from the Incheon region, 19.5% (1300 patches) from Seoul, and the remaining 37.7% (2518 patches) from Jeju Island. Seoul, as the capital city, contains many sensitive areas such as government buildings and military installations, where the acquisition and public release of high-resolution satellite imagery are restricted. To ensure the acquisition of a sufficient amount of urban-area data, a larger number of samples were collected from Incheon, which is subject to fewer restrictions on VHR satellite imagery compared to Seoul. Likewise, the number of patches obtained from Jeju Island is approximately twice that of Seoul. This sampling strategy was intended to compensate for the lack of Low Vegetation samples in highly urbanized areas, as Jeju’s diverse landscapes provided valuable additional data for the low vegetation class that are scarce in dense metropolitan environments. Figure 6 presents the geographic characteristics of the data acquisition sites across Republic of Korea and includes example patches captured from both urban areas (Seoul and Incheon) and suburban areas (Jeju-Island).
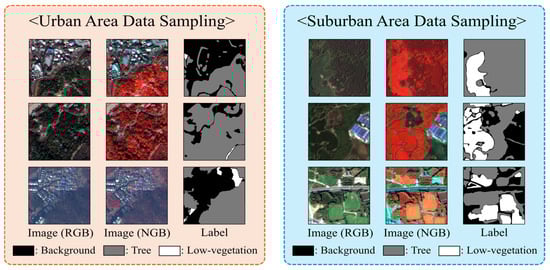
Figure 6.
Overview of the data acquisition areas and sample image patches.
Figure 7a presents the class distribution for each region. In the Incheon subset, Background pixels occupy approximately 81.35% of all pixels, followed by Tree with 13.77% and Low Vegetation with 4.88%. The Seoul subset shows a similar tendency, where Background covers 61.14% and Tree accounts for 35.31%, while Low Vegetation remains limited to only 3.55% because of the city’s highly urbanized landscape. In contrast, the Jeju subset contains a greater proportion of vegetation, with Tree accounting for 52.5%, Background for 32.55%, and Low Vegetation for 14.87%, reflecting the island’s well-preserved natural and agricultural environments.
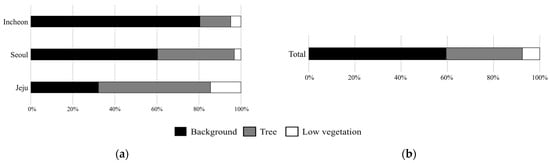
Figure 7.
Class distribution of the MultiVeg dataset: (a) per region (Seoul, Incheon, Jeju), and (b) overall proportions.
Figure 7b shows the overall class composition of the MultiVeg dataset. Background pixels constitute 59.01% of the total, Tree pixels account for 32.60%, and Low Vegetation pixels represent 8.39%. Although the Background class forms the majority, the inclusion of Jeju data considerably increased the proportion of Low Vegetation samples. This adjustment mitigated the class imbalance and enhanced both the representativeness and practical utility of the MultiVeg dataset.
4. Experiments and Results Analysis
4.1. Baseline Models
In this study, we evaluated the performance on the MultiVeg dataset using a diverse set of semantic segmentation models that represent both CNN-based and Transformer-based architectures. These models were originally developed in the computer vision field and have shown strong performance when applied to remote sensing imagery. Each model provides a unique approach to vegetation detection and segmentation depending on its architectural characteristics.
The CNN-based models used in this study include DeepLabV3+ [52], PSPNet [53], UPerNet [54], HRNet [55], and ConvNeXt [56]. DeepLabV3+ is a widely adopted model from the DeepLab series. It employs atrous convolution to effectively enlarge the receptive field and integrates an encoder–decoder structure that enables the extraction of multi-scale features. PSPNet introduces a pyramid pooling module to capture global contextual information from feature maps. By learning large-scale contextual relationships, PSPNet improves the ability to distinguish between complex classes in satellite images [57]. UPerNet extends the concept of pyramid pooling by applying it to the top-level features of the backbone and combines it with a feature pyramid network to integrate multi-scale contextual features. This structure allows UPerNet to utilize semantic information at multiple levels for more accurate segmentation. HRNet maintains multiple feature map resolutions in parallel and continuously exchanges information between them to preserve fine spatial details. This design provides superior pixel-level segmentation accuracy and makes HRNet particularly effective for delineating small-scale objects in high-resolution remote sensing imagery [58]. ConvNeXt is modernized CNN architecture inspired by the design principles of Vision Transformers (ViT). It incorporates large kernel depthwise convolutions, layer normalization, and GELU activation to bridge the performance gap between traditional CNNs and Transformers, achieving high performance while maintaining computation efficiency [59].
Transformer-based models were initially proposed in natural language processing to handle sequence-to-sequence tasks and are well known for their strength in modeling long-range dependencies through the self-attention mechanism. With advances in data availability and computational power, Transformer architectures have been successfully extended to computer vision and are now widely used in semantic segmentation [60,61,62,63,64]. The ViT divides an image into fixed-size patches and processes them as sequential tokens using self-attention to learn global contextual relationships [65]. It was the first model to apply a pure Transformer architecture to large-scale image recognition tasks. The Swin Transformer adopts a shifted window approach for self-attention, constructing hierarchical feature representations while maintaining computational efficiency [66]. This design enables the model to effectively learn both local and global context, making it well suited for dense prediction problems. SegFormer combines a hierarchical Transformer encoder with a lightweight multi-layer perceptron decoder, enabling efficient extraction and fusion of features across multiple spatial scales [67]. MIFNet incorporates both spatial and frequency-domain features using a hybrid U-Net and Transformer architecture to enhance robustness in high-resolution urban vegetation segmentation. By modeling global, local, and frequency information jointly, MIFNet effectively distinguishes spectrally similar vegetation classes under complex urban interference conditions [68].
In summary, CNN-based models are strong in local feature extraction and computational efficiency, whereas Transformer-based models excel at capturing global contextual information. By training and evaluating representative models from both families on the MultiVeg dataset, this study aims to validate the robustness and applicability of the dataset and to analyze how different architectural approaches perform in vegetation segmentation.
4.2. Evaluation Metrics
The performance of models on the MultiVeg dataset was evaluated using several accuracy metrics commonly applied in semantic segmentation. The primary evaluation measures include Overall Accuracy (OA), Mean Intersection over Union (mIoU), Mean F1-Score (mF1), and per-class IoU. OA represents the proportion of all pixels that are correctly classified and provides an intuitive measure of the model’s overall segmentation performance. However, OA is heavily influenced by the pixel distribution of each class in the dataset. When a dataset exhibits significant class imbalance in which one class occupies a large portion of all pixels, a model biased toward predicting the dominant class can still achieve a high OA, leading to an overestimation of segmentation performance. The MultiVeg dataset shows a similar imbalance due to the land cover characteristics of the study regions, which makes it difficult to fairly assess model performance using OA alone.
To overcome this limitation, segmentation studies commonly employ complementary evaluation metrics such as IoU and F1-Score. The mIoU is defined as the mean Intersection over Union computed for each class. It quantifies the overlap between the predicted segmentation and the ground truth and is widely recognized as a standard metric in segmentation research. The OA and class-wise IoU are calculated according to Equations (6) and (7).
where (True Positive) denotes the number of pixels that truly belong to a given class and are correctly predicted as that class, (False Positive) denotes the number of pixels that do not belong to a given class but are incorrectly predicted as that class, and (False Negative) represents the number of pixels that belong to one class but are incorrectly predicted as another. K denotes the total number of classes in the dataset, and i indicates each class index.
In addition to these measures, the mF1 is also employed. The F1-Score for each class is defined as the harmonic mean of Precision and Recall, and the mF1 is obtained by averaging the F1-Scores across all classes. Precision measures the proportion of pixels predicted as a specific class that belong to that class, while Recall measures the proportion of ground-truth pixels of a class that are correctly predicted. The F1-Score provides a balanced evaluation between Precision and Recall, preventing bias toward models that perform well in only one of these aspects. Because of its balanced formulation, the F1-Score is particularly useful for assessing performance on imbalanced datasets and has been widely adopted in previous studies. The use of mF1 enables a fairer evaluation of a model’s ability to detect minority classes such as low vegetation, which occupy relatively few pixels. Precision and Recall are formulated in Equation (8), and F1 and mF1 are defined in Equation (9). Using these complementary metrics enables a more reliable and balanced evaluation of model performance, even for imbalanced datasets.
4.3. Experimental Setup
In this paper, all experiments were conducted on a workstation equipped with two Intel(R) Xeon(R) Gold 5220 2.20GHz 18-core processors, 512 GB of RAM, and two NVIDIA GeForce RTX 4090 GPUs, running on Ubuntu 20.04 LTS. The models were implemented using PyTorch 2.1.0 with CUDA 12.1, and all training and evaluation were performed using the MMSegmentation framework [69], which provides standardized implementations of widely used segmentation models and pipelines. Although the framework supports the use of pretrained weights, we did not employ any pretrained models to ensure a fair comparison across architectures. In addition, to maintain fair and consistent performance evaluation, we trained all models using a unified set of hyperparameters. Specifically, we used a batch size of 8, an initial learning rate of 1 × 10⁻³ with the AdamW optimizer, and a weight decay of 1 × 10⁻⁴. Each model was trained for 150 epochs using image patches of 512 512 pixels.
To increase the diversity of vegetation samples and improve model generalization, we applied a set of geometric transformations during training. These transformations included horizontal and vertical flipping, small shifts, scaling, rotations, and weak elastic deformations. Additionally, light Gaussian noise and 3 × 3 Gaussian blur were applied with low probability to simulate mild sensor distortions without affecting spectral integrity. All transformations were performed in real time during training, ensuring that each training iteration used a newly transformed input while preserving the original dataset size.
4.4. Experimental Results
To establish a benchmark for the MultiVeg dataset, nine representative deep learning–based semantic segmentation models which is DeepLabV3+, HRNet, PSPNet, UPerNet, ConvNeXt, SegFormer, Swin Transformer, ViT, and MIFNet were compared under identical experimental conditions. All models used RGBN four-band imagery as input and were evaluated on the test set of MultiVeg. Table 5 summarizes the quantitative results in terms of OA, mIoU, mF1, mean Precision (mPrecision), and mean Recall (mRecall). Among all models, the Swin Transformer achieved the highest overall performance, recording an mIoU of 78.88%, mF1 of 87.58%, and OA of 92.33%. The ConvNeXt and ViT also achieved comparable performance, with mIoU of 78.81% and 77.93%, and mF1 of 87.56% and 87.49%, respectively. Among the models, SegFormer outperformed DeepLabV3+ by approximately 7 percentage points in mIoU, indicating that Transformer-based architectures are more effective in describing complex vegetation boundaries within urban environments. In contrast, DeepLabV3+ exhibited relatively lower accuracy, with an mIoU of 70.28% and an mF1 of 80.79%, highlighting the limitation of CNN architectures that rely heavily on local feature representations.
Table 5.
Performance comparison of semantic segmentation models trained with MultiVeg dataset.
Table 6 presents the class-wise IoU and F1-scores for the three main classes, which are Background, Tree, and Low Vegetation. Both Background and Tree classes achieved consistently high accuracies across all models, with IoU values above 80% and F1-scores exceeding 90%. In contrast, the Low Vegetation class showed substantially lower accuracy, with IoU around 55% and F1-scores near 70%, primarily due to class imbalance and spectrally similar sample between the vegetation areas in the MultiVeg dataset. The Low Vegetation class accounts for only 8.39% of all pixels, which likely limits the amount of data available for sufficient model training. Nevertheless, Transformer-based models achieved approximately 5 percentage points higher IoU for this class compared to CNN-based models. Notably, the Swin Transformer achieved a Low Vegetation IoU of 60.78%, showing a clear improvement over DeepLabV3+ (56.17%) and HRNet (52.18%). Interestingly, the CNN-based ConvNeXt model achieved performance comparable to the Swin Transformer and outperformed other Transformer-based models such as ViT and SegFormer. This result may be attributed to ConvNeXt’s architectural design, which incorporates several features inspired by Vision Transformers. For example, it employs large kernel depthwise convolutions and layer normalization, which enhance the model’s capacity to capture long-range dependencies and global contextual information, functioning similarly to the self-attention mechanism in Transformers.
Table 6.
Class-wise performance comparison of semantic segmentation models trained with MultiVeg dataset.
In comparison, MIFNet, despite being a hybrid model that combines CNN and Transformer components, did not achieve performance comparable to other Transformer-based models. Its relatively lower accuracy on the Low Vegetation class suggests that simply integrating Transformer-like modules is not sufficient the effectiveness depends on how global context modeling is operationalized within the architecture. In particular, the self-attention mechanism enables Transformers to dynamically weight non-local dependencies. This allows them to integrate spatially distant yet semantically correlated cues, an essential property for resolving vegetation boundaries where spectral and textural transitions are often subtle. These results collectively indicate that Transformer architectures are particularly advantageous for segmenting ambiguous vegetation boundaries in heterogeneous urban–forest environments.
In addition to the quantitative metrics presented earlier, a qualitative analysis was conducted to compare the visual quality of the segmentation results. Figure 8 presents qualitative comparisons of vegetation segmentation results generated by each model across various urban and suburban scenes, with black, gray, and white corresponding to Background, Tree, and Low Vegetation, respectively. All models produced segmentation maps that closely resembled the reference labels, indicating that they were successfully trained and that the MultiVeg dataset is suitable for learning vegetation segmentation tasks. For CNN-based models, however, insufficient capability was observed in representing fine details along object boundaries. In particular, in regions where trees and low vegetation are widely distributed (e.g., golf courses), several cases were observed where the central portions of such areas were incorrectly classified as background. These results suggest that CNN architectures have inherent limitations in representing continuous class distributions across spatially homogeneous regions. In contrast, Transformer-based models demonstrated superior visual quality compared with CNN-based counterparts. In particular, Swin Transformer and ViT achieved improved shape reconstruction of vegetation regions, especially in complex spatial contexts where spectral or textural ambiguity is present, resulting in fewer mis-segmentation within continuous vegetation areas. Overall, the qualitative analysis results are consistent with the quantitative findings reported in Table 5 and Table 6. Despite the inherent class imbalance of the dataset, models trained on MultiVeg were capable of accurately segmenting vegetation across diverse environments from narrow urban green spaces to broad suburban vegetation areas. These results demonstrate that the MultiVeg dataset provides a high-quality and reliable benchmark for vegetation segmentation research.
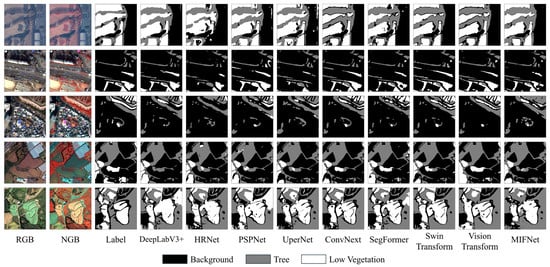
Figure 8.
Visual comparison of semantic segmentation models on the MultiVeg dataset.
5. Discussion
The experimental results presented in the previous section clearly demonstrate how various semantic segmentation models perform on the MultiVeg dataset. Overall, the model achieved high accuracy in the Tree and Background classes, but notable class-wise performance gaps were observed, leading to distinct regional differences in vegetation segmentation accuracy. This kind of discrepancies may primarily stem from class imbalance inherent in the MultiVeg dataset or from the temporal imbalance of satellite image acquisition. MultiVeg was constructed using KOMPSAT-3/3A imagery collected over approximately ten years, contributing to temporal diversity in the dataset. However, the image collection was not conducted on a regular schedule; only those images with minimal atmospheric interference (e.g., clouds, haze) and clear ground visibility were selected. As a result, some seasons may be overrepresented, and if seasonal vegetation characteristics are not adequately captured, models may become overly adapted to particular periods, potentially leading to seasonal performance variation.
To evaluate this possibility, we conducted seasonal performance analysis using four representative semantic segmentation models which are DeepLabV3+, PSPNet, Swin Transformer, and SegFormer. The test set, comprising 669 image patches, was divided by acquisition month into spring (March–May, 256 image patches), summer (June–August, 51 image patches), autumn (September–November, 106 image patches), and winter (December–February, 256 image patches). Performance was evaluated separately for each season. The results showed that all models achieved mIoU ≥ 70% and mF1-score ≥ 80% across all seasons, indicating robust segmentation performance regardless of seasonal variation. Notably, most models showed relatively higher performance in winter and spring, while the lowest mIoU was observed during the summer (Figure 9). As illustrated in Figure 10, this may be attributed to the vigorous growth of vegetation in summer, which leads to similar shapes and spectral characteristics across classes and makes boundary distinction more difficult. Additionally, the small number of summer image patches in the test set may have limited the robustness of model evaluation for that season. Nonetheless, seasonal performance variation was minimal, and consistent segmentation quality was observed across all seasons. These findings suggest that MultiVeg incorporates imagery from diverse seasons rather than being biased toward a specific period, enabling the training of vegetation segmentation models that are resilient to seasonal change.
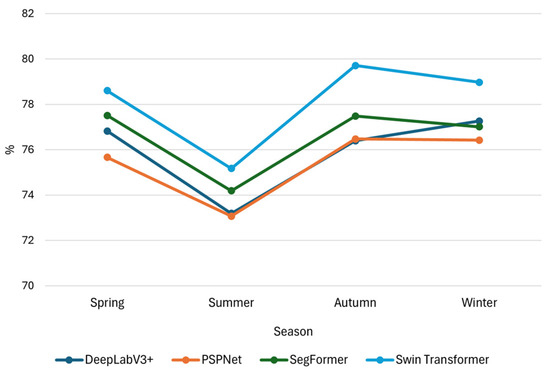
Figure 9.
Seasonal mIoU performance of four segmentation models.
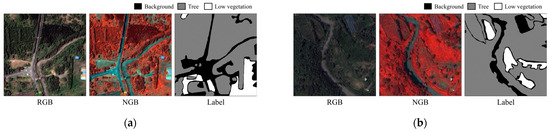
Figure 10.
Comparison between spring and summer scenes illustrating seasonal differences in vegetation separability: (a) Spring example with clearer structural contrast between Tree and Low Vegetation classes. (b) Summer example where dense and vigorous vegetation growth leads to similar shapes and spectral responses across classes, making boundary distinction more difficult.
Since seasonal variation has been shown to have a limited effect, the remaining major factor contributing to the performance gap is likely class imbalance. To further examine the influence of this imbalance, we conducted an additional experiment in which oversampling was applied only to patches containing more than 20 percent Low Vegetation pixels. Among the 6677 image patches in MultiVeg, 735 patches satisfied this criterion. These selected patches were augmented using various techniques, including geometric transformations such as rotation and flipping, as well as mild radiometric adjustments based on pixel value adjustment, generating a total of 3675 augmented patches. This procedure resulted in the construction of an oversampled MultiVeg dataset for comparative analysis. As shown in Table 7, the oversampled MultiVeg dataset exhibits a decreased proportion of the Background and Tree classes, while the Low Vegetation proportion increases from 8.39% to 16.53%, demonstrating a clear improvement in class balance. Using this oversampled MultiVeg dataset, the CNN-based models (PSPNet and DeepLabV3+) and Transformer-based models (Swin Transformer and SegFormer) employed in the main experiments were trained and evaluated to analyze the impact of class imbalance on segmentation performance. Performance differences were computed by subtracting the accuracy obtained on the original MultiVeg from that on the oversampled MultiVeg for each model, and the results are summarized in Table 8 to intuitively show the effect of oversampling.
Table 7.
Class distribution of the original MultiVeg and oversampled MultiVeg datasets.
Table 8.
Changes in IoU and F1-score (Δ = oversampled − original) for each model and class.
The analysis revealed that the Background and Tree classes showed only minimal changes, with variations in IoU and F1-score remaining within ±1 across all models. Deep learning models typically exhibit small performance changes between training runs because of nondeterministic factors such as random weight initialization and the stochastic composition of mini-batches. As a result, variation within this range falls into the normal training variance and cannot be regarded as a meaningful improvement attributable to oversampling. In contrast, the Low Vegetation class showed more noticeable gains, with IoU increasing by up to 2.08 percentage points. However, even this improvement remained modest. In addition, oversampling increased the size of the dataset by approximately 50%, which led to a substantial increase in training time and computational cost. Considering this additional cost, the observed improvement in Low Vegetation class performance provides limited practical benefits. Overall, these results suggest that the reduced accuracy for the Low Vegetation class in the original MultiVeg dataset cannot be explained solely by class imbalance.
Following the above analysis, it becomes evident that the reduced accuracy of the Low Vegetation class cannot be explained only by class imbalance. To further understand the underlying factors contributing to this difficulty, Figure 11 presents qualitative examples that illustrate the structure and spectral challenges inherent to Low Vegetation in urban environments. These examples are based on prediction results generated by the Swin Transformer, which achieved the highest overall accuracy among the models evaluated in this study. In several scenes, the spectral and textural characteristics of vegetation and non-vegetation surfaces were highly mixed, making it difficult for the model to distinguish between them (Figure 11a). In other cases, vegetation with low vitality exhibited spectral properties that were nearly indistinguishable from near non-vegetated areas (Figure 11b). These cases demonstrate that Low Vegetation often exhibits visual characteristics that overlap with nearby non-vegetated materials, which constrains segmentation performance regardless of class balance.
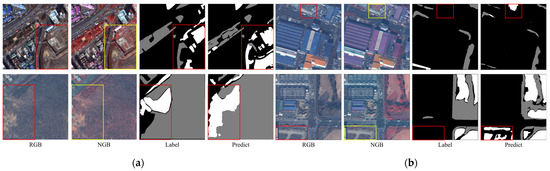
Figure 11.
Representative failure cases observed in the segmentation of the Low Vegetation class using the Swin Transformer: (a) Example of mis-segmentation in a complex urban environment due to similar texture and spectral characteristics between the Tree and Low vegetation classes, (b) Example of mis-segmentation caused by similar spectral characteristics between Background and Low Vegetation classes.
In contrast to urban areas, the Jeju Island images representing suburban environments within the MultiVeg dataset exhibited noticeably higher segmentation accuracy. As shown in Table 9, the results were obtained from a model trained on the combined dataset including Seoul, Incheon, and Jeju. Among the regions, Jeju achieved the best quantitative performance for the Low Vegetation class, with F1-score and IoU values of 75.00% and 60.00%, respectively, outperforming Incheon (68.35%, 51.91%) and Seoul (55.94%, 38.83%). This improvement can be attributed to Jeju’s landscapes that include extensive pastures and farmlands, where Low Vegetation samples are spatially well defined. Such suburban environments encompass diverse vegetation types, demonstrating that the MultiVeg dataset effectively captures the textural and radiometric characteristics of Low Vegetation, thereby enabling models to generalize and recognize this class more accurately. The prediction results further support this finding, showing that the shape and boundary of low-vegetation areas were accurately reconstructed in Jeju scenes, as also confirmed in the visual comparisons of Figure 12.
Table 9.
Regional performance comparison of the Swin Transformer trained on the MultiVeg Dataset.
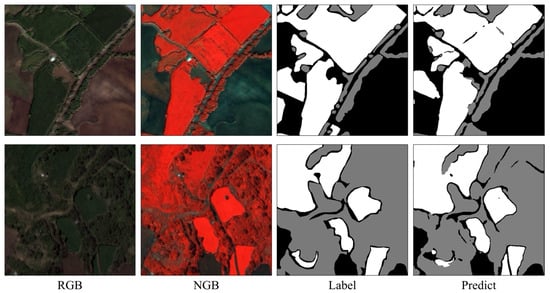
Figure 12.
Segmentation results in Jeju Island scenes using the Swin Transformer trained on the MultiVeg dataset.
In summary, the MultiVeg dataset encompasses a wide range of challenges for vegetation segmentation across urban and suburban environments, reflecting real-world issues such as class imbalance, complex boundaries, and heterogeneous backgrounds. The experimental findings of this study indicate that MultiVeg serves as a benchmark dataset that combines both structural complexity and practical scalability for urban vegetation segmentation, making it suitable for the training and evaluation of deep-learning-based models. Moreover, the regional diversity and class-wise representativeness of MultiVeg will provide an important reference for future research, facilitating the evaluation and comparison of model generalization performance in multi-class vegetation segmentation tasks.
6. Conclusions
In summary, this study introduced MultiVeg, a VHR multi-spectral dataset that fills a critical gap in multi-class vegetation segmentation research. By incorporating a decade of KOMPSAT-3 and 3A satellite imagery across urban, agricultural, and forested regions, MultiVeg provides a unique and comprehensive benchmark for segmenting vegetation in diverse real-world environments. The dataset’s 4-band imagery and expert annotations allow clearer differentiation between Trees and Low Vegetation than was previously possible with true-color data alone. Our benchmarking experiments further demonstrated that advanced Transformer-based models can leverage MultiVeg to achieve superior segmentation performance. In particular, the ability of Transformers to better detect the minority Low Vegetation class highlights the importance of global context modeling in addressing class imbalance and complex vegetation boundaries. These results underscore the significance of MultiVeg as a reliable dataset for improving vegetation mapping accuracy in both urban and natural landscapes.
The implications of this work are far-reaching for remote sensing and environmental monitoring. Researchers and practitioners can use MultiVeg to train robust deep learning models for tasks such as urban green space mapping, forest management, and agricultural monitoring, leading to more informed decision-making in ecosystem management. MultiVeg is expected to facilitate future studies on vegetation dynamics by enabling consistent evaluation of algorithms and fostering comparative research. Although MultiVeg offers valuable contributions, its current geographical scope is limited to regions within Republic of Korea due to the high acquisition cost of commercial VHR satellite imagery, which may restrict the global generalization performance of models trained on the dataset. Moreover, the current study evaluates model performance using a mixed training set across regions, which limits assessment of cross-regional generalizability. For future work, we plan to expand MultiVeg to broader geographic regions, design regionally separated experiments to evaluate generalization capability, and introduce finer vegetation categories, further enhancing its utility. Additionally, exploring new deep learning approaches including data augmentation strategies and specialized architectures could further improve segmentation performance for underrepresented classes like Low Vegetation. Leveraging MultiVeg’s multi-temporal span for change detection and trend analysis is another promising direction. Through these efforts, the MultiVeg dataset will continue to evolve and support the development of next-generation vegetation mapping techniques.
Author Contributions
Conceptualization, C.L. and Y.H.; methodology, C.L. and Y.H.; software, C.L.; validation, C.L.; formal analysis, C.L.; investigation, C.L. and J.L.; data curation, C.L., J.L. and H.L.; writing—original draft preparation, C.L.; writing—review and editing, A.J., M.C., Y.H. and C.L.; visualization, C.L. and H.L.; supervision, Y.H.; funding acquisition, T.K. All authors have read and agreed to the published version of the manuscript.
Funding
This work was supported by the Satellite Data Applications (No. 2800000853) project of the Korea Aerospace Research Institute (KARI) and by the National Research Foundation of Korea (NRF) grant funded by the Korean government (Ministry of Science and ICT) (No. 2021R1A2C2093671).
Data Availability Statement
The data presented in this study are available in the GitHub repository at https://github.com/pang914/MultiVeg (accessed on January 2026) and through the Remote Sensing Image Processing Laboratory website at Seoul National University of Science and Technology (https://sites.google.com/view/rsip/home, accessed on January 2026).This repository contains the MultiVeg dataset used for multi-class vegetation segmentation in very high-resolution satellite imagery, as described in this article.
Acknowledgments
The authors would like to thank anonymous reviewers for their helpful comments and suggestions, which significantly improved the quality of our paper.
Conflicts of Interest
The authors declare no conflicts of interest.
References
- Gonzalez, P.; Neilson, R.P.; Lenihan, J.M.; Drapek, R.J. Global patterns in the vulnerability of ecosystems to vegetation shifts due to climate change. Glob. Ecol. Biogeogr. 2010, 19, 755–768. [Google Scholar] [CrossRef]
- Zhang, L.; Yang, L.; Zohner, C.M.; Crowther, T.W.; Li, M.; Shen, F.; Guo, M.; Qin, J.; Yao, L.; Zhou, C. Direct and indirect impacts of urbanization on vegetation growth across the world’s cities. Sci. Adv. 2022, 8, eabo0095. [Google Scholar] [CrossRef]
- Gao, Y.; Skutsch, M.; Paneque-Gálvez, J.; Ghilardi, A. Remote sensing of forest degradation: A review. Environ. Res. Lett. 2020, 15, 103001. [Google Scholar] [CrossRef]
- Susca, T.; Gaffin, S.R.; Dell’Osso, G. Positive effects of vegetation: Urban heat island and green roofs. Environ. Pollut. 2011, 159, 2119–2126. [Google Scholar] [CrossRef] [PubMed]
- Janhäll, S. Review on urban vegetation and particle air pollution–Deposition and dispersion. Atmos. Environ. 2015, 105, 130–137. [Google Scholar] [CrossRef]
- Kowe, P.; Mutanga, O.; Dube, T. Advancements in the remote sensing of landscape pattern of urban green spaces and vegetation fragmentation. Int. J. Remote Sens. 2021, 42, 3797–3832. [Google Scholar] [CrossRef]
- Li, J.; Pei, Y.; Zhao, S.; Xiao, R.; Sang, X.; Zhang, C. A review of remote sensing for environmental monitoring in China. Remote Sens. 2020, 12, 1130. [Google Scholar] [CrossRef]
- Wu, B.; Zhang, M.; Zeng, H.; Tian, F.; Potgieter, A.B.; Qin, X.; Yan, N.; Chang, S.; Zhao, Y.; Dong, Q. Challenges and opportunities in remote sensing-based crop monitoring: A review. Natl. Sci. Rev. 2023, 10, nwac290. [Google Scholar] [CrossRef] [PubMed]
- Mora, A.; Santos, T.M.; Łukasik, S.; Silva, J.M.; Falcão, A.J.; Fonseca, J.M.; Ribeiro, R.A. Land cover classification from multispectral data using computational intelligence tools: A comparative study. Information 2017, 8, 147. [Google Scholar] [CrossRef]
- Nguyen, H.T.T.; Doan, T.M.; Radeloff, V. Applying random forest classification to map land use/land cover using Landsat 8 OLI. Int. Arch. Photogramm. Remote Sens. Spat. Inf. Sci. 2018, 42, 363–367. [Google Scholar] [CrossRef]
- Su, T. An improved unsupervised image segmentation evaluation approach based on under-and over-segmentation aware. ISPRS Ann. Photogramm. Remote Sens. Spat. Inf. Sci. 2018, 4, 197–204. [Google Scholar] [CrossRef]
- Cheng, J.; Deng, C.; Su, Y.; An, Z.; Wang, Q. Methods and datasets on semantic segmentation for Unmanned Aerial Vehicle remote sensing images: A review. ISPRS J. Photogramm. Remote Sens. 2024, 211, 1–34. [Google Scholar] [CrossRef]
- Huang, L.; Jiang, B.; Lv, S.; Liu, Y.; Fu, Y. Deep-learning-based semantic segmentation of remote sensing images: A survey. IEEE J. Sel. Top. Appl. Earth Obs. Remote Sens. 2023, 17, 8370–8396. [Google Scholar] [CrossRef]
- LeCun, Y.; Bengio, Y.; Hinton, G. Deep learning. Nature 2015, 521, 436–444. [Google Scholar] [CrossRef]
- Adegun, A.A.; Viriri, S.; Tapamo, J.-R. Review of deep learning methods for remote sensing satellite images classification: Experimental survey and comparative analysis. J. Big Data 2023, 10, 93. [Google Scholar] [CrossRef]
- Chen, H.; Yang, W.; Liu, L.; Xia, G.-S. Coarse-to-fine semantic segmentation of satellite images. ISPRS J. Photogramm. Remote Sens. 2024, 217, 1–17. [Google Scholar] [CrossRef]
- Alkan, M. Information content analysis from very high resolution optical space imagery for updating spatial database. Int. Arch. Photogramm. Remote Sens. Spat. Inf. Sci. 2018, 42, 25–31. [Google Scholar] [CrossRef]
- Alkan, M.; Yilmaz, O.; Buyuksalih, G.; Gazioglu, C.; Jacobsen, K. Mapping Contents Analysis of WorldView-2 VHR Satellite Imagery Using Cadastral Information. Int. Arch. Photogramm. Remote Sens. Spat. Inf. Sci. 2025, 48, 31–36. [Google Scholar] [CrossRef]
- Sun, X.; Wang, P.; Yan, Z.; Xu, F.; Wang, R.; Diao, W.; Chen, J.; Li, J.; Feng, Y.; Xu, T. FAIR1M: A benchmark dataset for fine-grained object recognition in high-resolution remote sensing imagery. ISPRS J. Photogramm. Remote Sens. 2022, 184, 116–130. [Google Scholar] [CrossRef]
- Chiu, M.T.; Xu, X.; Wei, Y.; Huang, Z.; Schwing, A.G.; Brunner, R.; Khachatrian, H.; Karapetyan, H.; Dozier, I.; Rose, G. Agriculture-vision: A large aerial image database for agricultural pattern analysis. In Proceedings of the IEEE/CVF Conference on Computer Vision and Pattern Recognition, Seattle, WA, USA, 13–19 June 2020; pp. 2828–2838. [Google Scholar]
- Qi, X.; Zhu, P.; Wang, Y.; Zhang, L.; Peng, J.; Wu, M.; Chen, J.; Zhao, X.; Zang, N.; Mathiopoulos, P.T. MLRSNet: A multi-label high spatial resolution remote sensing dataset for semantic scene understanding. ISPRS J. Photogramm. Remote Sens. 2020, 169, 337–350. [Google Scholar] [CrossRef]
- Sykas, D.; Sdraka, M.; Zografakis, D.; Papoutsis, I. A sentinel-2 multiyear, multicountry benchmark dataset for crop classification and segmentation with deep learning. IEEE J. Sel. Top. Appl. Earth Obs. Remote Sens. 2022, 15, 3323–3339. [Google Scholar] [CrossRef]
- Qu, F.; Sun, Y.; Zhou, M.; Liu, L.; Yang, H.; Zhang, J.; Huang, H.; Hong, D. Vegetation land segmentation with multi-modal and multi-temporal remote sensing images: A temporal learning approach and a new dataset. Remote Sens. 2023, 16, 3. [Google Scholar] [CrossRef]
- Shi, S.; Zhong, Y.; Liu, Y.; Wang, J.; Wan, Y.; Zhao, J.; Lv, P.; Zhang, L.; Li, D. Multi-temporal urban semantic understanding based on GF-2 remote sensing imagery: From tri-temporal datasets to multi-task mapping. Int. J. Digit. Earth 2023, 16, 3321–3347. [Google Scholar] [CrossRef]
- Demir, I.; Koperski, K.; Lindenbaum, D.; Pang, G.; Huang, J.; Basu, S.; Hughes, F.; Tuia, D.; Raskar, R. Deepglobe 2018: A challenge to parse the earth through satellite images. In Proceedings of the IEEE Conference on Computer Vision and Pattern Recognition Workshops, Salt Lake City, UT, USA, 18–22 June 2018; pp. 172–181. [Google Scholar]
- Boguszewski, A.; Batorski, D.; Ziemba-Jankowska, N.; Dziedzic, T.; Zambrzycka, A. LandCover. ai: Dataset for automatic mapping of buildings, woodlands, water and roads from aerial imagery. In Proceedings of the IEEE/CVF Conference on Computer Vision and Pattern Recognition, Nashville, TN, USA, 20–25 June 2021; pp. 1102–1110. [Google Scholar]
- Wang, J.; Zheng, Z.; Ma, A.; Lu, X.; Zhong, Y. LoveDA: A remote sensing land-cover dataset for domain adaptive semantic segmentation. arXiv 2021, arXiv:2110.08733. [Google Scholar]
- Xia, J.; Yokoya, N.; Adriano, B.; Broni-Bediako, C. Openearthmap: A benchmark dataset for global high-resolution land cover mapping. In Proceedings of the IEEE/CVF Winter Conference on Applications of Computer Vision, Waikoloa, HI, USA, 2–7 January 2023; pp. 6254–6264. [Google Scholar]
- Xue, J.; Su, B. Significant remote sensing vegetation indices: A review of developments and applications. J. Sens. 2017, 2017, 1353691. [Google Scholar] [CrossRef]
- Montero, D.; Aybar, C.; Mahecha, M.D.; Martinuzzi, F.; Söchting, M.; Wieneke, S. A standardized catalogue of spectral indices to advance the use of remote sensing in Earth system research. Sci. Data 2023, 10, 197. [Google Scholar] [CrossRef] [PubMed]
- Picon, A.; Bereciartua-Perez, A.; Eguskiza, I.; Romero-Rodriguez, J.; Jimenez-Ruiz, C.J.; Eggers, T.; Klukas, C.; Navarra-Mestre, R. Deep convolutional neural network for damaged vegetation segmentation from RGB images based on virtual NIR-channel estimation. Artif. Intell. Agric. 2022, 6, 199–210. [Google Scholar] [CrossRef]
- Knipling, E.B. Physical and physiological basis for the reflectance of visible and near-infrared radiation from vegetation. Remote Sens. Environ. 1970, 1, 155–159. [Google Scholar] [CrossRef]
- Sadeghi-Tehran, P.; Virlet, N.; Sabermanesh, K.; Hawkesford, M.J. Multi-feature machine learning model for automatic segmentation of green fractional vegetation cover for high-throughput field phenotyping. Plant Methods 2017, 13, 103. [Google Scholar] [CrossRef]
- Rottensteiner, F.; Sohn, G.; Jung, J.; Gerke, M.; Baillard, C.; Benitez, S.; Breitkopf, U. The ISPRS benchmark on urban object classification and 3D building reconstruction. In Proceedings of the ISPRS Annals of the Photogrammetry, Remote Sensing and Spatial Information Sciences, Melbourne, Australia, 25 August–1 September 2012. [Google Scholar]
- Alemohammad, H.; Booth, K. LandCoverNet: A global benchmark land cover classification training dataset. arXiv 2020, arXiv:2012.03111. [Google Scholar]
- Toker, A.; Kondmann, L.; Weber, M.; Eisenberger, M.; Camero, A.; Hu, J.; Hoderlein, A.P.; Şenaras, Ç.; Davis, T.; Cremers, D. Dynamicearthnet: Daily multi-spectral satellite dataset for semantic change segmentation. In Proceedings of the IEEE/CVF Conference on Computer Vision and Pattern Recognition, New Orleans, LA, USA, 18–24 June 2022; pp. 21158–21167. [Google Scholar]
- Tong, X.-Y.; Xia, G.-S.; Zhu, X.X. Enabling country-scale land cover mapping with meter-resolution satellite imagery. ISPRS J. Photogramm. Remote Sens. 2023, 196, 178–196. [Google Scholar] [CrossRef]
- Volpi, M.; Ferrari, V. Semantic segmentation of urban scenes by learning local class interactions. In Proceedings of the IEEE Conference on Computer Vision and Pattern Recognition Workshops, Boston, MA, USA, 7–12 June 2015; pp. 1–9. [Google Scholar]
- Basu, S.; Ganguly, S.; Mukhopadhyay, S.; DiBiano, R.; Karki, M.; Nemani, R. Deepsat: A learning framework for satellite imagery. In Proceedings of the 23rd SIGSPATIAL International Conference on Advances In geographic Information Systems, Bellevue, WA, USA, 3–6 November 2015; pp. 1–10. [Google Scholar]
- Yun, Y.R.; Kim, T.H.; Oh, J.H.; Han, Y.K. Analysis of Co-registration Performance According to Geometric Processing Level of KOMPSAT-3/3A Reference Image. Korean J. Remote Sens. 2021, 37, 221–232. [Google Scholar]
- Laben, C.A.; Brower, B.V. Process for Enhancing the Spatial Resolution of Multispectral Imagery Using Pan-Sharpening. US Patent No. 6011875, 4 January 2000. [Google Scholar]
- Liao, L.; Liu, W.; Liu, S. Effect of bit depth on cloud segmentation of remote-sensing images. Remote Sens. 2023, 15, 2548. [Google Scholar] [CrossRef]
- Mahbod, A.; Schaefer, G.; Löw, C.; Dorffner, G.; Ecker, R.; Ellinger, I. Investigating the impact of the bit depth of fluorescence-stained images on the performance of deep learning-based nuclei instance segmentation. Diagnostics 2021, 11, 967. [Google Scholar] [CrossRef]
- Pang, S.; Zeng, W.; Shi, Y.; Zuo, Z.; Xiao, K.; Wu, Y. RPFusionNet: An Efficient Semantic Segmentation Method for Large-Scale Remote Sensing Images via Parallel Region–Patch Fusion. Remote Sens. 2025, 17, 2158. [Google Scholar] [CrossRef]
- Wada, K. Labelme: Image Polygonal Annotation with Python, v4.6.0; Zenodo: Geneva, Switzerland, 2021. [Google Scholar]
- Yang, F.; Zamzmi, G.; Angara, S.; Rajaraman, S.; Aquilina, A.; Xue, Z.; Jaeger, S.; Papagiannakis, E.; Antani, S.K. Assessing inter-annotator agreement for medical image segmentation. IEEE Access 2023, 11, 21300–21312. [Google Scholar] [CrossRef]
- Ong, R.; Sun, J.; Șerban, O.; Guo, Y.-K. TKGQA dataset: Using question answering to guide and validate the evolution of temporal knowledge graph. Data 2023, 8, 61. [Google Scholar] [CrossRef]
- Cohen, J. A coefficient of agreement for nominal scales. Educ. Psychol. Meas. 1960, 20, 37–46. [Google Scholar] [CrossRef]
- Fleiss, J.L. Measuring nominal scale agreement among many raters. Psychol. Bull. 1971, 76, 378. [Google Scholar] [CrossRef]
- Okwuashi, O.; Isong, M.; Eyo, E.; Eyoh, A.; Nwanekezie, O.; Olayinka, D.N.; Udoudo, D.O.; Ofem, B. GIS cellular automata using artificial neural network for land use change simulation of Lagos, Nigeria. J. Geogr. Geol. 2012, 4, 94–101. [Google Scholar] [CrossRef]
- Tiwari, A.K.; Pal, A.; Kanchan, R. Mapping and Monitoring of Land Use/Land Cover Transformation Using Geospatial Techniques in Varanasi City Development Region, India. Nat. Environ. Pollut. Technol. 2024, 23, 365–379. [Google Scholar] [CrossRef]
- Chen, L.-C.; Zhu, Y.; Papandreou, G.; Schroff, F.; Adam, H. Encoder-decoder with atrous separable convolution for semantic image segmentation. In Proceedings of the European Conference on Computer Vision (ECCV), Munich, Germany, 8–14 September 2018; pp. 801–818. [Google Scholar]
- Zhao, H.; Shi, J.; Qi, X.; Wang, X.; Jia, J. Pyramid scene parsing network. In Proceedings of the IEEE Conference on Computer Vision and Pattern Recognition, Honolulu, HI, USA, 21–26 July 2017; pp. 2881–2890. [Google Scholar]
- Xiao, T.; Liu, Y.; Zhou, B.; Jiang, Y.; Sun, J. Unified perceptual parsing for scene understanding. In Proceedings of the European Conference on Computer Vision (ECCV), Munich, Germany, 8–14 September 2018; pp. 418–434. [Google Scholar]
- Sun, K.; Xiao, B.; Liu, D.; Wang, J. Deep high-resolution representation learning for human pose estimation. In Proceedings of the IEEE/CVF Conference on Computer Vision and Pattern Recognition, Long Beach, CA, USA, 15–20 June 2019; pp. 5693–5703. [Google Scholar]
- Liu, Z.; Mao, H.; Wu, C.-Y.; Feichtenhofer, C.; Darrell, T.; Xie, S. A convnet for the 2020s. In Proceedings of the IEEE/CVF Conference on Computer Vision and Pattern Recognition, New Orleans, LA, USA, 18–24 June 2022; pp. 11976–11986. [Google Scholar]
- Yang, H.; Yu, B.; Luo, J.; Chen, F. Semantic segmentation of high spatial resolution images with deep neural networks. GIScience Remote Sens. 2019, 56, 749–768. [Google Scholar] [CrossRef]
- Bai, J.; Jia, C.; Yu, S.; Sun, L.; Zhang, L.; Chang, Z.; Hou, A. Building Extraction from High-Resolution Remote Sensing Images Using Improved HRNet Method. In Proceedings of the IGARSS 2024—2024 IEEE International Geoscience and Remote Sensing Symposium, Athens, Greece, 7–12 July 2024; pp. 7982–7985. [Google Scholar]
- Karunasri, G.; Martha, S.; Bijalwan, V. Hybrid ConvNeXt-Liquid Neural Network for Satellite Image Classification: A Benchmark on EuroSAT Dataset. IEEE Trans. Geosci. Remote Sens. 2025, 63, 5645211. [Google Scholar] [CrossRef]
- Panboonyuen, T.; Jitkajornwanich, K.; Lawawirojwong, S.; Srestasathiern, P.; Vateekul, P. Transformer-based decoder designs for semantic segmentation on remotely sensed images. Remote Sens. 2021, 13, 5100. [Google Scholar] [CrossRef]
- He, X.; Zhou, Y.; Zhao, J.; Zhang, D.; Yao, R.; Xue, Y. Swin transformer embedding UNet for remote sensing image semantic segmentation. IEEE Trans. Geosci. Remote Sens. 2022, 60, 4408715. [Google Scholar] [CrossRef]
- Wang, H.; Chen, X.; Zhang, T.; Xu, Z.; Li, J. CCTNet: Coupled CNN and transformer network for crop segmentation of remote sensing images. Remote Sens. 2022, 14, 1956. [Google Scholar] [CrossRef]
- Wang, L.; Li, R.; Duan, C.; Zhang, C.; Meng, X.; Fang, S. A novel transformer based semantic segmentation scheme for fine-resolution remote sensing images. IEEE Geosci. Remote Sens. Lett. 2022, 19, 6506105. [Google Scholar] [CrossRef]
- Ma, X.; Zhang, X.; Pun, M.-O.; Liu, M. A multilevel multimodal fusion transformer for remote sensing semantic segmentation. IEEE Trans. Geosci. Remote Sens. 2024, 62, 5403215. [Google Scholar] [CrossRef]
- Dosovitskiy, A.; Beyer, L.; Kolesnikov, A.; Weissenborn, D.; Zhai, X.; Unterthiner, T.; Dehghani, M.; Minderer, M.; Heigold, G.; Gelly, S. An image is worth 16x16 words: Transformers for image recognition at scale. arXiv 2020, arXiv:2010.11929. [Google Scholar]
- Liu, Z.; Lin, Y.; Cao, Y.; Hu, H.; Wei, Y.; Zhang, Z.; Lin, S.; Guo, B. Swin transformer: Hierarchical vision transformer using shifted windows. In Proceedings of the IEEE/CVF International Conference on Computer Vision, Montreal, QC, Canada, 10–17 October 2021; pp. 10012–10022. [Google Scholar]
- Xie, E.; Wang, W.; Yu, Z.; Anandkumar, A.; Alvarez, J.M.; Luo, P. SegFormer: Simple and efficient design for semantic segmentation with transformers. Adv. Neural Inf. Process. Syst. 2021, 34, 12077–12090. [Google Scholar]
- Fan, J.; Li, J.; Liu, Y.; Zhang, F. Frequency-aware robust multidimensional information fusion framework for remote sensing image segmentation. Eng. Appl. Artif. Intell. 2024, 129, 107638. [Google Scholar] [CrossRef]
- Contributors, M. MMSegmentation: OpenMMLab Semantic Segmentation Toolbox and Benchmark; GitHub: San Franciso, CA, USA, 2020. [Google Scholar]


Disclaimer/Publisher’s Note: The statements, opinions and data contained in all publications are solely those of the individual author(s) and contributor(s) and not of MDPI and/or the editor(s). MDPI and/or the editor(s) disclaim responsibility for any injury to people or property resulting from any ideas, methods, instructions or products referred to in the content. |
© 2025 by the authors. Licensee MDPI, Basel, Switzerland. This article is an open access article distributed under the terms and conditions of the Creative Commons Attribution (CC BY) license.