Review

Passive Microwave Imagers, Their Applications, and Benefits: A Review

1
Center for Hydrometeorology and Remote Sensing (CHRS), Department of Civil and Environmental Engineering, The Henry Samueli School of Engineering, University of California, Irvine, CA 92697, USA
2
Center for Western Weather and Water Extremes, Scripps Institution of Oceanography, University of California, San Diego, CA 92093, USA
3
Center for Satellite Applications and Research, National Environmental Satellite, Data, and Information Service, National Oceanic and Atmospheric Administration, College Park, MD 20740, USA
4
Earth System Science Interdisciplinary Center, University of Maryland, College Park, MD 20740, USA
5
NOAA Office of Low Earth Observations, National Oceanic and Atmospheric Administration, Greenbelt, MD 20770, USA
6
Department of Earth System Science, University of California, Irvine, CA 92697, USA
*
Author to whom correspondence should be addressed.
Remote Sens. 2025, 17(9), 1654; https://doi.org/10.3390/rs17091654
Submission received: 18 March 2025 / Revised: 29 April 2025 / Accepted: 3 May 2025 / Published: 7 May 2025

Abstract

:
Passive Microwave Imagers (PMWIs) aboard meteorological satellites have been instrumental in advancing the understanding of Earth’s atmospheric and surface processes, providing invaluable data for weather forecasting, climate monitoring, and environmental research. This review examines the relevance, applications, and benefits of PMWI data, focusing on their practical use and benefits to society rather than the specific techniques or algorithms involved in data processing. Specifically, it assesses the impact of PMWI data on Tropical Cyclone (TC) intensity and structure, global precipitation and extreme events, flood prediction, the effectiveness of tropical storm and hurricane watches, fire severity and carbon emissions, weather forecasting, and drought mitigation. Additionally, it highlights the importance of PMWIs in hydrometeorological and real-time applications, emphasizing their current usage and potential for improvement. Key recommendations from users include expanding satellite networks for more frequent global coverage, reducing data latency, and enhancing resolution to improve forecasting accuracy. Despite the notable benefits, challenges remain, such as a lack of direct research linking PMWI data to broader societal outcomes, the time-intensive process of correlating PMWI use with measurable societal impacts, and the indirect links between PMWI and improved weather forecasting and disaster management. This study provides insights into the effectiveness and limitations of PMWI data, stressing the importance of continued research and development to maximize their contribution to disaster preparedness, climate resilience, and global weather forecasting.

1. Introduction

This review primarily examines the applications of Passive Microwave Imager (PMWI) data across various domains, rather than focusing on technical methodologies or algorithms. It highlights the significant role of PMWIs aboard satellites in advancing the understanding of Earth’s atmospheric and surface processes. Operating in the microwave region of the electromagnetic spectrum and observing brightness temperatures (Tbs) to monitor atmospheric water subsistence and surface variables over ocean and land [1], PMWI sensors provide critical data for weather forecasting [2,3,4], climate monitoring [5], and environmental research [6].
Key programs and organizations such as the Defense Meteorological Satellite Program (DMSP) by the Department of Defense (DOD) [7], the National Aeronautics and Space Administration (NASA) through the Global Precipitation Measurement (GPM) mission [1,8], the Japan Aerospace Exploration Agency (JAXA) with its Global Change Observation Mission—Water (GCOM-W) [9], the National Oceanic and Atmospheric Administration (NOAA) with its Joint Polar Satellite System (JPSS) [10], the Indian Space Research Organisation (ISRO) and French Centre National d’Etudes Spatiales (CNES) with the Megha-Tropiques satellite [11], and the China Meteorological Administration (CMA) with its Fengyun (FY) satellite series have been at the forefront of deploying PMWI technology [12].
The journey of PMWIs began in 1968 with the launch of a PMWI sensor by the Soviet Union. A significant leap in this technology came with NASA’s Nimbus-5 and Nimbus-6 satellites, which carried the Electrically Scanning Microwave Radiometer (ESMR) in 1972 and 1975 [1,8]. This was followed by the deployment of the Scanning Multichannel Microwave Radiometer (SMMR) on Nimbus-7 and SeaSat-1 in 1978 and the Special Sensor Microwave Imager (SSM/I) in 1987 as part of the DMSP. These early sensors laid the foundation for current PMWIs, providing valuable data on Sea Surface Temperatures (SSTs), wind stress, snow cover, and rainfall rates. The subsequent Special Sensor Microwave Imager/Sounder (SSMIS) series, starting with DMSP-F16 in 2004, expanded the frequency range and applications, covering atmospheric temperature, moisture, and surface parameters [13]. More detailed information about all existing PMWIs is provided in Table 1.
PMWIs have found a wide array of applications in monitoring and understanding various environmental phenomena [14,15,16,17,18,19,20,21,22,23,24,25]. For instance, the Advanced Microwave Scanning Radiometer for Earth Observing System (AMSR-E) aboard NASA’s Aqua satellite has provided crucial data on precipitation intensity, SST, sea ice cover, soil moisture, and wind speed since 2002. Similarly, the Tropical Rainfall Measuring Mission (TRMM) launched by NASA and JAXA in 1998 and its successor, the GPM mission in 2014, have been instrumental in enhancing precipitation estimates [26,27,28]. In parallel, EUMETSAT’s Meteorological Operational Satellite-Second Generation B series (Metop-SG-B) will carry the Ice Cloud Imager (ICI) and Microwave Imager (MWI) by 2026. The MWI will provide data on precipitation intensity at the surface, sea ice cover, and near-surface wind speed, while the ICI will focus on cloud characteristics and parameters. Meanwhile, JAXA’s GCOM-W1 satellite, launched in 2012, carries the Advanced Microwave Scanning Radiometer 2 (AMSR2), operating at frequencies from 6.925 GHz to 89.0 GHz, providing precipitation, SST, soil moisture, and wind speed products [29,30]. Additionally, the JPSS serves NOAA’s requirements by supporting the delivery of ocean products, including normalized water-leaving radiances from the AMSR2 instrument on GCOM-W, to provide global environmental data and enhance the understanding and prediction of changes in weather, climate, oceans, and coasts [10].
Moreover, recent missions such as the Weather System Follow-on Microwave (WSF-M) and the upcoming Global Observation SATellite for Greenhouse gases and Water cycle (GOSAT-GW) are expected to further expand the capabilities of PMWI technology. These missions will operate at multiple frequencies, allowing for more detailed and accurate observations of atmospheric and surface parameters. Looking ahead, the launch of WSF-M1 in April 2024 and the planned launches of WSF-M2 in 2028, along with GOSAT-GW in ≥2025 carrying the Advanced Microwave Scanning Radiometer 3 (AMSR3), promise to continue the legacy of PMWI technology. These future missions are poised to provide even more comprehensive data, enhancing the ability to monitor and predict weather and climate phenomena [31,32,33].
Consistent and accurate PMWI products are essential for advancing the understanding of Earth’s atmospheric and surface processes, improving weather forecasting, climate monitoring, and environmental research. Furthermore, these advancements yield significant societal benefits, including improved observation of rain and snow, more reliable winter weather forecasts, better flood and wildfire management, sustainable marine resource monitoring, and enhanced tracking and prediction of Tropical Cyclones (TCs) [34,35,36,37,38,39]. PMWI products complement Infrared (IR) retrievals by providing unique insights into atmospheric moisture profiles, precipitation, and surface characteristics under cloud-covered conditions where IR methods may have limitations. Despite their importance, challenges such as inconsistencies in data usage, limited accessibility, and gaps in the literature limit their broader application. Understanding these issues is important to fully realize the potential impacts of PMWI data in areas such as agricultural management, industrial operations, disaster preparedness, and resilience planning.
As a result, this review, along with a survey, was conducted by the Center for Hydrometeorology and Remote Sensing (CHRS) at UC Irvine in collaboration with expert users and the general public. It provides an analysis of the relevance, applications, and societal implications of PMWI data, highlighting their critical role in meteorological and hydrological applications. Additionally, it offers valuable insights into the current usage, limitations, impacts, and potential improvements for PMWI data. By identifying key areas for improvement, this review aims to guide future developments and investments in PMWI technologies, ensuring their sustained value for both scientific advancements and society.
The rest of this review discusses the applications and benefits of PMWI technology, particularly in the context of its societal impacts. It highlights the historical development and advancements of PMWIs, emphasizes their critical roles in environmental monitoring and disaster management, and presents findings from a recent survey that capture the perspectives of expert users and the general public. By examining these aspects, this review seeks to underscore the importance of PMWIs in improving weather forecasting, climate monitoring, and the overall understanding of atmospheric and surface processes, while also addressing the limitations and potential improvements for future implementations.
The remainder of this paper is structured as follows: Section 2 explores PMWI applications and impact areas, covering various aspects such as applications and benefits, including TCs and hurricanes, global precipitation and extreme events, fire severity and carbon emissions, Numerical Weather Prediction (NWP), the cryosphere, sea surface conditions, and soil moisture and drought. It also examines the impact areas of PMWIs within the National Weather Service (NWS). Section 3 discusses the applications, benefits, and societal impacts of PMWIs. This paper then summarizes key findings from the survey and related discussions in Section 4. Finally, the conclusion, Section 5, highlights the main insights and suggests directions for future research.

2. PMWI Applications and Impact Areas

PMWI data are essential for a broad spectrum of applications, ranging from forecasting TCs and hurricanes to analyzing extreme precipitation, floods, and fire severity, as well as estimating carbon emissions. They also support NWP models and play an important role in monitoring the cryosphere, sea surface conditions, soil moisture, and droughts. NWS is a primary user of PMWI data, utilizing them to enhance weather forecasts, improve precipitation estimates, and refine flood modeling. These applications underscore the significance and multifaceted utility of PMWI data. The following subsections delve into these applications and their far-reaching impacts, further highlighting the adaptability and value of PMWI data in addressing critical environmental and societal challenges.

2.1. Applications and Benefits of PMWIs

Satellite-based PMWIs have become indispensable tools in environmental monitoring and disaster management. These sensors provide unique insights into various atmospheric and surface processes by operating in the microwave region of the electromagnetic spectrum, typically ranging from 6 GHz to 190 GHz. The ability to penetrate clouds and capture data under all weather conditions makes PMWIs especially valuable in observing and understanding natural phenomena such as TCs and hurricanes, extreme precipitation and floods, fires, and storms. For example, Figure 1 illustrates the precipitation rates from all available microwave sensors in the Integrated Multi-satellite Retrievals for GPM (IMERG) products, captured on 26 September 2024, during Tropical Storm Helene. IMERG data leverage information from a variety of sources including several PMWIs, such as GPM Microwave Imager (GMI), AMSR2, and SSMIS [40].
The following subsections highlight some applications of PMWI technology as examples, emphasizing the significance of the PMWI frequency bands and citing relevant references to underscore the impact of this technology in advancing the understanding of the Earth’s environment.

2.1.1. TCs and Hurricanes

Different parameters, including waves and currents at the ocean surface, play roles in forecasting TC intensity, and understanding TC intensity changes is an observationally challenging problem [41]. However, in recent years, there have been improvements in TC intensity guidance [42,43,44,45,46,47]. PMWIs are critical in monitoring and forecasting winds, TCs, and hurricanes. PMWI data are a crucial source of satellite analysis due to their capacity to observe storm rainbands, eyewalls, shear effects, and low-level circulations [14]. These observations enhance the accuracy of forecasting models, leading to improved preparedness, and response strategies. Various TC datasets have been developed using PMWI to further advance the understanding of TC patterns and disaster management. For instance, two datasets, namely a Secondary Eyewall (SE) eye-labeled dataset and an SE progression dataset, were developed using PMWI for SE evolution and progressions observed in numerous TCs [15]. Microwave Imagery from the Naval Research Laboratory Tropical Cyclones (NRL-TC) collection, commonly known as MINT, includes Tb from DMSP SSM/I and SSMIS, TRMM Microwave Imager (TMI), and Aqua AMSR-E. The dataset is developed using SSM/I sensors on the DMSP F8-F15 satellites, which operate at the 37.0 GHz and 85.5 GHz bands, and SSMIS sensors on the DMSP F16-F18 satellites, which operate at 37.0 GHz and 91.7 GHz [48]. These sensors are operated by the DOD-NOAA and provide vital data on Maximum Sustained Wind (MSW) speeds, which are crucial for assessing storm intensity. The data from TRMM TMI, which operates at 37.0 GHz and 85.5 GHz, and Aqua AMSR-E, which operates at 36.5 GHz and 89.0 GHz, are also key to developing this dataset [48]. Furthermore, TMI data from Goddard Space Flight Center (GSFC) and SSM/I data from the Global Hydrology Resource Center (GHRC) at 19 GHz and 37 GHz (for average and maximum concentration of rainfall), 22 GHz (water vapor), and 85 GHz (precipitation ice) are used for hurricane intensity prediction [49]. The Tropical Cyclone Precipitation, Infrared, Microwave, and Environmental Dataset (TC PRIMED) is another dataset that utilizes TMI, GMI, SSM/I, and SSMIS to monitor precipitation from TCs [50]. Moreover, NOAA uses data from AMSR2 to estimate hurricane intensity through the Hurricane Severity Index (HSI) [51]. The Cooperative Institute for Research in the Atmosphere (CIRA) also uses microwave data from instruments such as the AMSR2 to estimate hurricane intensity and predict hurricane paths [52].

2.1.2. Global Precipitation and Extreme Events

Precipitation (rain and snowfall) retrievals [22,53,54,55,56] benefit from using PMWI due to their superior spatial resolution compared to sounders, which enables more accurate and detailed precipitation measurements and improves flood forecasting. Additionally, SMMR, SSM/I, SSMIS, and AMSR-E sensors have been pivotal in detecting flood occurrence signals and dynamic surface water fractions. The gridded Passive Microwave (PMW) Earth System Data Record (ESDR)—a part of the NASA Making Earth System Data Records for Use in Research Environments (MEaSUREs) program—provides data derived from the mentioned PMWIs [57]. Additionally, surface soil moisture retrievals obtained from the TMI X-band (10.7 GHz) radiometer, along with the TRMM TMI surface SOIL Moisture dataset generated from the Land Parameter Retrieval Model (LPRM_TMI_SOILM2), are used for forecasting storm-event-scale runoff ratios, which are used for flood forecasting [58]. AMSR2, GMI, and SSMIS at different frequencies are also utilized for rainfall rate and accumulation estimates during extreme precipitation events for studying floods [59]. Figure 2 shows the GPM Core Observatory (GPM-CO) observations of a storm over the Carolina coastlines.
Moreover, IMERG [1] and TRMM Multi-satellite Precipitation Analysis (TMPA) datasets are Level 3 products that blend Level 2 precipitation data from different satellites and sensors to provide precipitation data, including from GMI and TMI PMWIs, which are useful for flood discharge estimation and near-real-time flood forecasting [60]. Climate Prediction Center MORPHing technique 2 (CMORPH2) is another Level 3 dataset that merges Level 2 precipitation data from a constellation of satellites, including PMWIs, and provides global satellite-based precipitation analyses with 0.05° by 0.05° and 30 min spatial and temporal resolution [61,62]. The channels at frequencies above 150 GHz are preferred for detecting precipitation areas, and channels at 89 GHz and 150 GHz are considered the two most crucial features for precipitation retrieval. Therefore, future precipitation imagers that incorporate a broad range of these high-frequency channels will enhance measurement precision. By leveraging the precise precipitation rate information obtained from various PMW sensors, researchers and forecasters can better assess flood risks, estimate flood discharge, and facilitate near-real-time flood forecasting [62]. The timely data obtained from PMWI sensors are instrumental in early warning systems, significantly reducing the impact of floods on affected communities [63].
The use of PMWI data to estimate snow cover and snow water equivalent started in the late 1970s [21]. With the advent of PMW high-frequency channels (150 GHz and higher), the sensitivity to snowfall microphysics has improved, and these channels are more commonly used for snow retrieval [20,22,28,53]. Other PMWIs such as the AMSR-E aboard NASA’s Aqua satellite, operating across multiple frequency bands from 6.9 GHz to 89 GHz, are instrumental in monitoring land surface temperatures during strong snowstorms and disasters. Furthermore, this sensor operates at 36.5 GHz and 89 GHz frequencies and provides crucial data for understanding the dynamics of hail formation and distribution and snowfall retrieval, being important for studying storms, particularly hailstorms. Moreover, the X-band (approximately 10 GHz) gained popularity for studying deep snow conditions, particularly since the launch of AMSR-E in 2002 [21]. Another example usage of PMWI data is the Snow Retrieval Algorithm for GMI (SLALOM) and NESDIS snowfall rate products, both of which use PMWI data as part of their input [20,22,53,64]. The data acquired from PMWI sensors are crucial for understanding the dynamics of snowstorms, facilitating better forecasting and response strategies to mitigate their impact [65]. Additionally, data from TRMM TMI further enhance the ability to analyze storm characteristics. Utilizing resources and datasets from the National Snow and Ice Data Center (NSIDC), these sensors offer valuable insights into storm behavior, aiding in predicting and mitigating severe weather events [65,66].

2.1.3. Fire Severity and Carbon Emission

Tb observations from AMSR-E and AMSR-E/2 sensors at 6.925, 10.65, and 18.7 GHz aboard NASA’s Aqua satellite provide valuable information due to their capability to estimate soil moisture and Vegetation Optical Depth (VOD) [17,18]. Additionally, the 36.5 GHz frequency aids in effective temperature estimation and is a valuable tool in assessing fire severity and carbon emissions estimations [17,18]. Additional sensors such as SMMR (6.6 GHz, 10.7 GHz, 18 GHz, and 37 GHz), SSM/I (19.3 GHz and 36.5 GHz), and TMI (10.7 GHz, 19.4 GHz, and 37 GHz) play a vital role in constructing a comprehensive global soil moisture dataset [67]. Another dataset, called GlobScar, is derived from observations made by the Along Track Scanning Radiometer (ATSR-2) instrument aboard the European Space Agency (ESA) European Remote Sensing Satellite-2 (ERS-2) satellite. GlobScar is instrumental in detecting biomass and assessing burnt areas globally [68]. Moreover, the Modern-Era Retrospective Analysis for Research and Applications, version 2 (MERRA-2), produced by NASA’s Global Modeling and Assimilation Office (GMAO), incorporates PMWI data, including instruments like SSM/I, SSMIS, and WindSat, for estimating surface wind speed [4]. This information is critical for managing and mitigating the effects of wildfires, contributing to better environmental conservation and safety practices.

2.1.4. NWP

Currently, NWPs are the state of the art in forecasts ranging more than a few hours into the future, and they are a core component of early warning systems [3]. To initiate NWP models, data assimilation methods are used to combine satellite observations, conventional observations, and short-range forecasts to assess the initial state of the atmosphere [19]. A great example of the use of microwave data in NWP models is the European Center for Medium-Range Weather Forecast (ECMWF) and NOAA National Centers for Environmental Prediction Global Forecast System (NCEP GFS) model [2,19,69]. As of now, the volume of satellite observations by far exceeds other data types used in NWPs [2], and among them, microwave observations have the highest overall impact on the quality of the final product [3,19]. This is mostly related to the ability of microwave instruments to gather information in cloudy conditions. The benefits of microwave data vary with location, with the highest benefits in locations with sparse on-site observations [3]. For instance, microwave observations provide a higher benefit over the Northern Hemisphere compared to the Southern Hemisphere [3]. Additionally, ECMWF reported that denial of microwave data in NWP models would be equivalent to losing 2–4 years of technological advances in NWP models. Most importantly, ECMWF reported that almost 40% of improvement in short-range forecast skill is associated with PMW observations from sounders and imagers, and removing these data causes the largest loss of skill compared to other satellite data. Lawrence et al. reported a relative Forecast Sensitivity to observation Impact (FSOI) of 3% for microwave Arctic observations for ECMWF [19]. Eyre et al. reported a FSOI value of around 27% for microwave sounders and imagers in the Met Office global NWP system for August–October 2019 [70]. Additionally, the authors reported that through data denial experiments, denial of microwave sounder and imager data in the Met Office global NWP system for the period of August–November 2019 resulted in the biggest performance loss compared to both observations and ECMWF analysis [70]. In addition, Pu et al. evaluated the effect of incorporating GPM GMI clear-sky radiance into the track and intensity forecasts of two Atlantic hurricanes during the 2015 and 2016 hurricane seasons. They used the Hurricane Weather Research and Forecasting (HWRF) Model, which is based on the NOAA NCEP GFS. The forecast results indicated that assimilating GMI clear-sky radiance positively influences both track and intensity forecasts, with the impact varying depending on the phase of hurricane development [71]. Moreover, Bi et al. assessed the forecast impact of WindSat data in the NCEP GFS and reported that integrating National Environmental Satellite, Data, and Information Service (NESDIS) Coriolis WindSat improves the forecast at mid-latitudes and in the tropics [72]. Furthermore, Ota et al. applied an Ensemble Kalman Filter (EnKF) to estimate 24 h forecast impacts of assimilated observations, including wind data from WindSat. This approach that was implemented with NCEP GFS EnKF quantified the overall positive effects of assimilated data, highlighting the significance of satellite radiance observations, particularly for moisture variables [73].

2.1.5. Cryosphere

PMWIs are essential tools for monitoring cryospheric conditions, including snow cover, sea ice concentration, and ice sheet dynamics. Their ability to penetrate clouds and operate at night enables long-term and consistent observations in polar regions. These measurements are essential for tracking seasonal and interannual changes in ice and snow, supporting hydrological modeling, climate monitoring, and understanding of polar processes [20].
The cryosphere is a vital source of freshwater for the world’s population. It also plays a crucial role in Earth’s climate due to its high albedo. However, most of the cryosphere exists in places where obtaining on-site measurements is difficult, which emphasizes the need to use spaceborne instruments for its detection. Due to PMW instruments’ continuous presence over polar regions, a long-term dataset is available, making them ideal for cryosphere-related climate studies at the poles [20,74]. For example, NASA’s NSIDC Distributed Active Archive Center (NSIDC DAAC) maintains the AMSR Unified collection, which includes data from PMWIs such as AMSR-E sensors aboard NASA’s Aqua satellite (launched on 2 May 2002, and ceased operations on 4 December 2011) and AMSR-2 sensors aboard JAXA’s GCOM-W1 satellite. These PMW data products provide valuable information on snow, sea ice, and soil moisture in polar regions. The dataset includes horizontally (H) and vertically (V) polarized Tbs at 18.7 GHz, 23.8 GHz, 36.5 GHz, and 89.0 GHz, along with key cryospheric variables such as sea ice concentration, sea ice concentration difference, and snow depth. As an example, Figure 3 illustrates the daily average ice concentration with a nominal spatial resolution of 12.5 km over the Northern and Southern Hemispheres on 1 January 2025, as obtained from the Land Atmosphere Near Real-Time Capability for EOS (LANCE) AMSR2 sensors.
Additionally, the polarization of these instruments is useful in determining sea ice edges, as liquid water is more polarized and less emissive than ice [21,74]. PMWIs have been used extensively to study the cryosphere, including sea ice extent and thickness and glacier dynamics [75]. Much of what is currently known about the large-scale variability of global sea ice cover has been derived from data provided by satellite microwave sensors [76]. PMWI, like ESMR operating at 19.35 GHz aboard Nimbus-5 in 1972, was among the first to observe global sea ice, with the spatial resolution providing unprecedented daily coverage in polar regions without gaps [76,77]. Furthermore, more recent PMWIs, such as the Copernicus Imaging Microwave Radiometer (CIMR), AMSR-E, AMSR-2, SSM/I, SSMIS, and SMMR, have been extensively utilized to derive critical sea ice parameters (e.g., Arctic sea ice extent and thickness) [76,77]. For instance, EUMETSAT’s Ocean and Sea Ice Satellite Application Facility (OSI SAF) Global Low Resolution Sea Ice Drift (GBL LR SIDR) and Global Sea Ice Concentration (GBL SICO) product uses AMSR2 and SSMIS data to differentiate between ice and water based on their emissivity signatures [78]. The OSI SAF GBL LR SIDR also uses Tbs from AMSR-E and AMSR2 from 37 GHz channels, SSM/I from 85 GHz channels, and SSMIS from 91 GHz channels as part of its input [79], which can be used in NWPs and ocean ice models. Moreover, PMW instruments are capable of distinguishing between multi-year ice and first-year ice; this is because multi-year ice has lower emissivity that declines at higher frequencies, because of the air pockets formed during summer melts [21,74]. Finally, another area of PMWI application in the cryosphere is sea ice motion, which started with the use of SSMI data to monitor large-scale motion patterns in the late 1990s [79].

2.1.6. Sea Surface

PMWIs play a crucial role in estimating ocean surface wind speeds by measuring the roughness of the sea surface. They help in the accurate retrieval of wind speed data by detecting variations in the ocean’s surface caused by wind, which is essential for climate monitoring and weather prediction [80]. Currently, data from SSM/I, TMI, GMI, AMSR-E, SSMIS, AMSR2, and GMI are aggregated to create a PMWI-derived ocean 10 m wind speed climate data record called the MultiSensor Advanced Climatology of Liquid Water Path (MAC-LWP) [23]. Additionally, as part of the NASA MEaSUREs project, the Cross-Calibrated Multi-Platform (CCMP) project combines inter-calibrated 10 m ocean surface wind retrievals from multiple satellite microwave sensors—including PMWIs such as TRMM TMI, DMSP-F8 SSM/I, DMSP-F10 SSM/I, DMSP-F11 SSM/I, DMSP-F13 SSM/I, DMSP-F14 SSM/I, DMSP-F15 SSM/I, DMSP-F16 SSMIS, DMSP-F17 SSMIS, Aqua AMSR-E, GCOM-W1 AMSR2, GPM GMI, and Coriolis WindSat. It also incorporates data from active sensors on Metop-A and Metop-B, along with a background field from ERA5 10 m Neutral Stability winds. The wind retrievals, produced by Remote Sensing Systems (RSSs), include data from most of the wind-sensing U.S., Japanese, and European satellites flown to date [81]. Figure 4 illustrates the monthly mean ocean surface wind for December 2024, derived by combining 10 m wind retrievals from satellite microwave sensors—including PMWIs such as DMSP-F16 SSMIS, DMSP-F17 SSMIS, DMSP-F18 SSMIS, GCOM-W1 AMSR-E, and GPM GMI.
Building on these advancements in wind retrieval, it is also important to consider the role of ocean surface emissivity in remote sensing. Wind speed influences the emissivity of the ocean surface and horizontally polarized channels, while SST primarily affects vertically polarized channels [82]. Notably, PMWIs have been widely applied in studying SST, which is vital for climate monitoring—a task made feasible only through satellite remote sensing [83]. The first space-based microwave radiometer capable of measuring SST was the SMMR [84,85], and the high-quality PMW SST record began in 1997 with the launch of TRMM TMI (10 GHz channel), followed by GMI [86,87,88,89]. The first globally accurate PMW SST data, derived from the 6 GHz channels, became available in 2002 through the AMSR-E [90,91], which was followed by AMSR2 on the GCOM-W1, launched in May 2012 [90]. A follow-up mission to AMSR2, known as AMSR3, is planned by JAXA, while the ESA is developing the CIMR, which includes radiometer channels at 1.4, 6.9, 10.7, 18.7, and 36.6 GHz. CIMR is a polar mission designed to provide all-weather, high-resolution, and high-accuracy sub-daily observations of SST as its primary variables [77,92,93]. PMW SST estimates obtained using the 6.9 and 10.7 GHz channels typically have a spatial sampling of approximately 10 km, a resolution ranging from 50 to 60 km, and an uncertainty of around 0.4 °C [80,94,95,96] that is primarily due to mismatches in the timing and location of observations, variations in measurement depth, and errors in both satellite estimates and in situ observations [83]. Moreover, the spatial resolution of SST retrievals is limited, meaning that a larger antenna is necessary to achieve a higher spatial resolution. AMSR3 has capabilities nearly identical to those of AMSR2, but with the added inclusion of high-frequency channels at 166 and 183 GHz. Enhancing the spatial resolution of measurements from the 6.9 and 10.7 GHz channels and also identifying the role of different channel combinations could significantly improve PMW SST estimates and increase their information content in global products and regional analysis systems [83].
Another example of using microwaves to retrieve sea surface parameters is the Compact Ocean Wind Vector Radiometer (COWVR) instrument. The primary goal of COWVR was to assess the performance of its simpler sensor design compared to more complex instruments like WindSat and determine whether this simplified design could match WindSat’s wind vector performance [97]. In a comparison, Alsweiss et al. evaluated WindSat and COWVR across their shared channels and concluded that both instruments demonstrate a strong wind direction signal, enabling COWVR data to retrieve Ocean Surface Vector Winds (OSVWs) with accuracy comparable to WindSat. Moreover, they reported that COWVR shows greater sensitivity to wind direction at wind speeds exceeding 14 m/s. However, it should be noted that the authors conducted an indirect comparison between WindSat and COWVR data, as COWVR was launched a year after WindSat’s operation ended [98]. Beyond wind direction and speed retrievals, COWVR data have also been successfully combined with TEMPEST Tb into the NRL Ocean Surface Flux System (NFLUX) to produce swath-level ocean surface air temperature and specific humidity for clear and cloudy conditions [97].

2.1.7. Soil Moisture and Drought

Microwave sensors are extremely useful for retrieving soil moisture information from near surface layers of the Earth, offering quantitative measurements of water content within a shallow surface layer, specifically at 1 to 10 GHz frequencies [99,100]. At the L-band (1.4 GHz), the soil moisture within the top few centimeters of soil has a substantial effect on the observed Tb, with approximately a 2 Kelvin (K) change for every 1% increase in volumetric soil moisture over bare soil [100]. L-band microwaves are one of the most promising remote sensing techniques for monitoring soil moisture over land surfaces at large scales since they are not sensitive to the effects of the Earth’s atmosphere and clouds [101]. Another satellite equipped with an L-band sensor is the Soil Moisture and Ocean Salinity (SMOS) satellite, launched in November 2009. It carries the Microwave Imaging Radiometer using Aperture Synthesis (MIRAS), as shown in Table 1 [25]. Similarly to SMOS, NASA’s Soil Moisture Active Passive (SMAP) radar, launched in January 2015, has used an L-band radiometer to measure soil moisture starting in July 2015, thus ensuring more precise monitoring and measurements [102]. In contrast, most currently used sensors operate at frequencies above 10 GHz. For instance, the SMMR on Nimbus-7 used frequencies of 6.6 GHz and higher [103], the SSM/I operated at frequencies of 19 GHz and above [104], the AMSR-E aboard the Aqua satellite covers frequencies from 6.9 to 89 GHz [105], and WindSat operates between 6.8 and 37 GHz [106].
The NOAA Soil Moisture Operational Product System (SMOPS) integrates soil moisture data from multiple satellite platforms, including SMAP, Metop-B, Metop-C, GCOM-W, and GPM. It combines observations from various sources, including PMWIs such as AMSR2, GMI, and the SMAP L-band radiometer, as well as active sensors and optical data. As an example, Figure 5 illustrates the blended soil moisture distribution on 11 January 2025, derived from these datasets.
Using these soil moisture retrievals, studies have explored applications such as improving precipitation estimation, creating blended soil moisture products, and reconstructing soil moisture time series [25,107,108]. Another crucial use for these retrievals is for drought assessment; for example, Zhang and Jia used precipitation data from TRMM, land surface temperature, and soil moisture data derived from AMSR-E to compute a drought index called the Microwave Integrated Drought Index (MIDI) [109]. Other studies utilize merged satellite precipitation products that have PMWI data integrated in them to compute Standardized Precipitation Indices (SPIs), indicators for assessing drought [110].

2.2. Impact Areas of PMWIs Within the NWS

The NWS is one of the principal users of PMWI data. PMWI data allow the NWS to improve weather forecasts and precipitation estimates. The NWS uses conical-scanning PMWI data for precipitation estimation and other surface applications [111]. PMWI data, along with PMW sounder data and temperature records, allow the NWS to accurately forecast severe weather events, such as TCs and winter storms. Furthermore, these data are used for flood modeling and forecasting [111]. Specifically, the NWS National Water Center (NWC) is the principal user of the NESDIS flood products, which include Low Earth Orbit (LEO) satellite observations. Additionally, the NWS uses the Global Multisensor Automated Snow and Ice Mapping System (GMASI) as part of the global NWP model to accurately characterize snow and ice cover [111]. The GMASI algorithm inputs visible (VS), IR, and microwave spectral bands (such as Level 1 products from AMSR2, GMI, and Advanced Very High-Resolution Radiometer (AVHRR)) to generate daily snow and ice cover global maps [54,111].
As previously mentioned, one of the NWS applications of PMWI data is precipitation estimation. The NWS’s Climate Prediction Center (CPC) utilizes Level 2 precipitation products from PMWIs (e.g., SSMIS, AMSR2, and GMI) to generate precipitation estimates, such as CMORPH2 [62]. The NWS produces a global precipitation product leveraging the algorithms of Ferraro, Ferraro et al., and Kummerow et al. for SSM/I, TMI, SSMIS, and GMI [55,56,62,112]. Various applications underscore the importance of PMWI data in enhancing forecasting capabilities while also highlighting their potential societal impact. This impact varies across different applications of PMWI data, and further research is needed to fully quantify its extent.

3. The Applications, Benefits, and Impacts of PMWIs on Society

The societal benefits and impacts of PMWIs are significant, as they contribute to a range of sectors, including disaster management and environmental and climate change monitoring. In the context of this review, societal value and impact refer to the effects on people’s lives and their communities, as well as the potential economic consequences of extreme weather events. This section will explore the value of PMWIs for a variety of applications in greater detail, along with the challenges in measuring it.
The impact of PMWI observations varies depending on their application. PMWI data are widely used to analyze and understand TCs, flooding, extreme precipitation (rain and snowfall), wildfires, drought, weather variability, and climate change. TCs are destructive events that pose a risk to people’s lives every year. From 1980 to August 2023, TCs resulted in a death toll of 6890 and caused substantial financial damage, with an average cost of USD 22.8 billion per event in the United States (U.S.) alone [113]. A notable example is the 2020 Atlantic hurricane season, which marked the fifth consecutive year of above-average hurricane activity, with 30 storms [36]. Globally, TCs have cost USD 1.4 trillion and have killed approximately 779,000 individuals in the period from 1972 to 2022 [36]. Welker and Faust conducted a study of the Western North Pacific to assess which countries in the area experienced the most deaths and economic losses from 1980 to 2008, as this area is frequently affected by TCs. The study found that the highest death toll occurred in the Philippines, with an average of 115 fatalities per TC, while the highest economic loss was in China, with approximately USD 0.9 billion per TC [37]. Bakkensen and Mendelsohn stated that damages vary depending on whether the storm impacts urban or rural areas [114]. Damage and fatalities do not necessarily increase with population density, as urban areas often have better protective measures, strategies, and plans in place. Additionally, in wealthier countries, damage increases gradually with rising income and TC intensity. The study also found significant regional variations in TC damages, with the U.S. accounting for 60% of global damages annually, a figure that could rise to 84% by 2100. Their model suggested that the U.S. is the most vulnerable to the impacts of TCs due to climate change [114]. Additionally, Whitehead stated that mandatory evacuations along the East Coast and Gulf Coast of the U.S. cost approximately USD 1 million per mile. Moreover, Gulati et al. stated that due to the high concentration of expensive equipment in the U.S. military bases, a TC impact can cause damages of up to USD 2 billion. For instance, in 2018, Hurricane Florence and Hurricane Michael struck Camp Lejeune and Tyndall Air Force Base, respectively, costing the U.S. military billions of dollars in rebuilding costs and resulting in the loss of an F-22 fighter jet [115]. The proactive measures taken by the DoD, such as employing the TC Conditions of Readiness (TC-CORs) system, highlight the importance of predictive measures and warnings in mitigating the impact of severe weather events associated with TCs [42,115].
Spaceborne instruments that include PMWIs have great potential to enhance track and intensity forecasts for TCs [45,46,116]. Table 2 provides information about the applications of GMI data. For instance, Skofronick-Jackson et al. stated that GMI data significantly improved TC forecasting, beginning with the 2014 Atlantic hurricane season [38]. Specifically, the Tbs from GMI are assimilated into NWP models to forecast TCs more accurately and correct their tracks. Other applications of GMI data are also included in Table 2. Furthermore, GMI is being used to develop a near-real-time global flood monitoring system, which allows for timely flood detection and estimates of intensity, streamflow, and inundation [38]. This has positive impacts, which have yet to be fully quantified, in the form of more accurate TC warnings, saved lives, and the mitigation of financial damages. Floods are also destructive events that cause significant harm to both human lives and the economy. The 2020 summer monsoon flood in China is another example of the most expensive disaster, causing USD 35 billion in damages [117]. Even though damages from flooding can be extensive, there are a few issues when assessing their impacts.
It should be noted that county-level data on property and crop damages in the U.S. suffer from inconsistencies and aggregation issues, which makes them unusable for comparing damages over time. Furthermore, comparing and merging values from different databases is not advised, as there is no standardized way to measure and report the effects of flooding [129]. Samsuddin et al. identify four types of methods for socioeconomic assessments of flooding: the historical disaster statistics method, the index system method, scenario-simulation analysis, and Geographic Information System (GIS)-based approaches. However, socioeconomic assessments of flooding have not yet been conducted on a national scale; instead, they have been limited to small regional scales. While no comprehensive assessments provide the annual financial cost of flooding in the U.S., Earth observations have proven beneficial in addressing these impacts [39].
Winds, waves, and storm surges are among the deadliest and most expensive natural disasters, particularly affecting low-lying regions [47]. Sea transport handles 80% of global goods trade by quantity, with 62,100 vessels transporting 11 billion tons annually [130]. Extreme winds and waves, especially when combined with adverse currents, can impact the ships’ stability. Figure 6 shows the summary of annual sea container losses reported by the World Shipping Council (WSC) [131]. It was estimated that regardless of correct container weight, proper packing of the cargo into the container, and proper securing and stowage aboard ship, there were on average 1629 containers lost at sea each year due to factors ranging from severe weather and rough seas to more catastrophic and rare events like structural failures, ship groundings, and collisions. This is a significant increase (18%) compared to the average annual loss for the 12 years ending in 2019 (see Figure 6). Furthermore, it was reported that the high number of containers lost in 2013 was due to adverse weather in June 2013, which caused the container ship “MOL Comfort” to break in two in the Indian Ocean during its voyage from Singapore to Jeddah [132], and significant loss occurred in 2020 when the ONE Opus lost more than 1800 containers due to severe weather [131].
At the same time, a high sea state can indirectly impact the well-being and effectiveness of the crew [47]. Timely data and frequent updates are crucial for accurately forecasting storm surge levels, as demonstrated by the significant surge in Venice in November 2019, which was greatly underestimated [133]. Consequently, numerical prediction models typically combine wind, wave, and storm surge forecasts by utilizing improved wind data from satellite observations through data assimilation, thereby improving accuracy, as shown by [134]. The coastal zone, serving as the interface between land and sea, harbors a significant portion of the world’s population and activities [135]. This concentration makes coastal areas crucial for various societal, economic, and ecological services. Mitigating the expensive consequences of flooding or the loss of vital infrastructure requires precise knowledge of the dynamic state of the coast, and with projected increases in coastal populations, it becomes increasingly vital to monitor variables influencing coastal hazards using satellite-based tools for effective coastal management [47]. Traditional methods such as land-based, ship-based, and airborne surveys provide highly accurate bathymetric measurements. Still, they are limited by their suitability for small areas and face logistical challenges and high costs [136]. On the other hand, space-based techniques offer a convenient and cost-effective means of gathering continuous and synoptic bathymetric data, especially in hazardous or remote regions. This enables the rapid sampling and assessment of storm impacts on individual-event timescales, facilitating timely interventions.
As previously mentioned, PMWI data are valuable for forecasting intense winter storms. These weather extremes have a short but significant effect on the economy, with utilities, construction, hospitality, and retail being the most heavily affected [137]. A way in which PMWI data can have a positive impact on society and the economy in this application is by improving winter weather forecasts. For example, Snyder quantified the economic value of winter weather forecasts using two different criteria over Indiana, finding a range of winter weather forecast values from USD 4.1 million to USD 29.1 million [34]. Between 1980 and 2017, 14 billion-dollar winter storms in the U.S. caused damages worth USD 43.9 billion, resulting in 1013 deaths [138]. During this same period, 355 winter weather disasters globally caused 19,000 deaths, emphasizing the need for timely and accurate forecasts. Lazo et al. also estimated the impact of weather storms in the aviation sector, quantifying a storm’s cost in January 2016 in New York City, which led to 2420 weather-related flight cancellations incurring costs of USD 13.2 million for the airlines and USD 30.1 million for the passengers [138]. Additionally, a similar analysis for the energy sector during the same storm revealed that about 30,700 customers lost power for about 4.8 h, costing USD 14.7 million.
The study of wildfires is another important area where PMWI data are applied. Wildfires have substantial negative impacts, not only endangering lives but also causing damage to infrastructure and natural resources. Furthermore, these events threaten people’s livability since they negatively impact the agriculture and tourism industries [139]. Wildfires have extremely high suppression costs that have risen from USD 240 million in 1985 to USD 3.5 billion in 2022, according to the National Interagency Fire Center (NIFC). The cost of wildfires varies depending on geographical location; Chuvieco et al. developed a global wildfire vulnerability product and noted that the financial losses related to houses vary around the world, from 38 USD/m2 in Madagascar to 56,603 USD/m2 in Monaco [140]. Diaz reported that the 1998 Florida wildfire cost USD 880 million (1864 USD/acre), and the 2013 San Diego wildfires had a cost of USD 2.45 billion (6516 USD/acre), resulting in the loss of 24 commercial buildings. The monetary losses in the tourism industry were approximately USD 32.5 million and led to the unemployment of 5000 individuals, amounting to a 10% loss in gross productivity [139]. However, wildfires can also yield positive outcomes when fire suppression and rebuilding initiatives are performed locally. Under such circumstances, the area may witness a surge in economic activity related to rehabilitation efforts, which should not be mistaken for genuine economic growth [139].
PMWI data are also helpful for studying and assessing droughts [141]. Droughts have profound social and environmental impacts, often leading to non-market losses that are rarely explored in the scientific literature [142,143]. An example is Riebsame et al., who estimated the total cost of the 1988 drought across agriculture, transportation, power generation, recreation, commerce, and industry to be USD 39.2 billion [144]. However, Ding et al. questioned this value, as it did not account for federal disaster aid and crop insurance or the producer’s gains due to the increased prices of goods [142]. Howitt et al. estimated that the 2015 drought in California had a total economic impact of USD 2.7 billion while 21,000 jobs were lost. This value included direct losses, including USD 900 million in crop revenue loss, USD 350 million in dairy and livestock revenue loss, and USD 590 million in pumping costs [145]. In a similar study, Medellín-Azuara et al. reported that the 2016 drought in California had a total economic impact of USD 603 million and 4700 employment losses. The monetary losses caused by this drought included direct losses worth USD 247 million in crop revenue losses and USD 303 million in pumping costs [146].
When evaluating the impacts of natural disasters, it is important to recognize that, while these events are predominantly associated with negative consequences, they may also have positive aspects. For instance, a drought that raises the prices of goods in one region can attract goods from another, potentially offsetting the adverse effects at a national scale [142,147,148]. Conversely, improved forecasting skills, which reduce the economic losses of affected parties, might also diminish the gains of others in different regions, potentially neutralizing the net effect at a national level [148]. Kuwayama et al. note that after eight weeks of drought, any additional weeks have a minimal impact on farm income [147]. Similarly, Ding et al. highlight that some economic effects of droughts, such as livestock losses, can take years to recover. Therefore, it is crucial to leverage available data to mitigate the effects of droughts as effectively as possible [142].
An average of 22 billion-dollar weather and climate events occurred in the U.S. between 2021 and 2023 (Figure 7). This value is more than six times the number of billion-dollar events from 1980–1989 (3.3 events per year). This increase can be attributed to increased exposure and vulnerability and the frequency of extreme events caused by climate change [149].
Weather disasters in 2020 cost USD 258 billion, including USD 63 billion in damages, with more than 80% of these damages occurring in the U.S. (Figure 8) [117]. Lazo et al. reported that the effect of weather variability on the U.S. economy can amount to 3.4% (USD 485 billion) of the Gross Domestic Product (GDP) in 2008 dollars. The authors also found that economic sectors such as agriculture, communications, construction, finance–insurance–real estate (FIRE), manufacturing, mining, retail trade, services, transportation, utilities, and wholesale trade are statistically significantly sensitive to at least one measure of weather variability, with mining (oil, coal, and gas extraction) being the most sensitive one [148]. As a countermeasure to such adverse effects of weather variability and climate change on the U.S. economy, the NWS has developed the Impact-based Decision Support System (IDSS) as a tool for providing forecast advice and interpretation to support decision-making when people’s lives are at risk [150].
Figure 9 depicts how IDSS would be beneficial to decision-makers; with the use of IDSS, forecasts and warnings will be integrated into the decision-making process collaboratively [138]. Specifically, Lazo et al. analyzed the benefits of IDSS by comparing two storms in New York City (December 2010 and January 2016). They found that IDSS, combined with proactive decision-making, saved over USD 90 million in the energy sector, reduced ground transportation recovery time by five days, and saved USD 17 million in aviation. The benefits were greatest for major storms but diminished for extreme events where improved decision-making could only prevent a few impacts. Additionally, not all of these improvements were solely due to better decision-making, as factors such as societal preparedness also played a role [138].
The impacts of these weather disasters can be mitigated by the use of Earth observations, including PMWI data. These data play a crucial role in improving forecasting of natural disasters by providing timely information. However, quantifying their impact remains a challenge due to the lack of information on how these data actually benefit society, how they are being used by different sectors, and the varying levels of subjectivity in the methodologies developed to quantify them.

4. Summary of Survey and Discussion

As part of this report, an expert survey was conducted to assess the value of PMWIs. According to Straub et al., surveys are an excellent tool for gathering insights into the value of satellite observations, in this case, from PMWIs [152]. This survey consisted of 12 questions, 9 of which were related to the relevance and impact of PMWI data; these questions can be found in the Appendix A. Conducting this survey allowed for a further understanding of the applications of PMWI data, the impact related to the products created from its utilization, and their limitations and necessary improvements for future PMWIs. The survey was sent to 87 expert users of PMWI data and people in the fields of meteorology, hydrology, remote sensing, etc. Unfortunately, only nine experts completed the survey, and the main findings of this survey are presented below.
Through this survey, it was found that the respondents’ main uses for these data were for hurricane tracking and precipitation monitoring. Other applications included ocean surface wind measurements, structure monitoring and rapid intensification signals, and operational multi-satellite water vapor product development for forecasters. The main precipitation-related uses of these data found through this survey include the following: precipitation estimation, precipitation classification using machine learning, the development of Level 2 (L2) and Level 3 (L3) precipitation rate and accumulation products, the development of precipitable water products, advected total precipitable water estimates, advected layer precipitable water estimates, the development of blended total precipitable water products, and the development of blended rain rate products. The TC-related uses include the development of TC PRIMED [50], studying the intensity change and structure of TCs, and locating the center of TCs. It was also specifically mentioned that the National Hurricane Center (NHC) uses PMWIs to examine the structure of TCs. Another use for these data mentioned in the survey responses includes weather forecasting for the aviation, marine, and public sectors, from regular daily forecasts to issuing watches and warnings. Finally, one of the responses mentioned that these data are especially useful for studying open ocean storms and when reconnaissance aircraft data are unavailable.
When asked to rank the importance of PMWI data in their respective applications from 1 to 10, with 10 being extremely important, 67% ranked the importance at 10, 22% ranked it at 9, and 11% ranked it at 7. This leads to the conclusion that these data are extremely important for these applications. The survey respondents were also asked to describe and quantify the impact of their work using PMWIs. The majority of the responses were related to the capability of improving forecasts using these data. Specifically, a large number of the respondents mentioned that by using these data to improve forecasts of TCs, forecasters can have more confidence when predicting rapid intensification. Furthermore, when improving NHC forecasts utilizing PMWI data, more accurate tropical storm and hurricane watches and warnings can be issued, thus reducing the damage to infrastructure, property, and people’s lives. One of the respondents also mentioned that these data are used to predict flooding events; using these data, more accurate warnings of flooding threats can be issued. One respondent noted that in the past decade, improved forecasts had saved naval bases approximately USD 54 million per event; however, a supporting reference for this value was not provided.
Survey respondents were also asked to discuss the limitations of PMWI data and make suggestions for their improvement. The primary limitations that the respondents found from these data are the temporal coverage and resolution. They emphasized that the amount of satellite passes and the data latency are significant limitations that should be improved. A respondent also specifically emphasized the infrequent overpasses over TCs. These data are crucial for improving the forecasting of TCs; however, the latency could be lower for its usefulness. Another respondent specifically pointed out that only four primary spacecraft use the Microwave Integrated Retrieval System (MiRS) in two orbital planes: NOAA-20, NOAA-21, Metop-B, and Metop-C. Due to this limitation, 8 h gaps in sampling can occur, which is less than ideal and should be addressed. MiRS is a retrieval algorithm used to retrieve data from microwave sensors, enabling the creation of composites and blended products using data from the four satellites mentioned above [153]. This respondent further mentioned that even though the QuickSounder mission, scheduled for 2026, will contribute by providing additional data as a sounder (rather than an imager), a sustained effort must be made to fully address the challenges of data gaps and limited coverage.
Another suggestion from a different respondent was to strive for 3–4 h global coverage of PMWIs as an international community. Furthermore, decreasing the latency of the data, potentially to one hour, would be ideal, along with increasing the size of swaths and resolution. A few respondents agree that there should be more satellites, with one of them mentioning that a higher number of satellites is necessary for the polar constellations with improvements of algorithms for complex terrains, as well as for warm cloud top rainfall and better detection over snow and ice. Higher resolution and more frequent passes of PMWIs for the 32–35 GHz and 85–91 GHz bands are also necessary. The potential need for hyperspectral channels of GEO satellites to improve the data latency was also mentioned. The final recommendation is for NOAA to rapidly develop a mechanism to include the data from smallsats in the blended products.

5. Conclusions

This review highlights the diverse applications of PMWI data, rather than focusing on the technical methodologies or processing algorithms. PMWIs have demonstrated critical value in various domains, particularly NWP, hurricane tracking, precipitation, cryosphere and soil moisture monitoring, ocean surface wind measurements, and drought assessment. For example, their ability to provide accurate and timely data enhances hurricane forecasts, leading to improved early warning systems. This mitigates damage to infrastructure and aids in the preservation of human lives, translating to substantial benefits to society.
The high regard in which expert users and the general public hold PMWI data was evident through the conducted survey. However, it also uncovered key limitations to address for improved effectiveness of PMWIs. Issues such as temporal coverage, data latency, and resolution are significant challenges that impact the utility of PMWI data in real-time applications. Other challenges include that currently a considerable amount of Radio Frequency Interference (RFI) is observed in lower-frequency bands used in the AMSR2, SMOS, and SMAP instruments [3], which affects the efficacy of the sensors. Eyre et al. also indicated that the development of new technologies (i.e., 5G) will increase RFI in higher microwave bands. Therefore, to ensure the quality of microwave instruments and the accuracy and timeliness of data, it is important to protect key microwave bands [3,70]. Increasing the number of satellites to ensure more frequent global coverage, reducing data latency to enhance real-time application utility, and improving the resolution and swath sizes of PMWIs are essential steps forward. Furthermore, this review highlights the need for continuous innovation and collaboration among key organizations such as NOAA, NASA, JAXA, and EUMETSAT. By leveraging these organizations’ combined expertise and resources, the development and deployment of next-generation PMWI technology can be accelerated, leading to more robust and reliable environmental monitoring systems.
Throughout this review, several challenges were encountered that hindered a more comprehensive understanding of the impacts and benefits of PMWI data and their applications. First was the shortage of studies that discuss the impact of PMWIs. Although there is a plethora of papers discussing the applications of these sensors, none specifically discusses their societal value. An additional challenge directly linked to the first one is the lack of data about the value of PMWIs. A further obstacle was that quantifying the impacts of PMWIs can be complicated due to their indirect relationship with PMWIs, as it can be difficult to link improved weather forecasts only with PMWI sensors. Furthermore, the impact can be linked to long-term improvements instead of being immediate and measurable. The last challenge faced during the review was the limited number of responses to the survey.
Overall, the value of PMWIs to society is undeniable. Their contributions to weather forecasting, climate monitoring, and disaster management are critical in safeguarding communities and supporting informed decision-making. As we move forward, addressing the identified limitations and investing in technological advancements will be essential to unlocking the full potential of PMWIs. This review serves as a call to action for stakeholders to prioritize enhancing PMWI capabilities, ensuring that these invaluable tools continue to play a pivotal role in understanding and managing Earth’s dynamic environment.

Author Contributions

Conceptualization, K.H., P.N., S.K., R.R.F. and S.S.; methodology, N.R., M.B.Z., C.J.A. and V.A.G.; formal analysis, N.R., M.B.Z., C.J.A. and V.A.G.; investigation, K.H., N.R., M.B.Z., C.J.A. and V.A.G.; resources, K.H., S.K., S.S. and P.N.; data curation, N.R., M.B.Z. and C.J.A.; writing—original draft preparation, N.R., M.B.Z., C.J.A. and V.A.G.; writing—review and editing, K.H., S.K., S.S., R.R.F. and H.M.; visualization, N.R., M.B.Z. and C.J.A.; supervision, K.H., P.N., S.S., S.K. and R.R.F.; project administration, K.H., S.S., P.N. and S.K.; funding acquisition, K.H. and S.K. All authors have read and agreed to the published version of the manuscript.

Funding

This study was funded by NOAA JPSS PGRR through NOAA grants NA19NES4320002 and NA24NESX432C0001 (Cooperative Institute for Satellite Earth System Studies—CISESS) at the University of Maryland/ESSIC.

Data Availability Statement

No new data were created in this study. The data presented in the figures were obtained from publicly available sources as follows: 1. Precipitation rates during Tropical Storm Helene were downloaded from the National Aeronautics and Space Administration (NASA) Integrated Multi-satellite Retrievals for Global Precipitation Measurement (IMERG) website (https://gpm.nasa.gov/data/imerg, accessed on 7 March 2025). 2. Cryosphere data were obtained from the National Snow and Ice Data Center (NSIDC) website (https://nsidc.org/data/amsru, accessed on 7 March 2025). 3. The 10 m ocean surface wind speed data were downloaded from the Physical Oceanography Distributed Active Archive Center (PODAAC) website (https://podaac.jpl.nasa.gov/dataset/CCMP_WINDS_10MMONTHLY_L4_V3.1, accessed on 7 March 2025). 4. Blended soil moisture data were collected from the National Oceanic and Atmospheric Administration (NOAA) Soil Moisture Operational Product System (SMOPS) (https://www.ncei.noaa.gov/access/metadata/landing-page/bin/iso?id=gov.noaa.ncdc:C00994, accessed on 7 March 2025).

Acknowledgments

The authors would like to acknowledge the Cooperative Institute for Satellite Earth System Studies (CISESS) at the University of Maryland/ESSIC for its financial support of this work. We also extend our gratitude to the Climate Program Office’s Climate Observations and Monitoring Program for funding under Grant NA23OAR4310443, as well as to the Center for Western Weather and Water Extremes (CW3E) at the Scripps Institution of Oceanography through the AR Program (Grant 4600013361), sponsored by the California Department of Water Resources, and the USACE FIRO III program (Grant W912HZ2420001). Additionally, we appreciate the support provided by NASA under Grants 80NSSC23K0136 and 80NSSC21K1668, as well as NOAA through Grant ST133017CQ0058 in collaboration with Riverside Technology, Inc.

Conflicts of Interest

The authors declare no conflicts of interest.

Appendix A. Survey on the Societal Value of PMWIs

This survey has been prepared by the Center for Hydrometeorology and Remote Sensing (CHRS) at University of California Irvine to collect feedback from PMWI data users. The information gathered from the survey will be summarized in the report to the Cooperative Institute for Satellite Earth System Studies (CISESS). The survey aims to evaluate the societal effects of PMWIs in applications such as hurricane tracking, precipitation monitoring, ocean surface wind measurements, cryosphere studies, etc. PMWI data is vital for hydrological and meteorological applications because it allows for all-weather, day-and-night monitoring of key variables. This data enables more accurate monitoring and forecasting of weather patterns, water availability, and potential hazards, leading to improved water resource management, flood prediction, agricultural planning, and disaster preparedness efforts.
The survey below is intended to collect detailed insights into the applications of PMWI data, particularly on their societal impact. Participants are encouraged to share feedback and suggestions to support future sensor projects and missions. Please include relevant references in your response. Respondents’ identities will be kept confidential, and their relevant work and references will be cited in the report.
Survey Questions:
1.
Name: Your full name.
2.
Email Address: Your email address for follow-up and further communication.
3.
Workplace and Position: The organization where you work and your current job title.
4.
Usage of PMWI Data: Specific types of PMWI data application(s) in your role.
Categories:
  • hurricane tracking
  • precipitation monitoring
  • ocean surface wind measurements
  • cryosphere studies
  • others
5.
Importance Rating: On a scale from 1 to 10, rate the importance of PMWI data to your work or applications.
6.
Applications: Describe the products or applications you create using this data.
7.
Societal Impact: Discuss the societal impact of your work using PMWI data.
8.
Measurement of Societal Impact: Explain how you quantify the societal benefits of your work (e.g., lives saved, economic benefits, cost savings).
9.
Evidence of Impact: Provide evidence or data supporting the societal impact mentioned.
10.
Supporting References: List any references that support your claims about the societal impact of PMWI data.
11.
Limitations of PMWI Data: Identify any limitations you encounter with PMWI data and how these affect your products.
12.
Suggestions for Improvement: Provide recommendations for enhancing PMWI data quality, accessibility, or other aspects in future developments.

References

  1. Huffman, G.J.; Bolvin, D.T.; Braithwaite, D.; Hsu, K.-L.; Joyce, R.J.; Kidd, C.; Nelkin, E.J.; Sorooshian, S.; Stocker, E.F.; Tan, J.; et al. Integrated Multi-Satellite Retrievals for the Global Precipitation Measurement (GPM) Mission (IMERG). In Satellite Precipitation Measurement; Levizzani, V., Kidd, C., Kirschbaum, D.B., Kummerow, C.D., Nakamura, K., Turk, F.J., Eds.; Springer International Publishing: Cham, Switzerland, 2020; Volume 1, pp. 343–353. ISBN 978-3-030-24568-9. [Google Scholar]
  2. Thépaut, J.-N. Satellite Data Assimilation in Numerical Weather Prediction: An Overview; ECMWF: Reading, UK, 2003; pp. 75–94. [Google Scholar]
  3. Radio-Frequency Interference (RFI) Workshop. Available online: https://www.ecmwf.int/en/learning/workshops/radio-frequency-interference-rfi-workshop (accessed on 18 December 2024).
  4. Gelaro, R.; McCarty, W.; Suárez, M.J.; Todling, R.; Molod, A.; Takacs, L.; Randles, C.A.; Darmenov, A.; Bosilovich, M.G.; Reichle, R.; et al. The Modern-Era Retrospective Analysis for Research and Applications, Version 2 (MERRA-2). J. Clim. 2017, 30, 5419–5454. [Google Scholar] [CrossRef]
  5. Tapiador, F.J.; Navarro, A.; Levizzani, V.; García-Ortega, E.; Huffman, G.J.; Kidd, C.; Kucera, P.A.; Kummerow, C.D.; Masunaga, H.; Petersen, W.A.; et al. Global Precipitation Measurements for Validating Climate Models. Atmos. Res. 2017, 197, 1–20. [Google Scholar] [CrossRef]
  6. Ghent, D.; Kaduk, J.; Remedios, J.; Balzter, H. Data Assimilation into Land Surface Models: The Implications for Climate Feedbacks. Int. J. Remote Sens. 2011, 32, 617–632. [Google Scholar] [CrossRef]
  7. Bommarito, J.J. DMSP Special Sensor Microwave Imager Sounder (SSMIS); Shiue, J.C., Ed.; SPIE: Orlando, FL, USA, 1993; Volume 1935, pp. 230–238. [Google Scholar]
  8. Kidd, C.; Barrett, E.C. The Use of Passive Microwave Imagery in Rainfall Monitoring. Remote Sens. Rev. 1990, 4, 415–450. [Google Scholar] [CrossRef]
  9. Oki, T.; Imaoka, K.; Kachi, M. AMSR Instruments on GCOM-W1/2: Concepts and Applications. In Proceedings of the 2010 IEEE International Geoscience and Remote Sensing Symposium, Honolulu, HI, USA, 25–30 July 2010; IEEE: Piscataway, NJ, USA, 2010; pp. 1363–1366. [Google Scholar]
  10. Mineart, G.M. The Evolution and Status of Requirements for Ocean Data Products from the Joint Polar Satellite System (JPSS). In Proceedings of the OCEANS’11 MTS/IEEE KONA, Waikoloa, HI, USA, 19–22 September 2011; IEEE: Piscataway, NJ, USA, 2011; pp. 1–8. [Google Scholar]
  11. Karouche, N.; Raju, G. Megha-Tropiques Satellite Mission: Sensors Performances. In Proceedings of the Sensors, Systems, and Next-Generation Satellites XIV, Toulouse, France, 13 October 2010; SPIE: Bellingham, WA, USA, 2010; Volume 7826, pp. 192–204. [Google Scholar]
  12. Ustin, S.L.; Middleton, E.M. Current and Near-Term Earth-Observing Environmental Satellites, Their Missions, Characteristics, Instruments, and Applications. Sensors 2024, 24, 3488. [Google Scholar] [CrossRef]
  13. WMO OSCAR|Observing Systems Capability Analysis and Review Tool–Home. Available online: https://tools.wmo.int/ (accessed on 3 January 2025).
  14. Hawkins, J.D.; Lee, T.F.; Turk, J.; Sampson, C.; Kent, J.; Richardson, K. Real-Time Internet Distribution of Satellite Products for Tropical Cyclone Reconnaissance. Bull. Am. Meteorol. Soc. 2001, 82, 567–578. [Google Scholar] [CrossRef]
  15. Cheung, A.A.; Slocum, C.J.; Knaff, J.A.; Razin, M.N. Documenting the Progressions of Secondary Eyewall Formations. Weather Forecast. 2024, 39, 19–40. [Google Scholar] [CrossRef]
  16. Tang, L.; Tian, Y.; Lin, X. Validation of Precipitation Retrievals over Land from Satellite-Based Passive Microwave Sensors. J. Geophys. Res. Atmos. 2014, 119, 4546–4567. [Google Scholar] [CrossRef]
  17. Hu, L.; Zhao, T.; Ju, W.; Peng, Z.; Shi, J.; Rodríguez-Fernández, N.J.; Wigneron, J.-P.; Cosh, M.H.; Yang, K.; Lu, H.; et al. A Twenty-Year Dataset of Soil Moisture and Vegetation Optical Depth from AMSR-E/2 Measurements Using the Multi-Channel Collaborative Algorithm. Remote Sens. Environ. 2023, 292, 113595. [Google Scholar] [CrossRef]
  18. Chen, X.; Liu, Y.Y.; Evans, J.P.; Parinussa, R.M.; van Dijk, A.I.J.M.; Yebra, M. Estimating Fire Severity and Carbon Emissions over Australian Tropical Savannahs Based on Passive Microwave Satellite Observations. Int. J. Remote Sens. 2018, 39, 6479–6498. [Google Scholar] [CrossRef]
  19. Lawrence, H.; Bormann, N.; Sandu, I.; Day, J.; Farnan, J.; Bauer, P. Use and Impact of Arctic Observations in the ECMWF Numerical Weather Prediction System. Q. J. R. Meteorol. Soc. 2019, 145, 3432–3454. [Google Scholar] [CrossRef]
  20. Panegrossi, G. Satellite Snowfall Retrieval and Machine Learning: Challenges, Advancements, and Future Perspectives. In Proceedings of the International Precipitation Working Group (IPWG), Tokyo, Japan, 15–18 July 2024. [Google Scholar]
  21. Frontmatter. Remote Sensing of the Cryosphere; Tedesco, M., Ed.; Wiley-Blackwell Cryosphere Science Series; John Wiley & Sons, Ltd.: Hoboken, NJ, USA, 2015; pp. i–xxiv. ISBN 978-1-118-36890-9. [Google Scholar]
  22. Rysman, J.-F.; Panegrossi, G.; Sanò, P.; Marra, A.C.; Dietrich, S.; Milani, L.; Kulie, M.S. SLALOM: An All-Surface Snow Water Path Retrieval Algorithm for the GPM Microwave Imager. Remote Sens. 2018, 10, 1278. [Google Scholar] [CrossRef]
  23. Werapitiya, G.; McCoy, D.; Elsaesser, G.; Field, P.; Rahimi, S. Meteorology Modulates the Impact of GCM Horizontal Resolution on Underestimation of Midlatitude Ocean Wind Speeds. Geophys. Res. Lett. 2024, 51, e2024GL108512. [Google Scholar] [CrossRef]
  24. Zhang, L.; Shi, H.; Wang, Z.; Yu, H.; Yin, X.; Liao, Q. Comparison of Wind Speeds from Spaceborne Microwave Radiometers with In Situ Observations and ECMWF Data over the Global Ocean. Remote Sens. 2018, 10, 425. [Google Scholar] [CrossRef]
  25. Liu, Y.Y.; Parinussa, R.M.; Dorigo, W.A.; De Jeu, R.A.M.; Wagner, W.; van Dijk, A.I.J.M.; McCabe, M.F.; Evans, J.P. Developing an Improved Soil Moisture Dataset by Blending Passive and Active Microwave Satellite-Based Retrievals. Hydrol. Earth Syst. Sci. 2011, 15, 425–436. [Google Scholar] [CrossRef]
  26. Wentz, F.J.; Mattox, L.A.; Peteherych, S. New Algorithms for Microwave Measurements of Ocean Winds: Applications to Seasat and the Special Sensor Microwave Imager. J. Geophys. Res. Oceans 1986, 91, 2289–2307. [Google Scholar] [CrossRef]
  27. Kummerow, C.; Simpson, J.; Thiele, O.; Barnes, W.; Chang, A.T.C.; Stocker, E.; Adler, R.F.; Hou, A.; Kakar, R.; Wentz, F.; et al. The Status of the Tropical Rainfall Measuring Mission (TRMM) after Two Years in Orbit. J. Appl. Meteorol. 2000, 39, 1965–1982. [Google Scholar] [CrossRef]
  28. Kongoli, C.; Meng, H.; Dong, J.; Ferraro, R. Ground-Based Assessment of Snowfall Detection over Land Using Polarimetric High Frequency Microwave Measurements. Remote Sens. 2020, 12, 3441. [Google Scholar] [CrossRef]
  29. Okuyama, A.; Imaoka, K. Intercalibration of Advanced Microwave Scanning Radiometer-2 (AMSR2) Brightness Temperature. IEEE Trans. Geosci. Remote Sens. 2015, 53, 4568–4577. [Google Scholar] [CrossRef]
  30. Kidd, C.; Huffman, G.; Maggioni, V.; Chambon, P.; Oki, R. The Global Satellite Precipitation Constellation: Current Status and Future Requirements. Bull. Am. Meteorol. Soc. 2021, 102, E1844–E1861. [Google Scholar] [CrossRef]
  31. Nielsen-Englyst, P.; Høyer, J.L.; Karagali, I.; Kolbe, W.M.; Tonboe, R.T.; Pedersen, L.T. Impact of Microwave Observations on the Estimation of Arctic Sea Surface Temperatures. Remote Sens. Environ. 2024, 301, 113949. [Google Scholar] [CrossRef]
  32. Kasahara, M.; Kachi, M.; Inaoka, K.; Fujii, H.; Kubota, T.; Shimada, R.; Kojima, Y. Overview and Current Status of GOSAT-GW Mission and AMSR3 Instrument. In Proceedings of the Sensors, Systems, and Next-Generation Satellites XXIV, Online, 20 September 2020; SPIE: Bellingham, WA, USA, 2020; Volume 11530, p. 1153007. [Google Scholar]
  33. Erwin, S. Space Force Orders New Weather Satellite from Ball Aerospace. Available online: https://spacenews.com/space-force-orders-new-weather-satellite-from-ball-aerospace/ (accessed on 9 January 2025).
  34. Snyder, D. Evaluation and Economic Value of Winter Weather Forecasts. Master’s Thesis, Purdue University, West Lafayette, Indiana, 2014. [Google Scholar]
  35. Hou, A.Y.; Kakar, R.K.; Neeck, S.; Azarbarzin, A.A.; Kummerow, C.D.; Kojima, M.; Oki, R.; Nakamura, K.; Iguchi, T. The Global Precipitation Measurement Mission. Bull. Amer. Meteor. Soc. 2014, 95, 701–722. [Google Scholar] [CrossRef]
  36. Migliaccio, M.; Buono, A.; Alparone, M. Microwave Satellite Remote Sensing for a Sustainable Sea. Eur. J. Remote Sens. 2022, 55, 507–519. [Google Scholar] [CrossRef]
  37. Welker, C.; Faust, E. Tropical Cyclone-Related Socio-Economic Losses in the Western North Pacific Region. Nat. Hazards Earth Syst. Sci. 2013, 13, 115–124. [Google Scholar] [CrossRef]
  38. Skofronick-Jackson, G.; Kirschbaum, D.; Petersen, W.; Huffman, G.; Kidd, C.; Stocker, E.; Kakar, R. The Global Precipitation Measurement (GPM) Mission’s Scientific Achievements and Societal Contributions: Reviewing Four Years of Advanced Rain and Snow Observations. Q. J. R. Meteorol. Soc. 2018, 144, 27–48. [Google Scholar] [CrossRef] [PubMed]
  39. Samsuddin, A.; Kaman, Z.K.; Husin, N.M. Socio-Economic Assessment on Flood Risk Impact: A Methodological Review Toward Environmental Sustainability. IOP Conf. Ser. Earth Environ. Sci. 2021, 943, 012010. [Google Scholar] [CrossRef]
  40. Huffman, G.J.; Bolvin, D.T.; Joyce, R.; Nelkin, E.J.; Tan, J.; Braithwaite, D.; Hsu, K.; Kelley, O.A.; Nguyen, P.; Sorooshian, S.; et al. Algorithm Theoretical Basis Document (ATBD)-NASA Global Precipitation Measurement (GPM) Integrated Multi-Satellite Retrievals for GPM (IMERG) Version 07; NASA/GSFC: Greenbelt, MD, USA, 2023.
  41. Avenas, A.; Mouche, A.; Tandeo, P.; Piolle, J.-F.; Chavas, D.; Fablet, R.; Knaff, J.; Chapron, B. Reexamining the Estimation of Tropical Cyclone Radius of Maximum Wind from Outer Size with an Extensive Synthetic Aperture Radar Dataset. Mon. Weather Rev. 2023, 151, 3169–3189. [Google Scholar] [CrossRef]
  42. Sampson, C.R.; Schumacher, A.B.; Knaff, J.A.; DeMaria, M.; Fukada, E.M.; Sisko, C.A.; Roberts, D.P.; Winters, K.A.; Wilson, H.M. Objective Guidance for Use in Setting Tropical Cyclone Conditions of Readiness. Weather Forecast. 2012, 27, 1052–1060. [Google Scholar] [CrossRef]
  43. DeMaria, M.; Knaff, J.A.; Brennan, M.J.; Brown, D.; Knabb, R.D.; DeMaria, R.T.; Schumacher, A.; Lauer, C.A.; Roberts, D.P.; Sampson, C.R.; et al. Improvements to the Operational Tropical Cyclone Wind Speed Probability Model. Weather Forecast. 2013, 28, 586–602. [Google Scholar] [CrossRef]
  44. Sampson, C.R.; Knaff, J.A. A Consensus Forecast for Tropical Cyclone Gale Wind Radii. Weather Forecast. 2015, 30, 1397–1403. [Google Scholar] [CrossRef]
  45. Goni, G.; Demaria, M.; Knaff, J.; Sampson, C.; Ginis, I.; Bringas, F.; Mavume, A.; Lauer, C.; Lin, I.-I.; Ali, M.M.; et al. Applications of Satellite-Derived Ocean Measurements to Tropical Cyclone Intensity Forecasting. Oceanography 2009, 22, 190–197. [Google Scholar] [CrossRef]
  46. Knaff, J.A.; Sampson, C.R.; Kucas, M.E.; Slocum, C.J.; Brennan, M.J.; Meissner, T.; Ricciardulli, L.; Mouche, A.; Reul, N.; Morris, M.; et al. Estimating Tropical Cyclone Surface Winds: Current Status, Emerging Technologies, Historical Evolution, and a Look to the Future. Trop. Cyclone Res. Rev. 2021, 10, 125–150. [Google Scholar] [CrossRef]
  47. Hauser, D.; Abdalla, S.; Ardhuin, F.; Bidlot, J.-R.; Bourassa, M.; Cotton, D.; Gommenginger, C.; Evers-King, H.; Johnsen, H.; Knaff, J.; et al. Satellite Remote Sensing of Surface Winds, Waves, and Currents: Where Are We Now? Surv. Geophys. 2023, 44, 1357–1446. [Google Scholar] [CrossRef]
  48. Wimmers, A.; Velden, C.; Cossuth, J.H. Using Deep Learning to Estimate Tropical Cyclone Intensity from Satellite Passive Microwave Imagery. Mon. Weather. Rev. 2019, 147, 2261–2282. [Google Scholar] [CrossRef]
  49. Jones, T.A.; Cecil, D.; DeMaria, M. Passive-Microwave-Enhanced Statistical Hurricane Intensity Prediction Scheme. Weather Forecast. 2006, 21, 613–635. [Google Scholar] [CrossRef]
  50. Razin, M.N.; Slocum, C.J.; Knaff, J.A.; Brown, P.J.; Bell, M.M. Tropical Cyclone Precipitation, Infrared, Microwave, and Environmental Dataset (TC PRIMED). Bull. Am. Meteorol. Soc. 2023, 104, E1980–E1998. [Google Scholar] [CrossRef]
  51. DeMaria, M.; Kaplan, J. An Updated Statistical Hurricane Intensity Prediction Scheme (SHIPS) for the Atlantic and Eastern North Pacific Basins. Weather Forecast. 1999, 14, 326–337. [Google Scholar] [CrossRef]
  52. CIRA-Cooperative Institute for Research in the Atmosphere. Connecting Models and Observations. Available online: https://www.cira.colostate.edu/ (accessed on 18 December 2024).
  53. Meng, H.; Dong, J.; Ferraro, R.; Yan, B.; Zhao, L.; Kongoli, C.; Wang, N.-Y.; Zavodsky, B. A 1DVAR-Based Snowfall Rate Retrieval Algorithm for Passive Microwave Radiometers. J. Geophys. Res. Atmos. 2017, 122, 6520–6540. [Google Scholar] [CrossRef]
  54. Romanov, P. Global Multisensor Automated Satellite-Based Snow and Ice Mapping System (GMASI) for Cryosphere Monitoring. Remote Sens. Environ. 2017, 196, 42–55. [Google Scholar] [CrossRef]
  55. Ferraro, R.R. Special Sensor Microwave Imager Derived Global Rainfall Estimates for Climatological Applications. J. Geophys. Res. Atmos. 1997, 102, 16715–16735. [Google Scholar] [CrossRef]
  56. Ferraro, R.R.; Weng, F.; Grody, N.C.; Zhao, L. Precipitation Characteristics over Land from the NOAA-15 AMSU Sensor. Geophys. Res. Lett. 2000, 27, 2669–2672. [Google Scholar] [CrossRef]
  57. Zeng, Z.; Gan, Y.; Kettner, A.J.; Yang, Q.; Zeng, C.; Brakenridge, G.R.; Hong, Y. Towards High Resolution Flood Monitoring: An Integrated Methodology Using Passive Microwave Brightness Temperatures and Sentinel Synthetic Aperture Radar Imagery. J. Hydrol. 2020, 582, 124377. [Google Scholar] [CrossRef]
  58. Bindlish, R.; Crow, W.T.; Jackson, T.J. Role of Passive Microwave Remote Sensing in Improving Flood Forecasts. IEEE Geosci. Remote Sens. Lett. 2009, 6, 112–116. [Google Scholar] [CrossRef]
  59. Petković, V.; Kummerow, C.D. Performance of the GPM Passive Microwave Retrieval in the Balkan Flood Event of 2014. J. Hydrometeorol. 2015, 16, 2501–2518. [Google Scholar] [CrossRef]
  60. Belabid, N.; Zhao, F.; Brocca, L.; Huang, Y.; Tan, Y. Near-Real-Time Flood Forecasting Based on Satellite Precipitation Products. Remote Sens. 2019, 11, 252. [Google Scholar] [CrossRef]
  61. Xie, P.; Joyce, R.; Wu, S.; Yoo, S.-H.; Yarosh, Y.; Sun, F.; Lin, R. Reprocessed, Bias-Corrected CMORPH Global High-Resolution Precipitation Estimates from 1998. J. Hydrometeorol. 2017, 18, 1617–1641. [Google Scholar] [CrossRef]
  62. Joyce, R.J.; Janowiak, J.E.; Arkin, P.A.; Xie, P. CMORPH: A Method That Produces Global Precipitation Estimates from Passive Microwave and Infrared Data at High Spatial and Temporal Resolution. J. Hydrometeorol. 2004, 5, 487–503. [Google Scholar] [CrossRef]
  63. Li, Z.; Tang, G.; Kirstetter, P.; Gao, S.; Li, J.-L.F.; Wen, Y.; Hong, Y. Evaluation of GPM IMERG and Its Constellations in Extreme Events over the Conterminous United States. J. Hydrol. 2022, 606, 127357. [Google Scholar] [CrossRef]
  64. Mroz, K.; Montopoli, M.; Battaglia, A.; Panegrossi, G.; Kirstetter, P.; Baldini, L. Cross Validation of Active and Passive Microwave Snowfall Products over the Continental United States. J. Hydrometeorol. 2021, 22, 1297–1315. [Google Scholar] [CrossRef]
  65. Chen, S.; Chen, X.; Chen, W.; Su, Y.; Li, D. A Simple Retrieval Method of Land Surface Temperature from AMSR-E Passive Microwave Data—A Case Study over Southern China during the Strong Snow Disaster of 2008. Int. J. Appl. Earth Obs. Geoinf. 2011, 13, 140–151. [Google Scholar] [CrossRef]
  66. Cecil, D.J.; Blankenship, C.B. Toward a Global Climatology of Severe Hailstorms as Estimated by Satellite Passive Microwave Imagers. J. Clim. 2012, 25, 687–703. [Google Scholar] [CrossRef]
  67. Owe, M.; de Jeu, R.; Holmes, T. Multisensor Historical Climatology of Satellite-Derived Global Land Surface Moisture. J. Geophys. Res. Earth Surf. 2008, 113, F01002. [Google Scholar] [CrossRef]
  68. Simon, M.; Plummer, S.; Fierens, F.; Hoelzemann, J.J.; Arino, O. Burnt Area Detection at Global Scale Using ATSR-2: The GLOBSCAR Products and Their Qualification. J. Geophys. Res. Atmos. 2004, 109, D14S02. [Google Scholar] [CrossRef]
  69. Weng, F.; Zhu, T.; Yan, B. Satellite Data Assimilation in Numerical Weather Prediction Models. Part II: Uses of Rain-Affected Radiances from Microwave Observations for Hurricane Vortex Analysis. J. Atmos. Sci. 2007, 64, 3910–3925. [Google Scholar] [CrossRef]
  70. Eyre, J.R.; Bell, W.; Cotton, J.; English, S.J.; Forsythe, M.; Healy, S.B.; Pavelin, E.G. Assimilation of Satellite Data in Numerical Weather Prediction. Part II: Recent Years. Q. J. R. Meteorol. Soc. 2022, 148, 521–556. [Google Scholar] [CrossRef]
  71. Pu, Z.; Yu, C.; Tallapragada, V.; Jin, J.; McCarty, W. The Impact of Assimilation of GPM Microwave Imager Clear-Sky Radiance on Numerical Simulations of Hurricanes Joaquin (2015) and Matthew (2016) with the HWRF Model. Mon. Weather Rev. 2019, 147, 175–198. [Google Scholar] [CrossRef]
  72. Bi, L.; Marshall, J.; Zaptocny, T.H.; Jung, J.; Morgan, M.C. Assessing the forecast impact of windsat/coriolis data in the NCEP GDAS/GFS. In Proceedings of the 11th Symposium on Integrated Observing and Assimilation Systems for the Atmosphere, Oceans, and Land Surface (IOAS-AOLS) 2007, 87th AMS Annual Meeting, San Antonio, TX, USA, 14–18 January 2007. [Google Scholar]
  73. Ota, Y.; Derber, J.C.; Kalnay, E.; Miyoshi, T. Ensemble-Based Observation Impact Estimates Using the NCEP GFS. Tellus Dyn. Meteorol. Oceanogr. 2013, 65, 20038. [Google Scholar] [CrossRef]
  74. Aaboe, S.; Down, E.J.; Eastwood, S. Algorithm Theoretical Basis Document for the Global Sea-Ice Edge and Type Product; Norwegian Meteorological Institute: Blindern, Norway, 2021. [Google Scholar]
  75. Weng, F. Passive Microwave Remote Sensing of the Earth: For Meteorological Applications; Wiley Series in Atmospheric Physics and Remote Sensing; WILEY: Hoboken, NJ, USA, 2017; ISBN 978-3-527-33630-2. [Google Scholar]
  76. Comiso, J.C.; Nishio, F. Trends in the Sea Ice Cover Using Enhanced and Compatible AMSR-E, SSM/I, and SMMR Data. J. Geophys. Res. Oceans 2008, 113, C02S07. [Google Scholar] [CrossRef]
  77. Donlon, C.; Galeazzi, C.; Midthassel, R.; Sallusti, M.; Triggianese, M.; Fiorelli, B.; De Paris, G.; Kornienko, A.; Khlystova, I. The Copernicus Imaging Microwave Radiometer (CIMR): Mission Overview and Status. In Proceedings of the IGARSS 2023—2023 IEEE International Geoscience and Remote Sensing Symposium, Pasadena, CA, USA, 16–21 July 2023; pp. 989–992. [Google Scholar]
  78. Baordo, F.; Tonboe, R.; Howe, E. Algorithm Theoretical Basis Document for Global Sea Ice Concentration Level 2 and Level 3 2023. Available online: https://osisaf-hl.met.no/sites/osisaf-hl/files/baseline_document/osisaf_atbd_ice-conc_l2-3_v1p3.pdf (accessed on 18 December 2024).
  79. Lavergne, T.; Eastwood, S.; Teffah, Z.; Schyberg, H.; Breivik, L.-A. Sea Ice Motion from Low-Resolution Satellite Sensors: An Alternative Method and Its Validation in the Arctic. J. Geophys. Res. Oceans 2010, 115, C10032. [Google Scholar] [CrossRef]
  80. Wentz, F.J.; Gentemann, C.; Smith, D.; Chelton, D. Satellite Measurements of Sea Surface Temperature Through Clouds. Science 2000, 288, 847–850. [Google Scholar] [CrossRef]
  81. RSS. RSS CCMP Monthly 10 Meter Surface Winds Level 4 Version 3.1. PO.DAAC/JPL/NASA. 2024. Available online: https://cmr.earthdata.nasa.gov/search/concepts/C2916529935-POCLOUD.html (accessed on 5 March 2025).
  82. Wentz, F. AMSR Ocean Algorithm, Version 2.; Remote Sensing Systems, 15 December 2000. Available online: https://images.remss.com/papers/rsstech/2000_121599A-1_Wentz_AMSR_Ocean_Algorithm_ATBD_Version2.pdf (accessed on 17 March 2025).
  83. Nielsen-Englyst, P.; Høyer, J.L.; Alerskans, E.; Pedersen, L.T.; Donlon, C. Impact of Channel Selection on SST Retrievals from Passive Microwave Observations. Remote Sens. Environ. 2021, 254, 112252. [Google Scholar] [CrossRef]
  84. Lipes, R.G. Description of SEASAT Radiometer Status and Results. J. Geophys. Res. Oceans 1982, 87, 3385–3395. [Google Scholar] [CrossRef]
  85. Milman, A.S.; Wilheit, T.T. Sea Surface Temperatures from the Scanning Multichannel Microwave Radiometer on Nimbus 7. J. Geophys. Res. Oceans 1985, 90, 11631–11641. [Google Scholar] [CrossRef]
  86. Wentz, F.J. A 17-Yr Climate Record of Environmental Parameters Derived from the Tropical Rainfall Measuring Mission (TRMM) Microwave Imager. J. Clim. 2015, 28, 6882–6902. [Google Scholar] [CrossRef]
  87. Kummerow, C.; Barnes, W.; Kozu, T.; Shiue, J.; Simpson, J. The Tropical Rainfall Measuring Mission (TRMM) Sensor Package. J. Atmos. Ocean. Technol. 1998, 15, 809–817. [Google Scholar] [CrossRef]
  88. Draper, D.W.; Newell, D.A.; Wentz, F.J.; Krimchansky, S.; Skofronick-Jackson, G.M. The Global Precipitation Measurement (GPM) Microwave Imager (GMI): Instrument Overview and Early On-Orbit Performance. IEEE J. Sel. Top. Appl. Earth Obs. Remote Sens. 2015, 8, 3452–3462. [Google Scholar] [CrossRef]
  89. Bidwell, S.W.; Flaming, G.M.; Durning, J.F.; Smith, E.A. The Global Precipitation Measurement (GPM) Microwave Imager (GMI) Instrument: Role, Performance, and Status. In Proceedings of the 2005 IEEE International Geoscience and Remote Sensing Symposium, 2005 IGARSS ’05, Seoul, Republic of Korea, 29 July 2005; Volume 1, p. 4. [Google Scholar]
  90. Chelton, D.B.; Wentz, F.J. Global Microwave Satellite Observations of Sea Surface Temperature for Numerical Weather Prediction and Climate Research. Bull. Am. Meteorol. Soc. 2005, 86, 1097–1116. [Google Scholar] [CrossRef]
  91. Kawanishi, T.; Sezai, T.; Ito, Y.; Imaoka, K.; Takeshima, T.; Ishido, Y.; Shibata, A.; Miura, M.; Inahata, H.; Spencer, R.W. The Advanced Microwave Scanning Radiometer for the Earth Observing System (AMSR-E), NASDA’s Contribution to the EOS for Global Energy and Water Cycle Studies. IEEE Trans. Geosci. Remote Sens. 2003, 41, 184–194. [Google Scholar] [CrossRef]
  92. Alerskans, E.; Zinck, A.-S.P.; Nielsen-Englyst, P.; Høyer, J.L. Exploring Machine Learning Techniques to Retrieve Sea Surface Temperatures from Passive Microwave Measurements. Remote Sens. Environ. 2022, 281, 113220. [Google Scholar] [CrossRef]
  93. Alerskans, E.; Høyer, J.L.; Gentemann, C.L.; Pedersen, L.T.; Nielsen-Englyst, P.; Donlon, C. Construction of a Climate Data Record of Sea Surface Temperature from Passive Microwave Measurements. Remote Sens. Environ. 2020, 236, 111485. [Google Scholar] [CrossRef]
  94. Nielsen-Englyst, P.; Høyer, J.L.; Toudal Pedersen, L.; Gentemann, C.L.; Alerskans, E.; Block, T.; Donlon, C. Optimal Estimation of Sea Surface Temperature from AMSR-E. Remote Sens. 2018, 10, 229. [Google Scholar] [CrossRef]
  95. Gentemann, C.L.; Meissner, T.; Wentz, F.J. Accuracy of Satellite Sea Surface Temperatures at 7 and 11 GHz. IEEE Trans. Geosci. Remote Sens. 2010, 48, 1009–1018. [Google Scholar] [CrossRef]
  96. Gentemann, C.L. Three Way Validation of MODIS and AMSR-E Sea Surface Temperatures. J. Geophys. Res. Oceans 2014, 119, 2583–2598. [Google Scholar] [CrossRef]
  97. May, J.; Rowley, C. COWVR/TEMPEST Surface State Parameter Retrievals. In Proceedings of the IGARSS 2023—2023 IEEE International Geoscience and Remote Sensing Symposium, Pasadena, CA, USA, 16–21 July 2023; pp. 4084–4087. [Google Scholar]
  98. Alsweiss, S.; Jelenak, Z.; Chang, P.S. A Comparison between COWVR and WindSat Measurements for NOAA’s Applications. In Proceedings of the IGARSS 2023—2023 IEEE International Geoscience and Remote Sensing Symposium, Pasadena, CA, USA, 16–21 July 2023; pp. 3977–3980. [Google Scholar]
  99. Santamaria-Artigas, A.; Mattar, C.; Wigneron, J.-P. Application of a Combined Optical–Passive Microwave Method to Retrieve Soil Moisture at Regional Scale Over Chile. IEEE J. Sel. Top. Appl. Earth Obs. Remote Sens. 2016, 9, 1493–1504. [Google Scholar] [CrossRef]
  100. Schmugge, T.J. Remote Sensing of Soil Moisture: Recent Advances. IEEE Trans. Geosci. Remote Sens. 1983, GE-21, 336–344. [Google Scholar] [CrossRef]
  101. Kerr, Y.H.; Waldteufel, P.; Richaume, P.; Wigneron, J.P.; Ferrazzoli, P.; Mahmoodi, A.; Al Bitar, A.; Cabot, F.; Gruhier, C.; Juglea, S.E.; et al. The SMOS Soil Moisture Retrieval Algorithm. IEEE Trans. Geosci. Remote Sens. 2012, 50, 1384–1403. [Google Scholar] [CrossRef]
  102. Spencer, M.; Kim, Y.; Chan, S. The Soil Moisture Active/Passive (SMAP) Radar. In Proceedings of the 2008 IEEE Radar Conference, Rome, Italy, 26–30 May 2008; pp. 1–5. [Google Scholar]
  103. Owe, M.; de Jeu, R.; Walker, J. A Methodology for Surface Soil Moisture and Vegetation Optical Depth Retrieval Using the Microwave Polarization Difference Index. IEEE Trans. Geosci. Remote Sens. 2001, 39, 1643–1654. [Google Scholar] [CrossRef]
  104. Van Der Velde, R.; Salama, M.S.; Pellarin, T.; Ofwono, M.; Ma, Y.; Su, Z. Long Term Soil Moisture Mapping over the Tibetan Plateau Using Special Sensor Microwave/Imager. Hydrol. Earth Syst. Sci. 2014, 18, 1323–1337. [Google Scholar] [CrossRef]
  105. Njoku, E.G.; Jackson, T.J.; Lakshmi, V.; Chan, T.K.; Nghiem, S.V. Soil Moisture Retrieval from AMSR-E. IEEE Trans. Geosci. Remote Sens. 2003, 41, 215–229. [Google Scholar] [CrossRef]
  106. Li, L.; Gaiser, P.W.; Gao, B.-C.; Bevilacqua, R.M.; Jackson, T.J.; Njoku, E.G.; Rudiger, C.; Calvet, J.-C.; Bindlish, R. WindSat Global Soil Moisture Retrieval and Validation. IEEE Trans. Geosci. Remote Sens. 2010, 48, 2224–2241. [Google Scholar] [CrossRef]
  107. Zhang, Z.; Wang, D.; Wang, G.; Qiu, J.; Liao, W. Use of SMAP Soil Moisture and Fitting Methods in Improving GPM Estimation in Near Real Time. Remote Sens. 2019, 11, 368. [Google Scholar] [CrossRef]
  108. Lu, Z.; Chai, L.; Ye, Q.; Zhang, T. Reconstruction of Time-Series Soil Moisture from AMSR2 and SMOS Data by Using Recurrent Nonlinear Autoregressive Neural Networks. In Proceedings of the 2015 IEEE International Geoscience and Remote Sensing Symposium (IGARSS), Milan, Italy, 26–31 July 2015; pp. 980–983. [Google Scholar] [CrossRef]
  109. Zhang, A.; Jia, G. Monitoring Meteorological Drought in Semiarid Regions Using Multi-Sensor Microwave Remote Sensing Data. Remote Sens. Environ. 2013, 134, 12–23. [Google Scholar] [CrossRef]
  110. Rahman, K.U.; Shang, S.; Zohaib, M. Assessment of Merged Satellite Precipitation Datasets in Monitoring Meteorological Drought over Pakistan. Remote Sens. 2021, 13, 1662. [Google Scholar] [CrossRef]
  111. Zhao, L. NESDIS Five-Year Product Plan (NESDIS-PLN-1003.2). 2023. Available online: https://nesdis-prod.s3.amazonaws.com/2023-10/NESDIS-PLN-1003-2_NESDIS_FIVE-YEAR_PRODUCT_PLAN.pdf (accessed on 18 December 2024).
  112. Kummerow, C.; Hong, Y.; Olson, W.S.; Yang, S.; Adler, R.F.; McCollum, J.; Ferraro, R.; Petty, G.; Shin, D.-B.; Wilheit, T.T. The Evolution of the Goddard Profiling Algorithm (GPROF) for Rainfall Estimation from Passive Microwave Sensors. J. Appl. Meteorol. Climatol. 2001, 40, 1801–1820. [Google Scholar] [CrossRef]
  113. NOAA Hurricane Costs. Available online: https://coast.noaa.gov/states/fast-facts/hurricane-costs.html (accessed on 18 December 2024).
  114. Bakkensen, L.A.; Mendelsohn, R.O. Global Tropical Cyclone Damages and Fatalities Under Climate Change: An Updated Assessment. In Hurricane Risk; Collins, J.M., Walsh, K., Eds.; Springer International Publishing: Cham, Switzerland, 2019; Volume 1, pp. 179–197. ISBN 978-3-030-02402-4. [Google Scholar]
  115. Gulati, S.; Sampson, C.R. Economic Value of Tropical Cyclone Conditions of Readiness. Nat. Hazards 2021, 108, 1687–1700. [Google Scholar] [CrossRef]
  116. DeMaria, M.; Sampson, C.R.; Knaff, J.A.; Musgrave, K.D. Is Tropical Cyclone Intensity Guidance Improving? Bull. Am. Meteorol. Soc. 2014, 95, 387–398. [Google Scholar] [CrossRef]
  117. Masters, J. World Hammered by Record 50 Billion-Dollar Weather Disasters in 2020. Yale Climate Connections. Available online: http://yaleclimateconnections.org/2021/01/world-hammered-by-record-50-billion-dollar-weather-disasters-in-2020/ (accessed on 17 December 2024).
  118. Lyu, X.; Li, Z.; Li, X. Evaluation of GPM IMERG Satellite Precipitation Products in Event-Based Flood Modeling over the Sunshui River Basin in Southwestern China. Remote Sens. 2024, 16, 2333. [Google Scholar] [CrossRef]
  119. Wu, H.; Adler, R.F.; Tian, Y.; Huffman, G.J.; Li, H.; Wang, J. Real-Time Global Flood Estimation Using Satellite-Based Precipitation and a Coupled Land Surface and Routing Model. Water Resour. Res. 2014, 50, 2693–2717. [Google Scholar] [CrossRef]
  120. Kirschbaum, D.; Stanley, T.; Zhou, Y. Spatial and Temporal Analysis of a Global Landslide Catalog. Geomorphology 2015, 249, 4–15. [Google Scholar] [CrossRef]
  121. NRL Monterey-TCWeb–Active. Available online: https://science.nrlmry.navy.mil/geoips/tcweb/active/ (accessed on 3 January 2025).
  122. Schumann, G.; Kirschbaum, D.; Anderson, E.; Rashid, K. Role of Earth Observation Data in Disaster Response and Recovery: From Science to Capacity Building. In Earth Science Satellite Applications: Current and Future Prospects; Hossain, F., Ed.; Springer Remote Sensing/Photogrammetry: Springer: Cham, Switzerland, 2016; pp. 119–146. ISBN 978-3-319-33438-7. [Google Scholar]
  123. Using the IMERG Long-Term Precipitation Dataset for Applications|NASA Global Precipitation Measurement Mission. Available online: https://gpm.nasa.gov/applications/using-imerg-long-term-precipitation-data-applications (accessed on 9 January 2025).
  124. Kirschbaum, D.B.; Huffman, G.J.; Adler, R.F.; Braun, S.; Garrett, K.; Jones, E.; McNally, A.; Skofronick-Jackson, G.; Stocker, E.; Wu, H.; et al. NASA’s Remotely Sensed Precipitation: A Reservoir for Applications Users. Bull. Am. Meteorol. Soc. 2017, 98, 1169–1184. [Google Scholar] [CrossRef]
  125. Hossein, F.; Biswas, N.; Ashraf, M.W.; Bhatti, A.Z. Growing More with Less Using Cell Phones and Satellite Data|Semantic Scholar. Available online: https://www.semanticscholar.org/paper/Growing-More-with-Less-Using-Cell-Phones-and-Data-Hossain-Biswas/1612f6ad553f7ff2afe8f376bc36ea3159c07f94 (accessed on 3 January 2025).
  126. Valle, D.; Clark, J. Conservation Efforts May Increase Malaria Burden in the Brazilian Amazon. PLoS ONE 2013, 8, e57519. [Google Scholar] [CrossRef] [PubMed]
  127. Zaitchik, B.; Feingold, B.J.; Valle, D.; Pan, W.K. Integrating Earth Observations to Support Malaria Risk Monitoring in the Amazon. IEEE Earthzine. 2024. Available online: https://earthzine.org/integrating-earth-observations-to-support-malaria-risk-monitoring-in-the-amazon/ (accessed on 8 January 2025).
  128. Obringer, R.; Bohrer, G.; Weinzierl, R.; Dodge, S.; Deppe, J.; Ward, M.; Brandes, D.; Kays, R.; Flack, A.; Wikelski, M. Track Annotation: Determining the Environmental Context of Movement Through the Air. In Aeroecology; Chilson, P.B., Frick, W.F., Kelly, J.F., Liechti, F., Eds.; Springer International Publishing: Cham, Switzerland, 2017; pp. 71–86. ISBN 978-3-319-68576-2. [Google Scholar]
  129. Allaire, M. Socio-Economic Impacts of Flooding: A Review of the Empirical Literature. Water Secur. 2018, 3, 18–26. [Google Scholar] [CrossRef]
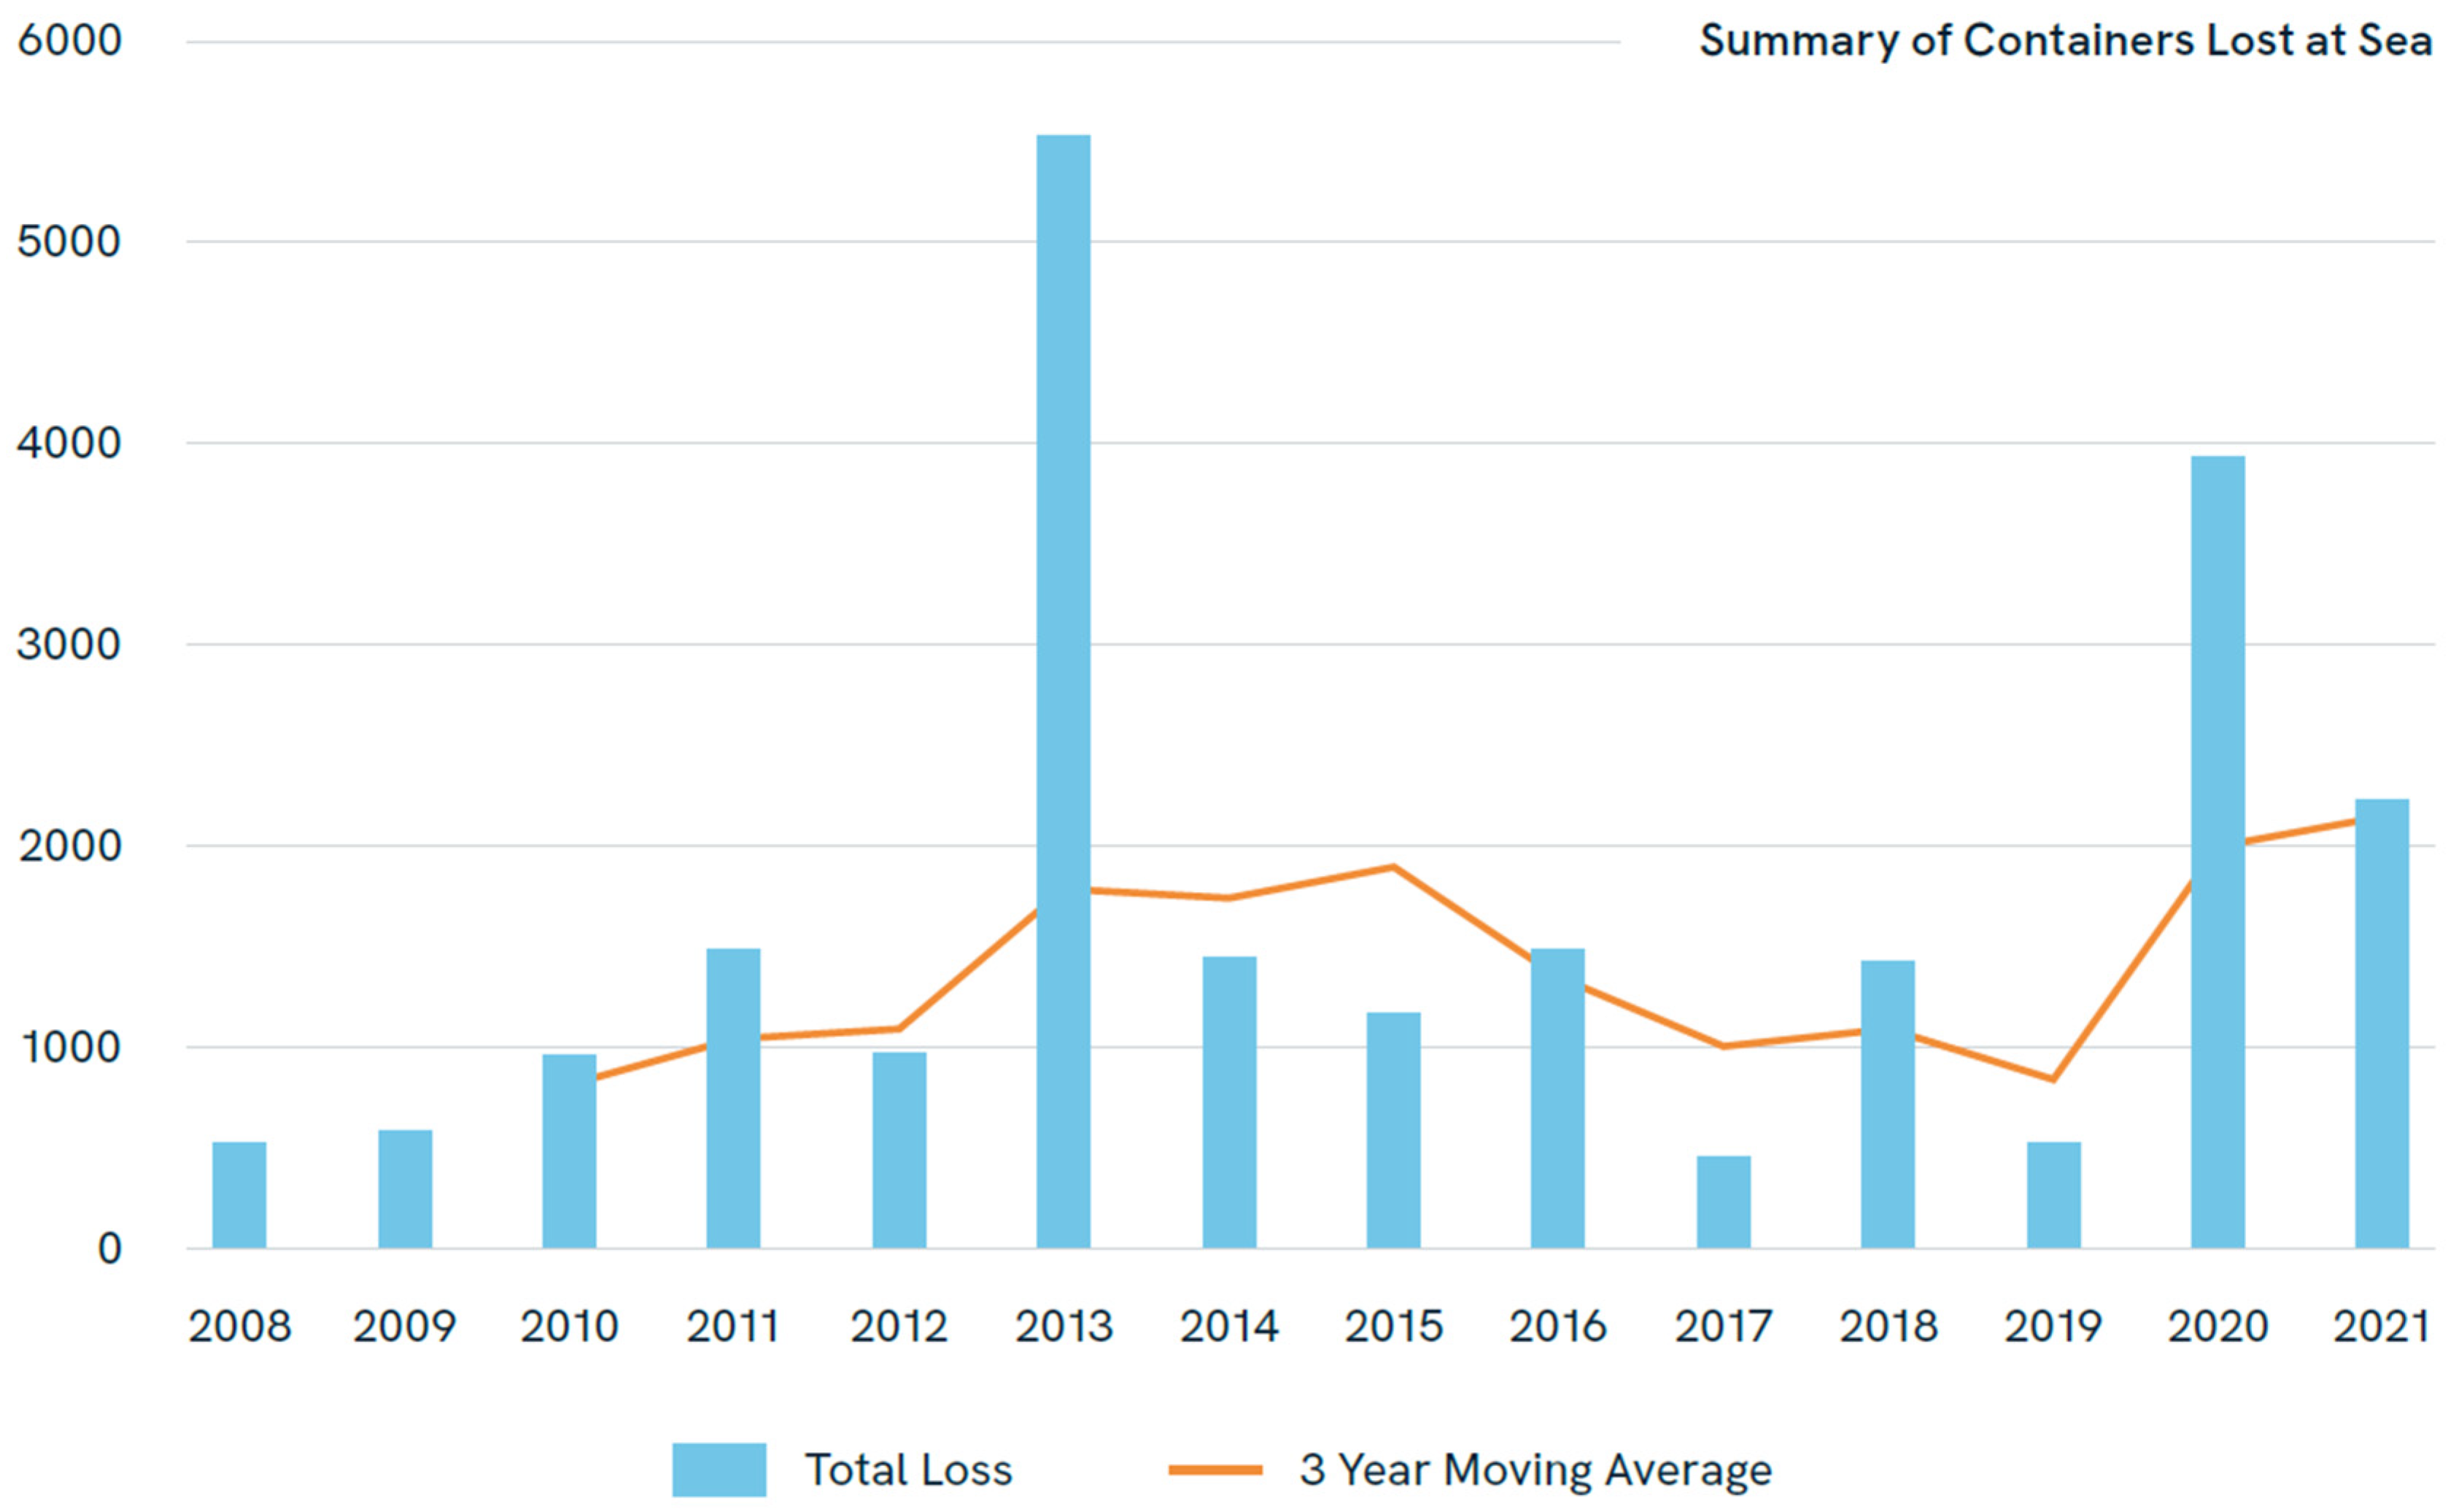
  130. UK Government Shipping Fleet Statistics 2020. Dep. Transp. Tech. Rep. 2021. Available online: https://assets.publishing.service.gov.uk/government/uploads/system/uploads/attachment_data/file/967763/shipping-fleet-statistics-2020.pdf (accessed on 18 December 2024).
  131. World Shipping Council (WSC) World Shipping Council Containers Lost at Sea Report 2022 Update Published. Available online: https://www.worldshipping.org/news/world-shipping-council-containers-lost-at-sea-report-2022-update-published (accessed on 18 December 2024).
  132. Bahamas Maritime Authority. Report of the Investigation into the Sinking of the “MOL Comfort” in the Indian Ocean; Bahamas Maritime Authority: London, UK, 2013. [Google Scholar]
  133. von Schuckmann, K.; Le Traon, P.-Y.; Smith (Chair), N.; Pascual, A.; Djavidnia, S.; Gattuso, J.-P.; Grégoire, M.; Aaboe, S.; Alari, V.; Alexander, B.E.; et al. Copernicus Marine Service Ocean State Report, Issue 5. J. Oper. Oceanogr. 2021, 14, 1–185. [Google Scholar] [CrossRef]
  134. Caires, S.; Marseille, G.-J.; Verlaan, M.; Stoffelen, A. North Sea Wave Analysis Using Data Assimilation and Mesoscale Model Forcing Winds. J. Waterw. Port Coast. Ocean Eng. 2018, 144, 04018005. [Google Scholar] [CrossRef]
  135. Melet, A.; Teatini, P.; Le Cozannet, G.; Jamet, C.; Conversi, A.; Benveniste, J.; Almar, R. Earth Observations for Monitoring Marine Coastal Hazards and Their Drivers. Surv. Geophys. 2020, 41, 1489–1534. [Google Scholar] [CrossRef]
  136. Salameh, E.; Frappart, F.; Almar, R.; Baptista, P.; Heygster, G.; Lubac, B.; Raucoules, D.; Almeida, L.P.; Bergsma, E.W.J.; Capo, S.; et al. Monitoring Beach Topography and Nearshore Bathymetry Using Spaceborne Remote Sensing: A Review. Remote Sens. 2019, 11, 2212. [Google Scholar] [CrossRef]
  137. Bloesch, J.; Gourio, F. The Effect of Winter Weather on U.S. Economic Activity. Econ. Perspect. 2015, 39. Available online: https://ssrn.com/abstract=2598559 (accessed on 17 March 2025).
  138. Lazo, J.K.; Hosterman, H.R.; Sprague-Hilderbrand, J.M.; Adkins, J.E. Impact-Based Decision Support Services and the Socioeconomic Impacts of Winter Storms. Bull. Am. Meteorol. Soc. 2020, 101, E626–E639. [Google Scholar] [CrossRef]
  139. Diaz, J.M. Economic Impacts of Wildfire; Southern Fire Exchange-A JFSP Knowledge Exchange Consortium, Environmental Science, Economics, 2012. Available online: https://api.semanticscholar.org/CorpusID:167877233 (accessed on 17 March 2025).
  140. Chuvieco, E.; Martínez, S.; Román, M.V.; Hantson, S.; Pettinari, M.L. Integration of Ecological and Socio-Economic Factors to Assess Global Vulnerability to Wildfire. Glob. Ecol. Biogeogr. 2014, 23, 245–258. [Google Scholar] [CrossRef]
  141. Champagne, C.; McNairn, H.; Berg, A.A. Monitoring Agricultural Soil Moisture Extremes in Canada Using Passive Microwave Remote Sensing. Remote Sens. Environ. 2011, 115, 2434–2444. [Google Scholar] [CrossRef]
  142. Ding, Y.; Hayes, M.J.; Widhalm, M. Measuring Economic Impacts of Drought: A Review and Discussion. Disaster Prev. Manag. Int. J. 2011, 20, 434–446. [Google Scholar] [CrossRef]
  143. Cochrane, H. Economic Loss: Myth and Measurement. Disaster Prev. Manag. Int. J. 2004, 13, 290–296. [Google Scholar] [CrossRef]
  144. Riebsame, W.E. Drought And Natural Resources Management in the United States: Impacts and Implications of the 1987-89 Drought; Routledge: New York, NY, USA, 2019; ISBN 978-0-429-04533-2. [Google Scholar]
  145. Howitt, R.; MacEwan, D.; Medellín-Azuara, J.; Lund, J.; Sumner, D. Economic Analysis of the 2015 Drought For California Agriculture; UC Davis Center for Watershed Sciences, ERA Economics, UC Agricultural Issues Center: Davis, CA, USA, 2015. [Google Scholar]
  146. Medellín-Azuara, J.; MacEwan, D.; Howitt, R.E.; Sumner, D.A.; Lund, J.R. A Report for the California Department of Food and Agriculture; Center for Watershed Sciences University of California-Davis: Davis, CA, USA, 2016. [Google Scholar]
  147. Kuwayama, Y.; Thompson, A.; Bernknopf, R.; Zaitchik, B.; Vail, P. Estimating the Impact of Drought on Agriculture Using the U.S. Drought Monitor. Am. J. Agric. Econ. 2019, 101, 193–210. [Google Scholar] [CrossRef]
  148. Lazo, J.K.; Lawson, M.; Larsen, P.H.; Waldman, D.M. U.S. Economic Sensitivity to Weather Variability. Bull. Am. Meteorol. Soc. 2011, 92, 709–720. [Google Scholar] [CrossRef]
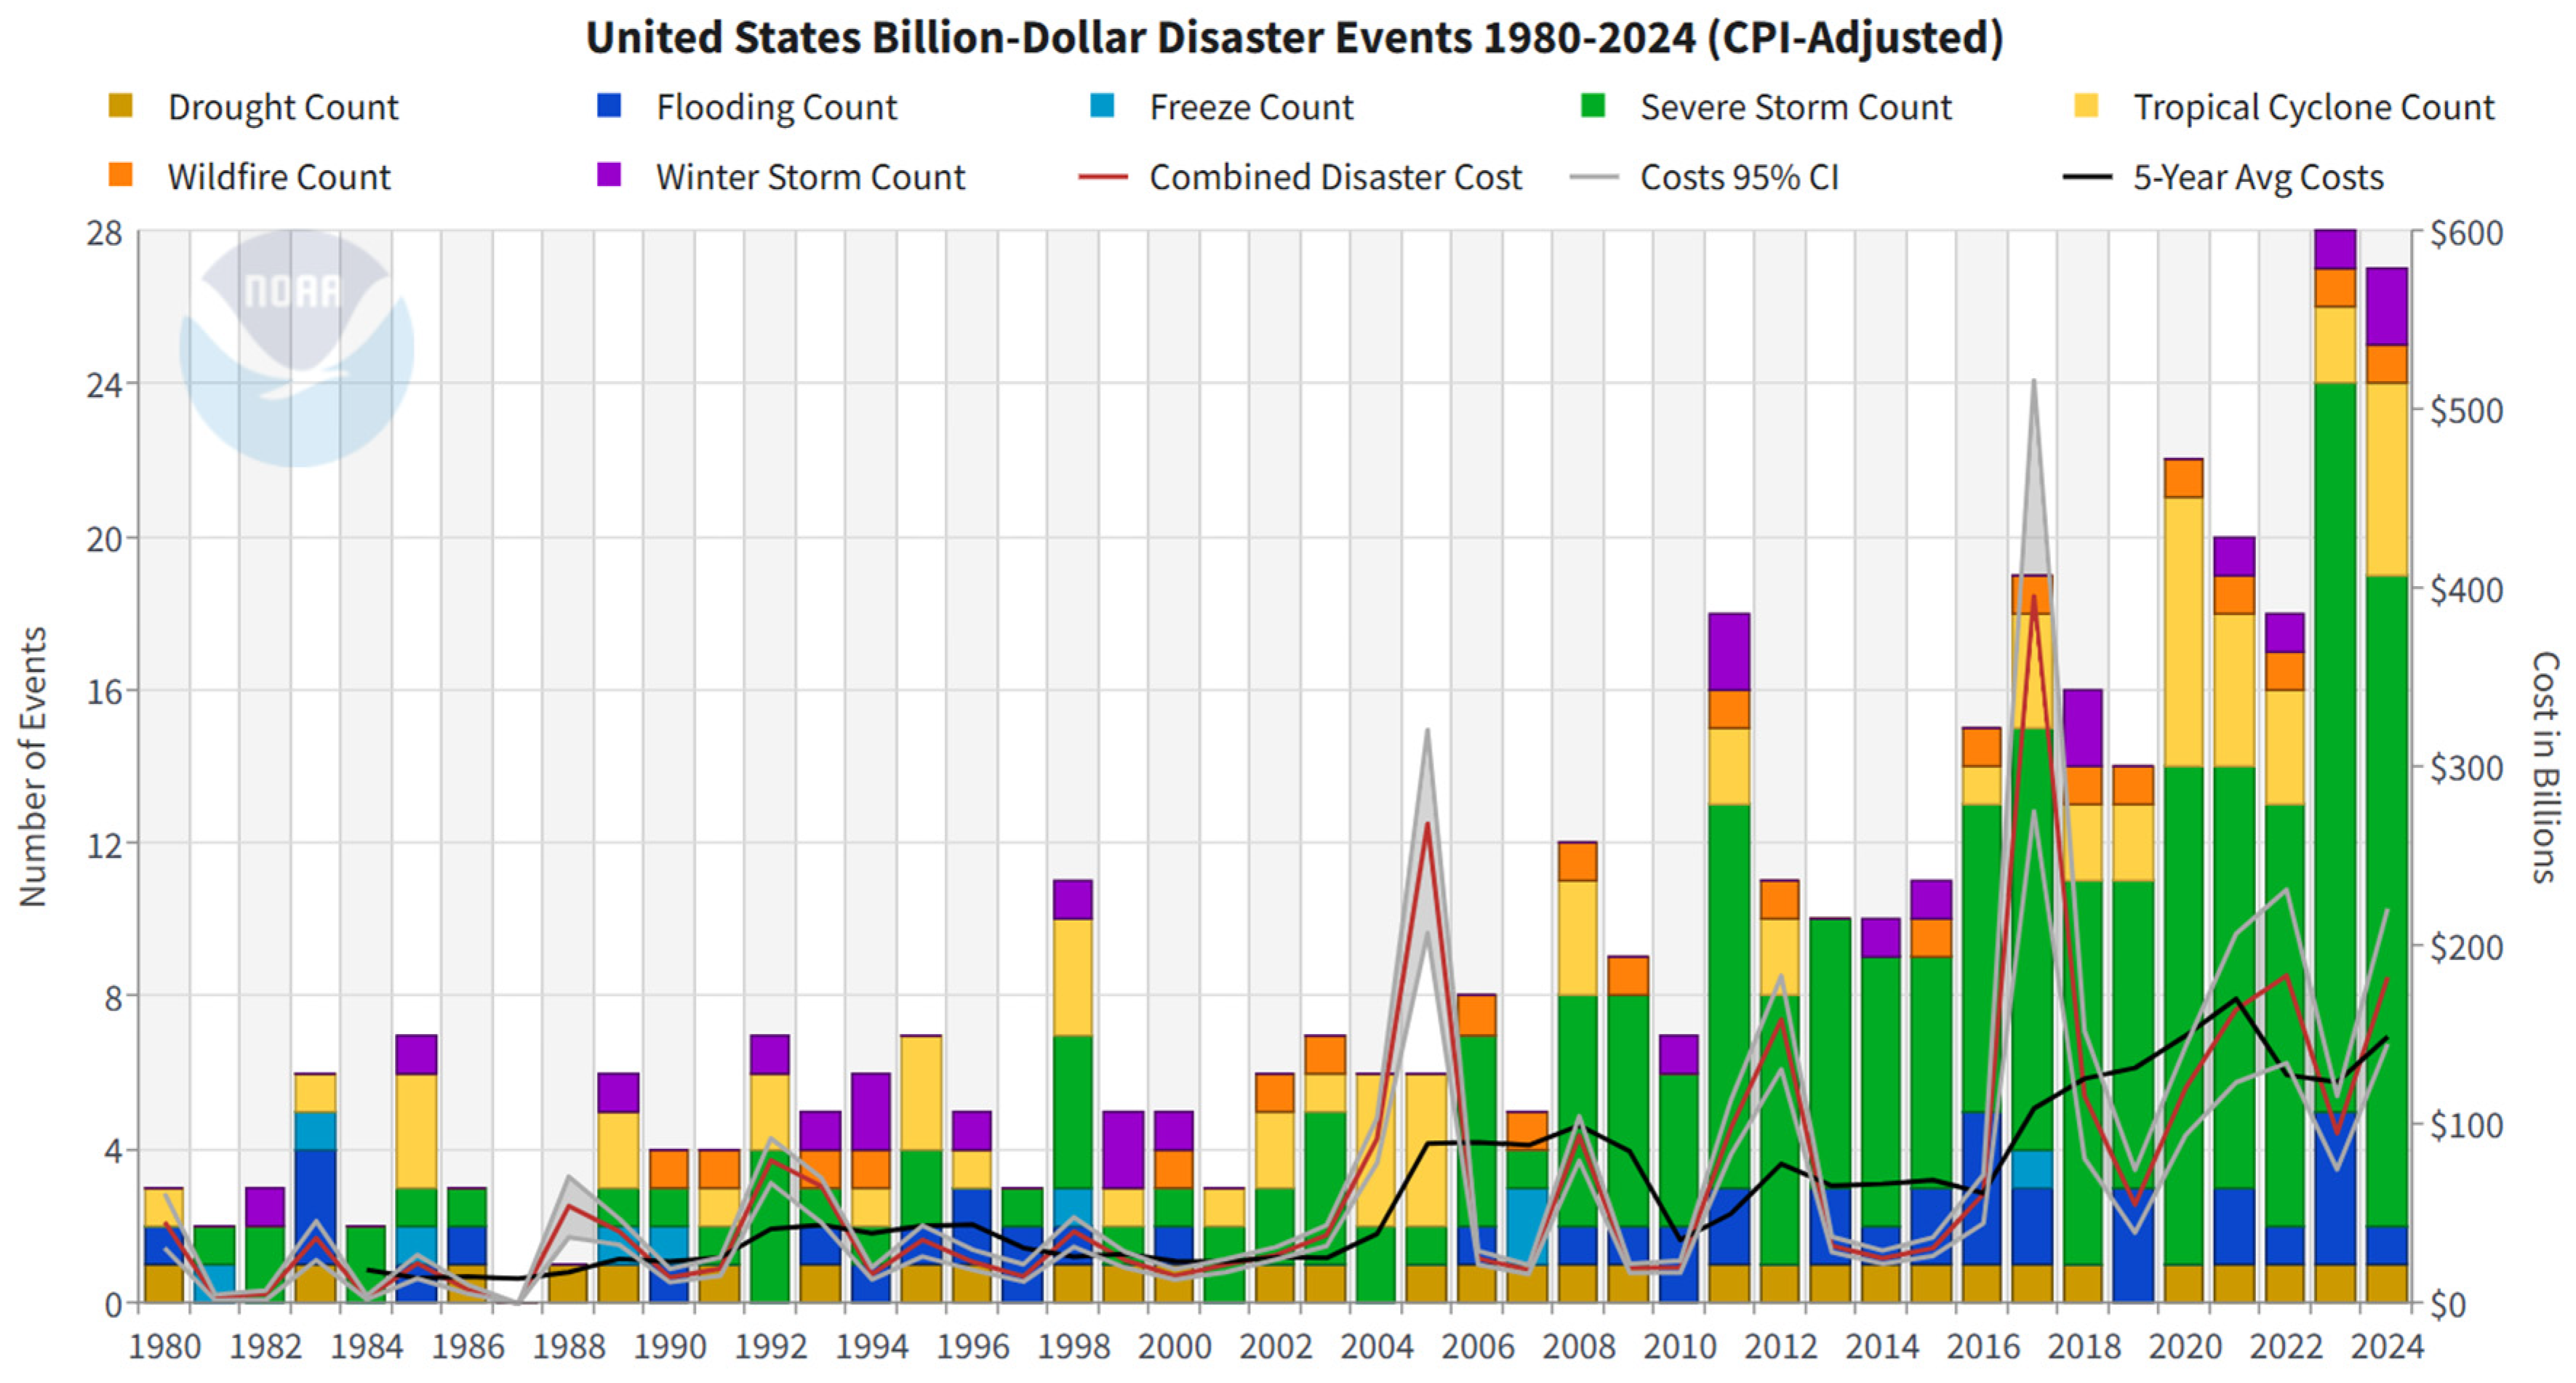
  149. NOAA Billion-Dollar Weather and Climate Disasters. Available online: https://www.ncei.noaa.gov/access/billions/time-series (accessed on 18 December 2024).
  150. US Department of Commerce, N. Impact-Based Decision Support Services (IDSS). Available online: https://www.weather.gov/about/idss (accessed on 17 December 2024).
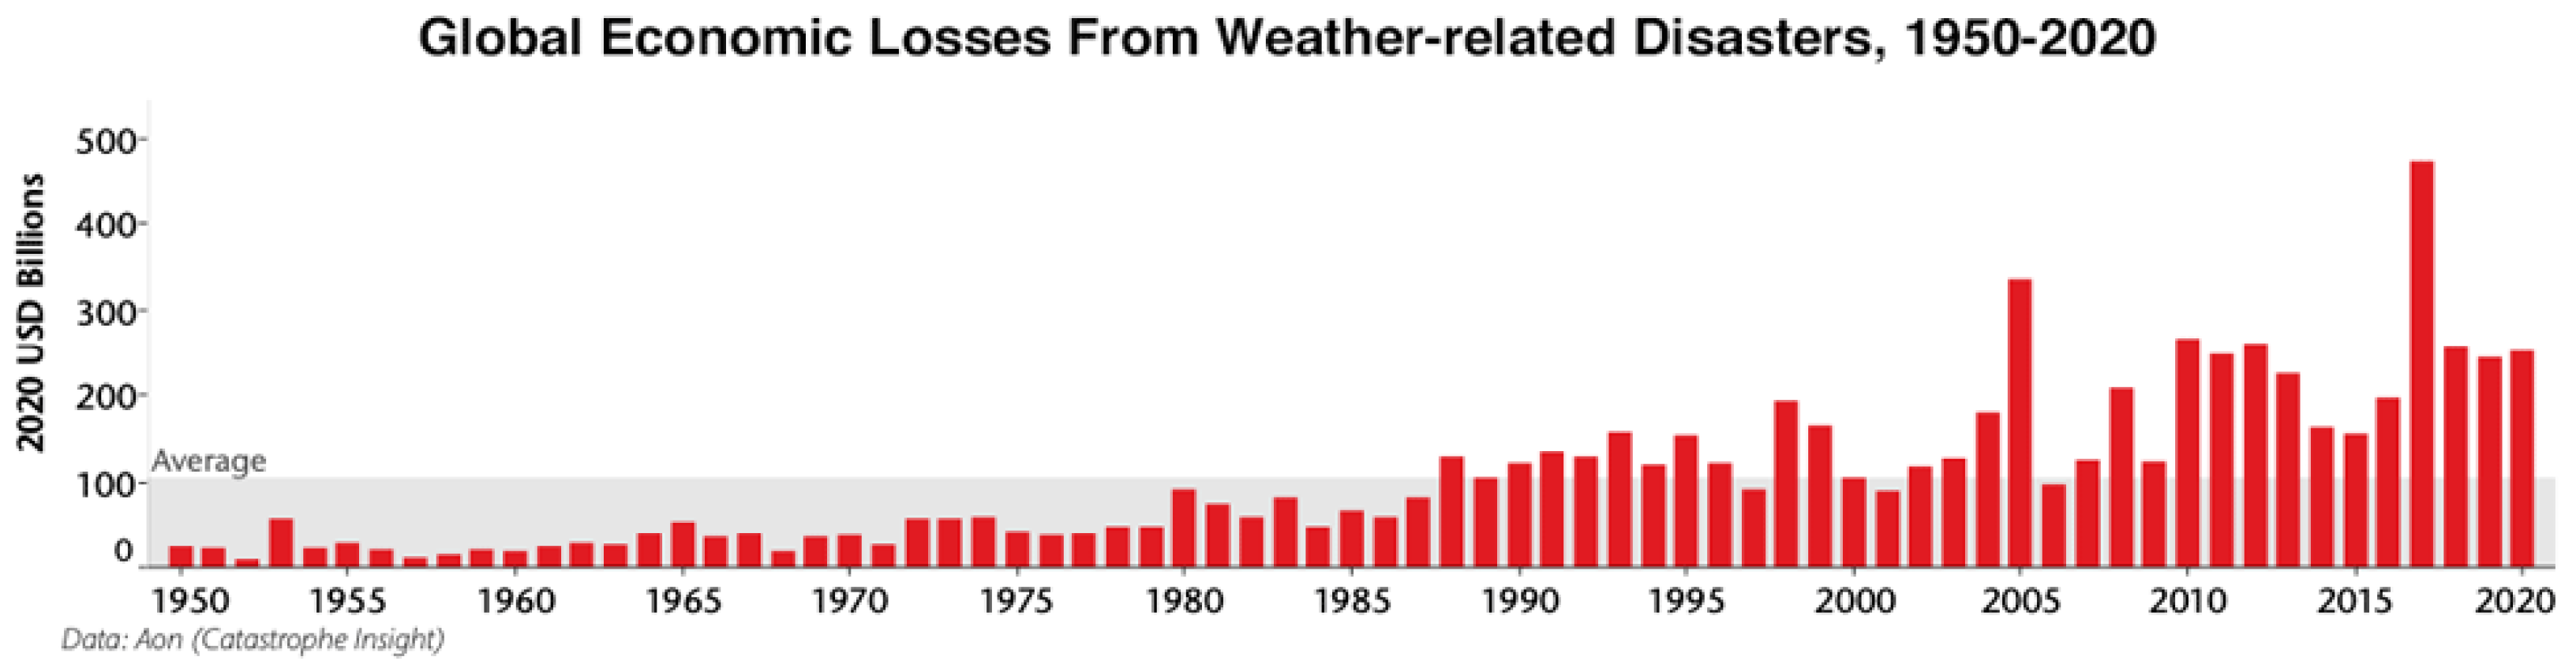
  151. Weather, Climate & Catastrophe Insight: 2020 Annual Report|Aon. Available online: https://www.aon.com/global-weather-catastrophe-natural-disasters-costs-climate-change-2020-annual-report/index.html (accessed on 17 December 2024).
  152. Straub, C.L.; Koontz, S.R.; Loomis, J.B. Economic Valuation of Landsat Imagery; United States Geological Survey: Reston, VA, USA, 2019.
  153. Boukabara, S.-A.; Garrett, K.; Chen, W.; Iturbide-Sanchez, F.; Grassotti, C.; Kongoli, C.; Chen, R.; Liu, Q.; Yan, B.; Weng, F.; et al. MiRS: An All-Weather 1DVAR Satellite Data Assimilation and Retrieval System. IEEE Trans. Geosci. Remote Sens. 2011, 49, 3249–3272. [Google Scholar] [CrossRef]
Figure 1. NASA IMERG precipitation rate from all available microwave sensors over Tropical Storm Helene on 26 September 2024 [source: figure created by authors].
Remotesensing 17 01654 g001
Figure 2. GPM-CO observation over a storm on the Carolina coast. The blues and purples represent snow, whereas the greens to reds represent rainfall (source: figure created by [38]).
Remotesensing 17 01654 g002
Figure 3. The daily average ice concentration over (a) the Northern and (b) Southern Hemispheres on 1 January 2025, obtained from the Land Atmosphere Near Real-Time Capability for EOS (LANCE) AMSR2 sensors (source: figure created by the authors).
Remotesensing 17 01654 g003
Figure 4. The NASA Cross-Calibrated Multi-Platform (CCMP) project combined monthly mean 10 m ocean surface wind speeds for December 2024 from microwave imagers—including PMWIs such as DMSP SSMIS, GCOM-W1 AMSR-E, and GPM GMI [81] (source: figure created by authors).
Remotesensing 17 01654 g004
Figure 5. The blended soil moisture distribution on 11 January 2025, derived from the Soil Moisture Operational Product System (SMOPS) (source: figure created by authors).
Remotesensing 17 01654 g005
Figure 6. Summary of annual containers lost at sea—analysis of the fourteen-year trend (source: figure created by [131]).
Remotesensing 17 01654 g006
Figure 7. The U.S. billion-dollar disaster events from 1980 to 10 June 2024 (source: figure created by [149]).
Remotesensing 17 01654 g007
Figure 8. Global economic costs from weather disasters from 1950 to 2020 (source: figure created by [117,151]).
Remotesensing 17 01654 g008
Figure 9. Value chain of IDSS information (source: figure created by [138]).
Remotesensing 17 01654 g009
Table 1. Summary of past, current, and future satellite PMWIs [13].
PMWI 1SatelliteLaunch DateCentral Frequency
(GHz)
Number of ChannelsSwath Width (km)FOV 2
(km)
ESMR 3Nimbus-5, 6197219.35H 411270–310025–160
SMMR 5Nimbus-7, SeaSat-119786.6 (V 6, H)–37 (V, H)1078017–160
SSM/I 7DMSP 8198719.35 (V, H)–85 (V, H)7140011–68
TMI 9TRMM 10199810.65 (V, H)–85.5 (V, H)97605–63
MSMR 11OceanSat-11999 6.6 (V, H)–21.0 (V, H) 81360 22–105
AMSR 12ADEOS 13-22002–20036.925 (V, H)–89 (V, H)1616003.1–70
AMSR-E 14Aqua2002–20116.925 (V, H)–89 (V, H)12145040–75
WindSatCoriolis20036.9 (V, H)–36.6 (V, H ± 45, L, R 15)2210258–71
SSMIS 16DMSP200419.35 (V, H)–183.31 ± 1 (H)24170013.1–70.1
MWRI 17-1FY 18-3(A, B, C, D) 2008–201010.65 (V, H)–150 (V, H)1214007.5–85
MIRAS 19SMOS 202009 1.413 (V, H)2100035–50
MADRAS 21Megha-Tropiques201118.7 (V, H)–157 (V, H)917006–60
MWRI 22HY 23-2(A, B, E)2011, 2018, and ≥20246.6 (V, H)–37 (V, H)9160015–120
AMSR 24 2GCOM-W1 2520126.925 (V, H)–89.0 B (V, H)1614503–62
GMI 26GPM-CO 27201410.65 (V, H)–183.31 ± 3 (V)138504.4–32
MWRI-2FY-3(F, H) 2023 and ≥202510.65 (V, H)–118.7503 ± 1.2 (V)2214006–45
MWRI-RM 28FY-3(G, I)2023 and ≥202610.65 (V, H)–183.31 ± 7.0 (V)268004–35
COWVR 29ISS COWVR 302022–202418.7 (V, H, P 31, M 32, L 33, R)–33.9 (V, H, P, M, L, R)18890 11–31
AMSR3GOSAT-GW 34≥20256.925 (V, H)–183.31 ± 3 (V)2114504–58
MWI 35 WSF 36-M1, M22024,
2028
10.85 (V, H, 3rd, 4th)–89 (V, H)18145010–50
MWI Metop-SG 37-(B1, B2, B3)≥2026, ≥2033, ≥204018.7 (V, H)–183.31 ± 2 (V)26170010–50
ICI 38Metop-SG-(B1, B2, B3)≥2026, ≥2033, ≥2040183.31 ± 7.0 (V)–664 ± 4.2 (V, H)13170016
CIMR 39CIMR A
CIMR B
≥2029 and ≥2031 1.41, 6.9, 10.65, 18.7, 36.5 (V, H, P, M, L, R)3019003–64
1 Passive Microwave Imagers, 2 Field of View, 3 Electrically Scanning Microwave Radiometer, 4 Horizontal, 5 Scanning Multichannel Microwave Radiometer, 6 Vertical, 7 Special Sensor Microwave/Imager, 8 Defense Meteorological Satellite Program, 9 Tropical Rainfall Measuring Mission Microwave Imager, 10 Tropical Rainfall Measuring Mission Microwave, 11 Microwave Scanning Radiometer, 12 Advanced Microwave Scanning Radiometer, 13 Advanced Earth Observing Satellite, 14 Advanced Microwave Scanning Radiometer—Earth Observing, 15 Right-hand Circular Polarization, 16 Special Sensor Microwave Imager/Sounder, 17 Microwave Radiation Imager Radiometer, 18 Feng-Yun, 19 Microwave Imaging Radiometer with Aperture Synthesis, 20 Soil Moisture and Ocean Salinity, 21 MicroWave Imaging Radiometer with Advanced Sounder, 22 Microwave Radiation Imager, 23 Hai Yang, 24 Advanced Microwave Scanning Radiometer, 25 Global Change Observation Mission—Water 1, 26 Global Precipitation Measurement Microwave Imager, 27 Global Precipitation Measurement-Core Observatory, 28 Radiometer Mode, 29 Compact Ocean Wind Vector Radiometer, 30 International Space Station Compact Ocean Wind Vector, 31 Polarization, 32 Multipolarization, 33 Linear Polarization, 34 Greenhouse Gases Observing Satellite—Global Water, 35 Microwave Imaging Radiometer, 36 Wind and Sea-Focused Microwave Radiometer, 37 Meteorological Operational Satellite—Second Generation, 38 Imaging Microwave Radiometer, 39 Copernicus Imaging Microwave Radiometer.
Table 2. List of TRMM and GPM societal benefit areas, topics, and specific uses of the data [38].
Societal Benefit AreaTopicApplicationExample
Extreme Events and DisastersFloodingIncorporation in hydrologic routing models for flood estimation. Application of IMERG data for event-based flood modeling in the Sunshui River Basin, southwestern China, using the hydrologic modeling system (HEC-HMS) model [118].
LandslidesNowcasting of potential landslides activities, rainfall intensity, and duration characteristics for landslide occurrence [119].Landslide Hazard Assessment model for Situational Awareness (LHASA) was developed using long-term TMPA and IMERG data. This model provides near-real-time estimates of potential landslide activity worldwide and assesses the overlap between global landslide occurrences and extreme rainfall patterns [120].
Tropical Cyclones (TCs)Improved characteristics of TC track and intensity.The GPM-CO GMI data have been incorporated into the NRL Automated Tropical Cyclone Forecasting System (ATCFS) to improve the precision of TC location tracking [121]. Furthermore, GMI data were mentioned in NOAA NHC hurricane forecasts for Irma and Jose [38].
Disaster ResponseSituational awareness of extreme precipitation in potentially affected areas.IMERG offers a valuable tool for analyzing precipitation extremes that lead to flooding and landslides, as well as aiding disaster response and recovery efforts [122]. In addition, TRMM and GPM data are being utilized for the development and near-real-time processing of a global flood monitoring system [119].
Reinsurance and InsuranceDefinition of extreme precipitation thresholds to determine pay-outs for microinsurance or improved situational awareness for precipitation climatologies.GPM data are utilized by the Microinsurance Catastrophe Risk Organization (MiCRO) to forecast natural hazard probability. The data are then used to calibrate their insurance products [123].
Water Resources and AgricultureDroughtEvaluation of precipitation anomalies leveraging extended temporal record.GPM and TRMM data are utilized to provide information about drought metrics [124].
Water Resources ManagementAssessment of freshwater input to basins and reservoirs to better quantify water fluxes.Water resource managers have taught farmers to utilize IMERG data in the Indus Valley to aid in crop irrigation scheduling through cell phone updates [125].
Agricultural Applications and Food SecurityIntegration of precipitation data within agricultural models to estimate growing seasons onset, crop productivity, and other variables.GPM and TRMM data are used for hydroclimate monitoring by organizations to assess and track food and water security; for example, they are used by the Famine Early Warning Systems Network [124].
Weather and Climate ModelingNumerical Weather Prediction (NWP)Assimilation of Level 1 Tb within NWP modeling for initializing models runs.GMI Tbs are assimilated in NWP models for the improvement of weather forecasts and to correct the forecasts of TC tracks [38].
Land Surface ModelingData assimilation into land-surface models to estimate environmental variables.TRMM data can be used as input for land surface modeling [6].
Climate Variability and ChangeVerification and validation of seasonal and climate modeling.TRMM and GPM data are valuable for validating precipitation outputs from climate models, but the limitations of satellite measurements should be carefully considered in the analysis [5].
Public Health and EcologyDisaster TrackingTracking precipitation anomalies with environmental conditions for disease vectors or water-borne diseases.TRMM data have been utilized to produce malaria hotspot maps for the Brazilian Amazon [124,126,127].
Ecological ForecastingMonitor changes in precipitation that are associated with migration patterns.GPM data are used in understanding the movement ecology of migrating birds [128].
Technology and PolicySatellite Services and Data DistributionSupporting data distribution and ground systems services.TRMM TMPA and GPM IMERG data are used in the LHASA model to create global maps of the distribution of potential landslide activity. These maps improve situational awareness and disaster preparedness, especially in regions with limited ground-based observations [38].
Disclaimer/Publisher’s Note: The statements, opinions and data contained in all publications are solely those of the individual author(s) and contributor(s) and not of MDPI and/or the editor(s). MDPI and/or the editor(s) disclaim responsibility for any injury to people or property resulting from any ideas, methods, instructions or products referred to in the content.

