Article

Spatiotemporal Changes in China’s Mangroves and Their Possible Impacts on Coastal Water Quality from 1998 to 2018

1
Department of Geography and Spatial Information Techniques, Ningbo University, Ningbo 315211, China
2
Ningbo Key Laboratory of Remote Sensing and Ecological Security of Coastal Zone, Ningbo 315211, China
3
Faculty of Electrical Engineering and Computer Science, Ningbo University, Ningbo 315211, China
4
University of the Chinese Academy of Sciences, Beijing 100101, China
*
Author to whom correspondence should be addressed.
Remote Sens. 2025, 17(9), 1640; https://doi.org/10.3390/rs17091640
Submission received: 10 February 2025 / Revised: 9 April 2025 / Accepted: 1 May 2025 / Published: 6 May 2025
(This article belongs to the Section Remote Sensing for Geospatial Science)

Abstract

:
Mangroves serve as critical transitional ecosystems between land and sea. However, their large-scale possible impacts on coastal water quality have not been investigated. This study systematically examined the possible impacts of mangrove dynamics on coastal water quality in China over a 20-year period (1998–2018). Theil–Sen trend analysis and Mann-Kendall tests were employed to assess long-term trends of mangrove area and four water quality indicators: chlorophyll-a (Chl-a), colored dissolved organic matter (CDOM), particulate attenuation coefficient at 660 nm (Cp660), and seawater transparency (Secchi disk depth, SDD). Partial correlation analysis and convergent cross-mapping (CCM) techniques were applied to evaluate the relationships between mangroves and water quality parameters, while a factor detector was used to quantify the specific contribution of mangroves to water quality improvement. The results revealed the following: (1) a significant nationwide expansion of mangroves, particularly after 2005, accompanied by accelerated recovery rates; (2) notable variations in water quality indicators, with SDD and CDOM experiencing degradation, while Chl-a and Cp660 showed varying degrees of improvement; (3) statistical evidence indicating that mangrove expansion was negatively partially correlated with Chl-a concentrations, and had moderate effects on CDOM, Cp660, and SDD. These findings highlight the measurable role of mangroves in improving coastal water quality at a national scale, provide a robust scientific basis for integrated coastal zone management, and underscore the need for further investigation into the underlying mechanisms, with comprehensive consideration of the dynamic impacts of climate change and anthropogenic activities.

1. Introduction

Coastal ecosystems, serving as a crucial interface between land and sea, play a vital role in regulating water quality and maintaining ecological balance [1]. Among them, mangroves, as representative blue carbon ecosystems, are increasingly recognized as a focus of global coastal ecological research due to their distinct ecological niches and efficient biogeochemical material cycling capabilities [2]. They are primarily distributed in tropical and subtropical intertidal zones and demonstrate strong adaptability to salinity gradients, tidal fluctuations, and dynamic sedimentary conditions [3]. Mangroves exhibit a range of unique ecological functions. First, they provide vital habitats for numerous marine and terrestrial species, acting as sanctuaries for biodiversity [4,5]. Second, they effectively protect coastlines from erosion and contribute to shoreline stabilization [6,7]. In addition, they play an essential role in water purification by absorbing and filtering pollutants, thereby improving coastal water quality [8,9,10]. Collectively, these functions highlight the critical role of mangrove ecosystems in ecological conservation and environmental restoration.
Recently, under the dual pressures of intensifying human activities and climate anomalies, coastal zones are increasingly subjected to the combined impact of multiple stressors [11]. Statistical data show that, over the past two decades, the discharge of industrial wastewater from coastal industries in China has exhibited a consistent upward trend, while the input of agricultural non-point source nitrogen and phosphorus into marine environments has also significantly increased, resulting in elevated concentrations of active phosphorus in nearshore waters [12]. Water quality deterioration driven by intensive anthropogenic disturbances has triggered a cascade effect: nutrient enrichment has increased the frequency of red tides, which has subsequently reduced dissolved oxygen concentration, thereby threatening the ecological service functions of coastal wetland ecosystems [13,14,15]. In addition, mangroves exhibit particular sensitivity to climate anomalies, including both acute disturbances (e.g., extreme cold events) and chronic stressors (e.g., sea-level rise, precipitation pattern shifts) [16,17,18,19].
In this context, investigating the impact of mangroves on coastal water quality is of critical importance. Previous research has primarily focused on the ecological service functions of mangroves and their influences on regional water quality, encompassing aspects such as nutrient cycling, filtration of suspended particulate matter, and the decomposition of organic matter [20,21,22,23,24,25]. Most of these studies have relied on fixed-point sampling combined with traditional statistical methods (e.g., ANOVA and Spearman correlation analysis) to assess the relationships between mangrove attributes and water quality [20,26,27]. However, these correlations are often affected by multiple external environmental factors, such as temperature, salinity, and pH, which are interrelated and dynamic, jointly shaping the water quality characteristics of coastal zones. Despite valuable insights, current research remains limited in both spatial and temporal resolution, as well as in methodological innovation. On one hand, fixed-point monitoring fails to capture large-scale, continuous variations in coastal environments [28]. On the other hand, only a few studies have leveraged remote sensing technologies to investigate the spatial relationship between mangrove cover change and water quality parameters [29].
In contrast to earlier efforts, this study integrates long-term, multi-source satellite remote sensing data with advanced statistical and causal analysis methods, including convergent cross mapping (CCM) and the Geodetector, to investigate the spatiotemporal dynamics of mangroves and their potential influence on coastal water quality. Specifically, this study aims to analyze the spatial distribution characteristics of mangroves in China over the period 1998–2018 and assess their long-term possible impacts on coastal water quality, with the goal of addressing existing research gaps. We have focused on examining the long-term influences of mangroves on key water quality parameters, including chlorophyll-a concentration (Chl-a), suspended particulate matter, and organic matter in the water column. Using satellite remote sensing datasets, this study quantifies the possible strength of independent associations between mangrove coverage and major water quality parameters through partial correlation analysis, controlling for confounding variables such as sea surface temperature. In addition, the CCM algorithm is employed to identify and evaluate potential nonlinear causal relationships between mangrove ecosystems and coastal water quality dynamics. A factor detector is further applied to evaluate the degree to which mangroves specifically contribute to water quality improvement. By integrating these approaches, the study aims to provide a robust theoretical basis and practical guidance for the protection, management, and restoration of mangroves and coastal environments. The findings are expected to contribute to the sustainable use and effective conservation of coastal ecological resources, while supporting the development of greener and healthier marine environments.

2. Materials and Methods

2.1. Study Area

The study area encompassed all mangrove plantations located in six coastal provinces of China—Guangxi, Guangdong, Fujian, Zhejiang, Hainan, and Taiwan, as well as the Hong Kong and Macao Special Administrative Region (Figure 1). Geographically, the region spans a wide range, extending from 18°12′ to 29°32′N and 108°03′ to 122°00′E. According to remote sensing monitoring data, Guangxi (37.2% of the total mangrove area in China), Guangdong (29.8%), Fujian (12.5%), Hainan (9.7%), and Zhejiang (2.3%) form the primary distribution zones for China’s mangroves, collectively accounting for 91.5% of the country’s total mangrove area [30]. Notably, due to the implementation of multiple ecological restoration initiatives in recent years, the mangrove area in China has exhibited consistent growth. This positive trend has positioned China as one of the few countries globally to achieve a net increase in mangrove coverage [31,32].

2.2. Data Source and Preprocessing

The dataset for this study contains mangrove, meteorological, and marine ecosystem data. The Mangrove Dynamics in China (MDC) dataset was utilized to represent mangrove dynamics, spanning the period from 1990 to 2020 [33]. This dataset was developed through the Google Earth Engine (GEE) platform and integrates 13,308 Landsat 5/7/8 satellite images, which offer comprehensive coverage and detailed insights into mangrove changes over time. These images were meticulously selected and processed to generate precise mappings of mangrove areas.
The marine ecosystem dataset includes sea surface salinity (SSS), sea surface temperature (SST), pH, and various water quality parameters, such as surface chlorophyll-a (Chl-a) concentration, absorption coefficients of colored dissolved organic matter (CDOM), particulate attenuation coefficients at 660 nm (Cp660), and seawater transparency (Secchi disk depth, SDD). Specifically, SSS and SST data were derived from the 0.5° gridded global ocean salinity and temperature dataset provided by the Institute of Atmospheric Physics (IAP), Chinese Academy of Sciences (CAS) [34]. Meanwhile, pH data were acquired from the global gridded dataset of pCO2 and pH developed by the Institute of Oceanography, CAS [35], and made publicly available via the Marine Science Data Center of the Chinese Academy of Sciences (http://msdc.qdio.ac.cn, accessed on 13 October 2023). Chl-a concentration data were sourced from a merged 4 km resolution global surface chlorophyll-a dataset [36]. In contrast, data for CDOM, Cp660, and SDD were extracted from the SeaWiFS (1998–2002) and MODIS (2003–2018) global ocean ecosystem remote sensing datasets, provided by the National Earth System Science Data Center (http://www.geodata.cn, accessed on 24 October 2023).
Meteorological data were obtained from the ERA5 reanalysis dataset developed by the European Center for Medium-Range Weather Forecasts (ECMWF) [37]. This dataset offers high-resolution, continuous time-series data encompassing various components of the atmosphere, land, and ocean. From these, precipitation and solar radiation data were specifically extracted for subsequent analysis in this study.
All data were processed using ArcGIS by applying a standardized projected coordinate system and calculating annual averages. Given that each dataset exhibited varying temporal and spatial resolutions, a 4 km × 4 km grid was constructed based on the Chl-a concentration data, and all variables were resampled to a consistent spatial resolution of 4 km and a uniform temporal span from 1998 to 2018 to ensure data consistency and analytical feasibility. For areas with missing values, kriging spatial interpolation was applied to align the spatial extent with the mangrove dataset. This preprocessing procedure provides a robust basis for the comprehensive analysis of mangrove dynamics and their influence on various water quality parameters.

2.3. Methods

2.3.1. Trend Analysis

In the analysis of long-term series data, the combined application of Theil–Sen median trend analysis and the Mann-Kendall test is widely recognized as an effective and robust statistical approach [38,39]. In this study, these two methods were integrated to accurately capture the temporal and spatial trends of mangrove area and water quality parameters.
The Theil–Sen median trend analysis estimates the median of all pairwise slopes between time-series data points, providing a robust trend estimate that is less sensitive to outliers [40,41]. It is calculated as:
S = M e d i a n x j x i j i
where x j and x i represent the values at times j and i , respectively. A positive S indicates an increasing trend, while a negative S indicates a decreasing trend.
The Mann-Kendall test, a non-parametric method, is used to determine whether a significant monotonic trend exists in time-series data [42]. It evaluates whether a trend exists without requiring data to follow a specific distribution. The test statistic Z is calculated as:
Z = S 1 v a r S   ,   S > 0 0   ,   S = 0 S + 1 v a r S   ,   S < 0
where S = i = 1 n 1 j = i + 1 n s g n ( x j x i ) , n is the length of the time series, and s g n is a sign function defined as follows:
s g n x j x i = 1   ,   x j x i > 0 0   ,   x j x i = 0 1   ,   x j x i < 0
The variance of S is calculated as:
v a r S = n ( n 1 ) ( 2 n + 5 ) 18
At a significance level α , a time series is considered to exhibit a statistically significant trend if Z > Z 1 α / 2 , where Z 1 α / 2 corresponds to the critical value of the standard normal distribution. Specifically, Z > 1.65 , 1.96   a n d   2.58 correspond to significance levels of 90%, 95%, and 99%, respectively. In general, a trend is considered significant at α = 0.05 , and highly significant under stricter thresholds.
Based on the calculated Theil–Sen slope S and the Mann-Kendall statistic Z , we classified the trends into nine distinct categories (Table 1):

2.3.2. Partial Correlation Analysis

Partial correlation analysis is a statistical method that is used to examine the strength and direction of the relationship between two specific variables while controlling for the influence of one or more other variables. The resulting quantitative measure is the partial correlation coefficient [43]. The formula for calculating the partial correlation coefficient is as follows:
r x 1 y · x 2 = r x 1 y r x 1 x 2 r x 2 y 1 r x 1 x 2 2 1 r x 2 y 2
In this formula, r x 1 y · x 2 represents the partial correlation coefficient between x 1 and y , controlling for the effect of x 2 . The terms r x 1 y , r x 2 y , and r x 1 x 2 denote the simple (i.e., unadjusted) Pearson correlation coefficients between the respective variable pairs. The partial correlation coefficient ranges from –1 to 1. A positive value indicates a positive partial correlation between x 1 and y , after removing the effect of x 2 , while a negative value indicates a negative partial association.

2.3.3. Convergent Cross-Mapping Method

Building upon the results of the partial correlation analysis, this study further employs the advanced CCM method to investigate the complex causal relationships between mangroves and water quality indicators. Given that statistical correlation does not imply causation, the CCM algorithm was innovatively introduced to more accurately detect potential causal interactions. The CCM method, developed by Sugihara and his team, is grounded in Takens’ embedding theorem and the theory of state-space reconstruction. It is particularly well-suited to identifying causality in nonlinear systems, especially when the coupling between variables is of weak to moderate strength. These characteristics make CCM uniquely effective in the field of ecological time-series analysis [44]. To quantify the strength of the causal effect of variable x on y , the CCM correlation coefficient ρ is computed using the following formula [45]:
ρ = cov x , x ^ σ x σ x ^
where cov x , x ^ denotes the covariance between the observed value x and the predicted values x ^ and σ x σ x ^ represent their respective standard deviations. A higher value of ρ indicates a stronger causal influence of x on y .

2.3.4. Geodetector

Geodetector is a statistical modeling approach based on spatially stratified heterogeneity, designed to uncover potential relationships between geographic factors and environmental variables by quantifying spatial variation and the spatial coupling between variables [46]. The method consists of four main components: the factor detector, interaction detector, risk detector, and ecological detector [47]. Among these, the factor detector is the most relevant to this study. The primary aim of the factor detector is to assess the degree to which a geographical factor explains the spatial variation of a target environmental variable. This is measured using the q - statistic, which quantifies the explanatory power of the factor. A higher q -value indicates stronger explanatory capability for the spatial distribution of the dependent variable [48]. The q -statistic is calculated using the following formula:
q = 1 h = 1 L N h σ h 2 N σ 2
where N is the total number of samples, σ 2 is the overall variance of the target variable, L is the number of strata (i.e., classes or subregions) defined by the geographic factor, and N h and σ h 2 denote the number of samples and the variance within the h -th stratum, respectively. The q -value ranges from 0 to 1, with higher values indicating that the factor more strongly accounts for the observed spatial heterogeneity in the target variable.

3. Results

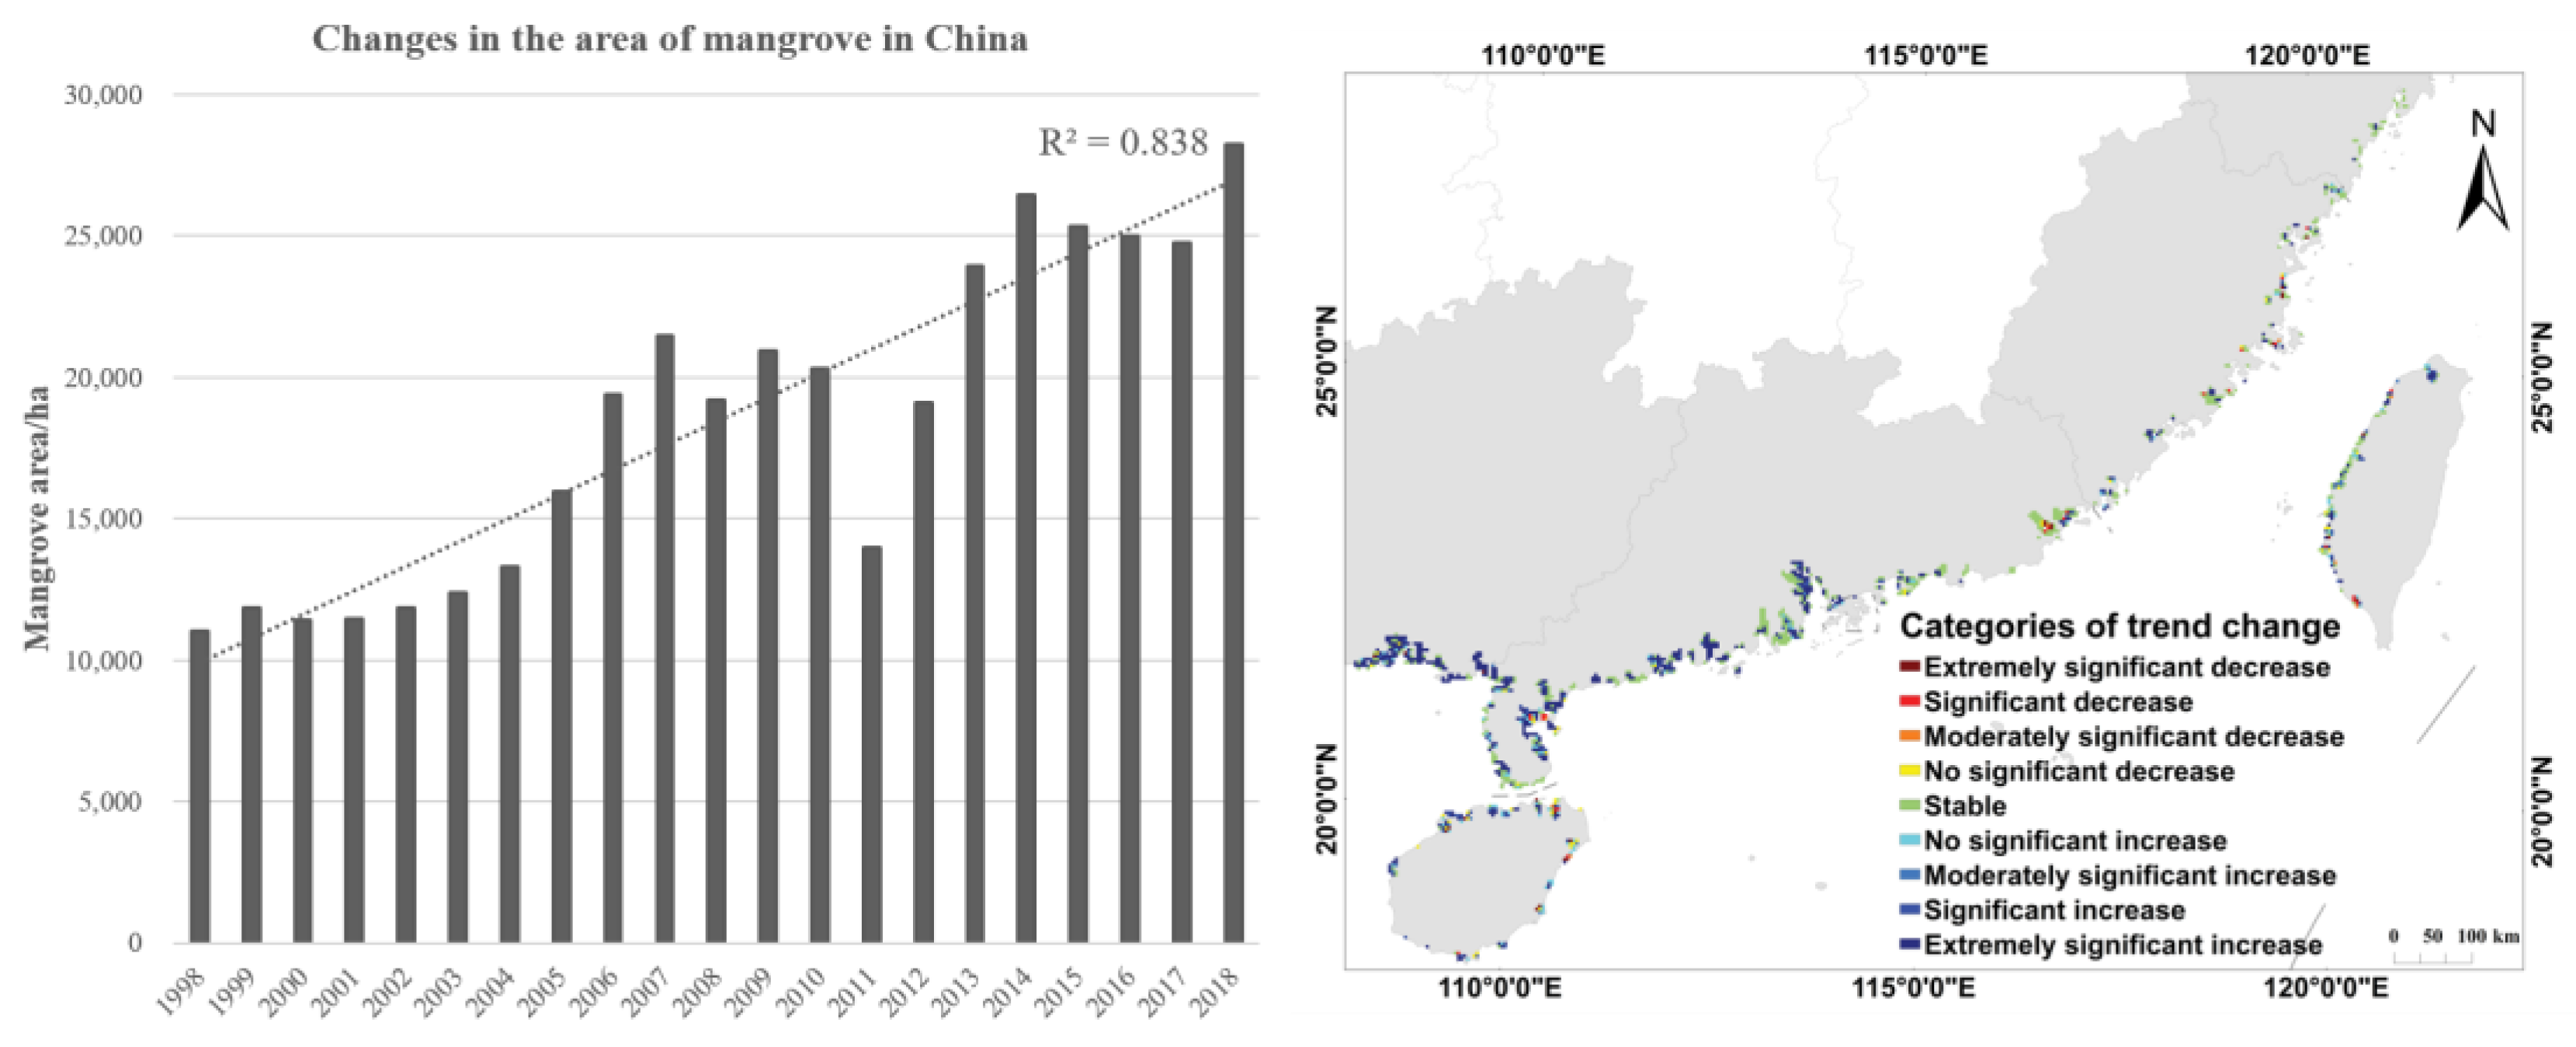
3.1. Dynamics of Mangroves in China from 1998 to 2018

From 1998 to 2018, the distribution and extent of mangroves in China underwent significant changes, with the total mangrove area increasing from 11,043 ha to 28,229 ha (Figure 2). This corresponds to an average annual growth rate of 5.8%, indicating a general trend of ecological restoration in mangrove ecosystems. From 1998 to 2005, the mangrove area remained relatively stable, with annual fluctuations of less than 3%. After 2005, a period of rapid recovery began, particularly following 2011, when the average annual growth rate accelerated to 9.2%. Despite the overall upward trend, there was a notable anomaly in 2011, during which the mangrove area declined by 12.5%—an abrupt deviation from the long-term expansion pattern.
From a spatial perspective, areas of improvement (including significant increases) in mangroves nationwide accounted for 91.5%, while areas of degradation comprised only 8.5%, reflecting a clear spatial differentiation pattern characterized as “prominent improvement in the south and stability in the north”. Notably, Guangxi and Guangdong provinces stood out in mangrove ecological restoration, contributing 78.3% of the national improvement area. As the core regions of mangrove distribution in China, Guangxi and Guangdong together held 72.5% of the country’s total mangrove area. Meanwhile, areas showing no significant change (38.6%) were primarily concentrated along the newly established coastal mangrove belt in Zhejiang Province.

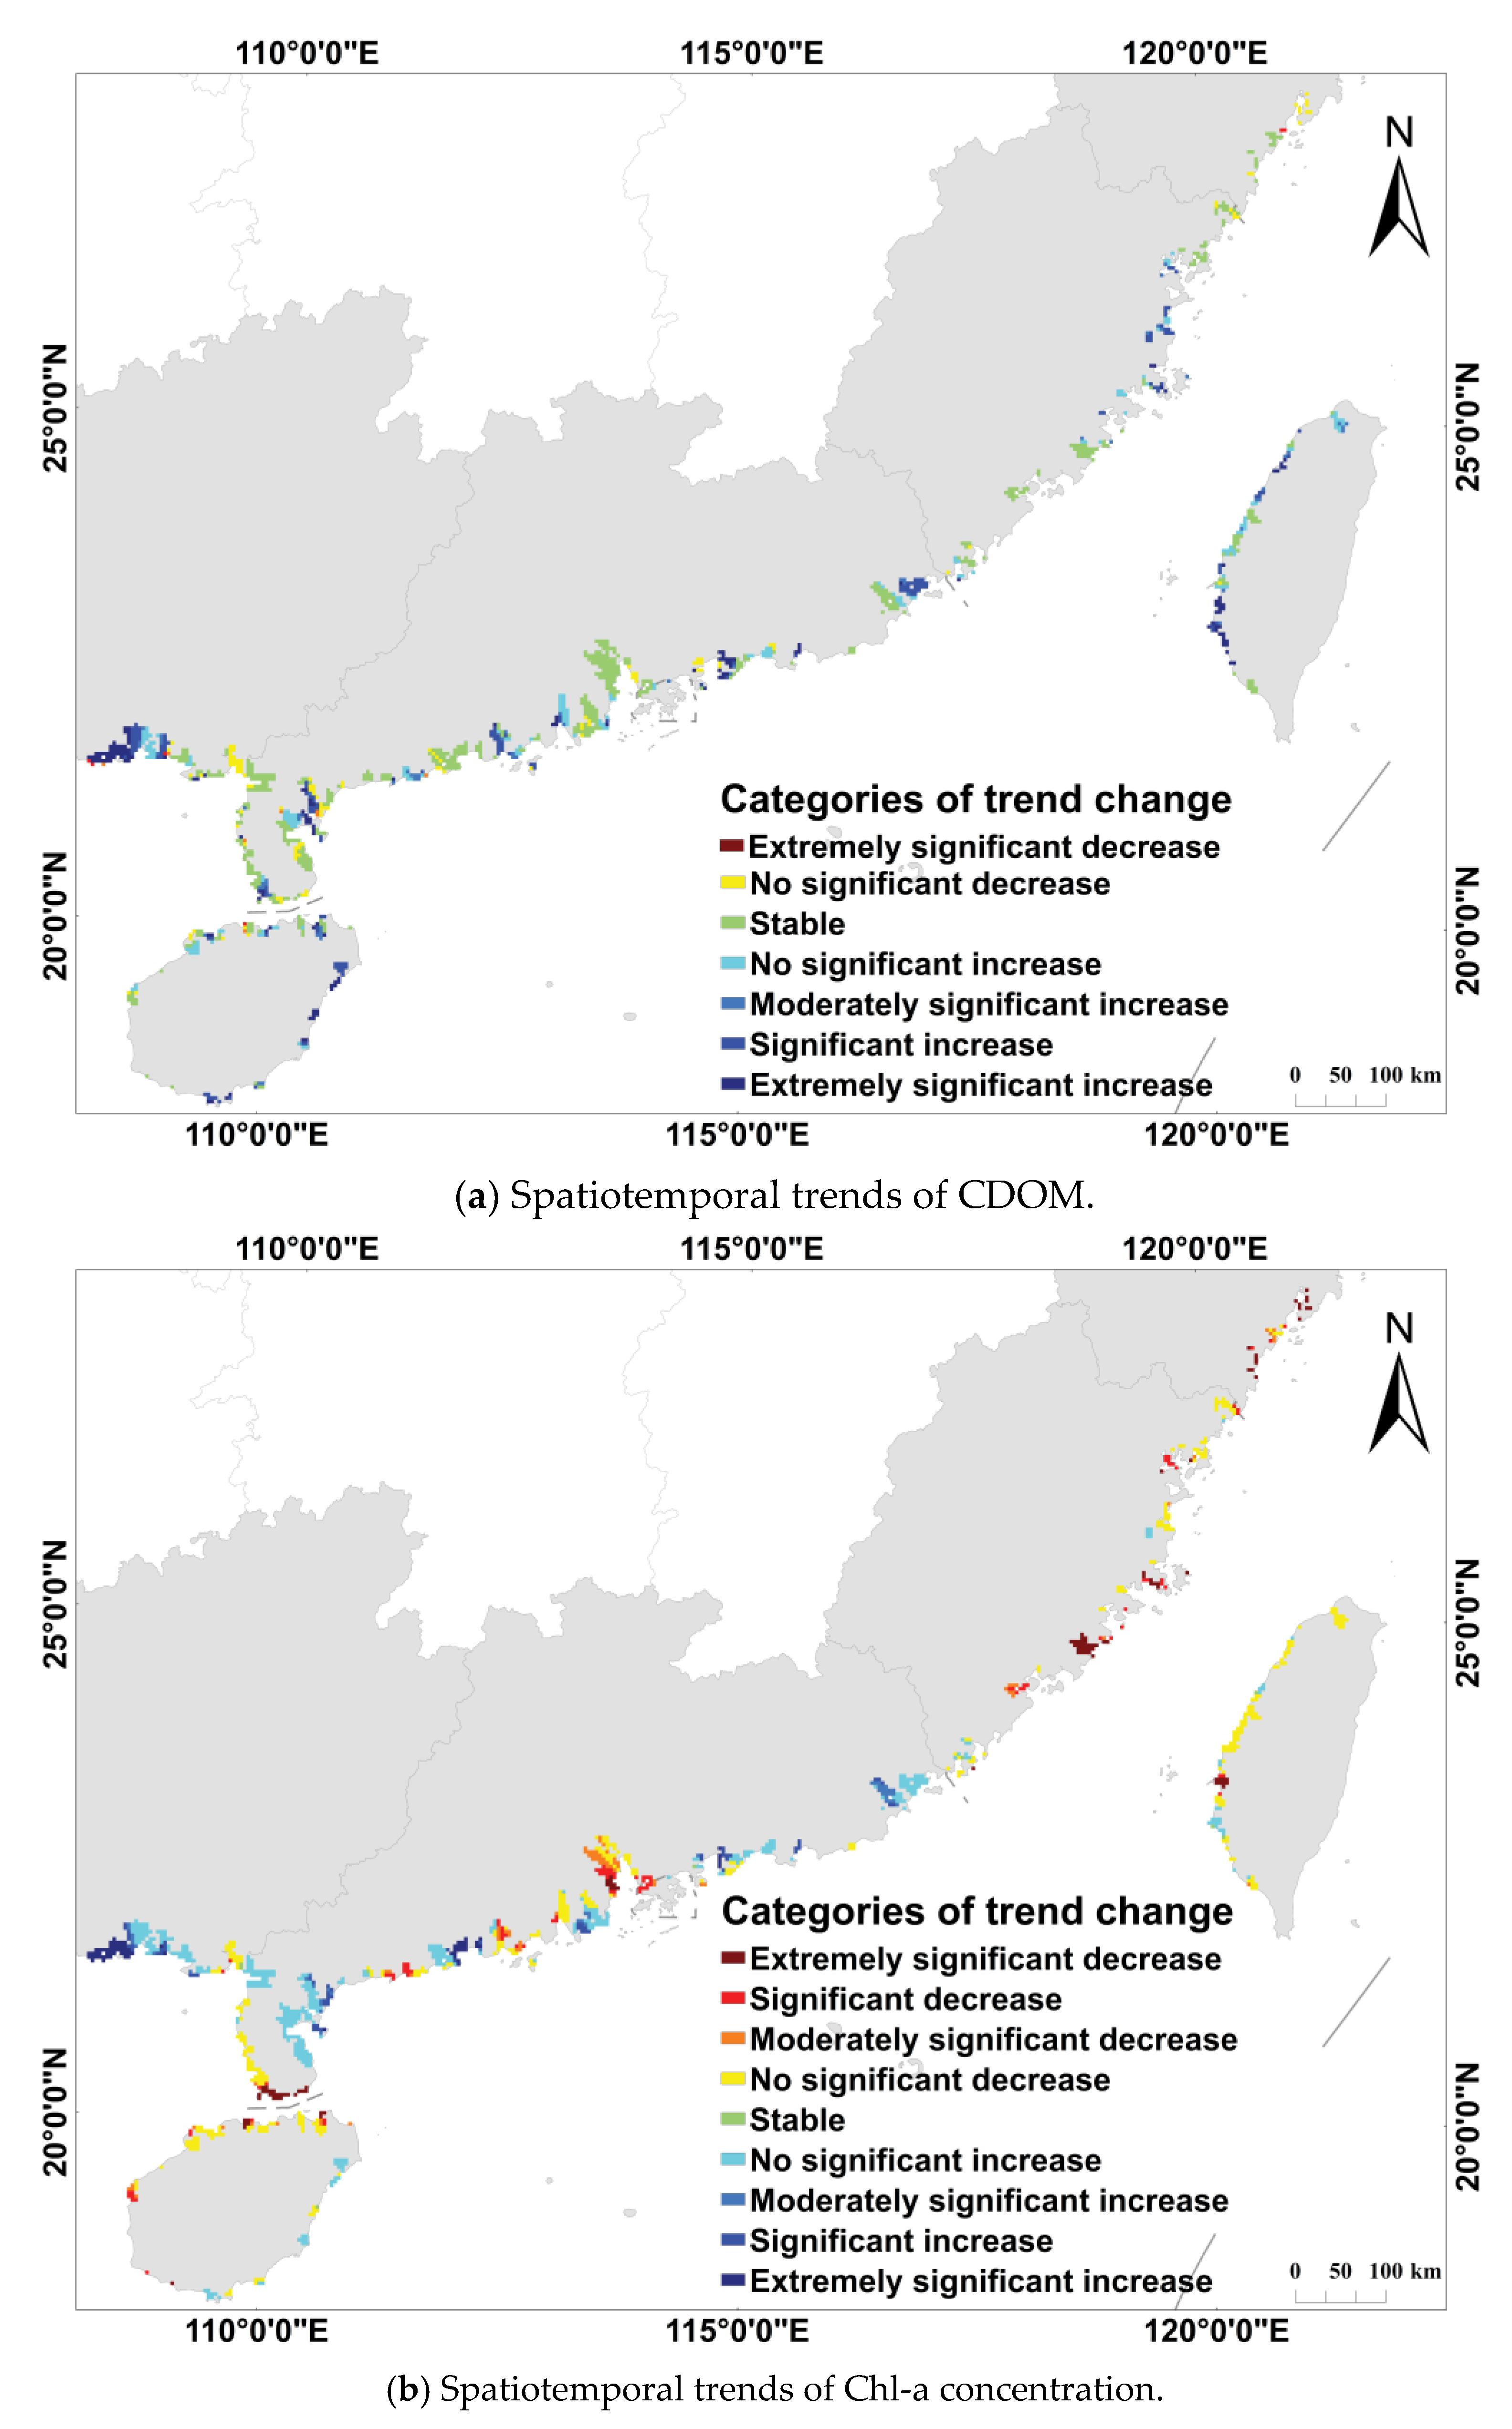
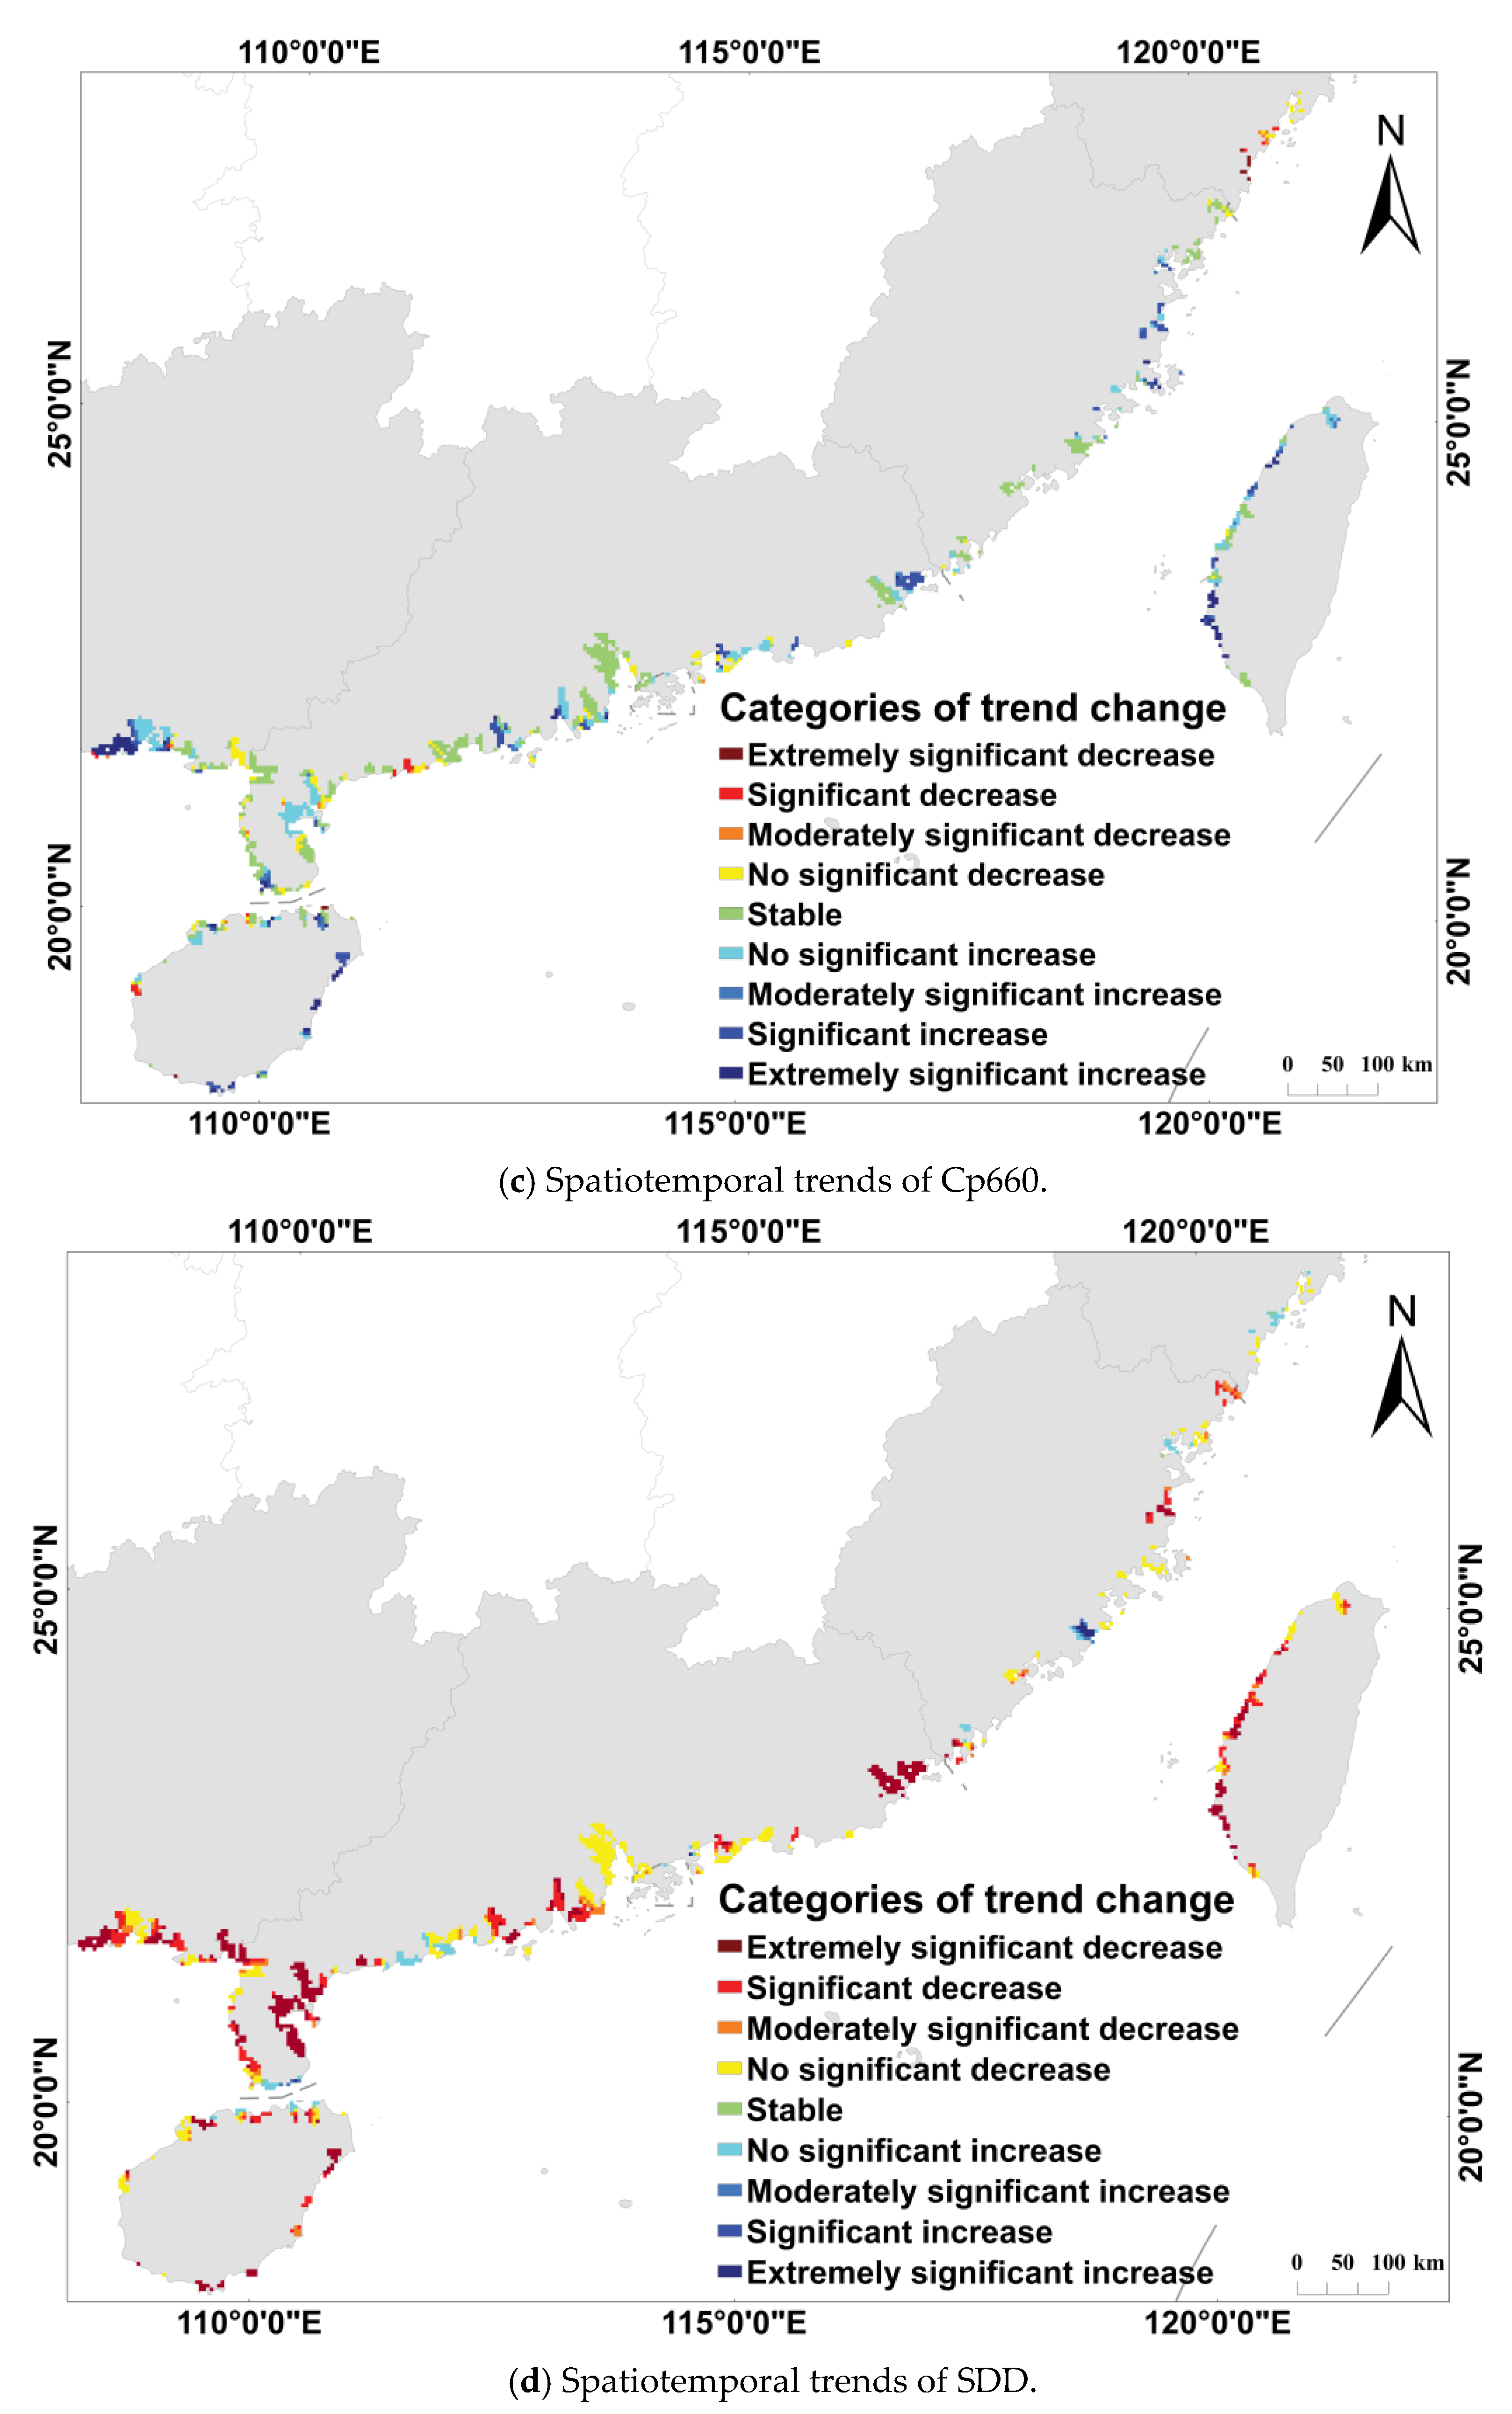
3.2. Dynamics of Water Quality Parameters in Coastal from 1998 to 2018

With the aid of extensive multi-source remote sensing datasets spanning from 1998 to 2018, we systematically characterized the spatiotemporal evolution of water quality parameters in the marine areas surrounding China’s mangroves (Figure 3). Through in-depth spatial statistical analysis, we found that SDD exhibited a significant degradation trend, with approximately 58.7% of the study area showing a notable decline. Similarly, CDOM also showed a significant degradation trend, with the most pronounced increases observed in Guangxi, the eastern part of Hainan, and Fuzhou, Fujian Province. Cp660 displayed an overall state of dynamic equilibrium, with 51.5% of the area showing no significant change. However, a significant decline in Cp660 was detected in Zhejiang Province. The spatial evolution of Chl-a concentration revealed marked heterogeneity, with both improvement and degradation trends coexisting. A decrease in Chl-a concentration was observed in 53.7% of the area—mainly located in Guangdong, Fujian, and Zhejiang—while 13.6% of the area, predominantly in Guangxi, showed a significant increase in Chl-a concentration.

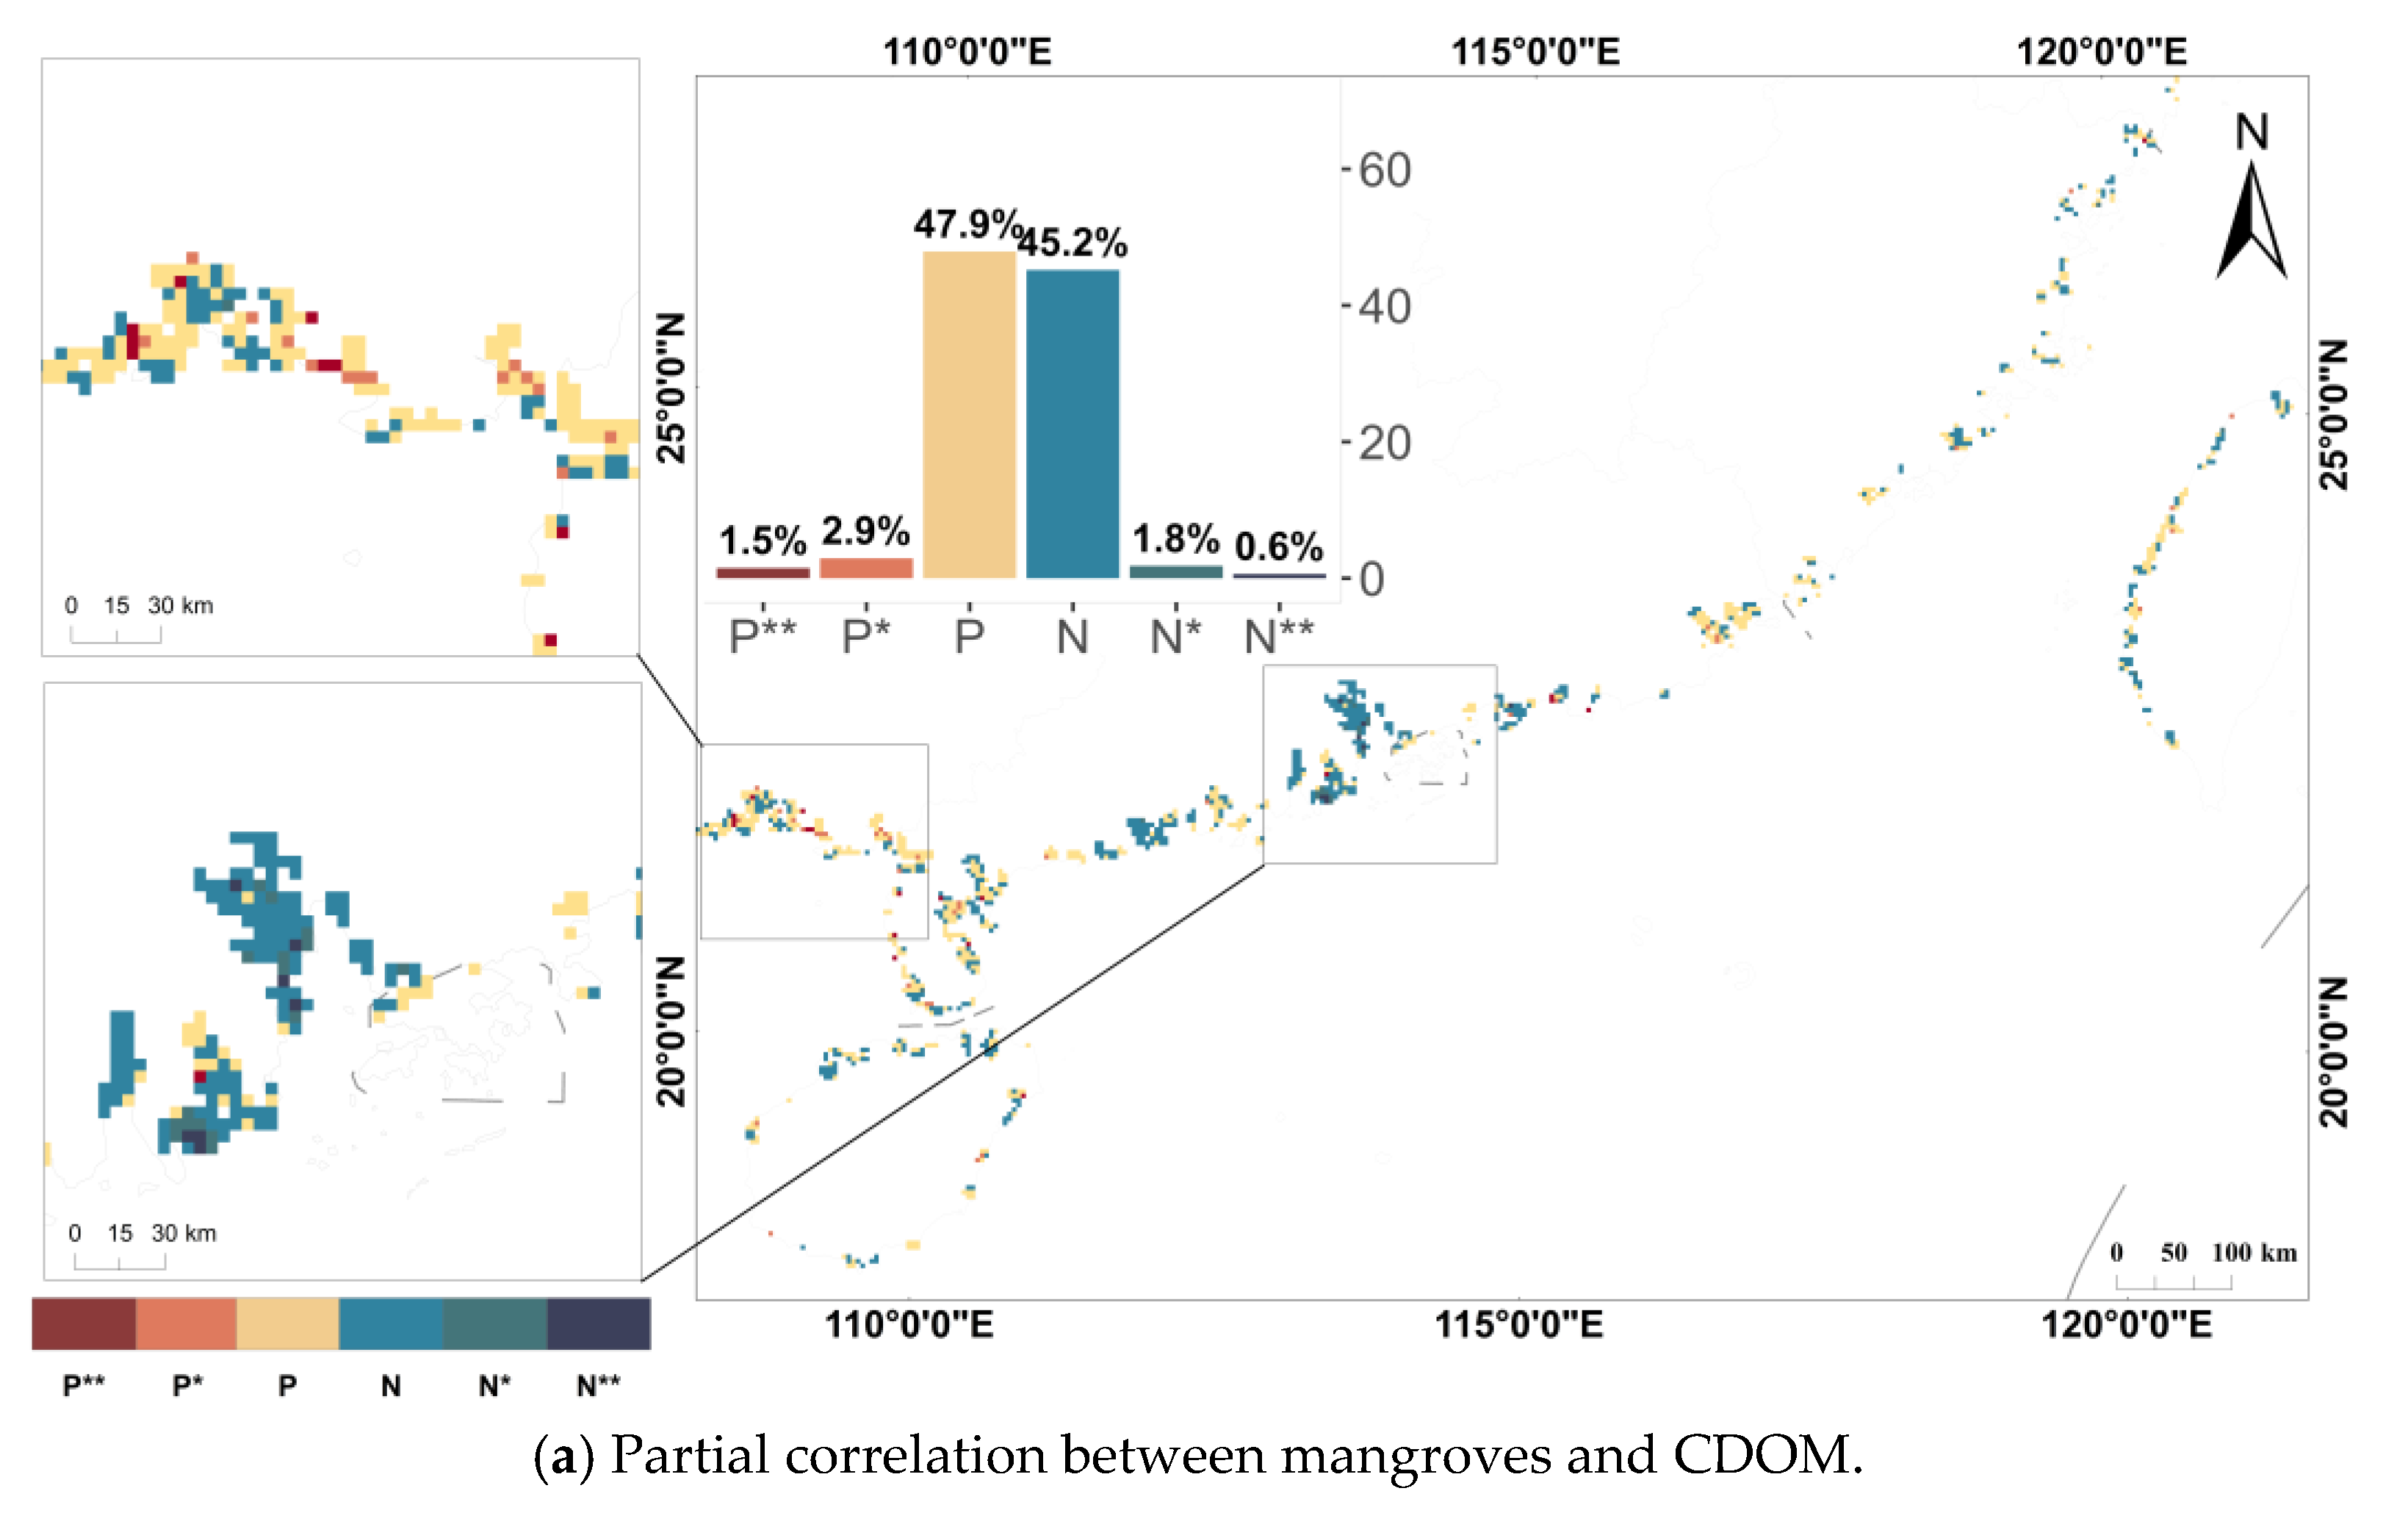
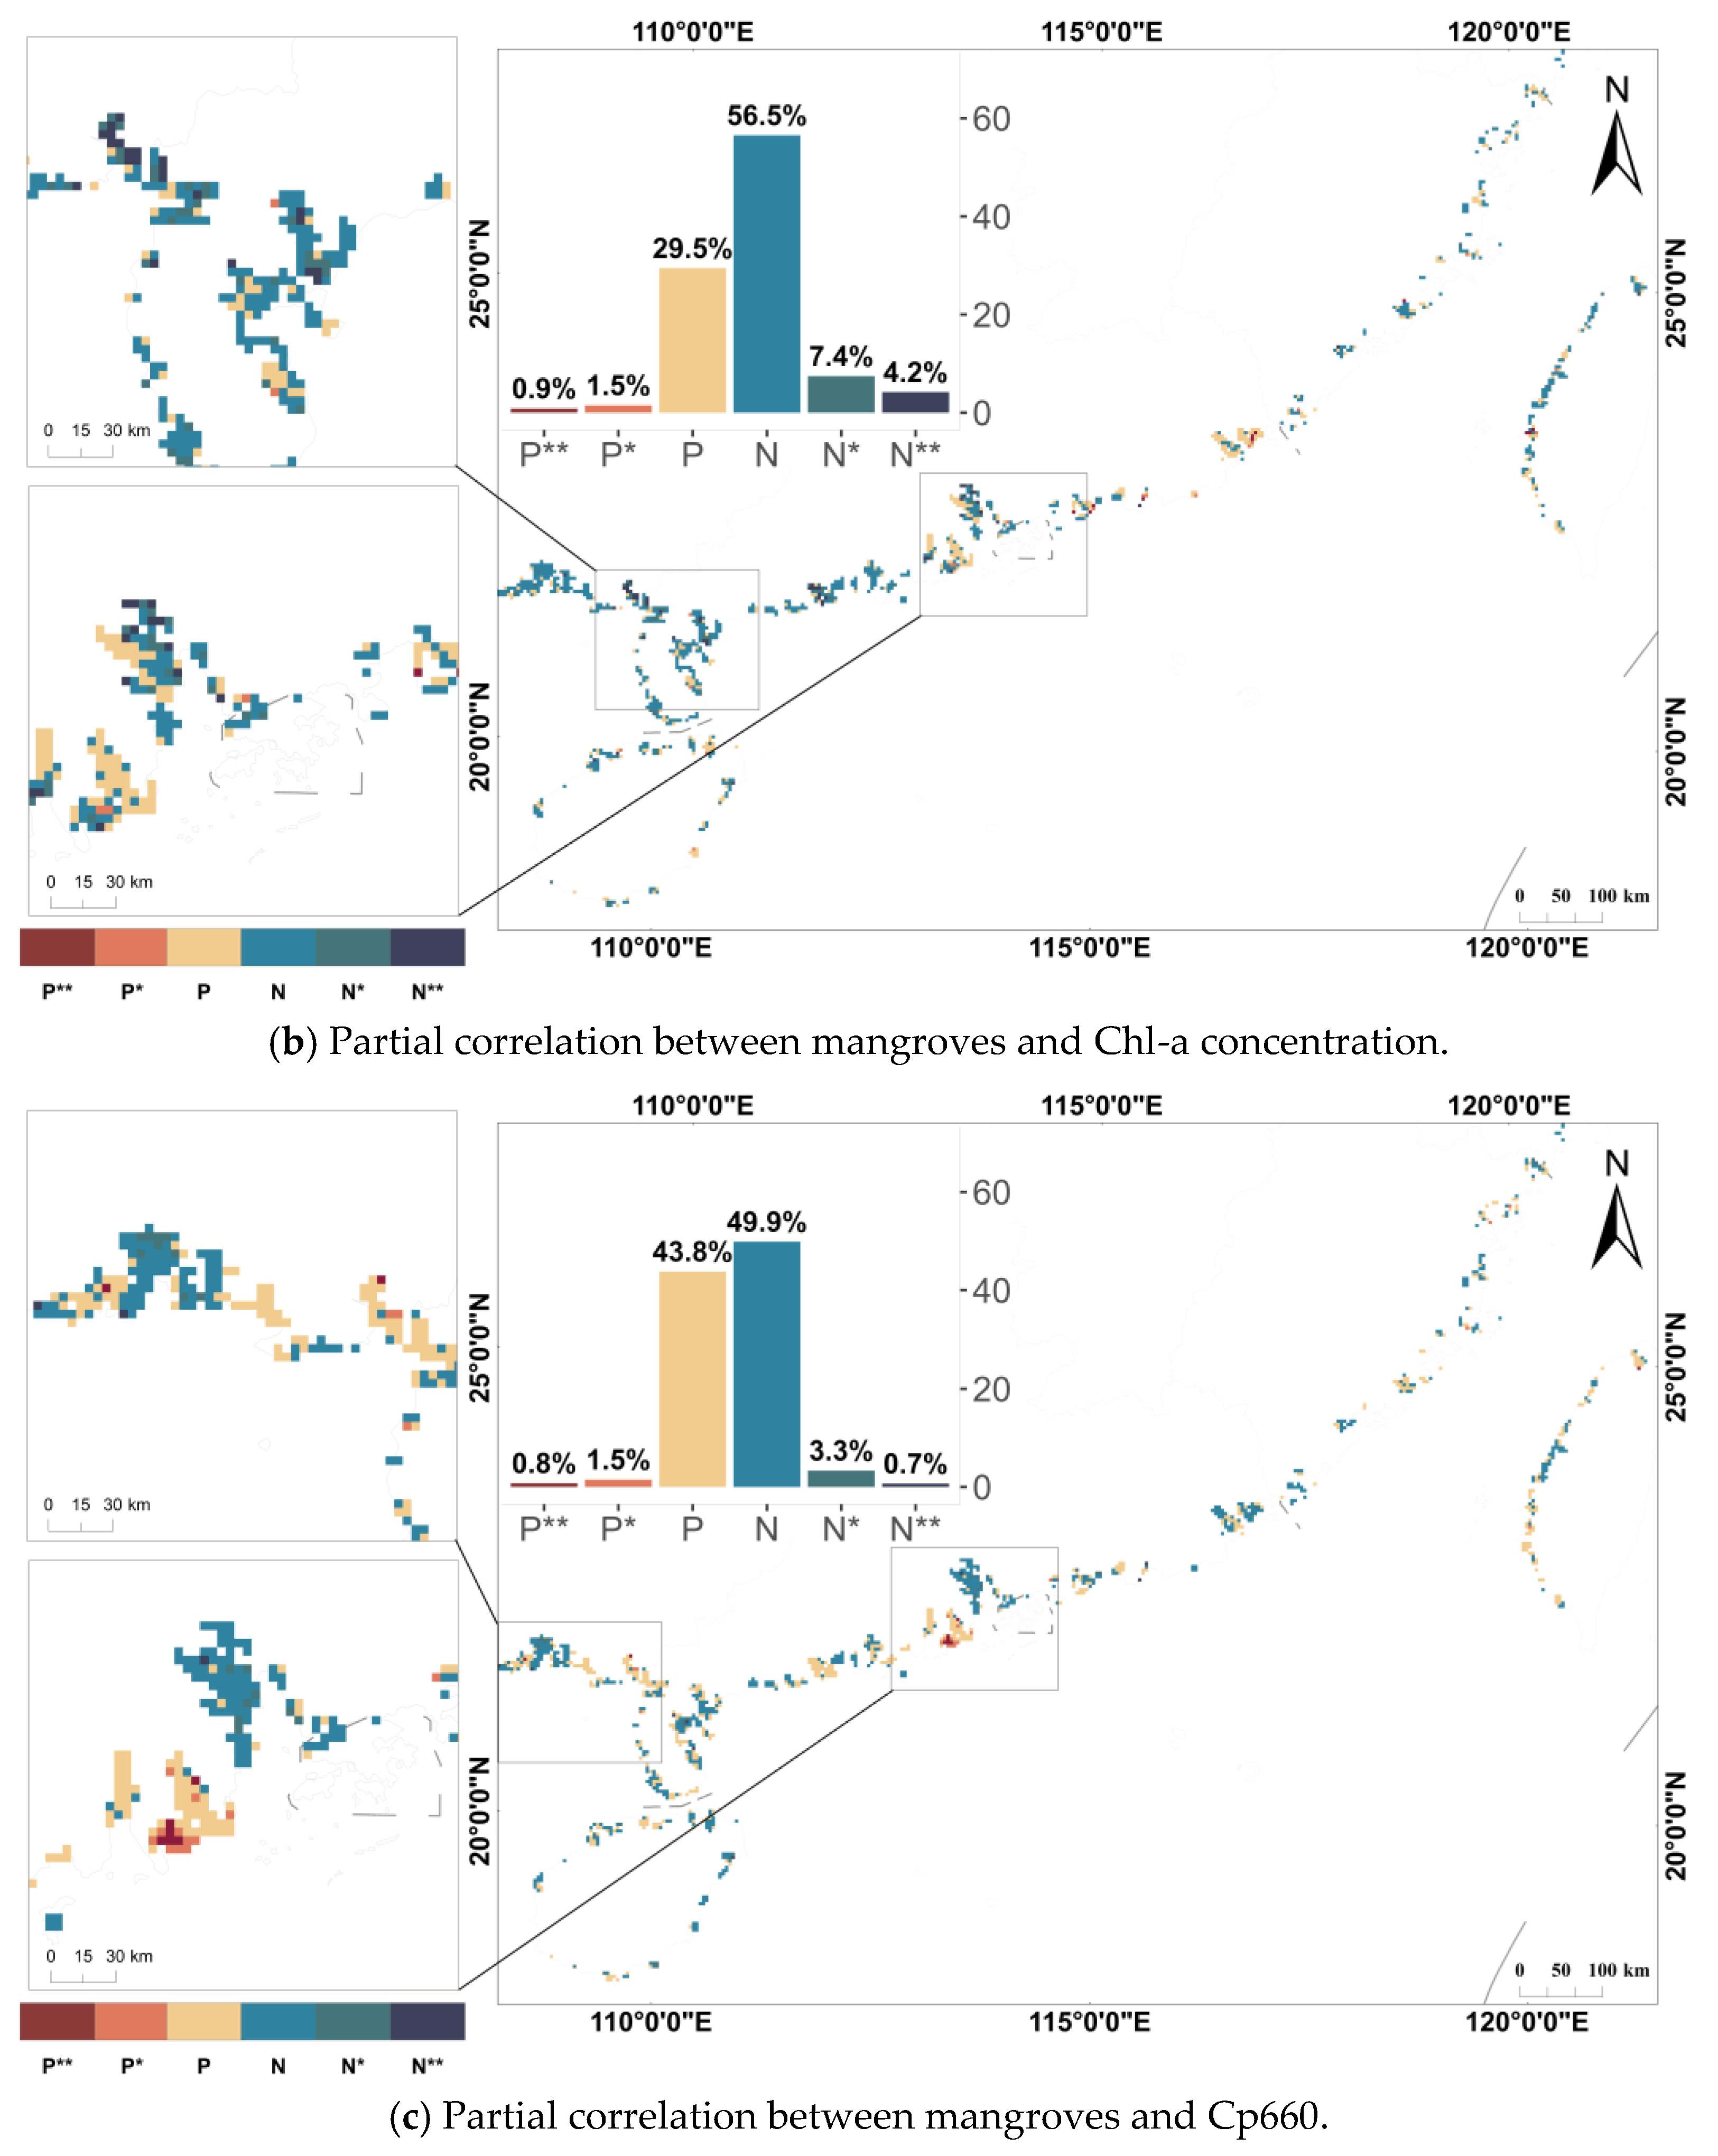
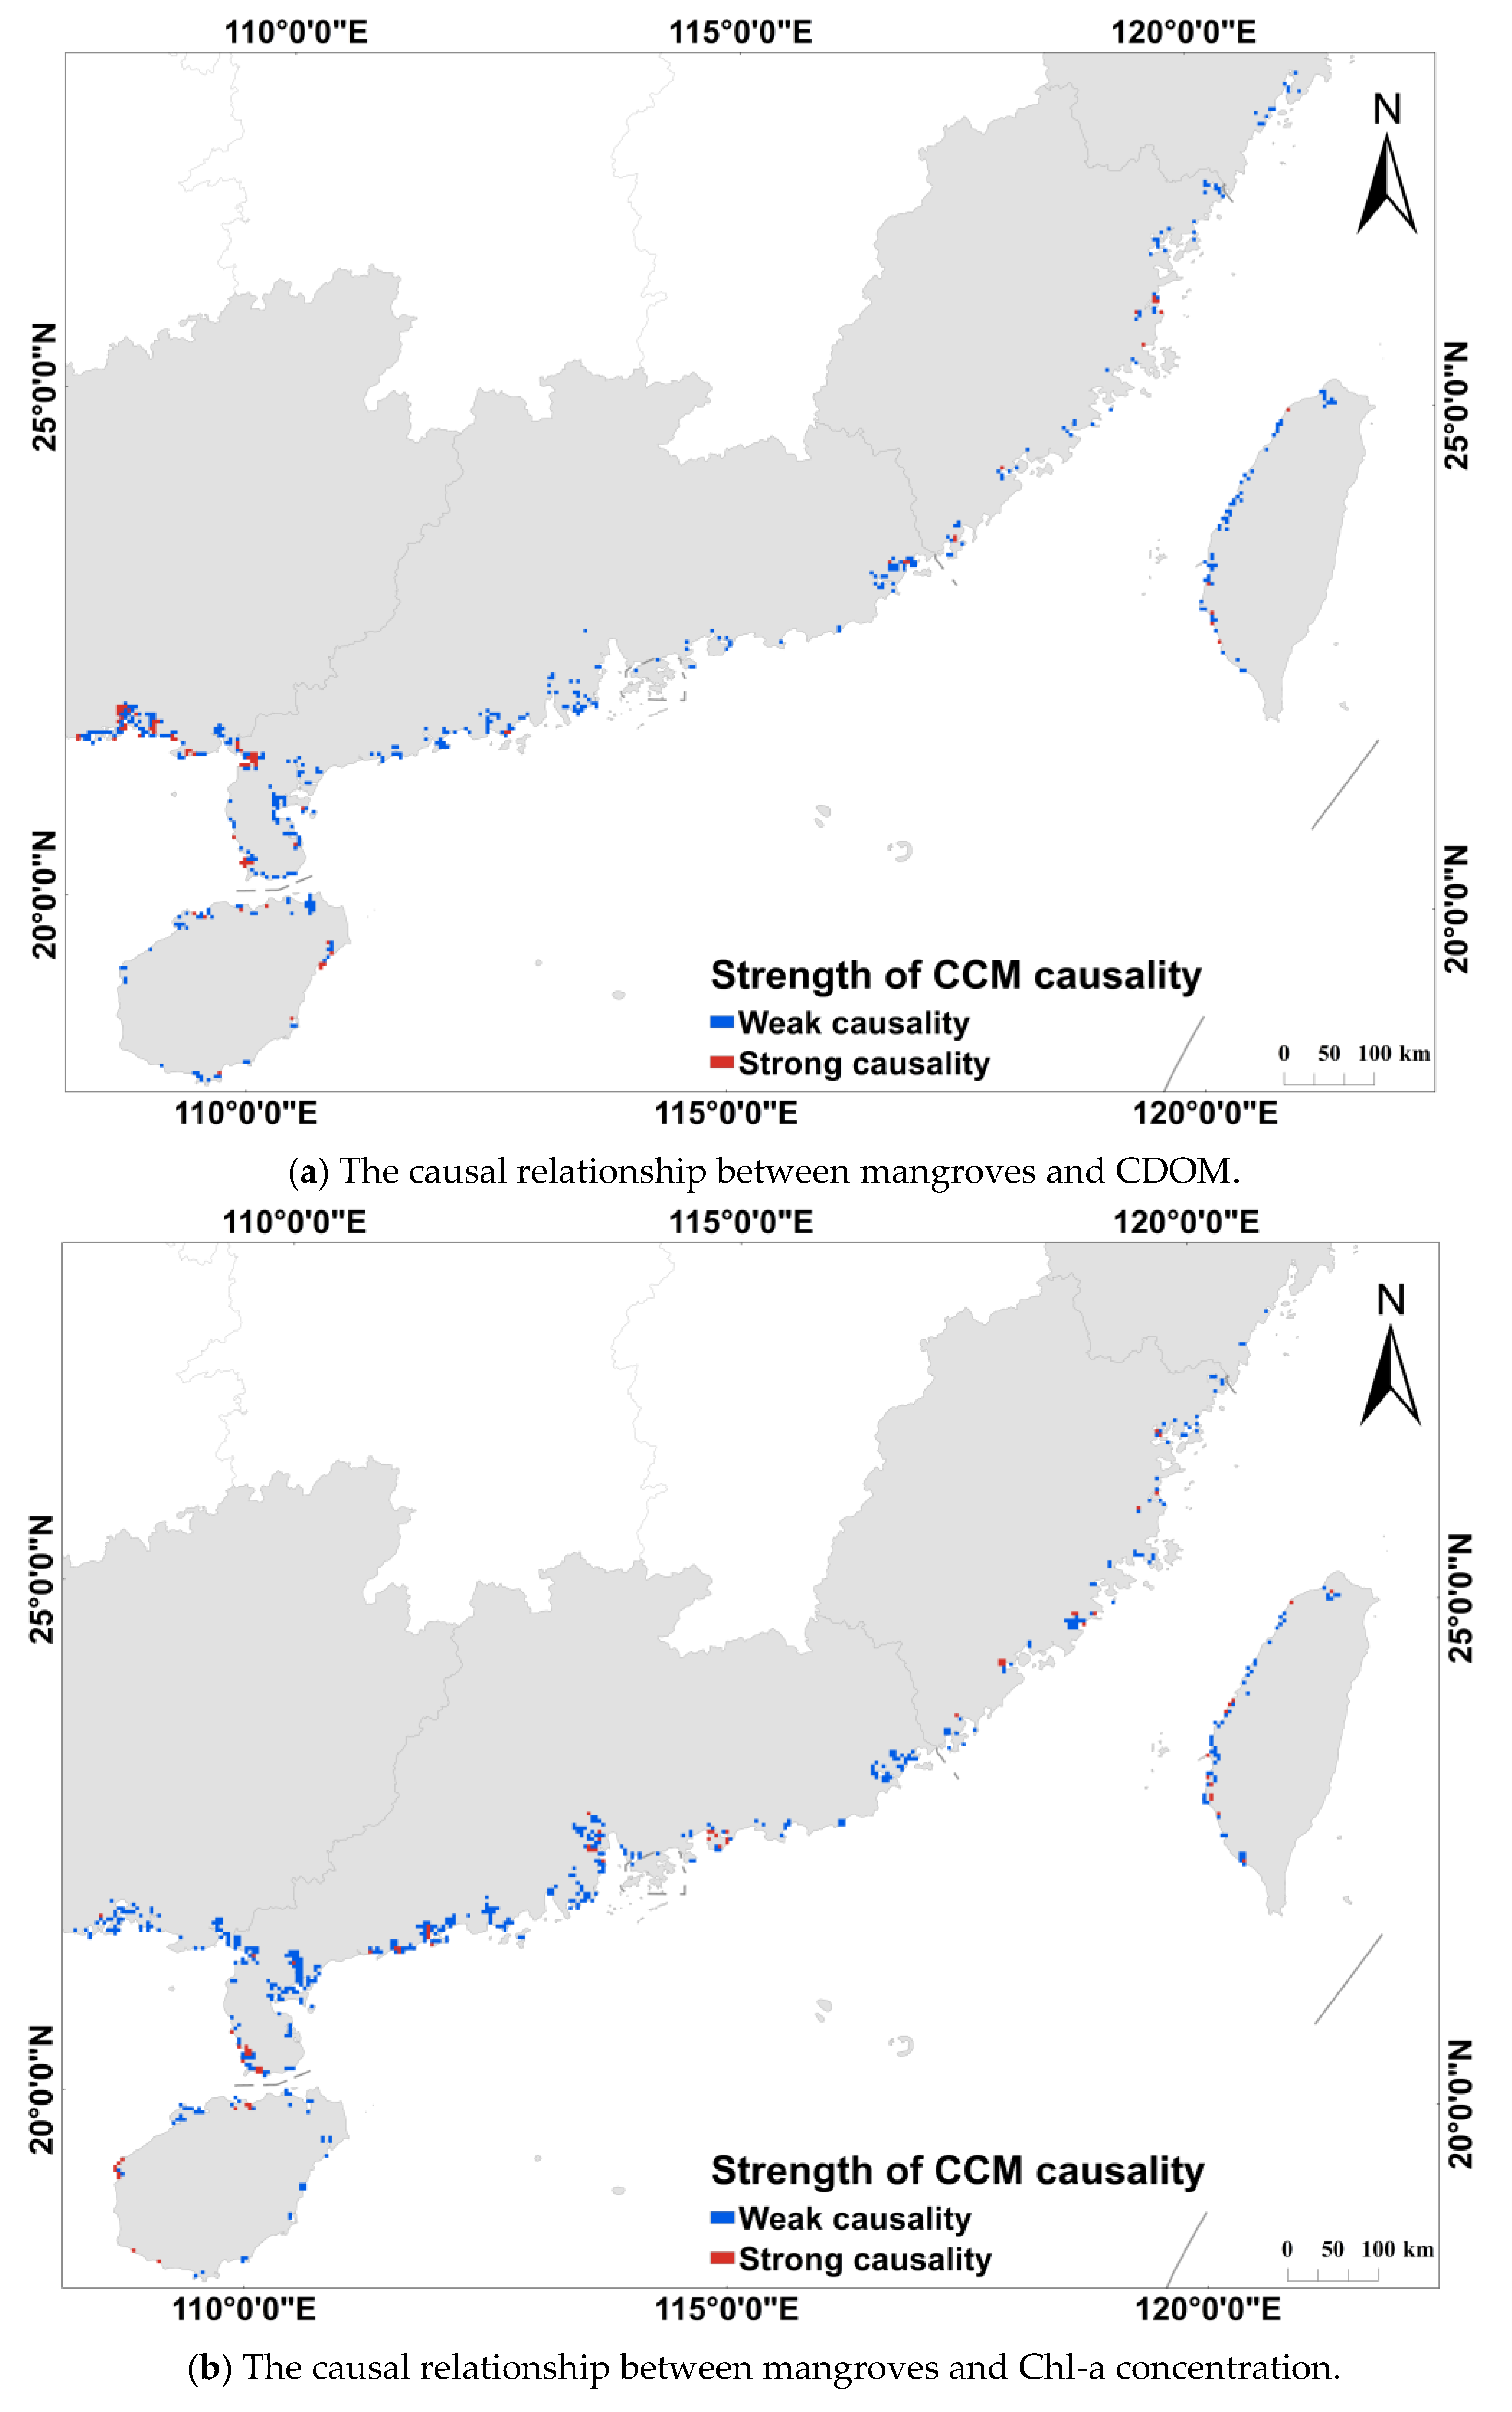
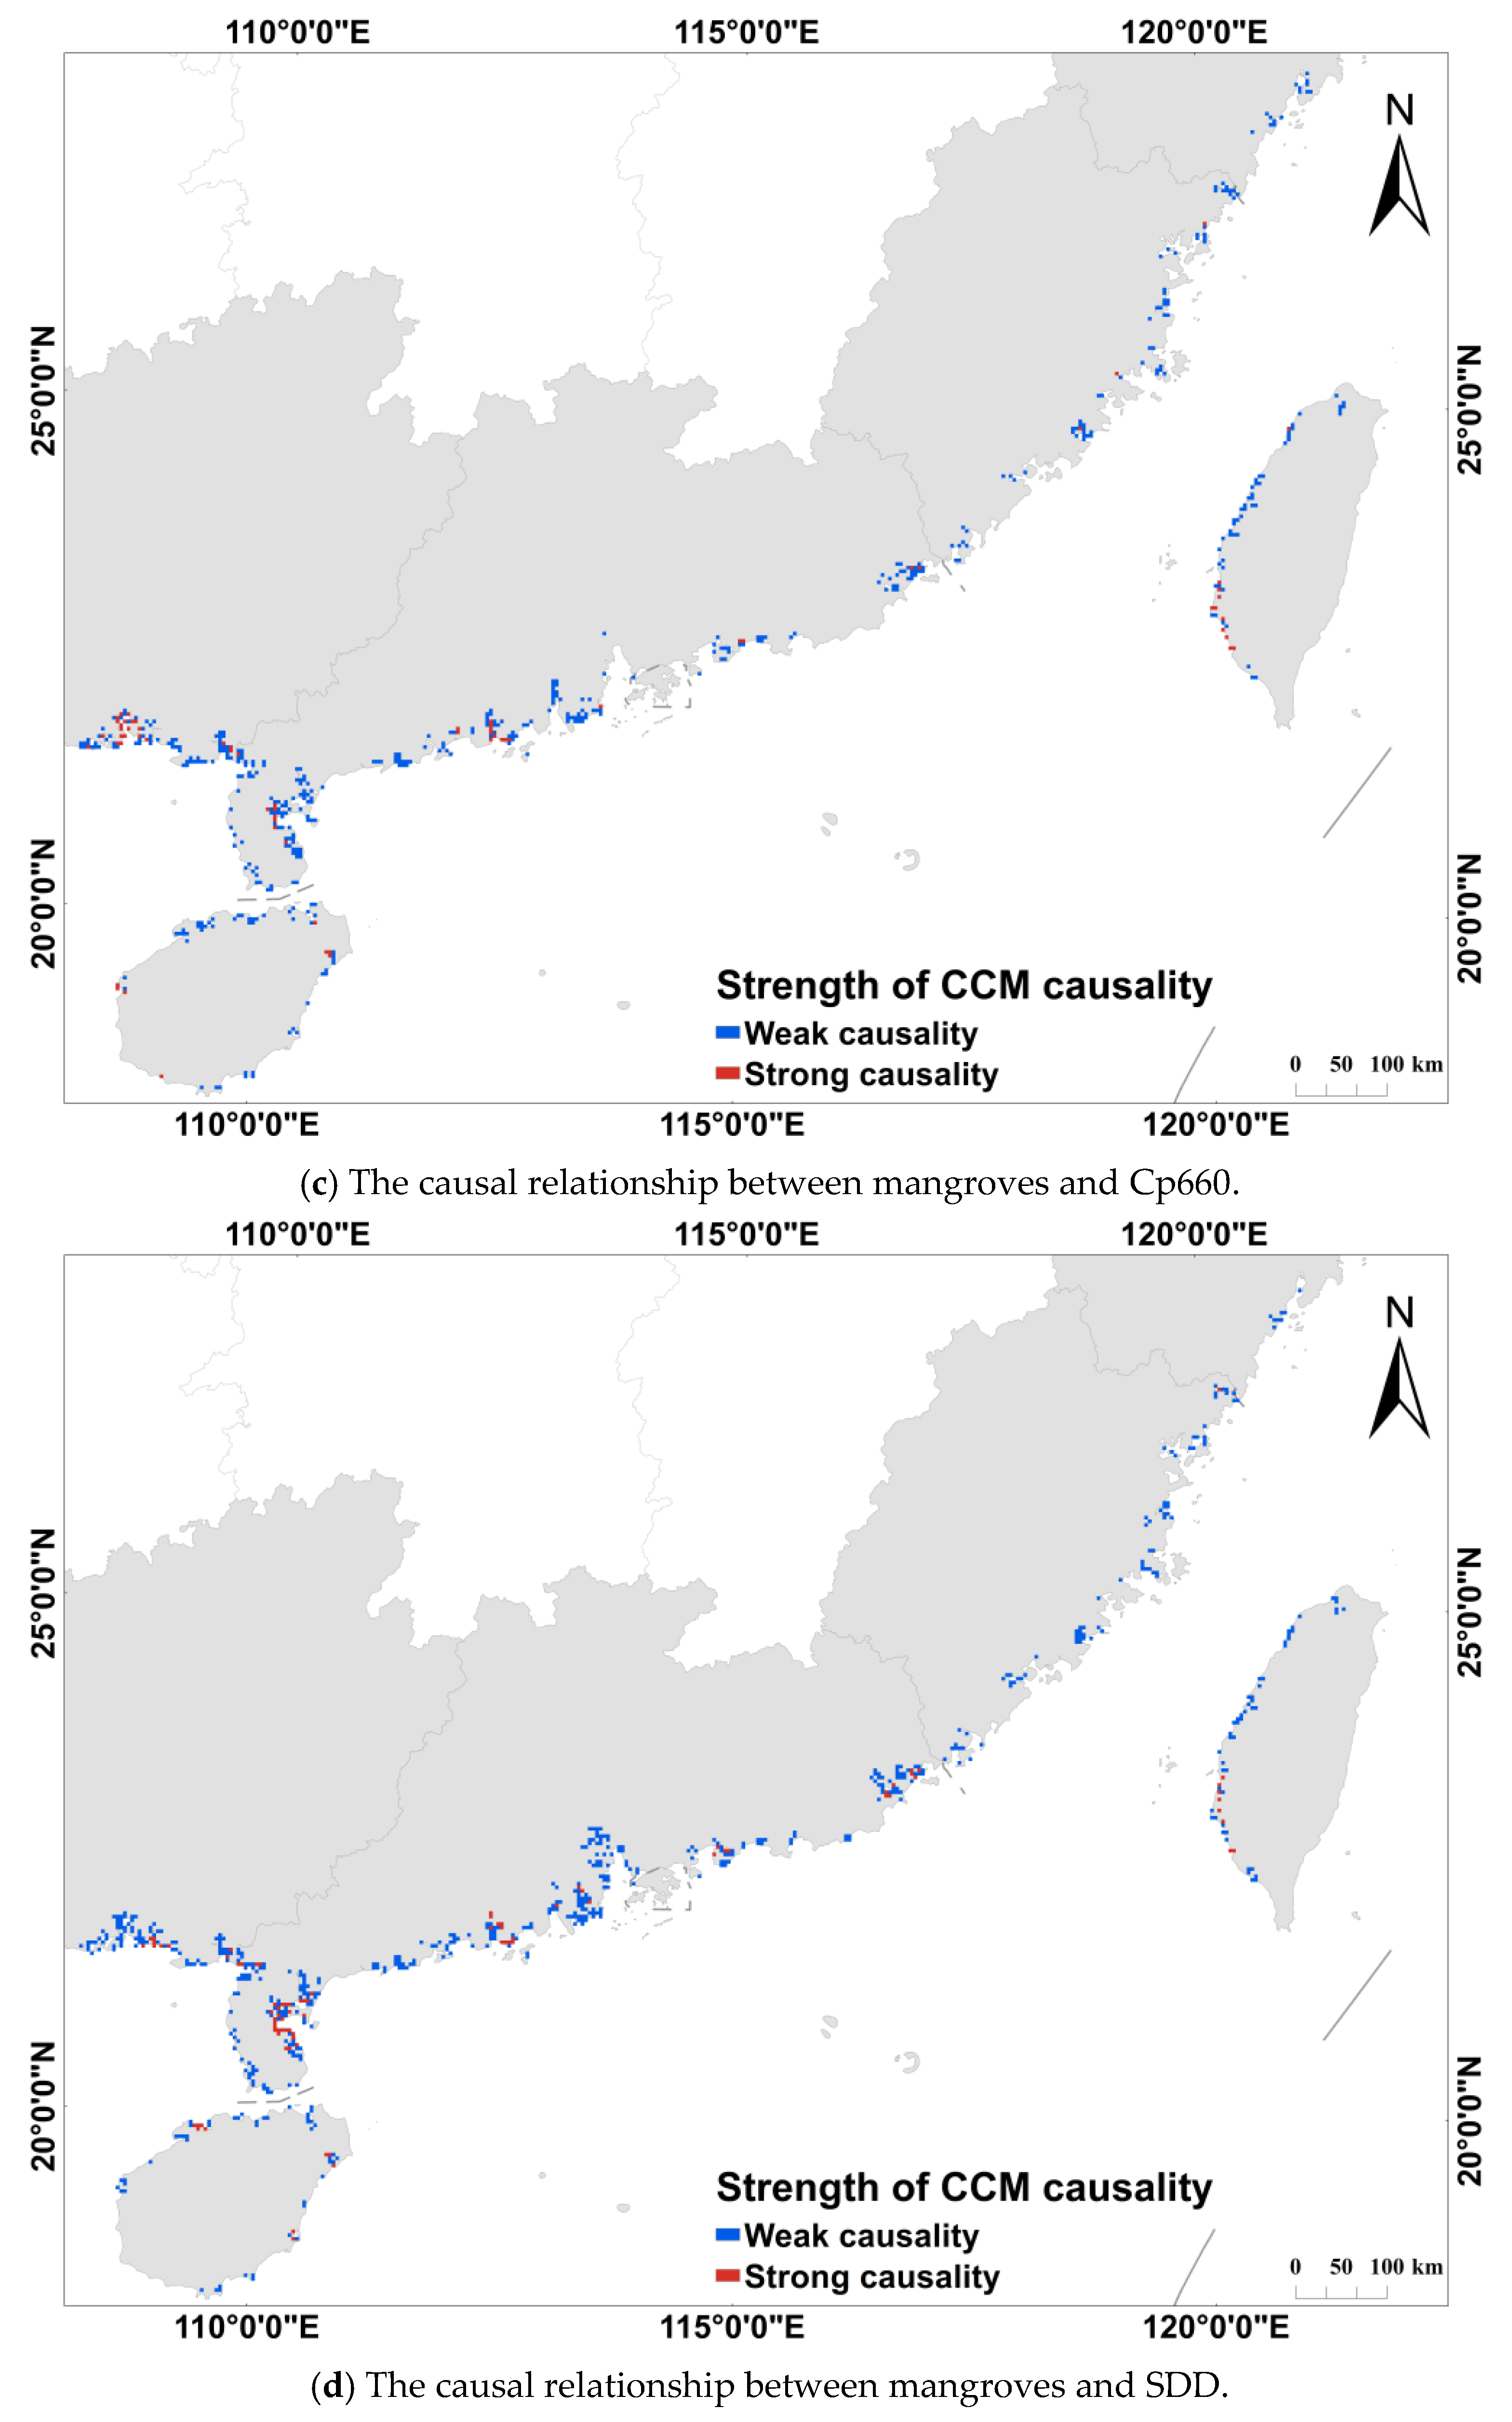
3.3. Relationship Between Mangroves and Water Quality Parameters

The technique of partial correlation analysis was employed to examine the relationship between mangroves and water quality parameters (Figure 4). Based on the differences in partial correlation coefficients and their associated significance levels, the correlations were categorized into six classes (Table 2). * p < 0.05, ** p < 0.01.
Figure 4 illustrates the partial correlations between mangroves and the four water quality parameters, with the significantly correlated areas highlighted in localized zoomed-in views. Figure 4b shows that the negative partial correlation between mangroves and Chl-a concentrations was particularly pronounced in the study area. Areas with significant negative correlations (7.4%) and highly significant negative correlations (4.2%) were predominantly located in Guangxi and Guangdong provinces. In contrast, a weak positive partial correlation was observed between mangroves and CDOM, with 2.9% of the area showing significant positive correlation and 1.5% showing highly significant positive correlation. Furthermore, the partial correlations between mangroves and other water quality parameters (SDD, Cp660) were generally found to be statistically insignificant. This trend is further supported by the mean partial correlation coefficients, which were 0.02 for CDOM, −0.04 for Cp660, −0.09 for SDD, and up to 0.20 for Chl-a concentration.
Table 3 outlines the strength of the causal relationships between mangroves ( x ) and the four water quality parameters ( y ). The results demonstrated that mangroves play a significant role in regulating nearshore water quality parameters. Specifically, the mean causal intensity ( x 2 y _ r h o _ m e a n ) from mangroves to water quality parameters ranged from 0.33 to 0.38, while the spatial extent of significant causal influence ( x 2 y _ f r e q u e n c y ) ranged from 28.40% to 36.77%. These findings indicate that mangroves have a statistically significant influence on water quality in more than 28.4% of the study area. Among the parameters, SDD exhibited the strongest causal effect ( ρ = 0.38, spatial coverage = 36.77%), followed by CDOM ( ρ = 0.35, coverage = 29.7%), Chl-a concentration ( ρ = 0.34, coverage = 34.9%), and finally Cp660 ( ρ = 0.31, coverage = 29.4%).
The spatial distribution characteristics of causal intensity were illustrated by retaining only pixels with ρ > 0 that passed the significance test. A corresponding spatial distribution map was then constructed (Figure 5). In the map, blue represents regions with weak causality ( 0 < ρ < 0.5 ), while red denotes areas of strong causality ( ρ 0.5 ).
The results reveal that strong causal associations ( ρ 0.5 ) exhibit pronounced spatial clustering, primarily along the coasts of Guangxi and Guangdong. Specifically, significant clusters of high-value causal associations between CDOM and mangroves were observed in Guangxi and Zhanjiang, Guangdong. In contrast, other regions displayed only weak associations. Regarding Cp660 and SDD (see Figure 5c,d), strong causal associations between mangroves and these parameters were strongly clustered along the Guangxi coast. In Guangdong, however, the patterns differed: strong association with SDD were predominantly concentrated in the mangrove area of eastern Zhanjiang, while regions with strong associations to Cp660 were more dispersed. For Chl-a concentration, notable regional variations were observed. The Guangxi coast showed no significant spatial clustering, whereas the Guangdong coast exhibited a broad, contiguous area with strong causal associations.
To quantify the relative contribution of mangroves in explaining the spatial variation in water quality parameters, a factor detector approach was employed. The results revealed variations in the effects of mangroves on the four water quality parameters (Figure 6). X1 to X6 represent the following variables: X1 for mangroves, X2 for pH, X3 for sea surface salinity (SSS), X4 for sea surface temperature (SST), X5 for solar radiation, and X6 for precipitation, respectively. Mangroves exhibited moderate explanatory power for CDOM ( q = 0.155 ), followed by Cp660 ( q = 0.142 ), SDD ( q = 0.133 ), and Chl-a concentration ( q = 0.132 ). The relatively weak explanatory power for Chl-a concentration indicates that phytoplankton dynamics are primarily influenced by other factors, including pH value ( q = 0.362 ), SSS ( q = 0.231 ) , and SST ( q = 0.23 ). pH was identified as the dominant controlling factor for CDOM ( q = 0.502 ), Chl-a concentration ( q = 0.362 ), SDD ( q = 0.412 ), and Cp660 ( q = 0.3 ). Additionally, SST exerted a strong influence on CDOM ( q = 0.344 ), Chl-a concentration ( q = 0.23 ), and SDD ( q = 0.189 ), while solar radiation exerted a strong influence on Cp660 ( q = 0.212 ). These q -values indicate that (1) the influence of mangroves on water quality is secondary to that of environmental drivers in this system, and (2) the impacts of mangroves on water quality are likely mediated through indirect ecological pathways rather than through direct linear relationships.

4. Discussion

4.1. Causes of Spatiotemporal Changes

The ecological revitalization of mangroves is strongly correlated with the systematic enhancement of China’s nature reserve framework. In particular, the implementation of the National Wetland Conservation Engineering Plan, alongside the establishment of specialized mangrove reserves across coastal provinces, has facilitated progressive ecosystem succession. A comprehensive investigation indicated that the abrupt decline in mangrove coverage observed in 2011 was primarily caused by a historically rare climatic anomaly—specifically, the low-temperature rain, snow, and ice event that impacted South China in January 2011 [49]. Meteorological records show that sustained suboptimal temperatures (below 4 °C persisting for 72 consecutive hours) resulted in severe frost damage to critical mangrove habitats in subtropical regions, especially in Danzhou (Hainan), Qinzhou (Guangxi), and Zhanjiang (Guangdong). This ecological disturbance highlights the susceptibility of mangroves to abrupt climatic fluctuations, particularly when environmental conditions exceed physiological tolerance thresholds (typically 15–30 °C), potentially leading to irreversible ecological degradation and biodiversity loss. Areas where mangrove coverage has remained unchanged suggest that a complete succession process has not yet occurred during the early stages of restoration, and the full realization of ecological function still requires a long-term process of natural adaptation and ecosystem development.
Mangroves, as the signature vegetation of the intertidal zone, have long been affected by both terrestrial and marine processes. On the one hand, the rapid urbanization of coastal areas has accelerated the discharge of industrial and agricultural pollutants; on the other hand, tidal dynamics have intensified sediment resuspension. The combined effect of these processes has significantly increased the attenuation of light in the water column, thus leading to a notable decline in SDD and an increase in CDOM levels [50,51]. As an effective indicator of particulate organic carbon (POC), the spatial and temporal variability of Cp660 was significantly correlated with seasonal fluctuations in Chl-a concentration, mixed layer depth and SST, although no consistent long-term trend was observed. The observed decrease in Chl-a concentration was attributed to the implementation of ecological aquaculture controls and environmental restoration efforts, such as seagrass bed rehabilitation projects. In contrast, the significant increase in Chl-a concentration in certain regions was likely driven by increased nutrient loading resulting from intensified offshore eutrophication and expanded aquaculture activities [52].

4.2. Mangrove Impacts on Water Quality Parameters

To ensure the robustness of partial correlation analyses, we controlled for key environmental drivers that simultaneously influence both mangroves and water quality parameters. The selection of control variables was based on established ecological principles and empirical findings from previous studies. SST was included because it regulates phytoplankton metabolic activity, typically with an optimal range of 20–30 °C. Phytoplankton also modulate solar radiation absorption, thereby influencing upper-ocean temperature and circulation, which in turn affect atmospheric conditions via SST-mediated feedbacks [53]. SSS was incorporated because it plays a dual role in regulating osmoregulation processes in both mangroves and phytoplankton, particularly in estuarine environments where salinity gradients are pronounced [54]. pH was included as a key variable due to its role in regulating carbonate chemistry and nutrient availability, which directly impacts photosynthetic efficiency. Additionally, precipitation and solar radiation were considered to account for atmospheric influences. These meteorological variables are critical to mangrove ecophysiology—affecting transpiration and nutrient absorption—as well as phytoplankton growth, through regulation of light availability and nutrient delivery. Incorporating these comprehensive control variables enhances the reliability of our correlation analyses and provides a more complete understanding of the complex interactions between mangroves and water quality in coastal ecosystems.
We conducted a correlation analysis to further illustrate the relationships between environmental variables, mangroves, and water quality parameters (Figure 7). Notably, pH emerged as a critical factor, particularly influencing both mangroves and Chl-a concentrations. Precipitation was identified as the primary driver of CDOM and SDD, likely due to its role in promoting nutrient and sediment runoff [55]. Solar radiation significantly affected both mangroves and CDOM, potentially by influencing photosynthetic activity and the dynamics of organic matter [56]. These findings are further supported by the results of the factor detector analysis (Figure 6). The inclusion of these comprehensive control variables enhanced the robustness of our correlation analysis and contributed to a more holistic understanding of the complex interactions between mangrove ecosystems and coastal water quality.
The observed negative correlation between mangrove coverage and Chl-a concentration highlights the critical role of mangrove ecosystems in mitigating phytoplankton blooms through their distinctive biogeochemical functions. This phytoremediation capacity is primarily facilitated by two mechanisms: (1) the efficient interception and assimilation of nutrients—particularly bioavailable forms of nitrogen (NO₃⁻ and NH₄⁺) and phosphorus (PO₄3⁻)—originating from agricultural runoff and urban wastewater discharge; and (2) sediment stabilization via extensive root systems that suppress nutrient resuspension and reduce subsequent bioavailability [57,58,59]. These findings are strongly supported by empirical evidence from the Guangxi and Guangdong provinces, where areas with dense mangrove cover exhibited significantly lower Chl-a concentrations compared to nearby regions lacking mangroves.

4.3. Differences in Impact Results

Our comparative analysis revealed notable discrepancies between the results of partial correlation analysis and those of CCM causal analysis. Specifically, regions exhibiting statistically significant negative correlations in the partial correlation analysis did not consistently demonstrate corresponding causal relationships in the CCM analysis ( ρ < 0.5). These methodological discrepancies can be attributed to several factors: (1) spatial interpolation techniques—particularly in data-sparse regions—may introduce estimation errors; (2) reduced spatial resolution increases uncertainty; and (3) ecological complexity, such as time-lagged responses of water quality parameters to mangrove-mediated processes.
Despite these limitations, the two analytical approaches offer complementary insights into the possible impacts of mangroves on water quality. Partial correlation analysis is effective in identifying consistent linear relationships under controlled conditions, whereas CCM analysis uncovers deeper causal mechanisms and directional influences within these complex ecological systems. The integration of both methods provides a more comprehensive understanding of mangrove functions, particularly in capturing the nonlinear dynamics that characterize coastal environments.

4.4. Limitations and Future Research Directions

Due to limitations in data availability and the scope of the research design, this study was unable to investigate the specific ecological mechanisms underlying the observed changes in detail. Our current analytical framework, which primarily relies on satellite-derived observations and publicly available marine monitoring datasets, effectively captures the spatiotemporal patterns and statistical correlations but lacks the capacity to elucidate the complex biogeochemical processes through which mangrove ecosystems influence water quality. Although remote sensing platforms offer invaluable synoptic coverage for tracking large-scale mangrove dynamics, their inherent inability to resolve microscale sediment–water interactions (at the mm–cm scale) and biochemical transformations constrains mechanistic insights. Previous studies have also demonstrated that spatial resolution directly affects model uncertainty, with lower resolutions generally leading to increased uncertainty and analytical challenges [60]. Moreover, the influence of mangroves on water quality may be confounded by additional factors—such as nearby anthropogenic activities, particularly coastal industrial discharges and aquaculture—which should be explicitly addressed in future research.
Future research should incorporate long-term ecological monitoring, controlled experiments, and advanced numerical modeling to elucidate the specific mechanisms through which mangroves contribute to water quality improvement. Long-term monitoring data can capture the temporal dynamics of mangroves, offering valuable insights into internal ecological processes and their effects on water quality. Experimental studies conducted under controlled environmental conditions would allow for the examination of mangrove-mediated water purification mechanisms under varying scenarios. Furthermore, refined numerical approaches, such as process-based ecological models and Earth system models, can integrate multiple environmental drivers and ecosystem processes to simulate the role of mangroves in regulating coastal water quality. The adoption of these approaches will facilitate a more comprehensive understanding of mangrove functions and provide scientific support for mangrove conservation and the sustainable management of coastal water resources.

5. Conclusions

This study investigated the spatial and temporal dynamics of mangrove cover and coastal water quality indicators from 1998 to 2018, as well as the potential influence of mangroves on water quality. Over the study period, mangrove areas expanded considerably, while two of the four water quality indicators showed varying degrees of improvement. In contrast, SDD and CDOM exhibited degradation. Partial correlation analysis revealed a significant negative correlation between mangrove cover and Chl-a concentration in specific regions, whereas correlations with other water quality indicators were relatively weak. Complementary findings from CCM causal analysis further confirmed that mangroves exert significant causal influences on SDD, CDOM, and Chl-a concentrations. Taken together, these results underscore the crucial role of mangroves in improving coastal water quality through their biogeochemical functions. However, the results of the factor detector analysis suggested that the overall influence of mangroves on water quality was limited, implying that their regulatory role is likely indirect and not dominant within the broader environmental context.
In conclusion, this study reveals the spatiotemporal dynamics of mangroves in China over the past two decades and underscores the potentially critical role of mangroves in enhancing coastal water quality. The protection and restoration of mangrove ecosystems are not only essential for improving water quality and maintaining ecological balance, but also provide vital ecological support for the sustainable development of coastal regions. Future research should further explore the interactions between mangroves and other ecological and anthropogenic factors to optimize conservation strategies and inform more effective coastal management practices.

Author Contributions

Conceptualization, J.R. and K.H.; data curation, J.R., C.L., W.Y. and X.Z.; formal analysis, J.R., G.Y. and B.C.; funding acquisition, G.Y., W.S. and T.F.; investigation, K.H., C.L. and W.Y.; methodology, J.R., X.Z. and W.L.; project administration, W.S., B.C. and T.F.; resources, W.S., W.L. and T.F.; software, J.R. and X.Z. and W.L.; supervision, W.S. and T.F.; validation, G.Y., W.S. and B.C.; visualization, J.R., C.L., W.Y. and X.Z.; writing—original draft, J.R. and G.Y.; writing—review and editing, W.S., G.Y. and J.R. All authors have read and agreed to the published version of the manuscript.

Funding

This research was funded by the Youth Scientist Project National Key R&D Program of China (No. 2023YFF1305600), the National Natural Science Foundation of China (No. 42271340, 42122009), Ningbo Municipal Science and Technology Innovation 2025 Major Special Project (No. 2022Z189, 2022Z181), and Ningbo Natural Science Foundation (No. 2024J456).

Data Availability Statement

The original contributions presented in this study are included in the article. Further inquiries can be directed to the corresponding author(s).

Acknowledgments

We would like to thank the National Earth System Science Data Center, National Science & Technology Infrastructure of China (http://www.geodata.cn, accessed on 24 October 2023), and the Oceanographic Data Center, Chinese Academy of Sciences (CODC) (http://msdc.qdio.ac.cn, accessed on 13 October 2023) for providing the data.

Conflicts of Interest

The authors declare no conflicts of interest.

References

  1. Liu, N.; Ma, Z. Ecological restoration of coastal wetlands in China: Current status and suggestions. Biol. Conserv. 2024, 291, 110513. [Google Scholar] [CrossRef]
  2. Alongi, D.M. Carbon cycling and storage in mangrove forests. Annu. Rev. Mar. Sci. 2014, 6, 195–219. [Google Scholar] [CrossRef] [PubMed]
  3. Twilley, R.R.; Rovai, A.S.; Riul, P. Coastal morphology explains global blue carbon distributions. Front. Ecol. Environ. 2018, 16, 503–508. [Google Scholar] [CrossRef]
  4. Gopal, B.; Chauhan, M. Biodiversity and its conservation in the Sundarban mangrove ecosystem. Aquat. Sci. 2006, 68, 338–354. [Google Scholar] [CrossRef]
  5. Shanker, K. Biodiversity of mangrove ecosystems. Conserv. Soc. 2005, 3, 537–539. [Google Scholar]
  6. Kathiresan, K.; Rajendran, N. Coastal mangrove forests mitigated tsunami. Estuar. Coast. Shelf Sci. 2005, 65, 601–606. [Google Scholar] [CrossRef]
  7. McIvor, A.; Möller, I.; Spencer, T.; Spalding, M. Reduction of Wind and Swell Waves by Mangroves; The Nature Conservancy: Arlington, WV, USA; Wetlands International: Ede, The Netherlands, 2012. [Google Scholar]
  8. Nagelkerken, I.; Van der Velde, G.; Gorissen, M.; Meijer, G.; Van’t Hof, T.; Den Hartog, C. Importance of mangroves, seagrass beds and the shallow coral reef as a nursery for important coral reef fishes, using a visual census technique. Estuar. Coast. Shelf Sci. 2000, 51, 31–44. [Google Scholar] [CrossRef]
  9. Pelegri, S.; Twilley, R. Heterotrophic nitrogen fixation (acetylene reduction) during leaf-litter decomposition of two mangrove species from South Florida, USA. Mar. Biol. 1998, 131, 53–61. [Google Scholar] [CrossRef]
  10. Mazda, Y.; Wolanski, E.; Ridd, P. The Role of Physical Processes in Mangrove Environments: Manual for the Preservation and Utilization of Mangrove Ecosystems; Terra Pub.: Drobeta-Turnu Severin, Romania, 2007. [Google Scholar]
  11. Gissi, E.; Manea, E.; Mazaris, A.D.; Fraschetti, S.; Almpanidou, V.; Bevilacqua, S.; Coll, M.; Guarnieri, G.; Lloret-Lloret, E.; Pascual, M. A review of the combined effects of climate change and other local human stressors on the marine environment. Sci. Total Environ. 2021, 755, 142564. [Google Scholar] [CrossRef]
  12. Zhai, T.; Wang, J.; Fang, Y.; Qin, Y.; Huang, L.; Chen, Y. Assessing ecological risks caused by human activities in rapid urbanization coastal areas: Towards an integrated approach to determining key areas of terrestrial-oceanic ecosystems preservation and restoration. Sci. Total Environ. 2020, 708, 135153. [Google Scholar] [CrossRef]
  13. Gao, Y.; Hao, P.; Wei, Z.; Li, S.; Song, J.; Yu, C. Dynamic causes contribute to the increasing trend of red tides in the east China sea during 2020–2022. Mar. Environ. Res. 2024, 198, 106521. [Google Scholar] [CrossRef] [PubMed]
  14. Xu, Y.; Sun, Y.; Xu, G.; Liu, D. Simulation of red tide drift-diffusion process in the Pearl River Estuary and its response to the environment. Front. Mar. Sci. 2023, 10, 1096896. [Google Scholar] [CrossRef]
  15. Li, H.-M.; Tang, H.-J.; Shi, X.-Y.; Zhang, C.-S.; Wang, X.-L. Increased nutrient loads from the Changjiang (Yangtze) River have led to increased harmful algal blooms. Harmful Algae 2014, 39, 92–101. [Google Scholar] [CrossRef]
  16. Cavanaugh, K.C.; Kellner, J.R.; Forde, A.J.; Gruner, D.S.; Parker, J.D.; Rodriguez, W.; Feller, I.C. Poleward expansion of mangroves is a threshold response to decreased frequency of extreme cold events. Proc. Natl. Acad. Sci. USA 2014, 111, 723–727. [Google Scholar] [CrossRef] [PubMed]
  17. Osland, M.J.; Day, R.H.; Hall, C.T.; Brumfield, M.D.; Dugas, J.L.; Jones, W.R. Mangrove expansion and contraction at a poleward range limit: Climate extremes and land-ocean temperature gradients. Ecology 2017, 98, 125–137. [Google Scholar] [CrossRef]
  18. Wang, Y.; Dong, P.; Hu, W.; Chen, G.; Zhang, D.; Chen, B.; Lei, G. Modeling the Climate Suitability of Northernmost Mangroves in China under Climate Change Scenarios. Forests 2022, 13, 64. [Google Scholar] [CrossRef]
  19. Krauss, K.W.; McKee, K.L.; Lovelock, C.E.; Cahoon, D.R.; Saintilan, N.; Reef, R.; Chen, L. How mangrove forests adjust to rising sea level. New Phytol. 2014, 202, 19–34. [Google Scholar] [CrossRef]
  20. Manju, M.; Resmi, P.; Gireesh, K.T.; Ratheesh, K.C.; Rahul, R.; Joseph, M.; Chandramohanakumar, N. Assessment of water quality parameters in mangrove ecosystems along Kerala coast: A statistical approach. Int. J. Environ. Res. 2012, 6, 893–902. [Google Scholar]
  21. Samara, F.; Solovieva, N.; Ghalayini, T.; Nasrallah, Z.A.; Saburova, M. Assessment of the environmental status of the mangrove ecosystem in the United Arab Emirates. Water 2020, 12, 1623. [Google Scholar] [CrossRef]
  22. Whelan, K.R.; Smith, T.J.; Cahoon, D.R.; Lynch, J.C.; Anderson, G.H. Groundwater control of mangrove surface elevation: Shrink and swell varies with soil depth. Estuaries 2005, 28, 833–843. [Google Scholar] [CrossRef]
  23. Kristensen, E.; Bouillon, S.; Dittmar, T.; Marchand, C. Organic carbon dynamics in mangrove ecosystems: A review. Aquat. Bot. 2008, 89, 201–219. [Google Scholar] [CrossRef]
  24. Wang, Y.; Zhang, Z.; Feng, L.; Ma, Y.; Du, Q. A new attention-based CNN approach for crop mapping using time series Sentinel-2 images. Comput. Electron. Agric. 2021, 184, 106090. [Google Scholar] [CrossRef]
  25. Ini, I.A.; Yueyue, Z.; Youshao, W. Characteristics of water quality and their eutrophication assessment on the mangrove ecosystems along the Guangdong coast. J. Trop. Oceanogr. 2022, 41, 1–11. [Google Scholar]
  26. Luo, J.; Huang, Q.; Zhang, H.; Xu, Y.; Zu, X.; Song, B. Impact of Conservation in the Futian Mangrove National Nature Reserve on Water Quality in the Last Twenty Years. Forests 2024, 15, 1246. [Google Scholar] [CrossRef]
  27. Satheeshkumar, P.; Khan, A.B. Identification of mangrove water quality by multivariate statistical analysis methods in Pondicherry coast, India. Environ. Monit. Assess. 2012, 184, 3761–3774. [Google Scholar] [CrossRef]
  28. Sari, N.; Patria, M.P.; Soesilo, T.E.B.; Tejakusuma, I.G. The structure of mangrove communities in response to water quality in Jakarta Bay, Indonesia. Biodiversitas J. Biol. Divers. 2019, 20, 1873–1879. [Google Scholar] [CrossRef]
  29. Lotfinasabasl, S.; Gunale, V.; Khosroshahi, M. Applying geographic information systems and remote sensing for water quality assessment of mangrove forest. Acta Ecol. Sin. 2018, 38, 135–143. [Google Scholar] [CrossRef]
  30. Jia, M.; Wang, Z.; Zhang, Y.; Mao, D.; Wang, C. Monitoring loss and recovery of mangrove forests during 42 years: The achievements of mangrove conservation in China. Int. J. Appl. Earth Obs. Geoinf. 2018, 73, 535–545. [Google Scholar] [CrossRef]
  31. Xu, M.; Wang, Z.; Liang, Y.; Mo, Z.; Zhang, Q. Analysis of spatiotemporal evolution characteristics and recovery patterns of mangrove forests in China since 1978. Ecol. Indic. 2024, 169, 112882. [Google Scholar] [CrossRef]
  32. Luojia, H.; Wenyu, L.; Bing, X. Monitoring mangrove forest change in China from 1990 to 2015 using Landsat-derived spectral-temporal variability metrics. Int. J. Appl. Earth Obs. Geoinf. 2018, 73, 88–98. [Google Scholar]
  33. Yang, G.; Huang, K.; Sun, W.; Wang, L.; Chen, B. Mangrove Dynamics in China (MDC): Accurate and Annual Distribution Maps from 1990 to 2020. Science Data Bank. 2024. [Google Scholar] [CrossRef]
  34. Li, G.; Cheng, L.; Pan, Y.; Wang, G.; Liu, H.; Zhu, J.; Zhang, B.; Ren, H.; Wang, X. A global gridded ocean salinity dataset with 0.5° horizontal resolution since 1960 for the upper 2000 m. Front. Mar. Sci. 2023, 10, 1108919. [Google Scholar] [CrossRef]
  35. Zhong, G.; Li, X.; Song, J.; Qu, B.; Wang, F.; Wang, Y.; Zhang, B.; Sun, X.; Zhang, W.; Wang, Z. Reconstruction of global surface ocean pCO2 using region-specific predictors based on a stepwise FFNN regression algorithm. Biogeosciences 2022, 19, 845–859. [Google Scholar] [CrossRef]
  36. Li, L.; Fu, Y.; Xue, C.; Cui, J.; Zhang, Y.; Xu, Y. Development of monthly-seasonal-annual dataset of sea surface chlorophyll-a concentration for 21 years, (1998–2018). J. Glob. Change Data Discov. 2021, 2, 219–225. [Google Scholar]
  37. Hersbach, H.; Bell, B.; Berrisford, P.; Biavati, G.; Horányi, A.; Muñoz Sabater, J.; Nicolas, J.; Peubey, C.; Radu, R.; Rozum, I. ERA5 monthly averaged data on single levels from 1940 to present. Copernic. Clim. Change Serv. Clim. Data Store 2019, 10, 252–266. [Google Scholar]
  38. Tucker, C.J.; Newcomb, W.W.; Los, S.O.; Prince, S.D. Mean and inter-year variation of growing-season normalized difference vegetation index for the Sahel 1981-1989. Int. J. Remote Sens. 1991, 12, 1133–1135. [Google Scholar] [CrossRef]
  39. Lunetta, R.S.; Knight, J.F.; Ediriwickrema, J.; Lyon, J.G.; Worthy, L.D. Land-cover characterization and change detection using multitemporal MODIS NDVI data. Remote Sens. Environ. 2009, 105, 142–154. [Google Scholar] [CrossRef]
  40. Theil, H. A Rank-Invariant Method of Linear and Polynomial Regression Analysis; Springer: Dordrecht, The Netherlands, 1992. [Google Scholar]
  41. Alongi, D.M. Present state and future of the world’s mangrove forests. Environ. Conserv. 2002, 29, 331–349. [Google Scholar] [CrossRef]
  42. Burn, D.H.; Hag Elnur, M.A. Detection of hydrologic trends and variability. J. Hydrol. 2002, 255, 107–122. [Google Scholar] [CrossRef]
  43. Lipsitz, S.R.; Leong, T.; Ibrahim, J.; Lipshultz, S. A partial correlation coefficient and coefficient of determination for multivariate normal repeated measures data. J. R. Stat. Soc. Ser. D Stat. 2001, 50, 87–95. [Google Scholar] [CrossRef]
  44. Sugihara, G.; May, R.; Ye, H.; Hsieh, C.-h.; Deyle, E.; Fogarty, M.; Munch, S. Detecting causality in complex ecosystems. Science 2012, 338, 496–500. [Google Scholar] [CrossRef] [PubMed]
  45. Deyle, E.R.; May, R.M.; Munch, S.B.; Sugihara, G. Tracking and forecasting ecosystem interactions in real time. Proc. R. Soc. B Biol. Sci. 2016, 283, 20152258. [Google Scholar] [CrossRef] [PubMed]
  46. Song, Y.; Wang, J.; Ge, Y.; Xu, C. An optimal parameters-based geographical detector model enhances geographic characteristics of explanatory variables for spatial heterogeneity analysis: Cases with different types of spatial data. GIScience Remote Sens. 2020, 57, 593–610. [Google Scholar] [CrossRef]
  47. Wang, J.; Xu, C. Geodetector: Principle and prospective. Acta Geogr. Sin. 2017, 72, 116–134. [Google Scholar]
  48. Zhai, Y.; Zhai, G.; Chen, Y.; Liu, J. Research on regional terrestrial carbon storage based on the pattern-process-function. Ecol. Inform. 2024, 80, 102523. [Google Scholar] [CrossRef]
  49. Chen, L.; Zheng, W.; Yang, S.; Wang, W.; Zhang, Y. Research Progresses of Mangrove Cold-tolerant Classes and Seral Classes, and Their Responses to Climate Change. J. Xiamen Univ. 2017, 56, 305–313. [Google Scholar]
  50. Wang, W.; Li, X.; Wang, M. Propagule dispersal determines mangrove zonation at intertidal and estuarine scales. Forests 2019, 10, 245. [Google Scholar] [CrossRef]
  51. Wang, Y.-S.; Gu, J.-D. Ecological responses, adaptation and mechanisms of mangrove wetland ecosystem to global climate change and anthropogenic activities. Int. Biodeterior. Biodegrad. 2021, 162, 105248. [Google Scholar] [CrossRef]
  52. Zhang, K.; Zhao, X.; Xue, J.; Mo, D.; Zhang, D.; Xiao, Z.; Yang, W.; Wu, Y.; Chen, Y. The temporal and spatial variation of chlorophyll a concentration in the China Seas and its impact on marine fisheries. Front. Mar. Sci. 2023, 10, 1212992. [Google Scholar] [CrossRef]
  53. Shell, K.M.; Frouin, R.; Nakamoto, S.; Somerville, R.C.J. Atmospheric response to solar radiation absorbed by phytoplankton. J. Geophys. Res. 2003, 108, 4445. [Google Scholar] [CrossRef]
  54. Parida, A.K.; Jha, B. Salt tolerance mechanisms in mangroves: A review. Trees 2010, 24, 199–217. [Google Scholar] [CrossRef]
  55. Chang, D.; Li, S.; Lai, Z. Effects of extreme precipitation intensity and duration on the runoff and nutrient yields. J. Hydrol. 2023, 626, 130281. [Google Scholar] [CrossRef]
  56. Zhang, Y.; Liu, X.; Osburn, C.L.; Wang, M.; Qin, B.; Zhou, Y. Photobleaching Response of Different Sources of Chromophoric Dissolved Organic Matter Exposed to Natural Solar Radiation Using Absorption and Excitation–Emission Matrix Spectra. PLoS ONE 2013, 8, e77515. [Google Scholar] [CrossRef] [PubMed]
  57. Aiello, G. Sedimentary Processes: Examples from Asia, Turkey and Nigeria; BoD–Books on Demand: Norderstedt, Germany, 2020. [Google Scholar]
  58. Hilaluddin, F.; Yusoff, F.; Natrah, F.; Lim, P. Disturbance of mangrove forests causes alterations in estuarine phytoplankton community structure in Malaysian Matang mangrove forests. Mar. Environ. Res. 2020, 158, 104935. [Google Scholar] [CrossRef]
  59. Chen, C.; Gao, Y.; Lin, P. Progress in the studies of the diatoms in mangrove environment. Mar. Sci. 2002, 26, 17–19. [Google Scholar]
  60. Pogson, M.; Smith, P. Effect of spatial data resolution on uncertainty. Environ. Model. Softw. 2015, 63, 87–96. [Google Scholar] [CrossRef]
Figure 1. Location of the study area and distribution of mangroves.
Remotesensing 17 01640 g001
Figure 2. Total area and spatiotemporal trends of China’s mangrove from 1998 to 2018. The dotted line is the trend line.
Remotesensing 17 01640 g002
Figure 3. Spatiotemporal trends of water quality parameters in China from 1998 to 2018.
Remotesensing 17 01640 g003aRemotesensing 17 01640 g003b
Figure 4. Distribution of partial correlation coefficients between mangroves and water quality parameters. * indicates p < 0.05 and ** indicates p < 0.01.
Remotesensing 17 01640 g004aRemotesensing 17 01640 g004bRemotesensing 17 01640 g004c
Figure 5. Spatial distribution of causality between mangroves and water quality parameters. The blue color represents the weak causality region with 0 < ρ < 0.5 , while red color represents the strong causality region with ρ 0.5 .
Remotesensing 17 01640 g005aRemotesensing 17 01640 g005b
Figure 6. Factor detector q -values in geodetectors.
Remotesensing 17 01640 g006
Figure 7. Percentage of pixels with strong correlation coefficients.
Remotesensing 17 01640 g007
Table 1. Mann-Kendall (M-K) test and Theil–Sen median trend analysis result categories.
S Z Categories of Trend Changes
0.0005 2.58 Extremely significant increase
1.96 Z < 2.58 Significant increase
1.65 Z < 1.96 Moderately significant increase
< 1.65 Non-significant increase
= 0 Z Stable
0.0005 < 1.65 Non-significant decrease
1.65 Z < 1.96 Moderately significant decrease
1.96 Z < 2.58 Significant decrease
2.58 Extremely significant decrease
Table 2. Classification table for partial correlation.
r p ClassDenotes Symbols
< 0 < 0.01 Highly significant negative partial correlationN **
0.01 p < 0.05 Significant negative
partial correlation
N *
0.05 Non-significant negative
partial correlation
N
> 0 0.05 Non-significant positive
partial correlation
P
0.01 p < 0.05 Significant positive
partial correlation
P *
< 0.01 Highly significant positive
partial correlation
P **
* represents p < 0.05 , ** represents p < 0.01 .
Table 3. Strength in causality between mangroves and water quality parameters.
y x 2 y _ f r e q u e n c y x 2 y _ r h o _ m e a n
CDOM29.700.35
CHLA34.900.34
CP66028.400.33
SDD36.770.38
Disclaimer/Publisher’s Note: The statements, opinions and data contained in all publications are solely those of the individual author(s) and contributor(s) and not of MDPI and/or the editor(s). MDPI and/or the editor(s) disclaim responsibility for any injury to people or property resulting from any ideas, methods, instructions or products referred to in the content.

