
Assimilation of Moderate-Resolution Imaging Spectroradiometer Level Two Cloud Products for Typhoon Analysis and Prediction


Abstract
1. Introduction
2. Materials and Methods
2.1. Data
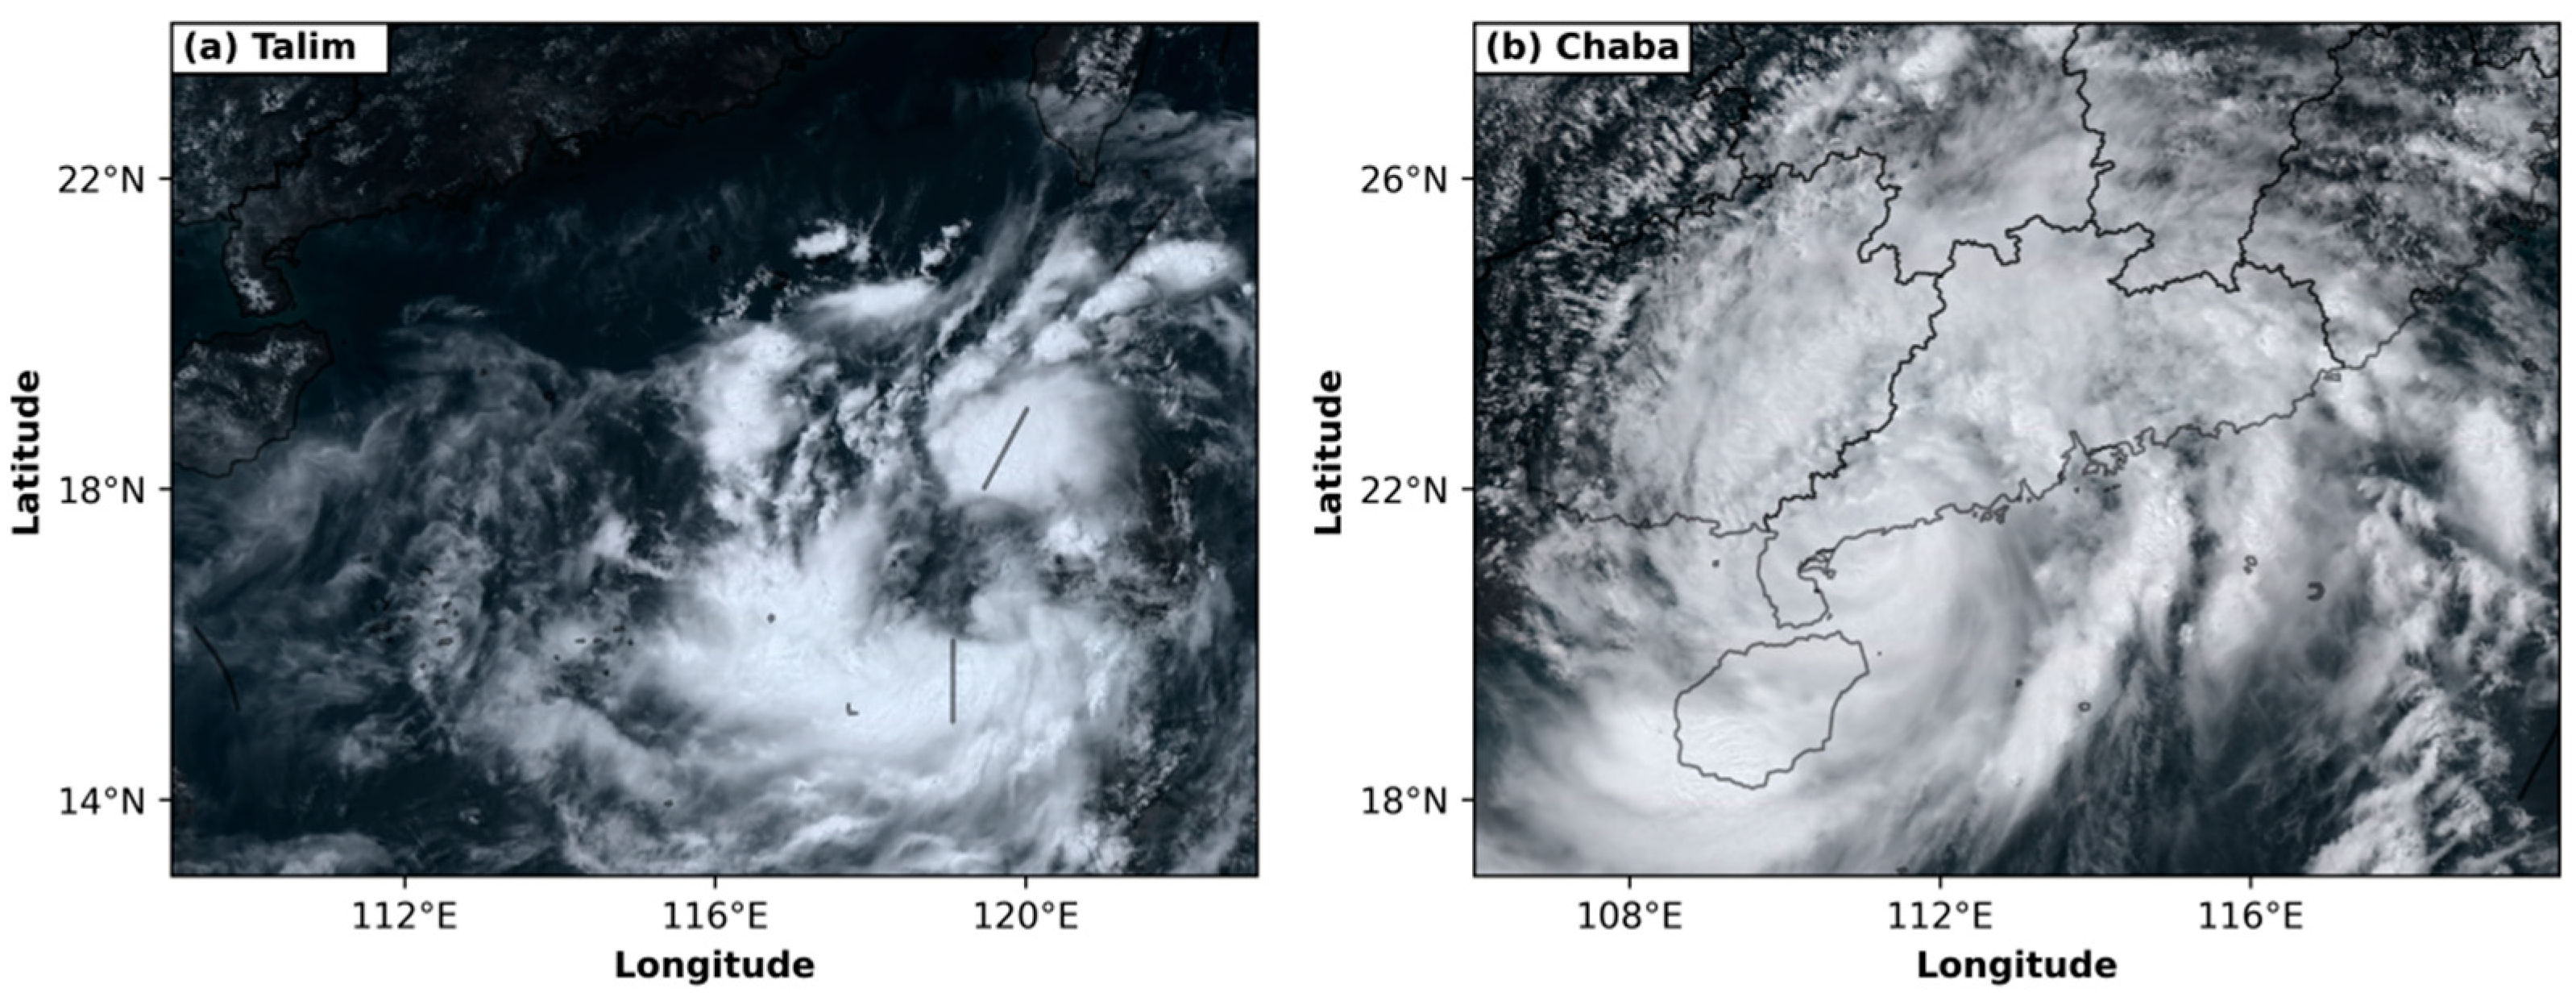
2.2. Typhoon Cases
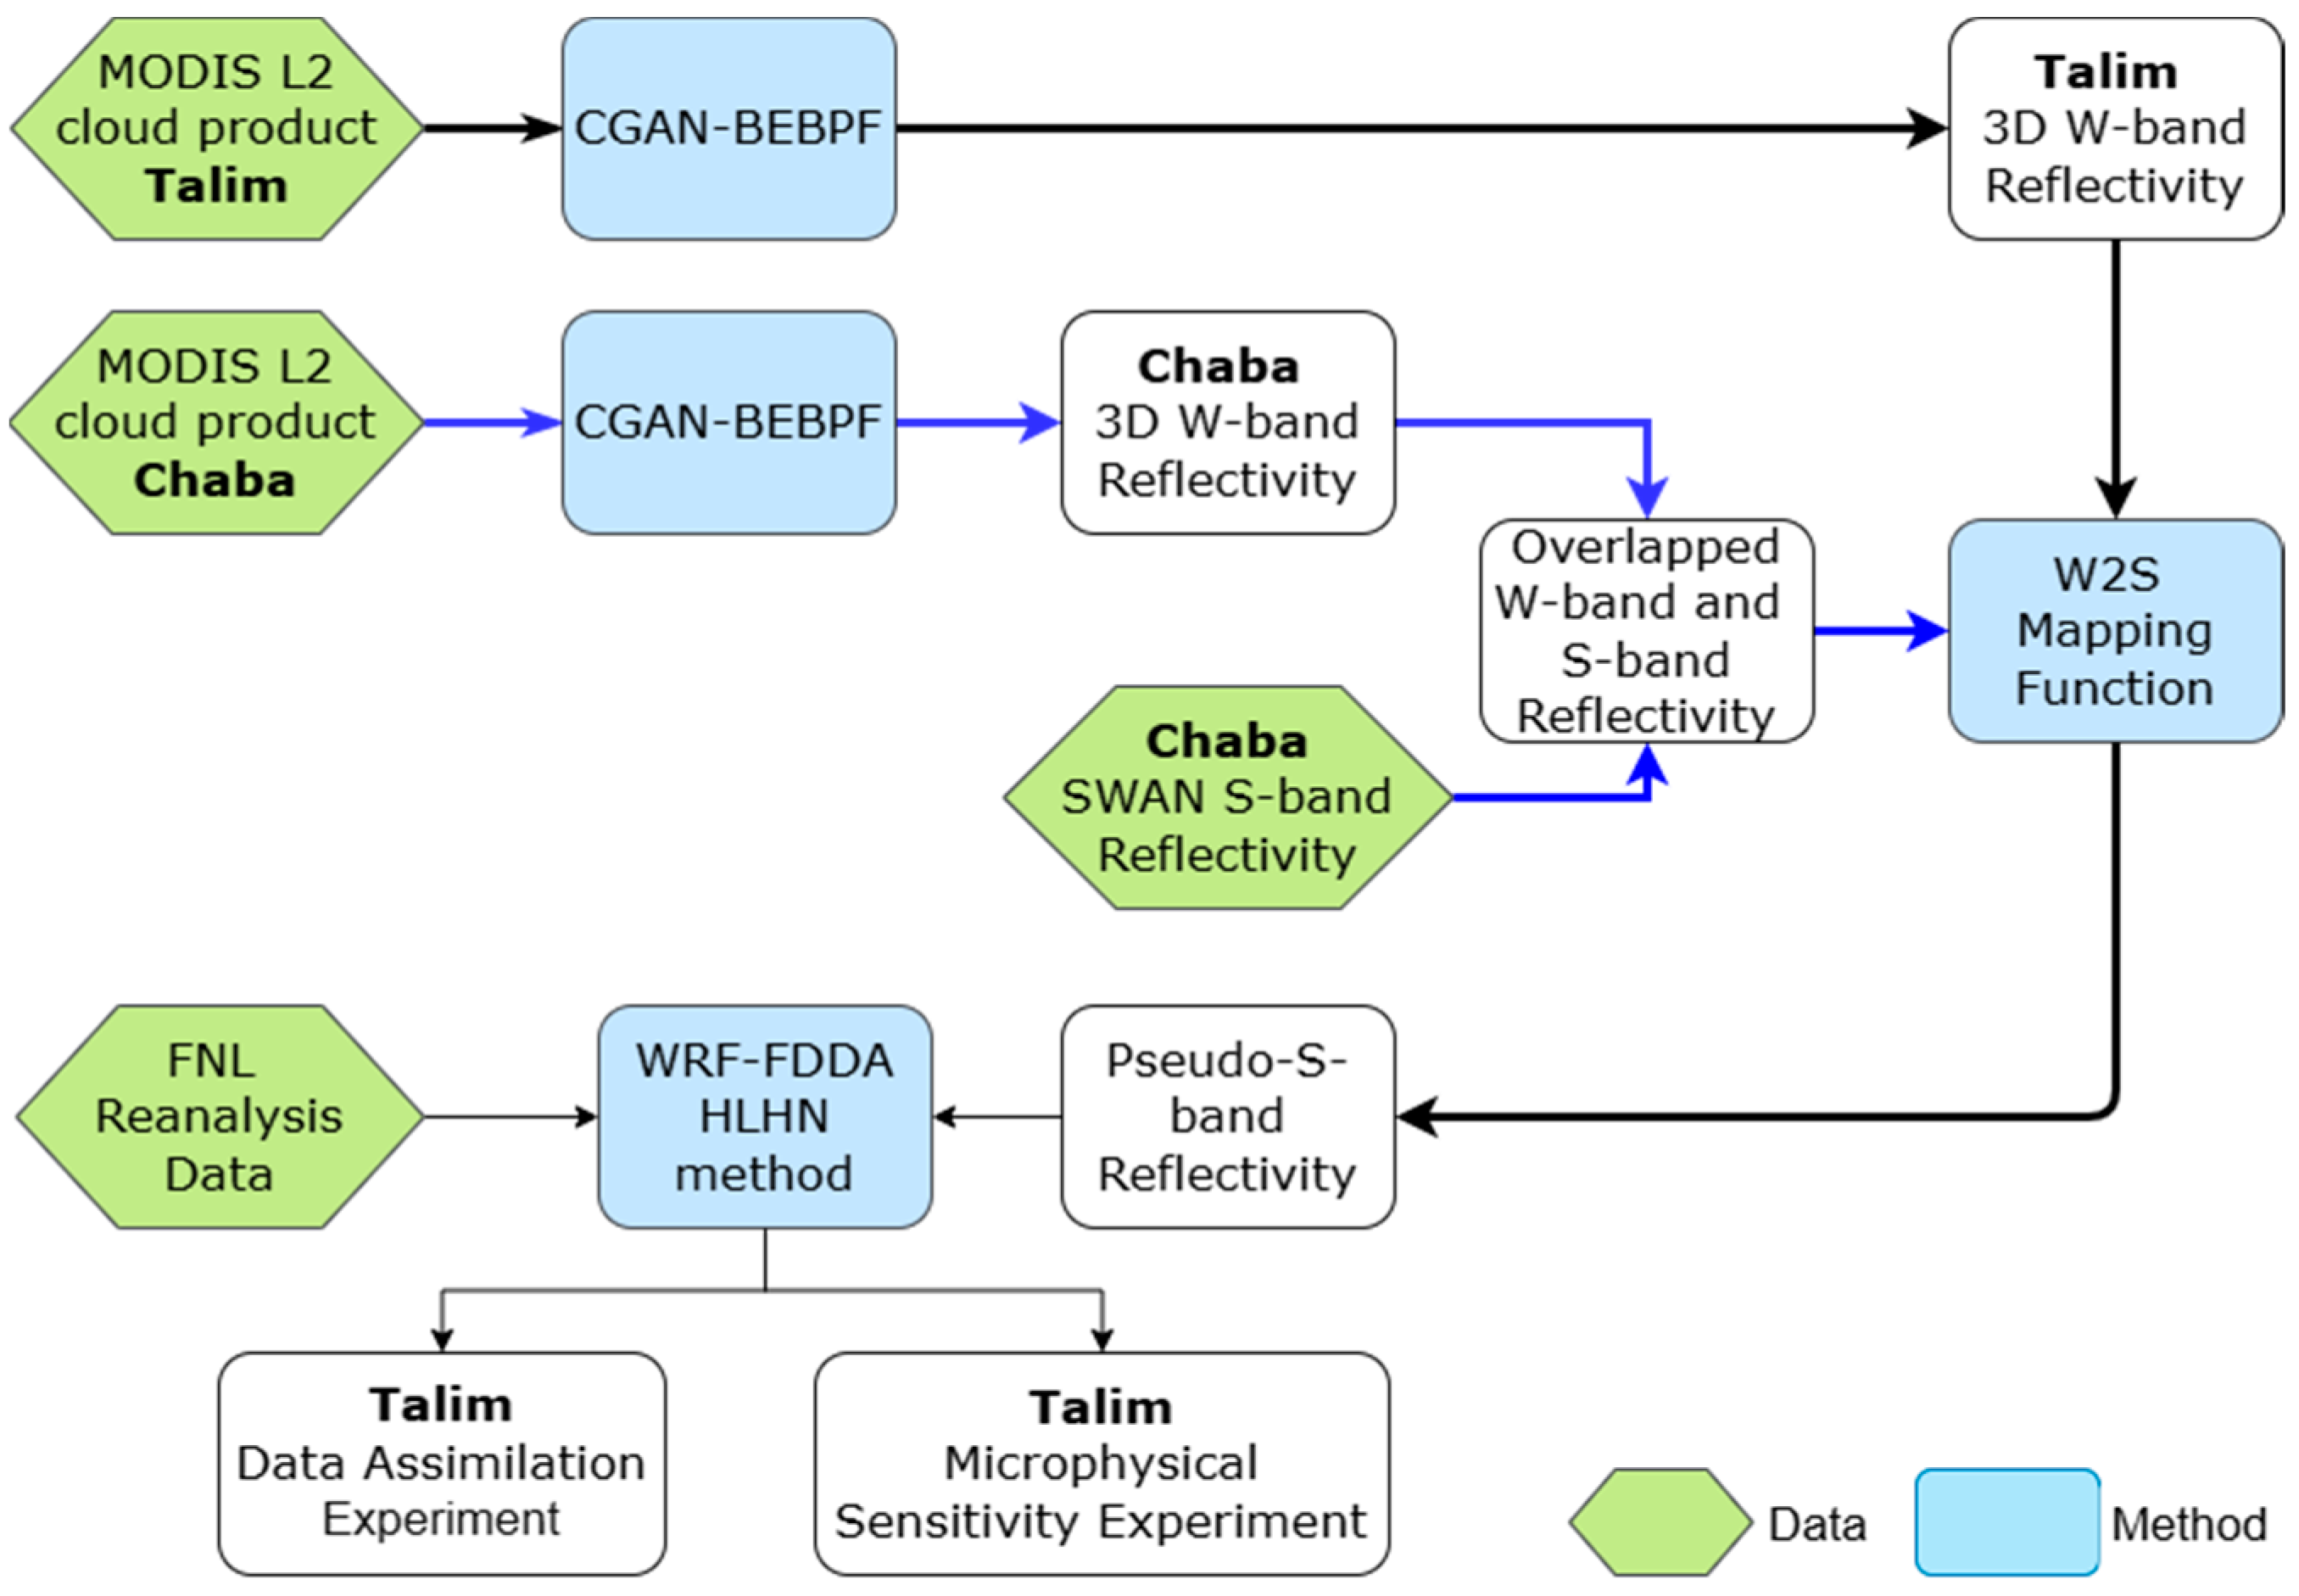
2.3. Technical Workflow
3. Mapping MODIS W-Band Cloud Radar Reflectivity Factor Retrieval to the S-Band Radar Reflectivity Factor
3.1. Retrieving 3D W-Band Radar Reflectivity Factor Based on CGAN-BEBPF
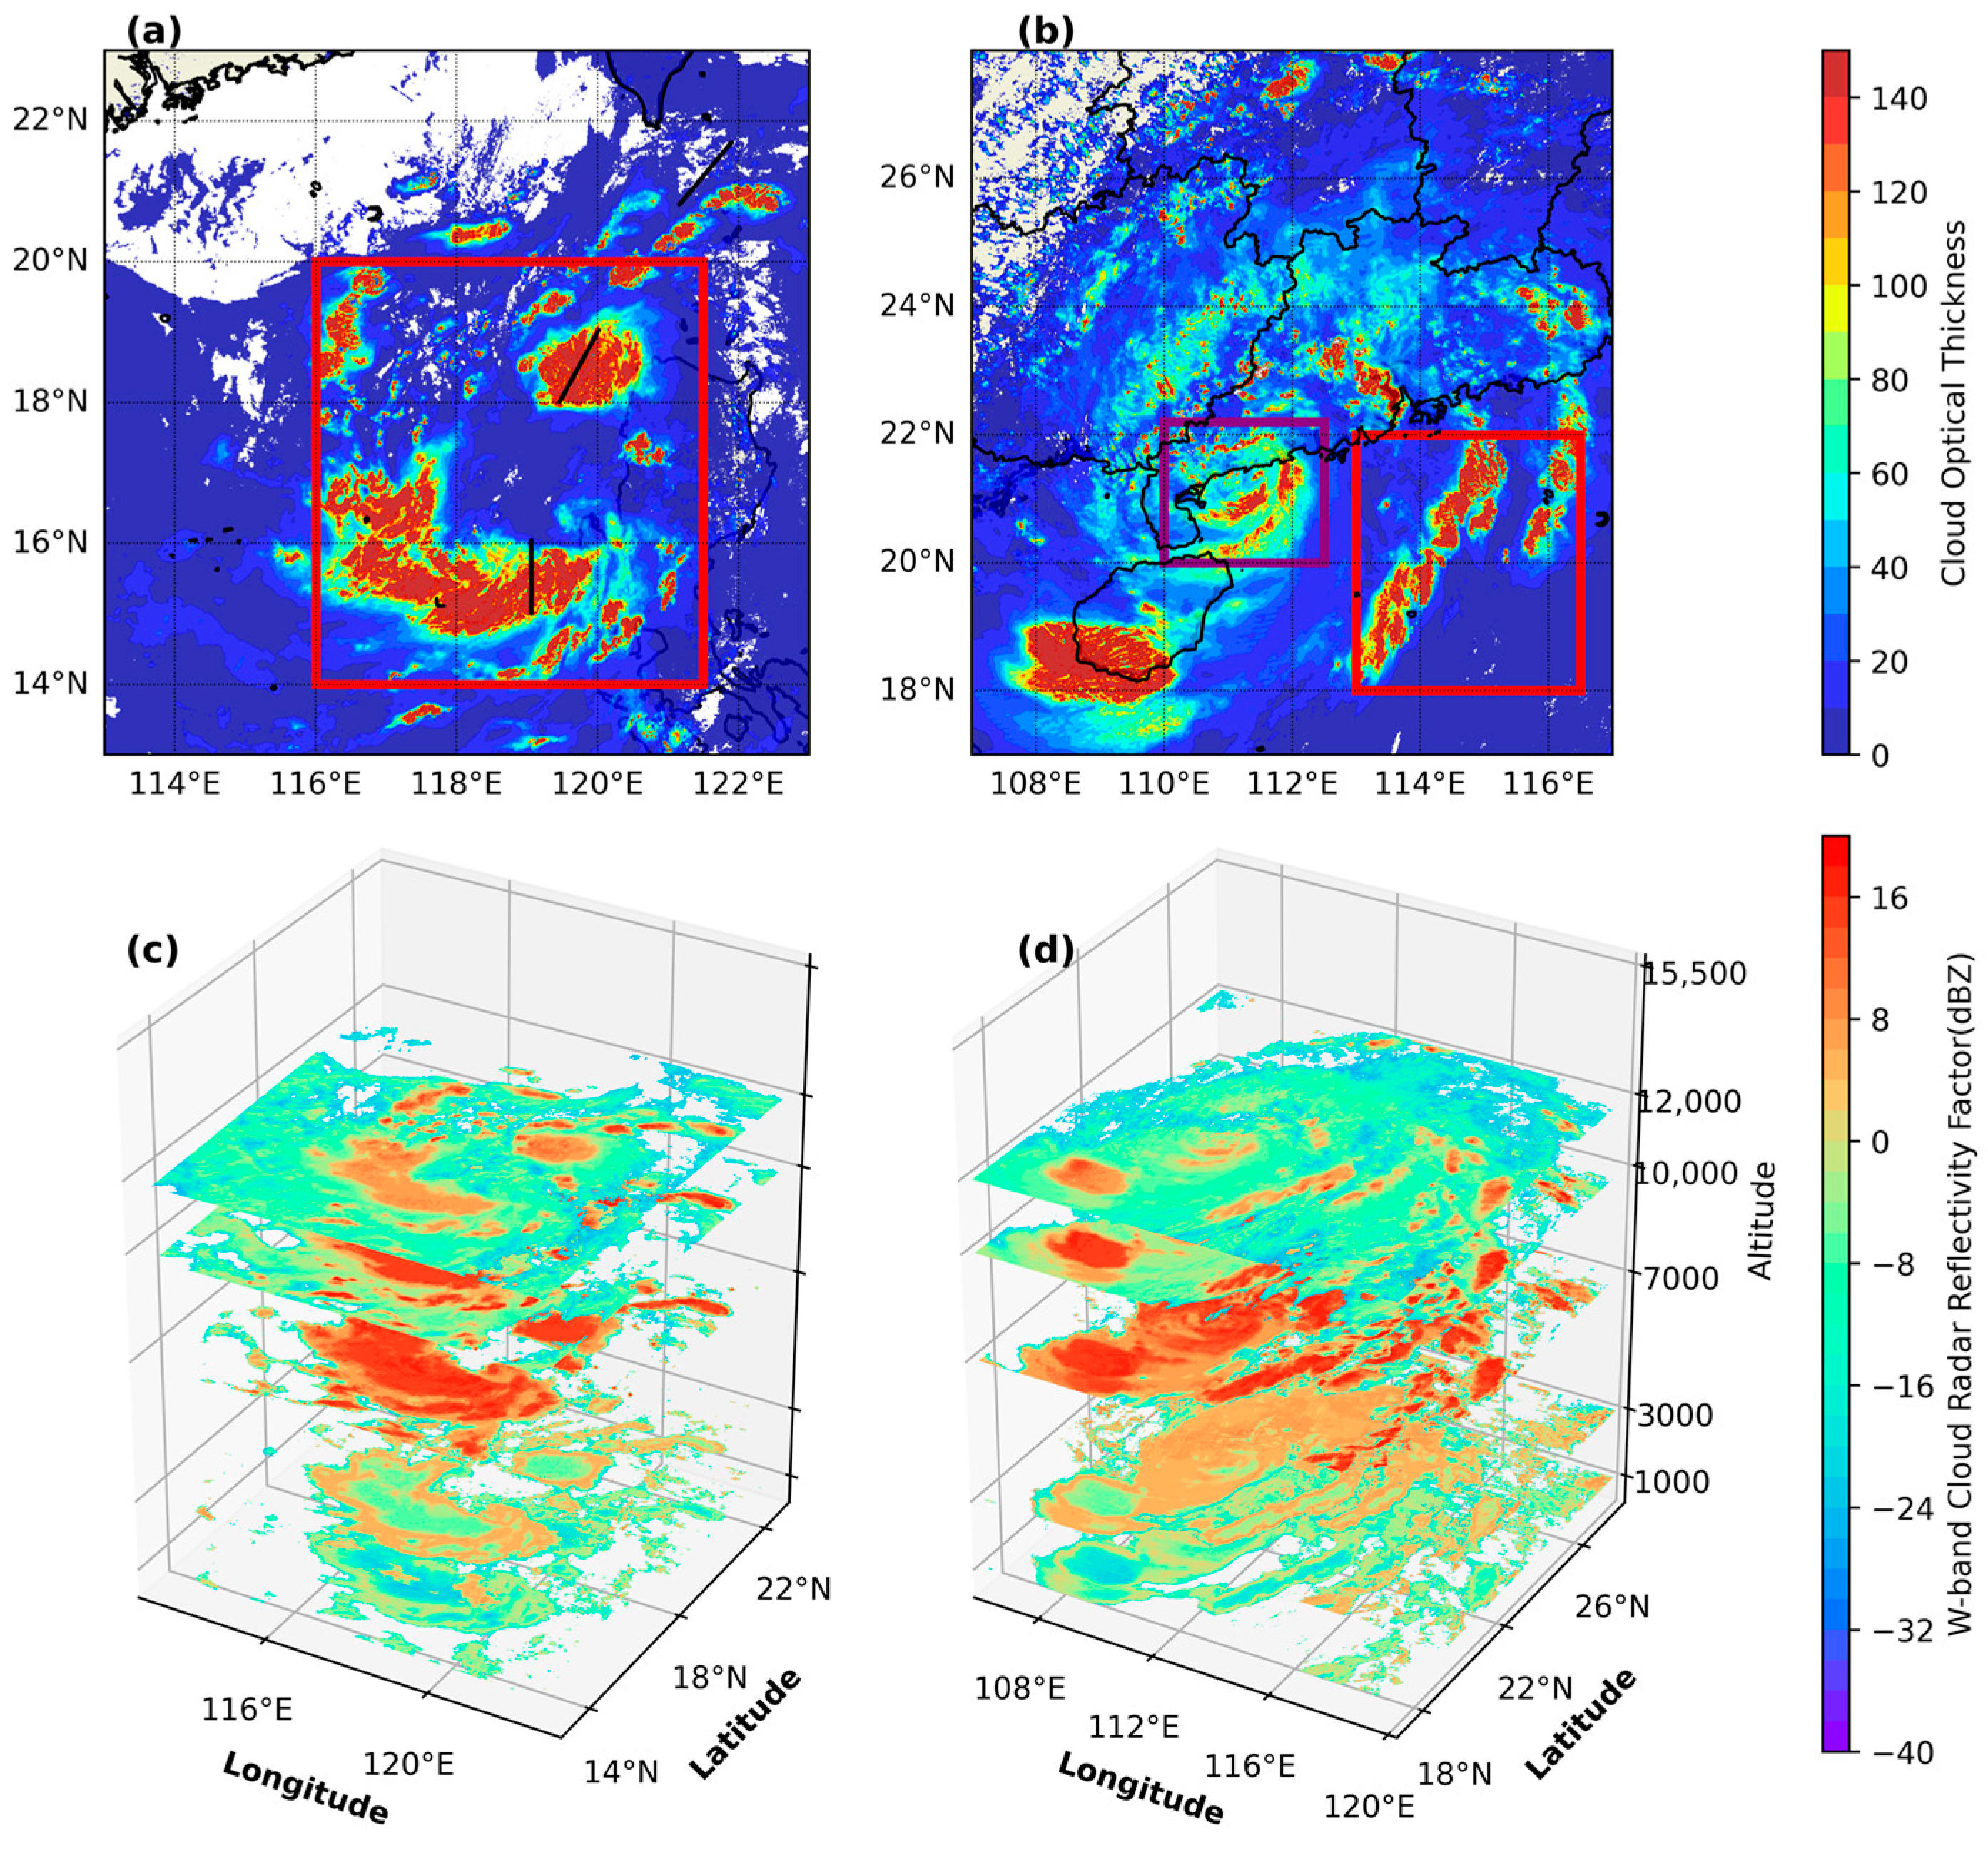
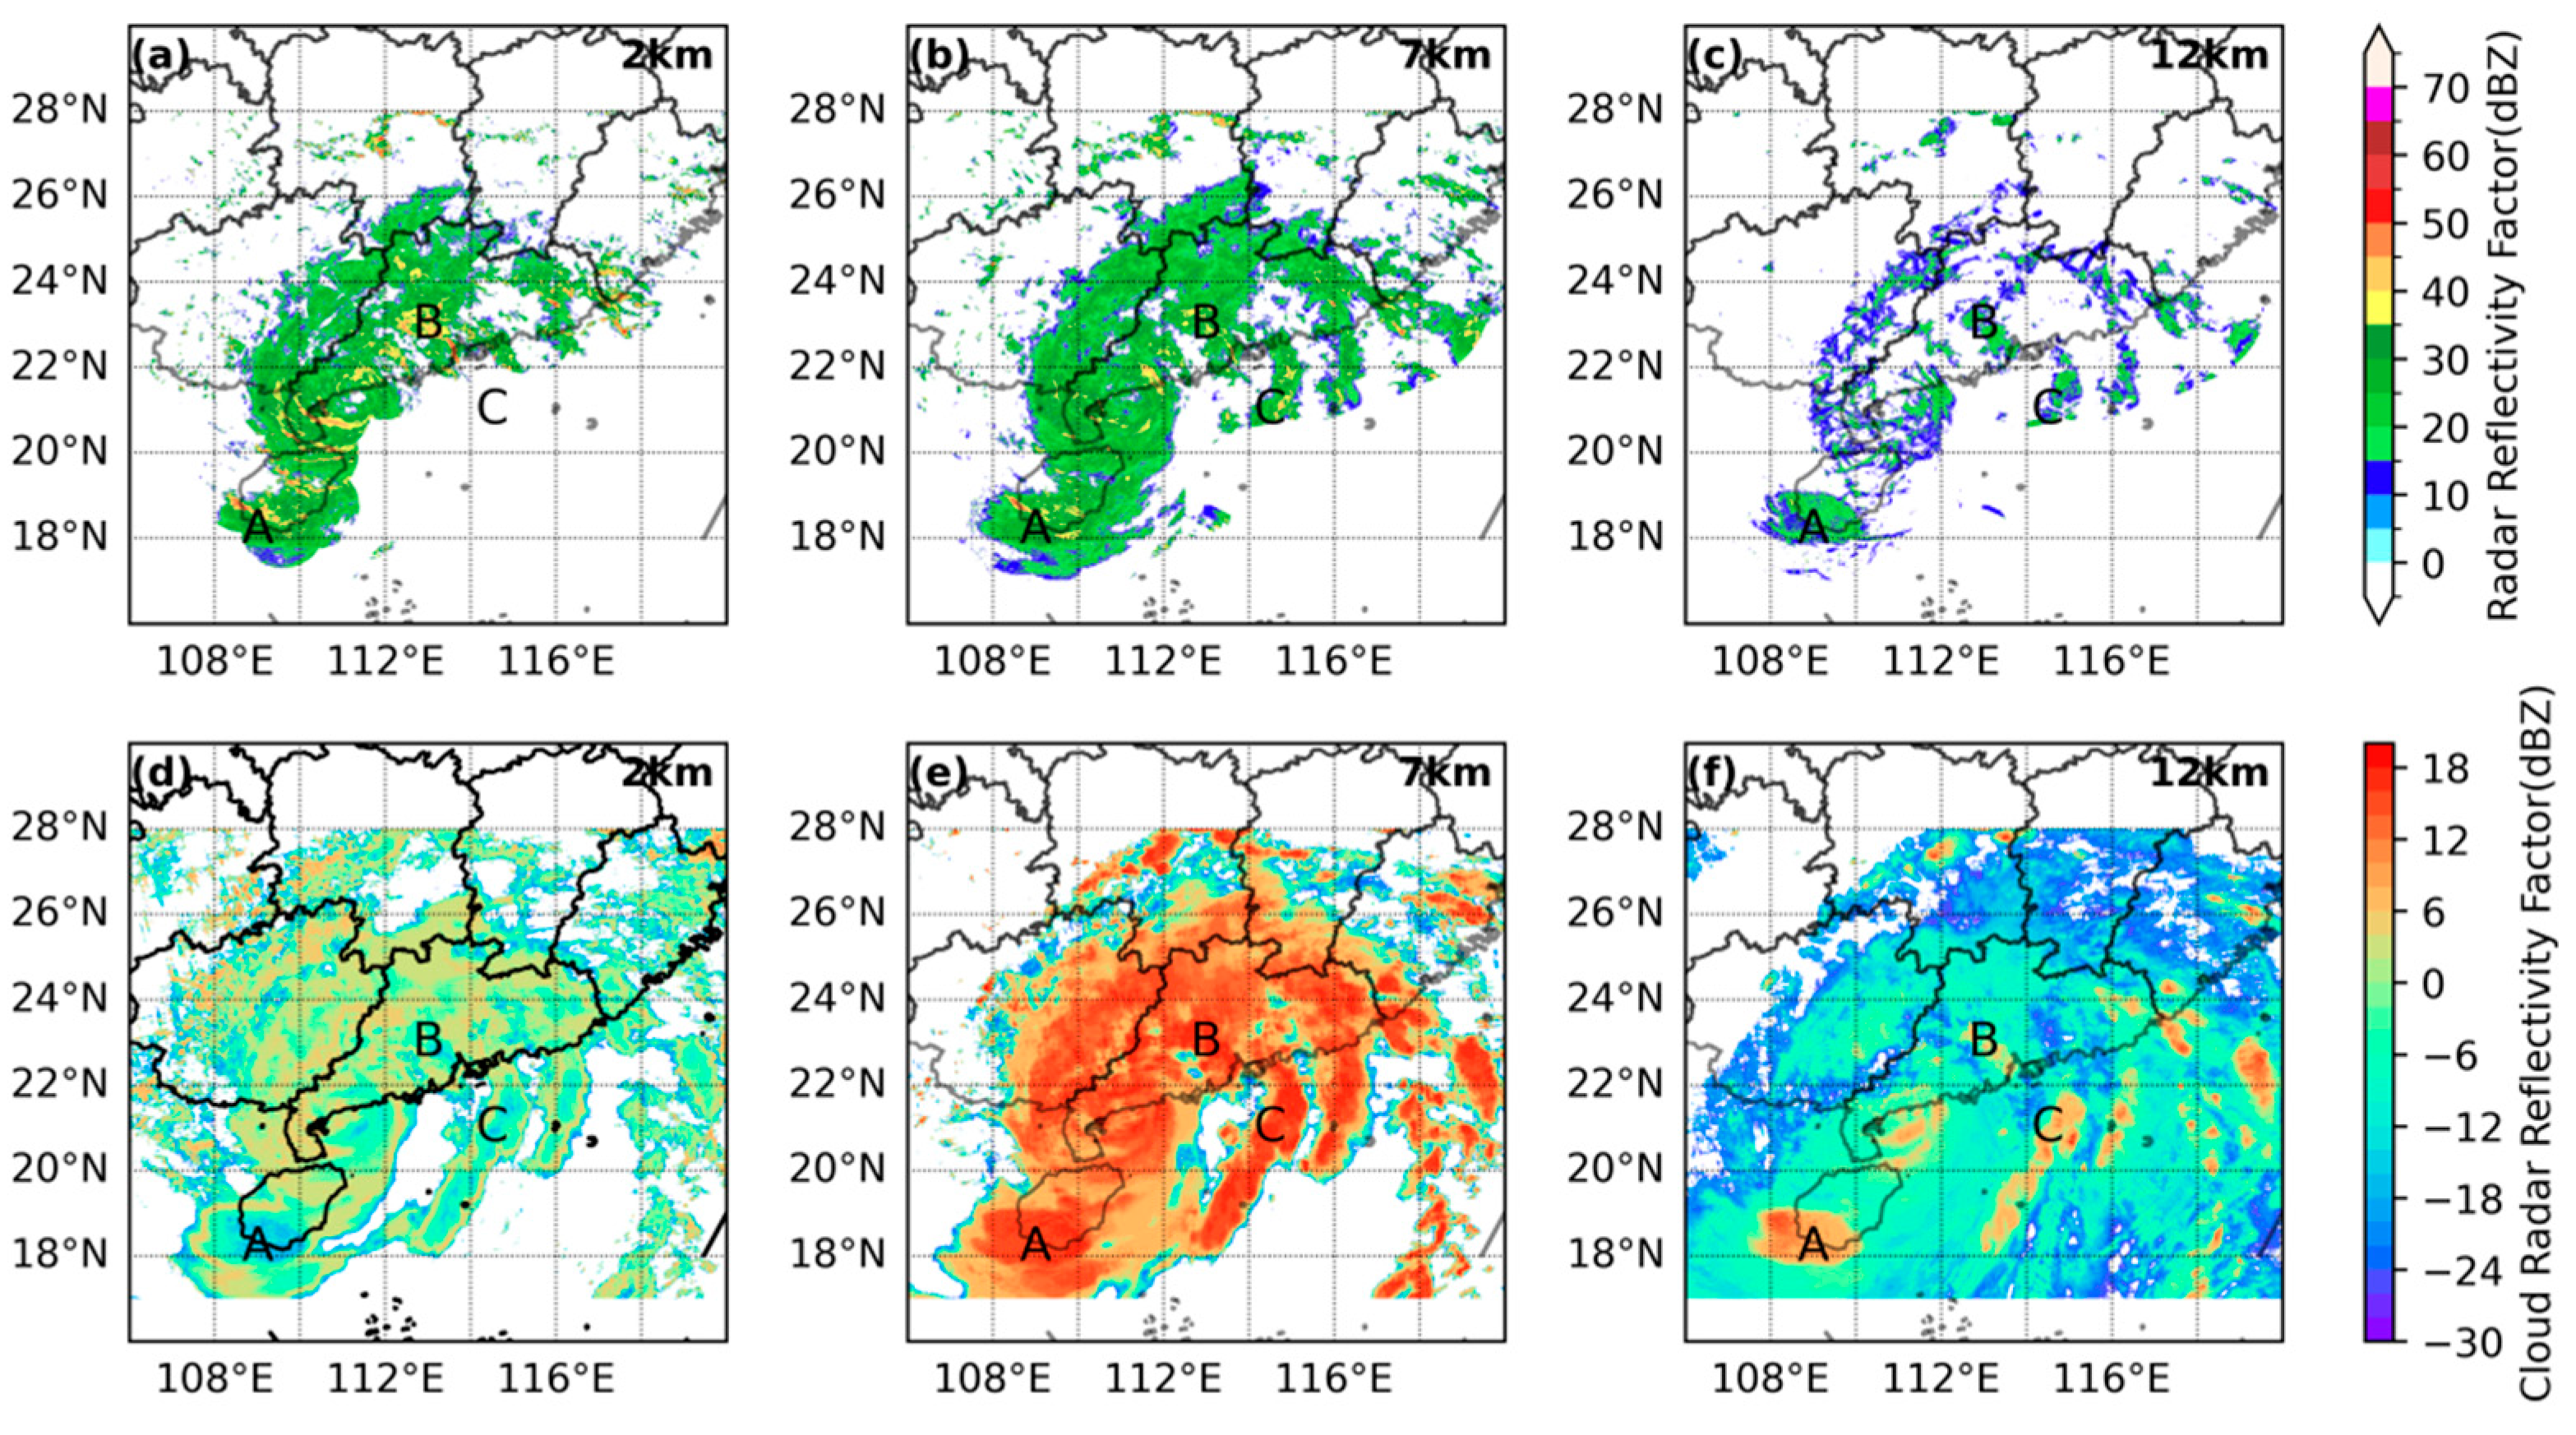
3.2. Characteristics of MODIS-Based W-Band Reflectivity Factor Retrievals
3.3. Mapping the W-Band to the S-Band Radar Reflectivity Factor Equivalent (W2S)
3.4. Assessment of the 3D Pseudo-S-Band Radar Reflectivity Factor
3.5. Assimilation of the Pseudo-S-Band Radar Reflectivity Factor
4. Assimilation Results and Evaluation
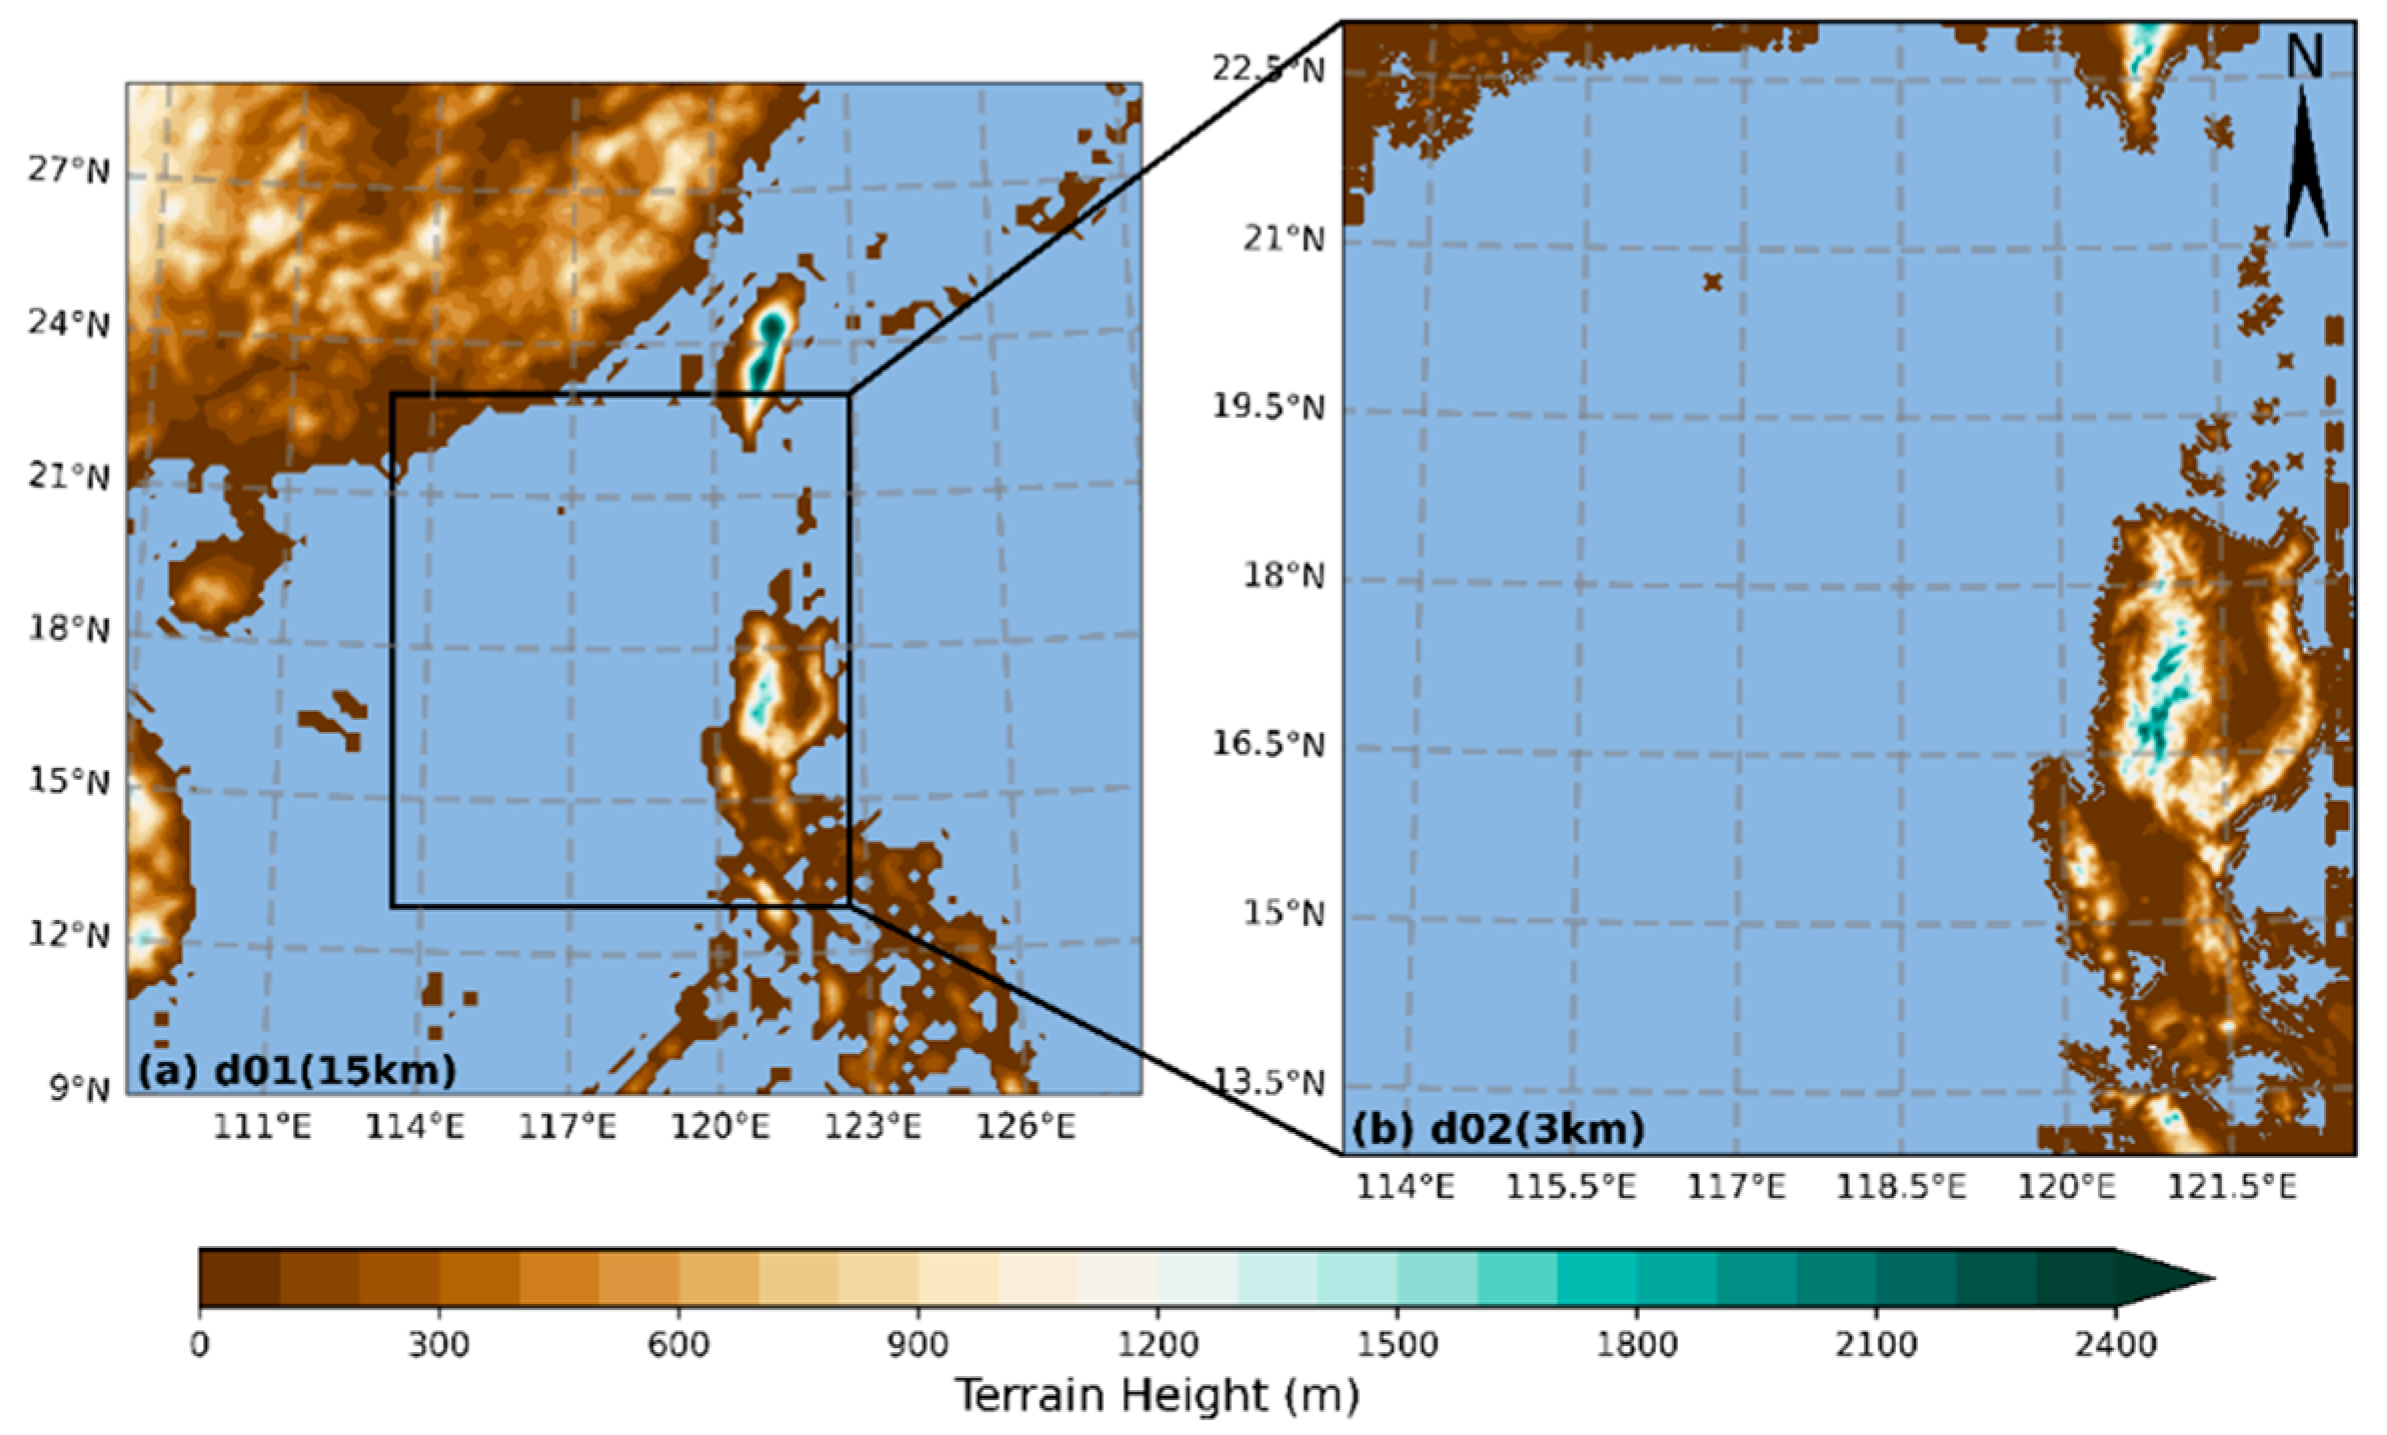
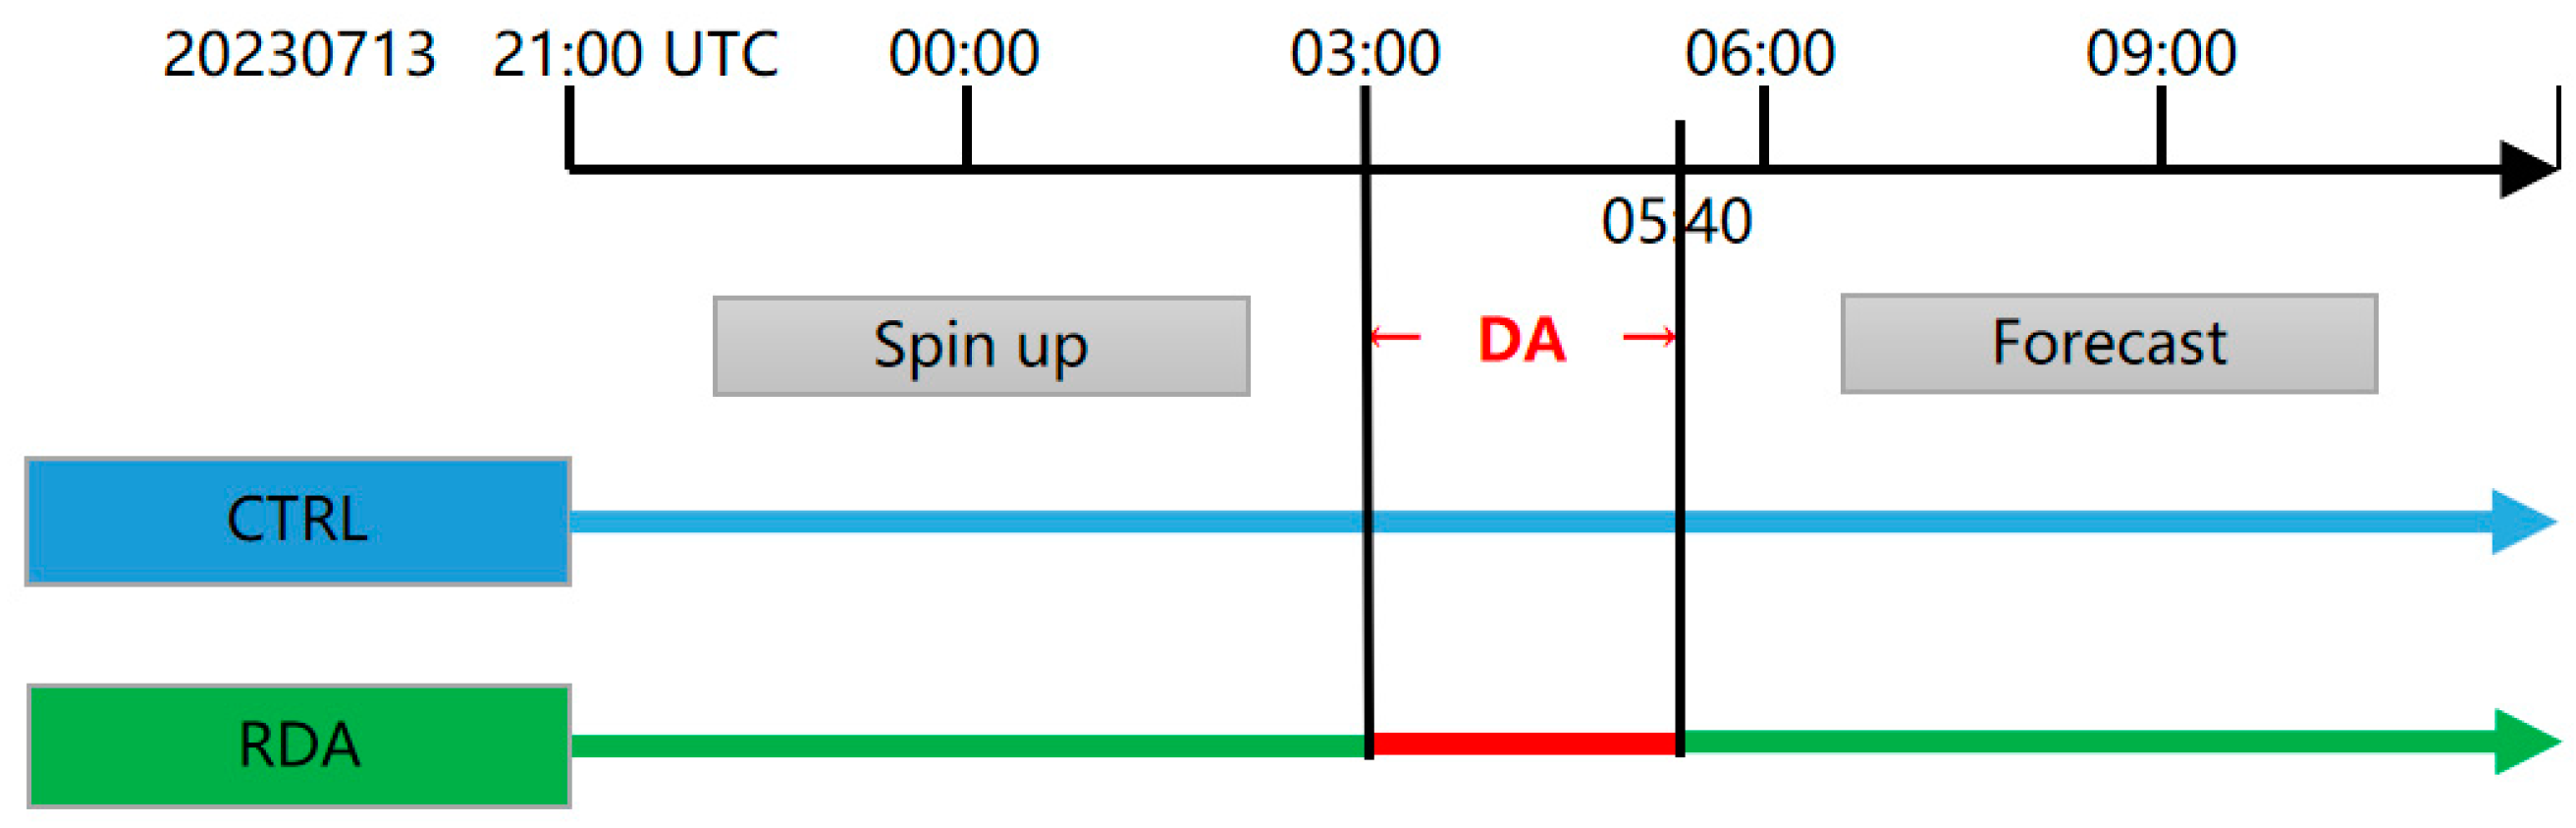
4.1. Data Assimilation Experiment Design
4.2. Impact of Microphysical Schemes on Data Assimilation
5. Discussion
6. Conclusions
- (1)
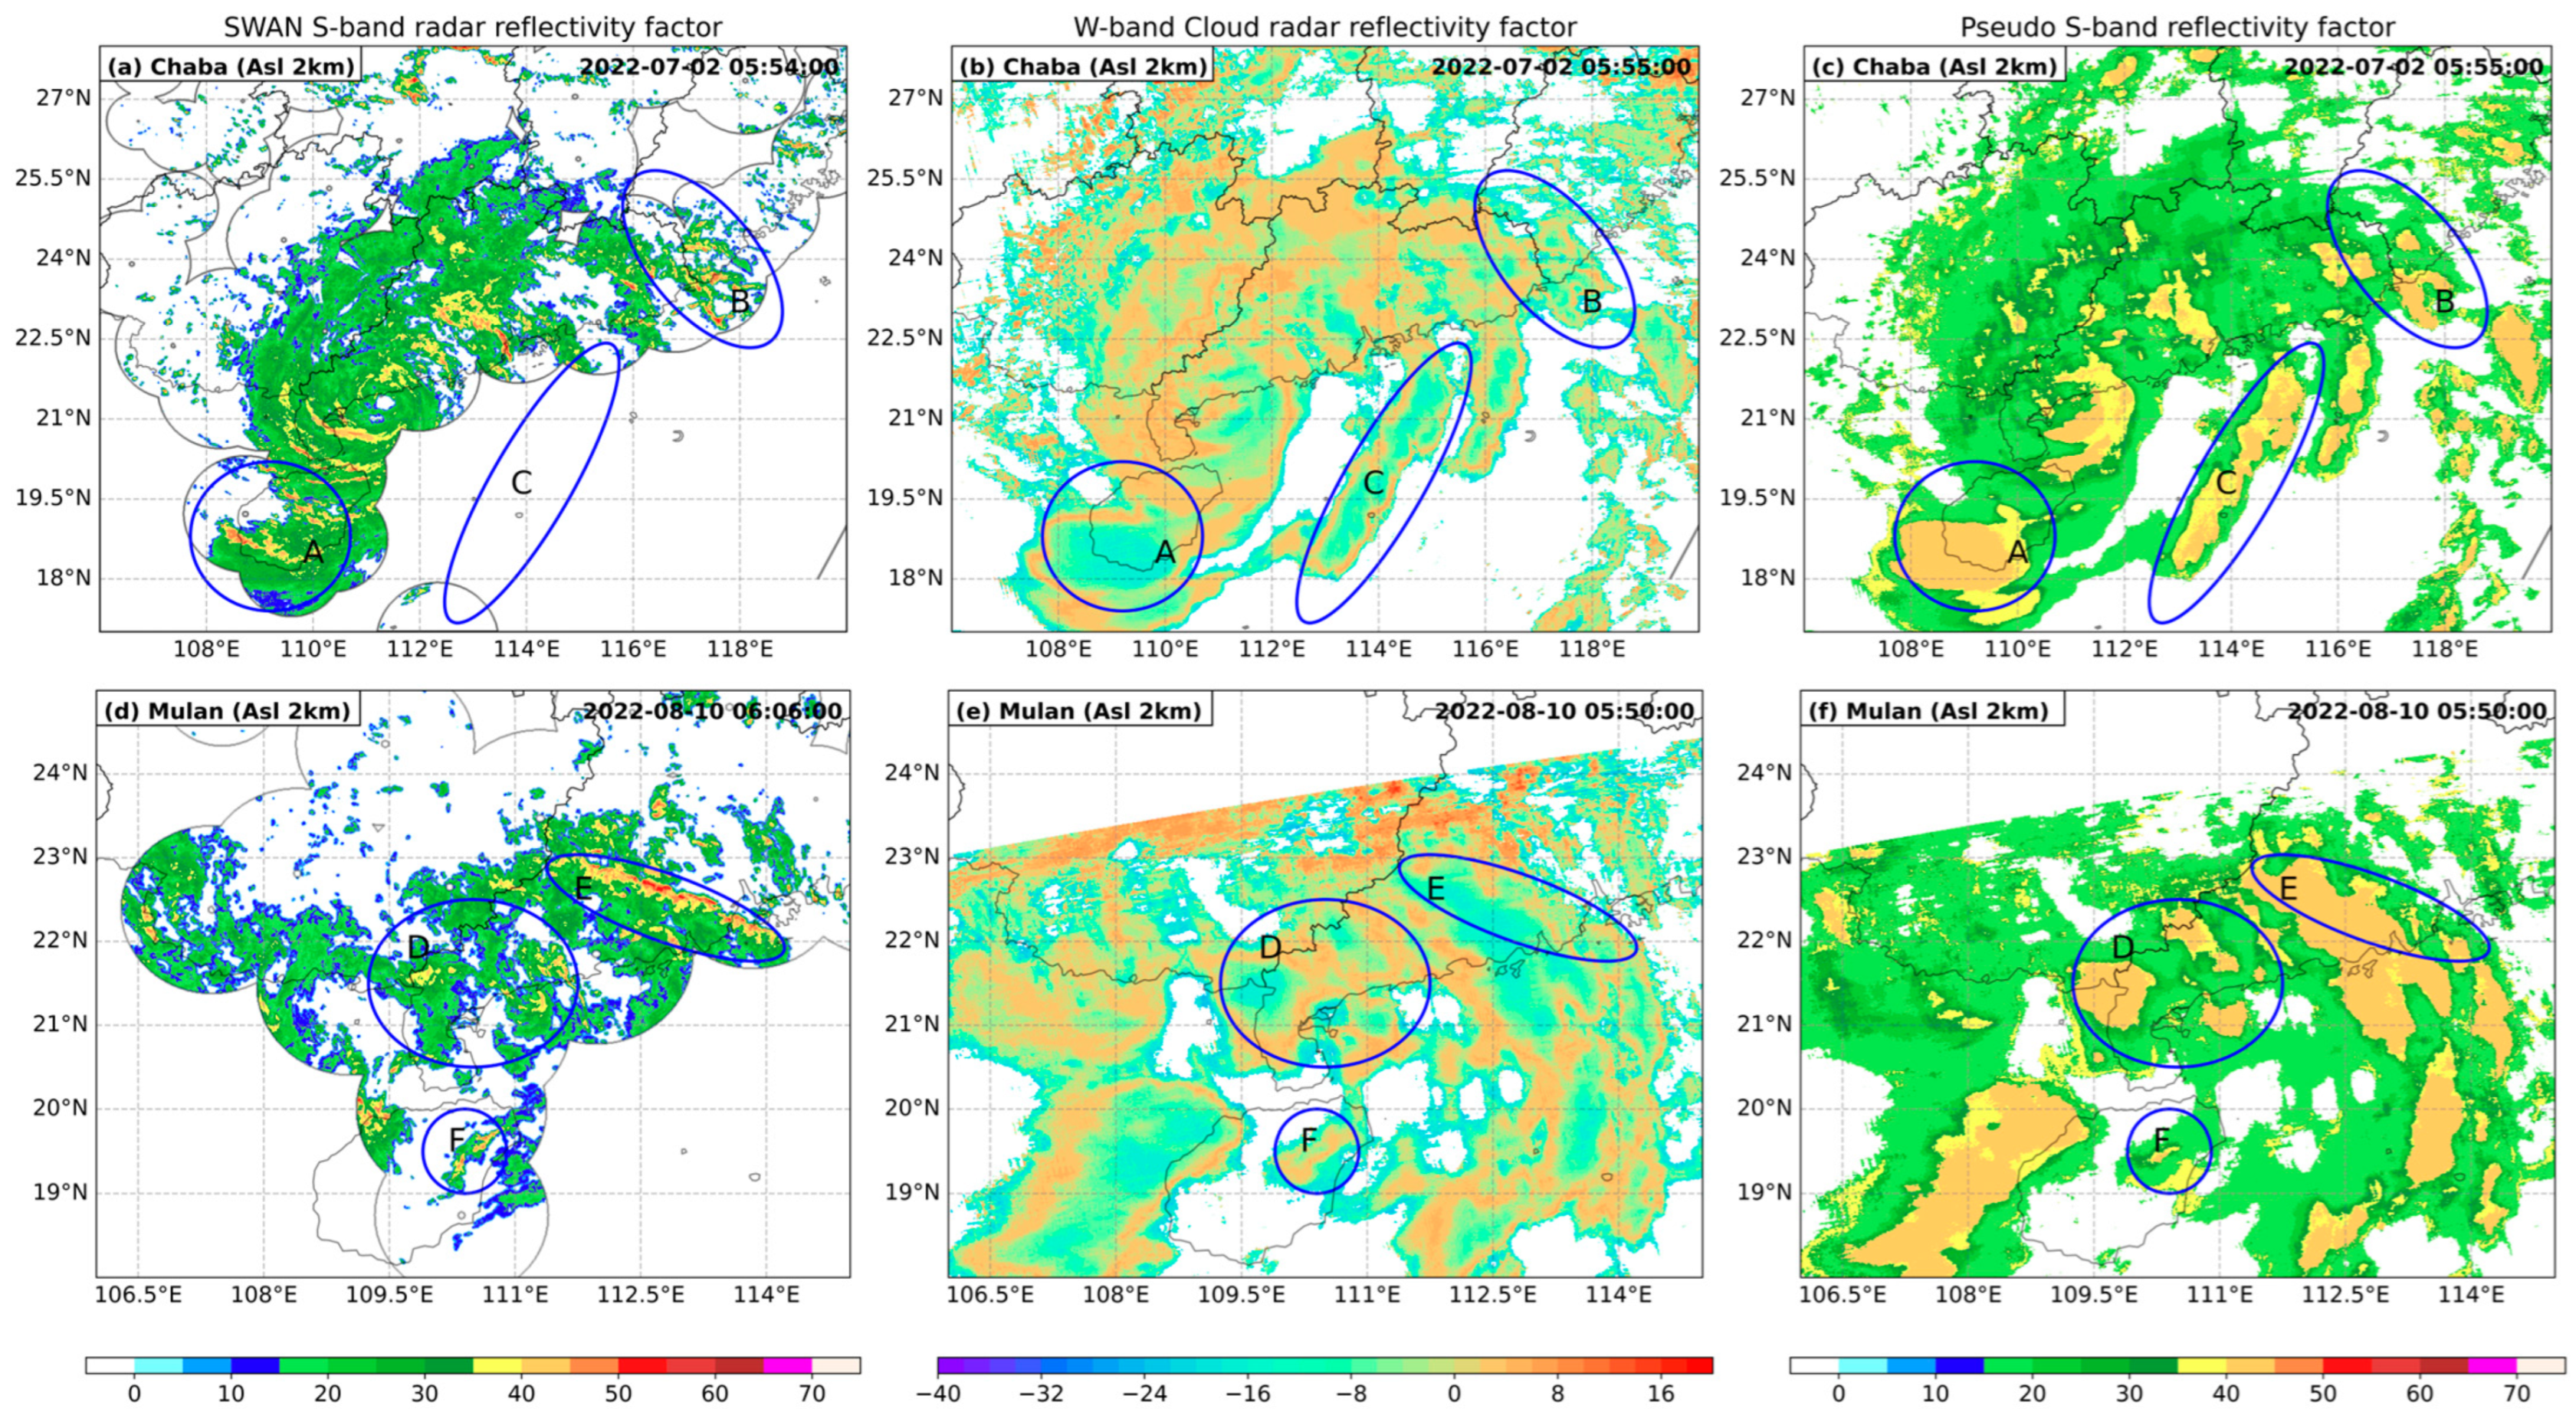
- Three-dimensional W-band cloud radar reflectivity factor of typhoons Talim and Chaba are retrieved based on the MODIS L2 cloud products by using the CGAN-BEBPF deep learning model. Taking advantage of collocated measurements of the ground-based weather radars and the retrieved MODIS W-band radar reflectivity factor at the landfall of typhoon Chaba, a mapping function between the MODIS-retrieved 3D W-band cloud radar reflectivity factor and the ground-based S-band radar reflectivity factor is constructed. This approach not only supports the use of WRF-FDDA HLHN to assimilate the MODIS data, but also effectively addresses the severe attenuation issue of the MODIS W-band cloud radar reflectivity factor retrievals in the lower portion of the intense precipitation cores.
- (2)
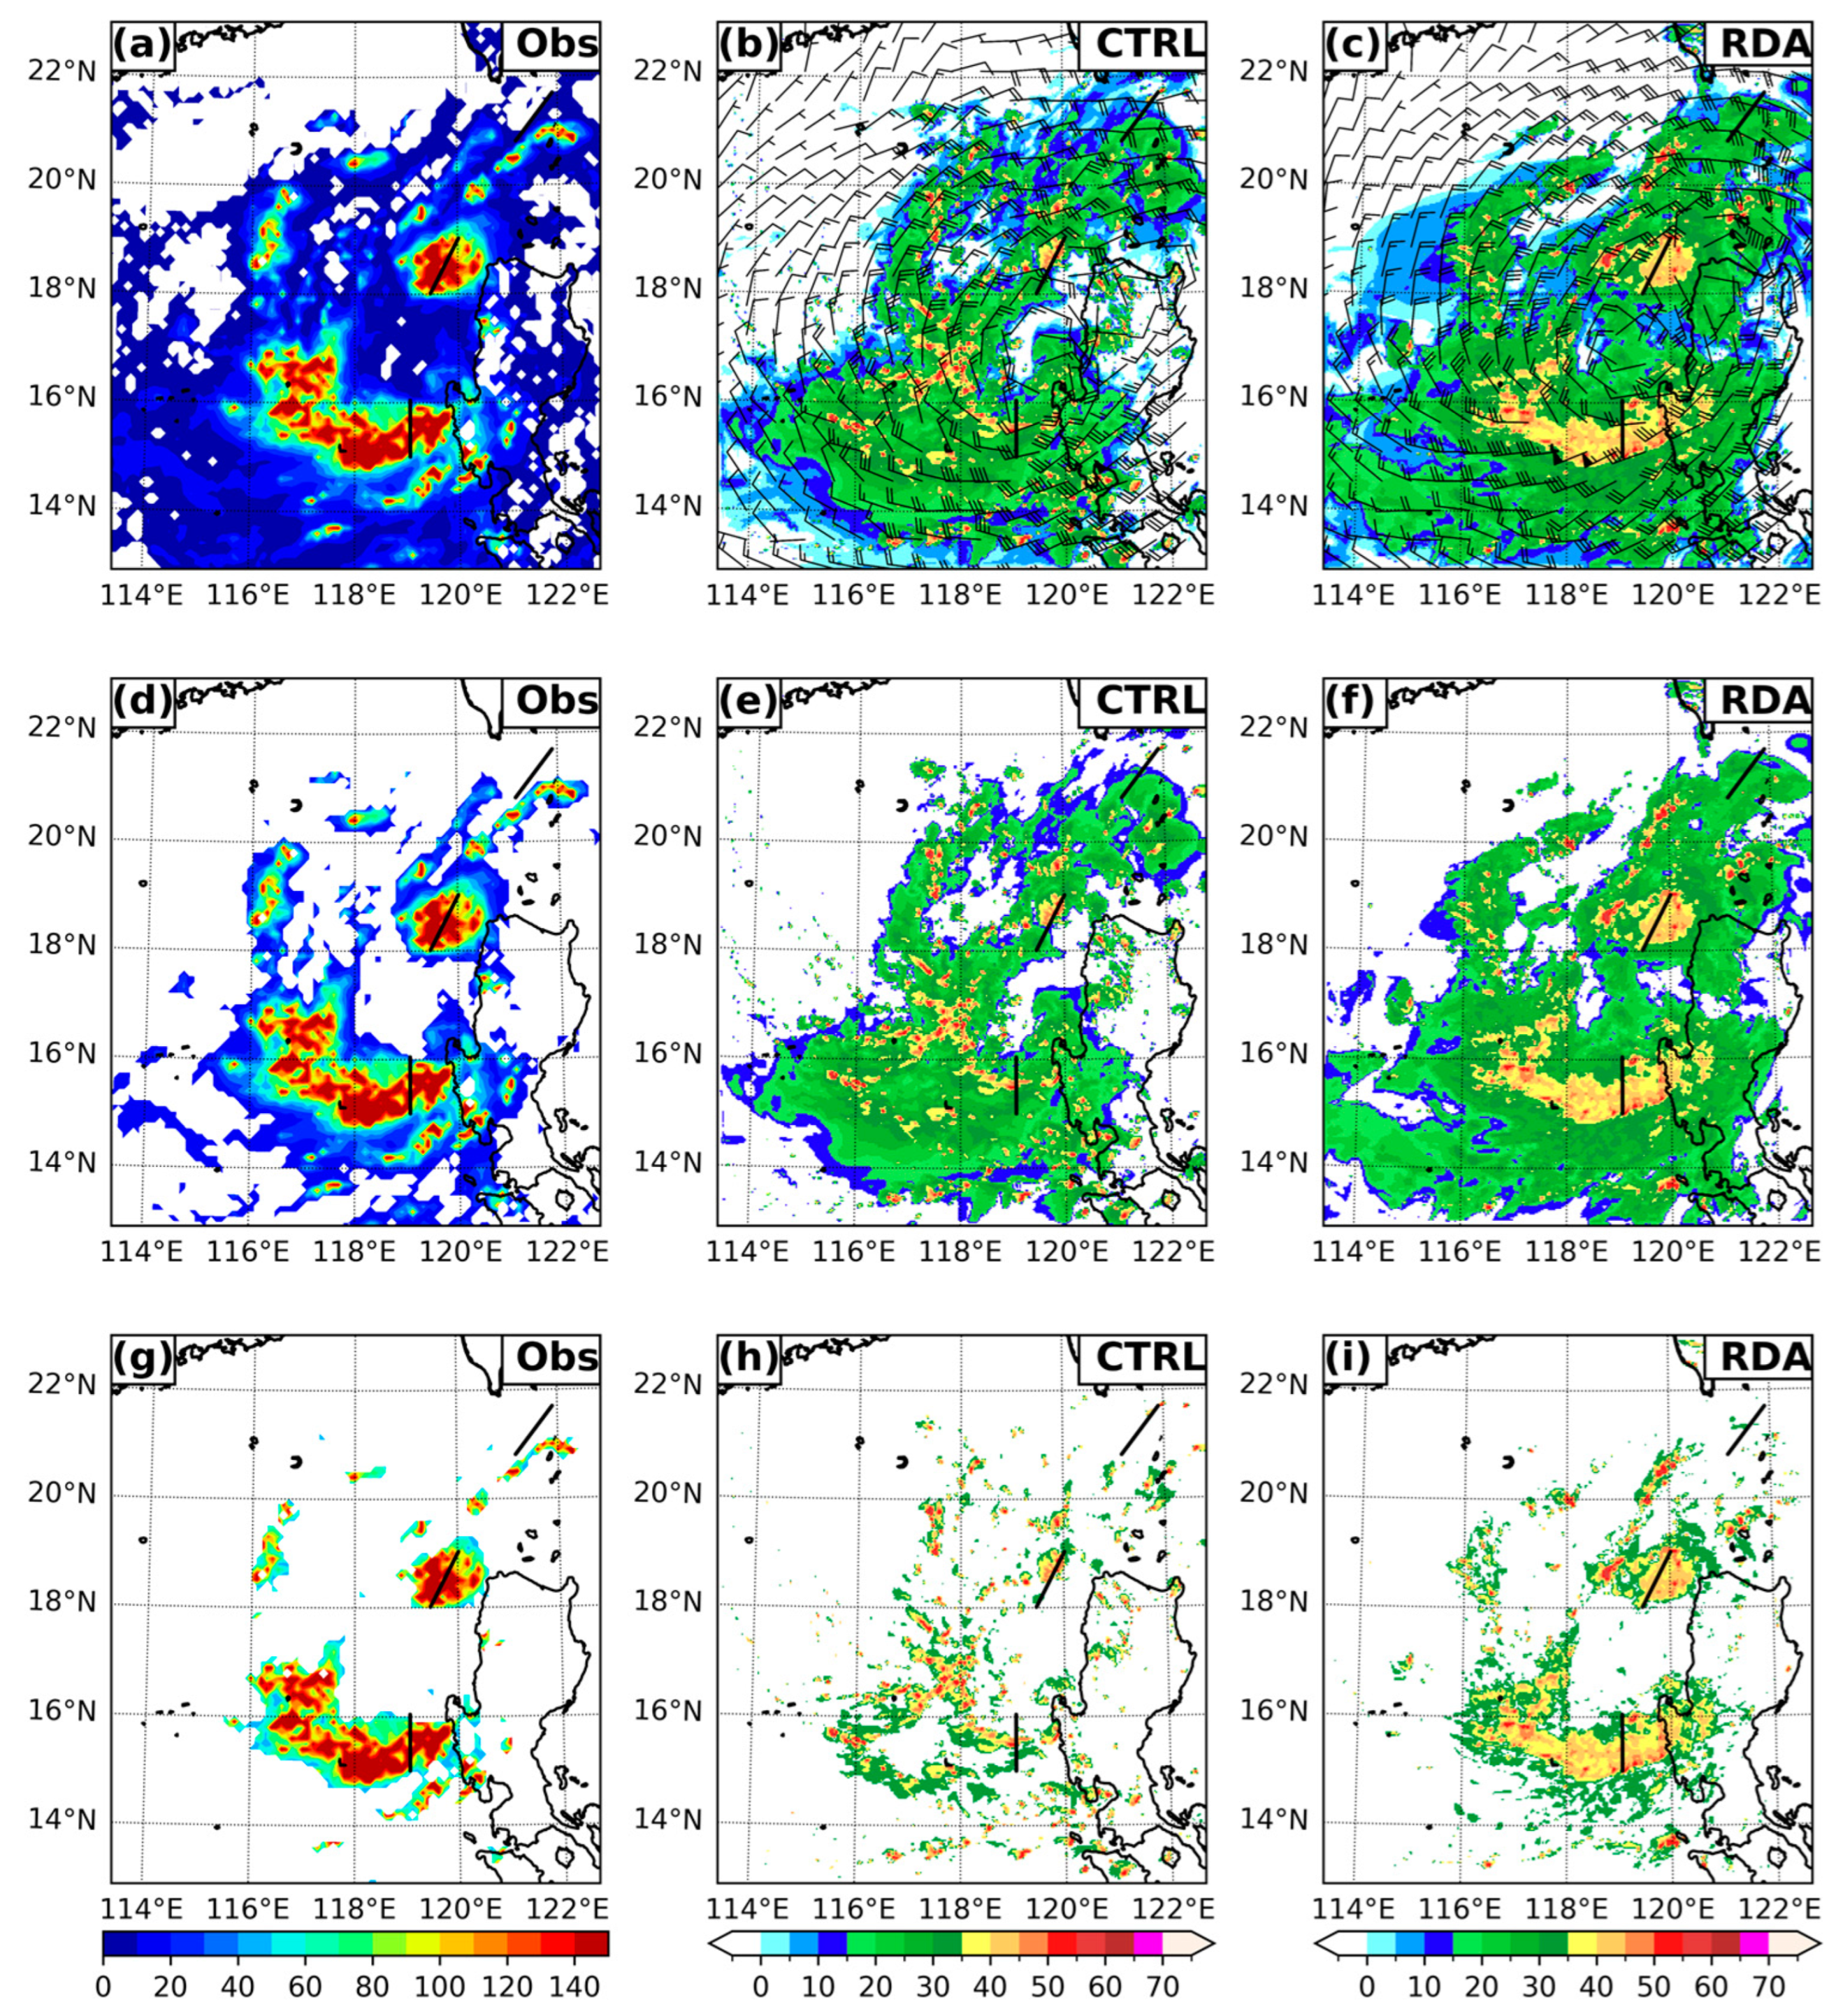
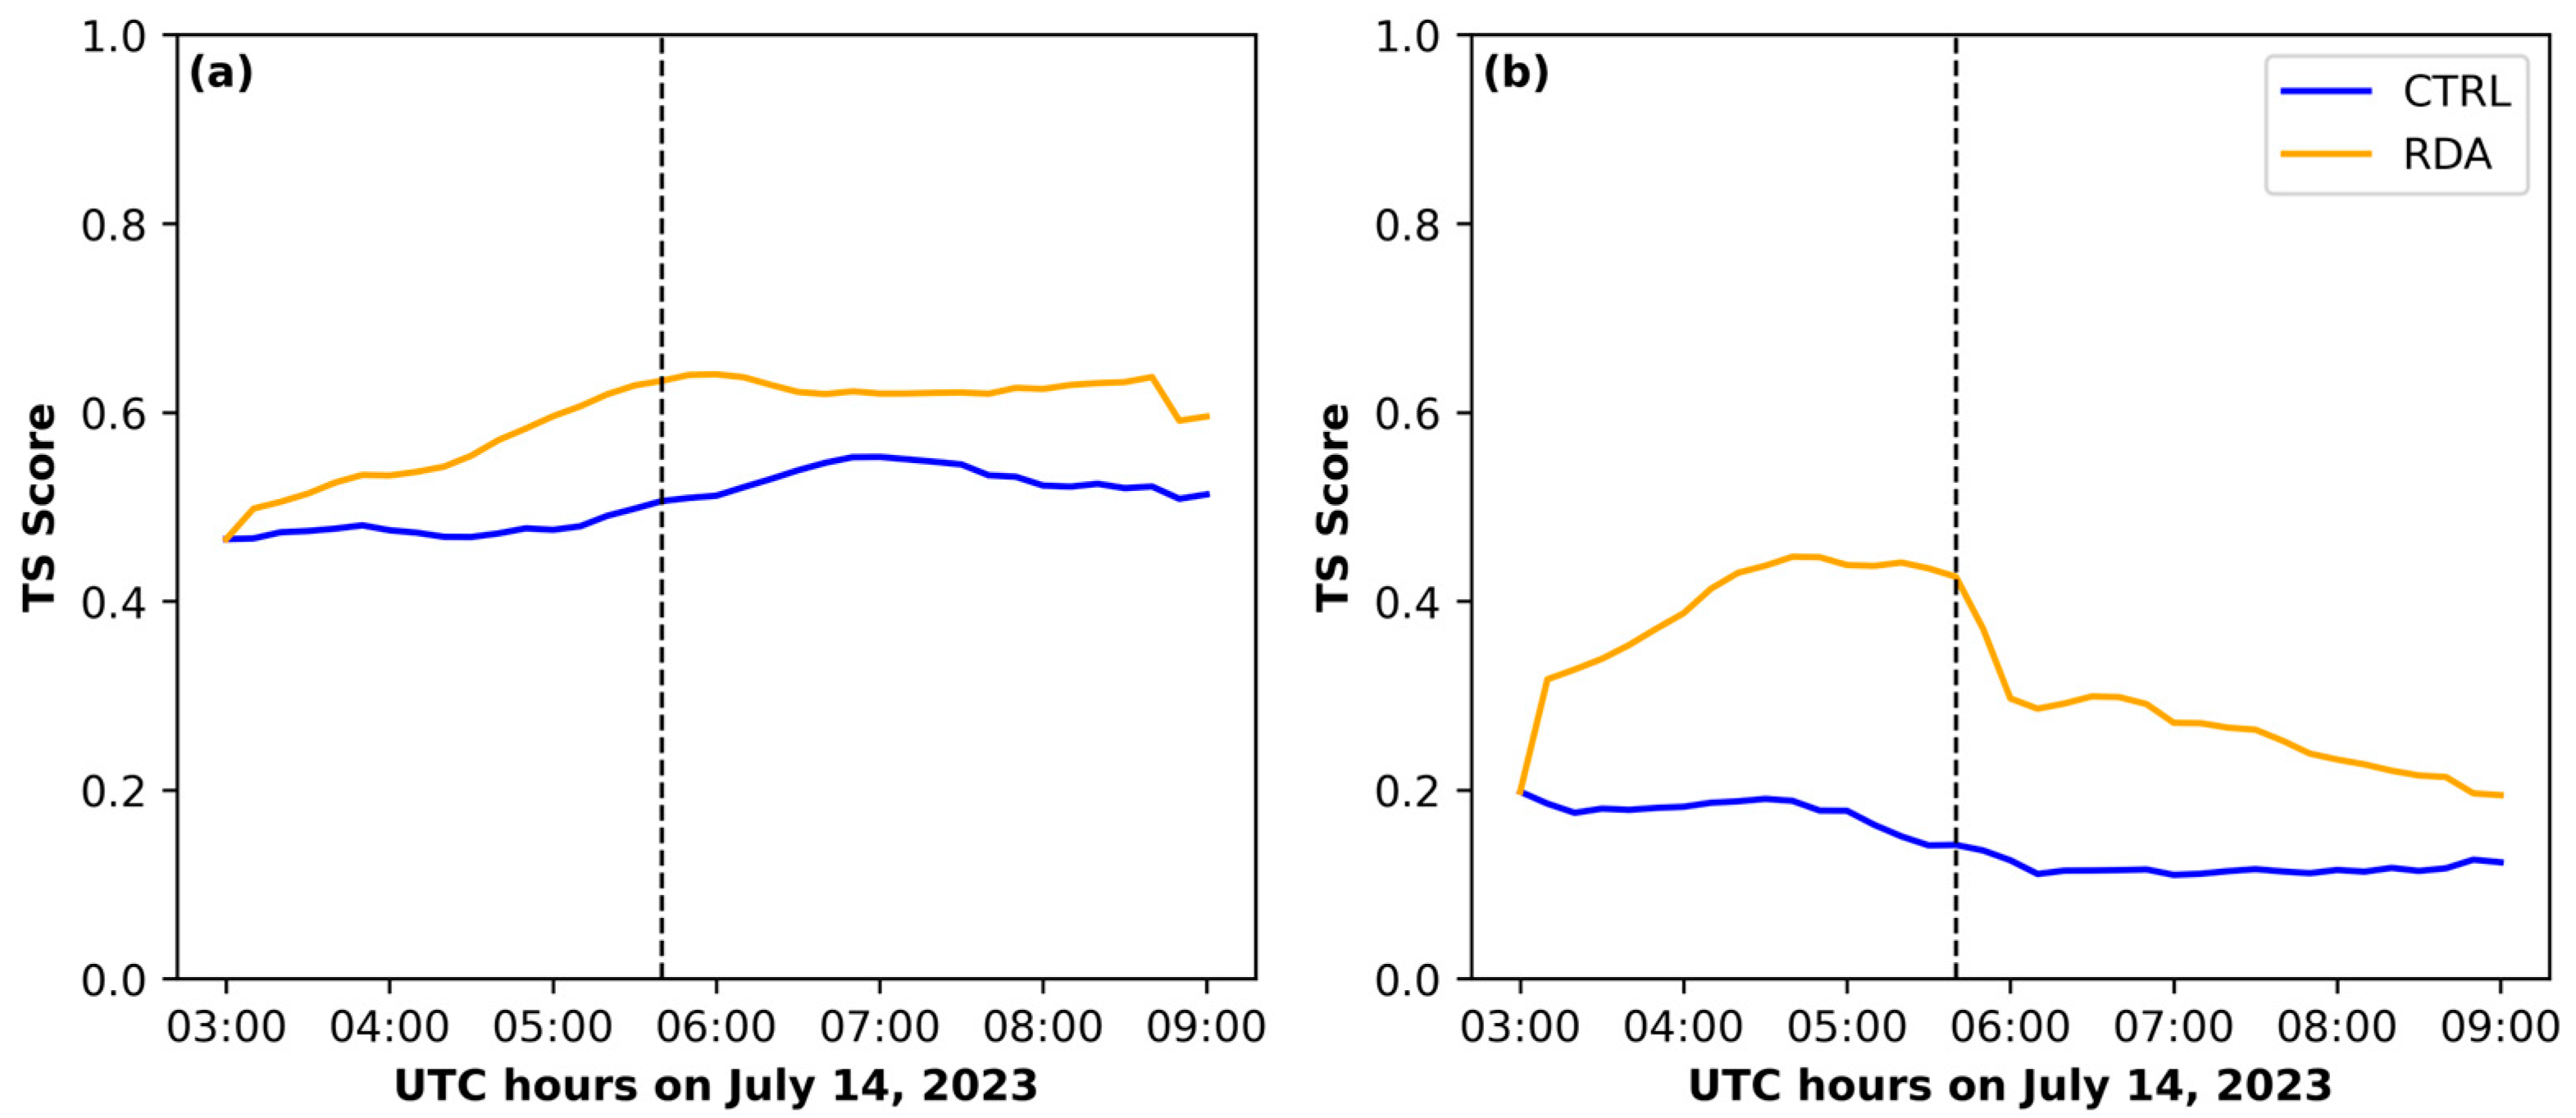
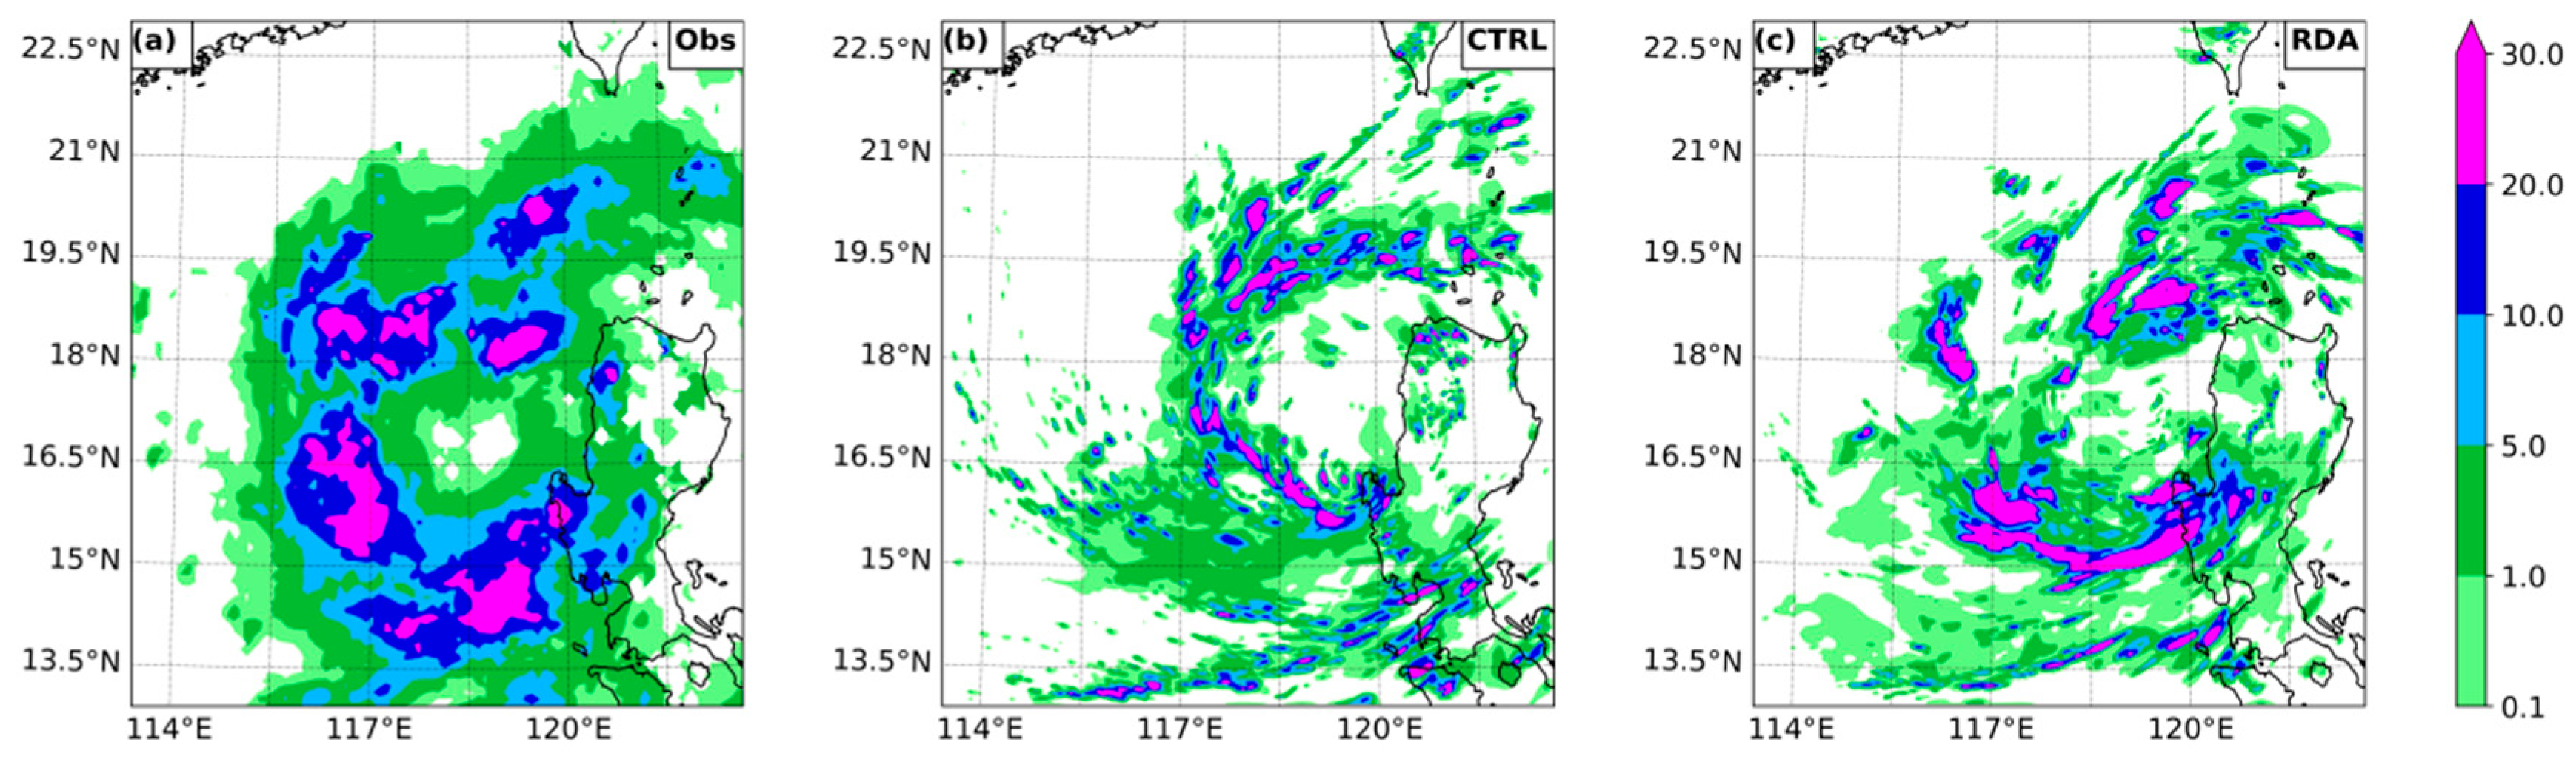
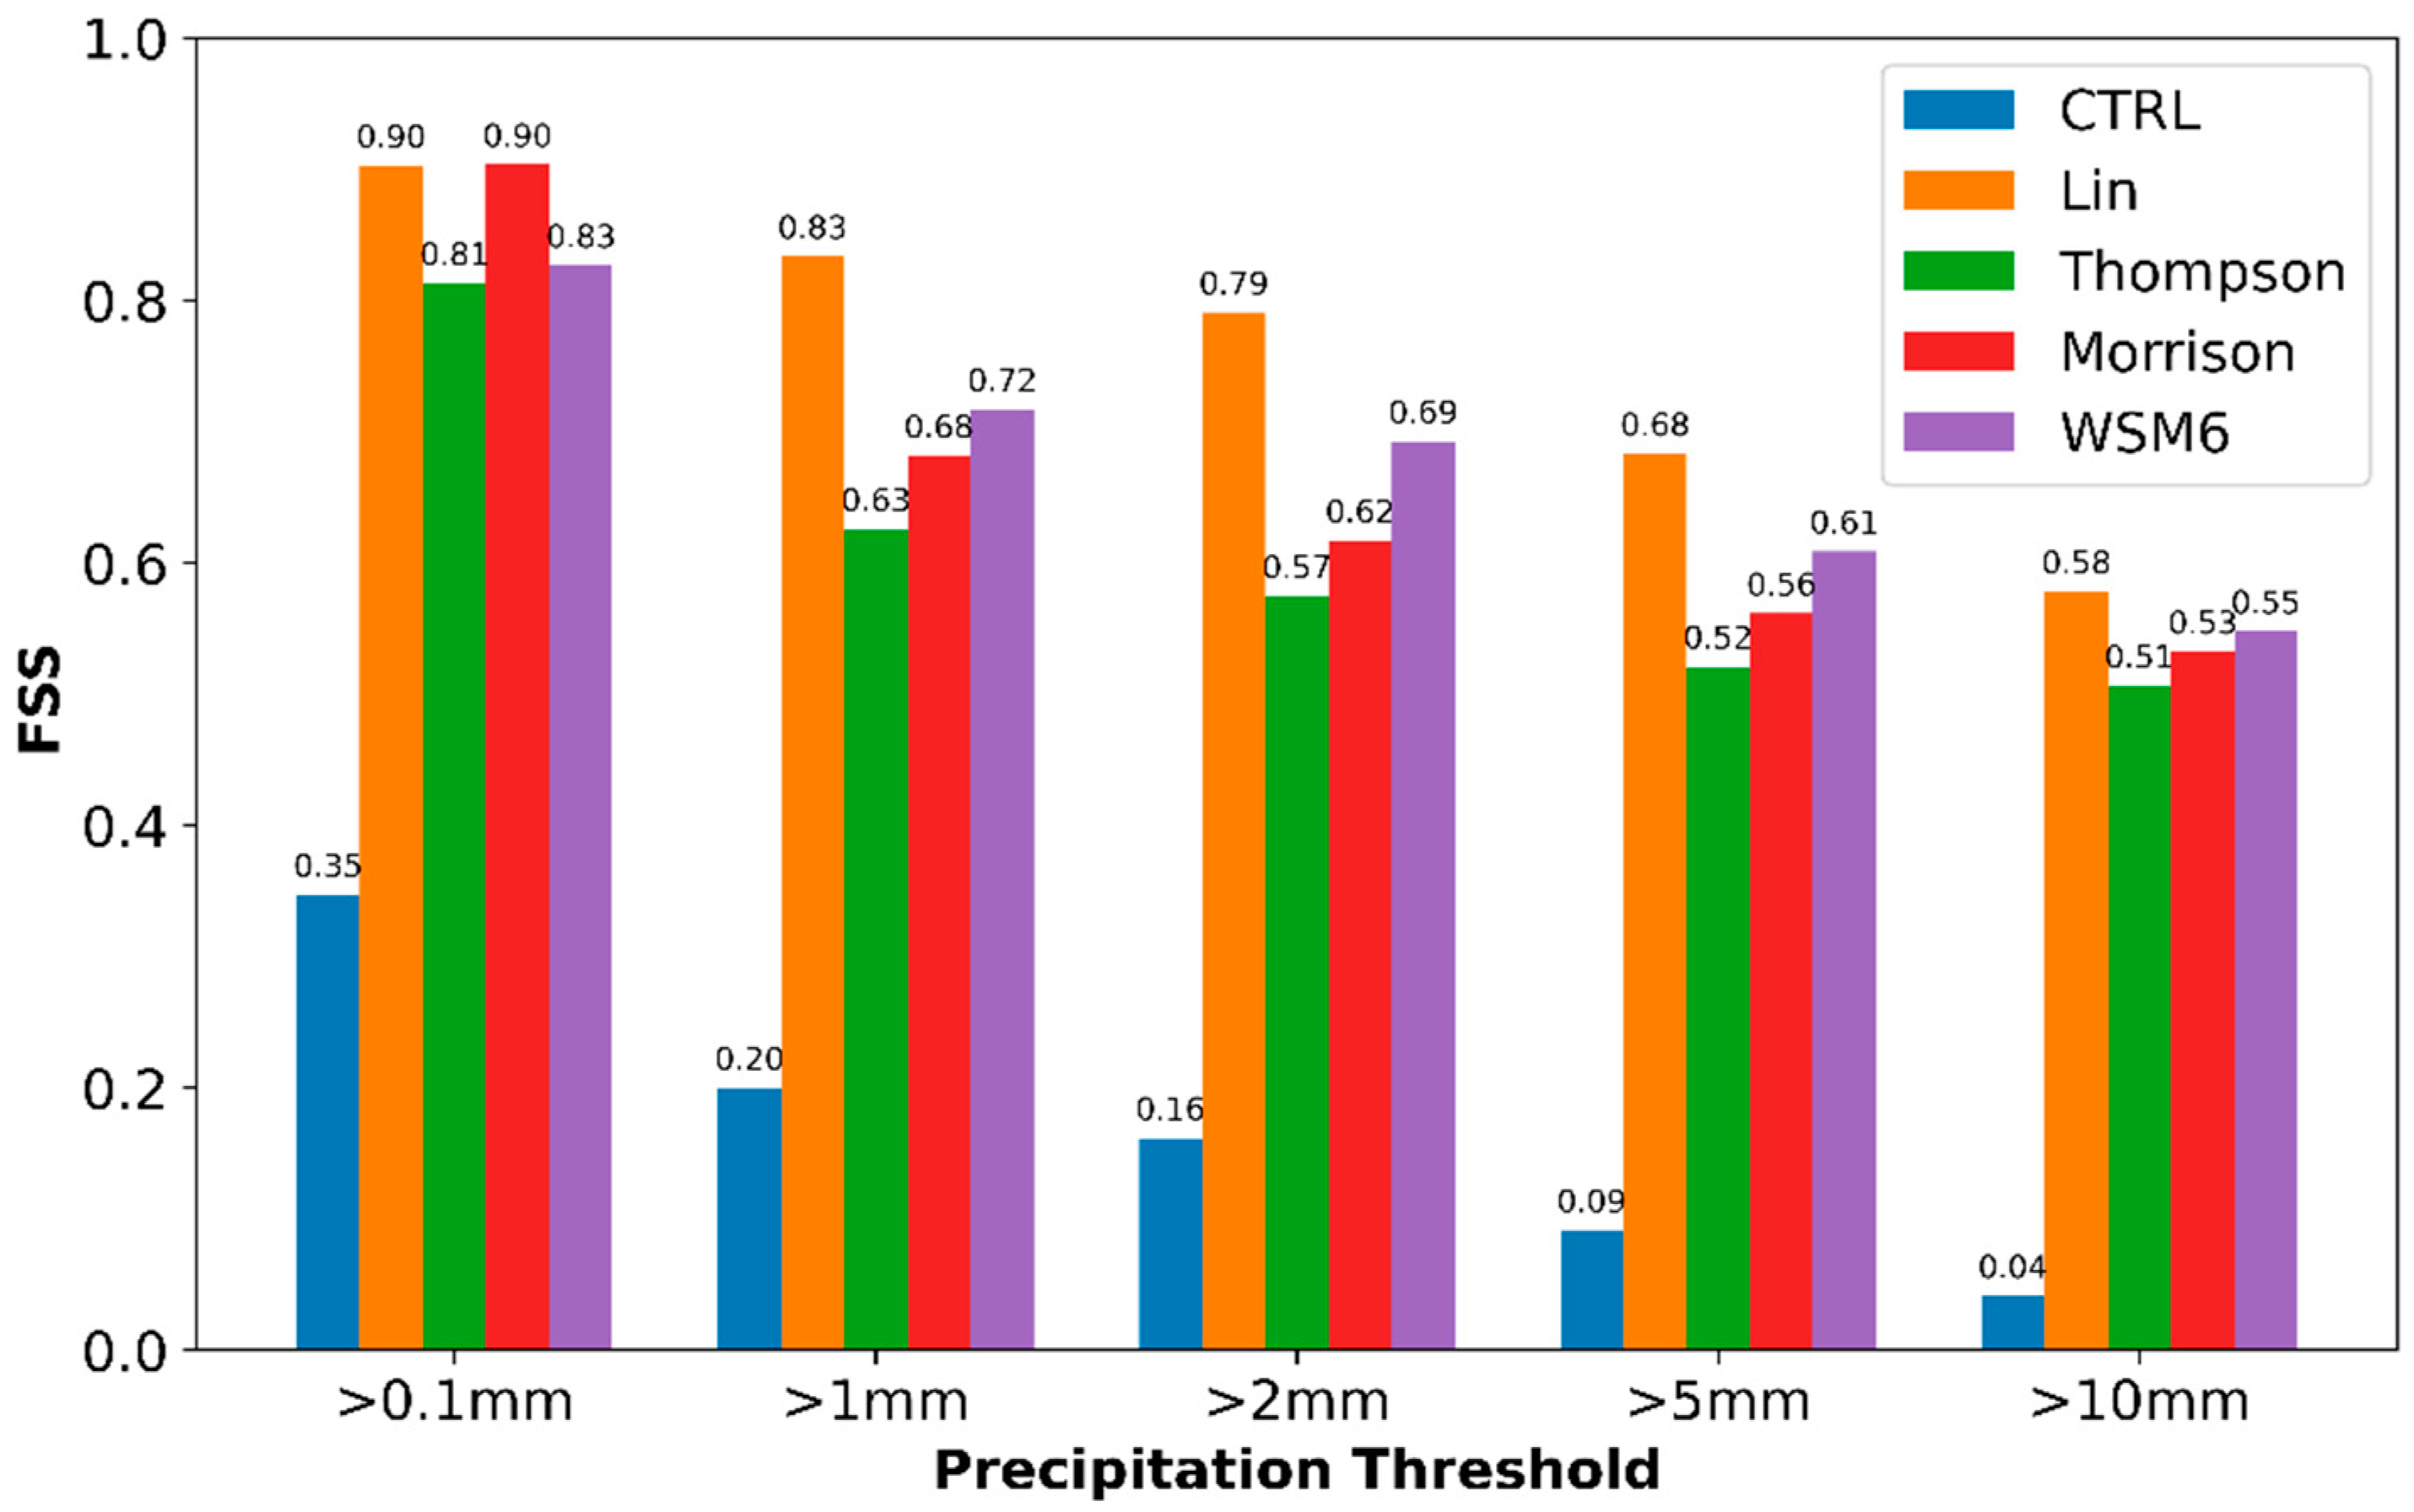
- Assimilating the MODIS L2 cloud products enables the WRF model to initialize the convective clusters of Typhoon Talim more accurately. By verifying the model results with the Himawari-9 cloud optical thickness and the GPM IMERG precipitation measurements, it is shown that during the data assimilation phase, the TS score of the MODIS data assimilation experiment is significantly increased for both general cloudy areas (from 0.46 to 0.63) and main precipitation areas (from 0.19 to 0.42), respectively; the TS score decreases during the forecasting phase, but it remains significantly higher than the experiment without data assimilation. There is also a significant improvement in precipitation analysis and forecasting, transforming the precipitation area from the narrow-rainband features in CTRL to the broader rainbands as observed. For the forecast period, the FSS score for the main precipitation core (>5 mm) is increased from 0.09 to 0.52.
- (3)
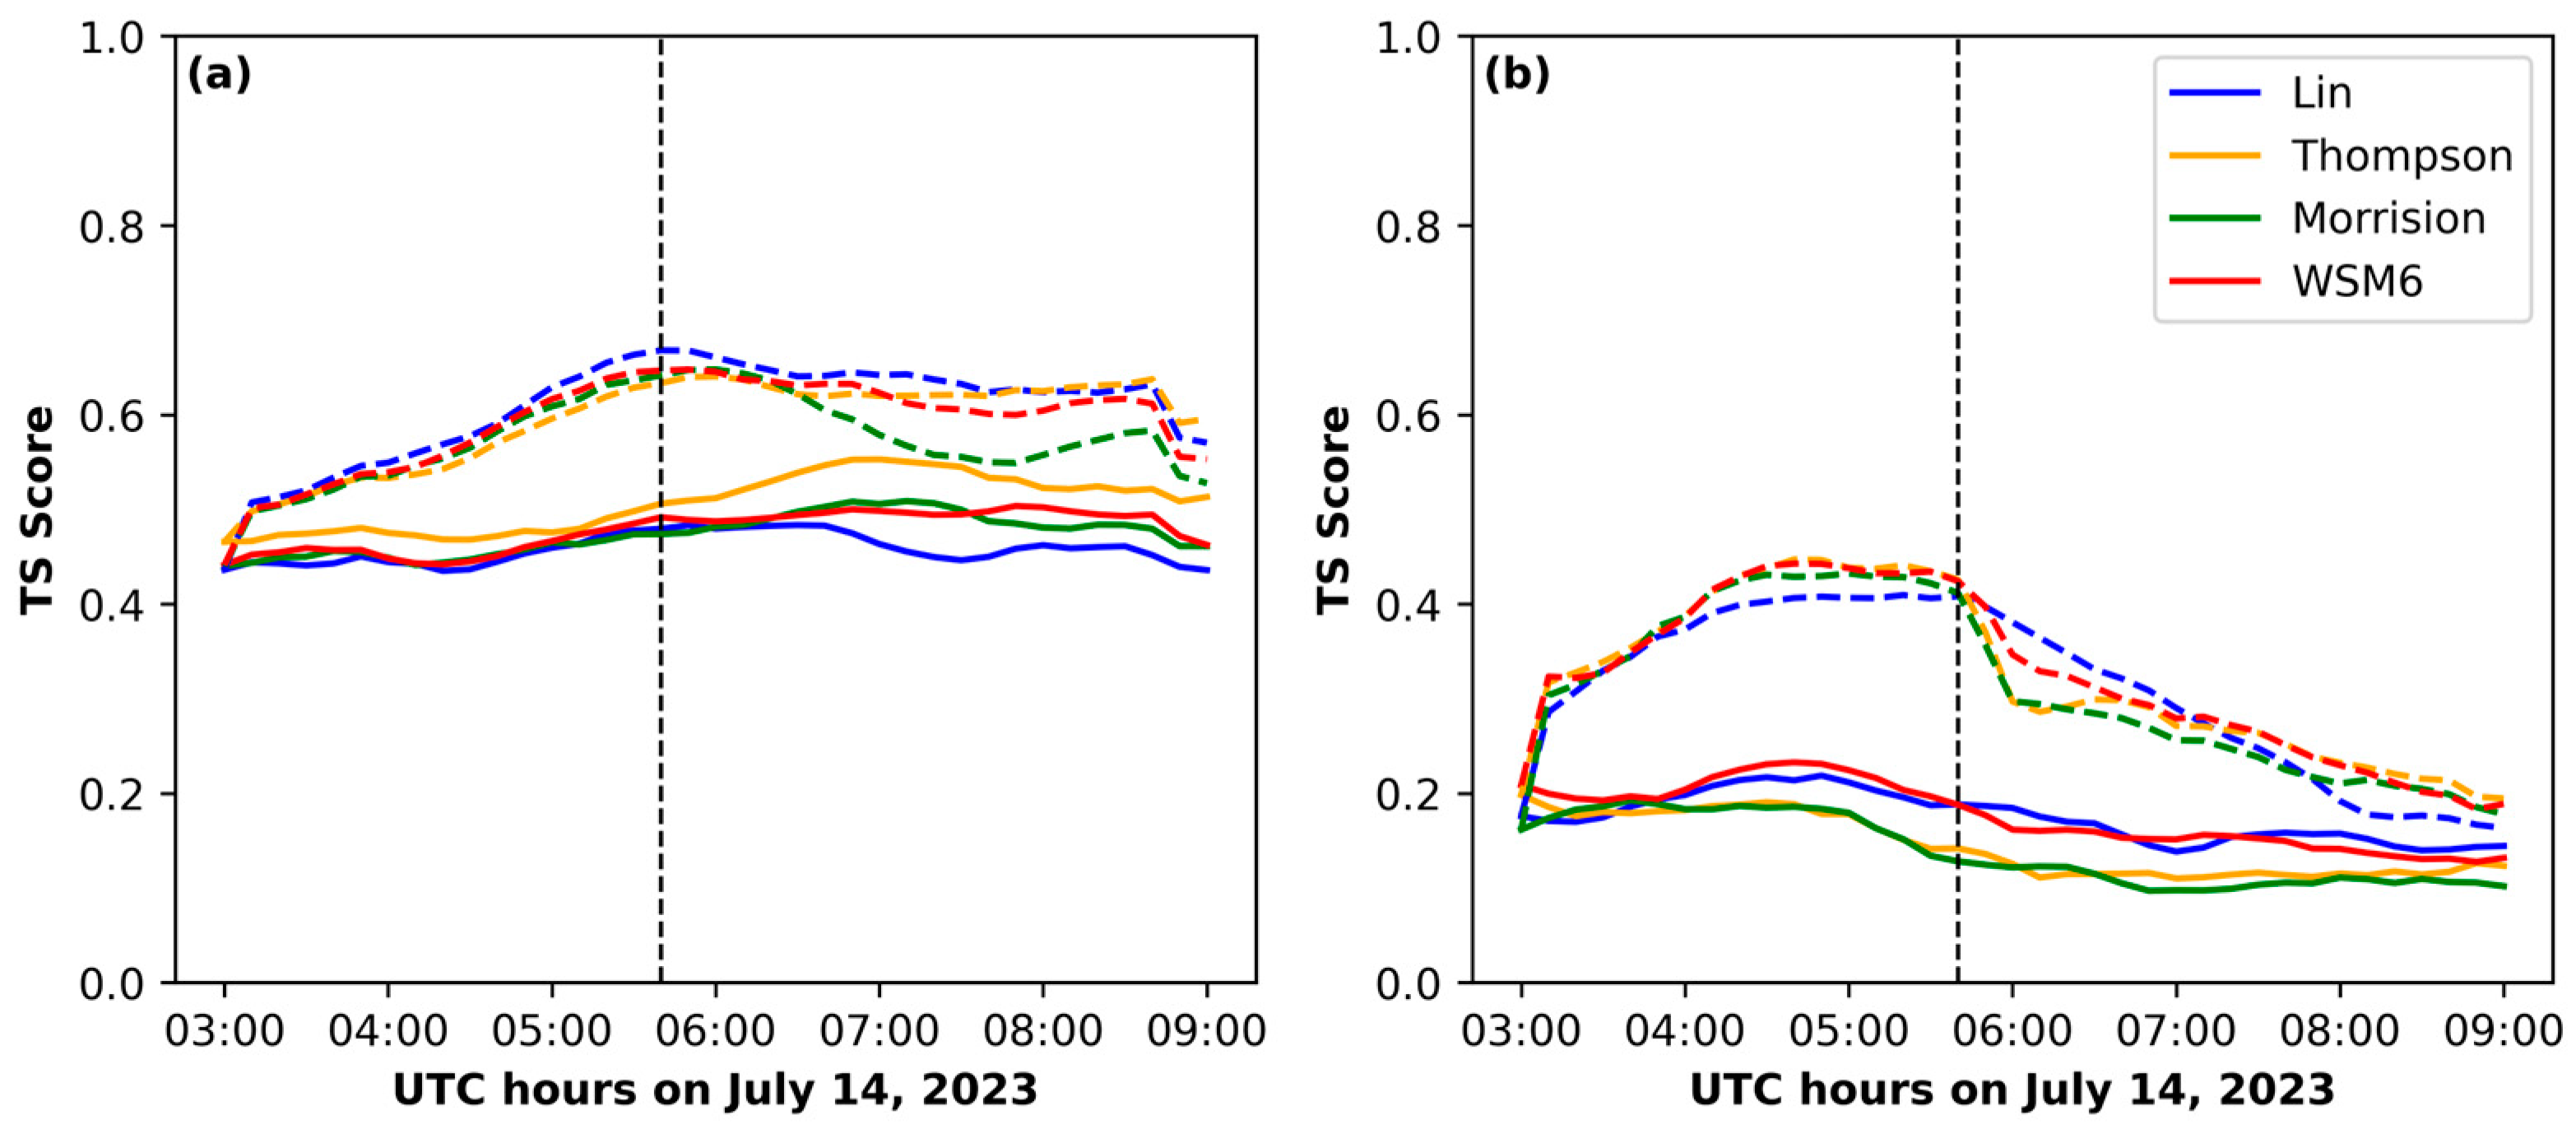
- The four microphysical parameterization schemes (Lin, Thompson, Morrison, and WSM6 schemes) present dramatically different distributions of rain, snow, and graupel mixing ratios. Since the HLHN radar data assimilation method assimilates the MODIS cloud products by modifying the model hydrometeors, the various microphysical schemes interact with the MODIS data assimilation differently. The results from the MODIS data assimilation experiments with the four microphysical schemes confirm that the microphysical schemes significantly affect the assimilation and forecasting performance of the model. Among the four microphysical schemes evaluated, the Lin microphysical scheme appears to be most compatible with the MODIS retrieved radar data assimilation.
Author Contributions
Funding
Data Availability Statement
Conflicts of Interest
References
- Xiong, X.; Sun, J.; Barnes, W.; Salomonson, V.; Esposito, J.; Erives, H.; Guenther, B. Multiyear On-Orbit Calibration and Performance of Terra MODIS Reflective Solar Bands. IEEE Trans. Geosci. Remote Sens. 2007, 45, 879–889. [Google Scholar] [CrossRef]
- Li, Y.; Pang, B.; Ren, M.; Shi, S.; Peng, D.; Zhu, Z.; Zuo, D. Evaluation of Performance of Three Satellite-Derived Precipitation Products in Capturing Extreme Precipitation Events over Beijing, China. Remote Sens. 2022, 14, 2698. [Google Scholar] [CrossRef]
- Liu, C.; Chiu, C.; Lin, P.; Min, M. Comparison of Cloud-Top Property Retrievals From Advanced Himawari Imager, MODIS, CloudSat/CPR, CALIPSO/CALIOP, and Radiosonde. JGR Atmos. 2020, 125, e2020JD032683. [Google Scholar] [CrossRef]
- Liao, L.; Meneghini, R. GPM DPR Retrievals: Algorithm, Evaluation, and Validation. Remote Sens. 2022, 14, 843. [Google Scholar] [CrossRef]
- Zhang, P.; Gu, S.; Chen, L.; Shang, J.; Lin, M.; Zhu, A.; Yin, H.; Wu, Q.; Shou, Y.; Sun, F.; et al. FY-3G Satellite Instruments and Precipitation Products: First Report of China’s Fengyun Rainfall Mission In-Orbit. J. Remote Sens. 2023, 3, 0097. [Google Scholar] [CrossRef]
- Kotsuki, S.; Terasaki, K.; Satoh, M.; Miyoshi, T. Ensemble-Based Data Assimilation of GPM DPR Reflectivity: Cloud Microphysics Parameter Estimation With the Nonhydrostatic Icosahedral Atmospheric Model (NICAM). J. Geophys. Res. Atmos. 2023, 128, e2022JD037447. [Google Scholar] [CrossRef]
- Kou, L.; Wang, Z.; Xu, F. Three-Dimensional Fusion of Spaceborne and Ground Radar Reflectivity Data Using a Neural Network–Based Approach. Adv. Atmospheric Sci. 2018, 35, 346–359. [Google Scholar] [CrossRef]
- Yang, Y.; Han, W.; Sun, H.; Xie, H.; Gao, Z. Reconstruction of 3D DPR Observations Using GMI Radiances. Geophys. Res. Lett. 2024, 51, e2023GL106846. [Google Scholar] [CrossRef]
- Brüning, S.; Niebler, S.; Tost, H. Artificial Intelligence (AI)-Derived 3D Cloud Tomography from Geostationary 2D Satellite Data. Atmos. Meas. Tech. 2024, 17, 961–978. [Google Scholar] [CrossRef]
- Leinonen, J.; Guillaume, A.; Yuan, T. Reconstruction of Cloud Vertical Structure With a Generative Adversarial Network. Geophys. Res. Lett. 2019, 46, 7035–7044. [Google Scholar] [CrossRef]
- Wang, F.; Liu, Y.; Zhou, Y.; Sun, R.; Duan, J.; Li, Y.; Ding, Q.; Wang, H. Retrieving Vertical Cloud Radar Reflectivity from MODIS Cloud Products with CGAN: An Evaluation for Different Cloud Types and Latitudes. Remote Sens. 2023, 15, 816. [Google Scholar] [CrossRef]
- Qin, Y.; Wang, F.; Liu, Y.; Fan, H.; Zhou, Y.; Duan, J. Research on Three-Dimensional Cloud Structure Retrieval and Fusion Technology for the MODIS Instrument. Remote Sens. 2024, 16, 1561. [Google Scholar] [CrossRef]
- Simmons, A.J.; Hollingsworth, A. Some Aspects of the Improvement in Skill of Numerical Weather Prediction. Quart. J. R. Meteoro Soc. 2002, 128, 647–677. [Google Scholar] [CrossRef]
- Chambon, P.; Mahfouf, J.-F.; Audouin, O.; Birman, C.; Fourrié, N.; Loo, C.; Martet, M.; Moll, P.; Payan, C.; Pourret, V.; et al. Global Observing System Experiments within the Météo-France 4D-Var Data Assimilation System. Mon. Weather Rev. 2023, 151, 127–143. [Google Scholar] [CrossRef]
- Hu, M.; Benjamin, S.G.; Ladwig, T.T.; Dowell, D.C.; Weygandt, S.S.; Alexander, C.R.; Whitaker, J.S. GSI Three-Dimensional Ensemble–Variational Hybrid Data Assimilation Using a Global Ensemble for the Regional Rapid Refresh Model. Mon. Weather Rev. 2017, 145, 4205–4225. [Google Scholar] [CrossRef]
- Wang, J.; Zhang, M. A Constrained Data Assimilation Algorithm Based on GSI Hybrid 3D-EnVar and Its Application. Mon. Weather Rev. 2021, 149, 3365–3378. [Google Scholar] [CrossRef]
- Majumdar, S.J.; Sun, J.; Golding, B.; Joe, P.; Dudhia, J.; Caumont, O.; Chandra Gouda, K.; Steinle, P.; Vincendon, B.; Wang, J.; et al. Multiscale Forecasting of High-Impact Weather: Current Status and Future Challenges. Bull. Am. Meteorol. Soc. 2021, 102, E635–E659. [Google Scholar] [CrossRef]
- Battaglia, A.; Kollias, P.; Dhillon, R.; Roy, R.; Tanelli, S.; Lamer, K.; Grecu, M.; Lebsock, M.; Watters, D.; Mroz, K.; et al. Spaceborne Cloud and Precipitation Radars: Status, Challenges, and Ways Forward. Rev. Geophys. 2020, 58, e2019RG000686. [Google Scholar] [CrossRef] [PubMed]
- Kato, R.; Shimizu, S.; Ohigashi, T.; Maesaka, T.; Shimose, K.; Iwanami, K. Prediction of Meso-γ-Scale Local Heavy Rain by Ground-Based Cloud Radar Assimilation with Water Vapor Nudging. Weather Forecast. 2022, 37, 1553–1566. [Google Scholar] [CrossRef]
- Ikuta, Y.; Satoh, M.; Sawada, M.; Kusabiraki, H.; Kubota, T. Improvement of the Cloud Microphysics Scheme of the Mesoscale Model at the Japan Meteorological Agency Using Spaceborne Radar and Microwave Imager of the Global Precipitation Measurement as Reference. Mon. Weather Rev. 2021, 149, 3803–3819. [Google Scholar] [CrossRef]
- Conte, D.; Miglietta, M.M.; Moscatello, A.; Albers, S.; Levizzani, V. A GIS Approach to Ingest Meteosat Second Generation Data into the Local Analysis and Prediction System. Environ. Model. Softw. 2010, 25, 1064–1074. [Google Scholar] [CrossRef]
- Hu, M.; Xue, M.; Gao, J.; Brewster, K. 3DVAR and Cloud Analysis with WSR-88D Level-II Data for the Prediction of the Fort Worth, Texas, Tornadic Thunderstorms. Part II: Impact of Radial Velocity Analysis via 3DVAR. Mon. Weather Rev. 2006, 134, 699–721. [Google Scholar] [CrossRef]
- Xu, M. Radar Data Assimilation for the Prediction of Front Range Convection; AMS: Brackenridge, CO, USA, 2013. [Google Scholar]
- Huang, Y.; Liu, Y.; Xu, M.; Liu, Y.; Pan, L.; Wang, H.; Cheng, W.Y.Y.; Jiang, Y.; Lan, H.; Yang, H.; et al. Forecasting Severe Convective Storms with WRF-Based RTFDDA Radar Data Assimilation in Guangdong, China. Atmos. Res. 2018, 209, 131–143. [Google Scholar] [CrossRef]
- Huo, Z.; Liu, Y.; Wei, M.; Shi, Y.; Fang, C.; Shu, Z.; Li, Y. Hydrometeor and Latent Heat Nudging for Radar Reflectivity Assimilation: Response to the Model States and Uncertainties. Remote Sens. 2021, 13, 3821. [Google Scholar] [CrossRef]
- Huo, Z.; Liu, Y.; Shi, Y.; Chen, B.; Fan, H.; Li, Y. An Investigation on Joint Data Assimilation of a Radar Network and Ground-Based Profiling Platforms for Forecasting Convective Storms. Mon. Weather Rev. 2023, 151, 2049–2064. [Google Scholar] [CrossRef]
- Liu, Y.; Warner, T.T.; Bowers, J.F.; Carson, L.P.; Chen, F.; Clough, C.A.; Davis, C.A.; Egeland, C.H.; Halvorson, S.F.; Huck, T.W.; et al. The Operational Mesogamma-Scale Analysis and Forecast System of the U.S. Army Test and Evaluation Command. Part I: Overview of the Modeling System, the Forecast Products, and How the Products Are Used. J. Appl. Meteorol. Climatol. 2008, 47, 1077–1092. [Google Scholar] [CrossRef]
- Liu, Y.; Warner, T.T.; Astling, E.G.; Bowers, J.F.; Davis, C.A.; Halvorson, S.F.; Rife, D.L.; Sheu, R.-S.; Swerdlin, S.P.; Xu, M. The Operational Mesogamma-Scale Analysis and Forecast System of the U.S. Army Test and Evaluation Command. Part II: Interrange Comparison of the Accuracy of Model Analyses and Forecasts. J. Appl. Meteorol. Climatol. 2008, 47, 1093–1104. [Google Scholar] [CrossRef]
- Sharman, R.D.; Liu, Y.; Sheu, R.-S.; Warner, T.T.; Rife, D.L.; Bowers, J.F.; Clough, C.A.; Ellison, E.E. The Operational Mesogamma-Scale Analysis and Forecast System of the U.S. Army Test and Evaluation Command. Part III: Forecasting with Secondary-Applications Models. J. Appl. Meteorol. Climatol. 2008, 47, 1105–1122. [Google Scholar] [CrossRef]
- Wang, H.; Yuan, S.; Liu, Y.; Li, Y. Comparison of the WRF-FDDA-Based Radar Reflectivity and Lightning Data Assimilation for Short-Term Precipitation and Lightning Forecasts of Severe Convection. Remote Sens. 2022, 14, 5980. [Google Scholar] [CrossRef]
- Casella, D.; Panegrossi, G.; Sanò, P.; Marra, A.C.; Dietrich, S.; Johnson, B.T.; Kulie, M.S. Evaluation of the GPM-DPR Snowfall Detection Capability: Comparison with CloudSat-CPR. Atmos. Res. 2017, 197, 64–75. [Google Scholar] [CrossRef]
- Borderies, M.; Caumont, O.; Augros, C.; Bresson, É.; Delanoë, J.; Ducrocq, V.; Fourrié, N.; Bastard, T.L.; Nuret, M. Simulation of W-band Radar Reflectivity for Model Validation and Data Assimilation. Quart. J. R. Meteorol. Soc. 2018, 144, 391–403. [Google Scholar] [CrossRef]
- Borderies, M.; Caumont, O.; Delanoë, J.; Ducrocq, V.; Fourrié, N.; Marquet, P. Impact of Airborne Cloud Radar Reflectivity Data Assimilation on Kilometre-Scale Numerical Weather Prediction Analyses and Forecasts of Heavy Precipitation Events. Nat. Hazards Earth Syst. Sci. 2019, 19, 907–926. [Google Scholar] [CrossRef]
- Barker, H.W.; Gabriel, P.M.; Qu, Z.; Kato, S. Representativity of Cloud-profiling Radar Observations for Data Assimilation in Numerical Weather Prediction. Quart. J. R. Meteorol. Soc. 2021, 147, 1801–1822. [Google Scholar] [CrossRef]
- Yin, J.; Tian, L.; Zhou, K.; Zhang, W.; Ran, L. The Retrieval Relationship between Lightning and Maximum Proxy Reflectivity Based on Random Forest. Remote Sens. 2024, 16, 719. [Google Scholar] [CrossRef]
- Platnick, S.; Meyer, K.G.; King, M.D.; Wind, G.; Amarasinghe, N.; Marchant, B.; Arnold, G.T.; Zhang, Z.; Hubanks, P.A.; Holz, R.E.; et al. The MODIS Cloud Optical and Microphysical Products: Collection 6 Updates and Examples From Terra and Aqua. IEEE Trans. Geosci. Remote Sens. 2017, 55, 502–525. [Google Scholar] [CrossRef] [PubMed]
- Wang, Y.; Miao, C.; Zhao, X.; Zhang, Q.; Su, J. Evaluation of the GPM IMERG Product at the Hourly Timescale over China. Atmos. Res. 2023, 285, 106656. [Google Scholar] [CrossRef]
- Kawamoto, K.; Nakajima, T.; Nakajima, T.Y. A Global Determination of Cloud Microphysics with AVHRR Remote Sensing. J. Clim. 2001, 14, 2054–2068. [Google Scholar] [CrossRef]
- Moya-Álvarez, A.S.; Martínez-Castro, D.; Flores, J.L.; Silva, Y. Sensitivity Study on the Influence of Parameterization Schemes in WRF_ARW Model on Short- and Medium-Range Precipitation Forecasts in the Central Andes of Peru. Adv. Meteorol. 2018, 2018, 1381092. [Google Scholar] [CrossRef]
- Rashid, G.M.; Akhter, A.E.; Mallik, M.A.K.; Hossain, M.M.T. Sensitivity of the WRF Model to Parameterization Schemes to Predict Pre- Monsoon Temperature over Bangladesh. Bangladesh Meteorol. Dep. DEW-DROP 2023, 9, 10–22. [Google Scholar]
- Di, Z.; Gong, W.; Gan, Y.; Shen, C.; Duan, Q. Combinatorial Optimization for WRF Physical Parameterization Schemes: A Case Study of Three-Day Typhoon Simulations over the Northwest Pacific Ocean. Atmosphere 2019, 10, 233. [Google Scholar] [CrossRef]
- Luo, Y.; Zhang, M.; Cao, Q.; Wang, L. An Evaluation of the WRF Physical Parameterizations for Extreme Rainfall Simulation in the Yangtze River Middle Reaches Urban Agglomeration. Urban Clim. 2024, 58, 102149. [Google Scholar] [CrossRef]
- Chen, X.; Liu, X. Comparison of the Morrison and WDM6 Microphysics Schemes in the WRF Model for a Convective Precipitation Event in Guangdong, China, Through the Analysis of Polarimetric Radar Data. Remote Sens. 2024, 16, 3749. [Google Scholar] [CrossRef]
- Zhang, Y.; Meng, W.; Huang, Y. Influence of Cloud Microphysical Schemes on CMA-GD Model Prediction of a Warm-Sector Heavy Rainfall in South China. Dyn. Atmos. Ocean. 2024, 106, 101463. [Google Scholar] [CrossRef]
- Liang, Y.; Kou, L.; Huang, A.; Gao, H.; Lin, Z.; Xie, Y.; Zhang, L. Comparison and Synthesis of Precipitation Data from CloudSat CPR and GPM KaPR. Remote Sens. 2024, 16, 745. [Google Scholar] [CrossRef]
- Stauffer, D.R.; Seaman, N.L. Use of Four-Dimensional Data Assimilation in a Limited-Area Mesoscale Model. Part I: Experiments with Synoptic-Scale Data. Mon. Weather Rev. 1990, 118, 1250–1277. [Google Scholar] [CrossRef]
- Liu, Y.; Zhuo, L.; Han, D. Developing Spin-up Time Framework for WRF Extreme Precipitation Simulations. J. Hydrol. 2023, 620, 129443. [Google Scholar] [CrossRef]
- Guo, C.; Chen, D.; Chen, M.; Zhang, S.; Guo, J.; Ma, Z. Aerosol Impacts on Summer Precipitation Forecast over the North China Plain by Using Thompson Aerosol-Aware Scheme in WRF: Statistical Analysis and Significant Threat Score Improvements in Polluted Condition during June to August 2018. Atmos. Res. 2024, 299, 107177. [Google Scholar] [CrossRef]
- Roberts, N.M.; Lean, H.W. Scale-Selective Verification of Rainfall Accumulations from High-Resolution Forecasts of Convective Events. Mon. Weather Rev. 2008, 136, 78–97. [Google Scholar] [CrossRef]


Disclaimer/Publisher’s Note: The statements, opinions and data contained in all publications are solely those of the individual author(s) and contributor(s) and not of MDPI and/or the editor(s). MDPI and/or the editor(s) disclaim responsibility for any injury to people or property resulting from any ideas, methods, instructions or products referred to in the content. |
© 2025 by the authors. Licensee MDPI, Basel, Switzerland. This article is an open access article distributed under the terms and conditions of the Creative Commons Attribution (CC BY) license (https://creativecommons.org/licenses/by/4.0/).
Share and Cite
Zhang, H.; Liu, Y.; Qin, Y.; Xiang, Z.; Shi, Y.; Huo, Z. Assimilation of Moderate-Resolution Imaging Spectroradiometer Level Two Cloud Products for Typhoon Analysis and Prediction. Remote Sens. 2025, 17, 1635. https://doi.org/10.3390/rs17091635
Zhang H, Liu Y, Qin Y, Xiang Z, Shi Y, Huo Z. Assimilation of Moderate-Resolution Imaging Spectroradiometer Level Two Cloud Products for Typhoon Analysis and Prediction. Remote Sensing. 2025; 17(9):1635. https://doi.org/10.3390/rs17091635
Chicago/Turabian StyleZhang, Haomeng, Yubao Liu, Yu Qin, Zheng Xiang, Yueqin Shi, and Zhaoyang Huo. 2025. "Assimilation of Moderate-Resolution Imaging Spectroradiometer Level Two Cloud Products for Typhoon Analysis and Prediction" Remote Sensing 17, no. 9: 1635. https://doi.org/10.3390/rs17091635
APA StyleZhang, H., Liu, Y., Qin, Y., Xiang, Z., Shi, Y., & Huo, Z. (2025). Assimilation of Moderate-Resolution Imaging Spectroradiometer Level Two Cloud Products for Typhoon Analysis and Prediction. Remote Sensing, 17(9), 1635. https://doi.org/10.3390/rs17091635