
Study on Class Imbalance in Land Use Classification for Soil Erosion in Dry–Hot Valley Regions

 ,
,  ,
, 
Abstract
1. Introduction
2. Materials and Methods
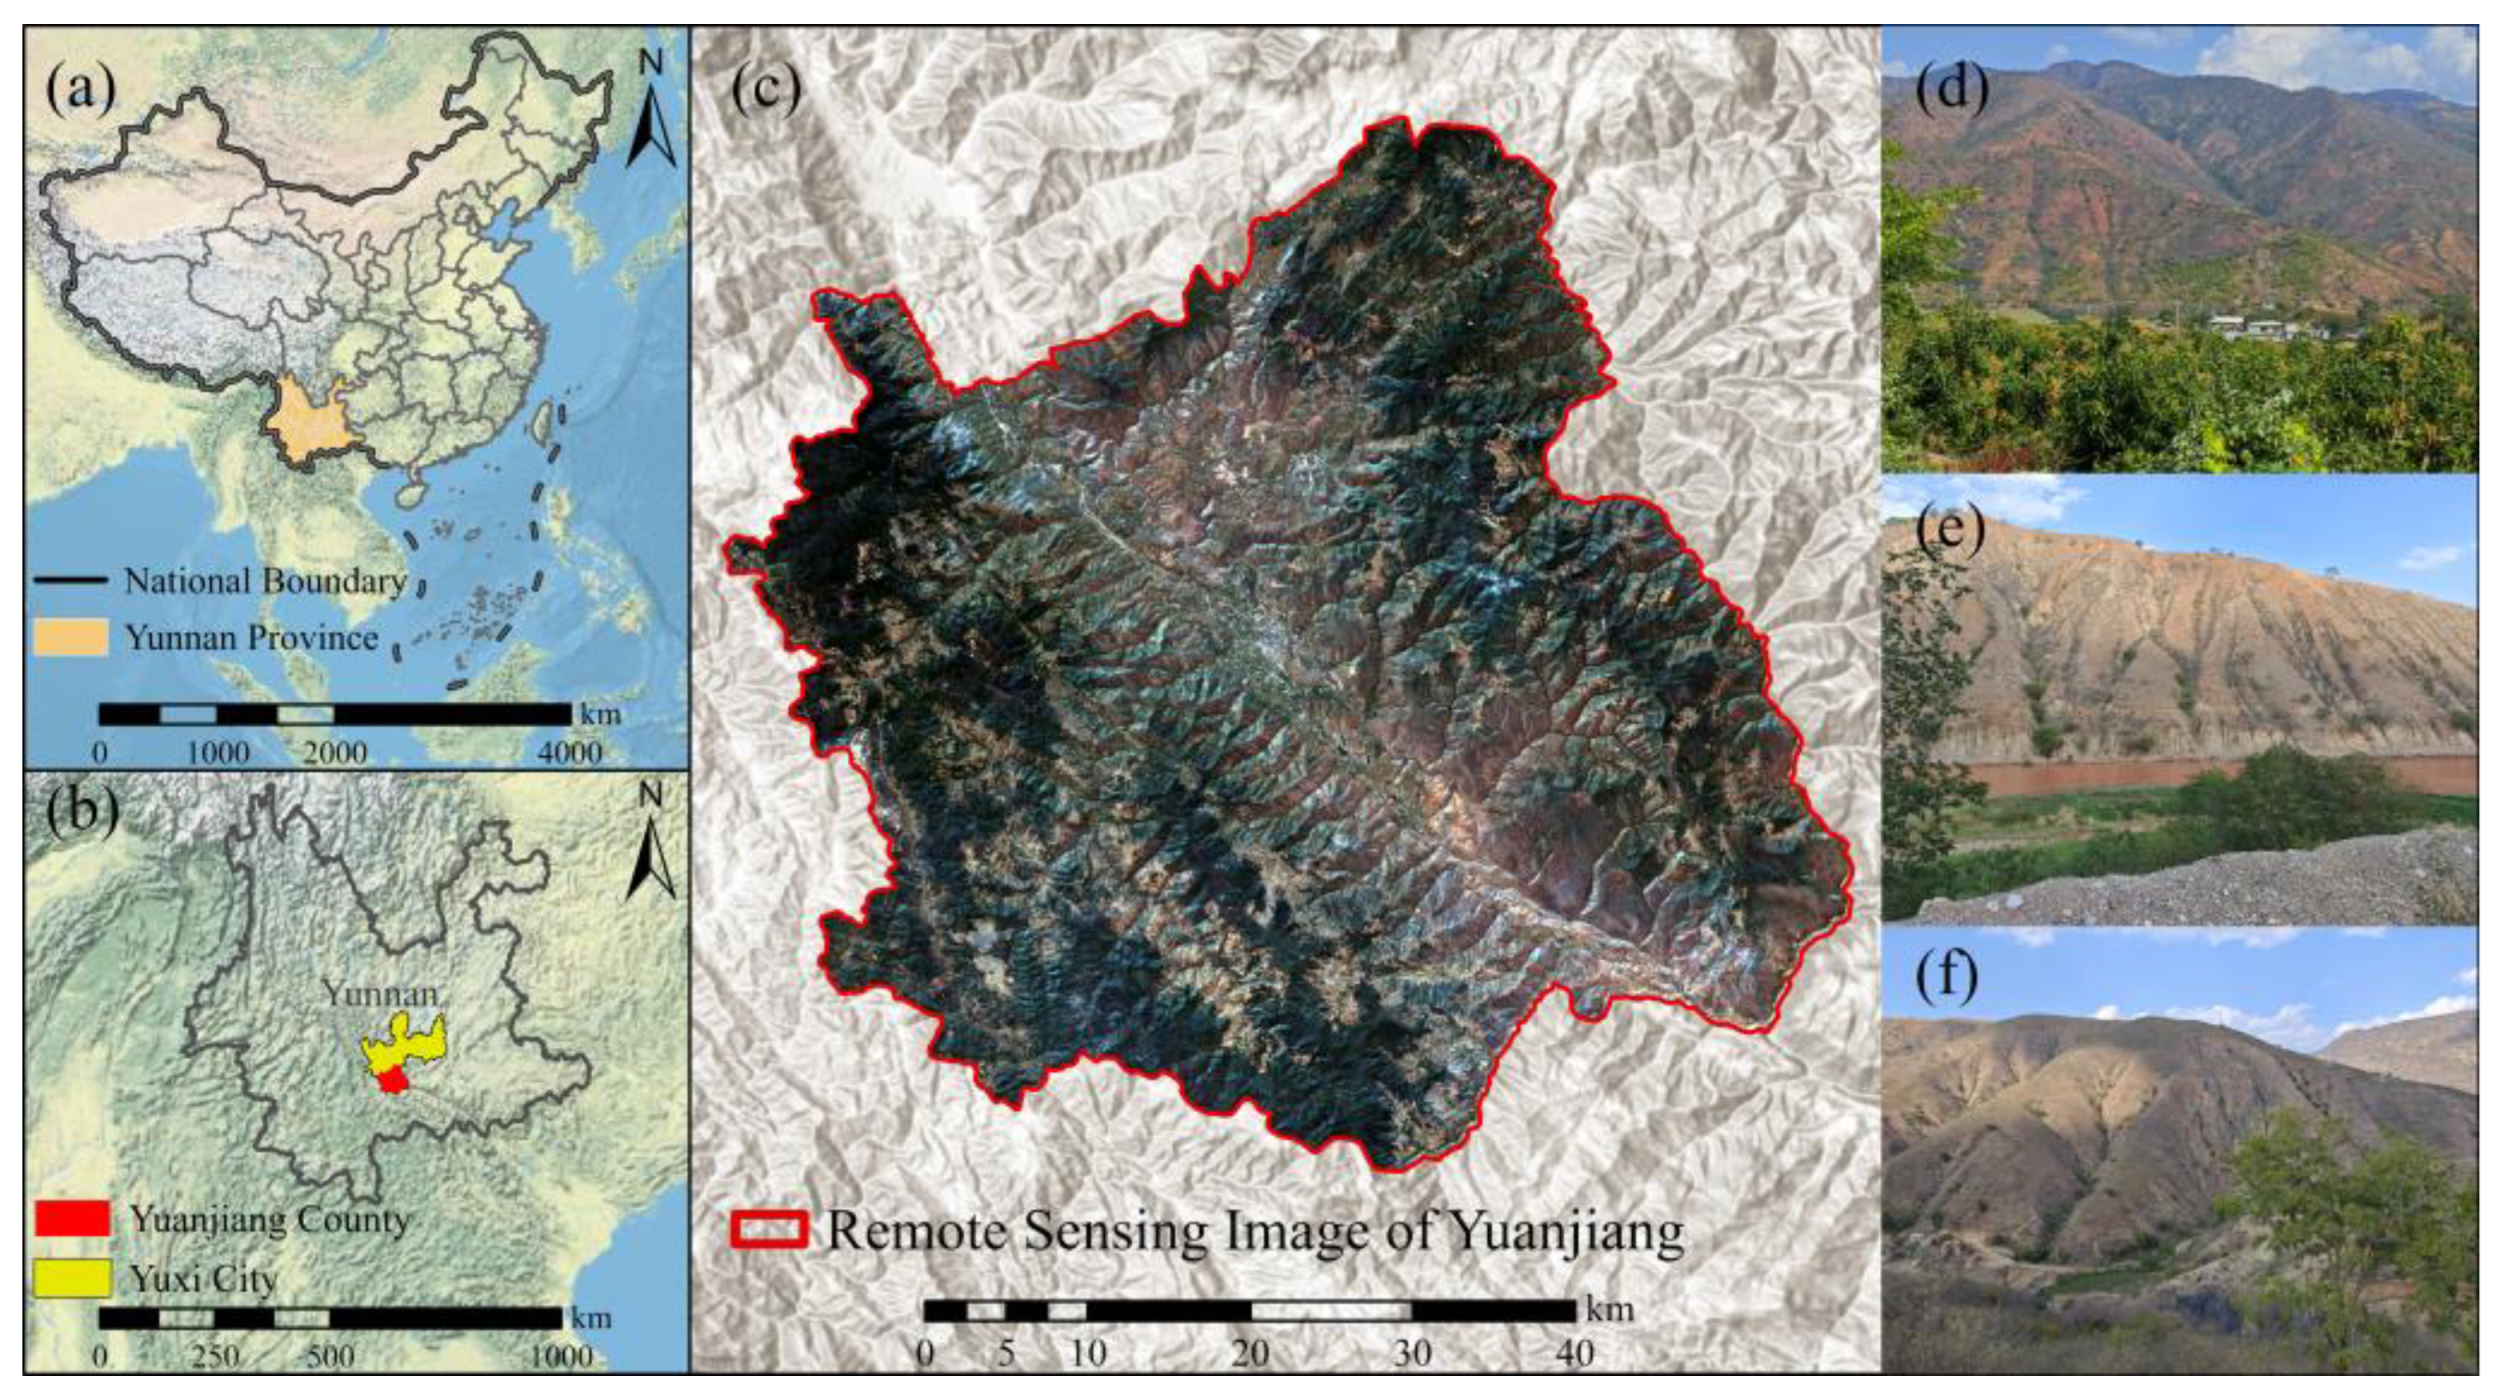
2.1. Study Area
2.2. Data Sources
2.2.1. Reference Land Use Datasets
2.2.2. Remote Sensing Imagery
2.2.3. DEM Data
2.3. Methods
2.3.1. High-Accuracy Sample Datasets Construction
- (1)
- Classification Scheme Alignment and Initial Screening
- (2)
- Non-homologous data voting
- (3)
- Sample Refinement and Precision Correction
2.3.2. Imbalanced Sample Datasets Design
- (1)
- Balanced dataset
- (2)
- Unbalanced datasets
2.3.3. Classification Algorithms and Feature Selection on GEE
2.3.4. Accuracy Evaluation
3. Results
3.1. Feature Optimization and Time-Series Curve Analysis
3.2. Accuracy Comparison of Different Classification Strategies
3.3. Impact of Class Imbalance on Classification Accuracy
3.3.1. Woodland vs. Cultivated Land Imbalance Experiment
- (1)
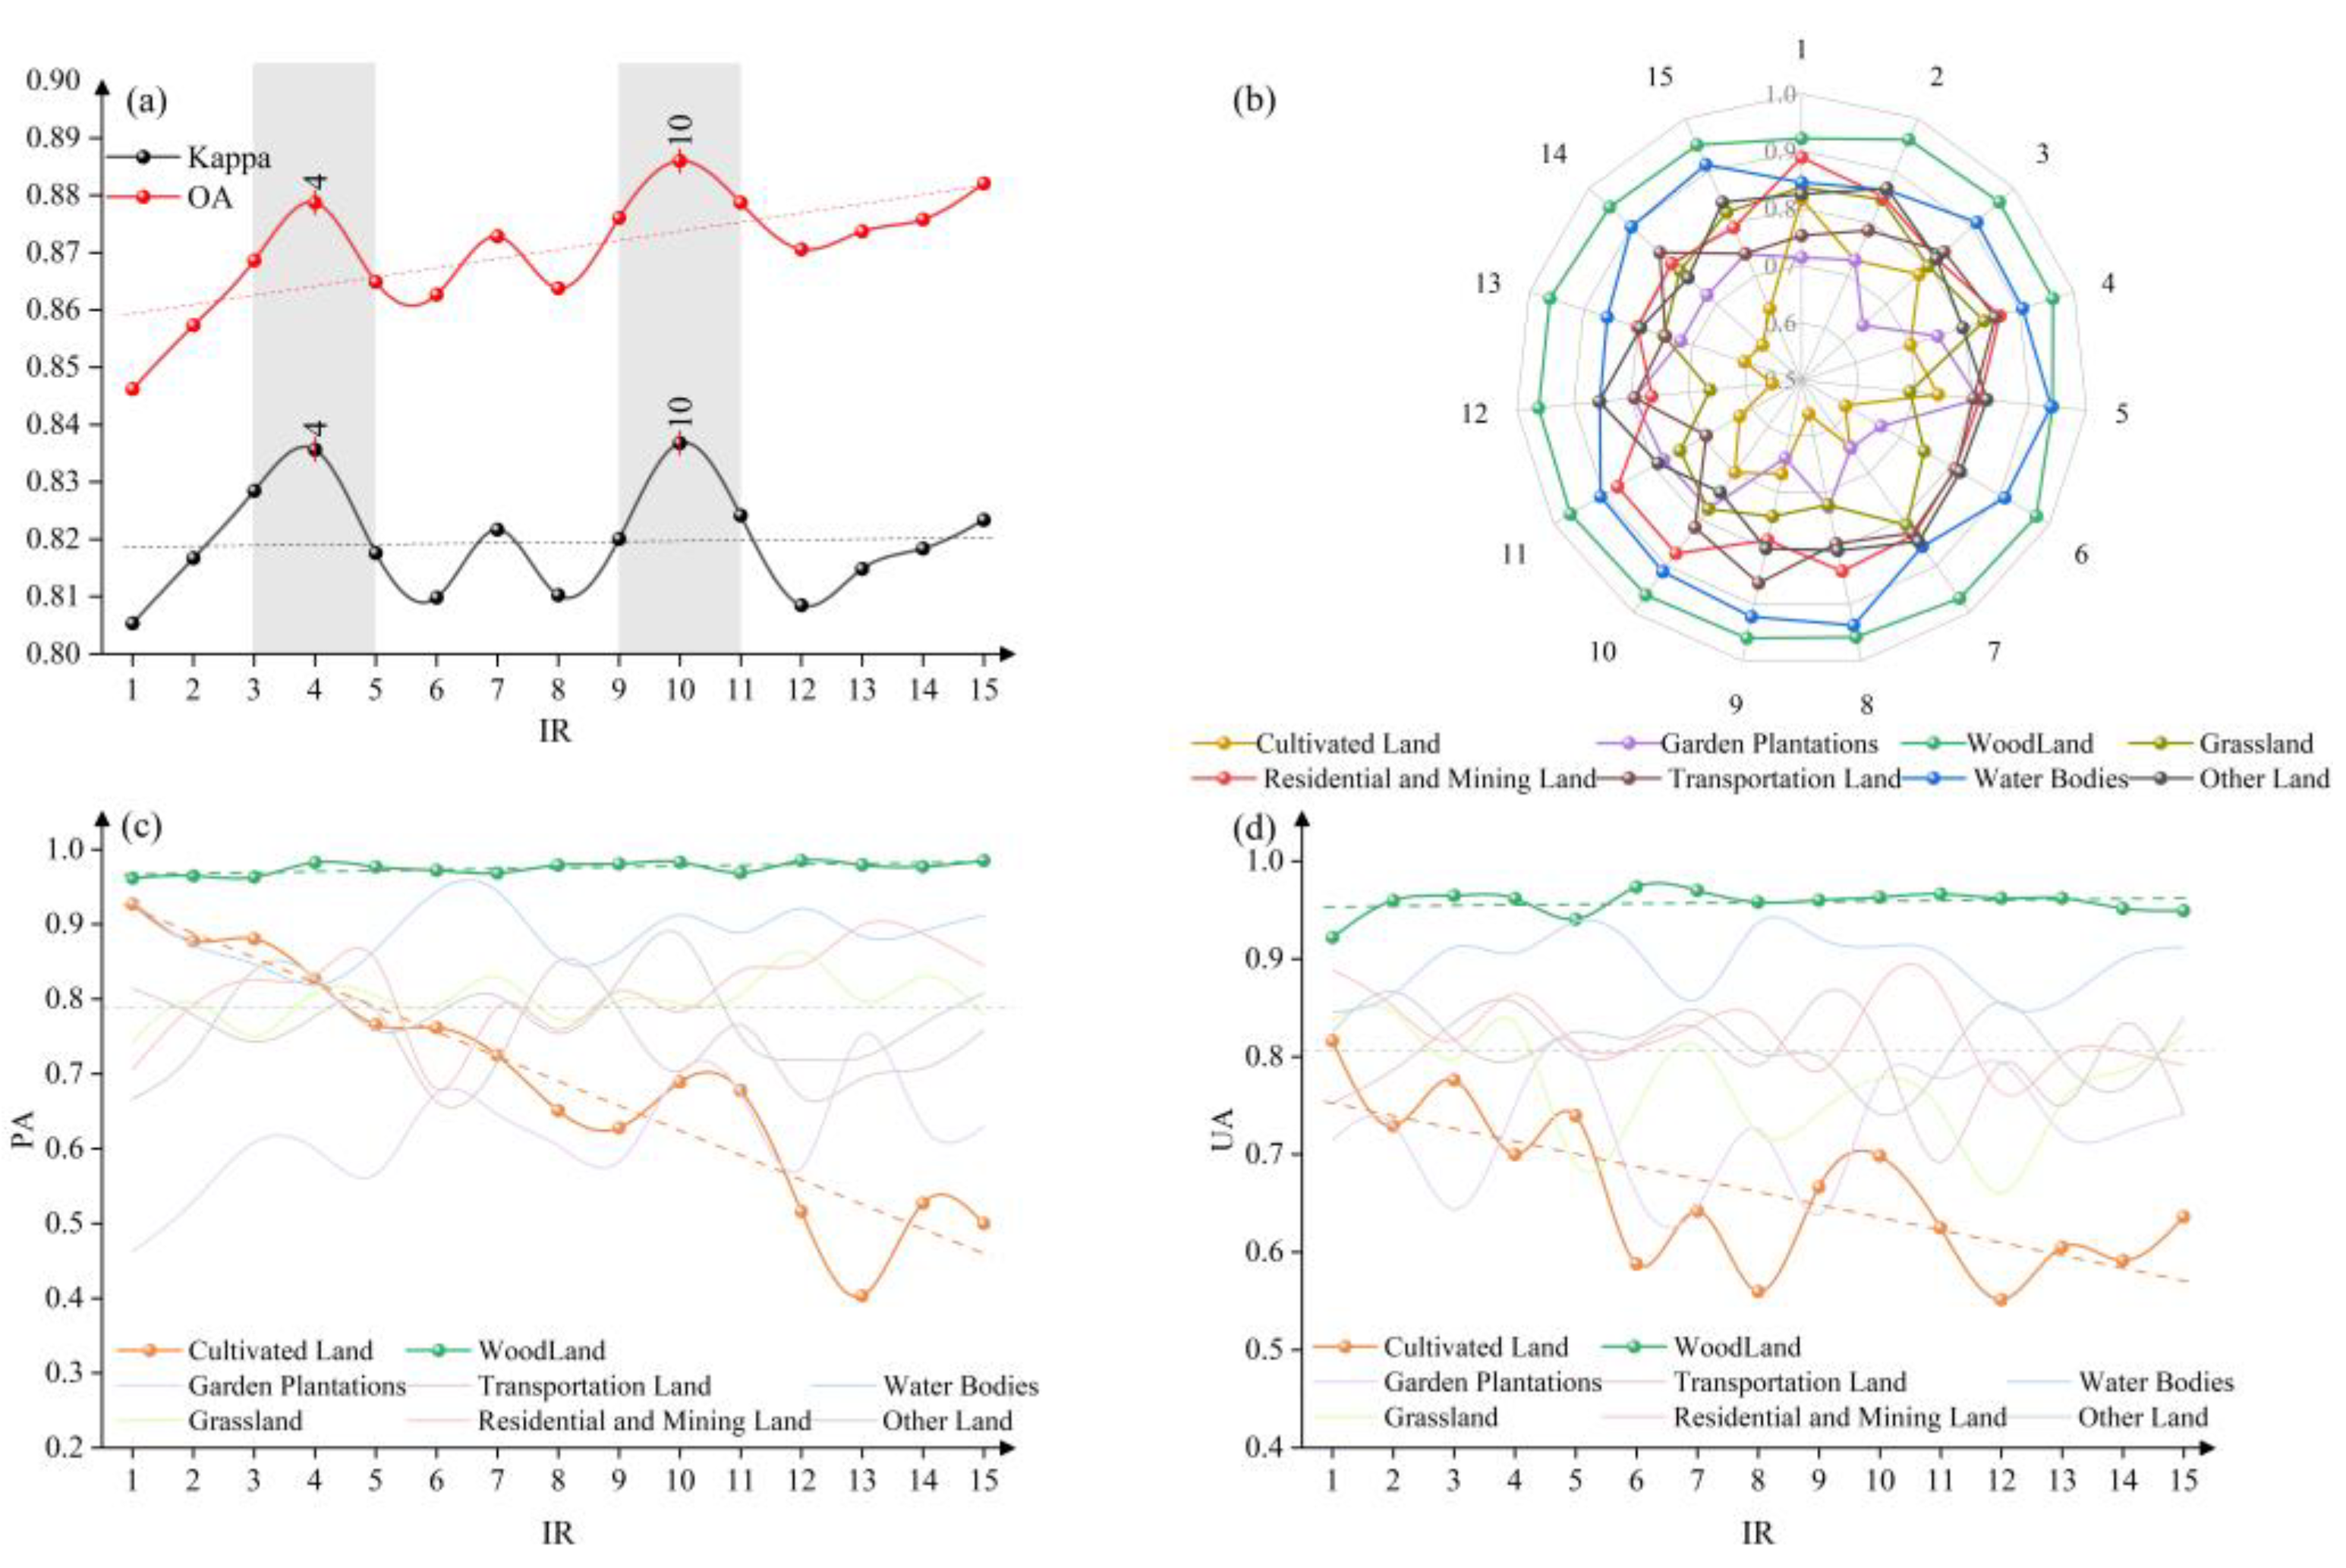
- The OA of the classification increases monotonically. This suggests that reducing the proportion of the hard-to-classify minority class (cultivated land) in the training data can inflate the overall accuracy, likely because the classifier focuses on the easier majority class.
- (2)
- The Kappa coefficient fluctuated with increasing IR but did not exhibit a clear upward trend and did not increase as consistently as OA (Kappa accounts for agreement by chance and is more sensitive to imbalanced distributions). The highest OA and Kappa were achieved at an intermediate imbalance level of IR = 10, reaching 88.6% and 83.7%, respectively.
- (3)
- The PA and UA for cultivated land both decreased markedly as IR increased (i.e., as cultivated land had fewer training samples). Notably, at IR = 15 (the most imbalanced scenario), cultivated land’s PA dropped by 46%, and its UA dropped by 22% compared to the balanced case. This sharp decline indicates that cultivated land is highly susceptible to omission errors under class imbalance; many cultivated land samples were missed by the classifier when its training presence was small. Except for woodland and cultivated land, the classification accuracy of other land types fluctuated with the change in IR value but did not show obvious regularity (Figure 8).
3.3.2. Woodland vs. Garden Plantations Imbalance Experiment
- (1)
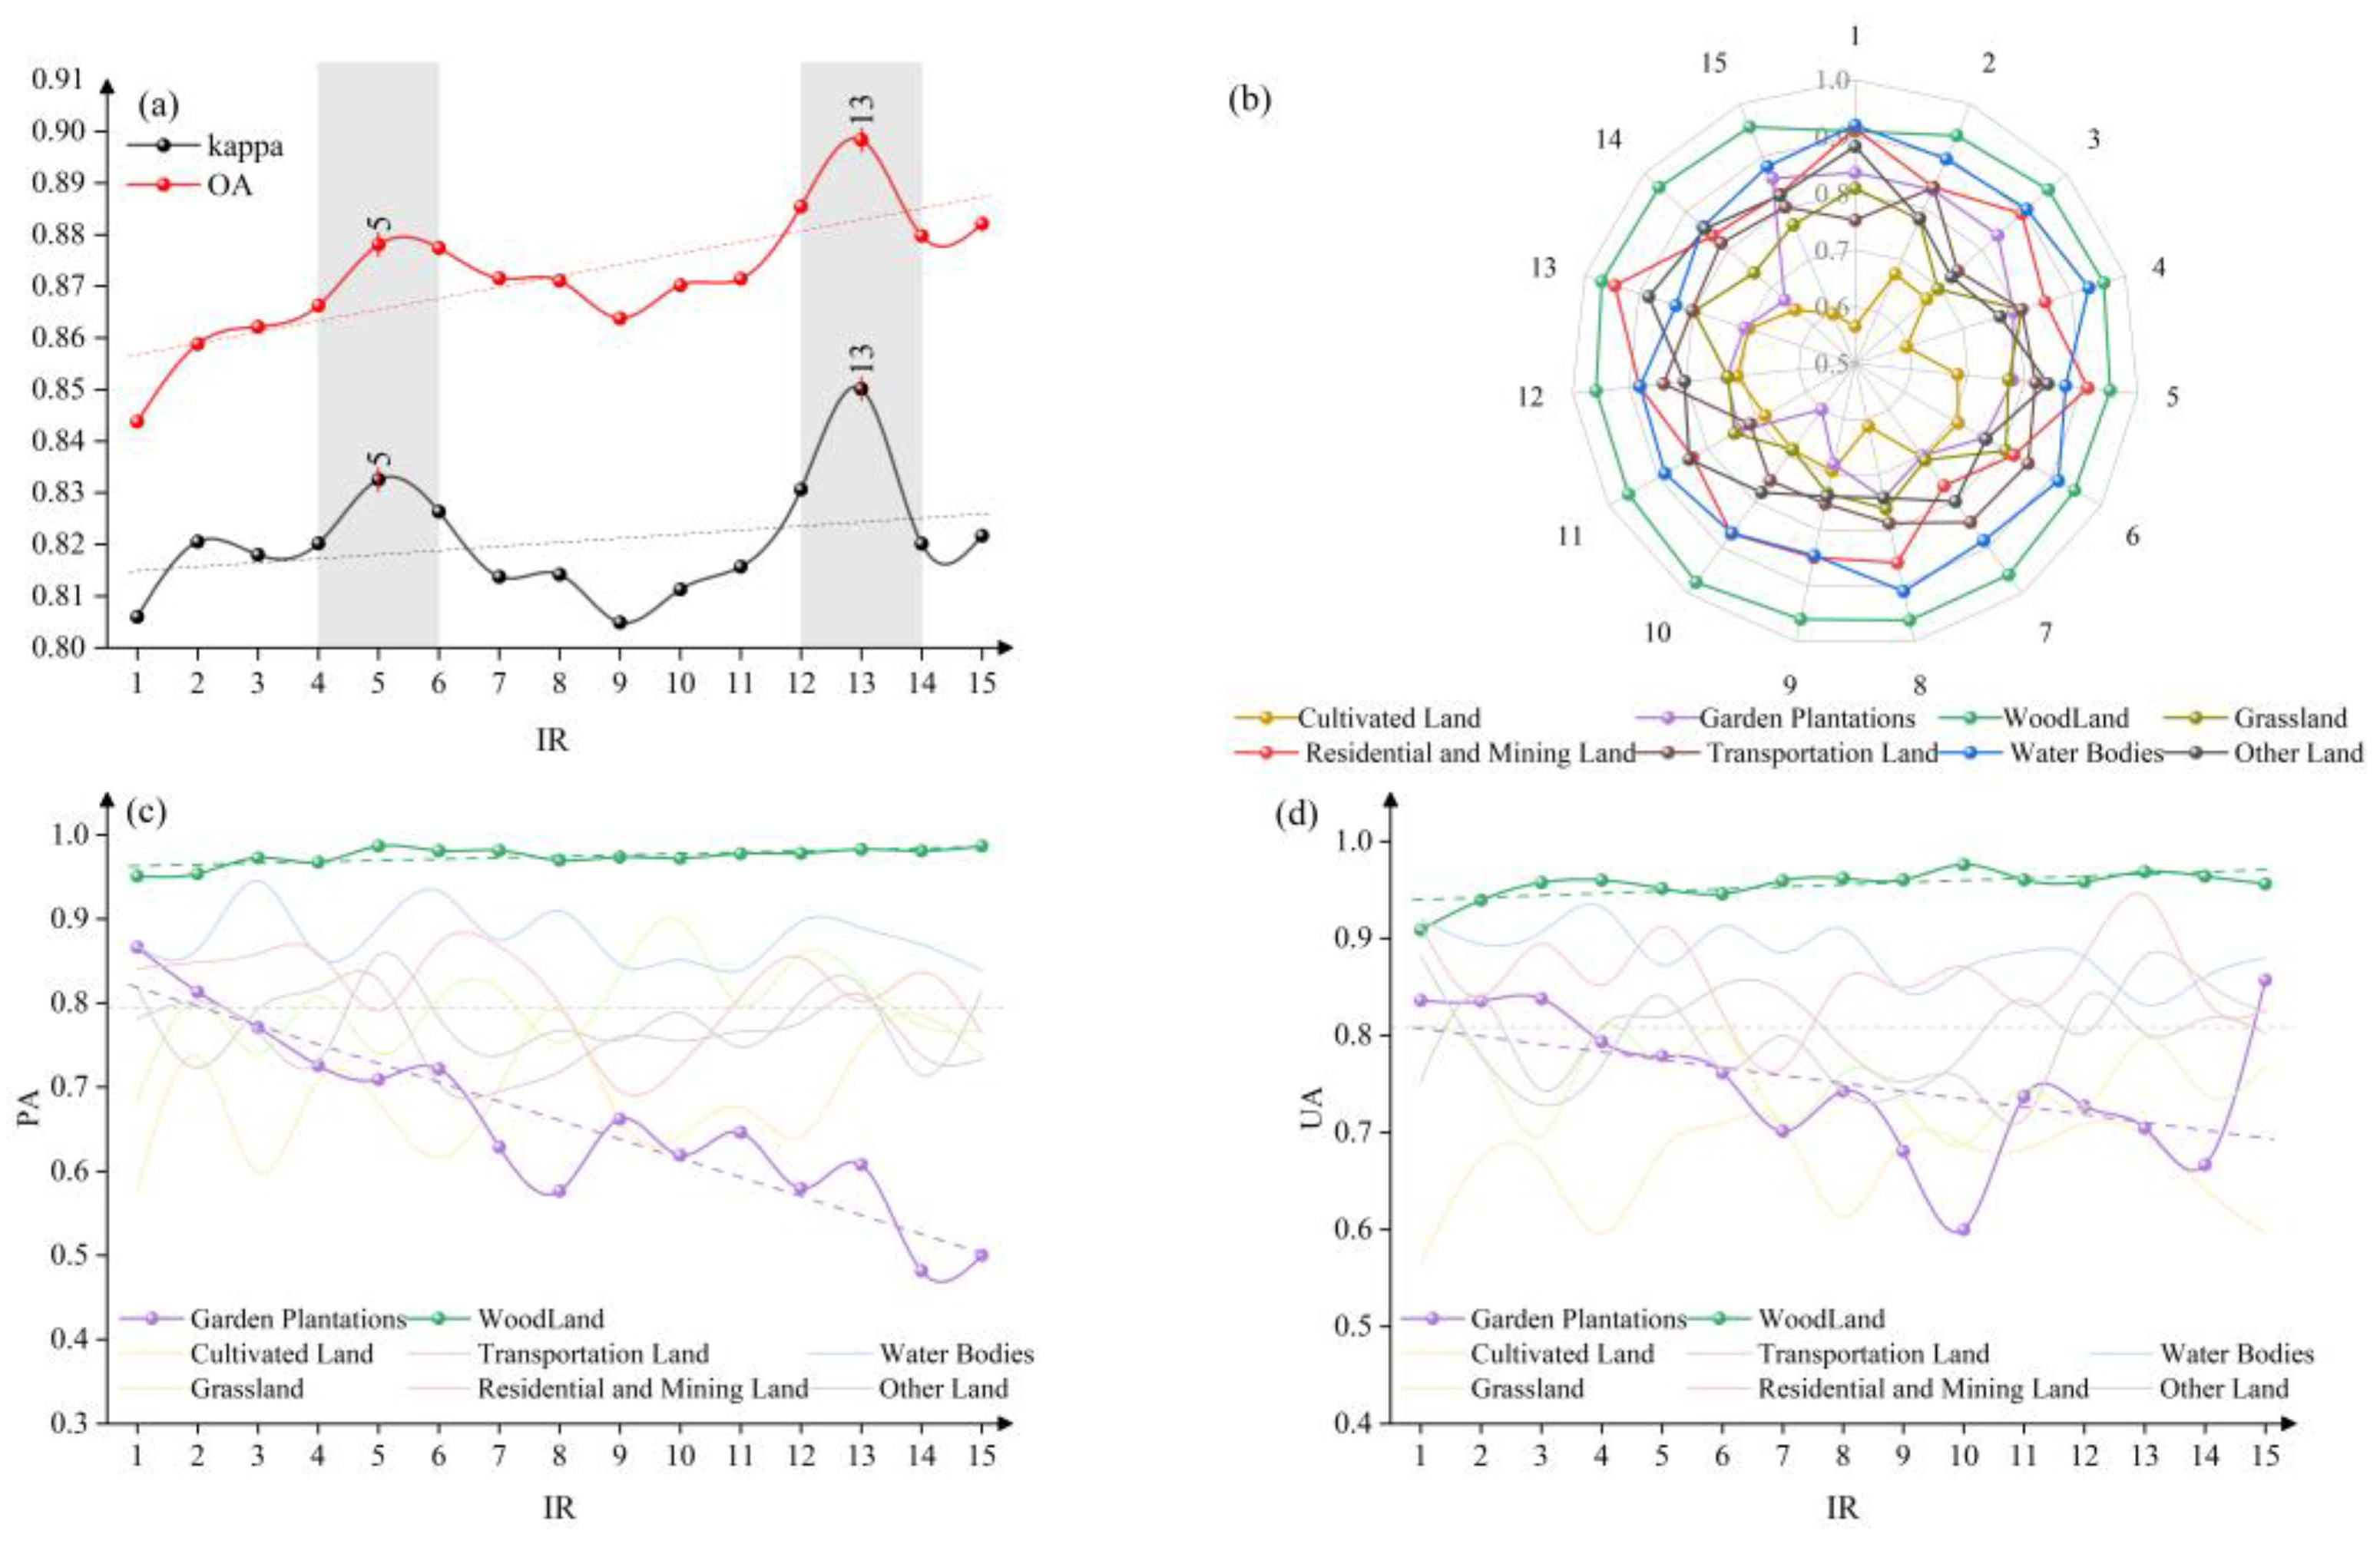
- Both OA and Kappa increased as IR increased, with OA rising more steeply than Kappa. This again reflects that overall accuracy benefits from emphasizing the majority class (woodland), though the improvement in Kappa (which considers the full error matrix) is more tempered. At IR = 13, the OA and Kappa reached their maximum values of 89.8% and 85.1%, respectively.
- (2)
- The PA for garden plantations showed a clear downward trend as IR increased, indicating a growing omission error for under greater imbalance. The UA for garden plantations did not show a consistent trend; it fluctuated and was relatively unstable across IR levels. At IR = 15, garden plantations’ PA had decreased by 42%, whereas its UA paradoxically increased by about 2.5%. This suggests that at a very high imbalance, the classifier seldom predicts the minority class at all; those few predictions might be mostly correct (hence a slight UA rise), but many actual garden plantation areas are being misclassified as something else (hence a large PA drop). In effect, garden plantation samples were largely omitted from the classification when they became too scarce in training, demonstrating a severe impact of class imbalance.
- (3)
- By contrast, PA and UA of woodland were relatively stable, showing little effect from the changing IR. Aside from garden plantations and woodland, the other classes again showed some fluctuations in accuracy with changing IR but no strong systematic trends (Figure 9).
3.3.3. Woodland vs. Grassland Imbalance Experiment
- (1)
- Both overall accuracy and Kappa increased as IR increased, similar to the previous experiments. The OA rose more noticeably than Kappa. At IR = 13, we obtained the highest values (OA ≈ 90.0%, Kappa ≈ 85.0%).
- (2)
- Grassland’s PA and UA both declined as IR increased, indicating that grassland became harder for the classifier to correctly identify with fewer training samples. At IR = 15, the grassland’s PA had fallen by about 25% and its UA by about 18% compared to the balanced scenario. This decline, although significant, was less drastic than what we saw for cultivated land and garden plantations, suggesting grassland is less sensitive to imbalance.
- (3)
- Woodland again achieved the highest class-specific accuracy; the PA and UA remained largely unaffected by the imbalance level, reinforcing that the majority class did not suffer from the imbalance increase (Figure 10).
4. Discussion
5. Conclusions
- (1)
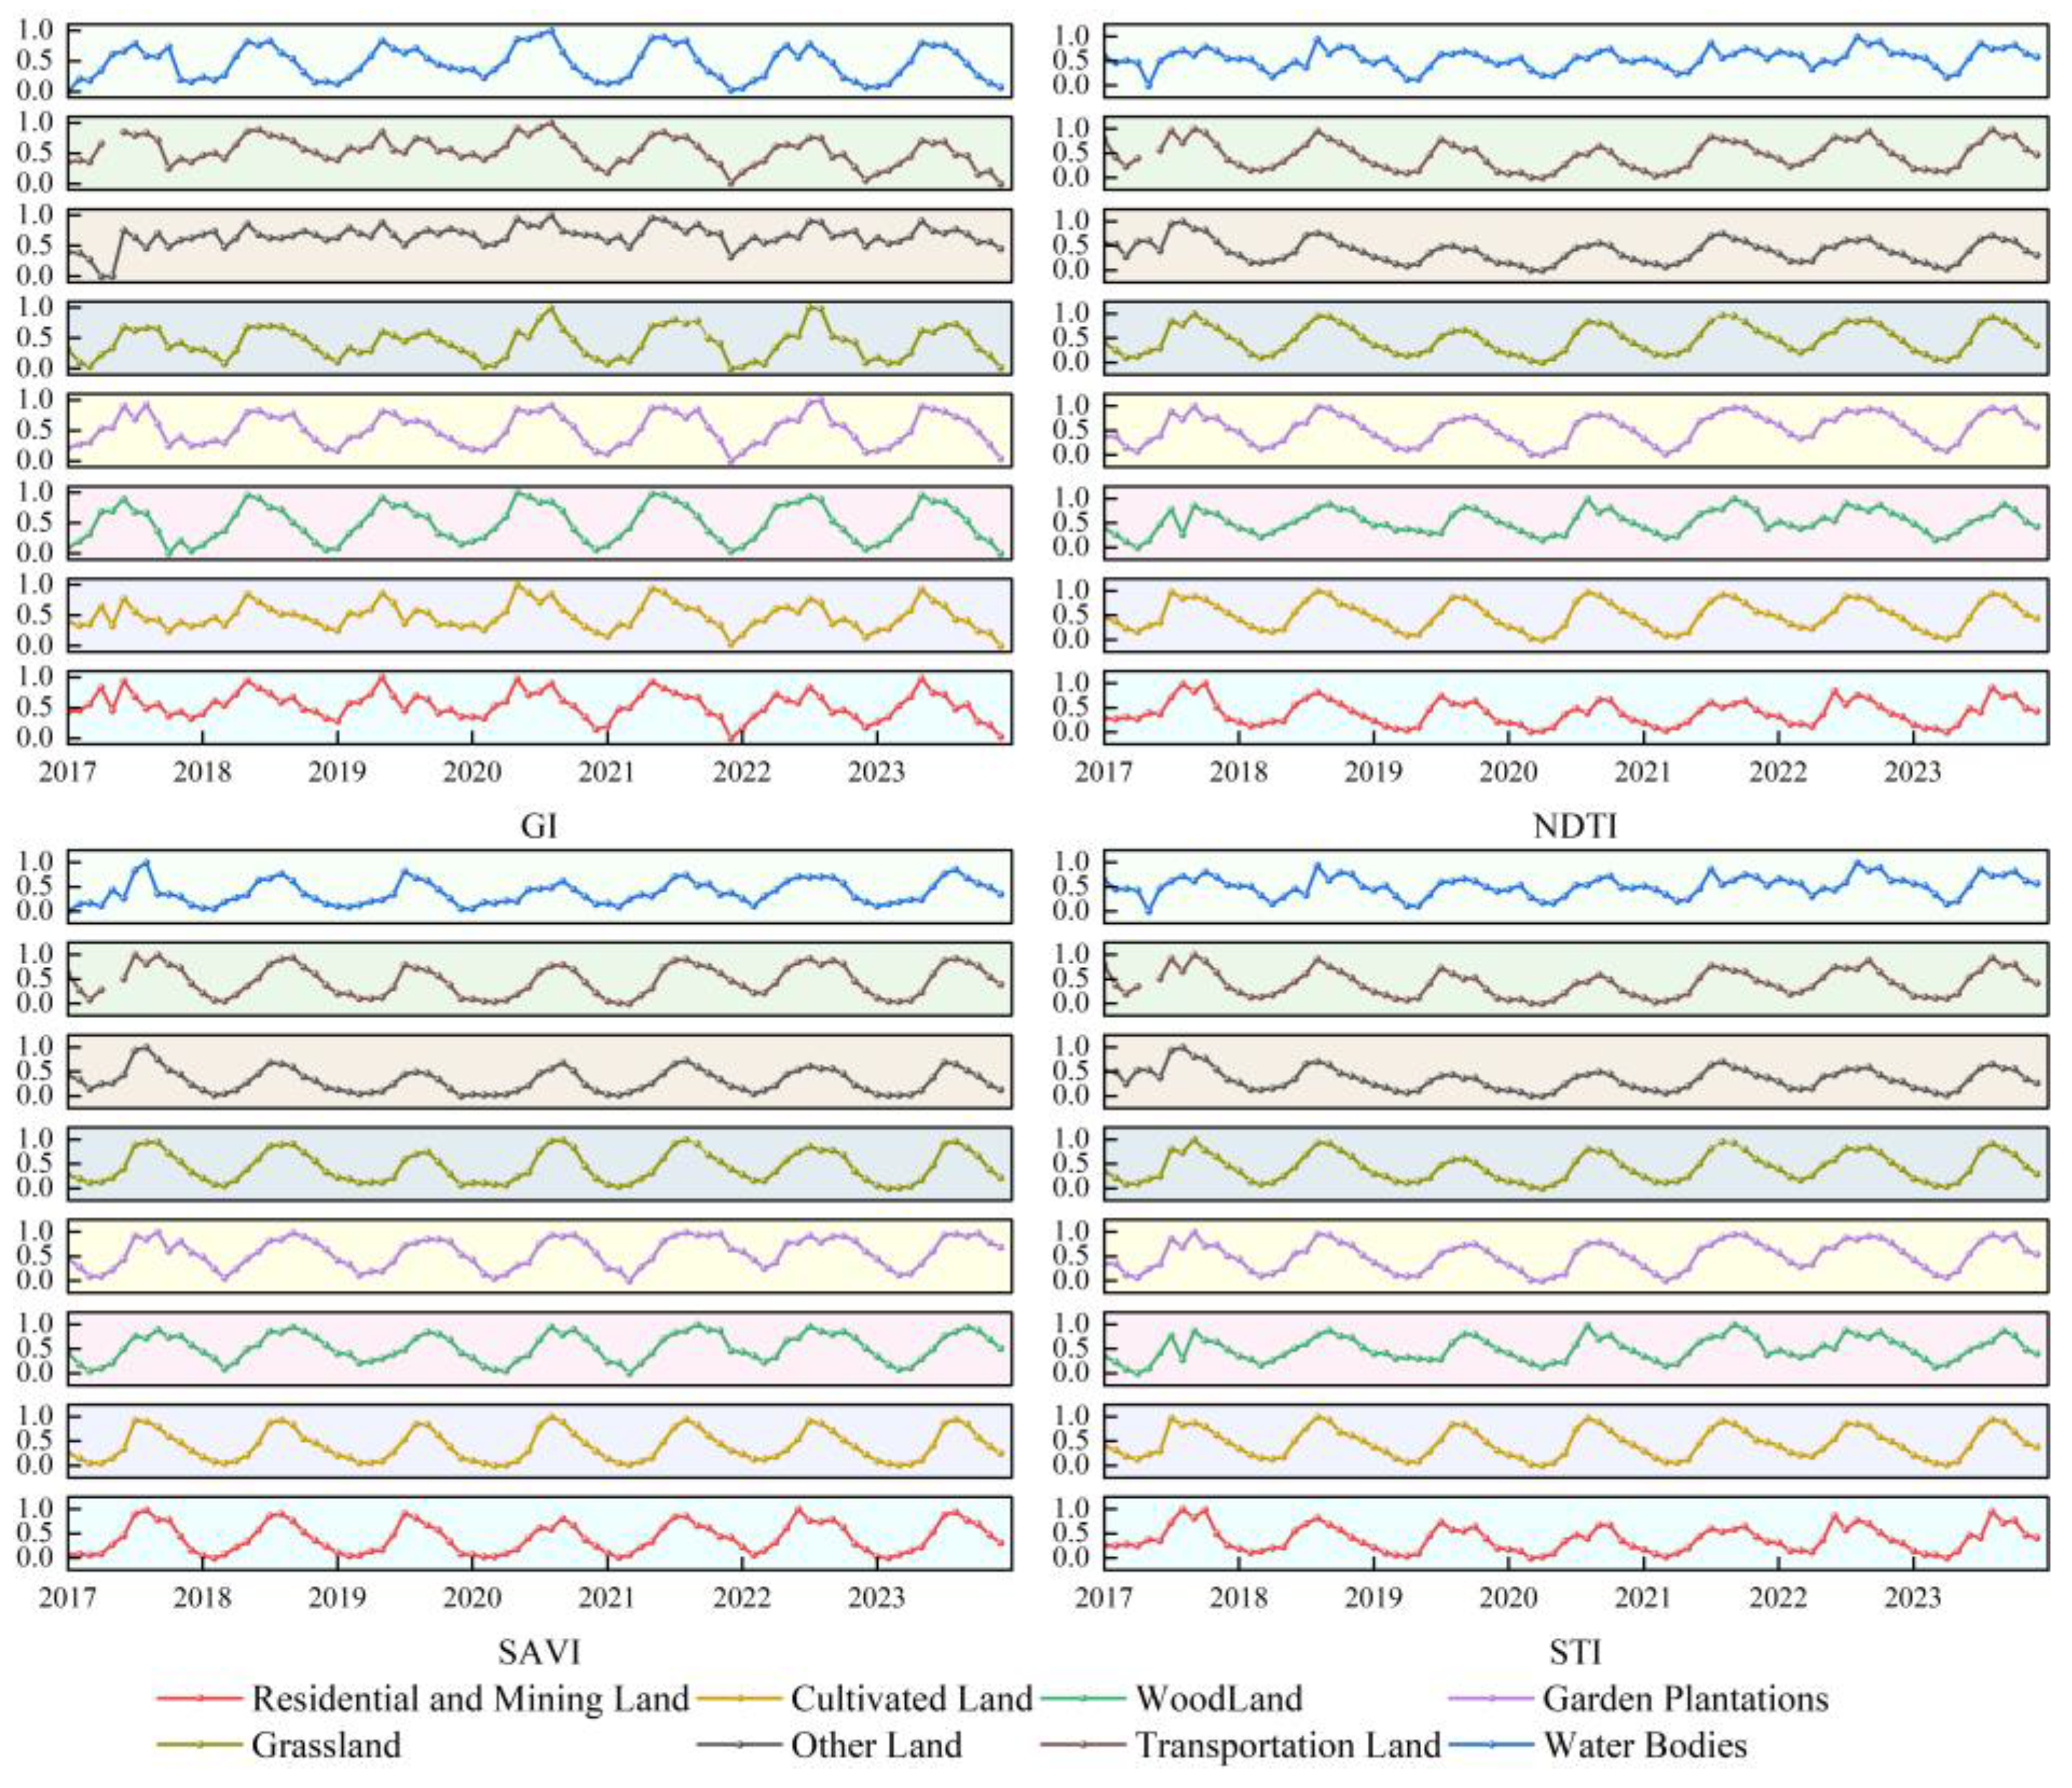
- Through feature optimization, the number of features was reduced from 59 to 21, leading to improvements in both classification efficiency and accuracy. Among these, GI, SAVI, NDTI, and STI were identified as the most discriminative spectral features. Based on these four indicators, monthly spectral time series curves from 2017 to 2023 were constructed, and the coefficient of variation (CV) between land use classes was calculated. The results indicated that the spectral features exhibited the greatest discriminative ability between February and April each year, identifying this period as the optimal time window for land use classification in dry–hot valleys.
- (2)
- Based on spectral time series analysis, synthetic images were generated at different temporal scales—single-month, three-month, half-year, and annual. These were used as inputs to four machine-learning algorithms for classification comparison. The results showed that the combination of annual-scale synthetic images from 2020 and the Gradient Boosted Trees classifier yielded the highest classification accuracy, demonstrating that longer temporal integration can significantly enhance classification performance.
- (3)
- The class imbalance experiments revealed that as the imbalance ratio (IR) increased, both OA and the Kappa coefficient exhibited an upward trend. Interestingly, the highest OA and Kappa values in each experiment group occurred under the most imbalanced conditions. Among the land classes, the PA and UA for woodland were relatively stable and less affected by class imbalance. In contrast, the PA and UA of minority classes, such as cultivated land, garden plantations, and grassland, declined significantly, with PA showing a steeper drop. This suggests that under imbalanced conditions, minority classes are more prone to omission or misclassification.
Author Contributions
Funding
Data Availability Statement
Acknowledgments
Conflicts of Interest
Appendix A
Appendix A.1

| Code | 1st-Level Class | Code | 2nd-Level Class | Detailed Descriptions |
|---|---|---|---|---|
| 1 | Cultivated Land | 11 | Paddy Field | Land used primarily for growing aquatic crops such as rice and lotus, including areas practicing rotation between aquatic and dry crops. |
| 12 | Irrigated Land | Land with guaranteed water sources and irrigation facilities, generally irrigable under normal weather conditions for dry crops, including non-industrial greenhouse land for vegetables. | ||
| 13 | Dry Land | Land without irrigation facilities, mainly dependent on natural rainfall for dry crop cultivation, including land irrigated only by flood deposits. | ||
| 2 | Garden Plantations | 21 | Orchard | Land dedicated to the cultivation of fruit trees. |
| 22 | Tea Plantation | Land dedicated to the cultivation of tea plants. | ||
| 23 | Other Plantations | Land cultivating perennial crops such as mulberry, rubber, cocoa, coffee, oil palm, pepper, medicinal plants, etc. | ||
| 3 | Woodland | 31 | Forest Land | Woodland with tree canopy coverage ≥ 20%, including mangroves and bamboo forests. |
| 32 | Shrubland | Land covered primarily with shrubs having a coverage ≥ 40%. | ||
| 33 | Other Forest Land | Includes sparse forests (canopy coverage between 10% and 20%), unformed forests, cutover areas, nurseries, etc. | ||
| 4 | Grassland | 41 | Natural Grassland | Natural grassland primarily used for grazing or haymaking. |
| 42 | Artificial Grassland | Grassland planted with cultivated grasses. | ||
| 43 | Other Grassland | Land with tree canopy coverage <10%, primarily soil-covered and grassy, not utilized for animal husbandry. | ||
| 5 | Residential and Mining Land | 51 | Urban Residential Area | Land within urban areas designated for residential housing and associated facilities, including ordinary residences, apartments, and villas. |
| 52 | Rural Residential Area | Land designated for residential housing in rural areas. | ||
| 53 | Independent Industrial and Mining Land | Land used primarily for industrial production and material storage. | ||
| 54 | Commercial, Service, and Public Facilities Land | Land mainly used for commercial services, institutional groups, publishing, education, science, culture, health, scenic spots, and public facilities. | ||
| 55 | Special Purpose Land | Land used for military facilities, foreign affairs, religious purposes, correctional facilities, cemeteries, etc. | ||
| 6 | Transportation Land | Land designated for transportation infrastructure, including airports, ports, docks, pipelines, and roads. | ||
| 7 | Water Bodies | Land comprising river surfaces, lakes, reservoirs, ponds, coastal tidal flats, inland flats, ditches, hydraulic structures, glaciers, and permanent snow, excluding flood detention areas and reclaimed flats used for farmland, orchards, forests, settlements, and roads. | ||
| 8 | Other Land | Includes lands not categorized above, such as saline-alkali land, marshland, sandy land, and bare land. |
References
- Wuepper, D.; Borrelli, P.; Finger, R. Countries and the global rate of soil erosion. Nat. Sustain. 2020, 3, 51–55. [Google Scholar] [CrossRef]
- Liu, B.Y.; Yang, Y.; Lu, S.J. Discriminations on common soil erosion terms and their implications for soil and water conservation. Chin. J. Soil Water Conserv. 2018, 16, 9–16. (In Chinese) [Google Scholar]
- Montgomery, D.R. Soil erosion and agricultural sustainability. Proc. Natl. Acad. Sci. USA 2007, 104, 13268–13272. [Google Scholar] [CrossRef]
- Morgan, R.P.C. Soil Erosion and Conservation; John Wiley & Sons: Hoboken, NJ, USA, 2009. [Google Scholar]
- Wang, Z.; Hoffmann, T.; Six, J. Human-induced erosion has offset one-third of carbon emissions from land cover change. Nat. Clim. Change 2017, 7, 345–349. [Google Scholar] [CrossRef]
- Alewell, C.; Ringeval, B.; Ballabio, C.; Robinson, D.A.; Panagos, P.; Borrelli, P. Global phosphorus shortage will be aggravated by soil erosion. Nat. Commun. 2020, 11, 4546. [Google Scholar] [CrossRef] [PubMed]
- Pimentel, D.; Burgess, M. Soil erosion threatens food production. Agriculture 2013, 3, 443–463. [Google Scholar] [CrossRef]
- Borrelli, P.; Robinson, D.A.; Fleischer, L.R.; Lugato, E.; Ballabio, C.; Alewell, C.; Panagos, P. An assessment of the global impact of 21st century land use change on soil erosion. Nat. Commun. 2017, 8, 2013. [Google Scholar] [CrossRef]
- Borrelli, P.; Robinson, D.A.; Panagos, P.; Lugato, E.; Yang, J.E.; Alewell, C.; Ballabio, C. Land use and climate change impacts on global soil erosion by water (2015–2070). Proc. Natl. Acad. Sci. USA 2020, 117, 21994–22001. [Google Scholar] [CrossRef]
- Fofang, S.T.; Mukama, E.B.; Adem, A.A.; Dondeyne, S. Landcover Change Amidst Climate Change in the Lake Tana Basin (Ethiopia): Insights from 37 Years of Earth Observation on Landcover–Rainfall Interactions. Remote Sens. 2025, 17, 747. [Google Scholar] [CrossRef]
- Venter, Z.S.; Barton, D.N.; Chakraborty, T.; Simensen, T.; Singh, G. Global 10 m Land Use Land Cover Datasets: A Comparison of Dynamic World, World Cover and Esri Land Cover. Remote Sens. 2022, 14, 4101. [Google Scholar] [CrossRef]
- Brown, C.F.; Brumby, S.P.; Guzder-Williams, B.; Birch, T.; Hyde, S.B.; Mazzariello, J.; Tait, A.M. Dynamic World, Near real-time global 10 m land use land cover mapping. Sci. Data 2022, 9, 251. [Google Scholar] [CrossRef]
- Karra, K.; Kontgis, C.; Statman-Weil, Z.; Mazzariello, J.C.; Mathis, M.; Brumby, S.P. Global land use/land cover with Sentinel 2 and deep learning. In Proceedings of the 2021 IEEE International Geoscience and Remote Sensing Symposium IGARSS, Brussels, Belgium, 11–16 July 2021; IEEE: Piscataway, NJ, USA, 2021; pp. 4704–4707. [Google Scholar]
- Tsendbazar, N.; Herold, M.; Li, L.; Tarko, A.; De Bruin, S.; Masiliunas, D.; Duerauer, M. Towards operational validation of annual global land cover maps. Remote Sens. Environ. 2021, 266, 112686. [Google Scholar] [CrossRef]
- Khan, M.; Chen, R. Assessing the Impact of Land Use and Land Cover Change on Environmental Parameters in Khyber Pakhtunkhwa, Pakistan: A Comprehensive Study and Future Projections. Remote Sens. 2025, 17, 170. [Google Scholar] [CrossRef]
- Chen, G.; Zhao, J.; Duan, X.; Tang, B.; Zuo, L.; Wang, X.; Guo, Q. Spatial quantification of cropland soil erosion dynamics in the yunnan plateau based on sampling survey and multi-source LUCC data. Remote Sens. 2024, 16, 977. [Google Scholar] [CrossRef]
- Tong, Y.; Feng, W.; Song, Y.; Quan, Y.; Huang, W.; Gao, L.; Xing, M. Dynamic ensemble algorithm of SMOTE and rotation WoodLand for imbalanced hyperspectral remote sensing classification. J. Remote Sens. 2022, 26, 2369–2381. (In Chinese) [Google Scholar]
- Xu, L.L.; Chi, D.X. Machine learning classification strategy for imbalanced datasets. Comput. Eng. Appl. 2020, 56, 12–27. (In Chinese) [Google Scholar]
- Bi, J.; Zhang, C. An empirical comparison on state-of-the-art multi-class imbalance learning algorithms and a new diversified ensemble learning scheme. Knowl.-Based Syst. 2018, 158, 81–93. [Google Scholar] [CrossRef]
- Mellor, A.; Boukir, S.; Haywood, A.; Jones, S. Exploring issues of training data imbalance and mislabelling on random WoodLand performance for large area land cover classification using the ensemble margin. ISPRS J. Photogramm. Remote Sens. 2015, 105, 155–168. [Google Scholar] [CrossRef]
- Ebrahimy, H.; Wang, Y.; Zhang, Z. Utilization of synthetic minority oversampling technique for improving potato yield prediction using remote sensing data and machine learning algorithms with small sample size of yield data. ISPRS J. Photogramm. Remote Sens. 2023, 201, 12–25. [Google Scholar] [CrossRef]
- Xiao, Y.; Huang, J.; Weng, W.; Huang, R.; Shao, Q.; Zhou, C.; Li, S. Class imbalance: A crucial factor affecting the performance of tea plantations mapping by machine learning. Int. J. Appl. Earth Obs. Geoinf. 2024, 129, 103849. [Google Scholar] [CrossRef]
- Liu, B.; Duan, X.; Wang, N.; Gu, Z.; Du, P. Sources of sediments during rainfall in the dry-hot valley region of China on a small watershed scale. J. Soil Water Conserv. 2021, 76, 14–24. [Google Scholar] [CrossRef]
- Palazzi, F.; Biddoccu, M.; Borgogno Mondino, E.C.; Cavallo, E. Use of Remotely Sensed Data for the Evaluation of Inter-Row Cover Intensity in Vineyards. Remote Sens. 2023, 15, 41. [Google Scholar] [CrossRef]
- Liu, Y.; Xie, M.; Qin, C. Climate characteristics and genesis of savannah in the dry hot valley of Yuanjiang, Yunnan. Yunnan Geogr. Environ. Res. 2023, 35, 61–69. (In Chinese) [Google Scholar]
- Zhu, H.; Tan, Y.; Yang, Y. Review on savanna vegetation in the dry hot river valleys of southwestern China. J. Plant Sci. 2024, 42, 682–696. (In Chinese) [Google Scholar]
- Yang, J.; Zhang, Z.; Shen, Z.; Ou, X.; Geng, Y.; Yang, M. Review of research on the vegetation and environment of dry-hot valleys in Yunnan. Biodivers. Sci. 2016, 24, 462. [Google Scholar] [CrossRef]
- Drusch, M.; Del Bello, U.; Carlier, S.; Colin, O.; Fernandez, V.; Gascon, F.; Bargellini, P. Sentinel-2: ESA’s optical high-resolution mission for GMES operational services. Remote Sens. Environ. 2012, 120, 25–36. [Google Scholar] [CrossRef]
- Yang, L.; Meng, X.; Zhang, X. SRTM DEM and its application advances. Int. J. Remote Sens. 2011, 32, 3875–3896. [Google Scholar] [CrossRef]
- Gorelick, N.; Hancher, M.; Dixon, M.; Ilyushchenko, S.; Thau, D.; Moore, R. Google Earth Engine: Planetary-scale geospatial analysis for everyone. Remote Sens. Environ. 2017, 202, 18–27. [Google Scholar] [CrossRef]
- Zhang, Y.; Fang, L.; Qiao, Z.; Chen, L.; Zhang, W.; Zheng, X.; Jiang, T. Remote sensing-based identification of WoodLand types and the scale effect in subtropical evergreen WoodLands. Chin. J. Ecol. 2020, 39, 1636. (In Chinese) [Google Scholar]
- Huang, H.; Wang, J.; Liu, C.; Liang, L.; Li, C.; Gong, P. The migration of training samples towards dynamic global land cover mapping. ISPRS J. Photogramm. Remote Sens. 2020, 161, 27–36. [Google Scholar] [CrossRef]
- Chen, B.; Huang, B.; Xu, B. Multi-source remotely sensed data fusion for improving land cover classification. ISPRS J. Photogramm. Remote Sens. 2017, 124, 27–39. [Google Scholar] [CrossRef]
- Gong, P. Intelligent mapping with remote sensing, iMap. J. Remote Sens. 2021, 25, 527–529. (In Chinese) [Google Scholar] [CrossRef]


| IR | 1 | 2 | 3 | 4 | 5 | 6 | 7 | 8 | 9 | 10 | 11 | 12 | 13 | 14 | 15 |
|---|---|---|---|---|---|---|---|---|---|---|---|---|---|---|---|
| Minority class | 800 | 534 | 400 | 320 | 267 | 229 | 200 | 178 | 160 | 145 | 133 | 123 | 114 | 107 | 100 |
| Majority class | 800 | 1067 | 1200 | 1280 | 1333 | 1371 | 1400 | 1422 | 1440 | 1455 | 1467 | 1477 | 1486 | 1493 | 1500 |
| No. | Spectral Characteristics | Abbreviation | No. | Spectral Characteristics | Abbreviation |
|---|---|---|---|---|---|
| 1 | Bare Soil Index | BSI | 24 | Red-Edge Near-Infrared Normalized Difference Vegetation Index | REDNDVI |
| 2 | Chlorophyll Absorption Reflectance Index | CARI | 25 | Red Edge Position Index | REP |
| 3 | Chlorophyll Concentration Reflectance Index | CCRI | 26 | Red-Edge Normalized Difference Vegetation Index | RNDVI |
| 4 | Chlorophyll Index | Cigreen | 27 | Band Ratio Vegetation Index | RVI |
| 5 | Red Edge Chlorophyll Index | Cire | 28 | Soil Adjusted Vegetation Index | SAVI |
| 6 | Difference Vegetation Index | DVI | 29 | Simple Tillage Index | STI |
| 7 | Enhanced Vegetation Index | EVI | 30 | Shortwave Infrared Vegetation Index | SWIRVI |
| 8 | Global Environment Monitoring Vegetation Index | GEMVI | 31 | Triangular Vegetation Index | TVI |
| 9 | Greenness Index | GI | 32 | Vegetation Growth Cycle Index | VGCI |
| 10 | Green Normalized Difference Vegetation Index | GNDVI | 33 | Angular Second Moment | Asm |
| 11 | Inverted Red Edge Chlorophyll Index | IRECI | 34 | Contrast | Contrast |
| 12 | Modified Crop Residue Cover | MCRC | 35 | Autocorrelation | Correlation |
| 13 | Improved Normalized Difference Water Bodies Index | MNDWI | 36 | Variance | Var |
| 14 | Improved Soil Adjusted Vegetation Index | MSAVI | 37 | Inverse Difference Moment | Idm |
| 15 | Normalized Difference Building Index | NDBI | 38 | Sum Of Averages | Savg |
| 16 | Normalized Difference Chlorophyll Index | NDCI | 39 | Sum Of Variances | Svar |
| 17 | Normalized Difference Residue Index | NDRI | 40 | Sum Of Entropy | Sent |
| 18 | Normalized Difference Senescent Vegetation Index, | NDSVI | 41 | Entropy | Entropy |
| 19 | Normalized Difference Tillage Index | NDTI | 42 | Slope Aspect | Aspect |
| 20 | Normalized Difference Vegetation Index | NDVI | 43 | Slope | Slope |
| 21 | Normalized Difference Vegetation Index(B8A) | NDVI8A | 44 | Elevation | Elevation |
| 22 | Normalized Difference Water Bodies Index | NDWI | 45 | Hillshade | Hillshade |
| 23 | Red Edge Triangular Vegetation Index | R–TVI |
Disclaimer/Publisher’s Note: The statements, opinions and data contained in all publications are solely those of the individual author(s) and contributor(s) and not of MDPI and/or the editor(s). MDPI and/or the editor(s) disclaim responsibility for any injury to people or property resulting from any ideas, methods, instructions or products referred to in the content. |
© 2025 by the authors. Licensee MDPI, Basel, Switzerland. This article is an open access article distributed under the terms and conditions of the Creative Commons Attribution (CC BY) license (https://creativecommons.org/licenses/by/4.0/).
Share and Cite
Deng, Y.; Chen, G.; Tang, B.; Duan, X.; Zuo, L.; Zhao, H. Study on Class Imbalance in Land Use Classification for Soil Erosion in Dry–Hot Valley Regions. Remote Sens. 2025, 17, 1628. https://doi.org/10.3390/rs17091628
Deng Y, Chen G, Tang B, Duan X, Zuo L, Zhao H. Study on Class Imbalance in Land Use Classification for Soil Erosion in Dry–Hot Valley Regions. Remote Sensing. 2025; 17(9):1628. https://doi.org/10.3390/rs17091628
Chicago/Turabian StyleDeng, Yuzhuang, Guokun Chen, Bohui Tang, Xingwu Duan, Lijun Zuo, and Haijuan Zhao. 2025. "Study on Class Imbalance in Land Use Classification for Soil Erosion in Dry–Hot Valley Regions" Remote Sensing 17, no. 9: 1628. https://doi.org/10.3390/rs17091628
APA StyleDeng, Y., Chen, G., Tang, B., Duan, X., Zuo, L., & Zhao, H. (2025). Study on Class Imbalance in Land Use Classification for Soil Erosion in Dry–Hot Valley Regions. Remote Sensing, 17(9), 1628. https://doi.org/10.3390/rs17091628