Abstract
The Dead Sea is one of the most saline terminal lakes on Earth, and few organisms survive in this harsh environment. In some onshore spring pools, active and diverse microbial communities flourish. In the geological past, microbial-rich environments left their marks in the form of stromatolites. Stromatolites are studied to better understand the appearance of life on Earth and potentially on other planets. Hyperspectral methodologies have been shown to be useful for detecting structures in stromatolites. In an effort to characterize the biosignatures and chemical composition inherent to stromatolites, we created a spectral classification scheme for distinguishing between stromatolites and their bedrock environment—typically carbonatic rocks, mostly dolomites. The overarching aim comprises the development of an automated hyperspectral reflectance method for detecting the presence of stromatolites. We collected and measured 82 field samples with an ASD spectrometer and used our spectral dataset to train three machine learning algorithms (linear regression, K-Nearest Neighbor, XGBoost). The results show the successful detection of stromatolites, with all three prediction methods giving high accuracy rates (stromatolite > 0.9, bedrock dolomite > 0.8). The continuum removal and spectral ratio technique results identified two significant spectral regions, ~1900 nm (water) and ~2310–2320 nm (carbonates), that allow one to differentiate between stromatolites and dolomites. This study establishes the grounds for the automated detection of a fossilized livable environment in a carbonatic terrain based on its hyperspectral reflectance data. The results have significant implications for future mapping efforts and emphasize the feasibility of automated mapping, extending the data acquisition to airborne or satellite-based hyperspectral remote sensing technologies to detect life forms in extreme environments.
1. Introduction
Stromatolites are laminated bio-sedimentary structures formed by sediment trapping and binding of microbially-assisted mineral precipitation [1,2].
Stromatolites represent some of the most ancient forms of life on Earth, bearing information regarding the primitive environment in which early life appeared and evolved [3,4]. The quest to shed light on such processes on potentially habitable planets has motivated the thorough investigation of stromatolites. Currently, possible analogies with potential microbialites and fossils on Mars motivate the study of terrestrial stromatolite textures and spectral signatures: they may be the ancient, heavily weathered and contentious Martian equivalent of the Archean stromatolites on Earth [5,6]
The Early Archean (3.2–3.6 Ga) supracrustal rocks of the Pilbara, Australia, have been proposed as Mars analogs by various authors on the basis of the preservation of similar surface environments (mafic volcanic, subaqueous, and hydrothermal) in rocks of a similar antiquity to the earlier epochs of Mars when its surface was dominated by similar processes and environments (e.g., Ref. [6]). To test the SWIR technique in a geologic setting comparable to the ancient flood basalts of Mars, fieldwork was undertaken in the arid Pilbara site, at an outcrop of a heavily silicified, stromatolitic Archean carbonate–chert succession to simulate the investigation of such an outcrop by a rover on Mars (e.g., Ref. [5]).
Stromatolites generally develop by the symbiotic activity of photosynthetic and anaerobic microbial communities in shallow water environments [1,2]. In the Dead Sea, these communities comprise halophiles surviving under extremely arid environmental conditions: hypersalinity, low nutrients, and high heavy metal concentrations [7]. The Dead Sea represents an extreme and challenging environment for known life forms. Having stromatolites in close proximity to their modern analog—microbialites [8] of receding shorelines—enables an understanding of the fossils and the environment in which they were formed. Stromatolites in the Dead Sea basin have the potential for the hydroclimatic reconstruction of a key site and crucial periods in the study of global climate change [9].
Pioneering studies since the 1970s [10] have established microscopic patterns and indices for interpreting Dead Sea fossils in terms of biological and sedimentological processes, reflecting primitive life and the preservation of the environmental record. We focus here on the stromatolite reefs fringing the paleo-shorelines of the Dead Sea for two purposes: first, as a testing ground to develop integrated methods for remote sensing and potentially identifying sites of geobiological interest; second, for better deciphering regional paleo-environmental conditions. According to the abundance of stromatolites in the local geological record, in particular during and following the last glacial maximum, the Dead Sea area presented less arid and more moderate climatic conditions in the late quaternary, allowing the development of a microbial-rich environment [10,11].
The field of imaging spectroscopy and remote sensing for mineral prospecting has been an active field of research for more than three decades. Hyperspectral remote sensing combines two methods: imaging and spectroscopy [2,10]. Imaging captures a spatial image of a scene (using a ground camera, drone, airplane, or satellite) measuring the radiant flux—which represents the amount of reflected or emitted electromagnetic radiation in dozens or hundreds of spectral bands. Point spectroscopy (in the field or the lab) measures the variation in reflectance intensity with the wavelength or frequency of light, capturing information related to the chemical and mineralogical composition of the materials measured. The instrumentation used to capture such spectral information is respectively called an imaging spectrometer or a hyperspectral sensor [12,13].
Spectrometers are in use in the laboratory, field, aircraft, and on satellites. The reflectance spectroscopy (measuring the reflected electromagnetic radiation) and emittance spectroscopy (measuring the heat-related emitted electromagnetic radiation) of natural surfaces are sensitive to specific chemical bonds in materials. Spectroscopy has the advantage of being sensitive to both crystalline and amorphous materials [14]. The minerals that have diagnostic spectral reflectance or emission features, and that crop out on the surface, can be detected, and their spatial distribution can be mapped by the analysis of the data acquired by the hyperspectral sensors [13].
Hyperspectral sensing (also termed reflectance spectrometry) enables many minerals, including phyllosilicates and carbonates, to be identified and quantified non-destructively by detecting their diagnostic absorption features in the visible near-infrared (VNIR; 400–1000 nm) and shortwave infrared (SWIR; 1000–2500 nm) spectra [15]. Hyperspectral techniques provide useful quantitative and textural information about stromatolites that visual inspection cannot detect. Biogenicity diagnostics refer to any chemical and/or morphological signatures preserved over a range of spatial scales in natural substances that are uniquely produced by past or present organisms [16]. Hyperspectral imaging has been shown in several previous works as a powerful tool for detecting structures in stromatolites that could be used, together with other lines of evidence, to diagnose biogenicity [5,15,17].
Previous work (Appendix A, Table A1) on linking reflectance measurements to the investigation of areas of paleobiological interest has focused on identifying minerals associated with ancient hydrothermal systems [18]. Such studies have now been extended to other planetary bodies such as Mars to identify areas that might have been conducive to the formation of ancient life [19]. SWIR spectroscopy has been conducted on Mars so far from two orbiters, OMEGA (on Mars Express) [20] and CRISM (on MRO) [21,22], and has been suggested for use on future landed missions to Mars [5]. To test the SWIR technique in a geologic setting comparable to the ancient flood basalts of Mars, fieldwork was undertaken in the arid, 3.5-Ga Pilbara Craton of Western Australia. Spectra in the range of 1300–2500 nm were obtained by a hand-held spectrometer at an outcrop of a heavily silicified, stromatolitic Archean carbonate–chert succession to simulate the investigation of such an outcrop by a rover on Mars (e.g., Refs. [5,23]).
Mars-related investigations on the spectral characteristics of stromatolites have mainly used data acquired by Raman or non-imaging spectrometers (e.g., Ref. [19]). In the following works, hyperspectral imaging techniques were proved to provide detailed information about stromatolites at a millimeter scale.
Murphy et al. studied stromatolites’ mineral distribution patterns to highlight their textural complexity, by using airborne hyperspectral imaging acquired at a high spatial resolution over the entire visible (VIS) to SWIR spectral range (400–2496 nm) with Specim (Oulu, Finland) hyperspectral sensors [15]. They found intricate petrographic and morphological information inherent to the stromatolites, SWIR data being particularly useful in revealing complex and intricate patterns of absorption by different minerals in some samples [15]. Hyperspectral images showed the intensity of absorption features associated with specific minerals and highlighted spatial variations relating to different aspects of mineralogy in their samples (e.g., Ref. [12]).
Microbialites are prime biosignature [4] targets for the ongoing Mars 2020 Perseverance rover mission. Their macrostructure could be visible in Remote Micro-Imager (Observatoire de Paris/CNES, France) and MastcamZ (Malin Space Science Systems and Arizona State University, USA) images at outcrop scale, whereas fine-scale features (tens to hundreds of microns in size) should be identifiable in images from the Wide Angle Topographic Sensor for Operations and eNgineering (WATSON) camera (Malin Space Science Systems, USA), mounted on the rover [24]. High-resolution imaging (from ~100 to ~10 µm/pixel) could identify the macrostructure, mesostructure, and much of the microstructure. If coupled with geochemical data using the payload instrumentation, a paleo-depositional and taphonomic history could be constrained [25].
A pioneer study [26] of an automatic classification scheme experiment using the early stages of machine learning tools showed preliminary results for distinguishing stromatolites from dolomites. The techniques included cluster analysis, Bayesian probabilistic estimators, and complexity analysis for the processing of remote and in situ photographic and spectral data. They collected hyperspectral data from the Trendall locality, Australia, an area rich in geobiological targets, including fossil stromatolites. Their initial work established the ability to detect the aqueous alteration of geological structures from an altitude of 2.5 km using 126-band hyperspectral images. They demonstrated that a compression algorithm can be used as a rapid screening technique to identify stromatolitic formations using three-band RGB high-resolution close-range color images of 10 × 10 cm rock samples (e.g., Ref. [26]). They had not built a spectral classification model for detecting stromatolites from airborne spectral imagery but rather used lossless compression algorithms that were applied on close-range digital photos in the visible range. These early stages of automation are insufficient, as they have not shown a feasible model for learning and predicting the presence of stromatolites.
As of today, the classification and detection of stromatolites by hyperspectral remote sensing has not been automated, and no study has yet developed a feasible robust, cross-validated machine learning model. We present a model for random learning and identifying the most diagnostic wavelengths with high prediction rates for detecting stromatolites.
The overarching objective of this research is the development of automated stromatolite detection using hyperspectral remote sensing. The three specific tasks for our study are as follows: First, to evaluate point spectroscopy and assess its feasibility for stromatolite detection in contrast with the surrounding dolomite rocks. Second, to identify which wavelengths are the most indicative for the first task. Third, to test whether machine learning-based algorithms are suitable for the learning hyperspectral data of carbonatic fossils with high prediction accuracy rates (stromatolites > 0.9, dolomites >0.8), and whether they could be used as an efficient tool to develop the automated mapping of stromatolites.
2. Materials and Methods
2.1. Study Area
The Dead Sea fills a tectonic basin in the rifts carrying its name (aka the Jordan Rift Valley), at the lowest elevation on Earth. The basin sedimentary record is well constrained by the U-Th chronology over several hundred thousand years of climatic variations (e.g., Ref. [27]) and the basin records over ten million years [28]. According to the abundance of stromatolites in the geological record, the Dead Sea paleo-shores reflect more suitable environmental conditions, allowing the development of an extensive microbial-rich environment, in particular during and following the last glacial maximum (Figure 1). This would serve as a preferable testing site for remote sensing techniques analogous to Mars, given that this is a hyper-arid site that is devoid of vegetation, and hence the remote sensing of minerals can be carried out, as well as other Mars-related simulations, as has been done in previous studies of the Dead Sea [29,30], similar to the Ramon Crater in Israel, which has been used as a Mars analog station [31].
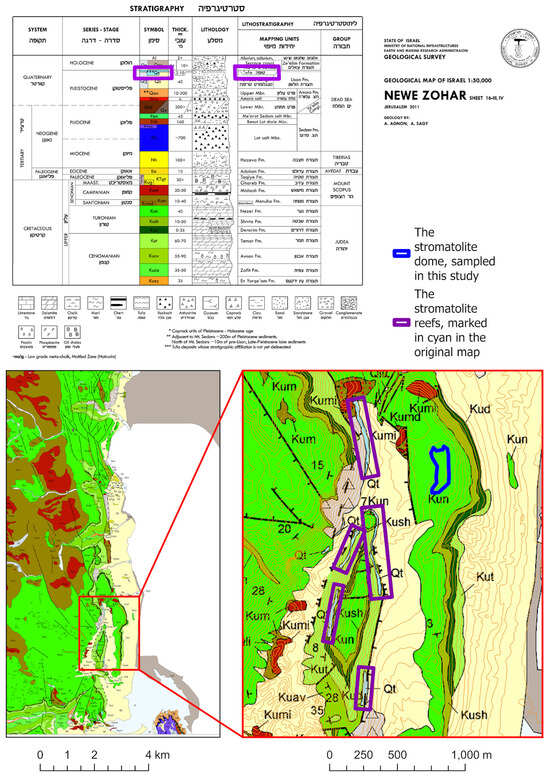
Figure 1.
A stratigraphic chart and a regional geological map. The stromatolite reefs, marked in blue in the original map [32], are encircled here in purple for focus.
These microbial-rich environments have left abundant marks in the form of fossil stromatolites. In recent decades, the Dead Sea has suffered from a severe decrease in water volume due to a highly negative water balance [7]. The shoreline drops at an increasing rate of circa one meter per year. Halite is almost constantly precipitating, and the total dissolved salt concentration has reached one of the highest levels on Earth, with up to 348 gL−1 [33]. The Dead Sea brine exhibits a high concentration of divalent cations (~2 m Mg2+ and ~0.5 m Ca2+) [34]; this makes it an especially harsh environment, even for resistant microorganisms [35]. In some locations of the current retreating shoreline, fresh water is seeping, allowing microbial life to flourish and form microbial mats [36]. The microbial cell number is extremely low in the present Dead Sea water (<5 × 10⁴ cells mL−1 [36]). The mixture of the ground water outflow with the extreme salinity of the modern Dead Sea brine allows a higher diversity than the modern Dead Sea brine, dominated by the existence of halophilic Archaea [7,37,38].
2.2. Sampling the Spectral Dataset with a Lab Spectrometer
We collected 82 rock specimens—42 of which were stromatolites, and 40 of which were the bedrock environment, mostly dolomites, 5 to 30 cm in diameter each (Figure 2), all from the “Stromatolite Dome” site, in the Ein Bokek area (Figure 3, coordinates 31°09′23.0″N 35°21′40.9″E, Israel), from an ancient shoreline of the Dead Sea (Figure 3). Uranium–thorium disequilibrium determinations of the Dead Sea stromatolite samples at altitudes circa 200 m below sea level (BSL) yield 32–25 ka (Figures 8d–11 in the reference [39]). This is in agreement with lake level curves published earlier, establishing the late glacial maximum (Ref. [40] and references therein).
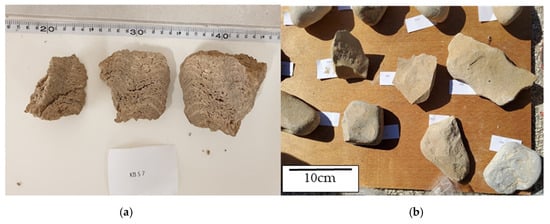
Figure 2.
(a) Stromatolite samples. (b) Dolomite samples.
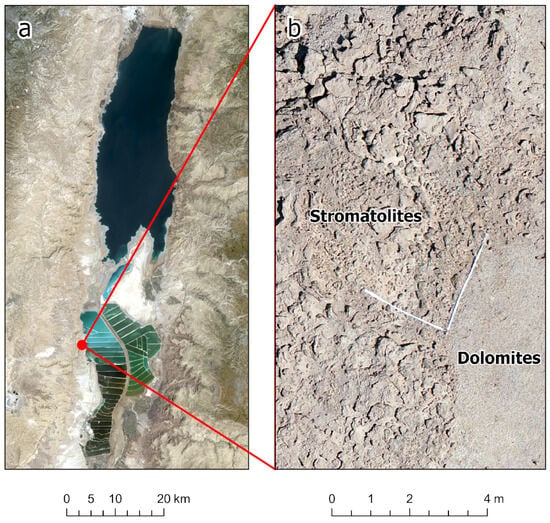
Figure 3.
(a) Map of the sampling location at the ancient shorelines of the Dead Sea around 175 m below sea level. (b) A drone orthophoto of the sampling site.
Splitting the samples 50–50% is derived from information randomization theory.
We have selected this particular site for several reasons: First, it spans a flat hilltop, distinct from the surroundings, at the highest altitude of extensive stromatolite reefs, which corresponds to the highest levels of extensive shore terraces of the Late Glacial Maximum Lake Lisan, ~200 m BSL. Second, the hilltop is roughly 0.5 km long (north–south) by 0.1 km wide, one of the largest exposures of Dead Sea stromatolites. Despite its unusual dimensions, the outcrop was not detected by field geological mapping based on extensive pedestrian excursions for calibrating the photo geology, as reflected by the 1:50,000 Geological Map Sheet (Figure 1) [32]. This is largely due to the similar varnish of the surrounding dolomites. Therefore, this site is a preferable one for the future testing of airborne applications of our methods. Third, that hilltop is surrounded by steep fault-controlled slopes, about halfway between the elevation of the coastal belt (~400 m BSL) and the rift shoulder (around sea level). Such isolation warrants preservation and minimal future anthropogenic destruction. The original map (Figure 1) showed seven fringing reefs limited to narrow (<30 m) and long (up to hundreds of m) eastward- (5) and westward-facing (2) steep slopes. The newly discovered sampling site is 300 m by 100 m on a flat hilltop, difficult to distinguish from the dolomitic surroundings [32].
We measured the spectral dataset using an ASD Field Spec 3 lab spectrometer for training and applying machine learning algorithms. The practice of classifying spectral data using machine learning models has been well demonstrated in recent years, as in Parent et al. [41], Francos et al. [42,43], Pelta et al. [44], and Gholizadeh et al. [45], which mainly focused on the spectral data of soils.
The dolomites are from the Touronian (Upper Cretaceous) Netzer Formation (Figure 1); similar dolomites from a nearby outcrop were studied by Stein et al. [34]. The dataset of hyperspectral reflectance data was collected using a spectrometer detector in the lab—an Analytical Spectral Devices (ASD) field-portable full-range UV/VIS/NIR/SWIR (350 nm–2500 nm) spectro-radiometer set and spectrometers used for material identification and analysis. The ASD collects 2151 channels of spectral reflectance measurement data. No sample preparation was applied, as we wanted to simulate the natural conditions in the field and thereby understand the feasibility of field automated mapping. Each of the specimens had 2150 feature (wavelength) readings; each sample underwent three readings of reflectance data, from 350 nm to 2500 nm, which were then averaged for further analysis (Figure 4). No spectral preprocessing methods, such as smoothing or normalization, were used. For each sample, the three readings were taken within the side of the surface that was exposed to air and sun, with a micro-spatial distribution, trying to cover the face of the sample and not measure twice on the same exact spot. There was no spatial distance between the sample and spectrometer, as the beam tool touched the sample for better measurement without atmospheric interference.
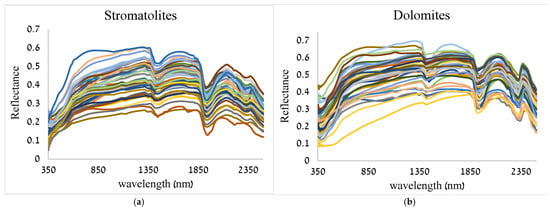
Figure 4.
Spectra of all the stromatolite (n = 42) (a) and dolomite (n = 40) (b) samples. Measurements were taken by the ASD spectrometer. Each sample spectra have a different colour in the graph.
2.3. Machine Learning Prediction Algorithms
We applied machine learning algorithms to distinguish between the spectra of stromatolites and dolomites. We used Scikit-Learn (1.5.2) and other open source modules of Python 3.12 All the predictions were repeated 20 times, each time with a different random seed, which was used for splitting the dataset into a training set and a testing set, using k-fold cross validation, where k = 3 (two thirds used for training, a third for testing) [46]. This process was stipulated in order to prevent false classification and overfitting. We began by training predictors using all of the available wavelengths in the dataset. Our purpose was (1) to understand the level of predictability of identifying the stromatolites using spectral measurements, as well as (2) to assess the possibility of dimensionality (spectral band) reduction without impacting the overall accuracy.
We trained and tested three predictors using all wavelengths: a linear regressor using logistic loss, a decision tree using the XGBoost algorithm (3.0.0) [47], and the K-Nearest Neighbor classifier. We then reduced the dimensions using the UMAP algorithm (0.5.8) [48], followed by training and prediction using the XGBoost decision tree (see Appendix A, Table A2 for hyperparameters).
Logistic regression is a regression in which the explanatory variable is continuous, the dependent variable is binary (1 or 0, in our case classifying “stromatolite” or “dolomite”), and the logistic regression has an S shape. When using a linear regression, we try to fit a linear equation to the observed data; the logistic loss function evaluates the difference between the predicted and the true values. By minimizing this difference, the model aims to find the best fitting line.
We chose to use XGBoost for multiple reasons: XGBoost was found to be more stable and computationally efficient than the other methods (SVM for example). Considering its accuracy, stability, and efficiency, the XGBoost model is highly recommended; XGBoost is capable of handling both regression and classification tasks [49].
Finally, we used two methods—Feature Importance and Shapley values (2.0.6) [50]—for the XGBoost decision trees trained for each division of the data, and we averaged their values, to gain a perspective on the more influential regions of wavelengths. Feature Importance for XGBoost decision tree is a method that retrieves importance scores for each attribute—here, each wavelength. Generally, the importance provides a score indicating how useful or valuable each feature was in constructing the boosted decision trees within the model. The more an attribute is used to make key decisions with decision trees, the higher its relative importance.
This importance is calculated explicitly for each attribute in the dataset, allowing attributes to be ranked and compared to each other. Importance is calculated for a single decision tree by the amount that each attribute split point improves the performance measure, weighted by the number of observations for which the node is responsible. The Feature Importance is then averaged across all of the decision trees within the model [47].
A Shapley value—a measure borrowed from game theory—is the average marginal contribution of a feature considering all possible combinations. In our application, it points out the most important significant wavelengths for the algorithms used to distinguish the stromatolites and to differentiate them from the background dolomites [50].
2.3.1. Trained Predictors
The data were divided for train-and-test, and three prediction methods were applied. True positive rate (TPR) is the probability of being correct, given that we predicted a stromatolite; true negative rate (TNR) is the probability of being correct, given that we predicted a dolomite. The calculations were made with a confusion matrix; the full confusion matrix and ROC (Receiver Operating Characteristic) curve [51] for each method are presented in the Appendix A (Table A3, Figure A1). The ROC curve shows a visual representation of model performance across all thresholds. The ROC curve is drawn by calculating the true positive rate (TPR) and false positive rate (FPR) at every possible threshold, then graphing the TPR over the FPR (e.g., Ref. [51]).
The algorithms are trained while the data goes through random shuffling, to prevent false positive learning. K-folding cross-validation is a resampling procedure enabling the evaluation of machine learning models on a limited data sample. In order to test the model performance, we split the hyperspectral data into training and test sets (see Appendix A.1).
Three classification methods effectively enhance the ability of learning models to predict the detection of stromatolites alongside dolomites by learning hyperspectral data: linear regression using logistic loss, a decision tree using the XGBoost algorithm, and the K-Nearest Neighbor classifier. Classifying the chemical differences between the two groups in vast data is a demanding task for manual analysis, which is why we chose to automate the procedure.
2.3.2. Dimensionality Reduction
Dimensionality reduction is commonly applied in hyperspectral remote sensing for computational efficiency, and it can also be useful for planning the number of spectral bands that are needed for specific tasks [52]. Uniform manifold approximation and projection (UMAP) is a dimension reduction technique that can be used to visualize patterns of clustering in high-dimensional data [48]. In this study, every wavelength was considered as a dimension. Clustering the prediction rates with the number of wavelengths used in the process can give another aspect to the results. Knowing that a high degree of prediction can be achieved by using 10 or 20 bands means that the model can run faster and more efficiently with around 1% of the sampled data. The UMAP dimension reduction consists of the target number of dimensions in {5, 10, …, 50}, followed by training with the XGBoost algorithm and the TPR, TNR, and an average of the two—known as the F1 score. The UMAP hyperparameters were, e.g., n_neighbors = 10, min_dist = 0.2, n_components = num, verbose = True. When mapping with a satellite, drone, or plane, data acquisition is limited, therefore finding a limited number of relevant bands (wavelengths) for automated classification is useful and essential for future work.
2.4. Spectral Analysis
Following the results of the machine learning algorithms, we conducted a spectral analysis of the stromatolites and dolomites, to identify specific absorption features and the differences between them. The three methods we used were the continuum removal algorithm, first derivative, and spectral ratios. All calculations were carried out with Excel and ENVI 6.0 (Environment for Visualizing Images) programs, as detailed below:
Continuum removal algorithm—The continuum removal algorithm is a well-known method that enhances the absorption features of spectra [53]. The monotonous spectra signals are characterized by a unity reflectance value, and absorption features are presented relative to a continuum of interpolated reflectance values that connects two absorption edges. Continuum removal (CR) enables a better determination of the differences in the absorption curves, to identify the central wavelength, width, asymmetry, and depth of absorption features. We have used the ENVI CR automated algorithm tool to calculate the CR for the entire spectrum, starting at 350 nm to 2500 nm.
First derivative—The first derivative calculates the slope of spectral curve. We calculated the first derivative of the CR curve between each pair of adjacent wavelengths, further emphasizing the differences in absorption features [54].
Spectral ratios—In the spectral ratio method, the target spectrum is divided by a reference spectrum, to better emphasize the differences between the two spectra. We calculated the ratio between the stromatolite reflectance CR curve and the dolomite spectral reflectance CR curve (both averaged over the entire sample populations), highlighting differences between their absorption features [53,55].
2.5. Simulation of Spaceborne Sensors
To examine the detectability of our approach with currently available spaceborne sensors, we resampled the ASD spectra to match the spectral sensitivities of two recent spaceborne sensors: Environmental Mapping and Analysis Program (EnMAP; OHB System AG, Germany) [56] and PRecursore IperSpettrale della Missione Applicativa (PRISMA; Leonardo OHB, Italy) [57]. We then repeated and conducted the spectral analysis of continuum removal and spectral ratios on the resampled spectra, and we also ran the machine learning model for Feature Importance and Shapley values in order to find the most indicative bands for detecting stromatolites and compare them with the ones found with the ASD data.
3. Results
3.1. Spectral Analysis Results
The average spectra of the sampled stromatolites presented lower reflectance values compared to the sampled dolomites’ reflectance values. Differences in the depth of absorption are apparent (Figure 5). The absorption features of the stromatolites were ~5% deeper than those of the dolomites around the water absorption features of 1400 nm and ~10% deeper at around 1900 nm (water), whereas the absorption features of the dolomites were ~11% deeper than those of the stromatolites around 2310 nm (carbonates) (Figure 6).
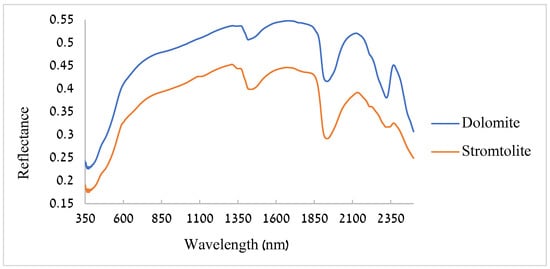
Figure 5.
Average spectra of the 42 stromatolite samples and the 40 dolomite samples.
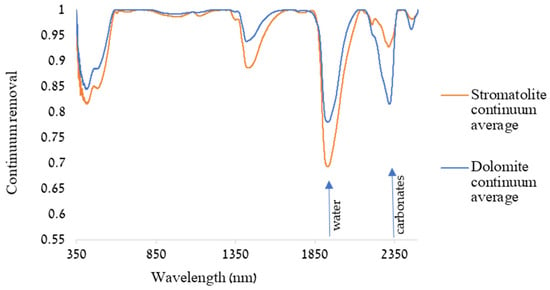
Figure 6.
Continuum removal (CR) of the averaged reflectance hyperspectral data. The CR enhances the differences in absorption relative to the curve fit.
Four areas with distinctive absorption features were apparent, three with a very similar form of absorption, where only the absorption depth was different between the dolomites and the stromatolites, mainly in the absorption centers of ~380, ~1400, and ~1900 nm. In contrast, between 2300 and 2350 nm, both the shape and depth were different between the dolomite and the stromatolite features (Figure 6). We received similar results from the CR analysis of the resampled spectra for both sensors, EnMAP and PRISMA (Appendix A, Figure A2 and Figure A3).
Using a two-tailed t-test applied to the CR spectra of the stromatolites and the dolomites (using wavelengths within a moving window of ±20 nm or ±100 nm), we found that the average CR spectra of the stromatolites and dolomites were statistically significant for most of the wavelengths.
Absorption features were evident more specifically around ~1445 nm, ~1920 nm, and ~2300 nm (Figure 6). We identified distinct differences between stromatolites and dolomites in the depth and center of their absorption features in the SWIR range between 2310 and 2325 nm (Figure 7): for dolomite, the absorption features were located at slightly longer wavelengths and deeper than for the stromatolites. Focusing on the carbonate absorption feature located between 2310 and 2340 nm, we applied a two-tailed t-test, and we found that there was a statistically significant difference between the stromatolites and dolomites in their absorption depth (p < 0.001) but not in the center of the absorption feature (p = 0.2).
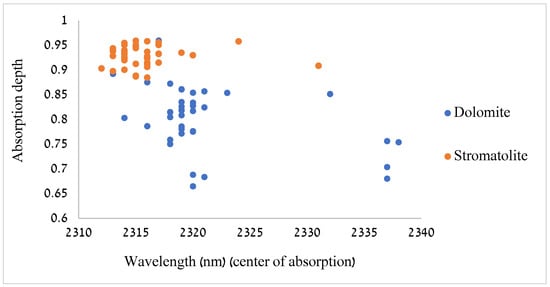
Figure 7.
Stromatolites’ and dolomites’ absorption depth and the wavelength of the center of the absorption feature. The data in this figure are based on the continuum removal of each individual spectrum.
The first derivative (following continuum removal) emphasizes the same differences, the most interesting area being the SWIR range (Figure 8). The major differences are around ~1939 nm (water), where stromatolites display a deeper absorption feature than the dolomites, whereas around ~2320 nm (carbonates) the dolomites had a deeper absorption feature than the stromatolites (Figure 8).
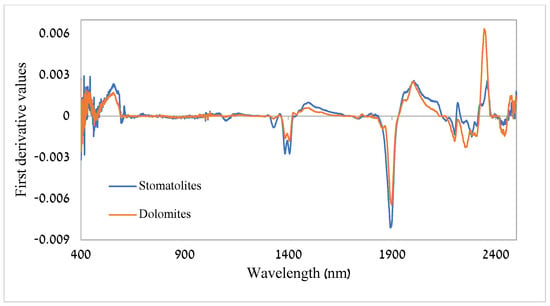
Figure 8.
First derivative with the following continuum removal curve of stromatolites and dolomites.
The spectral ratio (Figure 9) highlights the absorption differences; a distinctive trend reversal of absorption features is apparent in the water (~1900 nm) and especially in the carbonate (~2300 nm) absorption features. We found that the spectral ratio was greater than three standard scores between the wavelengths of 2268 and 2336 nm. Given that 99.7% of the data in a normal distribution lie within ±3 standard deviations, these indicative wavelengths are outliers and can be treated as statistically significant (p < 0.01) (Figure 9).
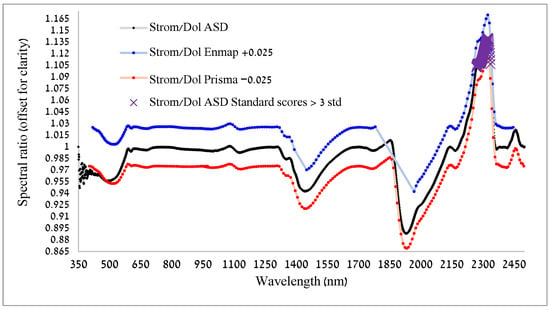
Figure 9.
The ratio between continuum removal fit for stromatolite over dolomite, as calculated from the ASD, and from the spectra resampled to the EnMAP and PRISMA sensors. Wavelengths where the standard score of the spectral ratio for the ASD were larger than three are shown with purple X symbols.
3.2. Automated Stromatolite Detection
We detected stromatolites with a high degree of accuracy using hyperspectral data, with all three machine learning classification methods showing high predictability rates of stromatolites and dolomites (TPR > 0.9, TNR > 0.8) (Table 1). The prediction rate of the logistic regression gave the best result (TPR = 0.98, TNR = 0.94) (Table 1). The ROC curves for all three methods demonstrate the high accuracy of the predictions, obtained by properly setting the decision threshold over the predictions made. The highest performance was obtained using logistic regression and XGBoost, which obtained an FPR=0.17, TPR=0.83 (logistic regression) and an FPR=0.15, TPR=0.85 (XGBoost), respectively (Appendix A, Figure A1).

Table 1.
Trained predictor classification of stromatolites and dolomites. The prediction rates of each of the trained predictors. (See Appendix A, Table A3 for the full confusion matrix).
The results also show the feasibility of using machine learning-based algorithms for learning hyperspectral data, and they could be used as an efficient tool to develop automated mapping, predicting the presence of stromatolites. The dimensionality reduction shows relatively accurate results (TPR = 0.83, TNR = 0.79), by using only ten dimensions (wavelengths) (Figure 10). This is a mild drop in performance in comparison to a TPR = 0.93, TNR = 0.85 for the XGBoost classifier trained using all of the 2150 wavelengths in the original dataset. The results for ten dimensions provide an example of the feasibility of using only a subset of hyperspectral data with a mild drop in prediction rates, therefore still resulting in an efficient outcome for automatic classification. Considering the UMAP parameters, at 10 dimensions the TNR was the highest, whereas with 40 dimensions the F1 was higher.
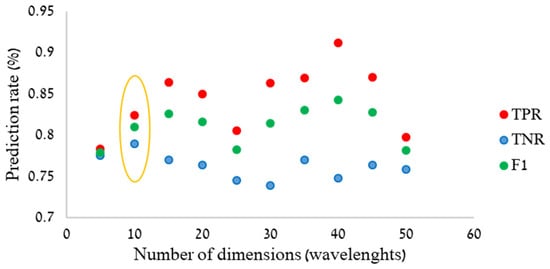
Figure 10.
Dimensionality reduction using UMAP, followed by the prediction using XGBoost decision tree. A scatter plot of the following: UMAP dimension reduction (with target number of dimensions in {5, 10, …, 50}), followed by training with XGBoost algorithm, prediction rates of stromatolites (TPR), dolomites (TNR), and an average of the two (F1 score). Circled (in yellow) are the rates at 10 dimensions (number of wavelengths).
3.3. Feature Importance Results
The Feature Importance values (marked in black in Figure 11) show the averaged importance of each wavelength for all the different decision trees overall trained using XGBoost. The high importance in the ~350 nm wavelength region is commonly attributed to noise in measurements. The most meaningful wavelengths for the task reside within the spectral ranges between 1875 and 1940 nm and between 2270 and 2380 (Figure 11).
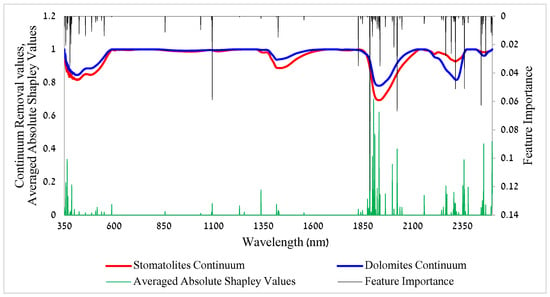
Figure 11.
Shapley values and Feature Importance compared with the absorption depths of the continuum removal. In green, the averaged absolute Shapley values of the trained decision trees using XGBoost. In black, the Feature Importance of the trained decision trees using XGBoost. The average Feature Importance of the trained decision trees using XGBoost. For averaged absolute Shapley values for each specific wavelength, see Appendix A, (Figure A4).
The Shapley values (marked in green) are the averaged absolute Shapley values of the trained decision trees using XGBoost (Figure 11, also see Appendix A, Figure A4). Positive values imply a positive direction of prediction, which means towards the value 1 (stromatolites assigned = 1), and a negative is towards the value 0 (dolomites assigned = 0). The regions around ~1900 nm and ~2350 nm were found statistically significant in determining the prediction of the classification (Figure 11). We received similar results (wavelength importance-wise) when we ran the analysis of the resampled spectra, both for the EnMAP and for the PRISMA sensors (Appenidx, Figure A5 and Figure A6).
The results of the Feature Importance and Shapley values have shown that the regions that were found in the spectral analysis between 2310 and 2325 nm were also found to be the most used by the algorithm to differentiate between the stromatolites and the bedrock dolomites (Figure 11). Shapley values and Feature Importance are two different methods that calculate the importance of the spectral features to make the classification decision. Given that they gave similar results, this reinforces the significance of the wavelengths that were identified as having high importance for the classification of dolomites vs. stromatolites.
4. Discussion
4.1. Machine Learning Implications
All three machine learning methods have shown high predictability rates for the presence of stromatolites and dolomites, with the logistic regression being the highest. The most indicative wavelengths for distinguishing stromatolites are found around ~1900 nm and ~2300–2350 nm, considering the computed Feature Importance, Shapley values (Figure 11), and the spectral analysis (Figure 6, Figure 7, Figure 8 and Figure 9).
The resampled data for the EnMAP and for the PRISMA sensors gave similar results (Appendix A, Figure A5 and Figure A6). There was an alignment of the indicative bands we found for our ASD data with the ones we found with the spectra when they were resampled to fit the spectral sensitivity of the two operational spaceborne sensors of EnMAP and PRISMA. Based on the results of the CR analysis for all sensors (EnMAP, PRISMA, and ASD) we see matching absorption features, especially around 1400, 1900, and 2300 nm (Appendix A, Figure A2 and Figure A3) (also, see Appendix A.2).
Using specific bands might reduce the search time needed to detect minerals and possible biosignatures on planetary surfaces, and it can assist in designing the required bands for future planetary missions.
The automatic detection of different absorption features within the hyperspectral reflectance spectra can also help to detect fine laminae structures in stromatolites. These structures exhibit distinct characteristics relative to their surrounding material. For example, differences in mineral composition, abundance, or crystallinity and their quantified intensity can be used as indicators of mineral abundance (e.g., Ref. [15]).
The dimensionality reduction result (Figure 10) demonstrates the possibility of having accurate predictions by using only a small number of wavelengths, which simplifies and facilitates the measurement and calculation processes. The idea behind dimensionality reduction is that a high degree of prediction can be achieved by using only 10 bands (Figure 10). This means that the model can run faster and more efficiently with around 1% of the sampled hyperspectral data.
As mentioned in our research objectives, focusing on a subset of indicative wavelengths bears strong implications for the goal of the practical detection and automated mapping of stromatolites, leading to the high practicality of the processes and the optimization of the classification. When mapping with a remote detector mounted on a drone or a satellite, hyperspectral acquisition across all bands in the VIS-NIR-SWIR may be limited, Therefore, knowing that a subset number of wavelengths bands can be sufficient for automated classification is useful. A significant potential emerges for deploying a drone with SWIR hyperspectral cameras for mapping in detail for geological maps. This opens new horizons regarding inaccessible areas (e.g., Ref. [58]).
The results regarding Feature Importance, as well as Shapley values [59] (Figure 11), indicate not only that a small number of features may be used efficiently, but they also highlight the significance of a specific region of wavelengths while detecting stromatolites. In this regard, we conducted a detailed analysis of the spectral features of stromatolites and dolomites in order to better understand the mineralogical signatures that serve as the key components for prediction at the relevant range, rather than examining the whole spectral range.
The machine learning model uses the edge of the absorption peak at ~1900 nm and the center peak at ~1930 nm. The use of the slope of absorption features as a mean for spectral-based mapping is common in hyperspectral analysis; e.g., in agricultural applications, the “red edge” (the slope of the reflectance curve between 700 and 800 nm) [60,61] is often used, and some multispectral sensors (e.g., Sentinel-2) have been designed with specific bands for quantifying the red edge [62].
4.2. Spectral Signature and Previous Works Comparison
Brown et al. [18] analyzed spectra from the Mars Compact Reconnaissance Imaging Spectrometer (CRISM) images and used co-located HiRISE images in order to further characterize the carbonate-bearing units of the Nili Fossae Mars region, indicating the presence of Mg-carbonate. The carbonate type can be determined by the central position of the 2300 and 2500 nm bands. The band positions characteristic of Ca-, Fe-, and Mg-bearing carbonates are respectively centered at 2340 and 2540 (Ca), 2330 and 2530 (Fe), and 2300 and 2500 nm (Mg) [18]. Peaks of carbonate absorption features were found in stromatolites at around the 2339 nm (e.g., Ref. [17]), 2300 nm, and 2540 nm bands [18]. In our stromatolite samples, carbonate peaks were detected at ~2320 nm.
We found a spectral separation between the two types of formations at the water absorption features at ~1950 nm and ~1450 nm (Figure 6) [5,19]. The stromatolites had a deeper absorption rate at the water absorption bands. As stromatolites are typically porous, hygroscopic water is much more likely to be present in their lattice structures, as opposed to compact dolomites (Figure 2). Previous studies have indeed found that porosity is associated with deeper absorption features in the spectral bands associated with water absorption [63]. In Kose et al.’s work [17], an indicative spectral difference was also found in the ~1932 nm band between dolomite and a stromatolite’s section. Regarding the water absorption bands as an indicator for spectral separation for stromatolites from their environment, under dry conditions porous media will not necessarily retain water. This may even apply to in situ stromatolites at the Dead Sea, as opposed to Tel Aviv lab conditions. A solution will be learning the spectral data with the machine learning model while excluding the water absorption regions in the spectra.
Our machine learning models have also found that SWIR holds the most indicative wavelengths while differentiating stromatolites from their bedrock environment. Hyperspectral analysis was demonstrated by Murphy et al.’s work [15], where hyperspectral imaging provided useful quantitative and textural information about stromatolites. Data acquired at SWIR (illite at 2202 nm; chlorite at 2251 nm; calcite at 2337 nm, ~2335 nm, 2331 nm, 1299 nm and 1650 nm, indicating strong absorption by ferrous iron) were particularly useful in revealing complex and intricate patterns of absorption by different minerals (e.g., Ref. [15]).
The SWIR range was reported to be indicative for recognizing stromatolitic features by exploratory researchers as well. Kose et al. [17] have suggested that infrared spectroscopy is potentially useful for distinguishing minerals in heavily weathered rock units for indicating the possible presence of stromatolites. The combined weathered and fresh surface SWIR data showed a particular strength in identifying water, clay, and carbon-based minerals such as calcite, tremolite, and montmorillonite.
4.3. Mars Relevance
The search for life on Mars has relied on infrared spectroscopy from orbit by CRISM (362–3920 nm; Johns Hopkins University Applied Physics Laboratory, USA) as it has searched for mineralogical indications of water and in situ by SHERLOC (Scanning Habitable Environments for Raman and Luminescence for Organics and Chemicals; NASA Johnson Space Center, USA) [24] a deep UV (~250–350 nm) spectrometer, installed on the Perseverance rover for the 2020 mission, to detect and characterize organics and minerals on the Martian surface [64]. The spectral region around 1900 nm is impacted by water absorption (on Earth) and CO2 on both Earth and Mars [65,66]. Hence, this spectral region is less useful for orbital remote sensing but is useful for ground-based remote sensing using field spectrometers. Carbonates on Mars are expected to form from basalt in an aqueous alteration environment under a CO2-rich atmosphere [18]. Carbonate and hydrothermally altered mineral signals were detected on small rock units and in small concentrations, but these minerals were likely a product of dolomitization rather than an indicator of stromatolitic precipitation [17]. Our findings align with CRISM’s capabilities to prioritize carbonate detection as part of its mission to detect mineralogical indications of water. One of CRISM’s targets is lake environments, as they could have been habitable, and some are favorable for fossil preservation—particularly those that have left sediments rich in carbonates or clays [67].
In the recent research of Hickman-Lewis et al. [25], the Dresser stromatolites in Australia, an ancient and heavily altered fossil unit, were sampled and imaged in high-resolution correlative micro-analyses using 2-D and 3-D multi-techniques to characterize their microstructure formation. Establishing the biogenicity of ancient samples of stromatolites is the first step in exploring their potential as analogs for putative Martian biosignatures.
The Dresser stromatolites are old direct evidence for early life on Earth. Their paleo-depositional setting, polyextremophilic biology, and taphonomy make them ideal analog biosignatures for Mars, reflecting the type of morphological fossils one might expect to encounter in altered Noachian carbonates [25]. In a similar manner, the Dead Sea stromatolites represent bio-sedimentary structures formed by microbially assisted mineral precipitation. In the Dead Sea, these microbial communities comprise halophiles surviving under extremely arid environmental conditions, which can serve as an analog for potential ancient fossils on Mars [4]. The Dead Sea stromatolites are much “younger” than the stromatolites in Australia sampled in the Dresser Formation and have conceivably undergone mineralogical alternations to a lesser extent. This is apparent in their largely aragonitic composition, a generally less stable mineralogy under standard conditions.
The preservation of biosignatures like organic carbon in carbonate environments can extend beyond obvious microbial structures and may also be preserved in shallow water environments that are rich in microbial life [4]. Textural and mineralogical evidence that may be indicative of life and biosignature preservation in carbonate environments were found to be not limited to silicified carbonates or obvious microbial structures (e.g., Ref. [4]). The findings extended to dolomitized carbonates and generally shallow water settings, where fine-grained carbonate minerals indicate primary environments that are capable of preserving primary and syngenetic organic carbon (e.g., Ref. [4]). These previous findings assert the need for developing better methods for distinguishing between stromatolites and dolomites. The Mars Perseverance rover has the ability to target fine-grained carbonate rock for Raman analysis, and if carbon is detected, this may serve as high potential biosignatures to be cached for future sampling return missions [4].
5. Conclusions
In this study, we explored the feasibility of accurately detecting stromatolites using hyperspectral data in the test case of the paleo-shorelines of the Dead Sea that were formed around the Last Glacial Maximum. We demonstrated that stromatolites can be distinguished from the background carbonate minerals (dolomites in our case), based on spectral features related to their porosity (around 1900 nm) and related to distinguishing unique absorption features (around 2300 nm).
Our set of machine learning-based algorithms was found to be useful for this task, demonstrating that hyperspectral data are highly suitable for automated classification methods. Identifying the indicative wavelengths in the SWIR range is a key component for understanding the chemical differences between structures that contain traces of paleo microbial-rich environments and their neighboring layers. Our model can learn, predict, and be applied, to distinguish between stromatolites and dolomites, not only to ASD field spectra but also to the spectral sensitivity of the available spaceborne sensors, such as EnMAP and PRISMA (see Appendix A, Figure A5 and Figure A6 for additional results of the satellite’s hyperspectral data applicability test).
In an effort to support evidence of biogenicity, the ability to identify discrete mineralogical differences from their environmental bedrock and structures within fossilized stromatolites may provide a window into microbial and environmental conditions during their formation. Building an automated detection and hyperspectral scheme for accurate classification is especially helpful when searching for life on other planets. Microbial fossil preservation on Earth is rare, while different geological environments on other planets will likely result in different signatures for ancient life forms [4]. Therefore, an automated detection and hyperspectral scheme for accurate classification, using machine learning, with terrestrial analogs such as this study, will allow better interpretations of potential biosignatures in Martian carbonates, which may have undergone varying levels of alteration.
Considering our results, we would recommend prioritizing the spectral bands 1900 nm and 2300 nm, when searching for signs of fossil stromatolites by using spectrometers mounted on rovers, and around 2300 nm when using satellites, as the bands around 1900 nm are affected by the atmosphere. Our work demonstrates the results for a dataset based on samples from a specific site, with relatively young carbonate deposits [39]. We plan to expand our field work and to sample a new site in the Dead Sea area. Having two datasets will help us evolve our machine learning model, enlarging the learning set and testing its ability to predict the presence of stromatolites in a new site, as the first site will function as the training set. The same could be done for testing other sites around the world. We also plan to examine our model with a hyperspectral thermal camera, since it can provide extensive and high-resolution data. Future work can also include satellite hyperspectral data predictions, as were tested here with the resampling of our data.
Author Contributions
Conceptualization, A.A. and N.L.; Methodology, N.G., A.A. and N.L.; Formal analysis, N.G.; Data curation, N.G.; Writing—original draft, N.G.; Writing—review & editing, N.G., A.A. and N.L.; Visualization, N.G.; Supervision, A.A. and Noam Levin; Funding acquisition, A.A. All authors have read and agreed to the published version of the manuscript.
Funding
This study was initiated under the University of Geneva–Hebrew University Seed Funding Program granted to Amotz Agnon with Adi Torfstein and Daniel Ariztegui.
Data Availability Statement
The raw data of the ASD spectral measurements supporting the conclusions of this article will be made available by the authors on request.
Acknowledgments
Thanks to our research and laboratory colleagues: Eyal Ben-Dor, Nicolas Francos (the Remote Sensing Laboratory, Tel Aviv University). Yoav Ben-Dor (Geological Survey of Israel), Yaniv Darvasi (Neev center, Institute of Earth Sciences, the Hebrew University), Daniel Ariztegui (University of Geneva), Camille Thomas (University of Bern), and Guy Ron, the Racah Institute of Physics, the Hebrew University. We are especially grateful to John K. Hall (Geological Survey of Israel), co-founder of the Neev Center for Geoinfomatics, for his ongoing support. We thank Eli Ram (Geological Survey of Israel) for his field assistance.
Conflicts of Interest
The authors declare no conflicts of interest.
Appendix A

Table A1.
A summarized table for previous work that has been undertaken with stromatolites and remote sensing.
Table A1.
A summarized table for previous work that has been undertaken with stromatolites and remote sensing.
| Paper Name | Writers (Sorted by Year) | Number of Samples | Spectral Methods | Statistical Methods | Spectral Range |
|---|---|---|---|---|---|
| Short-wave infrared reflectance investigation of sites of paleo-biological interest: applications for Mars exploration. | [5] | 50 × 30 m section of outcrop. 1500 digital photographs were taken of the outcrop. Over 250 SWIR spectra were obtained by a hand-held PIMA II spectrometer at an outcrop of a heavily silicified, stromatolitic Archean carbonate–chert succession | the Portable Infrared Mineral Analyzer (PIMA)— reflectance spectroscopy of the SWIR region | Rocks were categorized according to color and texture, as indicated in the paper. Following the rock type and unit categorization based on visual evidence, the area was surveyed with the PIMA spectrometer in the manner that a rover might examine an outcrop. This was achieved by acquiring several spectra of each unit. | (1300–2500 nm) |
| Remote and in situ detection of environmental and biological Signatures: ground-truthing hyperspectral imaging for planetary exploration | [26] | 40,000 spectra from a 200 × 200 pixel image of a 1 square kilometer region | airborne—the HyMap camera obtained 126-band images from an altitude of 2.5 km | Principal Component Analysis, Hierarchical Cluster Analysis, stochastic nonlinear artificial neural network. | (400–2400 nm) |
| Hyperspectral imaging spectroscopy of a Mars analog environment at the North Pole Dome, Pilbara Craton, Western Australia. | [23] | The dataset at the North Pole Dome consists of 14 flight lines that are 2.3 km wide on average and from 6 to 22 km long | airborne—the HyMap camera obtained 126-band images from 2.4 km above ground level | False-color continuum-removed image. | 400–2500 nm |
| Distinguishing in situ stromatolite biosignatures from silicification and dolomitization using shortwave, visible near-, and thermal infrared spectroscopy: A Mars analogue study. | [17] | 7 samples in total | PIMA II spectrometer, ASD) FieldSpec3- spectrometer, total internal reflection fluorescence microscope (infrared microscope) | The reflectance spectra were used for analysis. Where the spectra were obscured, the hull quotient feature was applied to delineate absorption features more clearly. | 390–2500 nm 2500–25,000 nm |
| Complex patterns in fossilized stromatolites revealed by hyperspectral imaging (400–2496 nm). | [15] | 4 samples | hyperspectral imaging, separate sensors to measure the VNIR (400–970 nm) and SWIR (1000–2496 nm) parts of the spectrum | Processed to identify reflectance and mineral absorption features and quantify their intensity (as an index of mineral abundance) using automated feature extraction. | (400–2496 nm) |

Table A2.
Hyperparameters.
Table A2.
Hyperparameters.
| Method | Hyperparameters (Are All Defaults) |
|---|---|
| UMAP | (n_neighbors = 10, min_dist = 0.2, n_components = num, verbose = True) |
| Linear Regression | ‘C’: 1.0, ‘dual’: False, ‘fit_intercept’: True, ‘intercept_scaling’: 1, ‘max_iter’: 1000, ‘multi_class’: ‘deprecated’, ‘penalty’: ‘l2’, ‘random_state’: 10, ‘solver’: ‘lbfgs’, ‘tol’: 0.0001, ‘verbose’: 0, ‘warm_start’: False} |
| XGB | {‘objective’: ‘binary:logistic’, ‘enable_categorical’: False, ‘eval_metric’: ‘logloss’, ‘missing’: nan} |
| KNN | {‘algorithm’: ‘auto’, ‘leaf_size’: 30, ‘metric’: ‘minkowski’, ‘n_neighbors’: 6, ‘p’: 2, ‘weights’: ‘uniform’} |

Table A3.
Confusion Matrix (1 = stromatolites, 0 = dolomites).
Table A3.
Confusion Matrix (1 = stromatolites, 0 = dolomites).
| Linear Regression | 1 | 0 |
| 1 | 0.98 | 0.02 |
| 0 | 0.06 | 0.94 |
| XGBoost | 1 | 0 |
| 1 | 0.93 | 0.07 |
| 0 | 0.15 | 0.85 |
| K-Nearest Neighbor | 1 | 0 |
| 1 | 0.93 | 0.07 |
| 0 | 0.19 | 0.81 |
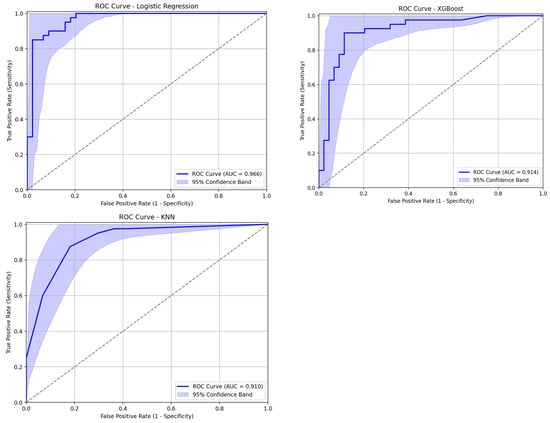
Figure A1.
ROC curves for all three methods—logistic regression, XGBoost, and K-Nearest Neighbor. The grey dashed line is the trade-off obtained by applying different thresholds over the predictions of a random predictor.
Appendix A.1. K-Fold Cross-Validation
Cross-validation is a resampling procedure used to evaluate machine learning models, the sampling is done in such a way that no two test sets overlap. In k-fold cross-validation, the available learning set is partitioned into k disjoint subsets of approximately equal size. Here, “fold” refers to the number of resulting subsets. This partitioning is performed by randomly sampling cases from the learning set without replacement. The model is trained using k -1 subsets, which, together, represent the training set. Then, the model is applied to the remaining subset, which is denoted as the validation set, and the performance is measured. This procedure is repeated until each of the k subsets has served as validation set. The average of the k performance measurements on the k validation sets is the cross-validated performance (e.g., Ref. [46]).
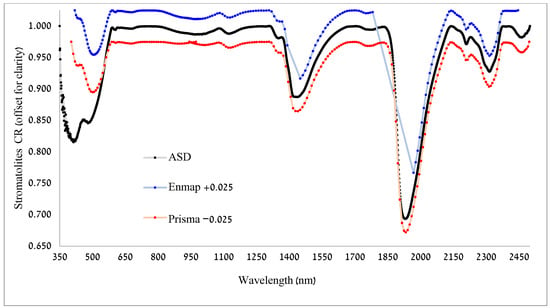
Figure A2.
Stromatolite CR for all three datasets.
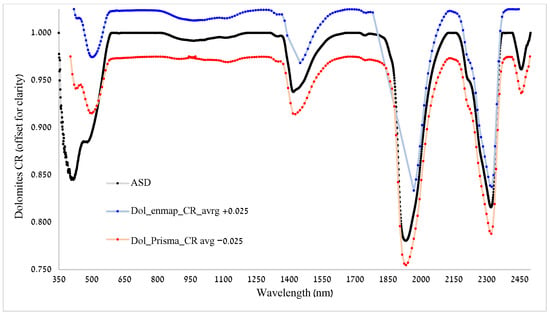
Figure A3.
Dolomite CR for all three datasets.
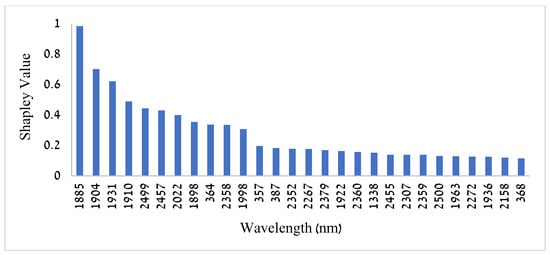
Figure A4.
The average absolute Shapley values for the most distinctive wavelengths found by the model to be useful for distinguishing between stromatolites and dolomites.
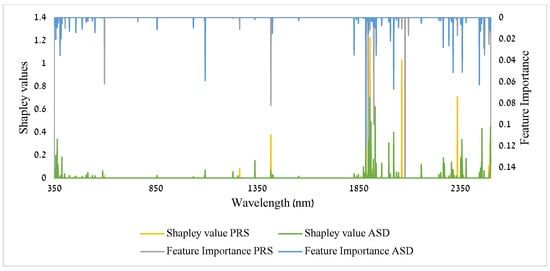
Figure A5.
PRISMA satellite hyperspectral data resampled and tested with our model; here are the Shapley values and Feature Importance results compared with the ASD results for our stromatolite and dolomite data.
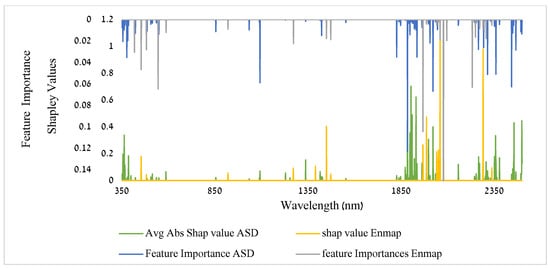
Figure A6.
EnMAP satellite hyperspectral data resampled and tested with our model; here are the Shapley values and Feature Importance results compared with the ASD results for our stromatolite and dolomite data.
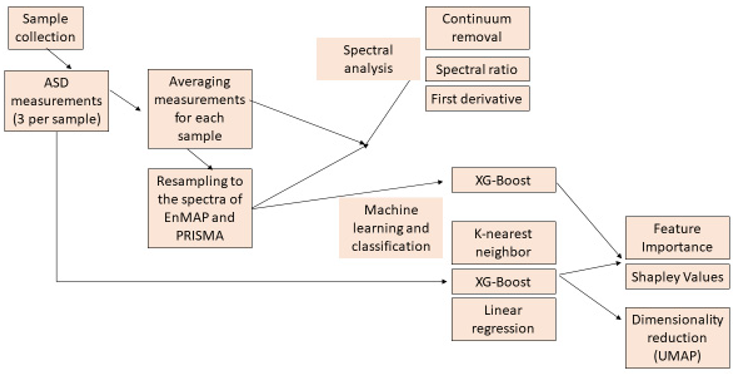
Appendix A.2. Flow Chart
References
- Hofmann, H.J. Stromatolites: Characteristics and Utility. Earth-Sci. Rev. 1973, 9, 339–373. [Google Scholar] [CrossRef]
- Gabriel, N.W.; Papineau, D.; She, Z.; Leider, A.; Fogel, M.L. Organic Diagenesis in Stromatolitic Dolomite and Chert from the Late Palaeoproterozoic McLeary Formation. Precambrian Res. 2021, 354, 106052. [Google Scholar] [CrossRef]
- Lisker, S.; Vaks, A.; Bar-Matthews, M.; Porat, R.; Frumkin, A. Stromatolites in Caves of the Dead Sea Fault Escarpment: Implications to Latest Pleistocene Lake Levels and Tectonic Subsidence. Quat. Sci. Rev. 2009, 28, 80–92. [Google Scholar] [CrossRef]
- Murphy, A.E.; Wieman, S.T.; Gross, J.; Stern, J.C.; Steele, A.; Glamoclija, M. Preservation of Organic Carbon in Dolomitized Cambrian Stromatolites and Implications for Microbial Biosignatures in Diagenetically Replaced Carbonate Rock. Sediment. Geol. 2020, 410, 105777. [Google Scholar] [CrossRef]
- Brown, A.; Walter, M.; Cudahy, T. Short-Wave Infrared Reflectance Investigation of Sites of Paleobiological Interest: Applications for Mars Exploration. Astrobiology 2004, 4, 359–376. [Google Scholar] [CrossRef] [PubMed]
- Clarke, J.D.A.; Stoker, C.R. Searching for Stromatolites: The 3.4Ga Strelley Pool Formation (Pilbara Region, Western Australia) as a Mars Analogue. Icarus 2013, 224, 413–423. [Google Scholar] [CrossRef]
- Thomas, C. Investigating the Subsurface Biosphere of a Hypersaline Environment—The Dead Sea (Levant). Ph.D. Thesis, Université de Genève, Genève, Switzerland, 2015. [Google Scholar]
- Popall, R.M.; Bolhuis, H.; Muyzer, G.; Sánchez-Román, M. Stromatolites as Biosignatures of Atmospheric Oxygenation: Carbonate Biomineralization and UV-C Resilience in a Geitlerinema sp.—Dominated Culture. Front. Microbiol. 2020, 11, 948. [Google Scholar] [CrossRef]
- Sorin, L.; Anton, V.; Miryam, B.-M.; Roi, P.; Amos, F. Late Pleistocene Palaeoclimatic and Palaeoenvironmental Reconstruction of the Dead Sea Area (Israel), Based on Speleothems and Cave Stromatolites. Quat. Sci. Rev. 2010, 29, 1201–1211. [Google Scholar] [CrossRef]
- Monty, C. Phanerozoic Stromatolites: Case Histories; Springer: Berlin/Heidelberg, Germany, 1981; ISBN 978-3-642-67915-5. [Google Scholar]
- Buchbinder, B.; Friedman, G.; Begin, Z. Pleistocene Algal Tufa of Lake Lisan, Dead Sea Area, Israel. Isr. J. Earth Sci. 1974, 23, 131–138. [Google Scholar]
- Van Der Meer, F.D.; Van Der Werff, H.M.A.; Van Ruitenbeek, F.J.A.; Hecker, C.A.; Bakker, W.H.; Noomen, M.F.; Van Der Meijde, M.; Carranza, E.J.M.; Smeth, J.B.D.; Woldai, T. Multi- and Hyperspectral Geologic Remote Sensing: A Review. Int. J. Appl. Earth Obs. Geoinf. 2012, 14, 112–128. [Google Scholar] [CrossRef]
- Bedini, E. The Use of Hyperspectral Remote Sensing for Mineral Exploration: A Review. Jour. Hypers. Rem. Sensg. 2017, 7, 189–211. [Google Scholar] [CrossRef]
- Clark, R.N. Manual of Remote Sensing, Chapter Spectroscopy of Rocks and Minerals, and Principles of Spectroscopy. Remote Sens. Earth Sci. 1999, 3–58. [Google Scholar]
- Murphy, R.J.; Van Kranendonk, M.J.; Kelloway, S.J.; Wainwright, I.E. Complex Patterns in Fossilized Stromatolites Revealed by Hyperspectral Imaging (400–2496 Nm). Geobiology 2016, 14, 419–439. [Google Scholar] [CrossRef]
- Gargaud, M.; Amils, R.; Quintanilla, J.C.; Cleaves, H.J.; Irvine, W.M.; Pinti, D.L.; Viso, M. (Eds.) Encyclopedia of Astrobiology; Springer: Berlin/Heidelberg, Germany, 2011; ISBN 978-3-642-11271-3. [Google Scholar]
- Kose, S.H.; George, S.C.; Lau, I.C. Distinguishing in Situ Stromatolite Biosignatures from Silicification and Dolomitisation Using Short Wave, Visible-near and Thermal Infrared Spectroscopy: A Mars Analogue Study. Vib. Spectrosc. 2016, 87, 67–80. [Google Scholar] [CrossRef]
- Brown, A.J.; Hook, S.J.; Baldridge, A.M.; Crowley, J.K.; Bridges, N.T.; Thomson, B.J.; Marion, G.M.; De Souza Filho, C.R.; Bishop, J.L. Hydrothermal Formation of Clay-Carbonate Alteration Assemblages in the Nili Fossae Region of Mars. Earth Planet. Sci. Lett. 2010, 297, 174–182. [Google Scholar] [CrossRef]
- Bishop, J.L.; Loizeau, D.; McKeown, N.K.; Saper, L.; Dyar, M.D.; Des Marais, D.J.; Parente, M.; Murchie, S.L. What the Ancient Phyllosilicates at Mawrth Vallis Can Tell Us about Possible Habitability on Early Mars. Planet. Space Sci. 2013, 86, 130–149. [Google Scholar] [CrossRef]
- Bibring, J.-P.; Langevin, Y.; Gendrin, A.; Gondet, B.; Poulet, F.; Berthé, M.; Soufflot, A.; Arvidson, R.; Mangold, N.; Mustard, J.; et al. Mars Surface Diversity as Revealed by the OMEGA/Mars Express Observations. Science 2005, 307, 1576–1581. [Google Scholar] [CrossRef]
- Seelos, F.P.; Seelos, K.D.; Murchie, S.L.; Novak, M.A.M.; Hash, C.D.; Morgan, M.F.; Arvidson, R.E.; Aiello, J.; Bibring, J.-P.; Bishop, J.L. The CRISM Investigation in Mars Orbit: Overview, History, and Delivered Data Products. Icarus 2023, 416, 115612. [Google Scholar] [CrossRef]
- Murchie, S.; Arvidson, R.; Bedini, P.; Beisser, K.; Bibring, J.-P.; Bishop, J.; Boldt, J.; Cavender, P.; Choo, T.; Clancy, R.T.; et al. Compact Reconnaissance Imaging Spectrometer for Mars (CRISM) on Mars Reconnaissance Orbiter (MRO). J. Geophys. Res. 2007, 112, 2006JE002682. [Google Scholar] [CrossRef]
- Brown, A.; Walter, M.; Cudahy, T. Hyperspectral Imaging Spectroscopy of a Mars Analogue Environment at the North Pole Dome, Pilbara Craton, Western Australia. Aust. J. Earth Sci. 2005, 52, 353–364. [Google Scholar] [CrossRef]
- Wogsland, B.V.; Minitti, M.E.; Kah, L.C.; Yingst, R.A.; Abbey, W.; Bhartia, R.; Beegle, L.; Bleefeld, B.L.; Cardarelli, E.L.; Conrad, P.G.; et al. Science and science-enabling activities of the SHERLOC and WATSON imaging systems in Jezero Crater, Mars. Earth Space Sci. 2023, 10, e2022EA002544. [Google Scholar] [CrossRef]
- Hickman-Lewis, K.; Cavalazzi, B.; Giannoukos, K.; D’Amico, L.; Vrbaski, S.; Saccomano, G.; Dreossi, D.; Tromba, G.; Foucher, F.; Brownscombe, W.; et al. Advanced Two- and Three-Dimensional Insights into Earth’s Oldest Stromatolites (ca. 3.5 Ga): Prospects for the Search for Life on Mars. Geology 2023, 51, 33–38. [Google Scholar] [CrossRef]
- Storrie-Lombardi, M.C.; Brown, A.J.; Walter, M.R. Remote and In Situ Detection of Environmental and Biological Signatures: Ground-Truthing Hyperspectral Imaging for Planetary Exploration. Hoover, R.B., Levin, G.V., Rozanov, A.Y., Eds.; Society of Photo-Optical Instrumentation Engineers (SPIE): Denver, CO, USA, 2004; p. 270. [Google Scholar]
- Torfstein, A.; Goldstein, S.L.; Kagan, E.J.; Stein, M. Integrated Multi-Site U–Th Chronology of the Last Glacial Lake Lisan. Geochim. Cosmochim. Acta 2013, 104, 210–231. [Google Scholar] [CrossRef]
- Stein, M. The Evolution of Neogene-Quaternary Water-Bodies in the Dead Sea Rift Valley. In Dead Sea Transform Fault System: Reviews; Garfunkel, Z., Ben-Avraham, Z., Kagan, E., Eds.; Springer: Dordrecht, The Netherlands, 2014; pp. 279–316. ISBN 978-94-017-8872-4. [Google Scholar]
- Frumkin, A.; Pe’eri, S.; Zak, I. Development of Banded Terrain in an Active Salt Diapir: Potential Analog to Mars. Geomorphology 2021, 389, 107824. [Google Scholar] [CrossRef]
- Preston, L.J.; Dartnell, L.R. Planetary Habitability: Lessons Learned from Terrestrial Analogues. Int. J. Astrobiol. 2014, 13, 81–98. [Google Scholar] [CrossRef]
- Rubinstein, H.; Abramovich, R.S.; Shikar, A.; Zagai, M.; Nevenzal, H.; Finzi, Y. The 2019 Analog Mars Mission Season at the Desert Mars Analog Ramon Station. In Proceedings of the Conference: 70th International Astronautical Congress (IAC-19), Washington, DC, USA, 21–25 October 2019. [Google Scholar]
- Agnon, A.; Weinberger, R.; Zak, I.; Sneh, A. The Geological Map of Israel, 1:50,000. Sheet 20-I, Sedom. In Vectorial Format of the 1:50,000 Geological Map of Israel; Rosensaft, M., Ed.; Geological Survey of Israel: Jerusalem, Israel, 2006. Available online: https://www.gov.il/he/pages/sdom-map (accessed on 8 April 2025).
- Oren, A.; Gunde-Cimerman, N. Fungal Life in the Dead Sea. In Biology of Marine Fungi; Raghukumar, C., Ed.; Progress in Molecular and Subcellular Biology; Springer: Berlin/Heidelberg, Germany, 2012; Volume 53, pp. 115–132. ISBN 978-3-642-23341-8. [Google Scholar]
- Stein, M.; Agnon, A.; Katz, A.; Starinsky, A. Strontium Isotopes in Discordant Dolomite Bodies of the Judea Group, Dead Sea Basin. Isr. J. Earth Sci. 2002, 51, 219–224. [Google Scholar] [CrossRef]
- Oren, A. The Bioenergetic Basis for the Decrease in Metabolic Diversity at Increasing Salt Concentrations: Implications for the Functioning of Salt Lake Ecosystems. In Saline Lakes; Melack, J.M., Jellison, R., Herbst, D.B., Eds.; Springer: Dordrecht, The Netherlands, 2001; pp. 61–72. ISBN 978-90-481-5995-6. [Google Scholar]
- Ionescu, D.; Siebert, C.; Polerecky, L.; Munwes, Y.Y.; Lott, C.; Häusler, S.; Bižić-Ionescu, M.; Quast, C.; Peplies, J.; Glöckner, F.O.; et al. Microbial and Chemical Characterization of Underwater Fresh Water Springs in the Dead Sea. PLoS ONE 2012, 7, e38319. [Google Scholar] [CrossRef]
- Bodaker, I.; Sharon, I.; Suzuki, M.T.; Feingersch, R.; Shmoish, M.; Andreishcheva, E.; Sogin, M.L.; Rosenberg, M.; Maguire, M.E.; Belkin, S.; et al. Comparative Community Genomics in the Dead Sea: An Increasingly Extreme Environment. ISME J. 2010, 4, 399–407. [Google Scholar] [CrossRef]
- Rhodes, M.E.; Oren, A.; House, C.H. Dynamics and Persistence of Dead Sea Microbial Populations as Shown by High-Throughput Sequencing of rRNA. Appl. Environ. Microbiol. 2012, 78, 2489–2492. [Google Scholar] [CrossRef]
- Jara-Muñoz, J.; Agnon, A.; Fohlmeister, J.; Tomás, S.; Mey, J.; Frank, N.; Schröder, B.; Schröder-Ritzrau, A.; Garcin, Y.; Darvasi, Y.; et al. Unveiling the Transition From Paleolake Lisan to Dead Sea Through the Analysis of Lake Paleoshorelines and Radiometric Dating of Fossil Stromatolites. Geochem. Geophys. Geosystems 2024, 25, e2024GC011541. [Google Scholar] [CrossRef]
- Bartov, Y.; Agnon, A.; Enzel, Y.; Stein, M. Late Quaternary Faulting and Subsidence in the Central Dead Sea Basin. Isr. J. Earth Sci. 2006, 55, 18–31. [Google Scholar] [CrossRef]
- Parent, E.J.; Parent, S.-É.; Parent, L.E. Machine Learning Prediction of Particle-Size Distribution from Infrared Spectra, Methodologies and Soil Features. bioRxiv 2020. [Google Scholar] [CrossRef]
- Francos, N.; Notesco, G.; Ben-Dor, E. Estimation of the Relative Abundance of Quartz to Clay Minerals Using the Visible–Near-Infrared–Shortwave-Infrared Spectral Region. Appl. Spectrosc. 2021, 75, 882–892. [Google Scholar] [CrossRef] [PubMed]
- Francos, N.; Gholizadeh, A.; Demattê, J.A.M.; Ben-Dor, E. Effect of the Internal Soil Standard on the Spectral Assessment of Clay Content. Geoderma 2022, 420, 115873. [Google Scholar] [CrossRef]
- Pelta, R.; Carmon, N.; Ben-Dor, E. A Machine Learning Approach to Detect Crude Oil Contamination in a Real Scenario Using Hyperspectral Remote Sensing. Int. J. Appl. Earth Obs. Geoinf. 2019, 82, 101901. [Google Scholar] [CrossRef]
- Gholizadeh, A.; Saberioon, M.; Ben-Dor, E.; Viscarra Rossel, R.A.; Borůvka, L. Modelling Potentially Toxic Elements in Forest Soils with Vis–NIR Spectra and Learning Algorithms. Environ. Pollut. 2020, 267, 115574. [Google Scholar] [CrossRef]
- Berrar, D. Cross-Validation. In Encyclopedia of Bioinformatics and Computational Biology; Elsevier: Amsterdam, The Netherlands, 2019; pp. 542–545. ISBN 978-0-12-811432-2. [Google Scholar]
- Brownlee, J. XGBoost With Python: Gradient Boosted Trees with XGBoost and Scikit-Learn, v1.10 ed.; Machine Learning Mastery: San Francisco, CA, USA, 2016. [Google Scholar]
- McInnes, L.; Healy, J.; Melville, J. UMAP: Uniform Manifold Approximation and Projection for Dimension Reduction. arXiv 2018, arXiv:1802.03426. [Google Scholar]
- Fan, J.; Wang, X.; Wu, L.; Zhou, H.; Zhang, F.; Yu, X.; Lu, X.; Xiang, Y. Comparison of Support Vector Machine and Extreme Gradient Boosting for Predicting Daily Global Solar Radiation Using Temperature and Precipitation in Humid Subtropical Climates: A Case Study in China. Energy Convers. Manag. 2018, 164, 102–111. [Google Scholar] [CrossRef]
- Hart, S. Shapley Value. In Game Theory; Eatwell, J., Milgate, M., Newman, P., Eds.; Palgrave Macmillan UK: London, UK, 1989; pp. 210–221. ISBN 978-1-349-20181-5. [Google Scholar]
- Classification: ROC and AUC|Machine Learning. Available online: https://developers.google.com/machine-learning/crash-course/classification/roc-and-auc (accessed on 7 April 2025).
- Harsanyi, J.C.; Chang, C.-I. Hyperspectral Image Classification and Dimensionality Reduction: An Orthogonal Subspace Projection Approach. IEEE Trans. Geosci. Remote Sens. 1994, 32, 779–785. [Google Scholar] [CrossRef]
- Ben-Dor, E.; Levin, N.; Singer, A.; Karnieli, A.; Braun, O.; Kidron, G.J. Quantitative Mapping of the Soil Rubification Process on Sand Dunes Using an Airborne Hyperspectral Sensor. Geoderma 2006, 131, 1–21. [Google Scholar] [CrossRef]
- Ben-Dor, E. The Reflectance Spectra of Organic Matter in the Visible Near-Infrared and Short Wave Infrared Region (400–2500 Nm) during a Controlled Decomposition Process. Remote Sens. Environ. 1997, 61, 1–15. [Google Scholar] [CrossRef]
- Levin, N.; Lugassi, R.; Ramon, U.; Braun, O.; Ben-Dor, E. Remote Sensing as a Tool for Monitoring Plasticulture in Agricultural Landscapes. Int. J. Remote Sens. 2007, 28, 183–202. [Google Scholar] [CrossRef]
- Guanter, L.; Kaufmann, H.; Segl, K.; Foerster, S.; Rogass, C.; Chabrillat, S.; Kuester, T.; Hollstein, A.; Rossner, G.; Chlebek, C. The EnMAP Spaceborne Imaging Spectroscopy Mission for Earth Observation. Remote Sens. 2015, 7, 8830–8857. [Google Scholar] [CrossRef]
- Cogliati, S.; Sarti, F.; Chiarantini, L.; Cosi, M.; Lorusso, R.; Lopinto, E.; Miglietta, F.; Genesio, L.; Guanter, L.; Damm, A. The PRISMA Imaging Spectroscopy Mission: Overview and First Performance Analysis. Remote Sens. Environ. 2021, 262, 112499. [Google Scholar] [CrossRef]
- Thiele, S.T.; Bnoulkacem, Z.; Lorenz, S.; Bordenave, A.; Menegoni, N.; Madriz, Y.; Dujoncquoy, E.; Gloaguen, R.; Kenter, J. Mineralogical Mapping with Accurately Corrected Shortwave Infrared Hyperspectral Data Acquired Obliquely from UAVs. Remote Sens. 2021, 14, 5. [Google Scholar] [CrossRef]
- Rozemberczki, B.; Watson, L.; Bayer, P.; Yang, H.-T.; Kiss, O.; Nilsson, S.; Sarkar, R. The Shapley Value in Machine Learning. In Proceedings of the 31st International Joint Conference on Artificial Intelligence and the 25th European Conference on Artificial Intelligence, Vienna, Austria, 23–29 July 2022. [Google Scholar]
- Miller, J.R.; Hare, E.W.; Wu, J. Quantitative Characterization of the Vegetation Red Edge Reflectance 1. An Inverted-Gaussian Reflectance Model. Int. J. Remote Sens. 1990, 11, 1755–1773. [Google Scholar] [CrossRef]
- Horler, D.N.H.; Dockray, M.; Barber, J. The Red Edge of Plant Leaf Reflectance. Int. J. Remote Sens. 1983, 4, 273–288. [Google Scholar] [CrossRef]
- Clevers, J.G.P.W.; Gitelson, A.A. Remote Estimation of Crop and Grass Chlorophyll and Nitrogen Content Using Red-Edge Bands on Sentinel-2 and -3. Int. J. Appl. Earth Obs. Geoinf. 2013, 23, 344–351. [Google Scholar] [CrossRef]
- Kupssinskü, L.S.; Guimarães, T.T.; Cardoso, M.D.B.; Bachi, L.; Zanotta, D.; Estilon De Souza, I.; Falcão, A.X.; Velloso, R.Q.; Cazarin, C.L.; Veronez, M.R.; et al. Hyperspectral Data as a Proxy for Porosity Estimation of Carbonate Rocks. Aust. J. Earth Sci. 2022, 69, 861–875. [Google Scholar] [CrossRef]
- Bhartia, R.; Beegle, L.W.; DeFlores, L.; Abbey, W.; Razzell Hollis, J.; Uckert, K.; Monacelli, B.; Edgett, K.S.; Kennedy, M.R.; Sylvia, M.; et al. Perseverance’s Scanning Habitable Environments with Raman and Luminescence for Organics and Chemicals (SHERLOC) Investigation. Space Sci. Rev. 2021, 217, 58. [Google Scholar] [CrossRef]
- Harner, P.L.; Gilmore, M.S. Visible–near Infrared Spectra of Hydrous Carbonates, with Implications for the Detection of Carbonates in Hyperspectral Data of Mars. Icarus 2015, 250, 204–214. [Google Scholar] [CrossRef]
- Liuzzi, G.; Villanueva, G.L.; Crismani, M.M.J.; Smith, M.D.; Mumma, M.J.; Daerden, F.; Aoki, S.; Vandaele, A.C.; Clancy, R.T.; Erwin, J.; et al. Strong Variability of Martian Water Ice Clouds During Dust Storms Revealed From ExoMars Trace Gas Orbiter/NOMAD. JGR Planets 2020, 125, e2019JE006250. [Google Scholar] [CrossRef]
- CRISM Web Site. Available online: http://crism.jhuapl.edu/science/themes/theme1.php (accessed on 7 April 2025).
Disclaimer/Publisher’s Note: The statements, opinions and data contained in all publications are solely those of the individual author(s) and contributor(s) and not of MDPI and/or the editor(s). MDPI and/or the editor(s) disclaim responsibility for any injury to people or property resulting from any ideas, methods, instructions or products referred to in the content. |
© 2025 by the authors. Licensee MDPI, Basel, Switzerland. This article is an open access article distributed under the terms and conditions of the Creative Commons Attribution (CC BY) license (https://creativecommons.org/licenses/by/4.0/).