Article

Multi-Scenario Land Use and Carbon Storage Assessment in the Yellow River Delta Under Climate Change and Resource Development

1
Shandong Provincial Key Laboratory of Marine Environment and Geological Engineering, Ocean University of China, Qingdao 266100, China
2
Laboratory for Marine Geology, Qingdao Marine Science and Technology Center, Qingdao 266237, China
3
Shandong Institute of Geological Sciences, Jinan 250013, China
4
Department of Civil, Environmental, and Geomatic Engineering, University College London, London WC1E 6BT, UK
*
Author to whom correspondence should be addressed.
Remote Sens. 2025, 17(9), 1603; https://doi.org/10.3390/rs17091603
Submission received: 28 February 2025 / Revised: 27 April 2025 / Accepted: 28 April 2025 / Published: 30 April 2025
(This article belongs to the Special Issue Carbon Sink Pattern and Land Spatial Optimization in Coastal Areas)

Abstract

:
Land use and land cover change (LULCC) is a key driver of carbon storage changes, especially in complex coastal ecosystems such as the Yellow River Delta (YRD), which is jointly influenced by climate change and resource development. The compounded effects of sea-level rise (SLR) and land subsidence (LS) are particularly prominent. This study is the first to integrate the dual impacts of SLR and LS into a unified framework, using three climate scenarios (SSP1–26, SSP2–45, SSP5–85) provided in the Intergovernmental Panel on Climate Change (IPCC) Sixth Assessment Report (AR6), along with LS monitoring data, to comprehensively assess future inundation risks. Building on this, and taking into account land use and ecological protection policies in the YRD, three strategic scenarios—Ecological Protection Scenario (EPS), Natural Development Scenario (NDS), and Economic Growth Scenario (EGS)—are established. The PLUS and InVEST models are used to jointly simulate LULCC and carbon storage changes across these scenarios. Unlike previous studies focusing on single driving factors, this research innovatively develops a dynamic simulation system for LULCC and carbon storage driven by the SLR-LS compound effects, providing scientific guidance for land space development and coastal zone planning in vulnerable coastal areas, while enhancing carbon sink potential. The results of the study show the following: (1) Over the past 30 years, the land use pattern of the YRD has generally extended toward the sea, with land use transitions mainly from grasslands (the largest reduction: 1096.20 km2), wetlands, reservoirs and ponds, and paddy fields to drylands, culture areas, construction lands, salt pans, and tidal flats. (2) Carbon storage in the YRD exhibits significant spatial heterogeneity. Low-carbon storage areas are primarily concentrated in the coastal regions, while high-carbon storage areas are mainly found in grasslands, paddy fields, and woodlands. LULCC, especially the conversion of high carbon storage ecosystems to low carbon storage uses, has resulted in an overall net regional carbon loss of 2.22 × 10⁶ t since 1990. (3) The risk of seawater inundation in the YRD is closely related to LS, particularly under low sea-level scenarios, with LS playing a dominant role in exacerbating this risk. Under the EGS, the region is projected to face severe seawater inundation and carbon storage losses by 2030 and 2060.

1. Introduction

The Intergovernmental Panel on Climate Change (IPCC) Sixth Assessment Report (AR6) predicts that the substantial rise in carbon emissions will cause global temperatures to increase by approximately 1.1 °C above pre-industrial levels, resulting in sea-level rise (SLR) and extreme weather events. These changes present a pressing global challenge in the coming decades [1,2,3]. SLR is anticipated to have widespread and significant impacts on coastal areas worldwide [4,5,6,7,8,9], with low-lying regions like the Yellow River Delta (YRD), one of China’s most important wetland ecosystems, which is facing an even more severe risk of flooding. Under the latest climate scenarios based on Shared Socioeconomic Pathways (SSP), future SLR is expected to worsen the region’s ecological vulnerability, endangering its biodiversity and critical ecosystem services. With China aiming for a carbon peak by 2030 and carbon neutrality by 2060 [10], reducing carbon emissions has become an urgent priority on the global agenda.
In addition to climate change, the YRD is also grappling with the issue of land subsidence (LS), primarily driven by human activities such as oil extraction and excessive groundwater pumping [11,12,13]. LS has emerged as a significant threat to ecological security in the region [14]. Research indicates that the rate of subsidence in the YRD has greatly outpaced the rate of SLR [15]. This subsidence not only exacerbates seawater intrusion and accelerates coastal erosion but also has far-reaching implications for land use and spatial planning. Consequently, finding a balance between resource development and environmental protection, while ensuring sustainable development, is a pressing challenge that must be addressed [12].
Carbon sequestration is the natural process through which ecosystems capture CO2 from the atmosphere, primarily through photosynthesis, thus contributing to the mitigation of global climate change [16]. Carbon storage, as a measurable indicator of sequestration capacity, directly reflects a region’s ability to absorb CO2. Land use and land cover change (LULCC) are pivotal factors influencing shifts in carbon storage [17,18,19], particularly in complex coastal ecosystems such as the YRD, where the interplay of global climate change and resource development activities triggers compounded effects, including SLR and LS. From a theoretical perspective, SLR can inundate coastal areas of the YRD, altering hydrodynamic conditions and the physicochemical properties of soils, thereby affecting vegetation growth and distribution, which directly impacts carbon storage. LS, caused by resource development activities, changes the region’s topography and land use and land cover (LULC) patterns, disrupts the carbon cycling processes of the ecosystem, and affects carbon storage and release. Ultimately, this leads to the spatial redistribution of carbon storage and disrupts the original ecological balance [20,21]. As a result, understanding the effects of SLR and LS on LULC dynamics and carbon sequestration potential in coastal areas is of critical practical importance.
Various methods and models, alongside field surveys, are currently employed to estimate carbon storage and simulate LULCC. Among these, the InVEST (Integrated Valuation of Ecosystem Services and Trade-offs) model has become a widely used tool for assessing ecosystem service values due to its simplicity, high spatial resolution, and broad applicability [22]. Research has demonstrated that the InVEST model effectively estimates potential carbon storage and offers robust spatial analytical capabilities, making it a valuable asset for policy development and environmental management [23,24,25]. Moreover, the InVEST model is frequently integrated with other land use change models, such as the Cellular Automata–Markov (CA–Markov) Model [26,27], the Future Land Use Simulation (FLUS) Model [28,29], the Patch-Generating Land Use Simulation (PLUS) Model [30,31], and the Conversion of Land Use and its Effects at Small Regional Extent (CLUE-S) Model [32,33]. Among these, the coupled PLUS-InVEST model stands out due to its integration of process-driven and statistical methods, offering significant advantages in terms of high simulation accuracy and efficient data processing, making it particularly effective for simulating the complex evolution of multiple land types. With the continuous advancement of cloud computing technologies, represented by Google Earth Engine (GEE), their applications in LULCC and carbon storage analysis have become increasingly widespread, particularly demonstrating significant advantages in processing large-scale datasets and improving computational efficiency [34,35,36]. These technologies not only accelerate the evaluation processes of LULCC and carbon storage but also provide strong support for the spatiotemporal analysis of ecological services such as carbon sequestration.
Existing research primarily focuses on the independent coupling analysis of carbon storage and other ecosystem service indicators in relation to land use change in the YRD [37,38,39]. However, relatively few studies have effectively integrated carbon storage with LULCC, SLR, and LS under real-world scenarios. This gap fails to account for the potential impact of seawater inundation on the accuracy of carbon storage pattern simulations, thereby limiting the comprehensive assessment of carbon sequestration potential in coastal regions. Therefore, the core focus of this study is to establish an integrated analytical framework that combines multi-scenario climate change pathways and resource development trends in the YRD, in order to accurately simulate LULCC processes under the combined effects of SLR and LS, and further predict the spatiotemporal dynamics of carbon storage.
This study is based on three climate change scenarios (SSP1–26, SSP2–45, and SSP5–85) provided by the IPCC AR6, combined with LS monitoring data from the YRD between 2020 and 2024. The study uses an active flooding algorithm to comprehensively predict the risks of SLR- and LS-induced seawater inundation. Furthermore, drawing on land resource planning and ecological protection policies for the YRD, this study sets three strategic scenarios: the Ecological Protection Scenario (EPS), the Natural Development Scenario (NDS), and the Economic Growth Scenario (EGS) for key time nodes in 2030 and 2060 (the carbon peak and carbon neutrality target years). On this basis, land use data from 1990 to 2020, along with natural environment, socio-economic, and locational factors, are combined to simulate the spatiotemporal distribution patterns of LULC in the region using the PLUS model. The InVEST model is further employed to explore the spatiotemporal evolution characteristics of carbon storage in the area. Unlike previous studies, this research is the first to combine the dual effects of SLR and LS as key variables, simulating and predicting LULC and carbon storage changes in the YRD under a multi-scenario framework. This integrated approach not only provides important references for carbon storage assessment based on complex driving mechanisms but also offers technical support for ecological protection, resource development, and sustainable development in the YRD, promoting the integrated management of coastal ecosystems and the coordinated development of land and marine spaces.

2. Study Area and Data

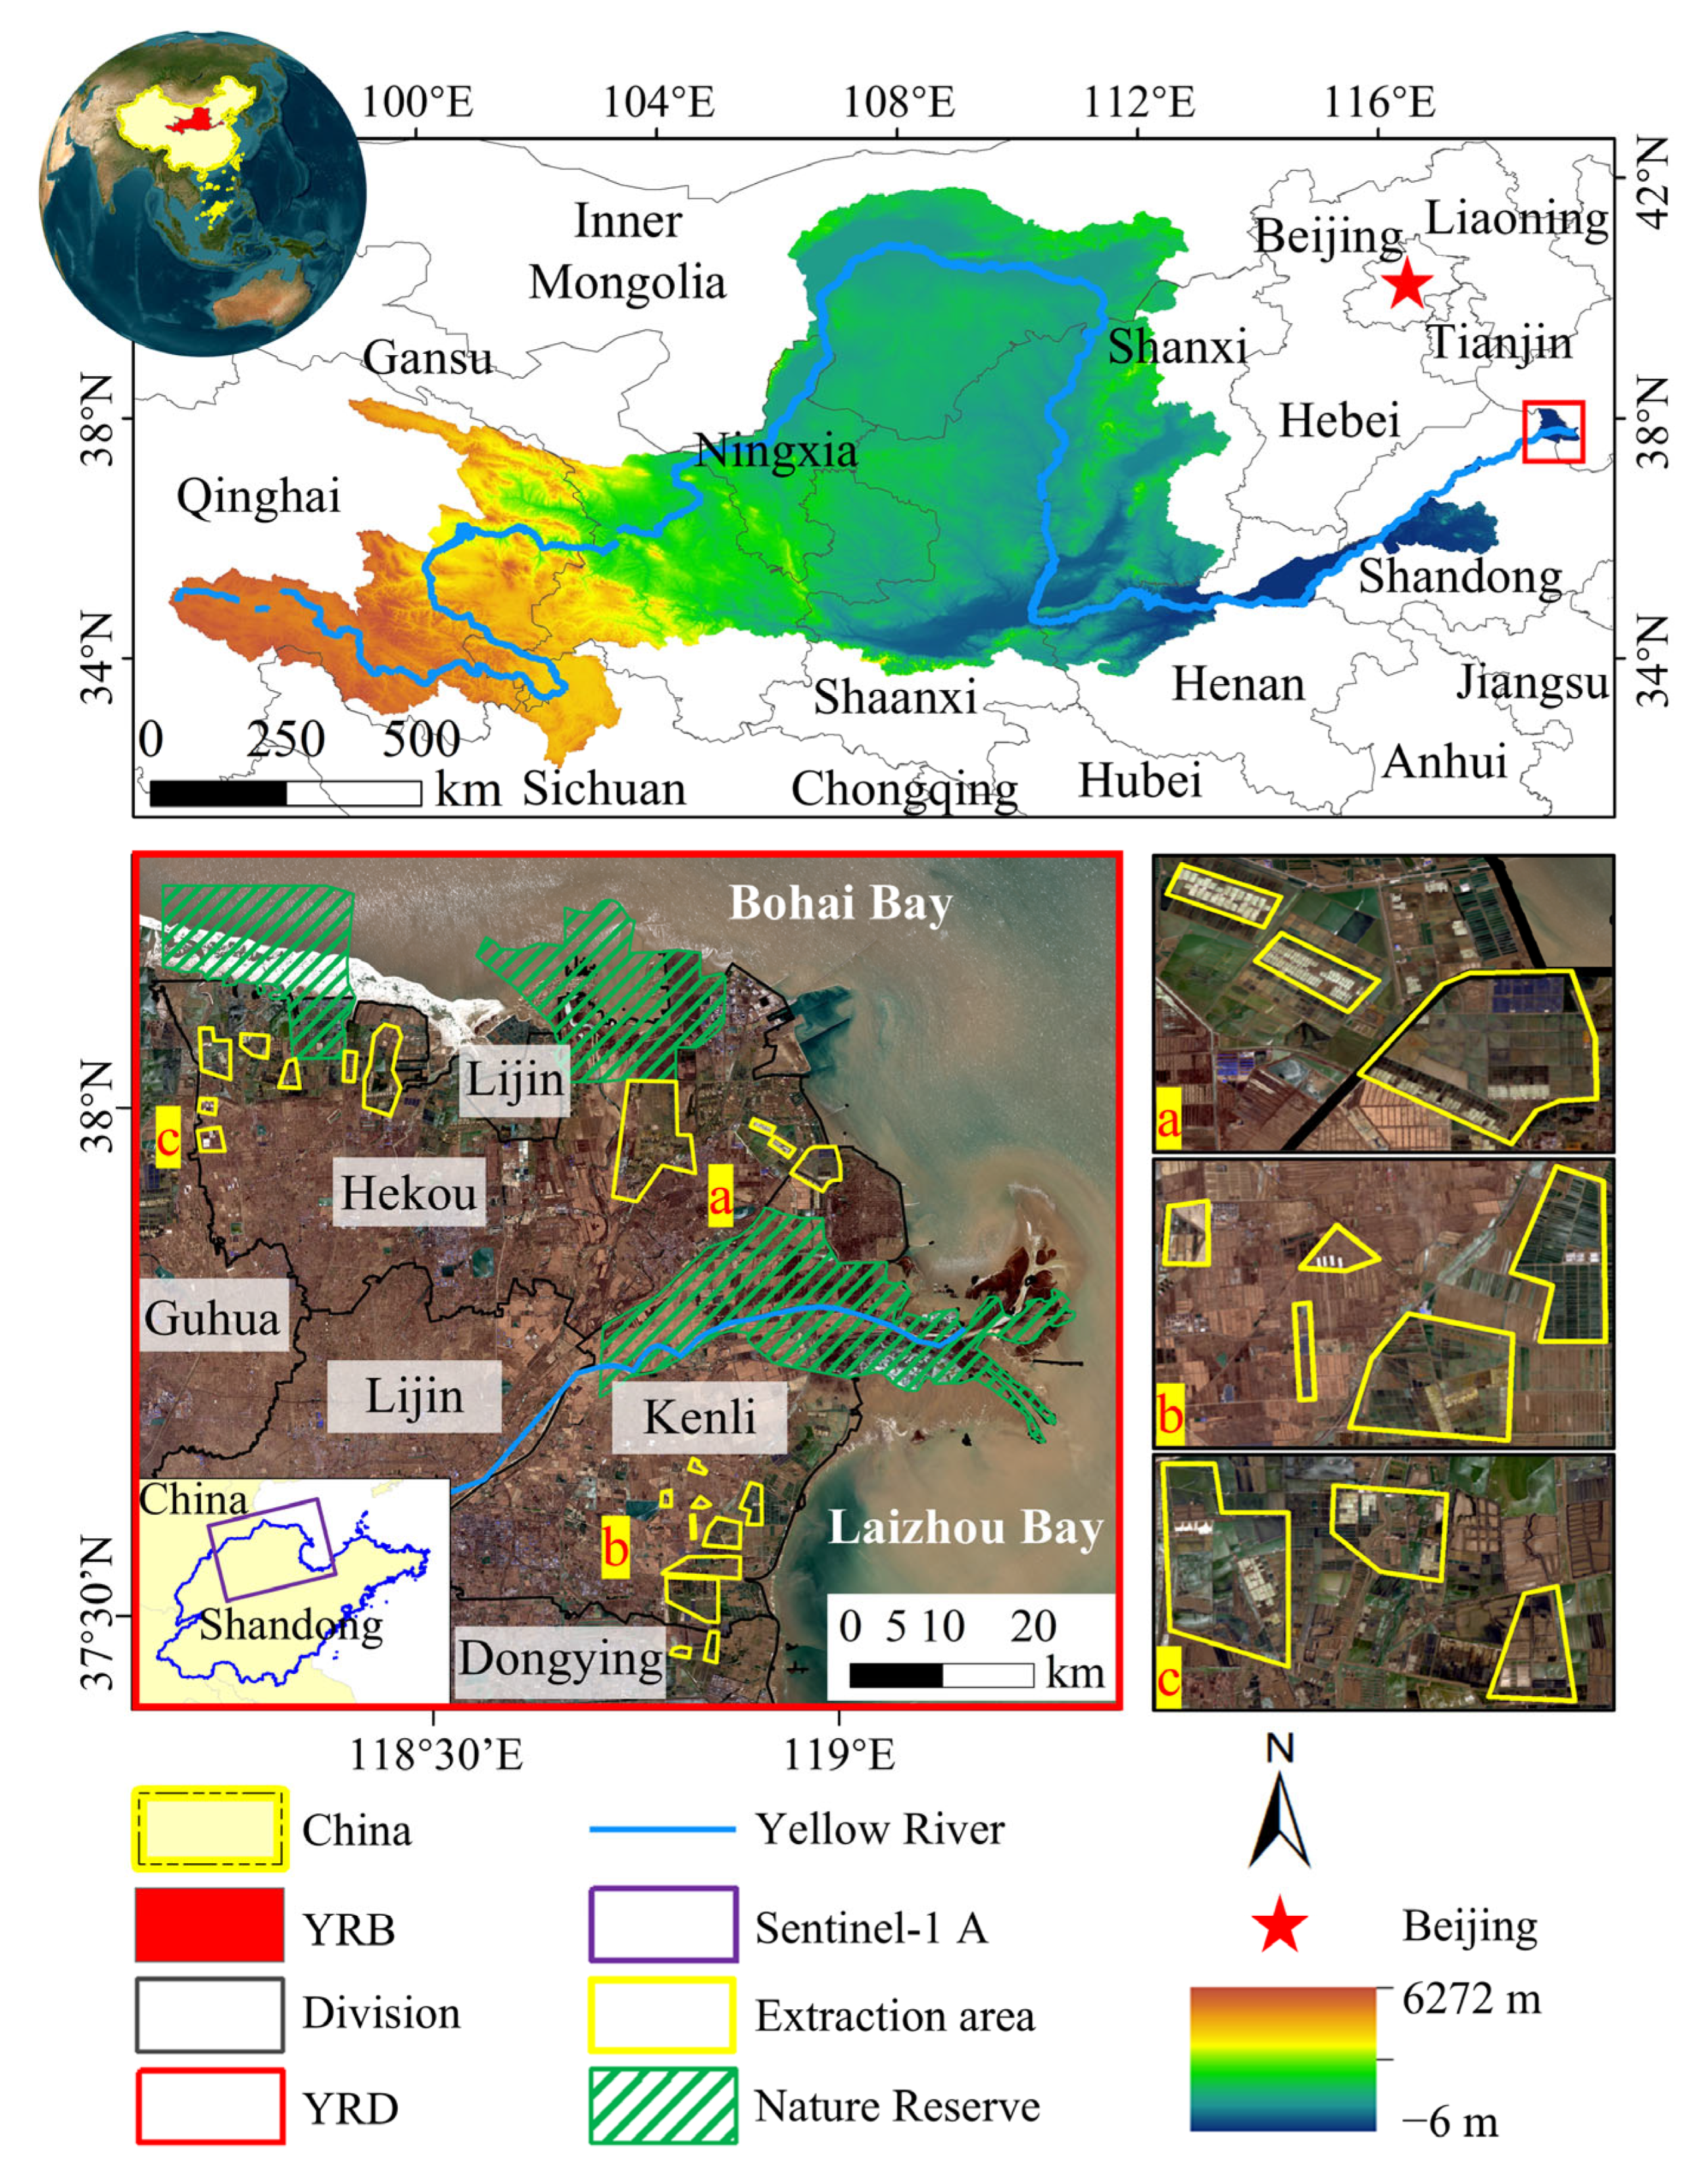
2.1. Study Area Overview

The YRD is situated in Dongying City, Shandong Province, China [40], with geographic coordinates spanning from 118°33′ to 119°21′E and 37°35′ to 38°12′N. It is bordered by Bohai Bay to the north and Laizhou Bay to the east. The YRD, an alluvial plain located in the lower reaches of the Yellow River Basin (YRB) formed by the Yellow River carrying large amounts of sediment into the Bohai depression (Figure 1). The region is characterized by flat terrain, with most areas lying below 6 m in elevation, and is renowned for its extensive wetlands, making it a prime example of a wetland ecosystem. The YRD is home to the Yellow River National Nature Reserve, which encompasses various land use types, including tidal flats, salt pans, and wetlands. The average annual temperature is approximately 12.9 °C, and annual precipitation averages around 576.7 mm, with the majority occurring during the summer and autumn months [41].
Since the Yellow River altered its course and began flowing into the sea in 1855, the region has experienced multiple diversions and shifts [42,43,44], resulting in the formation of a distinct deltaic landscape. The river has carried silt and clay particles, which rapidly accumulated to form land, creating a complex, multi-layered sedimentary system. Over time, these sediments have undergone consolidation and compaction, leading to widespread LS in the area [13]. Additionally, the YRD is located within the Bohai economic circle, an area rich in oil, natural gas, and underground brine resources (Figure 1a–c). In recent years, the surge in oil extraction and other resource development activities has further exacerbated LS in the region [45]. At the same time, global climate change has had a profound impact on the stability of the region’s ecological environment. Therefore, investigating the spatiotemporal patterns and evolving trends of LULC and carbon storage in the YRD is crucial for promoting ecological security, reducing carbon emissions, and ensuring sustainable development in the region.

2.2. Data Sources and Preprocessing

The SLR data utilized in this study are based on the work of Zhang (2022) [46], who integrated low-resolution outputs from seven global climate models under three SSP scenarios (SSP1–26, SSP2–45, and SSP5–85). These outputs were ensemble-averaged and dynamically downscaled using the Regional Ocean Model System (ROMS) to project 21st-century sea-level changes in China’s coastal regions. Taking into account the geographic and environmental characteristics of the YRD, the original datasets were further screened and processed to derive region-specific SLR projections. The estimated SLR values for the YRD in 2030 are 13.74 cm, 15.90 cm, and 15.51 cm, and in 2060 are 16.68 cm, 20.46 cm, and 22.41 cm, corresponding to the three emission scenarios, respectively.
This study used 56 scenes of Sentinel-1A data (VV polarization) covering the study area from 2020 to 2024, provided by the European Space Agency (ESA), including the corresponding precise orbit determination (POD) data, as the primary data source for LS monitoring. In addition, a 30 m × 30 m Digital Elevation Model (DEM) from the Shuttle Radar Topography Mission (SRTM), obtained from the National Aeronautics and Space Administration (NASA), was utilized in this study. The image acquired on 23 May 2020, was chosen as the reference master image, generating a total of 142 interferometric pairs. Interferogram generation, flattening, filtering, coherence calculation, and phase unwrapping were performed using the SARscape module in ENVI 5.3.1 to monitor and analyze LS within the study area. Although the 30 m × 30 m spatial resolution of Sentinel-1A data imposes certain limitations in detecting subtle-scale LS variations, its high temporal frequency offers distinct advantages in monitoring large-scale subsidence trends. This temporal advantage proves invaluable in supporting the identification of recent LS characteristics and in forecasting future subsidence rates in the YRD.
Land use data for this study were obtained from the Institute of Resources and Environmental Science Data Center, Chinese Academy of Sciences, covering the years 1990, 2000, 2010, and 2020, with a spatial resolution of 30 m × 30 m. Based on Landsat satellite imagery and referring to the long-term land use change trends in the YRD, classification system adjustments, polygon modification, and dynamic updates were performed using ArcGIS 10.5 software. The final land use categories were reclassified into the following types: Paddy field (PF), Dryland (DR), Woodland (WO), Grassland (GR), River and canal (RC), Lake (LA), Reservoir and pond (RP), Bottomland (BO), Wetland (WE), Tidal flat (TF), Salt pan (SP), Culture area (CA), Construction land (CL), and Unused land (UL). Although the land use data has certain limitations in terms of temporal and spatial resolution, potentially failing to capture short-term or fine-scale land class changes, its long time span and high classification accuracy still provide a solid foundation for the dynamic evolution analysis of land use in this study. Carbon density data were sourced from the National Science and Technology Infrastructure Platform and further corrected and compiled by referencing studies from other researchers during the same period.
To predict future land use changes in the study area, this study took into account topographical features, hydrological characteristics, and regional development factors. A total of fifteen driving factors were selected, including spatial distribution data for the YRD-protected area, administrative boundaries, roads, and rivers, sourced from the National Geographic Information Resource Directory Service System. Socioeconomic data, such as population density and Gross Domestic Product (GDP), were obtained from the Institute of Resources and Environmental Science Data Center, Chinese Academy of Sciences. Additionally, natural environmental data, including annual average temperature, precipitation, and soil types, were considered. All data were resampled to a consistent spatial resolution of 30 m × 30 m using ArcGIS 10.5 software, with projection to the “WGS_1984_UTM_Zone_50N” coordinate system. While the 30 m × 30 m resolution may have limitations in capturing high-precision features, such as the detailed alignment of roads and rivers or the complex boundaries of ecological protection areas, its consistency and broad spatiotemporal coverage ensure reliable support for the land use change predictions.
The specific sources and details of the data are provided in Table 1.

3. Research Methodology

This study is based on three climate change scenarios (SSP1–26, SSP2–45, and SSP5–85) provided by the IPCC AR6, with a focus on the years 2030 and 2060, which correspond to the carbon peak and carbon neutrality targets. Three strategic scenarios were defined: EPS, NDS, and EGS. Using LS monitoring data from 2020 to 2024 for the YRD, an active flooding algorithm was applied to comprehensively predict the risk of seawater inundation resulting from future SLR and LS. Additionally, land use, natural environmental, socio-economic, and regional data from 1990 to 2020 were incorporated, and the PLUS model was employed to simulate the spatial and temporal distribution of LULCC in the region. Following this, the InVEST model, along with visualization techniques, was used to illustrate the spatiotemporal evolution of carbon storage in the study area. The overall technical framework is shown in Figure 2.

3.1. Comprehensive Prediction of Seawater Inundation Risk

3.1.1. Active Flooding Algorithm

Seawater inundation analysis using grid models can be categorized into two types: passive flooding and active flooding algorithms. Passive flooding, also referred to as rainfall-induced flooding, assumes a uniform distribution of rainfall across the entire area and does not account for the influence of topographical features or regional connectivity on the flow paths of water. In contrast, active flooding, specifically the Seeded Region Growing (SRG) method, incorporates the effects of water flow sources [47]. This approach utilizes either a four-direction or eight-direction expansion algorithm, starting from a flooding source (seed point). The algorithm then calculates the inundated area based on the extent of water flow reach [48,49,50].
In this study, both the temporal variation in the future terrain of the YRD and the projected SLR due to global average sea-level changes were taken into account. The active flooding algorithm was employed, where grid points along the coast of the YRD were selected as “seed points” for the calculation. The water spread was expanded in the direction of flow to the eight neighboring grids. When a grid met the flooding criteria, it was designated as an inundated area and added to the seed collection. If the criteria were not satisfied, the grid was marked as the flooding boundary, and the expansion process was halted. Ultimately, this approach allowed for the construction of the seawater inundation model for the YRD [48,49]. To validate the reliability of the model, a comparative analysis was conducted with data from existing literature. The results indicate that the predicted inundation extent is highly consistent with the findings of Li et al. (2023) [15], confirming the high credibility of the model and its ability to accurately reflect the characteristics of seawater inundation in the YRD. The underlying computational principles of the model are as follows:
I n = D E M + D n + A n S L R n
where I n represents the elevation index. If I n is negative and connected to the sea, the grid is classified as an inundated area. D E M refers to the DEM data provided by NASA, which plays a direct role in determining the calculation results for the inundated area. D n and A n denote the cumulative LS and natural deposition in the target year n , respectively, with the assumption that natural deposition is negligible. Finally, S L R n represents the projected sea-level height after n years.

3.1.2. SBAS-InSAR (Small Baseline Subset-InSAR) LS Monitoring

SBAS-InSAR technology relies on multiple sets of master image interferograms, utilizing high coherence points to reconstruct the time-series deformation data of the study area [51,52]. Initially, N + 1 SAR images covering the study area over the period ( t 0 , …, t N ) are collected. Appropriate spatiotemporal baseline thresholds are then applied to select master images, which are used to generate M interferograms that meet the required conditions: N + 1 / 2 M N N + 1 / 2 . Assuming that SAR images obtained at times t A and t B produce the j -th interferogram, the interferometric phase φ j at the azimuth and slant range coordinates x ,   r can be expressed as:
φ j = φ B x ,   r φ A x , r = 4 π λ d t B ,   x ,   r d t A ,   x ,   r + φ j t x ,   r + φ j a t B ,   t A ,   x ,   r + φ j n x ,   r
where j ranges from 1 to M, and φ B and φ A represent the phase values at times t B and t A , respectively. λ denotes the electromagnetic wave wavelength, while d t B ,   x ,   r and d t A ,   x ,   r are the cumulative displacement values at times t B and t A , relative to the reference time t 0 ( d t 0 ,   x ,   r = 0 ), in the radar Line of Sight (LOS) direction. In the differential interferogram, the residual topographic phase is denoted by φ j t x ,   r . If a high-precision DEM model is utilized during the interferometric process, the topographic phase can be effectively removed, minimizing residual topographic effects, which can then be neglected in the subsequent calculations. φ j a t B ,   t A ,   x ,   r represents the atmospheric delay phase and φ j n x ,   r corresponds to the decoherence noise. The equation can then be further simplified to:
φ j = φ B x ,   r φ A x ,   r = 4 π λ d t B ,   x ,   r d t A ,   x ,   r
Next, the phase can be expressed as the product of the average phase velocity and time:
V j = φ j φ j 1 t j t j 1
Therefore, the phase can be represented in the following manner:
B V = δ φ
where B is an M × N matrix representing each interferogram pair, V is the deformation velocity at each imaging time, and φ is the vector of unknown phase values. When the matrix B is of full rank, the deformation velocity V can be determined using the following formula: V = B T B 1 B T · δ φ . However, when the matrix B is rank-deficient and B T B becomes singular, the generalized inverse of B can be computed using Singular Value Decomposition (SVD), enabling the optimal estimation of deformation parameters [53].
It is important to note that during the SBAS-InSAR processing, orbit refinement and re-flattening serve as critical preprocessing steps. These steps correct satellite orbit errors and eliminate phase interference from flat terrains and topography, providing high signal-to-noise ratio interferometric phase data for displacement calculations, thus preventing systematic errors from affecting the deformation results. In this process, the selection of Ground Control Points (GCPs) is crucial. The selection criteria include avoiding residual topographic fringes and staying away from deformation zones. Typically, GCPs are chosen in areas with wide interferometric fringes, flat terrain, and high coherence. This selection process is somewhat subjective but ensures the acquisition of stable and reliable baseline data. The subsequent inversion process consists of two steps: In the first step, a linear model is used to preliminarily calculate deformation rates and time series, identify low-quality interferometric pairs, and provide initial parameters for optimization. The second step involves the introduction of a nonlinear model and noise suppression (such as atmospheric correction) to refine the displacement time series and generate error maps, quantifying the uncertainty of the results. Through this stepwise collaborative processing, from data quality assurance to nonlinear optimization, the noise resistance and physical reliability of the displacement calculation are significantly improved, ensuring the stability of the subsidence monitoring results.

3.2. PLUS Model for LULCC Simulation

3.2.1. Model Principle

The PLUS model is a patch-level integrated modeling tool designed for the assessment and optimization of land use systems [30]. It effectively integrates the mechanisms of various spatial driving factors with the dynamic evolution processes of geographic units [54], enabling high-precision simulation and projection of land use spatial patterns and their development trends [55]. Although land use change modeling is influenced by multiple uncertainties inherent in natural and socio-economic systems, and the acquisition of certain land use constraints remains challenging, the PLUS model innovatively introduces the Land Expansion Analysis Strategy (LEAS) based on the traditional cellular automata (CA) framework. This enhancement significantly improves the model’s capacity to identify and simulate land use change drivers, allowing for a more accurate representation of regional land use patterns and policy orientations.
The LEAS module computes the expansion and inertia probabilities for each land use type at various time points, using land use data [56]. The specific principle is outlined as follows:
P i , k d x = n = 1 M I h n x = d M
where P i , k d x represents the probability of land type i converting to type k ; x is a vector of multiple driving factors; I · denotes the indicator function within the decision tree set of the random forest algorithm; h n x indicates the predicted category of vector x in the n -th decision tree; and M represents the total number of decision trees.
Building on this, the Cellular Automata Random Seeds (CARS) model simulates land use competition by incorporating multiple random seeds and a threshold reduction mechanism [57]. The underlying principle is as follows:
O P i , k d = 1 , t = P i , k d × Ω i , k t × D k t
where O P i , k d = 1 , t represents the overall probability of land type i converting to type k at time t ; P i , k d is the suitability probability for land type i to develop into type k ; Ω i , k t indicates the domain effect of land type i ; and D k t reflects the impact of future demand on land type k .
In the land use change simulation, PLUS v1.40 was utilized, incorporating a comprehensive set of factors including topography, hydrological characteristics, and regional development dynamics. A total of fifteen driving factors influencing land use changes in the study area were selected. These included natural environmental, socio-economic, and spatial accessibility factors (Figure S1). Based on land use data from 2000 and 2010, the spatial distribution of land use in the YRD in 2020 was simulated and compared with the actual land use data of the same year, resulting in a confusion matrix (Table S1). The results show that the commission errors for unused land, salt pan, and tidal flat were relatively high, reaching 0.69, 0.62, and 0.44, respectively, while the commission error for woodland was the lowest, at only 0.01.
To evaluate the accuracy of land use type simulation, this study introduces the Kappa coefficient and the Figure of Merit (FoM) as evaluation metrics. Relevant studies have shown that when K a p p a > 0.8 and F o M > 0.1 , the simulation results can be considered highly accurate [58]. In this study, the Kappa coefficient is 0.84, indicating that the model exhibits high accuracy in capturing the temporal evolution and directional changes of raster data, effectively reflecting the temporal dynamics of land use types. At the same time, the FoM index is 0.27, further demonstrating the model’s strong simulation capability and spatial recognition precision at the cellular scale. Together, these two indicators suggest that the land use simulation results in this study exhibit strong spatial consistency and robustness, adequately fulfilling the research objectives and analytical requirements.

3.2.2. Parameter Setting

In the land use simulation, the CARS model accounts for both “top-down” influences, such as the demand for different land types, and “bottom-up” effects, which reflect the local interactions that occur during the system’s evolution [59]. The model also integrates key parameters like neighborhood weights and transfer cost matrices to better simulate these dynamics [60,61].
1.
Neighborhood weights
These weights are determined by analyzing historical data and projecting future land demand [30]. The value range for neighborhood weights is between 0 and 1, with higher values indicating a greater expansion capacity for a given land type. This means that land types with higher weights are less likely to be displaced by other types. For this study, neighborhood weights were calculated through dimensionless normalization and experimental adjustments using land use data from 2000 and 2010 [62], as detailed in Table S2. The formula used for this calculation is:
W i = T A i T A m i n T A m a x T A m i n
where W i represents the neighborhood weight of land type i ; T A i is the area change of land type i over the study period; and T A m i n and T A m a x are the minimum and maximum area changes observed for land type i , respectively.
2.
Transfer cost matrix
The transfer cost matrix defines the potential conversion relationships. A matrix value of “1” indicates that conversion between the two land types is possible. Using the land use data from 2000 to 2010, the transfer cost matrix was established as shown in Table S3 for model accuracy validation.

3.3. InVEST Model for Carbon Storage Assessment

The InVEST model [63] is designed to assess the quantity and economic value of ecosystem services across various scenarios. For this study, the “Carbon Storage and Sequestration” module of InVEST version 3.14.2 was utilized to estimate carbon storage in the YRD. This module categorizes carbon storage into four primary pools: aboveground biomass carbon, belowground biomass carbon, soil carbon, and dead organic carbon [64,65]. Using land use classification data for the study area, the average carbon density for each LULC type was computed. The formula for this calculation is as follows:
C i = C i a b o v e + C i b e l o w + C i s o i l + C i d e a d
C t o t a l = i = 1 n C i × S i
where C i represents the carbon density of the i -th LULC type (t/hm2); C i a b o v e , C i b e l o w , C i s o i l , and C i d e a d denote the respective carbon densities for aboveground biomass, belowground biomass, soil organic carbon, and dead organic carbon (t/hm2); C t o t a l is the total carbon storage in the study area (t); S i represents the area of the i -th LULC type (hm2); and n is the total number of LULC types, which in this study ranges from 1 to 14.
The simulation accuracy of the carbon storage module in the InVEST model largely depends on the input data of carbon density for each LULC type. The model assumes that the carbon density of each LULC type remains constant throughout the simulation period, meaning that for areas where no LULC conversion occurs, the carbon storage also remains stable. While this assumption simplifies the carbon cycling process and enhances the model’s efficiency, it also overlooks variations in carbon density within the same LULC type due to factors such as soil texture, vegetation growth, and other natural conditions, as well as the interactions between different carbon pools over time. This simplification could lead to estimation errors at a fine scale, especially in areas with high heterogeneity.
To minimize the uncertainties introduced by this assumption, this study has conducted a thorough optimization of the carbon density data selection and processing. The carbon density data mainly comes from the National Science and Technology Infrastructure (https://www.nesdc.org.cn/, accessed on 27 September 2024) and relevant literature [66]. Additionally, we refer to the InVEST model handbook and extensive field surveys and remote sensing inversion studies by other researchers in similar climate zones [67,68,69,70]. By incorporating the specific environmental characteristics of the YRD, we have systematically corrected and consolidated the carbon density data for different LULC types, ultimately developing a carbon density parameter system more suited to the actual conditions of the study area (Table 2), thus enhancing the representativeness and reliability of the carbon storage assessment.

3.4. Multi-Scenario Setting

Scenario simulations aim to create diverse land use scenarios in order to examine changes in ecosystem services and their interactions, thus offering valuable decision-making support for future land use planning. This study draws upon several strategic documents, including the “Opinions of the Central Committee of the Communist Party of China and the State Council on Fully, Accurately, and Comprehensively Implementing the New Development Concept and Achieving Carbon Peak and Carbon Neutrality”, the “Dongying City Land Spatial Master Plan (2021–2035)”, and the “Yellow River Basin Ecological Protection and High-Quality Development Planning Outline”. It uses three carbon emission scenarios (SSP1–26, SSP2–45, and SSP5–85) from the IPCC AR6 to predict LULC and carbon storage changes in the YRD by 2030 and 2060—key target years for achieving carbon peak and carbon neutrality. The specific scenario settings are outlined as follows [71,72]:
(1)
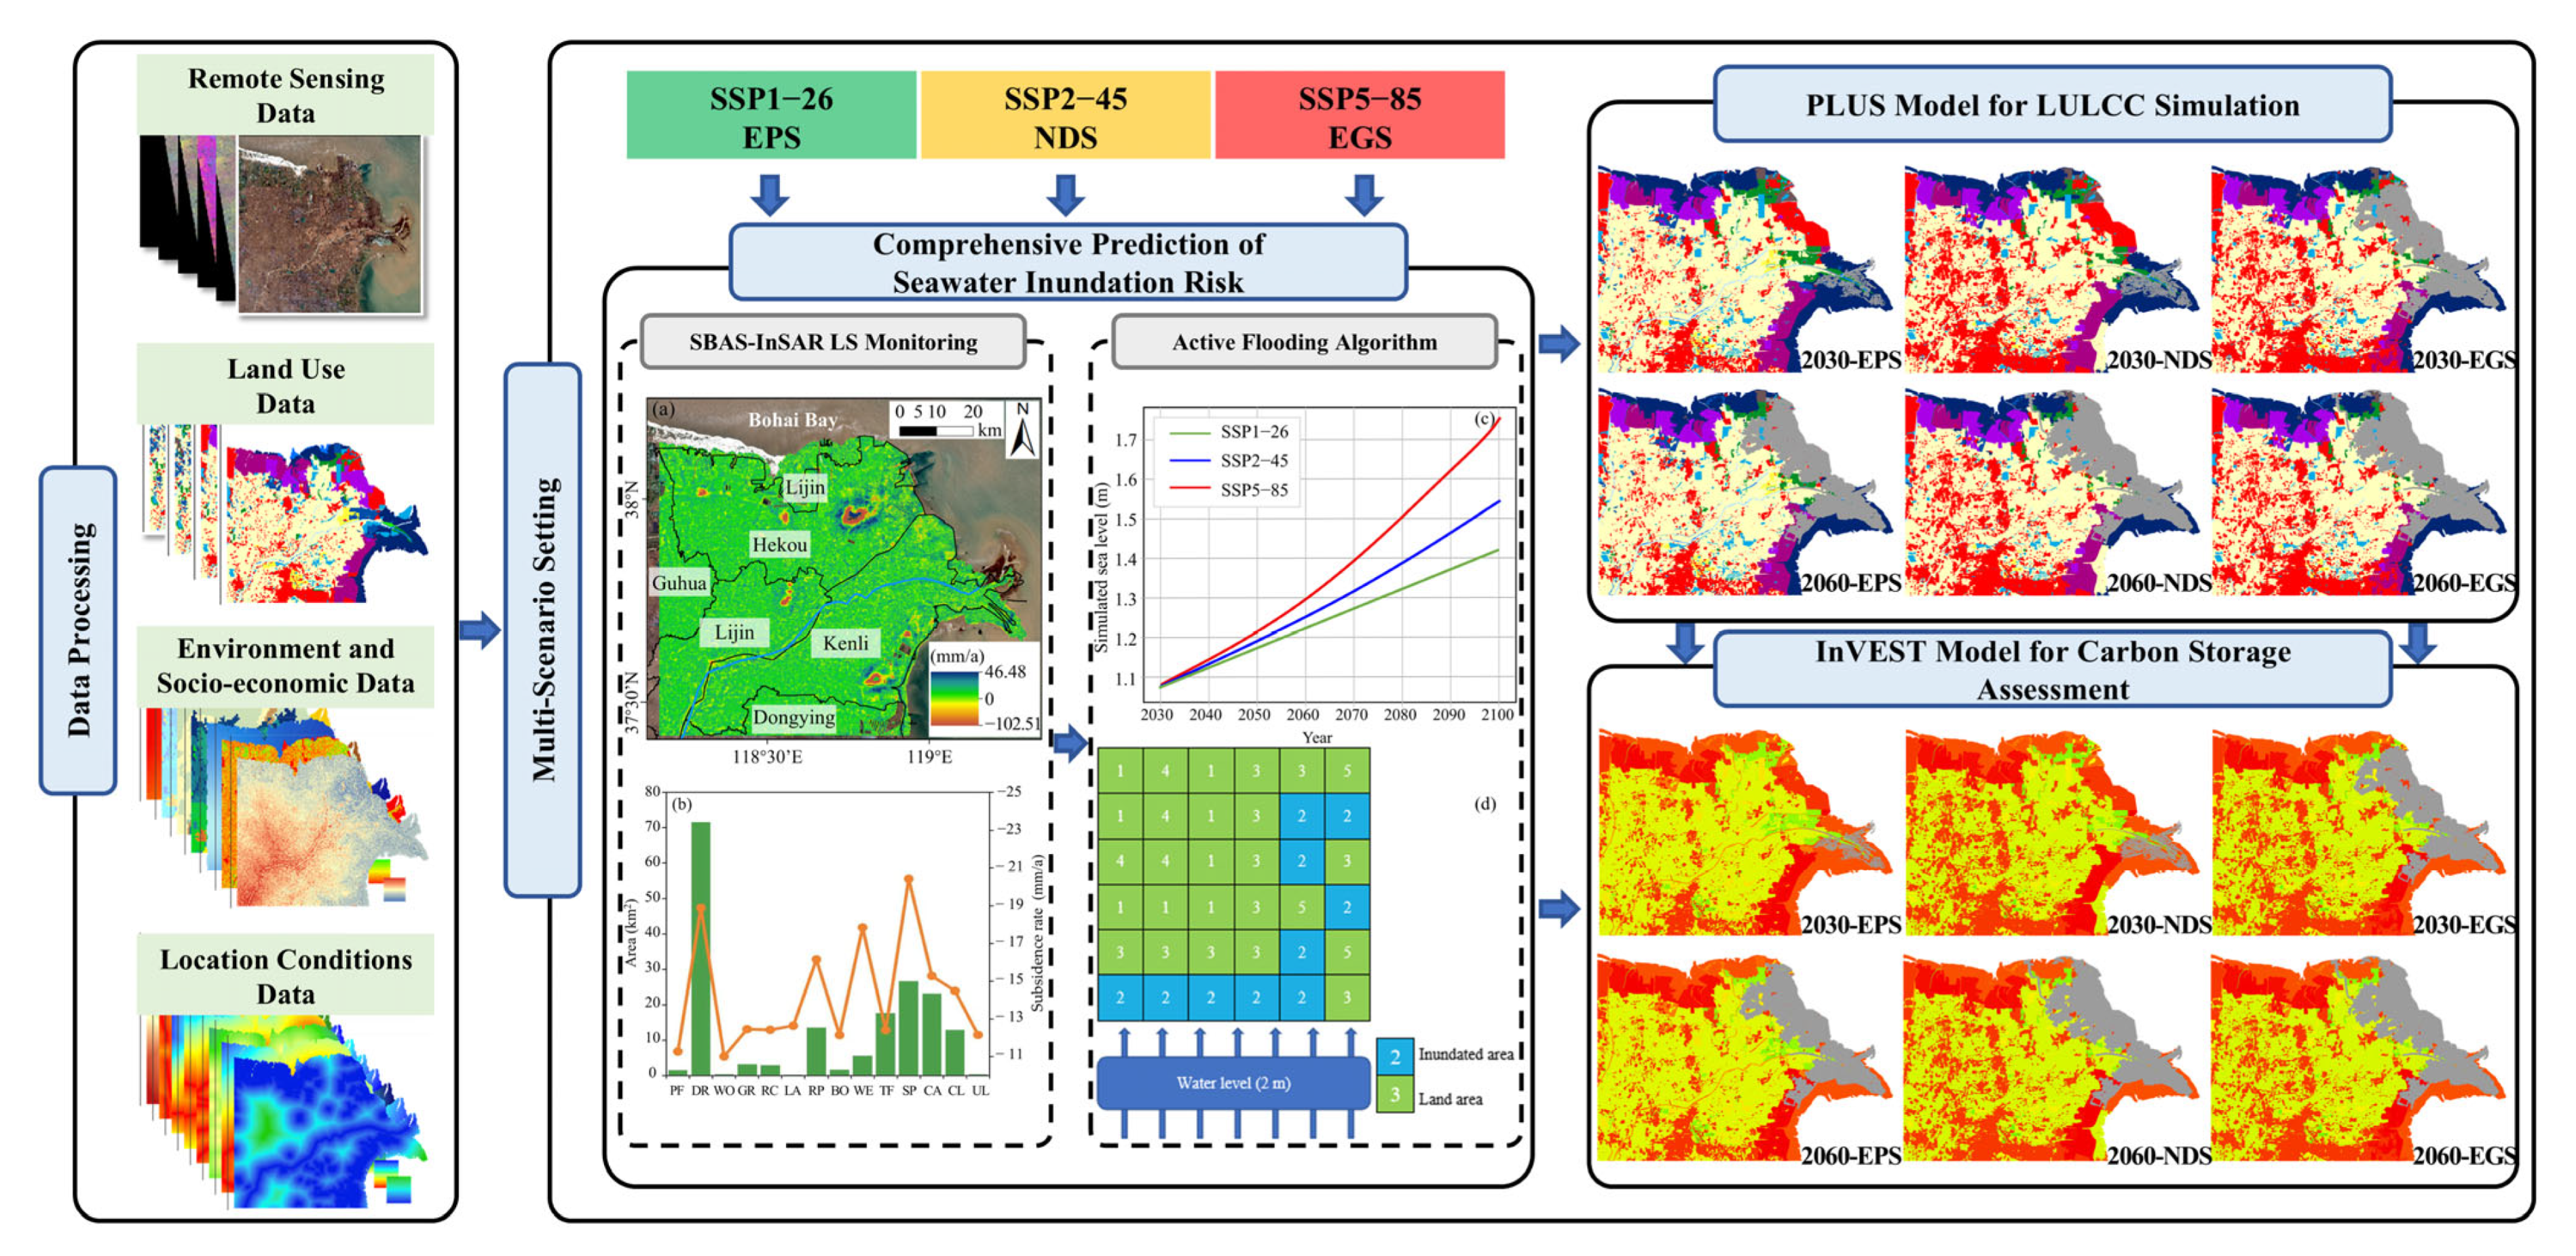
NDS (Natural Development Scenario): This scenario is based on the SSP2–45 pathway, representing a moderate socio-economic development trajectory and emissions model. It assumes that social and economic policies remain stable, with no active interventions to influence future land use changes. LULCC is expected to follow the trends and characteristics observed from 2000 to 2010 (Table S3). The future LULC structure is forecasted based on historical transition probabilities, without any restrictions on land type conversion. Under this scenario, the YRD will maintain its current rate of LS, and SLR is projected to reach 15.90 cm by 2030 and 20.46 cm by 2060.
(2)
EPS (Ecological Protection Scenario): This scenario is based on the SSP1–26 pathway, which represents a sustainable, green development trajectory characterized by low levels of socio-economic development and emissions. Aligned with the national “dual carbon” targets and the Paris Agreement, this scenario emphasizes the limitation of carbon emissions. The principle of ecological priority is central to this scenario, imposing strict restrictions on the conversion of woodlands and water bodies (including rivers, lakes, reservoirs and ponds, tidal flats, and wetlands) into construction lands, cultivated land (paddy fields, drylands), or unused lands. However, other land types may be converted to woodlands, grasslands, or water bodies (Table S4). In this scenario, ecological nodes are also protected. As a result, the LS rate is expected to decrease to 50% of its current rate, and SLR is projected to reach 13.74 cm by 2030 and 16.68 cm by 2060 under this climate model.
(3)
EGS (Economic Growth Scenario): This scenario is based on the SSP5–85 pathway, representing a model of the highest socio-economic development and emissions. In this scenario, the primary focus is on regional economic growth and infrastructure development, with no policy interventions to limit land use changes. Given the current trends in land use transitions and urban expansion, the likelihood of converting other land types into construction lands is increased, while the reverse conversion of construction lands is heavily restricted (Table S5). Under this scenario, the LS rate in the study area is expected to rise to 150% of its current level. The impact of carbon emissions on SLR will be most pronounced, with a projected SLR of 15.51 cm by 2030 and 22.41 cm by 2060.

4. Results and Discussion

4.1. LULCC Characteristics from 1990 to 2020

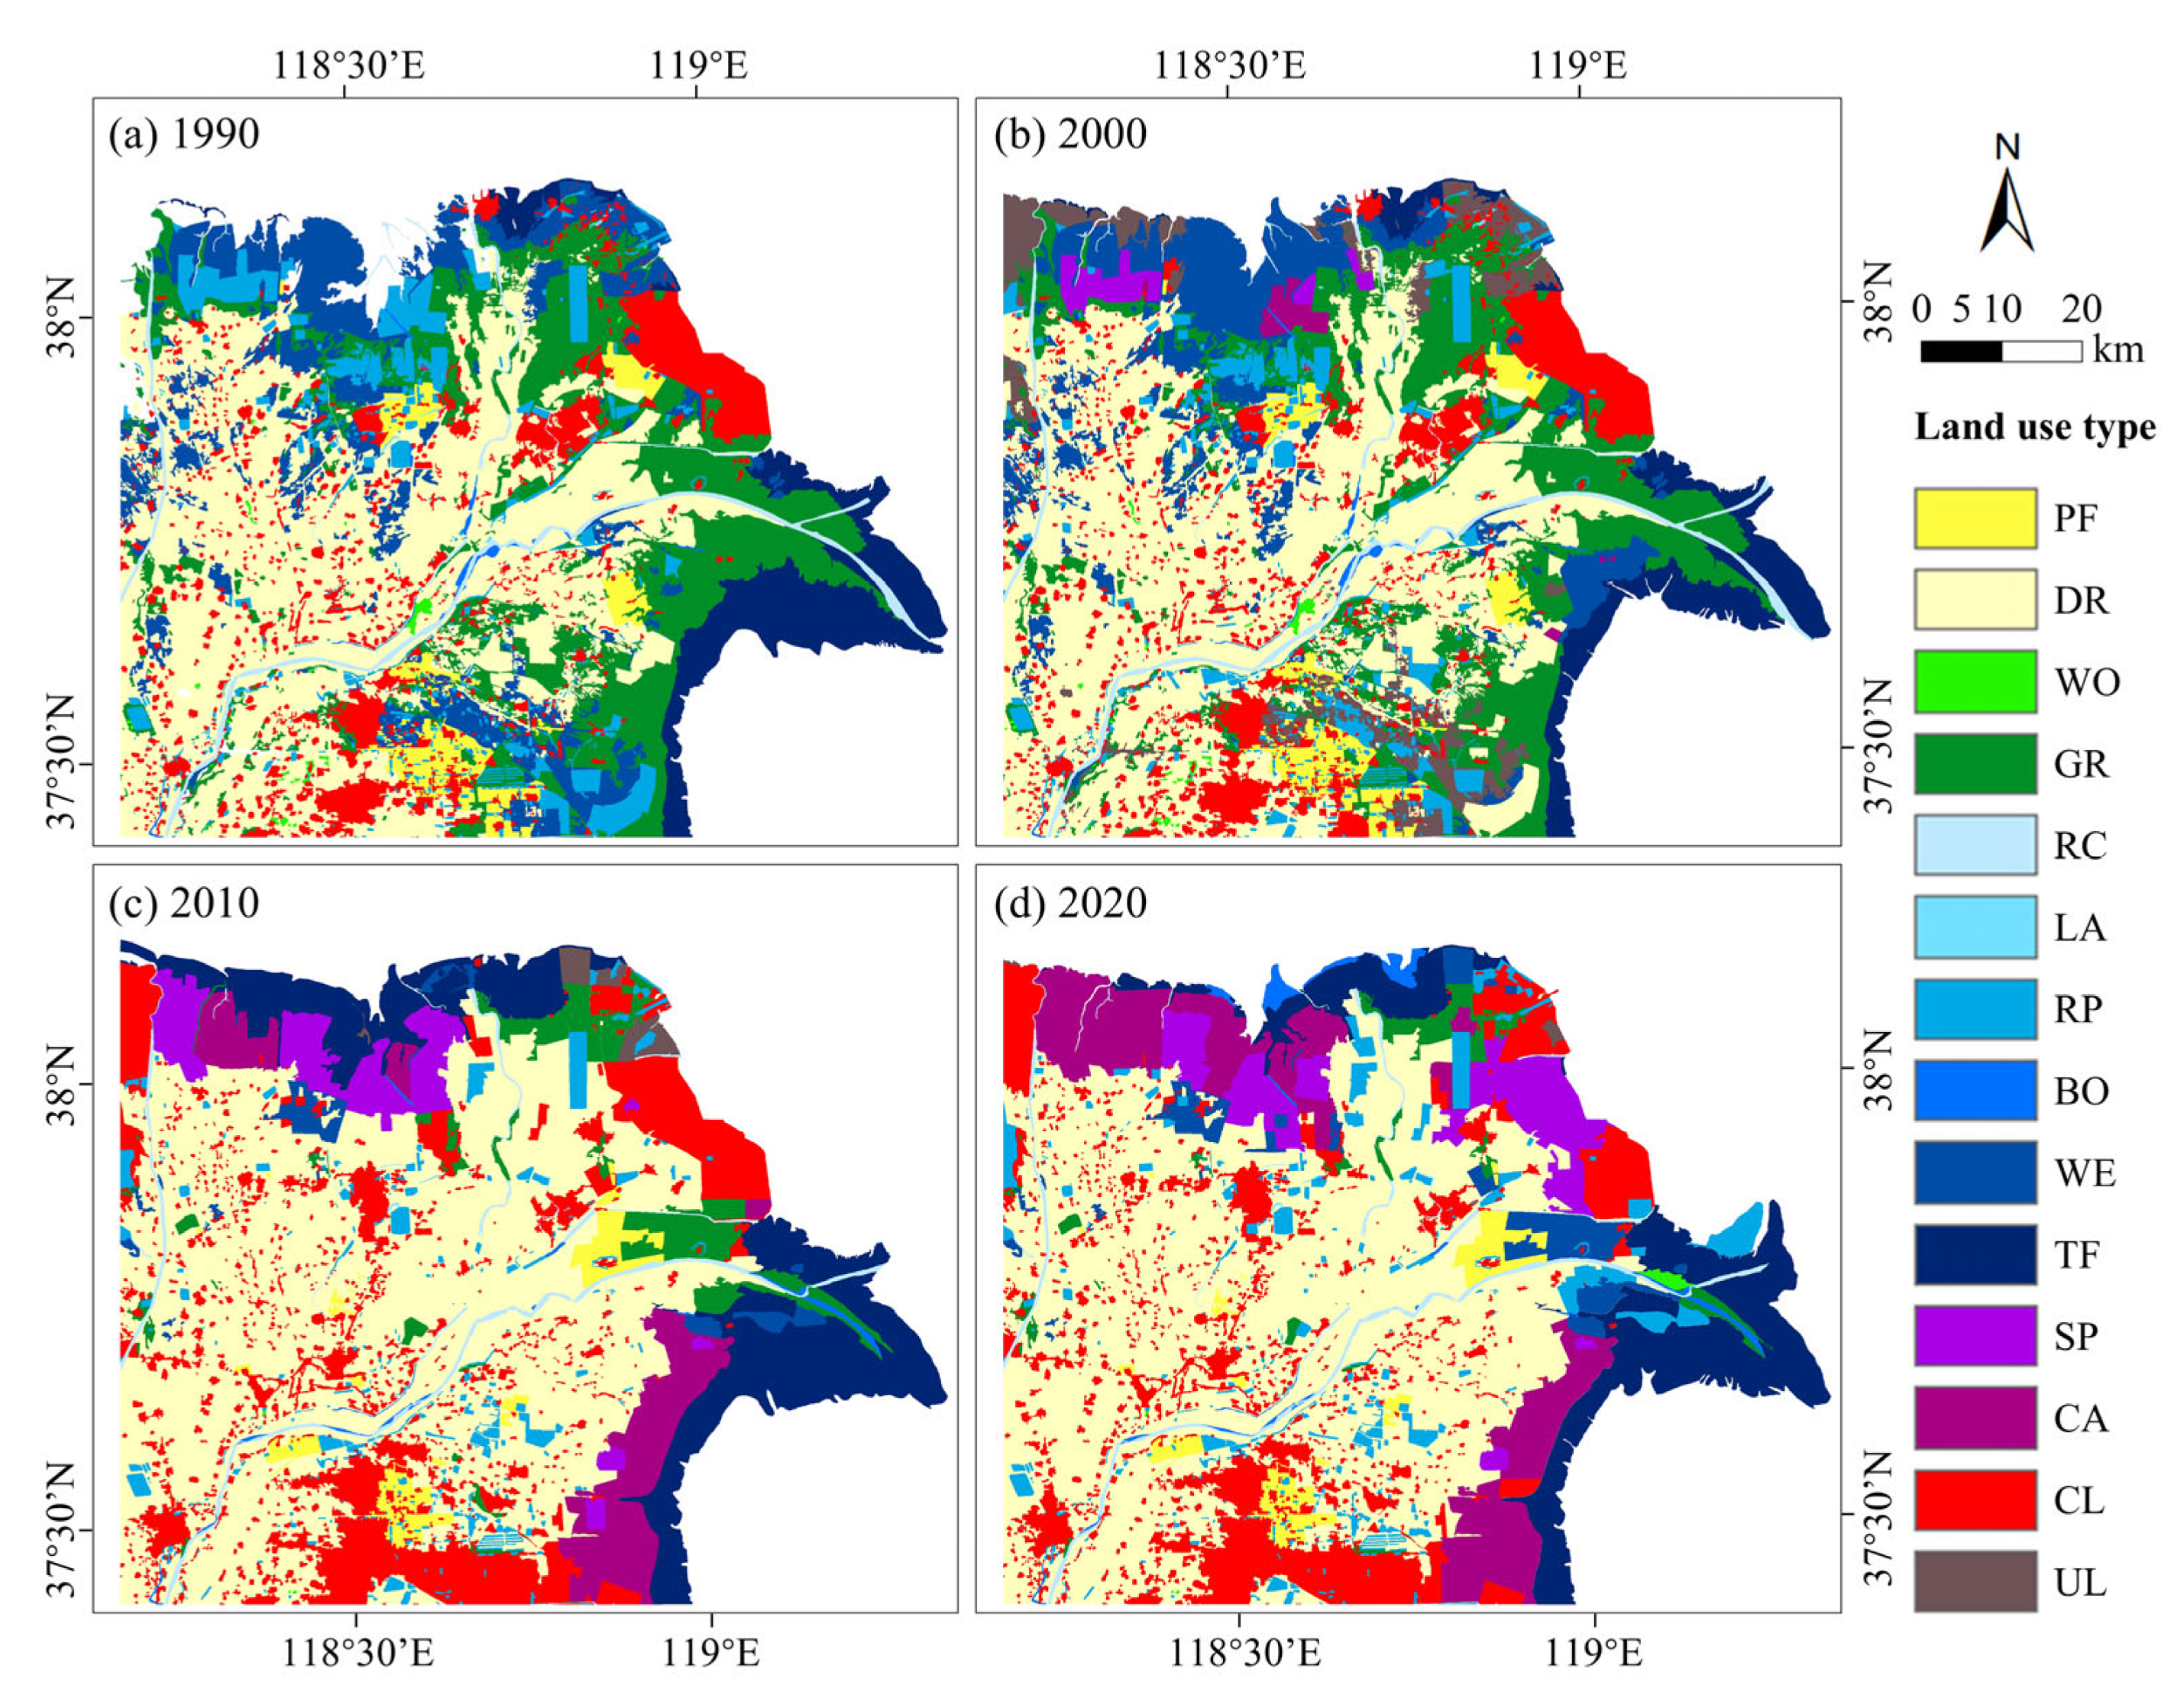
4.1.1. Spatiotemporal Evolution of LULC

Using land use datasets from 1990, 2000, 2010, and 2020, and considering the long-term trends in land use change within the YRD, this study reclassified the land use types of the study area into 14 distinct categories. The reclassified spatial distribution and area statistics for each land type are presented in Figure 3 and Figure 4. The findings reveal that between 1990 and 2020, the land use pattern in the YRD exhibited a general trend of expansion toward the sea (Figure 3a–d). The total land area of the study region increased slightly, from 6269.13 km2 in 1990 to 6276.70 km2 in 2020. The land use distribution within the region is notably varied, with dryland being the dominant land type, primarily located in the inland areas farther from the coast. Over the past 30 years, the dryland area has generally expanded, with a marked increase observed between 2000 and 2010 (Figure 4b). The proportion of dryland within the total area of the study region ranged from 36.69% to 47.99% (Figure 4c), with notable growth in the northern and eastern parts of the region.
Since 2000, the development of culture areas and salt pans in the YRD has accelerated, progressively extending inland (Figure 4a,b). At the same time, areas of construction lands and tidal flats have also increased (Figure 4d). Over the past 30 years, the areas of culture areas, salt pans, construction lands, and tidal flats grew by 9.16%, 4.89%, 5.08%, and 2.98%, respectively. The most significant reduction, however, was observed in grassland areas (Figure 4d), which declined from 18.67% in 1990 to just 1.76% in 2020 (Figure 4c). Additionally, wetlands and unused lands experienced substantial reductions, with their areas decreasing by 579.85 km2 and 196.94 km2, respectively, over the 30-year period (Figure 4d). Other land types, including reservoirs and ponds, paddy fields, woodlands, rivers, lakes, and bottomlands, exhibited relatively stable area changes, with some fluctuations, but the overall change in area was minimal (Figure 4d).
Overall, while the spatial distribution pattern of land use in the YRD remained relatively consistent between 1990 and 2000, and again between 2010 and 2020 (Figure 3), significant changes in the area of various land types were observed over the past 30 years. These changes were primarily characterized by increases in drylands, culture areas, construction lands, salt pans, and tidal flats, alongside declines in grasslands, wetlands, and unused lands. Notably, the most substantial land use changes occurred between 2000 and 2010.
A spatial comparison of the land use reclassification results in the YRD from 1990 to 2020 reveals a continuous increase in land development intensity, with the most notable expansions occurring in drylands, culture areas, and construction lands. Since 2000, land use in the region has undergone a rapid transition from traditional agriculture to an aquaculture-dominated structure, particularly evident in areas such as Hekou, Lijin, and Kenli. The urban expansion trends in the northern coastal zone and the western part of the Dongying New District align closely with the port and logistics-oriented industrial development advocated by the “Development Plan for the Efficient Eco-Economic Zone of the Yellow River Delta”. Since the implementation of the Water and Sediment Regulation Scheme (WSRS) in 2002, the expansion of tidal flats in the YRD has created favorable geomorphic conditions for coastal wetland restoration [73,74]. However, over the same period, grasslands have significantly declined (by approximately 17%), particularly in inland regions subject to intensive agricultural expansion. This indicates ongoing ecological degradation caused by human activities, potentially undermining regional carbon sequestration capacity and ecosystem services [14]. The concurrent reduction in wetlands and unused lands is also concerning: the degradation of wetlands, as key ecological barriers, may compromise essential functions such as water purification and flood regulation; meanwhile, the decline in unused lands suggests that the region is entering a stage of high-intensity land exploitation, further exacerbating land resource pressures. From a global perspective, LULCC has been identified as a core issue by both the International Geosphere–Biosphere Programme (IGBP) and the International Human Dimensions Programme on Global Environmental Change (IHDP). The YRD’s land transformation—characterized by the expansion of drylands and construction lands alongside the degradation of grasslands and wetlands—mirrors the developmental trends observed in many coastal regions worldwide, reflecting the pervasive and systemic impacts of human activities on ecosystems.
Under the influence of policy interventions, land use in the region exhibits distinct spatial heterogeneity. In the YRD ecological zone, the implementation of the “Regulations on the National Nature Reserve of the Yellow River Delta in Shandong Province” led to an increase in woodlands between 2010 and 2020, highlighting the positive effects of conservation policies in limiting development and promoting ecological recovery. In contrast, areas such as the Dongying Port Economic Development Area have largely completed the conversion of unused lands into construction lands, demonstrating the dominant role of policy planning in shaping land use patterns. The land use disparities arising from ecological sensitivity and policy zoning provide a spatial basis for implementing differentiated control and management strategies. Historical evidence underscores the significant guiding role of policy in LULCC processes—for instance, coastal aquaculture rapidly expanded following policy reforms after the 1980s, whereas recent ecological civilization initiatives have strengthened constraints on ecological function zones. Looking ahead, it is essential to establish a coordinated mechanism integrating land management and ecological restoration, reinforce controls on construction land in ecologically sensitive areas, promote exemplary restoration models such as “retreating aquaculture for tidal flat restoration” and “ecological water replenishment”, and incorporate scenario-based tools—such as coupled climate-land use simulations—to enhance the adaptability and resilience assessments of spatial planning. These strategies can provide scientific support for harmonizing regional ecological protection with resource development.

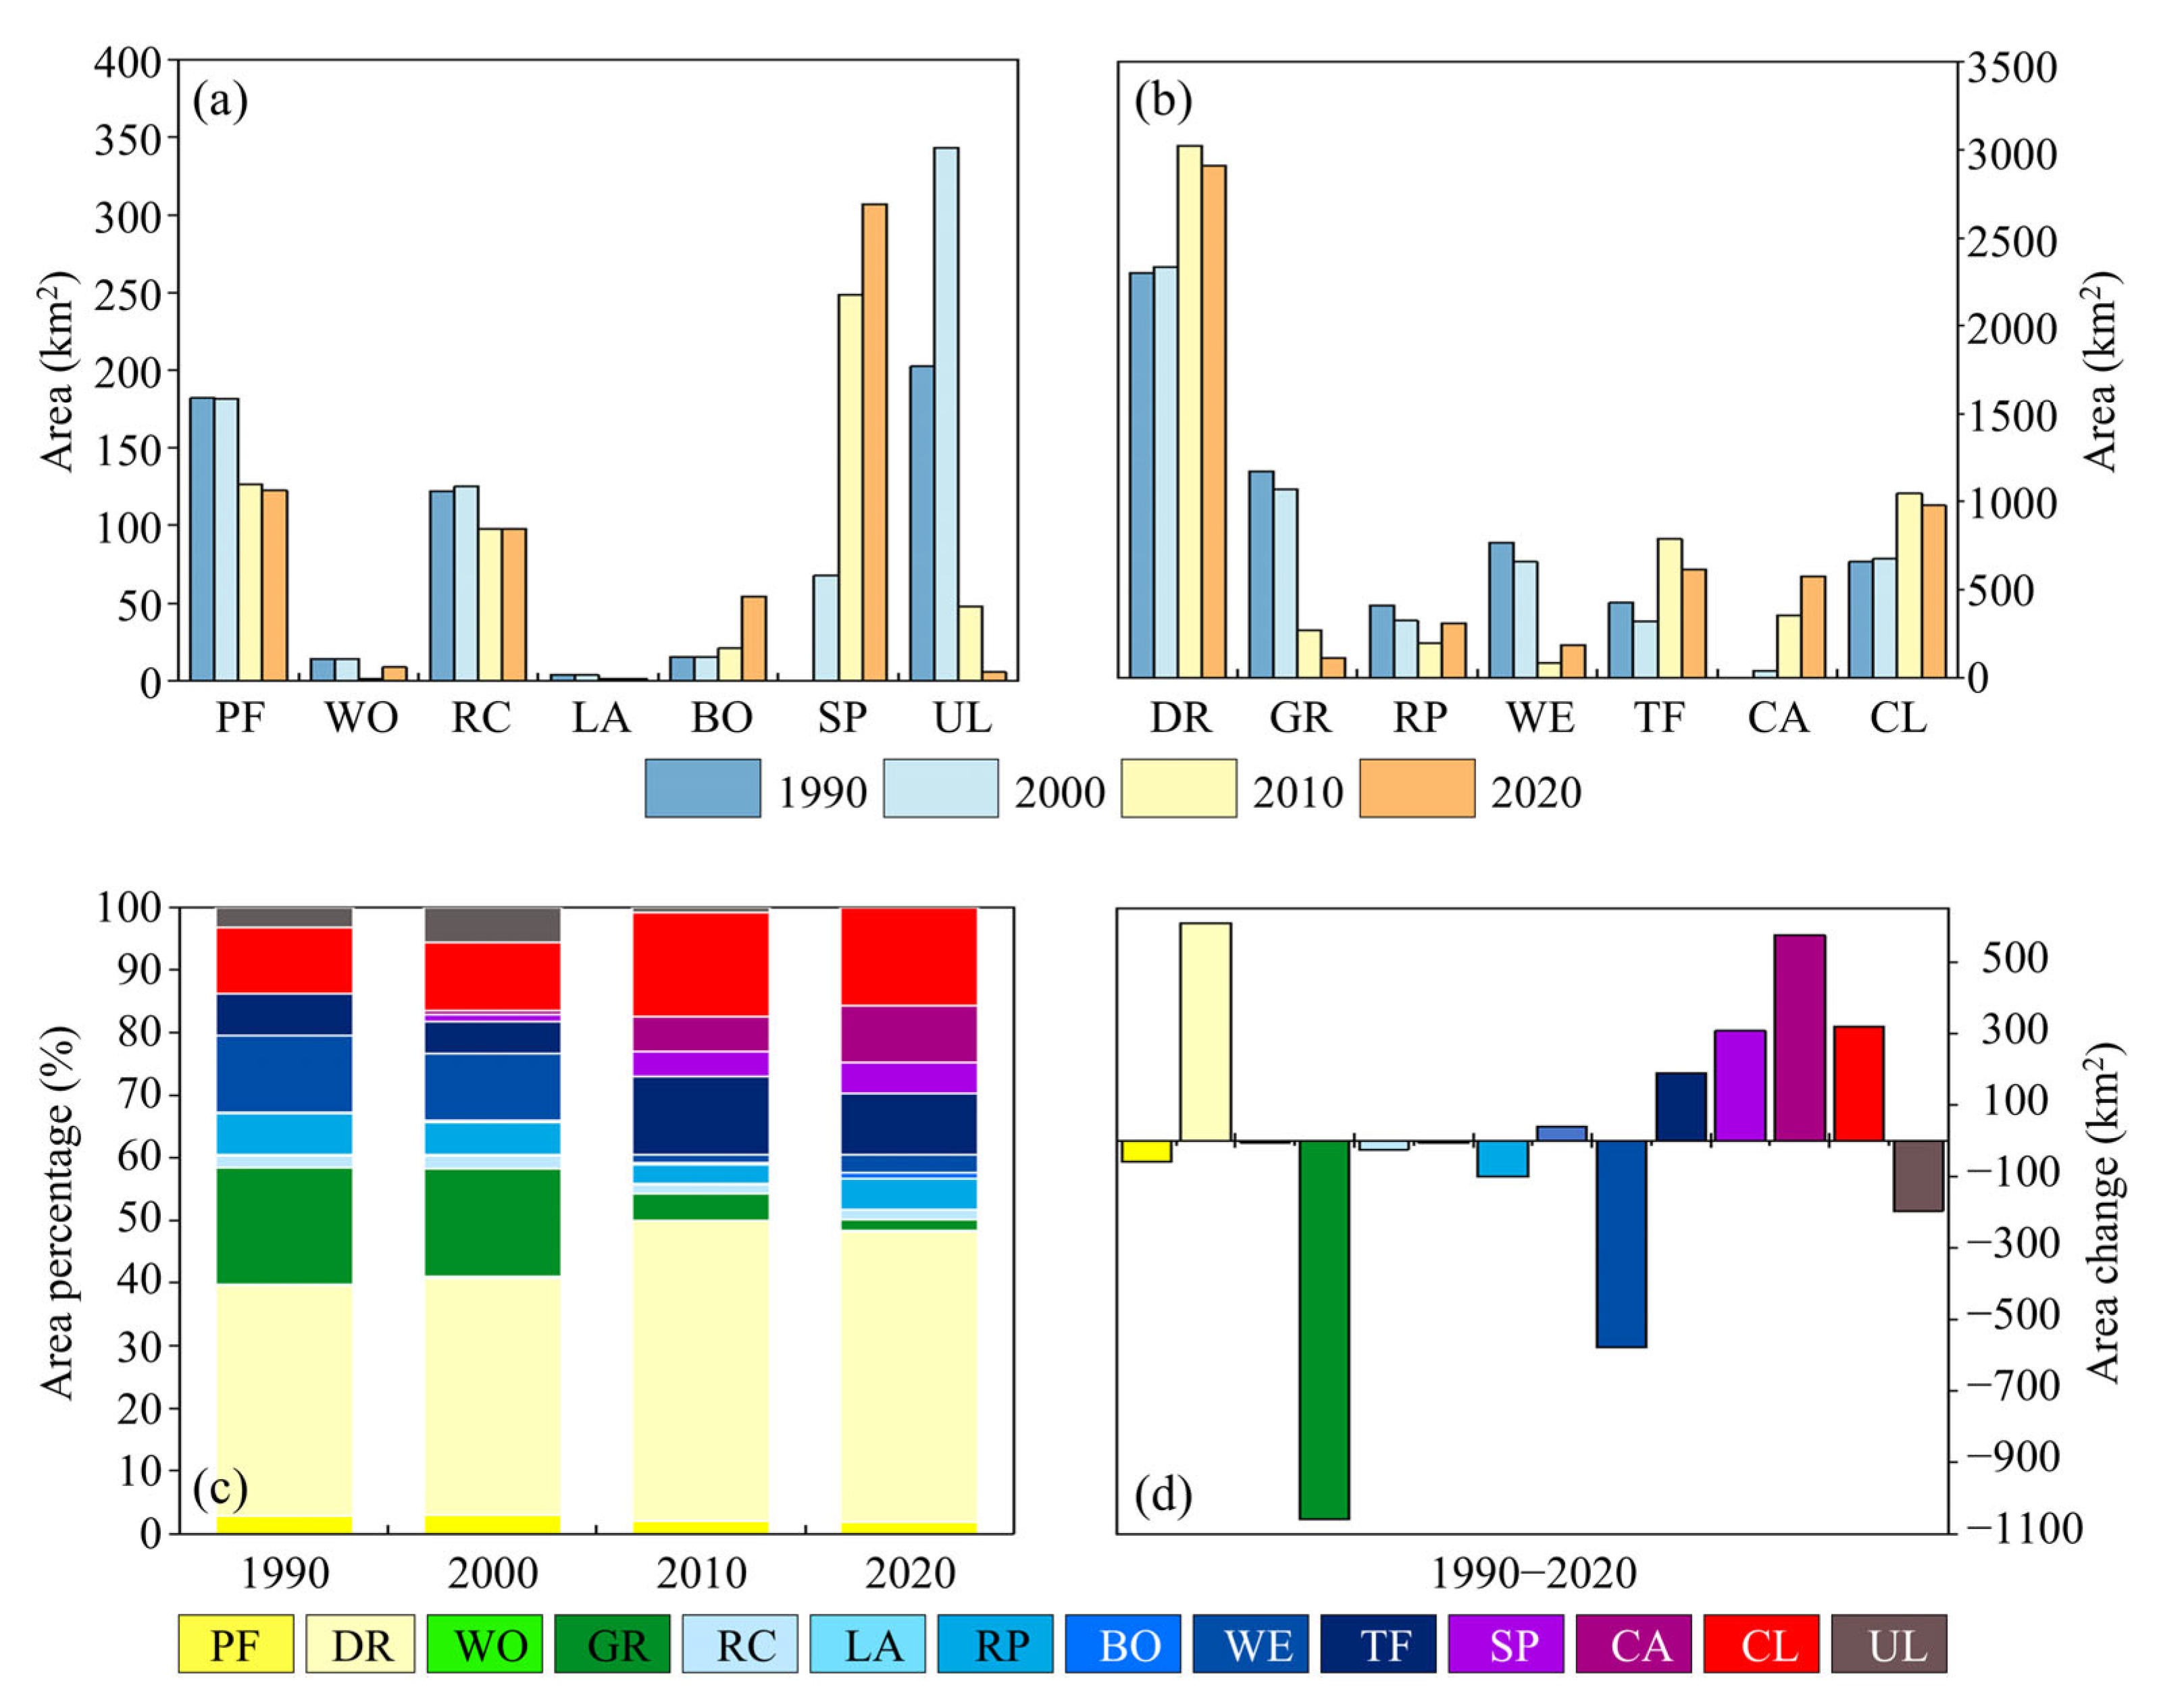
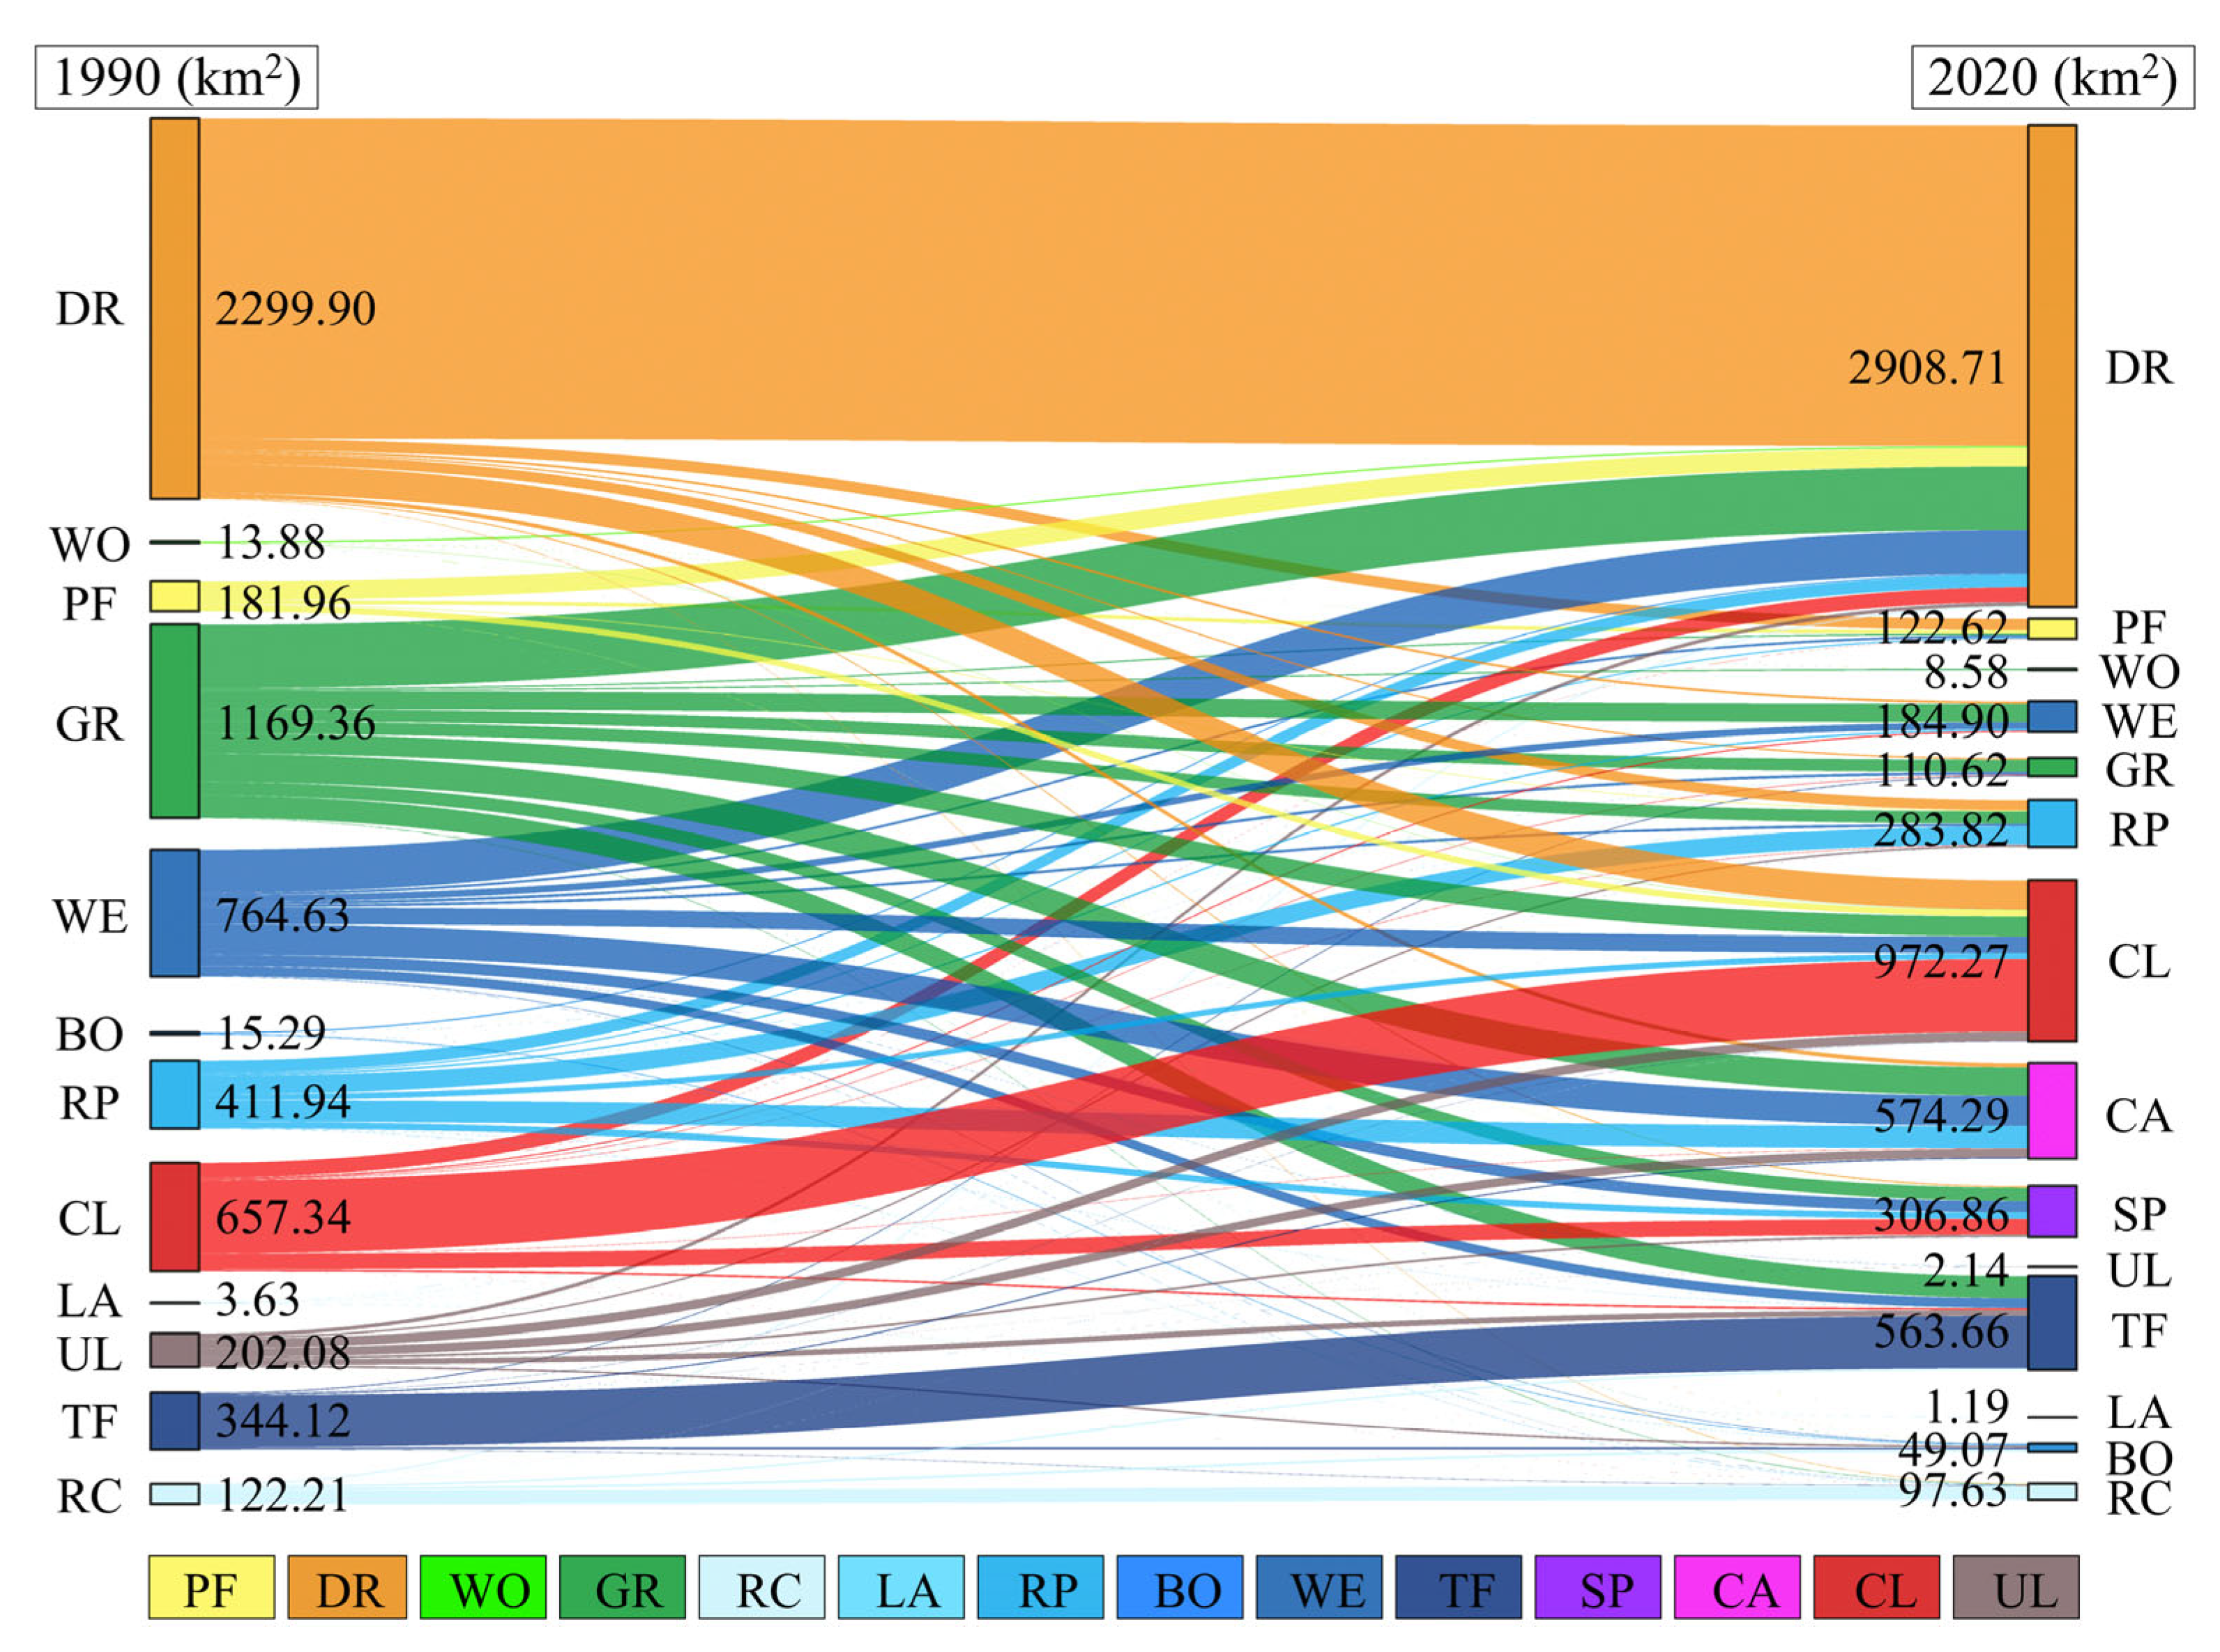
4.1.2. LULCC and Transfer Characteristics

Based on the land use transfer matrix from 1990 to 2020, the land use changes in the YRD can be visualized through a Sankey diagram (Figure 5, Table 3). Between 1990 and 2020, land use transitions were primarily marked by the conversion of grasslands, wetlands, reservoirs and ponds, unused lands, and paddy fields into drylands, culture areas, construction lands, salt pans, and tidal flats. Specifically, the largest area of transformation occurred in grasslands, which experienced a total conversion of 1096.20 km2. These grasslands predominantly shifted to drylands (385.72 km2), culture areas (172.37 km2), and tidal flats (133.68 km2). Wetlands were largely converted into drylands (260.39 km2) and culture areas (182.82 km2), while drylands themselves were primarily converted into construction lands (177.09 km2). Notably, 84.08% of the original drylands remained unchanged, demonstrating relative stability in land use.
At the same time, the largest conversion into drylands occurred in an area of 974.84 km2, primarily originating from grasslands, wetlands, and paddy fields (114.19 km2). The expansion of culture areas was mainly driven by conversions from wetlands and grasslands. The conversion into construction lands primarily stemmed from drylands and grasslands, with an area of 118.46 km2. Additionally, the conversion into salt pans was largely from construction lands, totaling 94.59 km2.
These trends highlight the intricate relationship between economic development, resource utilization, and ecological management in the YRD. As the region has progressed into a phase of rapid development, particularly with the establishment of its efficient ecological economic zone [14], the conversion between various land use types has become increasingly frequent. The rising demand for agricultural production and aquaculture has resulted in the transformation of substantial ecological land (such as grasslands and wetlands) into agricultural and aquaculture areas (such as drylands and culture areas), with the loss of grasslands being especially pronounced.
The largest conversion into drylands reflects the strong demand for agricultural expansion in the YRD, especially in light of the decline in paddy fields and wetlands. Drylands have provided additional resources for agriculture in this context. At the same time, 84.08% of the original drylands have remained stable without significant changes in land use, indicating that drylands have been steadily developed and utilized for a long period, becoming a key land resource in the region [75]. Furthermore, with the continued development of resources, the areas of culture areas and salt pans have expanded significantly, mirroring the acceleration of urbanization, particularly in coastal areas and the urbanization of the Dongying New District.

4.2. Carbon Storage Changes from 1990 to 2020

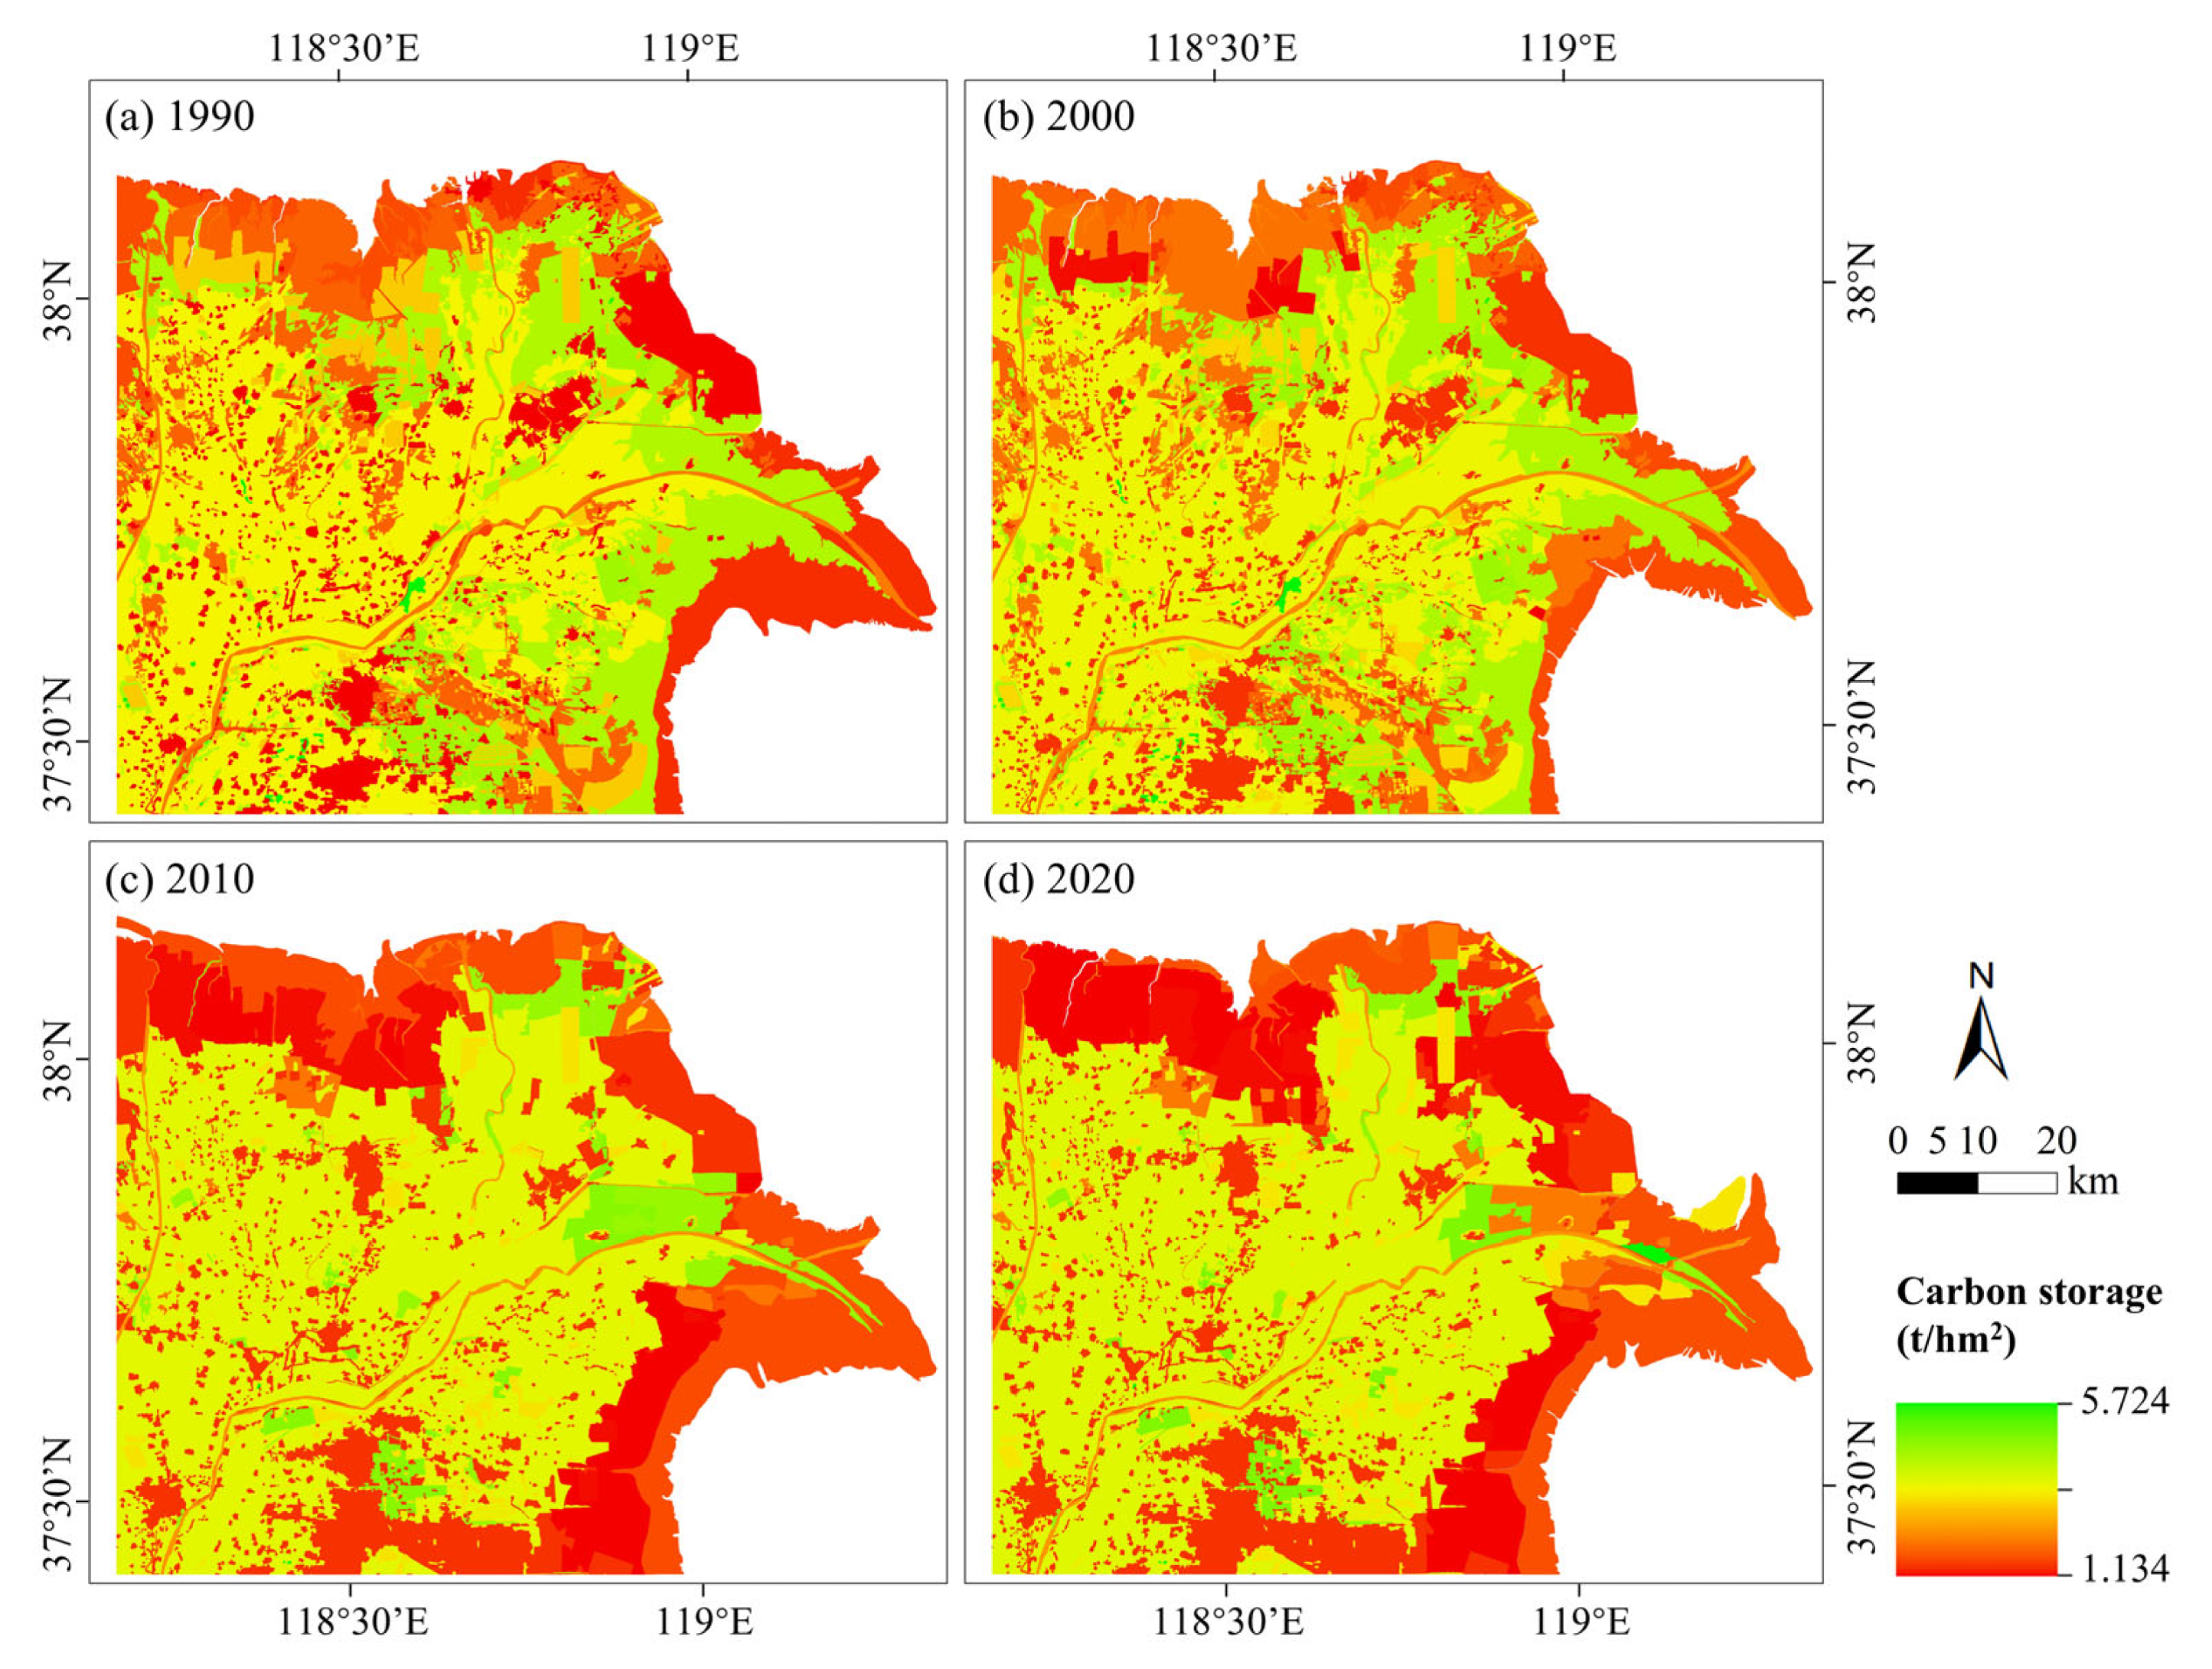
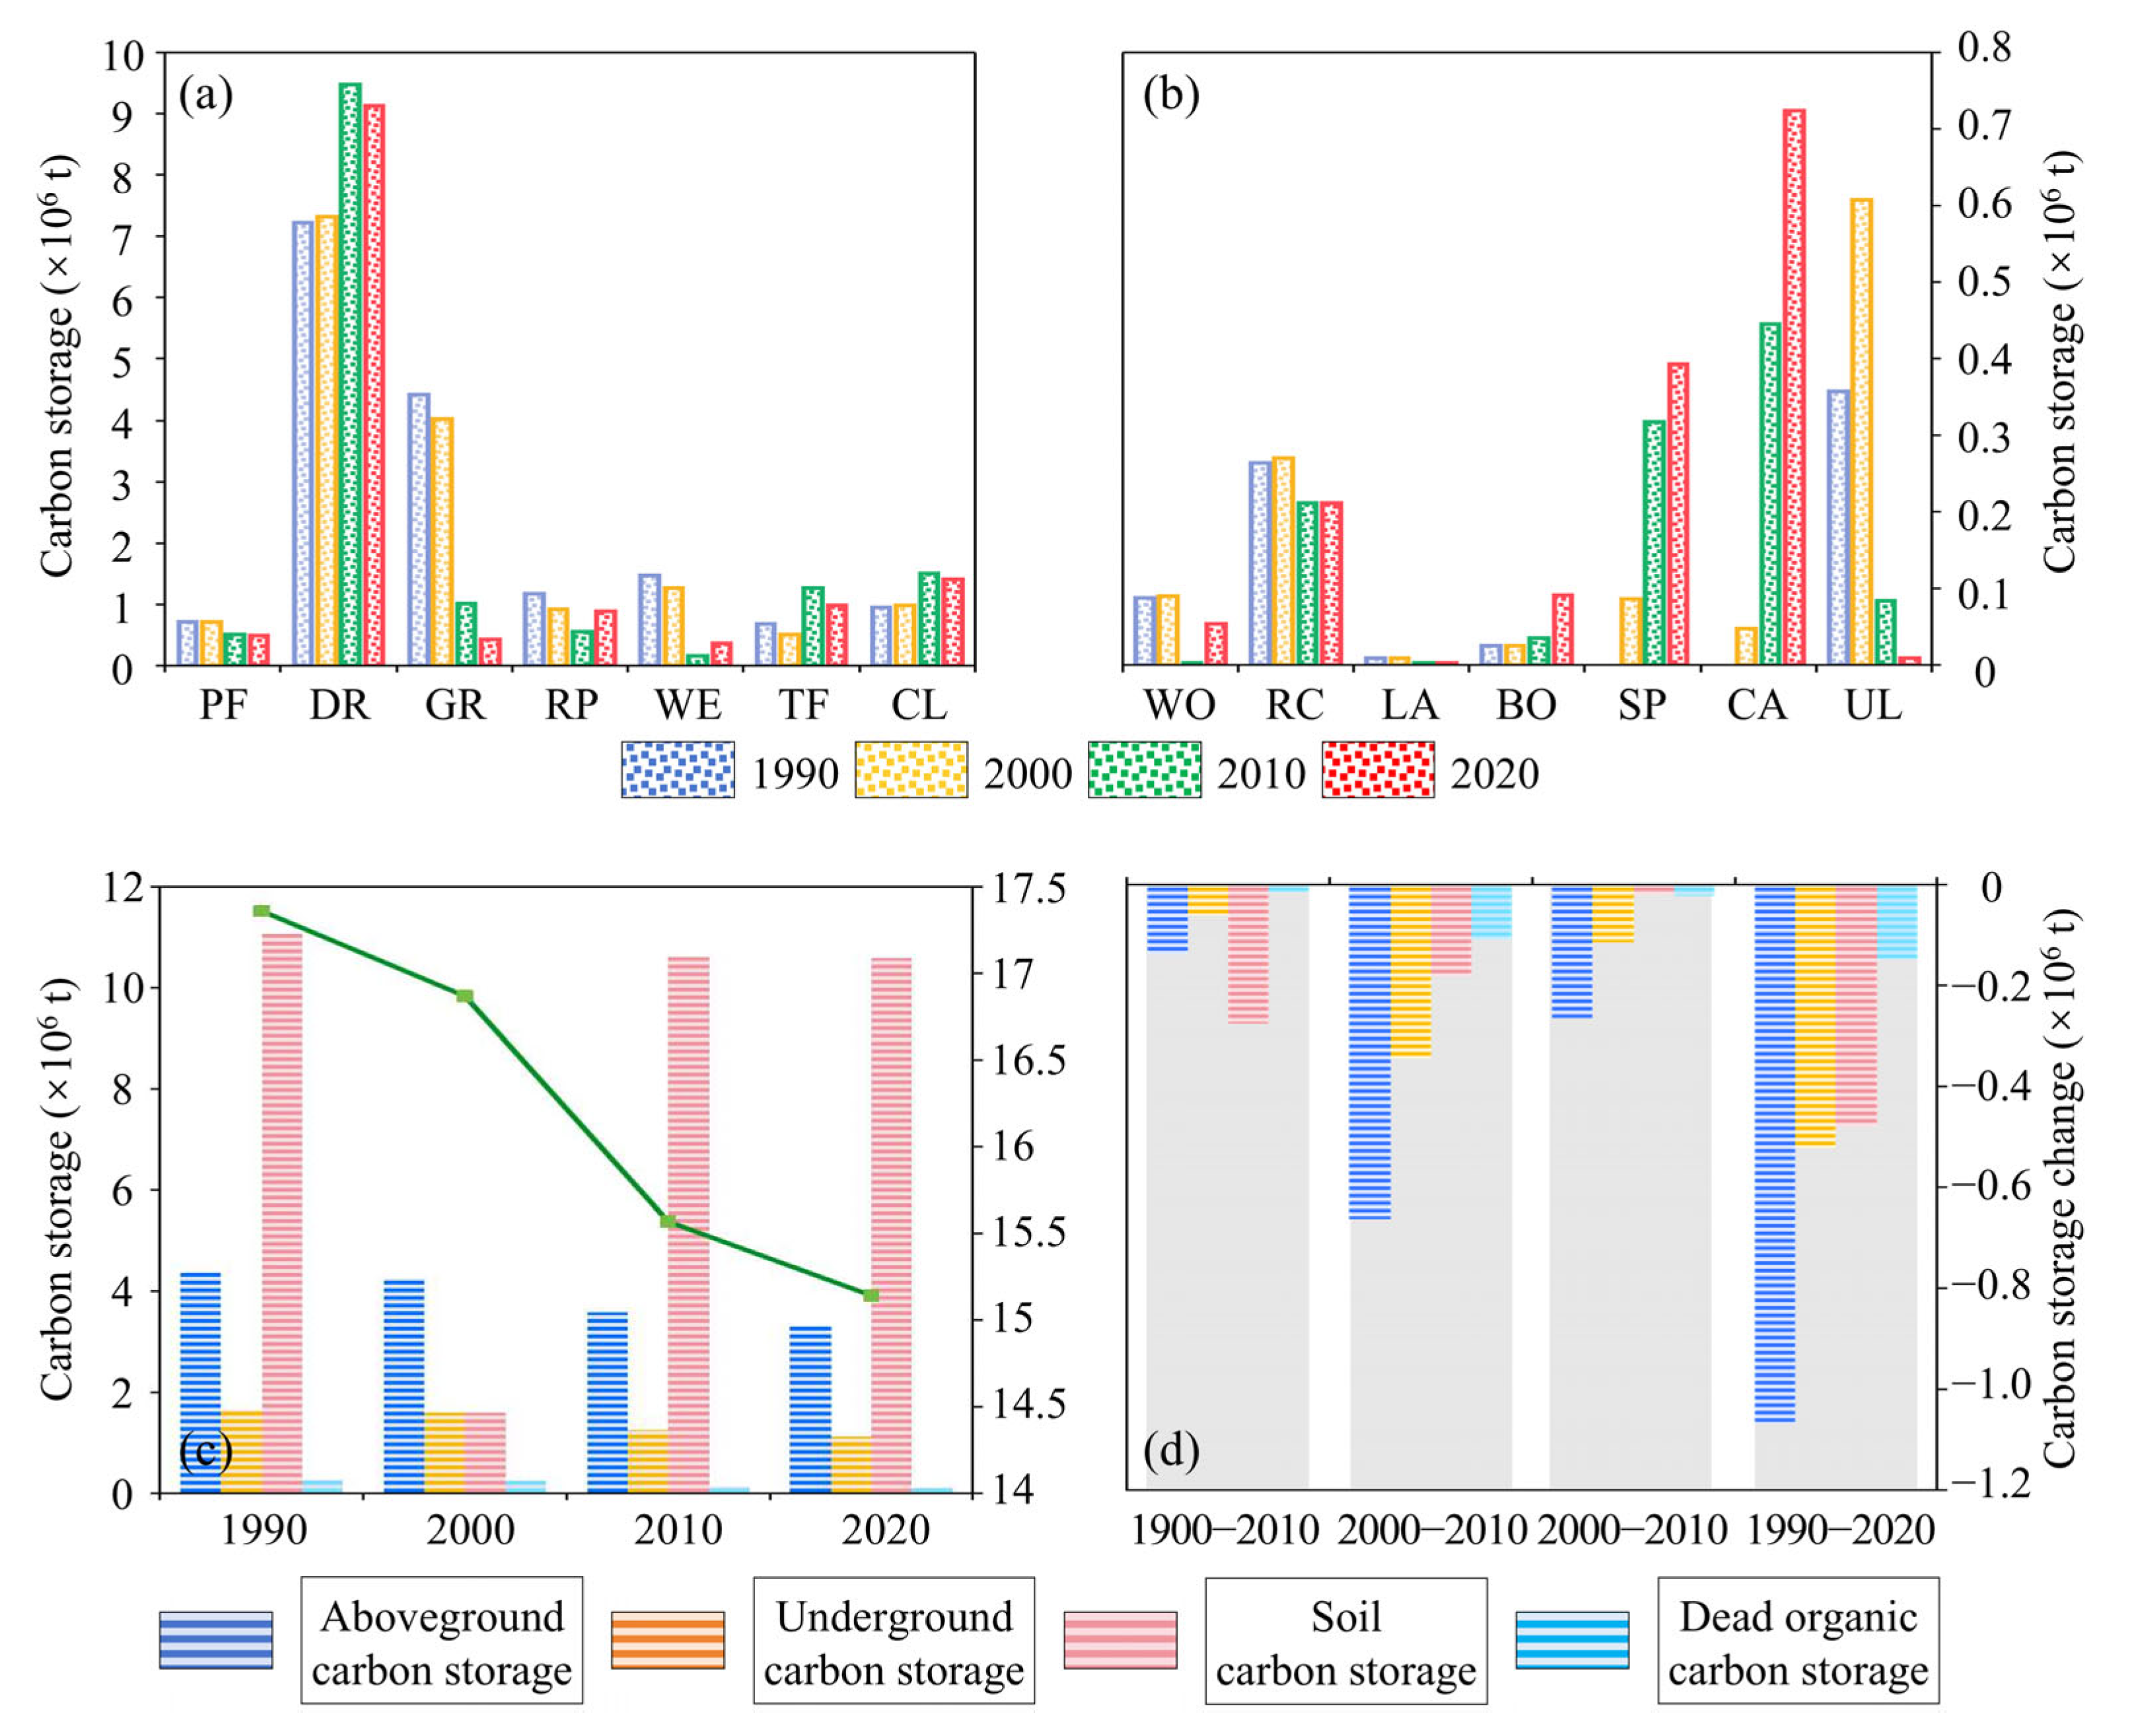
4.2.1. Spatial and Temporal Distribution of Carbon Storage

This research applied the “Carbon Storage and Sequestration” module of the InVEST model to assess the spatial distribution of carbon storage on a per-unit-area basis. It also tracked variations in carbon storage across different land use types and carbon pools in the YRD from 1990 to 2020, as shown in Figure 6 and Figure 7. The findings reveal that carbon storage in the YRD shows considerable spatial variation (Figure 6). Areas with low carbon storage per unit are primarily located in coastal zones, including land types such as construction lands, tidal flats, salt pans, and culture areas. These areas generally exhibit low biomass and limited carbon sequestration potential. Specifically, salt pans and culture areas have particularly low carbon storage due to their high salinity levels, which hinder the growth of vegetation.
Regions with medium unit carbon storage are mainly found in areas where wetlands extend inland, with land uses primarily consisting of drylands and wetlands. These areas exhibit moderately high vegetation carbon density values (Table 2). They are widespread, and their carbon storage has remained relatively stable over time. High-unit carbon storage areas, on the other hand, are typically situated between zones of lower and medium carbon storage, particularly along the YRB and near nature reserves. These areas are predominantly composed of grasslands, paddy fields, and woodlands, all of which possess high carbon densities and strong carbon sequestration abilities.
Between 1990 and 2020, the areas with low unit carbon storage in the YRD expanded inward in a surrounding pattern, while high-value carbon storage areas saw a significant decline, leading to an overall reduction in carbon storage. Zonal statistics indicate that the total carbon storage in the YRD was 17.36 × 10⁶ t in 1990, 16.87 × 10⁶ t in 2000, 15.57 × 10⁶ t in 2010, and 15.14 × 10⁶ t in 2020. The most pronounced decrease occurred between 2000 and 2010 (as shown by the green line in Figure 7c), aligning with the trends in LULCC. During this period, the total carbon storage loss amounted to 2.22 × 10⁶ t, marking a decrease of 12.79%. A detailed analysis reveals a reduction in carbon storage across all four carbon pools over the 30 years (Figure 7c): the aboveground carbon pool decreased by 1.07 × 10⁶ t (24.39%), the belowground carbon pool dropped by 0.52 × 10⁶ t (31.56%), the soil carbon pool reduced by 0.48 × 10⁶ t (4.34%), and the dead organic carbon pool fell by 0.15 × 10⁶ t (57.27%) (Figure 7d). These reductions are primarily linked to changes in land use, particularly the conversion of grasslands, wetlands, and other high-carbon land types into drylands, culture areas, and construction lands.
Among the 14 land use types in the YRD, drylands have consistently served as the primary carbon sink, with an estimated carbon storage increase of approximately 1.91 × 10⁶ t during the study period (Figure 7a). This significant carbon sequestration potential is likely linked to China’s stringent protection policies for permanent basic farmland [75]. However, the long-term stability of dryland carbon sinks remains contingent upon sustainable land use practices, as overexploitation and intensified land utilization may pose potential risks to carbon storage. Spatial heterogeneity in carbon storage changes is evident within the region, reflecting the differentiated effectiveness of land use policies and ecological restoration measures. For example, nature reserves in Dongying City have effectively enhanced carbon sequestration through ecological policies such as “reverting farmland to wetlands” and “retreating aquaculture for tidal flat restoration”, whereas the coastal industrial belt in Binzhou has experienced substantial carbon losses due to construction land expansion. This “gain–loss” spatial pattern not only aligns with the principle of “common but differentiated responsibilities” under the “United Nations Framework Convention on Climate Change (UNFCCC)”, but also highlights the limitations of relying solely on natural recovery to achieve China’s dual-carbon goals.
Overall, from 2000 to 2020, the terrestrial ecosystem carbon storage in the YRD has shown a declining trend, which deviates from China’s national strategic goal of peaking carbon emissions before 2030 and the objective outlined in the “White Paper: China’s Policies and Actions for Addressing Climate Change”—to increase forest stock volume by 6 billion m3 compared to 2005 levels by 2030. If the current carbon loss trajectory continues, the region’s carbon storage in 2030 may fall significantly below the baseline level, further exacerbating the gap with the 1.5 °C warming target of the “Paris Agreement”. In this context, establishing a compound pathway combining “coastal wetland restoration + industrial land carbon compensation” is of practical significance for enhancing regional carbon sequestration. Although salt marsh restoration may entail a delayed carbon response period of 10–15 years, it nonetheless holds considerable long-term potential and strategic value as a key spatial and technical solution within China’s 2060 carbon neutrality agenda.
From a global perspective, the carbon storage trajectory of the YRD offers important comparative insights within typical deltaic systems, contributing to a deeper understanding of carbon sink mechanisms under varying climatic zones and land use regimes. The Niger Delta, for instance, relies heavily on mangrove sedimentation to achieve high-density carbon storage, but its carbon sink capacity has been persistently undermined by anthropogenic disturbances such as deforestation and illegal oil refining [76]. In contrast, the Mackenzie River Delta, located in a cold-temperate zone, stores carbon mainly in permafrost and forest biomass, yet faces challenges in carbon stability due to climate warming and freeze–thaw dynamics [77]. The Mekong and Mississippi River Deltas have also shown marked carbon losses under the pressures of rapid urban expansion and high population density. Compared with these systems, the YRD is characterized by a mosaic of wetlands, grasslands, and drylands. Although the overall carbon density is relatively low, strong land use policy interventions and high management responsiveness offer substantial potential for carbon storage regulation and restoration. The diversity of carbon sink types and the region’s policy plasticity lay a solid foundation for constructing regional carbon enhancement pathways. Cross-regional comparisons not only contribute to improving the scientific and adaptive management of carbon storage in the YRD but also provide valuable references and theoretical support for low-carbon transitions in deltaic regions worldwide [16].

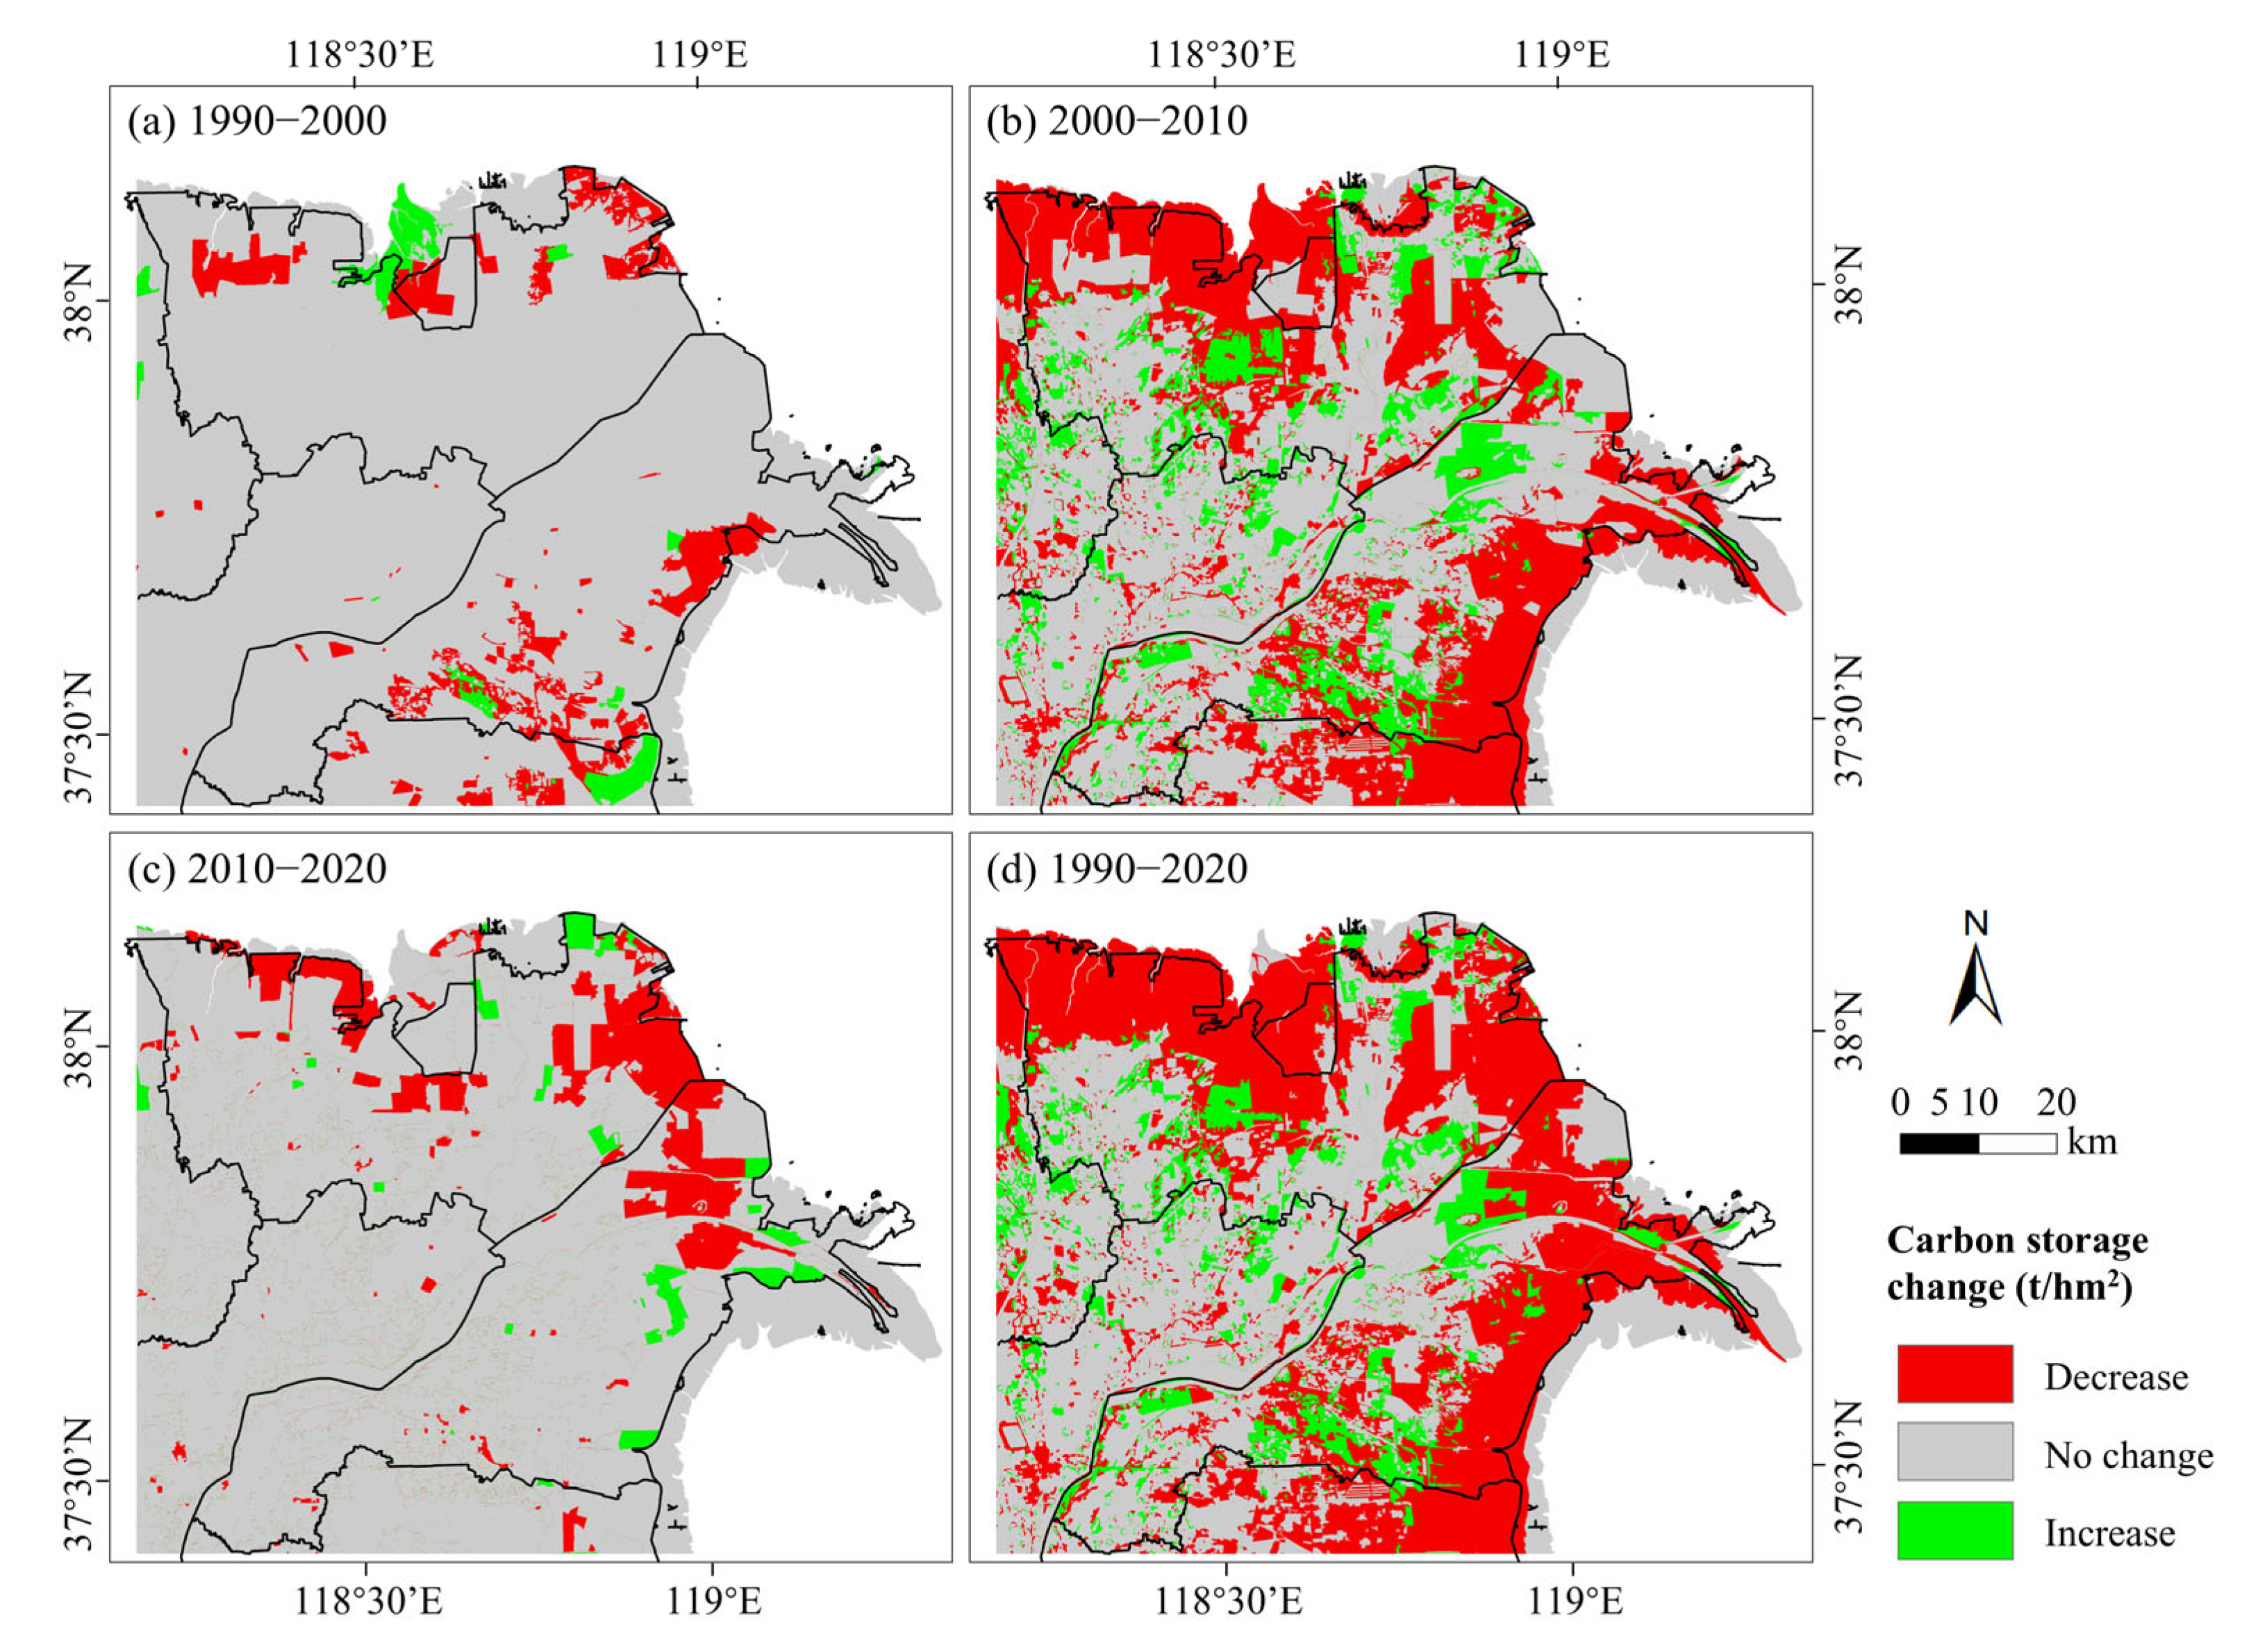
4.2.2. Response of Carbon Storage to LULCC

To better reflect the dynamic changes in carbon storage in the YRD, this study defined areas with an increase in unit carbon storage of more than 10% during the period from 1990 to 2020 as carbon storage increase zones (carbon sink zones), while areas with a decrease of more than 10% were defined as carbon storage decrease zones (carbon source zones). Areas with changes within ±10% were classified as stable carbon storage zones. As depicted in Figure 8 and Figure 9, between 1990 and 2020, carbon sink areas represented 10.78% of the total land area, while carbon source areas comprised 39.87%. Overall, the extent of carbon source areas surpassed that of carbon sink areas, contributing to a net decline in carbon storage. Notably, the period from 2000 to 2010 exhibited the most substantial changes in carbon storage, with distinct fragmented regions evident in the raster maps, aligning closely with the observed shifts in LULC (Figure 3).
A more detailed analysis of carbon storage influx and outflux across various LULC types in the YRD between 1990 and 2020 revealed that most land types experienced a decline in carbon storage during the transformation process (Table S6). The largest carbon losses occurred when grasslands, reservoirs and ponds, drylands, paddy fields, wetlands, and other land types were converted into alternative uses. Over the 30-year period, the most significant carbon loss (2023.09 × 103 t) resulted from the conversion of grasslands to other land types. Specifically, the conversion of grasslands to culture areas accounted for a loss of 649.83 × 10³ t, while losses of 305.75 × 10³ t, 290.09 × 10³ t, and 276.01 × 10³ t occurred when grasslands were converted to salt pans, tidal flats, and construction lands, respectively. Similarly, converting reservoirs and ponds to other uses led to a carbon loss of 506.31 × 10³ t, with aquaculture expansion causing the largest loss at 368.66 × 10³ t. When drylands were converted to other land types, a total carbon loss of 382.32 × 10³ t was recorded, with 301.05 × 10³ t lost to construction lands. The conversion of paddy fields led to a carbon storage reduction of 197.16 × 10³ t, of which 98.80 × 10³ t was lost to construction lands. Wetlands experienced substantial carbon losses, totaling 161.44 × 10³ t, with the largest loss occurring due to their conversion to culture areas.
However, certain land use conversions also led to a recovery in carbon storage. For instance, when construction lands were transformed into drylands, tidal flats, or grasslands, there was a notable increase in carbon storage. It is important to highlight that, since salt pans and culture areas were not classified in the 1990 land use dataset, the changes in carbon storage resulting from their conversion are not addressed in this analysis. Detailed information on the changes in aboveground, underground, soil, and dead organic carbon pools can be found in Table S6.
In conclusion, the changes in carbon storage across the YRD from 1990 to 2020 exhibit notable spatial and temporal fluctuations, with the most significant decline occurring between 2000 and 2010. The primary drivers of carbon storage reduction are land use transitions, particularly the conversion of high-carbon ecosystems such as grasslands, wetlands, and reservoirs and ponds into low-carbon uses like construction lands and culture areas. These transformations have weakened the region’s carbon sink capacity, potentially increasing carbon emissions and exacerbating local climate change impacts [78]. This highlights the ecosystem’s vulnerability under the pressures of economic growth and resource exploitation.
The most prominent example of land use change is the conversion of grasslands, which has led to a substantial loss of over 2 million tons of carbon storage due to the encroachment of agricultural, aquaculture, and urban development. However, it is important to note that land reclamation and restoration efforts, such as converting construction lands back to drylands or transforming tidal flats into grasslands, can support the recovery of carbon storage. This underscores the critical role of land management and ecological restoration in enhancing carbon sink potential.
Moving forward, it is essential to focus on protecting land use types with significant carbon storage capabilities. Strengthening policies related to ecological protection, including establishing ecological protection redlines and expanding national nature reserves, should be prioritized. Additionally, strategies that enhance the diversity, connectivity, and aggregation of land use types will be crucial for maintaining long-term carbon sequestration capacity.

4.3. Multi-Scenario Prediction of LULC and Carbon Storage Based on Seawater Inundation Model

4.3.1. Multi-Scenario Seawater Inundation Prediction

To conduct a thorough assessment of future seawater inundation risks in the YRD, this study integrates three climate change scenarios from the IPCC AR6 report—SSP1–26, SSP2–45, and SSP5–85. It also defines three strategic scenarios—EPS, NDS, and EGS—targeting the years 2030 and 2060, corresponding to key carbon peak and carbon neutrality milestones. In addition, the study incorporates SBAS-InSAR LS monitoring data from 2020 to 2024 and employs the seeded inundation algorithm to comprehensively predict the seawater inundation risks driven by future SLR and LS.
Through the analysis of time-series data using SBAS-InSAR, the average vertical deformation rate of the land surface in the YRD from January 2020 to December 2024 was determined. Areas exhibiting subsidence were interpolated using the Inverse Distance Weighting (IDW) method, producing comprehensive LS results for the study area (Figure 10a). The findings indicate that during the monitoring period, a funnel-shaped subsidence pattern developed in the YRD, with unevenly distributed subsidence zones. Notably, severe subsidence was concentrated in the northeastern estuary region, including areas near Haihu New Village (Figure 1a,c), Dongying Shengli Airport, and Liushi Village (Figure 1b). The subsidence rates in these areas reached −102.51 mm/a, −51.40 mm/a, and −60.89 mm/a, respectively. Field surveys identified that these areas are rich in oil, gas, and underground brine resources [45]. Over-exploitation of these resources has led to a decline in reservoir pressure, resulting in land consolidation and the development of funnel-shaped subsidence. Additionally, infrastructure projects, such as those at Dongying Shengli Airport, have contributed additional load pressure on the ground surface, exacerbating layer compression and localized subsidence.
To enhance the accuracy of subsidence monitoring, reference points from the previous PS-InSAR (Persistent Scatterer-InSAR) method were used as control points for the SBAS-InSAR deformation calculations. The results of this study are consistent with those of other researchers [79]. The accuracy of the subsidence distribution and amount has been validated, particularly in areas where the LS rate exceeds 10 mm/a around salt pans and surrounding drylands (Figure 10b), where the distribution matches previous studies. These results demonstrate high reliability and provide strong support for the comprehensive prediction of seawater inundation risk in the YRD.
This study examines the potential impact of SLR on coastal inundation in the YRD by utilizing 30 m × 30 m resolution DEM data from 2020 and SLR forecasts provided under three climate change scenarios in IPCC AR6 [15,46]. The results indicate that by 2030 and 2060, the projected SLR in the YRD is expected to be 13.74 cm, 15.90 cm, 15.51 cm, and 16.68 cm, 20.46 cm, 22.41 cm, respectively. The predicted seawater inundation range (Figure 11 and Figure 12) demonstrates a continuous surface distribution, as modeled using the seeded inundation algorithm. This inundation range aligns closely with the DEM elevation distribution of the YRD, with low-lying areas being particularly susceptible to flooding. As the protection intensity decreases from EPS to EGS, the inundation area gradually expands into regions already experiencing significant LS. This includes estuarine tidal flats, wetlands, and coastal construction lands such as the Gu Dong Oilfield, Dongying Port, and the northwest coastline. These results are consistent with findings from previous studies [15].
The inundation areas under different development scenarios reveal notable variations. Specifically, under the EPS, the inundation areas for 2030 and 2060 are projected to be 68.93 km2 and 478.78 km2, respectively, accounting for 1.09% and 7.60%. Under the NDS, the inundation areas increase to 95.30 km2 and 571.80 km2, representing 1.51% and 9.08%. In the EGS, the inundation areas reach 428.90 km2 (6.81%) in 2030 and 590.52 km2 (9.38%) in 2060 (Table 4). Notably, in the 2030 projections (Figure 11a–c), the EGS exhibits a larger inundation area than the NDS, despite the sea-level being lower in the former. This indicates that the influence of LS on seawater inundation is more pronounced in the EGS (low sea-level) [15]. However, by 2060 (Figure 11d–f), as SLR, the impact of LS begins to diminish, and the inundation area differences between the scenarios become less significant. It is important to acknowledge that this analysis does not account for topographic factors, such as slope and aspect, which may introduce some errors in the inundation area estimates.
To enhance the robustness of the projection results, this study incorporates SLR rate uncertainty analysis based on multi-model ensembles, systematically evaluating the variability of SLR and its primary driving mechanisms under different SSP scenarios. Under the low-emission SSP1–26 scenario, the projected SLR rate is 0.98 ± 0.18 mm/a (0.80–1.16 mm/a), with uncertainty primarily arising from differences in glacier melt models and the sensitivity of ocean thermal expansion to temperature increases. In the intermediate-emission SSP2–45 scenario, the SLR rate increases to 1.52 ± 0.31 mm/a (1.21–1.83 mm/a), with uncertainties influenced by Antarctic ice sheet dynamics and the coupling effects of mid-range carbon emission trajectories. Under the high-emission SSP5–85 scenario, the SLR rate further rises to 2.30 ± 0.58 mm/a (1.72–2.88 mm/a), reflecting amplified uncertainty due to the nonlinear response of ice sheet collapse and enhanced ocean circulation feedbacks. Notably, the delayed and threshold responses of the Antarctic and Greenland ice sheets to global warming remain the largest sources of uncertainty in current SLR estimates [46]. At the regional scale, factors such as tectonic subsidence, crustal deformation, and oceanic circulation anomalies may cause spatial deviations in SLR trends from the global mean, further complicating the assessment. According to the IPCC AR6, extreme warming under the SSP5–85 scenario could trigger irreversible thresholds in ice sheet dynamics, significantly raising the upper bound of future SLR projections. Therefore, the potential risks under extreme scenarios should be given high priority in coastal risk assessments and spatial planning, serving as a critical basis for formulating carbon peak, carbon neutrality, and climate adaptation strategies.

4.3.2. Temporal and Spatial Changes of LULC and Carbon Storage Under Multiple Scenarios

This study employed both the PLUS and InVEST models to simulate future LULC types and carbon storage distributions for the YRD. The simulations were conducted under three distinct development scenarios—EPS, NDS, and EGS—for the years 2030 and 2060, factoring in the potential effects of seawater inundation (Figure 11 and Figure 12). The findings reveal notable differences in the projected seawater inundation areas and carbon storage losses across the three scenarios. Specifically, as ecological protection intensity decreases and the extent of seawater inundation increases, all three scenarios indicate a significant reduction. This highlights the pressing need for enhanced environmental management to mitigate the risks of land degradation and carbon loss in the YRD.
Under the EPS, the primary land types projected to be submerged by 2030 include tidal flats (68.09%), wetlands (12.77%), and grasslands (9.24%). The estimated carbon storage loss is calculated to be 0.17 × 10⁶ t. By 2060, the predominant land types affected by inundation are tidal flats (27.86%), construction lands (25.31%), and drylands (20.12%). This results in a higher carbon storage loss of 1.35 × 10⁶ t, leaving a remaining carbon storage of 13.26 × 10⁶ t. In this scenario, socio-economic development and greenhouse gas emissions are projected to remain at relatively low levels. While seawater inundation driven by SLR and LS poses challenges, effective ecological protection measures for wetlands and grasslands help mitigate the carbon storage losses, resulting in a comparatively lower impact on overall carbon storage (Table 4).
Under the NDS, carbon storage loss is estimated to reach 0.24 × 106 t by 2030 and 1.58 × 106 t by 2060. Compared to the EPS, the increased rate of LS and higher SLR in this scenario result in more significant losses, particularly affecting wetlands and tidal flats. Additionally, the expansion of submerged areas in construction lands and drylands further exacerbates the reduction in carbon storage.
Under the EGS, carbon storage loss is projected to be 1.23 × 10⁶ t in 2030 and 1.73 × 10⁶ t in 2060. With accelerated land development and urbanization driven by economic growth, low-lying carbon sinks such as wetlands and grasslands are more heavily impacted. The conversion of these areas to construction lands accelerates seawater inundation, thereby intensifying the risk of flooding. This not only contributes to further ecological degradation but also leads to significant economic losses.
In conclusion, the YRD is confronted with significant challenges related to seawater inundation and carbon storage loss, exacerbated by the combined effects of global climate change and extensive resource development. Specifically, the overexploitation of oil and underground brine has intensified LS in coastal low-lying areas, further amplifying the risk of seawater inundation and accelerating the loss of carbon storage. Failure to account for these factors could lead to an overestimation of the Delta’s carbon storage by approximately 1/15, while also overlooking the economic losses in inundated areas. Moving forward, it is crucial for the government to enhance policy development, curbing excessive resource extraction—particularly oil and underground brine extraction—so as to mitigate the effects of LS. Additionally, efforts should be made to fortify coastal protective infrastructure, particularly coastal dikes, and to initiate long-term protection and restoration initiatives [15,80,81]. These actions are essential for preventing seawater intrusion and ensuring the sustainable development of the YRD’s ecological environment.

5. Conclusions

This study integrates three climate change scenarios (SSP1–26, SSP2–45, and SSP5–85) provided by the IPCC AR6 with LS monitoring data for the YRD, addressing the future risks of seawater inundation driven by SLR and LS. Taking into account the land use and ecological protection policies in the YRD, three strategic scenarios were developed—EPS, NDS, and EGS. Using the PLUS and InVEST models, this study predicts and assesses future changes in LULC and carbon storage. The key conclusions of this study are as follows:
(1)
From 1990 to 2020, land use in the YRD showed a clear trend of coastal expansion and production-oriented transformation, with grasslands, wetlands, and unused lands extensively converted into drylands, culture areas, construction lands, and salt pans. The most intensive changes occurred between 2000 and 2010, reflecting rapid urbanization and industrial restructuring. Despite significant reductions in ecological land, 84.08% of drylands remained stable, underscoring their dominance. These patterns highlight the persistent trade-off between economic development and ecological preservation, emphasizing the need for more balanced land management strategies;
(2)
From 1990 to 2020, carbon storage in the YRD declined overall, with pronounced spatial heterogeneity. Low-carbon densities were concentrated in coastal areas dominated by construction lands, tidal flats, salt pans, and culture areas, while inland grasslands, paddy fields, and woodlands served as key carbon sinks. The region experienced a net carbon loss of 2.22 × 10⁶ t, largely driven by the conversion of high-carbon ecosystems to low-carbon land uses. Carbon sink areas accounted for only 10.78% of the landscape, highlighting the profound impact of LULCC on carbon dynamics and the urgent need for targeted land management and ecological restoration to enhance long-term sequestration;
(3)
By integrating IPCC AR6 climate scenarios (SSP1–26, SSP2–45, SSP5–85) with LS monitoring data, this study conducted a multi-scenario assessment of seawater inundation risk in the YRD under future SLR-LS coupling. The results revealed significant spatial heterogeneity in LS, with low-lying areas experiencing severe subsidence facing the highest inundation risk. From the EPS to the EGS, inundation progressively expanded into zones with intensified LS. By 2030 and 2060, under high-emission and development scenarios, carbon-rich ecosystems such as wetlands and grasslands are projected to face compounded threats from both inundation and accelerated development, leading to substantial carbon loss and ecological degradation. These findings highlight the urgent need to regulate resource extraction and enhance coastal protection planning to mitigate future risks.
This study primarily relied on existing carbon density datasets for carbon storage estimation, without fully accounting for spatial heterogeneity that may affect accuracy. Additionally, the prediction of seawater inundation did not fully correct for DEM elevation errors or incorporate disturbances from extreme events such as storm surges, which contributed to model uncertainty. Although we assessed the feasibility of cross-validating with independent satellite-derived carbon storage products (e.g., MODIS), differences in land classification systems, spatial resolution mismatches, and the relatively small scale of the study area limited the applicability of such comparisons. Nevertheless, the carbon density dataset employed has been widely validated in previous studies, and the spatial distribution patterns of our simulation results are consistent with established findings, supporting their reliability. Future research should incorporate high-resolution remote sensing products (e.g., GEDI and LiDAR) to enhance multi-source data validation and integrate socioeconomic factors—such as urbanization rates and industrial development—to improve the scientific rigor and policy relevance of LULCC projections and carbon storage assessments. In summary, this study provides critical insights for land use regulation and ecosystem carbon management in the YRD under the dual pressures of climate change and resource exploitation, while offering methodological reference and future directions for integrated modeling in other vulnerable coastal regions.

Supplementary Materials

The following supporting information can be downloaded at: https://www.mdpi.com/article/10.3390/rs17091603/s1, Figure S1: Driving factors of land use change simulation in the YRD; Table S1: Confusion matrix for classification accuracy of different land use types. (PF: paddy field; DR: dryland; WO: woodland; GR: grassland; RC: river and canal; LA: lake; RP: reservoir and pond; BO: bottomland; WE: wetland; TF: tidal flat; SP: salt pan; CA: culture area; CL: construction land; UL: unused land); Table S2: Neighborhood weight settings for different land use types. (PF: paddy field; DR: dryland; WO: woodland; GR: grassland; RC: river and canal; LA: lake; RP: reservoir and pond; BO: bottomland; WE: wetland; TF: tidal flat; SP: salt pan; CA: culture area; CL: construction land; UL: unused land); Table S3: Transfer cost matrix setting for the accuracy verification phase. (PF: paddy field; DR: dryland; WO: woodland; GR: grassland; RC: river and canal; LA: lake; RP: reservoir and pond; BO: bottomland; WE: wetland; TF: tidal flat; SP: salt pan; CA: culture area; CL: construction land; UL: unused land); Table S4: Transfer cost matrix setting under Ecological Protection Scenario (EPS). (PF: paddy field; DR: dryland; WO: woodland; GR: grassland; RC: river and canal; LA: lake; RP: reservoir and pond; BO: bottomland; WE: wetland; TF: tidal flat; SP: salt pan; CA: culture area; CL: construction land; UL: unused land); Table S5: Transfer cost matrix setting under Economic Growth Scenario (EGS). (PF: paddy field; DR: dryland; WO: woodland; GR: grassland; RC: river and canal; LA: lake; RP: reservoir and pond; BO: bottomland; WE: wetland; TF: tidal flat; SP: salt pan; CA: culture area; CL: construction land; UL: unused land); Table S6: Changes in carbon storage corresponding to land transfer in the YRD from 1990 to 2020. (PF: paddy field; DR: dryland; WO: woodland; GR: grassland; RC: river and canal; LA: lake; RP: reservoir and pond; BO: bottomland; WE: wetland; TF: tidal flat; SP: salt pan; CA: culture area; CL: construction land; UL: unused land).

Author Contributions

Conceptualization, Z.W. and X.L.; methodology, Z.W. and X.L.; software, Z.W.; formal analysis, S.Z. and X.M.; investigation, S.Z. and X.M.; resources, H.Z. and X.G.; data curation, H.Z. and X.G.; writing—original draft preparation, Z.W. and X.G.; writing—review and editing, Z.W., X.L. and X.G.; visualization, Z.W., S.Z., and X.M.; funding acquisition, X.L. and X.G. All authors have read and agreed to the published version of the manuscript.

Funding

This research was financially supported by the National Natural Science Foundation of China (42022052 and 42207181), the Fundamental Research Funds for the Central Universities (202441003), and the Shandong Province National-Level Leading Talent Supporting Project (2022GJJLJRC-15).

Data Availability Statement

Data sharing is not applicable to this article as no datasets were generated or analyzed during the current study.

Acknowledgments

We would like to thank all the scholars in the references for their contributions to their respective research fields, as well as the open-source data provided by various data websites.

Conflicts of Interest

The authors declare no conflicts of interest.

References

  1. Qin, D.H.; Stocker, T. Highlights of the IPCC working group I fifth assessment report. Adv. Clim. Change Res. 2014, 10, 1–6. [Google Scholar] [CrossRef]
  2. Rogelj, J.; Den Elzen, M.; Höhne, N.; Fransen, T.; Fekete, H.; Winkler, H.; Schaeffer, R.; Sha, F.; Riahi, K.; Meinshausen, M. Paris Agreement climate proposals need a boost to keep warming well below 2 °C. Nature 2016, 534, 631–639. [Google Scholar] [CrossRef] [PubMed]
  3. Falkner, R. The Paris Agreement and the new logic of international climate politics. Int. Aff. 2016, 92, 1107–1125. [Google Scholar] [CrossRef]
  4. Schuerch, M.; Spencer, T.; Temmerman, S.; Kirwan, M.L.; Wolff, C.; Lincke, D.; McOwen, C.J.; Pickering, M.D.; Reef, R.; Vafeidis, A.T.; et al. Future response of global coastal wetlands to sea-level rise. Nature 2018, 561, 231–234. [Google Scholar] [CrossRef]
  5. Xu, X.F. Frequent occurrence of extreme weather and out-of-balance climate systems. Innov. Geosci. 2024, 2, 100049. [Google Scholar] [CrossRef]
  6. Van Hooidonk, R.; Maynard, J.A.; Planes, S. Temporary refugia for coral reefs in a warming world. Nat. Clim. Change 2013, 3, 508–511. [Google Scholar] [CrossRef]
  7. Tamura, M.; Kumano, N.; Yotsukuri, M.; Yokoki, H. Global assessment of the effectiveness of adaptation in coastal areas based on RCP/SSP scenarios. Clim. Change 2019, 152, 363–377. [Google Scholar] [CrossRef]
  8. Ericson, J.P.; Vörösmarty, C.J.; Dingman, S.L.; Ward, L.G.; Meybeck, M. Effective sea-level rise and deltas: Causes of change and human dimension implications. Glob. Planet. Change 2006, 50, 63–82. [Google Scholar] [CrossRef]
  9. Paola, C.; Twilley, R.R.; Edmonds, D.A.; Kim, W.; Mohrig, D.; Parker, G.; Viparelli, E.; Voller, V.R. Natural processes in delta restoration: Application to the Mississippi Delta. Annu. Rev. Mar. Sci. 2011, 3, 67–91. [Google Scholar] [CrossRef]
  10. Macreadie, P.I.; Costa, M.D.P.; Atwood, T.B.; Friess, D.A.; Kelleway, J.J.; Kennedy, H.; Lovelock, C.E.; Serrano, O.; Duarte, C.M. Blue carbon as a natural climate solution. Nat. Rev. Earth Environ. 2021, 2, 826–839. [Google Scholar] [CrossRef]
  11. Higgins, S.A. Advances in delta-subsidence research using satellite methods. Hydrogeol. J. 2016, 24, 587. [Google Scholar] [CrossRef]
  12. Zhang, J.Z.; Huang, H.J.; Bi, H.B. Land subsidence in the modern Yellow River Delta based on InSAR time series analysis. Nat. Hazards 2015, 75, 2385–2397. [Google Scholar] [CrossRef]
  13. Liu, Y.L.; Liu, J.Q.; Xia, X.F.; Bi, H.B.; Huang, H.J.; Ding, R.W.; Zhao, L.H. Land subsidence of the Yellow River Delta in China driven by river sediment compaction. Sci. Total Environ. 2021, 750, 142165. [Google Scholar] [CrossRef] [PubMed]
  14. Wang, G.Y.; Li, P.; Li, Z.D.; Ding, D.; Qiao, L.L.; Xu, J.S.; Li, G.X.; Wang, H.J. Coastal dam inundation assessment for the Yellow River Delta: Measurements, analysis and scenario. Remote Sens. 2020, 12, 3658. [Google Scholar] [CrossRef]
  15. Li, P.; Wang, G.Y.; Liang, C.R.; Wang, H.J.; Li, Z.H. InSAR-derived coastal subsidence reveals new inundation scenarios over the Yellow River Delta. IEEE J. Sel. Top. Appl. Earth Obs. Remote Sens. 2023, 16, 8431–8441. [Google Scholar] [CrossRef]
  16. Chen, Z.F.; Wang, W.G.; Forzieri, G.; Cescatti, A. Transition from positive to negative indirect CO2 effects on the vegetation carbon uptake. Nat. Commun. 2024, 15, 1500. [Google Scholar] [CrossRef]
  17. Tan, L.S.; Ge, Z.M.; Li, S.H.; Zhou, K.; Lai, D.Y.F.; Temmerman, S.; Dai, Z.J. Impacts of land-use change on carbon dynamics in China’s coastal wetlands. Sci. Total Environ. 2023, 890, 164206. [Google Scholar] [CrossRef]
  18. Sasmito, S.D.; Taillardat, P.; Clendenning, J.N.; Cameron, C.; Friess, D.A.; Murdiyarso, D.; Hutley, L.B. Effect of land-use and land-cover change on mangrove blue carbon: A systematic review. Glob. Change Biol. 2019, 25, 4291–4302. [Google Scholar] [CrossRef]
  19. Zhu, L.Y.; Song, R.X.; Sun, S.; Li, Y.; Hu, K. Land use/land cover change and its impact on ecosystem carbon storage in coastal areas of China from 1980 to 2050. Ecol. Indic. 2022, 142, 109178. [Google Scholar] [CrossRef]
  20. Fu, X.; Liu, G.H.; Chai, S.Y.; Huang, C.; Li, F.D. Spatial-temporal analysis of wetland landscape pattern under the influence of artificial dykes in the Yellow River delta. Chin. J. Popul. Resour. Environ. 2013, 11, 109–117. [Google Scholar] [CrossRef]
  21. Guo, X.S.; Fan, N.; Liu, Y.H.; Liu, X.L.; Wang, Z.K.; Xie, X.T.; Jia, Y.G. Deep seabed mining: Frontiers in engineering geology and environment. Int. J. Coal Sci. Technol. 2023, 10, 23. [Google Scholar] [CrossRef]
  22. Natural Capital Project. InVEST 3.14.2, Stanford University: Stanford, CA, USA; University of Minnesota: Minneapolis, MN, USA; Chinese Academy of Sciences: Beijing, China; The Nature Conservancy: Arlington County, VA, USA; World Wildlife Fund: Gland, Switzerland; Stockholm Resilience Centre and the Royal Swedish Academy of Sciences: Stockhom, Sweden, 2024.
  23. García-Ontiyuelo, M.; Acuña-Alonso, C.; Valero, E.; Álvarez, X. Geospatial mapping of carbon estimates for forested areas using the InVEST model and Sentinel-2: A case study in Galicia (NW Spain). Sci. Total Environ. 2024, 922, 171297. [Google Scholar] [CrossRef] [PubMed]
  24. Li, C.Q.; Xu, H.Q.; Du, P.J.; Tang, F. Predicting land cover changes and carbon stock fluctuations in Fuzhou, China: A deep learning and InVEST approach. Ecol. Indic. 2024, 167, 112658. [Google Scholar] [CrossRef]
  25. Aitali, R.; Snoussi, M.; Kolker, A.S.; Oujidi, B.; Mhammdi, N. Effects of land use/land cover changes on carbon storage in North African Coastal Wetlands. J. Mar. Sci. Eng. 2022, 10, 364. [Google Scholar] [CrossRef]
  26. Etemadi, H.; Smoak, J.M.; Karami, J. Land use change assessment in coastal mangrove forests of Iran utilizing satellite imagery and CA-Markov algorithms to monitor and predict future change. Environ. Earth Sci. 2018, 77, 208. [Google Scholar] [CrossRef]
  27. Firozjaei, M.K.; Sedighi, A.; Argany, M.; Jelokhani-Niaraki, M.; Arsanjani, J.J. A geographical direction-based approach for capturing the local variation of urban expansion in the application of CA-Markov model. Cities 2019, 93, 120–135. [Google Scholar] [CrossRef]
  28. Liu, X.P.; Liang, X.; Li, X.; Xu, X.C.; Ou, J.P.; Chen, Y.M.; Li, S.Y.; Wang, S.J.; Pei, F.S. A future land use simulation model (FLUS) for simulating multiple land use scenarios by coupling human and natural effects. Landsc. Urban Plan. 2017, 168, 94–116. [Google Scholar] [CrossRef]
  29. Çağlıyan, A.; Dağlı, D. Monitoring land use land cover changes and modelling of urban growth using a future land use simulation model (FLUS) in Diyarbakır, Turkey. Sustainability 2022, 14, 9180. [Google Scholar] [CrossRef]
  30. Liang, X.; Guan, Q.F.; Clarke, K.C.; Liu, S.S.; Wang, B.Y.; Yao, Y. Understanding the drivers of sustainable land expansion using a patch-generating land use simulation (PLUS) model: A case study in Wuhan, China. Comput. Environ. Urban Syst. 2021, 85, 101569. [Google Scholar] [CrossRef]
  31. Zhang, S.Q.; Yang, P.; Xia, J.; Wang, W.Y.; Cai, W.; Chen, N.C.; Hu, S.; Luo, X.G.; Li, J.; Zhan, C.S. Land use/land cover prediction and analysis of the middle reaches of the Yangtze River under different scenarios. Sci. Total Environ. 2022, 833, 155238. [Google Scholar] [CrossRef]
  32. Luo, G.P.; Yin, C.Y.; Chen, X.; Xu, W.Q.; Lu, L. Combining system dynamic model and CLUE-S model to improve land use scenario analyses at regional scale: A case study of Sangong watershed in Xinjiang, China. Ecol. Complex. 2010, 7, 198–207. [Google Scholar] [CrossRef]
  33. Verburg, P.H.; Soepboer, W.; Veldkamp, A.; Limpiada, R.; Espaldon, V.; Mastura, S.S.A. Modeling the spatial dynamics of regional land use: The CLUE-S model. Environ. Manag. 2002, 30, 391–405. [Google Scholar] [CrossRef] [PubMed]
  34. Khachoo, Y.H.; Cutugno, M.; Robustelli, U.; Pugliano, G. Impact of land use and land cover (LULC) changes on carbon stocks and economic implications in Calabria using Google Earth Engine (GEE). Sensors 2024, 24, 5836. [Google Scholar] [CrossRef] [PubMed]
  35. Grassi, G.; Conchedda, G.; Federici, S.; Abad Viñas, R.; Korosuo, A.; Melo, J.; Rossi, S.; Sandker, M.; Somogyi, Z.; Vizzarri, M.; et al. Carbon fluxes from land 2000–2020: Bringing clarity to countries’ reporting. Earth Syst. Sci. Data 2022, 14, 4643–4666. [Google Scholar] [CrossRef]
  36. Zhao, J.F.; Liu, D.S.; Zhu, Y.J.; Peng, H.W.; Xie, H.F. A review of forest carbon cycle models on spatiotemporal scales. J. Clean. Prod. 2022, 339, 130692. [Google Scholar] [CrossRef]
  37. Zhang, J.J.; Yang, J.; Liu, P.F.; Liu, Y.; Zheng, Y.W.; Shen, X.Y.; Li, B.C.; Song, H.Q.; Liang, Z.Z. Effects of land use/cover change on terrestrial carbon stocks in the Yellow River Basin of China from 2000 to 2030. Remote Sens. 2024, 16, 1810. [Google Scholar] [CrossRef]
  38. Ding, Q.L.; Chen, Y.; Bu, L.T.; Ye, Y.M. Multi-scenario analysis of habitat quality in the Yellow River delta by coupling FLUS with InVEST model. Int. J. Environ. Res. Public Health 2021, 18, 2389. [Google Scholar] [CrossRef]
  39. Duan, H.L.; Yu, X.B. Land-use change, habitat connectivity, and conservation gaps: A case study of shorebird species in the Yellow River Delta of China using the InVEST model and network analysis. Remote Sens. 2022, 14, 6191. [Google Scholar] [CrossRef]
  40. Liu, X.L.; Zheng, J.W.; Zhang, H.; Zhang, S.T.; Liu, B.H.; Shan, H.X.; Jia, Y.G. Sediment critical shear stress and geotechnical properties along the modern Yellow River Delta, China. Mar. Georesour. Geotechnol. 2018, 36, 875–882. [Google Scholar] [CrossRef]
  41. Jiang, D.J.; Fu, X.F.; Wang, K. Vegetation dynamics and their response to freshwater inflow and climate variables in the Yellow River Delta, China. Quat. Int. 2013, 304, 75–84. [Google Scholar] [CrossRef]
  42. Liu, X.L.; Jia, Y.G.; Zheng, J.W.; Yang, X.J.; Shan, H.X. Consolidation of sediments discharged from the Yellow River: Implications for sediment erodibility. Ocean Dyn. 2013, 63, 371–384. [Google Scholar] [CrossRef]
  43. Liu, Y.X.; Huang, H.J.; Qiu, Z.F.; Fan, J.Y. Detecting coastline change from satellite images based on beach slope estimation in a tidal flat. Int. J. Appl. Earth Obs. Geoinf. 2013, 23, 165–176. [Google Scholar] [CrossRef]
  44. Liu, X.L.; Liu, J.P.; Wang, Y.P. Sediment dynamics and geohazards in estuaries and deltas. Front. Earth Sci. 2023, 10, 1079804. [Google Scholar] [CrossRef]
  45. Wang, G.Y.; Li, P.; Li, Z.H.; Liang, C.R.; Wang, H.J. Coastal subsidence detection and characterization caused by brine mining over the Yellow River Delta using time series InSAR and PCA. Int. J. Appl. Earth Obs. Geoinf. 2022, 114, 103077. [Google Scholar] [CrossRef]
  46. Zhang, J. Sea Level Change in Coastal China Seas During the 21st Based on SSPs Scenarios. Master’s Dissertation, Zhejiang Ocean University, Zhoushan, China, 2022. (In Chinese). [Google Scholar] [CrossRef]
  47. Fan, J.P.; Zeng, G.H.; Body, M.; Hacid, M.S. Seeded region growing: An extensive and comparative study. Pattern Recognit. Lett. 2005, 26, 1139–1156. [Google Scholar] [CrossRef]
  48. Dawson, R.; Hall, J.; Sayers, P.; Bates, P.; Rosu, C. Sampling-based flood risk analysis for fluvial dike systems. Stoch. Environ. Res. Risk Assess. 2005, 19, 388–402. [Google Scholar] [CrossRef]
  49. Liu, R.Y.; Liu, N. Flood area and damage estimation in Zhejiang, China. J. Environ. Manag. 2002, 66, 1–8. [Google Scholar] [CrossRef]
  50. Palamakumbure, L.; Ratnayake, A.S.; Premasiri, H.M.R.; Ratnayake, N.P.; Katupotha, J.; Dushyantha, N.; Weththasinghe, S.; Weerakoon, W.A.P. Sea-level inundation and risk assessment along the south and southwest coasts of Sri Lanka. Geoenviron. Disasters 2020, 7, 17. [Google Scholar] [CrossRef]
  51. Berardino, P.; Fornaro, G.; Lanari, R.; Sansosti, E. A new algorithm for surface deformation monitoring based on small baseline differential SAR interferograms. IEEE Trans. Geosci. Remote Sens. 2002, 40, 2375–2383. [Google Scholar] [CrossRef]
  52. Hooper, A. A multi-temporal InSAR method incorporating both persistent scatterer and small baseline approaches. Geophys. Res. Lett. 2008, 35, 302–307. [Google Scholar] [CrossRef]
  53. Wang, S.Y.; Zhang, G.; Chen, Z.W.; Cui, H.; Zheng, Y.Z.; Xu, Z.X.; Li, Q.H. Surface deformation extraction from small baseline subset synthetic aperture radar interferometry (SBAS-InSAR) using coherence-optimized baseline combinations. GISci. Remote Sens. 2022, 59, 295–309. [Google Scholar] [CrossRef]
  54. Li, S.F.; Hong, Z.L.; Xue, X.P.; Zheng, X.F.; Du, S.S.; Liu, X.F. Evolution characteristics and multi-scenario prediction of habitat quality in Yulin City based on PLUS and InVEST models. Sci. Rep. 2024, 14, 11852. [Google Scholar] [CrossRef] [PubMed]
  55. Wang, J.B.; Wu, Y.F.; Gou, A.P. Habitat quality evolution characteristics and multi-scenario prediction in Shenzhen based on PLUS and InVEST models. Front. Environ. Sci. 2023, 11, 1146347. [Google Scholar] [CrossRef]
  56. Wei, R.H.; Fan, Y.M.; Wu, H.Q.; Zheng, K.; Fan, J.; Liu, Z.; Xuan, J.W.; Zhou, J.E. The value of ecosystem services in arid and semi-arid regions: A multi-scenario analysis of land use simulation in the Kashgar region of Xinjiang. Ecol. Model. 2024, 488, 110579. [Google Scholar] [CrossRef]
  57. Sang, L.L.; Zhang, C.; Yang, J.Y.; Zhu, D.H.; Yun, W.J. Simulation of land use spatial pattern of towns and villages based on CA-Markov model. Math. Comput. Model. 2011, 54, 938–943. [Google Scholar] [CrossRef]
  58. Yang, X.D.; Bai, Y.P.; Che, L.; Qiao, F.W.; Xie, L.X. Incorporating ecological constraints into urban growth boundaries: A case study of ecologically fragile areas in the Upper Yellow River. Ecol. Indic. 2021, 124, 107436. [Google Scholar] [CrossRef]
  59. Wang, Q.H.; Kalantar-Zadeh, K.; Kis, A.; Coleman, J.N.; Strano, M.S. Electronics and optoelectronics of two-dimensional transition metal dichalcogenides. Nat. Nanotechnol. 2012, 7, 699–712. [Google Scholar] [CrossRef]
  60. Wickramasuriya, R.C.; Bregt, A.K.; Van Delden, H.; Hagen-Zanker, A. The dynamics of shifting cultivation captured in an extended Constrained Cellular Automata land use model. Ecol. Model. 2009, 220, 2302–2309. [Google Scholar] [CrossRef]
  61. Sun, C.M.; Hall, J.A.; Blank, R.B.; Bouladoux, N.; Oukka, M.; Mora, J.R.; Belkaid, Y. Small intestine lamina propria dendritic cells promote de novo generation of Foxp3 T reg cells via retinoic acid. J. Exp. Med. 2007, 204, 1775–1785. [Google Scholar] [CrossRef]
  62. Li, Y.; Geng, H.C. Spatiotemporal trends in ecosystem carbon stock evolution and quantitative attribution in a karst watershed in southwest China. Ecol. Indic. 2023, 153, 110429. [Google Scholar] [CrossRef]
  63. Nelson, E.; Mendoza, G.; Regetz, J.; Polasky, S.; Tallis, H.; Cameron, D.; Chan, K.M.; Daily, G.C.; Goldstein, J.; Kareiva, P.M.; et al. Modeling multiple ecosystem services, biodiversity conservation, commodity production, and tradeoffs at landscape scales. Front. Ecol. Environ. 2009, 7, 4–11. [Google Scholar] [CrossRef]
  64. Bacani, V.M.; da Silva, B.H.M.; Sato, A.A.D.S.A.; Sampaio, B.D.S.; da Cunha, E.R.; Vick, E.P.; de Oliveirira, V.F.R.; Decco, H.F. Carbon storage and sequestration in a eucalyptus productive zone in the Brazilian Cerrado, using the Ca-Markov/Random Forest and InVEST models. J. Clean. Prod. 2024, 444, 141291. [Google Scholar] [CrossRef]
  65. Gong, W.F.; Duan, X.Y.; Mao, M.J.; Hu, J.H.; Sun, Y.X.; Wu, G.H.; Zhang, Y.Y.; Xie, Y.D.; Qiu, X.C.; Rao, X.D.; et al. Assessing the impact of land use and changes in land cover related to carbon storage by linking trajectory analysis and InVEST models in the Nandu River Basin on Hainan Island in China. Front. Environ. Sci. 2022, 10, 1038752. [Google Scholar] [CrossRef]
  66. Xu, L.; Yu, G.R.; He, N.P. Increased soil organic carbon storage in Chinese terrestrial ecosystems from the 1980s to the 2010s. J. Geogr. Sci. 2019, 29, 49–66. [Google Scholar] [CrossRef]
  67. Yang, F.; Li, S.C.; Gao, Y.; Li, M.J.; Wu, P.F. Inconsistent carbon budget estimation using dynamic/static carbon density under land use and land cover change: A case study in Henan Province, China. Land 2022, 11, 2232. [Google Scholar] [CrossRef]
  68. Yang, J.; Xie, B.P.; Zhang, D.G. Spatio-temporal evolution of carbon stocks in the Yellow River Basin based on InVEST and CA-Markov models. Chin. J. Eco-Agric. 2021, 29, 1018–1029. [Google Scholar] [CrossRef]
  69. Giardina, C.P.; Ryan, M.G. Evidence that decomposition rates of organic carbon in mineral soil do not vary with temperature. Nature 2000, 404, 858–861. [Google Scholar] [CrossRef]
  70. Chuai, X.W.; Huang, X.J.; Lai, L.; Wang, W.J.; Peng, J.W.; Zhao, R.Q. Land use structure optimization based on carbon storage in several regional terrestrial ecosystems across China. Environ. Sci. Policy 2013, 25, 50–61. [Google Scholar] [CrossRef]
  71. Kok, K.; Pedde, S.; Gramberger, M.; Harrison, P.A.; Holman, I.P. New European socio-economic scenarios for climate change research: Operationalising concepts to extend the shared socio-economic pathways. Reg. Environ. Change 2019, 19, 643–654. [Google Scholar] [CrossRef]
  72. Wu, J.Y.; Luo, J.G.; Zhang, H.; Qin, S.; Yu, M.J. Projections of land use change and habitat quality assessment by coupling climate change and development patterns. Sci. Total Environ. 2022, 847, 157491. [Google Scholar] [CrossRef]
  73. Wang, H.J.; Yang, Z.S.; Bi, N.S.; Li, H.D. Rapid shifts of the river plume pathway off the Huanghe (Yellow) River mouth in response to water-sediment regulation scheme in 2005. Chin. Sci. Bull. 2005, 50, 2878–2884. [Google Scholar] [CrossRef]
  74. Wang, H.J.; Wu, X.; Bi, N.S.; Li, S.; Yuan, P.; Wang, A.M.; Syvitski, J.P.M.; Saito, Y.; Yang, Z.S.; Liu, S.M.; et al. Impacts of the dam-orientated water-sediment regulation scheme on the lower reaches and delta of the Yellow River (Huanghe): A review. Glob. Planet. Change 2017, 157, 93–113. [Google Scholar] [CrossRef]
  75. Chen, W.G.; Zhang, Q.P.; Kong, X.B.; Duan, X.F.; Zuo, X.Y.; Tan, M.; Zhao, J.; Dong, T. Optimizing rules and empirical research of provincial permanent basic farmland layout based on the “Three-line” coordination. Trans. CSAE 2021, 37, 248–257. [Google Scholar] [CrossRef]
  76. Nwankwo, C.; Tse, A.C.; Nwankwoala, H.O.; Giadom, F.D.; Acra, E.J. Below ground carbon stock and carbon sequestration potentials of mangrove sediments in Eastern Niger Delta, Nigeria: Implication for climate change. Sci. Afr. 2023, 22, e01898. [Google Scholar] [CrossRef]
  77. Sendrowski, A.; Wohl, E.; Hilton, R.; Kramer, N.; Ascough, P. Wood-based carbon storage in the Mackenzie River Delta: The world’s largest mapped riverine wood deposit. Geophys. Res. Lett. 2023, 50, e2022GL100913. [Google Scholar] [CrossRef]
  78. Raich, J.W.; Nadelhoffer, K.J. Belowground carbon allocation in forest ecosystems: Global trends. Ecology 1989, 70, 1346–1354. [Google Scholar] [CrossRef]
  79. Duan, H.Z.; Li, Y.S.; Li, B.Q.; Li, H. Fast InSAR time-series analysis method in a full-resolution SAR coordinate system: A case study of the Yellow River Delta. Sustainability 2022, 14, 10597. [Google Scholar] [CrossRef]
  80. Wang, F.W.; Miyajima, M.; Dahal, R.; Timilsina, M.; Li, T.L.; Fujiu, M.; Kuwada, Y.; Zhao, Q.L. Effects of topographic and geological features on building damage caused by 2015.4.25 Mw7. 8 Gorkha earthquake in Nepal: A preliminary investigation report. Geoenviron. Disasters 2016, 3, 7. [Google Scholar] [CrossRef]
  81. Fang, J.Y.; Nicholls, R.J.; Brown, S.; Lincke, D.; Hinkel, J.; Vafeidis, A.T.; Du, S.Q.; Zhao, Q.; Liu, M.; Shi, P.J. Benefits of subsidence control for coastal flooding in China. Nat. Commun. 2022, 13, 6946. [Google Scholar] [CrossRef]
Figure 1. Schematic map of the geographical extent and resource exploitation distribution in the Yellow River Delta (YRD), located in the lower reaches of the Yellow River Basin (YRB). (ac) Typical oil, gas, and underground brine extraction areas within the study region.
Remotesensing 17 01603 g001
Figure 2. Research framework for multi-scenario land use and land cover change (LULCC) simulation and carbon storage assessment in the YRD considering seawater inundation risk. (a) Land subsidence (LS) rate inversion; (b) Subsidence of each land use type; (c) Future sea-level rise (SLR) projections; (d) Active flooding algorithm principle. (EPS: Ecological Protection Scenario; NDS: Natural Development Scenario; EGS: Economic Growth Scenario).
Remotesensing 17 01603 g002
Figure 3. Spatial distribution of land use types in the YRD from 1990 to 2020. (PF: paddy field; DR: dryland; WO: woodland; GR: grassland; RC: river and canal; LA: lake; RP: reservoir and pond; BO: bottomland; WE: wetland; TF: tidal flat; SP: salt pan; CA: culture area; CL: construction land; UL: unused land).
Remotesensing 17 01603 g003
Figure 4. Changes in land use types and areas in the YRD from 1990 to 2020. (a,b) Annual area statistics of each land use type; (c) Area proportion of each land use type; (d) Change in area of each land use type from 1990 to 2020. (PF: paddy field; DR: dryland; WO: woodland; GR: grassland; RC: river and canal; LA: lake; RP: reservoir and pond; BO: bottomland; WE: wetland; TF: tidal flat; SP: salt pan; CA: culture area; CL: construction land; UL: unused land).
Remotesensing 17 01603 g004
Figure 5. Sankey diagram of land use change in the YRD from 1990 to 2020. (PF: paddy field; DR: dryland; WO: woodland; GR: grassland; RC: river and canal; LA: lake; RP: reservoir and pond; BO: bottomland; WE: wetland; TF: tidal flat; SP: salt pan; CA: culture area; CL: construction land; UL: unused land).
Remotesensing 17 01603 g005
Figure 6. Spatial distribution of unit carbon storage in the YRD from 1990 to 2020. (Areas with low unit carbon storage are primarily located in the coastal zones, while the areas with medium unit carbon storage are mainly located in the regions where wetlands extend inland. The areas with high unit carbon storage are mainly located between the low and medium value areas, as well as along the banks of the YRB).
Remotesensing 17 01603 g006
Figure 7. Changes in carbon storage in different land use types and carbon pools in the YRD from 1990 to 2020. (a,b) Annual carbon storage of each land use type; (c) Annual total carbon storage (right y-axis, green line) and annual carbon storage in different carbon pools (left y-axis); (d) Changes in carbon storage in different carbon pools from 1990 to 2020, with gray shadows used to represent the span of years. (PF: paddy field; DR: dryland; WO: woodland; GR: grassland; RC: river and canal; LA: lake; RP: reservoir and pond; BO: bottomland; WE: wetland; TF: tidal flat; SP: salt pan; CA: culture area; CL: construction land; UL: unused land).
Remotesensing 17 01603 g007
Figure 8. Dynamic changes in the spatial distribution of carbon storage in the YRD from 1990 to 2020. (Areas with an increase in unit carbon storage greater than 10% are defined as carbon storage increase zones (carbon sink zones), while areas with a decrease in unit carbon storage greater than 10% are defined as carbon storage decrease zones (carbon source zones), areas with changes within ±10% are defined as stable carbon storage zones).
Remotesensing 17 01603 g008
Figure 9. Net transfer of carbon storage in and out of various land use types in the YRD from 1990 to 2020. (PF: paddy field; DR: dryland; WO: woodland; GR: grassland; RC: river and canal; LA: lake; RP: reservoir and pond; BO: bottomland; WE: wetland; TF: tidal flat; SP: salt pan; CA: culture area; CL: construction land; UL: unused land).
Remotesensing 17 01603 g009
Figure 10. LS in the YRD from 2020 to 2024. (a) Interpolated LS rate; (b) Area of distribution (left y-axis, green frames) and average rate (right y-axis, orange line) of land use types with subsidence rates greater than 10 mm/a. (PF: paddy field; DR: dryland; WO: woodland; GR: grassland; RC: river and canal; LA: lake; RP: reservoir and pond; BO: bottomland; WE: wetland; TF: tidal flat; SP: salt pan; CA: culture area; CL: construction land; UL: unused land).
Remotesensing 17 01603 g010
Figure 11. Land use distribution pattern and inundation situation in the YRD in 2030 and 2060 under different scenarios. (EPS: Ecological Protection Scenario; NDS: Natural Development Scenario; EGS: Economic Growth Scenario; PF: paddy field; DR: dryland; WO: woodland; GR: grassland; RC: river and canal; LA: lake; RP: reservoir and pond; BO: bottomland; WE: wetland; TF: tidal flat; SP: salt pan; CA: culture area; CL: construction land; UL: unused land).
Remotesensing 17 01603 g011
Figure 12. Carbon storage distribution pattern and inundation situation in the YRD in 2030 and 2060 under different scenarios. (EPS: Ecological Protection Scenario; NDS: Natural Development Scenario; EGS: Economic Growth Scenario).
Remotesensing 17 01603 g012
Table 1. Research data and sources.
Data CategoryData DescriptionYearData SourceData Type
Remote sensingLand use1990, 2000, 2010, 2020https://www.resdc.cn/, accessed on 25 September 2024Raster
Sentinel-1A2020–2024https://dataspace.copernicus.eu/, accessed on 24 September 2024
Landsat 8 OLI_TIRS2021https://www.gscloud.cn/home, accessed on 24 September 2024
Natural
environment
DEM2020https://www.nasa.gov/, accessed on 24 September 2024Raster
SlopeObtained by DEM calculation
Average annual temperaturehttps://www.resdc.cn/, accessed on 25 September 2024
Average annual precipitation
Soil typeUnknown
Socio-economicPopulation density2020https://www.resdc.cn/, accessed on 25 September 2024Raster
GDP
Location
conditions
Distance to protected area2020https://www.webmap.cn/, accessed on 26 September 2024Vector
Distance to water
Distance to city
Distance to railway
Distance to highway
Distance to national highway
Distance to provincial highway
Distance to county highway
OthersSLR2030, 2060[46]Statistics
Carbon density2010https://www.nesdc.org.cn/, accessed on 27 September 2024
Table 2. Carbon density of land use types in the YRD (unit: t/hm2). (PF: paddy field; DR: dryland; WO: woodland; GR: grassland; RC: river and canal; LA: lake; RP: reservoir and pond; BO: bottomland; WE: wetland; TF: tidal flat; SP: salt pan; CA: culture area; CL: construction land; UL: unused land).
Land Use TypeAboveground
Carbon Density
Underground
Carbon Density
Soil
Carbon Density
Dead Organic
Carbon Density
PF8.5525.50.3
DR103.317.80.3
WO34.27.419.22.8
GR14.36.215.71.5
RC1.250.4200
LA1.250.4250
RP0.80.4270
BO1.50.5150
WE20.616.60.1
TF00160
SP0012.80
CA0.50.1120
CL0014.40
UL0017.70
Table 3. Land use transfer in the YRD from 1990 to 2020 (unit: km2). (PF: paddy field; DR: dryland; WO: woodland; GR: grassland; RC: river and canal; LA: lake; RP: reservoir and pond; BO: bottomland; WE: wetland; TF: tidal flat; SP: salt pan; CA: culture area; CL: construction land; UL: unused land).
Land Use TypePFDRWOGRRCLARPBOWETFSPCACLUL
PF22.89114.1900.010.030.044.910001.420.0138.470
DR67.621933.870.019.413.260.0362.340.2514.160.036.9524.89177.090
WO0.1510.580.4700.0900.160.03000.2702.120
GR8.19385.728.0673.173.25073.990.45110.86133.6881.10172.37118.460.07
RC0.068.480.040.5585.4000.0814.860.0811.020.020.541.080
LA00.6600.3401.100.8300.11000.150.450
RP8.2874.2900.550.250110.721.1610.520.9739.14130.7335.330
BO08.32001.3700.354.890.060.200.040.010.050
WE14.45260.39016.521.11015.963.9141.0158.0169.11182.82100.161.20
TF0005.742.5500.2611.920.02313.360.337.901.780.27
SP00000000000000
CA00000000000000
CL0.9689.7704.100.220.033.320.038.0812.0594.592.70441.500
UL0.0422.4300.250.09010.8911.57034.3513.9052.1855.780.60
Table 4. Statistics of seawater inundation in the YRD in 2030 and 2060 under different scenarios. (EPS: Ecological Protection Scenario; NDS: Natural Development Scenario; EGS: Economic Growth Scenario).
Scenario SimulationEPSNDSEGS
Year203020602030206020302060
Height of SLR (cm)13.7416.6815.9020.4615.5122.41
Inundation area (km2)68.93478.7895.30571.80428.90590.52
Land area (km2)6227.645817.806201.275724.785867.675706.05
Lost carbon storage
(×106 t)
0.171.350.241.581.231.73
Remaining carbon
storage (×106 t)
14.4313.2614.3412.8814.2413.73
Disclaimer/Publisher’s Note: The statements, opinions and data contained in all publications are solely those of the individual author(s) and contributor(s) and not of MDPI and/or the editor(s). MDPI and/or the editor(s) disclaim responsibility for any injury to people or property resulting from any ideas, methods, instructions or products referred to in the content.

