Abstract
The Moderate Resolution Imaging Spectroradiometer (MODIS) provides consistent long-term satellite observations that are valuable for rice mapping and production estimation through phenology extraction. This study evaluates the effectiveness of three MODIS products, MOD09GQ (1-day), MOD09Q1 (8-day), and MOD13Q1 (16-day), for mapping rice phenology in An Giang Province, a key rice-producing region in Vietnam’s climate-sensitive Mekong River Delta (MRD). The analysis focuses on rice cropping seasons from 2019 to 2021, using time series of the Normalized Difference Vegetation Index (NDVI) to capture temporal and spatial variations in rice growth dynamics. To address data gaps due to persistent cloud cover and sensor-related noises, smoothing techniques, including the Double Logistic Function (DLF) and Savitzky–Golay Filtering (SGF), were applied. Thirteen phenological parameters were extracted and used as inputs to an unsupervised K-Means clustering algorithm, enabling the classification of distinct rice growth patterns. The results show that DLF-processed MOD09GQ data most accurately reconstructed NDVI time series and captured short-term phenological transitions, outperforming coarser-resolution products. The resulting phenology maps could be used to correlate the influence of anthropogenic factors, such as the widespread adoption of short-duration rice varieties and shifts in water management practices. This study provides a robust framework for phenology-based rice mapping to support food security, sustainable agricultural planning, and climate resilience in the MRD.
1. Introduction
Rice is a vital cereal crop that serves as a staple food for over half of the global population [1], and worldwide rice consumption is also expected to increase with the projected population increase [2]. Therefore, crop information is very necessary for policymakers to make informed decisions. In Vietnam, information on rice cultivation is primarily obtained from governmental agricultural statistical agencies. However, these data are often not updated in a timely manner due to the challenges these agencies face in accurately monitoring rice growth across diverse geographic regions. Nevertheless, such data are critically important for stakeholders, including exporters, brokers, insurance providers, food companies, producers, and others [3]. Despite the relatively short duration of the rice crop cycle in Vietnam, each phenological stage exhibits distinct vegetation reflectance characteristics that can be possibly identified through the analysis of multi-temporal satellite imagery [4,5,6,7,8,9]. The phenology-based approach using the vegetation index time series dataset is a breakthrough technique and an alternative method for updating rice crop information [10].
The Moderate Resolution Imaging Spectroradiometer (MODIS) satellite, launched in 1999 and 2002 by the US National Aeronautics and Space Administration (NASA), provides valuable optical image data for studying a variety of disciplines. With 36 spectral bands, a temporal resolution of daily and near-daily global coverage, and a spatial resolution of up to 250 m, MODIS offers a robust dataset for distinguishing subtle differences in surface reflectance [11]. The MODIS products, including MODIS/Terra Surface Reflectance Daily L2G Global 250 m SIN Grid (MOD09GQ), MODIS/Terra Surface Reflectance 8-Day L3 Global 250 m SIN Grid (MOD09Q1), and MODIS/Terra Surface Reflectance 16-Day L3 Global 250 m SIN Grid (MOD13Q1), are frequently used to interpret surface changes and biophysical characteristics of global vegetation [12].
Among these MODIS products, the daily MOD09GQ dataset appears to be well suited for capturing rapid changes in vegetation phenology due to its high temporal resolution. However, the practical application of daily MODIS data for detailed crop phenology analysis is often constrained by frequent cloud cover and inherent data discontinuities [13,14,15]. Consequently, prior studies have predominantly employed temporally composited MODIS products with coarser temporal resolutions (e.g., 8-day or 16-day composites) [8,16,17], or have integrated MODIS data with higher spatial resolution satellite observations, such as those from Landsat, to improve data usability and spatial detail [18]. Additionally, the reconstruction of missing observations in daily MOD09GQ data has been proposed as a viable strategy to enhance the accuracy and continuity of phenological feature extraction [16]. Accurate identification of crop phenological stages enables the optimization of site-specific agricultural practices [18,19]. In the case of rice, phenological mapping involves delineating key growth stages, such as transplanting, heading, and maturity [20,21]. Timely and accurate monitoring of rice phenology is essential for supporting food security [22,23,24] and for facilitating assessments of climate change impacts on rice production systems [25].
The Mekong River Delta (MRD) is an extensive and crucial agroecological region situated in the southern part of Vietnam, bordering Cambodia to the North and the Gulf of Thailand and the East Sea to the Southwest and Southeast, respectively. As Vietnam’s most important rice production region, the Mekong River Delta (MRD) contributes approximately 50% of Vietnam’s total rice production and accounts for 90% of the country’s rice exports [26]. Despite its critical role in national and global food supply, the MRD is recognized as one of the regions most vulnerable to the adverse impacts of climate change [27]. In recent years, the region has experienced increasingly variable rice-growing seasons, posing significant risks to both overall rice production in the MRD and national food security [28]. The region comprises thirteen administrative provincial units; among them, An Giang Province, known for its rice cultivation scale and high rice productivity [29], was chosen as the study area because of its frequent rotation of rice cultivation locations. The high temporal and spatial variation of rice phenology in this area is challenging to capture, making it suitable for testing the effectiveness of phenology extraction methods using MODIS products with different temporal resolutions.
This study aims to improve the extraction of rice phenological information using MODIS satellite imagery in An Giang Province, Vietnam, focusing on the cropping seasons from 2019 to 2021. Extracting accurate phenological metrics from optical satellite data presents significant challenges due to persistent cloud contamination, atmospheric disturbances, and sensor-related noise [3,30,31]. To address these issues, this study evaluates various temporal smoothing techniques, particularly the Double Logistic Function (DLF) and Savitzky–Golay filtering, to reconstruct missing observations in the daily MOD09GQ NDVI time series. Thirteen phenological parameters, including Start-of-Season (SOS), End-of-Season (EOS), and Middle-of-Season (MOS), among others, were derived and utilized as input features for unsupervised K-Means clustering to classify diverse rice cultivation patterns. The optimal number of clusters was determined objectively using the Silhouette Score and Average Silhouette Width (ASW) [32], allowing for a fully automated classification workflow. Ground-truth validation was conducted by comparing MODIS-derived SOS, MOS, and EOS with field-recorded sowing, heading, and harvesting dates. This integrated approach is expected to enhance the utility of MODIS products for phenology-based rice mapping, contributing to improved rice production estimation, and supporting regional food security, sustainable agriculture, and climate resilience.
2. Materials and Methods
2.1. Study Area
An Giang Province covers an area of approximately 3537 km2, between 104.42–105.39E and 10.10–10.58N. It is in the northwest of the MRD and is surrounded by Dong Thap, Kien Giang Provinces, and Can Tho city on its east, west, and south sides (Figure 1). It encompasses eleven sub-administrative areas, including cities such as Long Xuyen and Chau Doc, Tan Chau town, and several districts, including Chau Thanh, Thoai Son, Tinh Bien, An Phu, Chau Phu, Cho Moi, Phu Tan, and Tri Ton. The rice cultivation in the study area is supported by the dense river network and irrigation system.
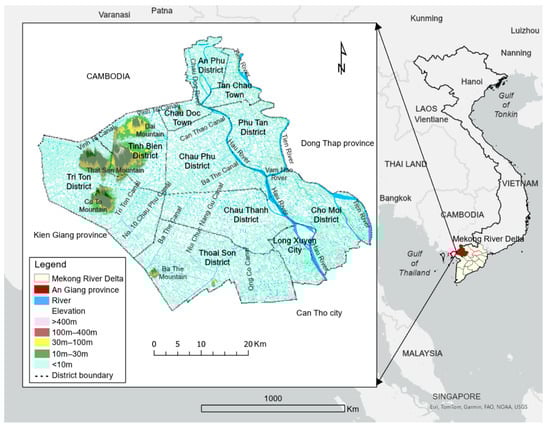
Figure 1.
Location of An Giang Province within the Mekong River Delta, highlighting the river and irrigation network, district boundaries, and elevation ranges.
The climate in An Giang is tropical monsoon, characterized by a dry season from December to April and a rainy season from May to November, with an average annual temperature of 27 °C. Despite receiving an annual average precipitation of approximately 1400 mm, which is lower than the region’s average, in the early 1990s, high-dike systems were developed to mitigate the flooding impact, support paddy rice intensification, and increase rice production. As shown in Figure 2, rice production and the planted rice area in the province have increased significantly from 2000 to 2015. In contrast, despite the rice cultivation area having an increasing trend after 2016, the total rice production has trended downward due to multiple factors, including soil degradation, inappropriate irrigation management, and human activities, such as dam construction and intensive farming practices [33,34,35].
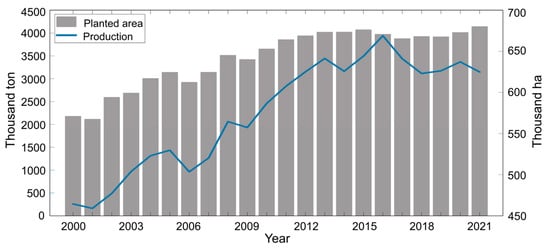
Figure 2.
Annual rice production (thousand tons) and planted area (thousand hectares) in An Giang Province from 2000 to 2021, as reported by the General Statistics Office of Vietnam [29].
In An Giang Province, three main rice seasons can be recognized: Winter–Spring (WS), Summer–Autumn (SA), and Autumn–Winter (AW). WS and SA are the two main rice seasons focused on in this study, while AW is frequently affected by floods [36,37]. The province boasts large and homogeneous rice fields [32], which are ideal for mapping with the moderated spatial resolution of MODIS [8].
2.2. MODIS Data
This study obtained MODIS data from the Land Processes Distributed Active Archive Center (LP DAAC) website using the Application for Extracting and Exploring Analysis Ready Samples (AppEEARS), a web-based platform that allows users to access and transform MODIS products. Specifically, this study acquired the entire data range for MOD09GQ, MOD09Q1, and MOD13Q1, version 6.1 (Table 1). AppEEARS was used to transform the sinusoidal projection of these products to the WGS84 (EPSG 4326) coordinate system for rice phenology extraction and mapping purposes [11].

Table 1.
Key parameters of MODIS surface reflectance and vegetation index products.
The MOD09GQ product provides daily surface reflectance data at a 250 m spatial resolution, representing ground-level measurements without atmospheric interference, for red (620–670 nm) and near-infrared (841–876 nm) bands [11]. These data are corrected for atmospheric gases and aerosols. The product also includes six layers with quality and viewing information: observation count, surface quality, coverage, orbit and granule pointers, and observation number. To create a single daily image, the product selects the best observation from each satellite orbit. This selection is based on a scoring system that prioritizes cloud-free pixels with low aerosol and view angles. Observations with missing data are assigned the lowest score of 0. The final pixel chosen has the highest score and lowest view angle. This processing method is detailed in Vermote, Ray, and Roger [38].
The MOD09Q1 provides 8-day surface reflectance at a 250 m spatial resolution for the red (620–670 nm) and near-infrared (841–876 nm) bands. Atmospheric corrections for gasses, aerosols, and Rayleigh scattering are performed using a Look-Up Table (LUT) approach [39]. This method utilizes pre-calculated transmittances and path radiances based on radiative transfer simulations, considering sun-sensor geometry and aerosol loading. Briefly, atmospheric parameters are estimated, and the LUT is used to invert the radiative transfer equation, yielding surface reflectance. A detailed description of the methodology is provided in [39]. Along with the reflectance bands, the surface reflectance state flag and band quality control flag layers are included for quality assurance. This product is created by compositing MOD09GA and MOD09GQ data over 8-day periods in the MODIS sinusoidal grid. The compositing process selects the best pixel based on the observation coverage, view angle, and the presence of clouds, aerosols, or cloud shadows. A score from 0 to 10 is assigned to each pixel based on these criteria, with fill values receiving a score of 0. The pixel with the highest score and lowest view angle is selected for the 8-day output. Additionally, the Multi-Angle Implementation of Atmospheric Correction (MAIAC) algorithm is used for cloud detection, aerosol retrieval, and atmospheric corrections [40].
The MOD13Q1 offers data with a 16-day temporal resolution at a 250 m spatial resolution [38]. This product includes two Vegetation Index (VI) layers, the Enhanced Vegetation Index (EVI) and the Normalized Difference Vegetation Index (NDVI). These indices are computed based on two 8-day composite surface reflectance [41], which are atmospherically corrected using bidirectional surface reflectance, and masked for water, clouds, heavy aerosols, and cloud shadows. This aggregation process employs a series of quality, cloud cover, and viewing geometry filters to select the highest-quality pixel from the collected 8-day data. This ensures that only cloud-free, nadir-view pixels with minimal residual atmospheric contamination are used in the vegetation index algorithm for the 16-day composite.
In this study, the yearly collection of MOD09GQ (MOD-1D) consisted of 365 images for a typical year and 366 images for a leap year (2020); MOD09Q1 (MOD-8D) consisted of 46 images, and MOD13Q1 (MOD-16D) consisted of 23 shots for every year. Details on the number of images used in this study are shown in Table 2. The temporal period of image collection was from 2018 to 2022, covering all rice seasons from 2019 to 2021 in the An Giang region.
Table 2.
Summary of MODIS image acquisition for time series analysis (2018–2022).
2.3. Methods
To investigate the temporal and spatial variations in rice phenology in the An Giang region, this study utilized three MODIS products, as summarized in Table 2. The processing workflow, illustrated in Figure 3, involved NDVI computation and smoothing, rice phenology parameter extraction, unsupervised classification, and field data comparison for accuracy assessment.
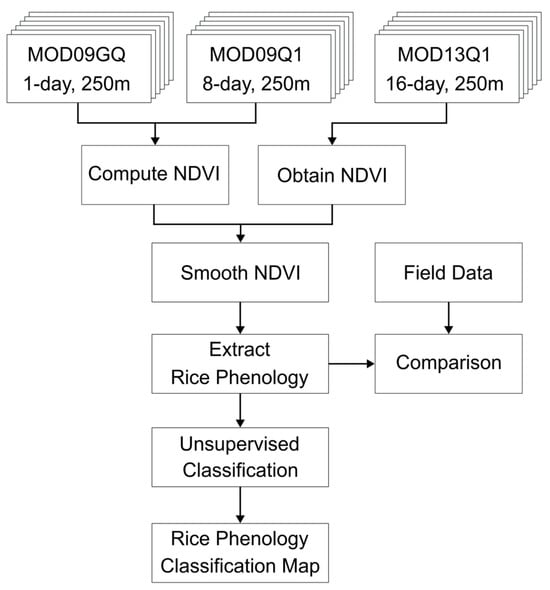
Figure 3.
Schematic representation of MODIS data processing for rice phenology extraction.
2.3.1. Computation of Normalized Difference Vegetation Index
The acquired MODIS datasets were used to construct NDVI time series for extracting rice phenology parameters. Initially, each dataset was assessed for quantity and quality to ensure suitability for time series analysis. Specifically, the MOD-1D and MOD-8D datasets, containing red and near-infrared reflectance, were used to calculate the NDVI using the standard formula Equation (1).
where and are the surface reflectance obtained from the near-infrared and red bands, respectively. The MOD-16D dataset, which directly provides NDVI values, was also incorporated into the analysis.
2.3.2. Smoothing Normalized Difference Vegetation Index
The NDVI is widely recognized as a valuable tool for vegetation monitoring [42,43], offering notable advantages, such as reductions in band-correlated noise, calibration errors, and sensor-related discrepancies [44]. However, it also presents several limitations. The NDVI values tend to saturate in areas of dense vegetation, reducing sensitivity to variations in high biomass regions. In sparsely vegetated areas, the NDVI can be strongly influenced by soil background effects, including soil brightness and moisture content. Additionally, topographic shadows and frequent cloud contamination introduce noise and uncertainty into NDVI time series, potentially leading to unstable or misleading observations [45].
To mitigate the impact of noise, a series of smoothing techniques was applied to the NDVI time series data. First, a median filter was employed to eliminate spikes and outliers, effectively removing abrupt, anomalous values. Subsequently, the DLF and SGF were employed to achieve smooth curves that accurately represent the upper envelope of NDVI values. The DLF models nonlinearities and complex patterns and effectively captures oscillations, multiple peaks, and troughs [46]. SGF, a polynomial smoothing technique, uses a moving window to remove noise and high-frequency variability while preserving significant features [47]. The mathematical function of DLF can be expressed by Equation (2):
where t is the independent variable (usually time); a1 and a2 are the asymptotes of the function; b1 and b2 determine the steepness of the function; c1 and c2 determine the locations of the inflection points. The DLF effectively smooths the start, end, peak greenness, and length of the rice growing season.
The SGF smooths curves by averaging adjacent data points within a moving window, preserving the overall curve shape while removing noise [47]. The SGF can be described as follows:
where is the smoothed value at the jth data point, and is the convolution coefficient determined by the degree of polynomial fit. are data points within the window, N is the total number of data points, and m is the half-width of the window. The SGF, unlike the median filter, which only removes outliers, smooths the entire curve.
2.3.3. Rice Phenology Extraction
TIMESAT 3.3 software is specifically designed for analyzing time series of satellite vegetation indices [46]. The extracted rice phenology parameters, as detailed in Table 3, were generated using the TSF-seas2img program within TIMESAT 3.3 [48,49,50].
Table 3.
Extracted rice phenology parameters and their definitions based on NDVI time series.
For the application of TIMESAT software, several key parameters and settings were configured to facilitate accurate phenology extraction. For the Savitzky–Golay Filtering (SGF) method, a smoothing window size of 5 was selected to effectively capture subtle variations in the NDVI associated with rice growth dynamics. In contrast, the Double Logistic Function (DLF) does not require a smoothing window for curve fitting [47,51]. The NDVI value range was constrained between −1 and 1 to encompass the full spectral response of vegetation. All available data points along the time-series curves were retained for analysis to ensure comprehensive coverage of the phenological signal. The Seasonal-Trend Decomposition using the Loess (STL) method was chosen for decomposing the NDVI time series into seasonal and trend components. The maximum number of seasonal cycles was set to ensure that all potential phenological events were captured. The number of envelope iterations was set to three, allowing for two additional curve-fitting passes that progressively down-weight values falling below the initial fit. This process helped guide the fitted curve toward the upper envelope, improving the sensitivity to peak vegetation growth and mitigating the influence of anomalously low or noisy data points. The adaptation strength was tuned to balance the curve’s adherence to the upper envelope with the preservation of the overall temporal trend [16]. The season start and end points were defined using a threshold method, in which the beginning and end of the season corresponded to the points at which the fitted curve reached 30% of the seasonal amplitude [47,52]. This threshold was calculated relative to the minimum NDVI values on the left and right of the seasonal peak, respectively.
2.3.4. Unsupervised Rice Phenology Classification
Based on the 13 extracted phenology parameters in Table 3, the unsupervised K-means clustering was used to map different phenology patterns in the study area. First, the Silhouette Score (Equation (4)) was used to compare the statistical distance of each object to its cluster and other clusters. It can be expressed as follows:
where is the Sihoutter Score of an ith object in the jth cluster of parameter c, ai is the average distance from the ith point to the other points in the same cluster, and bi is the minimum average distance from the ith point to points in a different cluster. The Silhouette Score ranges from −1 to 1, with a score of 1 indicating a good match to its own cluster and a poor match to other clusters. A score of 0 indicates that the sample is on or very close to the decision boundary between clusters, while a negative value indicates that those samples may have been assigned to the wrong cluster [53]. Second, this study computed the ASW, which is based on the Sihoutter Score, to determine the optimal number of clusters in a dataset [54]. The ASW with a pre-defined cluster number m can be defined by (5):
where n(j) is the number of objects in class j, m is the pre-defined cluster number, and k is the number of applied parameters in K-means. ASW values range from −1 to 1, and positive and larger values of ASW indicate better clustering quality. This study tested cluster numbers from 2 to 15, and the optimal number was determined by selecting the maximum ASW across the tested range. This optimal number of clusters was then utilized to perform unsupervised K-means clustering and map the rice cultivation patterns in the study area.
2.3.5. Assessment of Rice Phenology Extraction
The field investigation of the rice phenology of An Giang was conducted in the Winter–Spring rice season of 2021 from December 2020 to April 2021 (WS 2020–2021) and the Summer–Autumn rice season of 2021 from May 2021 to September 2021 (SA-2021). Table 4 statistically summarizes the dates of sowing, heading, and harvesting for these seasons as the Day of Year (DOY) from 110 samples. These fundamental dates of the rice seasons were collected from questionnaires for farmers and their reports. To evaluate the accuracy of the extracted seasonal parameters, this study employed the Root Mean Square Error (RMSE) between the observed and the estimated dates (in DOY).
Table 4.
Statistical summary of field-observed rice season dates for WS2020–2021 and SA-2021 in An Giang (in DOY, n = 110).
3. Results
3.1. Comparison of NDVI Time Series Smoothing Methods
This study examined the raw and smoothed NDVI curves derived from three temporal resolutions of MODIS datasets, MOD-1D, MOD-8D, and MOD-16D. These curves reflect the growth patterns of rice fields, marking distinct phenological phases, such as sowing, heading, and harvesting across multiple seasons. Figure 4 illustrates the variations in the raw (gray) and smoothed NDVI (blue and red) data of a selected pixel from a rice farm (Lat: 10.2472136, Long: 105.1838556), highlighting the inherent noise in the daily dataset (MOD-1D), as evidenced by its erratic pattern.
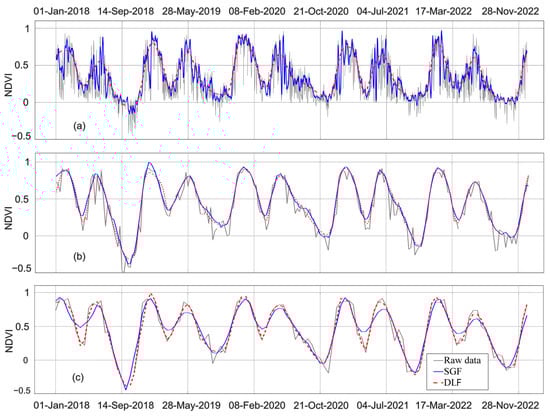
Figure 4.
Comparison of NDVI time-series curves from 2018 to 2022 for a selected rice field in An Giang Province (Lat: 10.2472136, Long: 105.1838556), demonstrating the impact of different MODIS temporal resolutions and smoothing techniques: (a) MOD-1D, (b) MOD-8D, and (c) MOD-16D, smoothed using SGF and DLF.
Table 5 presents an analysis of the RMSE, which indicates the accuracy of the estimated phenological dates compared to the observed dates for two rice growing seasons (WS 2020–2021 and SA 2021), using the three MODIS datasets with different smoothing techniques. We can observe that the RMSE values derived from the DLF were generally lower than those from the SGF. Also, MOD-1D showed lower RMSE values than the other two products. Specifically, for both the WS 2020–2021 and SA 2021 seasons, by averaging the RMSEs of the SOS, MOS, and EOS, the MOD-1D dataset coupled with the DLF method exhibited the lowest RMSE values (6 days for WS 2021 and 7.7 days for SA 2022, respectively).
Table 5.
RMSEs for comparing estimated rice phenology dates using different MODIS products and smoothing filters with field-observed rice seasons in 2021 (expressed as DOY).
3.2. Mapping the Rice Phenology
3.2.1. Determination of Rice Phenology Class
In this analysis, the suitable number of clusters for classifying rice phenology was assessed using unsupervised K-means clustering. The Average Silhouette Width (ASW) values served as the primary criterion for this evaluation, aiming to maximize the ASW for the most distinct clustering [54]. Figure 5 showcases the boxplots representing the distribution of the ASW for cluster numbers ranging from two to fifteen. These clusters were analyzed within the context of the WS and SA rice seasons, spanning the years 2018 to 2021, using the Double Logistic Function (DLF) method applied to the MOD-1D dataset.
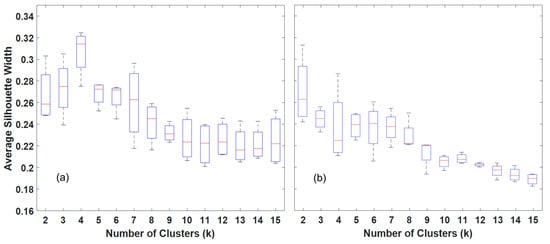
Figure 5.
Average silhouette width analysis for determining the optimal number of clusters (k) in unsupervised classification, applied to rice phenology data for (a) WS and (b) SA rice seasons, using the DLF smoothed MOD-1D dataset.
A decreasing trend in ASW values was observed as the number of clusters increased for both rice seasons. The optimal cluster count was selected based on the highest median ASW value to ensure clear separation and consistency. For the WS season, a four-cluster solution was determined to be ideal with a median ASW of 0.318. For the SA season, a two-cluster solution proved optimal, reflecting a median ASW of 0.262. These optimal cluster numbers were subsequently applied in the K-means unsupervised classification to facilitate the rice phenology mapping.
3.2.2. Rice Phenology in An Giang Province
To investigate the spatial variation of the rice phenology of An Giang Province, first, this study employed MODD-1D time series with the DLF to extract the 13 rice phenological parameters, and then applied K-means clustering to map the rice phenology class from 2018 to 2021. Specifically, according to the AWD analysis, four and two different rice phenology classes were mapped for the Winter–Summer and Summer–Autumn seasons respectively. Table 6 lists the phenology class centroids of thirteen parameters to better clarify the characteristics of each phenology.
Table 6.
K-means clustering centroid values for rice phenology classes based on thirteen parameters.
The phenology of rice exhibited distinct characteristics across different seasons. During the WS season, the start of the season (SOS) for PN01, PN02, PN03, and PN04 ranged from early November to early December. The Middle of the Season (MOS) occurred between early January and mid-February, while the End of the Season (EOS) spanned from early March to early May, resulting in a Length of Season (LOS) varying from 101 to 173 days. PN01 and PN03 represented the short-time cultivation rice varieties, with growth periods of about 95–125 days, such as OM9582, Dai Thom 8, OM5451, OM7347, OM6976, OM18, Jasmine 85, OM9577, and OM4900. PN02 and PN04 exhibited longer rice seasons, representing varieties that have longer growth periods, where the straw remains standing in the fields.
In the SA season, the phenological stage occurred from mid-April to late May, with the middle of the season occurring from early May to late June, and the end of the season from early August to the end of August, resulting in a shorter length of the season from 97 to 106 days. The integrals (LIN and SIN) and the Start-of-Season (SVA) and End-of-Season values (EVA) suggest a more compact growth period compared to the WS season. These seasonal variations underline the adaptability and growth dynamics of rice in response to different rice varieties, such as OM5451, OM7347, OM6976, OM18, Jasmine 85, OM9577, OM4900, and OM38, which grow for around 100 days.
3.3. Rice Phenology Mapping in An Giang Province from 2018 to 2021
Figure 6 and Figure 7 illustrate the spatial distribution of rice phenology types across An Giang Province during the WS and SA rice seasons from 2018 to 2022. Each map corresponds to a specific season, facilitating the temporal analysis of phenological shifts.
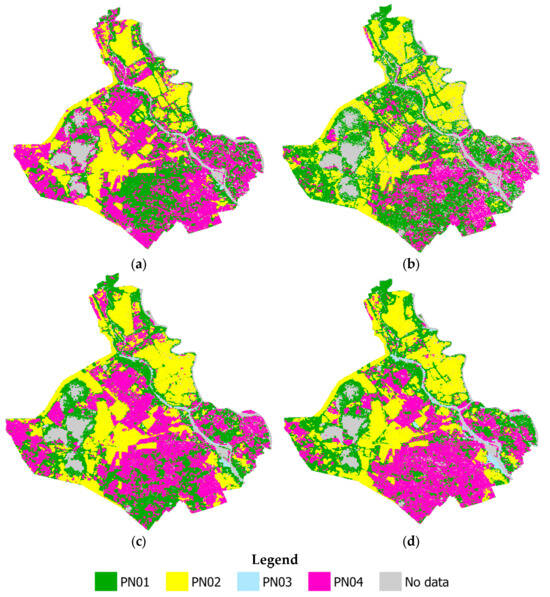
Figure 6.
Rice phenology maps for Winter–Spring seasons in An Giang Province, showing spatial distribution of phenological types (PN01-PN04) using MOD-1D and DLF: (a) WS2018–2019, (b) WS2019–2020, (c) WS2020–2021, and (d) WS2021–2022.
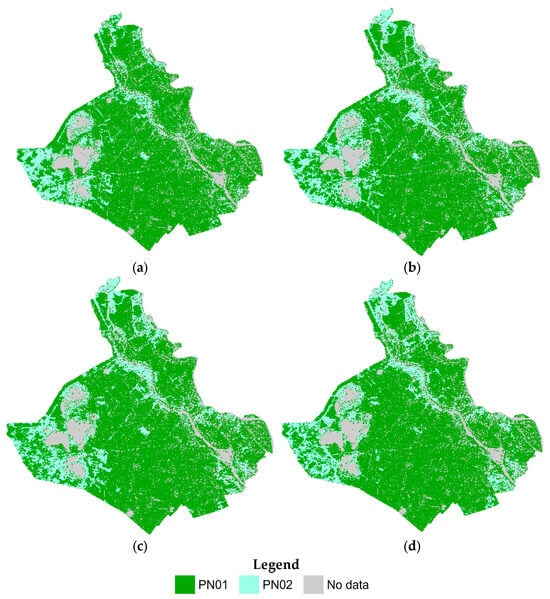
Figure 7.
Rice phenology maps for Summer–Autumn seasons in An Giang Province, showing spatial distribution of phenological types (PN01-PN02) using MOD-1D and DLF: (a) SA2018, (b) SA2019, (c) SA2020, and (d) SA2021.
Over the four WS seasons (Figure 6a–d), PN01 (green) was initially concentrated in the eastern and southeastern regions in WS 2018–2019. However, in subsequent seasons (WS 2019–2020 and WS 2020–2021), its distribution expanded into the central region, encompassing larger areas in the northern and western parts of the province. This spatial shift likely reflects adaptive modifications in rice cultivation practices in response to changing flood regimes driven by climatic variability.
In the WS seasons, PN02 (yellow), which represents high-quality rice and sticky rice varieties with longer growth durations, consistently occupied extensive areas, particularly in the central and northern upstream regions of the study area. PN03 (cyan) remained sparse across all four seasons, appearing in small, localized patches along streams. PN04 (magenta) exhibited substantial variability with a dispersed distribution pattern. Notably, PN04 was concentrated in the western, southern, and central regions during WS 2018–2019 (Figure 6a) and WS 2020–2021 (Figure 6c), while it was predominantly found in the central and southern regions in WS 2019–2020 (Figure 6b) and WS 2021–2022 (Figure 6d). The fluctuating spatial distribution of PN04 suggests a transition in rice cultivation strategies, indicating a potential reduction in the allocation of land for longer-duration rice varieties and a shift toward more sustainable and high-quality rice production systems.
4. Discussion
The time series analysis of MODIS datasets provided a comprehensive assessment of rice cultivation dynamics, enabling the identification of temporal trends and patterns that may not be discernible from individual images. This study employed MOD-1D, MOD-8D, and MOD-16D datasets to construct time series data, capturing variations in rice phenology at different temporal scales. Based on the findings, this study further discusses the comparative performance of the applied MODIS products, the limitations of the proposed phenology extraction approach, and the factors influencing rice phenology patterns in the region.
4.1. Comparative Evaluation of MODIS Products for Rice Phenology Mapping
The MOD-1D dataset exhibited more noise due to frequent artifacts, such as clouds and shadows. In contrast, the MOD-8D and MOD-16D datasets provided more stable NDVI profiles, as their compositing nature helps reduce such noise. To enhance the phenological signal, smoothing techniques, including Double Logistic Function (DLF), and Savitzky-Golay Filtering (SGF), were employed in this study to better capture subtle seasonal variations.
The comparison of the RMSE values highlighted that the DLF demonstrated superior performance, particularly when applied to the high-temporal-resolution MOD-1D dataset, in estimating key rice phenological stages, such as sowing, heading, and harvesting (Table 5). Its capability to model the non-linear dynamics of rice growth aligns with previous studies supporting logistic-based time series analysis [31,55]. While the MOD-8D and MOD-16D datasets were less noisy, their coarser temporal granularity can obscure short-term phenological events. Therefore, the MOD-1D dataset, when combined with appropriate smoothing techniques, offers a balanced solution between temporal detail and signal stability for precision agriculture in the Mekong River Delta (MRD).
4.2. Limitations and Challenges of the Proposed Approach
To accurately reflect rice growth dynamics, this study optimized the parameters influencing the shape of the NDVI curve, including the timing and rate of NDVI changes. Curve-fitting parameters for the SGF and DLF were selected based on a combination of theoretical foundations, curve shape inspection, and validation against field-observed phenological dates (sowing, heading, and harvesting). While a full sensitivity analysis was not conducted, the chosen parameters were effective in meeting the study’s objectives. Future work could involve more exhaustive parameter tuning to further enhance accuracy.
A significant challenge in using MOD-1D data is the prevalence of missing values due to persistent cloud cover. Although this issue was partially mitigated through smoothing and interpolation, future studies could consider integrating advanced reconstruction techniques, including machine learning or SAR-optical data fusion, which have shown strong potential in addressing spatiotemporal data gaps [56,57,58]. Furthermore, the MODIS 250 m spatial resolution may result in the misrepresentation of small and fragmented rice fields. This limitation could be addressed by employing spatiotemporal fusion models, such as STARFM [59], FSDAF [60], or similar approaches, that generate higher-resolution daily NDVI data [61].
The success of the proposed approach in mapping the rice phenology in An Giang indicates the potential for application in other crop systems and climatic regions. The approach’s strength lies in its ability to capture rapid phenological changes, which is particularly useful for monitoring fast-growing or multi-harvest crops, such as wheat [49]. Techniques like the DLF and SGF are not crop-specific and can be applied to a wide range of vegetation index time series to reconstruct continuous NDVI profiles [15,16,31,51] and enhance phenological precision.
However, some considerations are necessary when applying this method elsewhere. The suitability of MODIS data depends on the crop’s NDVI response and field size [9,10], as the 250 m spatial resolution may not be ideal for regions with small or fragmented agricultural plots [9]. In different climatic conditions, such as arid or temperate zones [8,21], environmental factors like snow, drought, or sparse vegetation may affect NDVI reliability, requiring the use of alternative indices or higher-resolution data. Despite these limitations, this study offers a flexible and scalable framework for agricultural monitoring, supporting food security and sustainable farming practices beyond the Mekong River Delta.
4.3. Factors Affecting Rice Phenological Patterns
In this study, unsupervised K-means clustering effectively categorized rice phenology patterns in An Giang Province. These phenological classes captured differences in the timing and duration of rice cultivation cycles, reflecting variability in rice varieties, local agricultural practices, and environmental conditions. Rice phenology variation in the field can be influenced by short-day rice varieties [62,63]. As a result, farmers may cultivate multiple rice crops in the same field within a year. Additionally, the timing of rice sowing or transplanting in these fields depends on both a government rice crop schedule and environmental conditions [37]. Farmers typically sow rice seeds only after the floodwaters recede, leading to variations in the rice season across different fields [64].
For instance, during the Winter–Spring season, four distinct classes were mapped (PN01–PN04, Figure 6). Among them, PN01 and PN03 were associated with short-duration rice varieties, while PN02 and PN04 represented longer-cycle crops. These differences are reportedly influenced by factors such as flood recession timing [62], government transplanting schedules [37], and the widespread adoption of short-day rice varieties [63,64].
Changes in rice phenology across the Mekong Delta are also driven by long-term shifts in agricultural practices and environmental conditions. Notably, the adoption of short-duration rice varieties and revised water management strategies have been influenced by infrastructural developments, such as high-dike systems, which have significantly altered the region’s flood regime [65,66]. Understanding these drivers is essential for evaluating the broader implications of phenological changes on rice productivity, water use, and climate resilience.
5. Conclusions
The findings of this study demonstrate the effectiveness of MODIS data products with 1-day, 8-day, and 16-day temporal resolutions for monitoring rice phenology. The results highlight the critical role of preprocessing techniques in addressing gaps in NDVI time series data. Specifically, the implementation of the DLF successfully reconstructed NDVI time series, significantly enhancing the extraction of rice phenological patterns in the MRD, Vietnam. Time series analysis of MODIS imagery has provided valuable insights into the phenological stages of rice cultivation, emphasizing the advantages of the high-temporal-resolution MOD-1D dataset. This dataset enables detailed observations of phenological transitions occurring over short time frames, which is essential for capturing the dynamic nature of rice growth and development. However, challenges associated with missing data, coarse spatial resolution, and potential inaccuracies in classification highlight the need for further methodological refinement.
Mapping rice phenology within the study area offers critical insights into the influence of anthropogenic activities on rice cultivation practices, including the widespread adoption of short-duration rice varieties and modifications in water management strategies in response to changing environmental conditions. These factors exert a significant impact on rice crop phenology, necessitating the application of advanced analytical approaches and continuous improvements in dataset accuracy to effectively monitor these transformations. The findings of this study provide a foundational framework for future research and contribute to a broader understanding of agricultural dynamics in the MRD, particularly in the context of climatic variability and land use changes.
Author Contributions
Conceptualization, S.-H.C. and M.-B.T.; writing—original draft preparation, M.-B.T.; writing—review and editing, S.-H.C. All authors have read and agreed to the published version of the manuscript.
Funding
This research was funded by the National Science and Technology Council, grant number NSTC113-2121-M-008-003, and the Agency of Rural Development and Soil and Water Conservation, grant number ARDSWC-113-019.
Data Availability Statement
The original contributions presented in the study are included in the article. Further inquiries can be directed to the corresponding author.
Acknowledgments
The authors would like to sincerely thank the editor and anonymous reviewers for their valuable comments and constructive suggestions, which have greatly contributed to improving the quality of this manuscript.
Conflicts of Interest
The authors declare no conflicts of interest.
References
- Bin Rahman, A.N.M.R.; Zhang, J. Trends in rice research: 2030 and beyond. Food Energy Secur. 2022, 12, e390. [Google Scholar] [CrossRef]
- Organization for Economic Co-operation and Development (OECD)/Food and Agriculture Organization of the United Nations (FAO). OECD-FAO Agricultural Outlook 2020–2029; OECD: Paris, France, 2020. [Google Scholar]
- Oyoshi, K.; Takeuchi, W.; Yasuoka, Y. Noise reduction algorithm for time-series NDVI data in phenological monitoring. J. Jpn. Soc. Photogramm. Remote Sens. 2008, 47, 4–16. [Google Scholar] [CrossRef]
- Zhang, X.; Friedl, M.A.; Schaaf, C.B.; Strahler, A.H.; Hodges, J.C.; Gao, F.; Reed, B.C.; Huete, A. Monitoring vegetation phenology using MODIS. Remote Sens. Environ. 2003, 84, 471–475. [Google Scholar] [CrossRef]
- Sakamoto, T.; Van Phung, C.; Kotera, A.; Nguyen, K.D.; Yokozawa, M. Analysis of rapid expansion of inland aquaculture and triple rice-cropping areas in a coastal area of the Vietnamese Mekong Delta using MODIS time-series imagery. Landsc. Urban Plan. 2009, 92, 34–46. [Google Scholar] [CrossRef]
- Kontgis, C.; Schneider, A.; Ozdogan, M. Mapping rice paddy extent and intensification in the Vietnamese Mekong River Delta with dense time stacks of Landsat data. Remote Sens. Environ. 2015, 169, 255–269. [Google Scholar] [CrossRef]
- Guan, X.; Huang, C.; Liu, G.; Meng, X.; Liu, Q. Mapping rice cropping systems in Vietnam using an NDVI-based time-series similarity measurement based on DTW distance. Remote Sens. 2016, 8, 19. [Google Scholar] [CrossRef]
- Xiao, X.; Boles, S.; Liu, J.; Zhuang, D.; Frolking, S.; Li, C.; Salas, W.; Moore, B. Mapping paddy rice agriculture in southern China using multi-temporal MODIS images. Remote Sens. Environ. 2005, 95, 480–492. [Google Scholar] [CrossRef]
- Nguyen, T.T.H.; De Bie, C.; Ali, A.; Smaling, E.; Chu, T.H. Mapping the irrigated rice cropping patterns of the Mekong delta, Vietnam, through hyper-temporal SPOT NDVI image analysis. Int. J. Remote Sens. 2012, 33, 415–434. [Google Scholar] [CrossRef]
- Jinwei, D.; Xiangming, X.; Weili, K.; Yuanwei, Q.; Geli, Z.; Li, L.; Cui, J.; Yuting, Z.; Jie, W.; Chandrashekhar, B.; et al. Tracking the dynamics of paddy rice planting area in 1986–2010 through time series Landsat images and phenology-based algorithms. Remote Sens. Environ. 2015, 160, 99–113. [Google Scholar] [CrossRef]
- Vermote, E.F.; Ray, J.P.; Roger, J.-C. MODIS Surface Reflectance User’s Guide, Version 1.4; MODIS Land Surface Reflectance Science Computing Facility: Greenbelt, MD, USA, 2015. [Google Scholar]
- Didan, K.; Munoz, A.B.; Solano, R.; Huete, A. MODIS Vegetation Index User’s Guide (MOD13Series), Version 3.10; University of Arizona, Vegetation Index and Phenology Lab: Tucson, AZ, USA, 2019; p. 35. [Google Scholar]
- Phan, T.N.; Kappas, M. Application of MODIS land surface temperature data: A systematic literature review and analysis. J. Appl. Remote Sens. 2018, 12, 041501. [Google Scholar] [CrossRef]
- Qunming, W.; Kaidi, P.; Yijie, T.; Xiaohua, T.; Peter, M.A. Blocks-removed spatial unmixing for downscaling MODIS images. Remote Sens. Environ. 2021, 256, 112325. [Google Scholar] [CrossRef]
- Jing, Y.; Maogui, H. Filling the missing data gaps of daily MODIS AOD using spatiotemporal interpolation. Sci. Total Environ. 2018, 633, 677–683. [Google Scholar] [CrossRef]
- Zhao, H.; Yang, Z.; Di, L.; Li, L.; Zhu, H. Crop phenology date estimation based on NDVI derived from the reconstructed MODIS daily surface reflectance data. In Proceedings of the 2009 17th International Conference on Geoinformatics, Fairfax, VA, USA, 12–14 August 2009. [Google Scholar] [CrossRef]
- Son, N.-T.; Chen, C.-F.; Chen, C.-R.; Duc, H.-N.; Chang, L.-Y. A Phenology-Based Classification of Time-Series MODIS Data for Rice Crop Monitoring in Mekong Delta, Vietnam. Remote Sens. 2014, 6, 135–156. [Google Scholar] [CrossRef]
- Alex, O.O.; George, A.B.; Qunming, W.; Peter, M.A.; Daniel, K.; Miao, Y. Rice crop phenology mapping at high spatial and temporal resolution using downscaled MODIS time-series. GIScience Remote Sens. 2018, 55, 659–677. [Google Scholar] [CrossRef]
- Arturo, G.C.; Roshanak, D.; Michael, S.; Andrew, N.; Alice, L. Estimation of transplanting and harvest dates of rice crops in the Philippines using Sentinel-1 data. Remote Sens. Appl. Soc. Environ. 2025, 37, 101435. [Google Scholar] [CrossRef]
- Xin, Z.; Kazuya, N.; Tomoko Kawaguchi, A.; Liguang, J.; Yuji, M.; Kenlo Nishida, N. Feature-based algorithm for large-scale rice phenology detection based on satellite images. Agric. For. Meteorol. 2023, 329, 109283. [Google Scholar] [CrossRef]
- Cao, J.; Cai, X.; Tan, J.; Cui, Y.; Xie, H.; Liu, F.; Yang, L.; Luo, Y. Mapping paddy rice using Landsat time series data in the Ganfu Plain irrigation system, Southern China, from 1988−2017. Int. J. Remote Sens. 2021, 42, 1556–1576. [Google Scholar] [CrossRef]
- Wang, M.; Wang, J.; Chen, L.; Du, Z. Mapping paddy rice and rice phenology with Sentinel-1 SAR time series using a unified dynamic programming framework. Open Geosci. 2022, 14, 414–428. [Google Scholar] [CrossRef]
- Nuarsa, I.W.; Nishio, F.; Hongo, C. Relationship between Rice Spectral and Rice Yield Using Modis Data. J. Agric. Sci. 2011, 3, 80–88. [Google Scholar] [CrossRef][Green Version]
- Guo, Y.; Wu, W.; Liu, Y.; Wu, Z.; Geng, X.; Zhang, Y.; Bryant, C.R.; Fu, Y. Impacts of Climate and Phenology on the Yields of Early Mature Rice in China. Sustainability 2020, 12, 10133. [Google Scholar] [CrossRef]
- Na, L.; Yating, Z.; Jinsheng, H.; Qiliang, Y.; Jiaping, L.; Xiaogang, L.; Yazhou, W.; Zhengzhong, H. Impacts of future climate change on rice yield based on crop model simulation—A meta-analysis. Sci. Total Environ. 2024, 949, 175038. [Google Scholar] [CrossRef]
- Duy, V.Q.; Neuberger, D.; Suwanaporn, C. Access to credit and rice production efficiency of rural households in the Mekong Delta. Sociol. Anthropol. 2015, 3, 425–433. [Google Scholar] [CrossRef]
- Parry, M.L.; Canziani, O.; Palutikof, J.; Van der Linden, P.; Hanson, C. Climate Change 2007-Impacts, Adaptation and Vulnerability: Working Group II Contribution to the Fourth Assessment Report of the IPCC; Cambridge University Press: Cambridge, UK, 2007; Volume 4. [Google Scholar]
- Kontgis, C.; Schneider, A.; Ozdogan, M.; Kucharik, C.; Tri, V.; Duc, N.; Schatz, J. Climate change impacts on rice productivity in the Mekong River Delta. Appl. Geogr. 2019, 102, 71–83. [Google Scholar] [CrossRef]
- GSO. Statistical Yearbook of Vietnam 2022. Available online: https://www.gso.gov.vn/wp-content/uploads/2023/06/Sach-Nien-giam-TK-2022-final.pdf (accessed on 31 March 2025).
- Zhou, Q.; Rover, J.; Brown, J.; Worstell, B.; Howard, D.; Wu, Z.; Gallant, A.L.; Rundquist, B.; Burke, M. Monitoring landscape dynamics in central us grasslands with harmonized Landsat-8 and Sentinel-2 time series data. Remote Sens. 2019, 11, 328. [Google Scholar] [CrossRef]
- Yang, Y.; Luo, J.; Huang, Q.; Wu, W.; Sun, Y. Weighted Double-Logistic Function Fitting Method for Reconstructing the High-Quality Sentinel-2 NDVI Time Series Data Set. Remote Sens. 2019, 11, 2342. [Google Scholar] [CrossRef]
- Uno, K.; Ishido, K.; Nguyen Xuan, L.; Nguyen Huu, C.; Minamikawa, K. Multiple drainage can deliver higher rice yield and lower methane emission in paddy fields in An Giang Province, Vietnam. Paddy Water Environ. 2021, 19, 623–634. [Google Scholar] [CrossRef]
- Pham, V.H.T.; Ho, V.H.; Tran, D.D.; Pham, T.D.; Huynh, D.N.; Chau, N.X.Q. Impact of water resources variation on winter–spring rice yield in the upper Vietnamese Mekong Delta: A case study of An Giang Province. Irrig. Drain. 2024, 73, 574–587. [Google Scholar] [CrossRef]
- Tran, D.D.; Park, E.; Thu Van, C.; Nguyen, T.D.; Nguyen, A.H.; Linh, T.C.; Quyen, P.H.; Tran, D.A.; Nguyen, H.Q. Advancing sustainable rice production in the Vietnamese Mekong Delta insights from ecological farming systems in An Giang Province. Heliyon 2024, 10, e37142. [Google Scholar] [CrossRef]
- Yuen, K.W.; Hanh, T.T.; Quynh, V.D.; Switzer, A.D.; Teng, P.; Lee, J.S.H. Interacting effects of land-use change and natural hazards on rice agriculture in the Mekong and Red River deltas in Vietnam. Nat. Hazards Earth Syst. Sci. 2021, 21, 1473–1493. [Google Scholar] [CrossRef]
- Phuoc, L.H.; Suliansyah, I.; Arlius, F.; Chaniago, I.; Xuan, N.T.T.; Tanh, N.T.N.; Quang, P.V. Rice Growth and Yield Responses to Climate Variabilities and Scenarios. Trends Sci. 2022, 20, 6390. [Google Scholar] [CrossRef]
- Nguyen, V.H.; Yen, H.P.H. Seasonal variation and its impacts in rice-growing regions of the Mekong Delta. Int. J. Clim. Change Strateg. Manag. 2021, 13, 483–491. [Google Scholar] [CrossRef]
- Vermote, E.F.; Ray, J.P.; Roger, J.-C. MODIS Surface Reflectance User’s Guide, Version 1.5; MODIS Land Surface Reflectance Science Computing Facility: Greenbelt, MD, USA, 2020. [Google Scholar]
- Vermote, E.; Vermeulen, A. Atmospheric Correction Algorithm: Spectral Reflectances (MOD09); ATBD Version; NASA: Washington, DC, USA, 1999; Volume 4, pp. 1–107. [Google Scholar]
- Fagua, J.C.; Ramsey, R.D. Comparing the accuracy of MODIS data products for vegetation detection between two environmentally dissimilar ecoregions: The Chocó-Darien of South America and the Great Basin of North America. GIScience Remote Sens. 2019, 56, 1046–1064. [Google Scholar] [CrossRef]
- Didan, K.; Munoz, A.B.; Solano, R.; Huete, A. MODIS Vegetation Index User’s Guide (MOD13 Series), Version 3.0; University of Arizona: Vegetation Index and Phenology Lab: Tucson, AZ, USA, 2015. [Google Scholar]
- Zhao, Q.; Qu, Y. The Retrieval of Ground NDVI (Normalized Difference Vegetation Index) Data Consistent with Remote-Sensing Observations. Remote Sens. 2024, 16, 1212. [Google Scholar] [CrossRef]
- Huang, S.; Tang, L.; Hupy, J.P.; Wang, Y.; Shao, G.F. A commentary review on the use of normalized difference vegetation index (NDVI) in the era of popular remote sensing. J. For. Res. 2021, 32, 1–6. [Google Scholar] [CrossRef]
- Huete, A.; Justice, C.; Van Leeuwen, W. MODIS vegetation index (MOD13). In Algorithm Theoretical Basis Document; NASA: Washington, DC, USA, 1999; Volume 3, pp. 295–309. [Google Scholar]
- Agrawal, R.; Mohite, J.D.; Sawant, S.A.; Pandit, A.; Pappula, S. Estimation of NDVI for cloudy pixels using machine learning. Int. Arch. Photogramm. Remote Sens. Spat. Inf. Sci. 2022, 43, 813–818. [Google Scholar] [CrossRef]
- Eklundha, L.; Jönsson, P. TIMESAT 3.3 with Seasonal Trend Decomposition and Parallel Processing Software Manual; Lund University: Lund, Sweden, 2017. [Google Scholar]
- Savitzky, A.; Golay, M.J.E. Smoothing and Differentiation of Data by Simplified Least Squares Procedures. Anal. Chem. 1964, 36, 1627–1639. [Google Scholar] [CrossRef]
- Alcantara, C.; Kuemmerle, T.; Prishchepov, A.V.; Radeloff, V.C. Mapping abandoned agriculture with multi-temporal MODIS satellite data. Remote Sens. Environ. 2012, 124, 334–347. [Google Scholar] [CrossRef]
- Lobell, D.B.; Ortiz-Monasterio, J.I.; Sibley, A.M.; Sohu, V. Satellite detection of earlier wheat sowing in India and implications for yield trends. Agric. Syst. 2013, 115, 137–143. [Google Scholar] [CrossRef]
- Wang, Y.; Zang, S.; Tian, Y. Mapping paddy rice with the random forest algorithm using MODIS and SMAP time series. Chaos Solitons Fractals 2020, 140, 110116. [Google Scholar] [CrossRef]
- Zhang, G.; Hao, H.; Wang, Y.; Jiang, Y.; Shi, J.; Yu, J.; Cui, X.; Li, J.; Zhou, S.; Yu, B. Optimized adaptive Savitzky-Golay filtering algorithm based on deep learning network for absorption spectroscopy. Spectrochim. Acta Part A Mol. Biomol. Spectrosc. 2021, 263, 120187. [Google Scholar] [CrossRef]
- Bangura, R.; Johnson, S.; Mbulayi, O. Application of K-Means and Fuzzy K-Means to Rice Dataset in Sierra Leone. Sri Lankan J. Appl. Stat. 2020, 21, 69. [Google Scholar] [CrossRef]
- MathWorks. Matlab k-Means Clustering. Available online: https://www.mathworks.com/help/stats/kmeans.html#buefthh-2 (accessed on 15 January 2022).
- Kaufman, L.; Rousseeuw, P.J. Wiley Series in Probability and Mathematical Statistics. In Applied Probability and Statistics; Wiley: New York, NY, USA, 1990. [Google Scholar]
- Sakamoto, T. Spatio–Temporal Analysis of Agriculture in the Vietnamese Mekong Delta Using MODIS Imagery; Bulletin; National Institute for Agro-Environmental Sciences: Tokyo, Japan, 2009.
- Julien, Y.; Sobrino, J.A. Comparison of cloud-reconstruction methods for time series of composite NDVI data. Remote Sens. Environ. 2010, 114, 618–625. [Google Scholar] [CrossRef]
- Zhao, W.; Duan, S.-B. Reconstruction of daytime land surface temperatures under cloud-covered conditions using integrated MODIS/Terra land products and MSG geostationary satellite data. Remote Sens. Environ. 2020, 247, 111931. [Google Scholar] [CrossRef]
- Meraner, A.; Ebel, P.; Zhu, X.X.; Schmitt, M. Cloud removal in Sentinel-2 imagery using a deep residual neural network and SAR-optical data fusion. ISPRS J. Photogramm. Remote Sens. 2020, 166, 333–346. [Google Scholar] [CrossRef] [PubMed]
- Gao, F.; Hilker, T.; Zhu, X.; Anderson, M.; Masek, J.; Wang, P.; Yang, Y. Fusing Landsat and MODIS Data for Vegetation Monitoring. IEEE Geosci. Remote Sens. Mag. 2015, 3, 47–60. [Google Scholar] [CrossRef]
- Onoda, S.; Ikkai, Y.; Kobayashi, T.; Komoda, N. Definition of deadlock patterns for business processes workflow models. In Proceedings of the 32nd Annual Hawaii International Conference on Systems Sciences, Honolulu, HI, USA, 5–8 January 1999. [Google Scholar]
- Filgueiras, R.; Mantovani, E.C.; Fernandes-Filho, E.I.; Cunha, F.F.d.; Althoff, D.; Dias, S.H.B. Fusion of MODIS and Landsat-like Images for Daily High Spatial Resolution NDVI. Remote Sens. 2020, 12, 1297. [Google Scholar] [CrossRef]
- Livsey, J.; Da, C.T.; Scaini, A.; Lan, T.H.P.; Long, T.X.; Berg, H.; Manzoni, S. Floods, soil and food–Interactions between water management and rice production within An Giang province, Vietnam. Agric. Ecosyst. Environ. 2021, 320, 107589. [Google Scholar] [CrossRef]
- Vergara, B.; Tanaka, A.; Lilis, R.; Puranabhavung, S. Relationship between growth duration and grain yield of rice plants. Soil. Sci. Plant Nutr. 1966, 12, 31–39. [Google Scholar] [CrossRef]
- Zhang, X.; Friedl, M.A.; Schaaf, C.B. Global vegetation phenology from Moderate Resolution Imaging Spectroradiometer (MODIS): Evaluation of global patterns and comparison with in situ measurements. J. Geophys. Res. Biogeosciences 2006, 111, G04017. [Google Scholar] [CrossRef]
- Tien, D.N.; Hoang, H.G.; Sen, L.T.H. Understanding farmers’ behavior regarding organic rice production in Vietnam. Org. Agric. 2022, 12, 63–73. [Google Scholar] [CrossRef]
- Chu, L.; Nguyen, H.T.; Kompas, T.; Dang, K.; Bui, T. Rice land protection in a transitional economy: The case of Vietnam. Heliyon 2021, 7, e06754. [Google Scholar] [CrossRef]
Disclaimer/Publisher’s Note: The statements, opinions and data contained in all publications are solely those of the individual author(s) and contributor(s) and not of MDPI and/or the editor(s). MDPI and/or the editor(s) disclaim responsibility for any injury to people or property resulting from any ideas, methods, instructions or products referred to in the content. |
© 2025 by the authors. Licensee MDPI, Basel, Switzerland. This article is an open access article distributed under the terms and conditions of the Creative Commons Attribution (CC BY) license (https://creativecommons.org/licenses/by/4.0/).