Abstract
Lake surface water area (LSWA) and lake surface water temperature (LSWT) are critical indicators of climate change, responding rapidly to global warming. However, studies on the synergistic variations of LSWA and LSWT are scarce, and the coupling relationships among lakes with different environmental characteristics remain unclear. In this study, the relative growth rate of LSWA (RKLSWA); the absolute growth rates of annual maximum, mean, and minimum LSWTs (i.e., KLSWT_max, KLSWT_mean, KLSWT_min); and the absolute growth rates of the difference between maximum and minimum LSWT (LSWT_mmd) (KLSWT_mmd) were investigated across more than 4000 lakes in China using long-term Landsat data, and their coupling relationships among different lake types (i.e., permafrost and non-permafrost recharge, endorheic or exorheic lakes, and natural and artificial lakes) were comprehensively analyzed. Results indicate significant differences in the trends of LSWA and LSWT, as well as their interrelationships across various regions and lake types. In the Qinghai–Tibet Plateau (QTP), 57.8% of lakes showed an increasing trend in LSWA, with 2.4% of the lakes showing moderate expansion (RKLSWA values of 0.1–0.2), while over 27.5% of lakes in the South China (SC) region displayed shrinkage in LSWA (RKLSWA values were between −0.1~0%/year). Regarding LSWTs, 49.8% of lakes in the QTP exhibited a KLSWT_max greater than 0, and 47.9% of lakes showed a KLSWT_mean greater than 0. In contrast, 48.1% of lakes in the Middle and Lower Yangtze River Plain (MLYP) had a KLSWT_max less than 0, and 48.5% of lakes had a KLSWT_mean less than 0. Additionally, lakes supplied by permanent permafrost demonstrated more significant growth in both LSWA and LSWT than those supplied by non-permanent permafrost. Further analysis revealed that approximately 20.2% of the lakes experienced a concurrent increase in both mean LSWT and LSWA, whereas around 18.9% of the lakes exhibited a simultaneous rise in both LSWT_mmd and LSWA. This suggests that the expansion of lakes in China is correlated with both rising temperatures and greater temperature differences. This study provides deeper insights into the response of Chinese lakes to climate change and offers important references for lake resource management and ecological conservation.
1. Introduction
Lakes play an important role in the hydrologic cycle, providing essential ecological services [1,2,3]. The lake surface water area (LSWA) is an important indicator of sensitivity to global and regional climate change and a key parameter for basin water resource assessments and water balance analyses [4]. The lake surface water temperature (LSWT) is an important parameter for energy exchange between lakes and the atmosphere and is often used to assess climate change impacts on lakes [5,6,7,8,9]. In the context of global warming, LSWA and LSWT are changing rapidly and responding to natural and anthropogenic factors [10,11,12]. Therefore, understanding the dynamics of LSWA and LSWT is essential for studying lake ecosystems and environmental changes [13,14,15].
Many efforts have been paid to investigate changes in LSWA and LSWT at regional and global scales with the intensification of global warming. Based on Landsat imagery data, the area of 3.4 million lakes globally showed an upward trend with a net increase of 46,278 km2 from 1984 to 2019; the Himalayan glacial lakes enlarged by about 14.1% between 1990 and 2015 [16], and the overall increase in lake area in the Qinghai–Tibet Plateau (QTP) has accelerated significantly since 2000 [17], with the number of lakes increasing from 868 to more than 1200, and the total area of lakes expanding from 38,823.3 km2 to 48,793.0 km2 [18]. However, global warming not only affects LSWA but also has a significant impact on LSWT, with a significant increase in the number of severe heatwave events in lakes globally by nearly 40 events per decade since 1995 [19] and an average warming rate of 0.34 °C per decade in LSWT during the global warm season [20]. From 1985 to 2022, results based on the air2water model combined with Landsat data indicate that the warming rate of LSWT in China’s 2260 lakes is 0.16 °C per decade without removing extreme high temperatures [21]. Over a relatively large time span of 1978–2017, studies also utilizing the air2water model with MODIS data have shown that annual LSWT of lakes on the QTP increased significantly during 1978–2017, by 0.01–0.47 °C per decade [22]. During 2001–2016, the LSWT of 169 large lakes in China generally showed an increasing trend, with an average increase rate of 0.26 °C per decade [23]. The above studies show that both LSWA and LSWT can well reflect the dynamic changes of global warming; however, most of the existing studies only focus on LSWA or LSW and lack a systematic study on the coupling relationship between the two.
In addition, different types of lakes may respond differently to climate change. Compared to non-glacier-recharged lakes, glacier-recharged lakes exhibit significantly greater increases in water volume and delayed LSWA peaks, while endorheic lakes show more pronounced seasonal area fluctuations than exorheic lakes [24]. Moreover, endorheic lakes typically experience more distinct seasonal cycles and faster water level rises than exorheic lakes. This difference may stem from the reliance of endorheic lakes solely on inflowing water, whereas exorheic lakes balance both inflows and outflows [25,26]. Lakes recharged by permafrost can lead to lake expansion through thermal erosion of lake margins and geomorphological changes, especially in areas with high ground ice content, whereas lakes that are not recharged by permafrost may not have such expansion possibilities [27]. Natural lakes and artificial reservoirs exhibit marked differences in LSWA dynamics, with reservoirs generally showing greater surface area variability than natural lakes of comparable size [28]. Additionally, bottom waters in reservoirs are often warmer than those in lakes, which may be attributed to differences in flushing rates and associated stratification mechanisms [29]. Different types of lakes exhibit distinct characteristics, which may influence the coupling relationships between LSWA and LSWT. Investigating these relationships across various lake types is essential for understanding their hydrological and thermal dynamics.
The number and variety of lakes in China, distributed under different geographical and climatic conditions, provide a unique chance for exploring the correlation between LSWT and LSWA in different regions and types of lakes [30,31]. Although two censuses of lakes in different regions of China were conducted in 1960–1980 and 2005–2006 [32,33], the changes in LSWA and LSWT of different types of lakes with the current changes in lakes and their drivers remain unclear. Zhang et al. [34] improved the limitations of studies on LSWA and LSWT of lakes in China by investigating the changes in water bodies in different regions of China from the 1960s to 2015, but their study did not explore the changes in LSWA and LSWT of different types of lakes and their coupling relationships. China’s lakes cover a huge area, support nearly half of the country’s centralized drinking water sources, and play a crucial role in human ecosystem services [35]. Over the past four decades, persistent and dramatic climate change, rapid urbanization, and economic growth have dramatically altered the thermal conditions of lakes. In addition, lakes in China are diverse in character and geographic location and are therefore subject to multiple climate change factors [30,36]. Therefore, it is urgent to study the long-term change pattern of overall lakes in China.
This study utilized time-series Landsat data and a comprehensive dataset of lakes in China, combined with the random forest algorithm, to extract annual LSWA and LSWT data for over 4000 lakes with areas exceeding 1 km2. Regression analyses were employed to statistically analyze the trends in LSWA and LSWT. The analysis focused on examining the variations and coupling relationships of LSWA and LSWT across different lake types and regions. This study can provide a reference for lake ecological assessment, monitoring of extreme hydrological droughts [37], and provides a scientific basis for lake protection and drought risk assessment.
2. Materials and Methods
2.1. Study Area
The study area covers 73°33′E to 135°05′E and 3°51′N to 53°33′N, covering a wide range of climatic zones from temperate to tropical, as shown in Figure 1. It can be divided into nine distinct geographical regions: Northeast China Plain (NCP), Yunnan–Guizhou Plateau (YGP), Northern Arid and Semi-Arid Regions (NAASR), South China (SC), Sichuan Basin and Surrounding Areas (SBASR), Middle and Lower Yangtze River Plain (MLYP), QTP, Loess Plateau (LP), and Huang-Huai-Hai Plain (HHHP). The geographic zoning vector data were obtained from the Chinese Academy of Sciences Resource and Environment Data Cloud Platform (http://www.resdc.cn, accessed on 1 March 2025). In these regions, natural resource endowments—including topography, climate, soil, vegetation, and socio-economic development—are relatively balanced, which minimizes the impact of major natural and societal factors [38]. This results in a clearer reflection of regional differences in lake distribution [39].
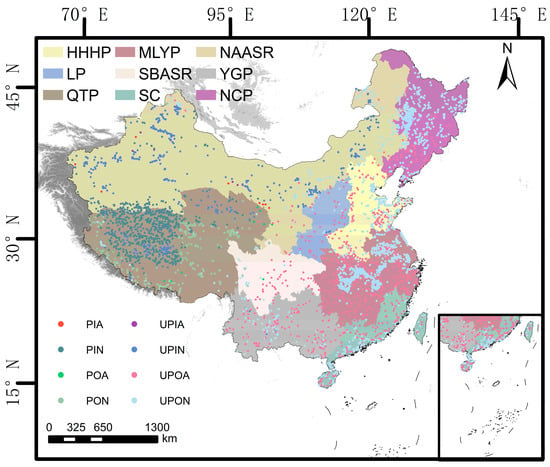
Figure 1.
A schematic diagram of the research area includes nine regions: NCP, YGP, NAASR, SC, SBASR, MLYP, QTP, LP, and HHHP, as well as eight lake types: PIA, UPIA, PIN, UPI, POA, UPO, PON, and UPON.
The study area encompasses 4093 lakes with surface area exceeding 1 km2. Lakes have different hydrological characteristics and recharge mechanisms and can be categorized based on their representation of regional hydrological conditions and the availability of reliable data. In this study, the classification considers factors such as the source of recharge (whether the lake is recharged by permafrost, i.e., permafrost or non-permafrost), the direction of water flow in the hydrological process (endorheic or exorheic), and the type of lake formation (manmade reservoirs or natural lakes). These criteria are used to reflect both the natural attributes and hydrological characteristics of the lakes. Based on these factors, the lakes are classified into eight types: permafrost recharge into endorheic artificial reservoirs (PIA), non-permafrost recharge into endorheic artificial reservoirs (UPIA), permafrost recharge into endorheic natural lakes (PIN), non-permafrost recharge into endorheic natural lakes (UPIN), permafrost recharge into exorheic artificial reservoirs (POA), non-permafrost recharge into exorheic artificial reservoirs (UPOA), permafrost recharge into exorheic natural lakes (PON), and non-permafrost recharge into exorheic natural lakes (UPON). In this classification, P denotes lakes fed by permafrost meltwater, while UP refers to those replenished by non-permafrost meltwater. O signifies exorheic lakes, and I denotes endorheic lakes. Additionally, N designates natural lakes, and A indicates artificial reservoirs. The distribution of these lake types is intrinsically linked to regional climate, topography, and recharge processes, collectively shaping the hydrological dynamics and ecological diversity of the study area. The total number of lakes by region and type is shown in Table 1.

Table 1.
Summary of the number of lakes in different geographical regions and by lake type.
2.2. Data Sources
2.2.1. Landsat Data and Joint Research Centre Global Surface Water (JRC Global Surface Water) Dataset
This study utilized Landsat series satellite surface reflectance and temperature products in conjunction with the JRC Global Surface Water dataset, both accessible via the Google Earth Engine (GEE) platform. The Landsat series provides remote sensing imagery with high spatial, spectral, and temporal resolution, making it well suited for long-term environmental analysis [40]. Specifically, the surface reflectance data from Landsat 5 and 7 were generated using the Landsat Ecosystem Disturbance Adaptive Processing System LEDAPS (LEDAPS) algorithm [41], while data from Landsat 8 were processed using the Land Surface Reflectance Code LaSRC (LaSRC) algorithm [42]. All Landsat series of standardized Land Surface Temperature products are derived using an operational single channel (SC) algorithm based on the Advanced Spaceborne Thermal Emission and Reflection Radiometer (ASTER) Global Emissivity Dataset Version 3 (GEDv3), which provides physically retrieved emissivity values that enable more accurate and consistent correction of Landsat thermal data at their native spatial resolution [43]. Compared to the MODIS and Sentinel satellite series, Landsat satellites offer higher spatial resolution in the thermal infrared bands. Additionally, their coverage effectively encompasses the study area, providing superior data support for detailed land surface temperature monitoring and analysis. The data volume provided by each satellite is illustrated in Figure 2.
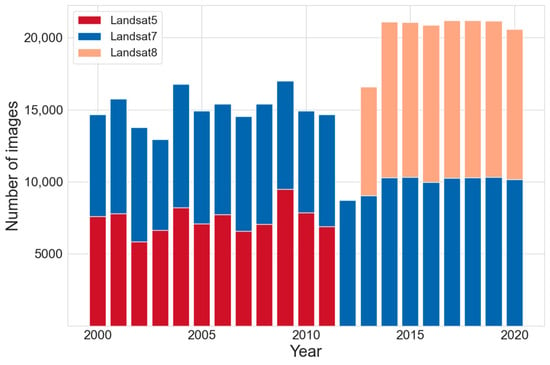
Figure 2.
Statistical chart showing the number of different Landsat satellites from 2000 to 2020.
The JRC Global Surface Water dataset, derived from Landsat 5, 7, and 8 imagery spanning from 1984 to 2019, provides a global surface water coverage map at a 30 m resolution. This dataset enables the tracking of surface water dynamics over time, identifying regions where water levels have increased, decreased, or remained stable globally. It includes data on the probability of water presence at each pixel, inter-annual variability, spatial distribution, and seasonal fluctuations. Specifically, the dataset classifies trends into non-water areas, seasonal water bodies, and permanent water bodies, offering insights into their dynamic changes, spatial distribution, and the duration (in months) of seasonal and permanent water presence. Despite its strengths, the JRC dataset mainly offers statistical surface water information and does not effectively capture variations in LSWA. Nevertheless, it can be utilized as a supplementary dataset for correction purposes.
2.2.2. GLAKES Global Lakes Dataset
The GLAKES global lake dataset is derived from the Global Water Frequency Dataset and a deep learning-based semantic segmentation model. It provides detailed boundary information for lakes worldwide, covering 3.4 million lakes with an area greater than or equal to 0.03 square kilometers. The dataset records the maximum spatial extent of lakes from 1984 to 2019. This comprehensive coverage significantly reduces inaccuracies in lake LSWA extraction caused by lake movement. Compared to existing similar datasets, GLAKES offers a broader coverage, higher spatial resolution, and stronger spatiotemporal consistency, making it capable of reflecting long-term trends [44]. Additionally, GLAKES includes several auxiliary variables that describe the geographic characteristics of lakes, such as whether the lake is fed by glaciers or permafrost, whether it is an endorheic lake, or whether it is an artificial reservoir. These variables further enhance the value of GLAKES in the fields of lake hydrological processes, ecological environment assessment, and water resource management.
2.3. Method
2.3.1. Lake Surface Water Body and Temperature Extraction
Given that the random forest (RF) algorithm integrates Classification and Ensemble learning, Regression Trees, Boosting, and Bagging, it exhibits high classification accuracy, robustness to outliers and noise, computational efficiency, internal error estimation capability, model strength, variable importance assessment, and ease of parallelization [45,46,47,48,49,50,51,52]. RF was employed to classify water bodies using Landsat 5, Landsat 7, and Landsat 8 satellite images covering terrestrial regions of China from 2000 to 2020 in this study. To extract the distribution of water bodies, a combination of several water indices was applied (as shown in Table 2), including the Modified Normalized Difference Water Index (MNDWI), Normalized Difference Built-up Index (NDBI), Normalized Difference Vegetation Index (NDVI), Enhanced Water Index (EWI), and Land Surface Water Index (LSWI). These indices were integrated into an RF model for classifying water bodies, resulting in annual water body images. Classification accuracy was evaluated using multiple metrics, including overall accuracy, user accuracy, producer accuracy, and the Kappa coefficient. The model achieved an overall accuracy of 0.9899, with both user and producer accuracies exceeding 95% and a Kappa coefficient of 0.9795 (as shown in Table 3). To derive annual data on permanent water bodies from 2000 to 2020, the JRC dataset was used as a spatial mask to filter out non-water pixels from the annual water body images. Pixels with a water occurrence frequency greater than 70% were designated as permanent water bodies. Subsequently, the GLAKES lake dataset was used to extract the area of these permanent water bodies within the lakes, which was then calculated as LSWA.

Table 2.
Indices used for lake water body extraction.

Table 3.
Accuracy metrics for image random forest classification.
For temperature extraction, thermal infrared bands were employed to invert the temperature distribution. The permanent water body image was used as a mask to clip the LSWT of the lake surface. Based on the time series LSWT data, the annual temperature statistics, including maximum, average, and minimum LSWT for each lake from 2000 to 2020 were calculated.
2.3.2. Trend Analysis
Given that linear regression analysis effectively captures trends in time-series data [53], this study employed this method to analyze variations in LSWT and LSWA over specific periods after obtaining the complete LSWA and LSWT dataset for all lakes. The significance of the slope in a linear regression equation is determined using the t-Student test. The t-statistic follows a t-distribution with n − 2 degrees of freedom, where n is the sample size. By comparing the calculated t-statistic with the critical values in the t-distribution table, the corresponding p-value is calculated, and a p-value of <0.05 is used as a criterion for assessing the presence of a significant trend in the time series [54]. The relevant equations are shown in (9)–(12) below:
where xi represents the year (from 2000 to 2020, with indices from 0 to 20), yi represents the corresponding temperature/area values (i.e., annual maximum, mean, minimum, and difference between maximum and minimum LSWT, and LSWA), is the ith prediction, K is the slope of the linear relationship between the year and the temperature including KLSWT_max, KLSWT_mean, KLSWT_min, KLSWT_mmd (with units of °C per year), and KLSWA (with units of km2 per year), and SE(K) is the standard error of the slope.
The relative growth rate, calculated from the ratio of KLSWA to average LSWA, is used to quantify changes in LSWA due to the significant differences in lake areas. Lakes with larger surface areas may exhibit substantial absolute changes in water body size, but these changes may not accurately reflect their relative importance or variability. The relative growth rate allows for comparison of growth across lakes of differing sizes by normalizing the growth relative to the initial area. This method ensures that the variation in growth rates is comparable across lakes with varying surface areas, providing a more robust metric for understanding temporal changes in lake water bodies. The specific formula is as follows:
where mean is the average LSWA from 2000 to 2020, and RKLSWA is the relative growth rate of LSWA (%/year).
The differences in the changes of LSWA and LSWT among lakes of different types and regions, as well as their coupling relationships, were analyzed. The flowchart is shown in Figure 3.
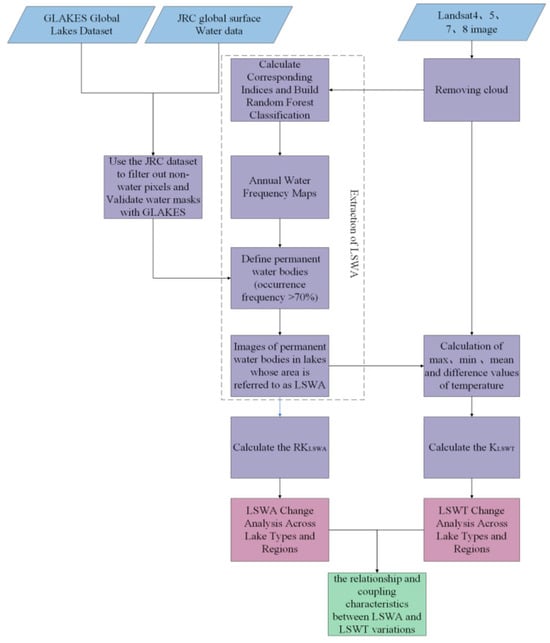
Figure 3.
Flowchart for extracting LSWA and LSWT data and extracting different K-values to analyze changes and their drivers in Chinese lakes, 2000–2020.
3. Results and Analysis
3.1. Changes of Lake Surface Water Area in China
As shown in Figure 4, from 2000 to 2020, 36.5% of lakes in China exhibited a significant increasing trend in LSWA, with 89.0% of these lakes having RKLSWA values between 0 and 0.1 year−1. In contrast, 18.1% of lakes showed a significant decreasing trend in LSWA, with 91.8% of these lakes having RKLSWA values between −0.1 and 0 year−1. RKLSWA box plots and statistical analyses for different lake types and regions are shown in Figure 5 and Figure 6 and Table 4 and Table 5.
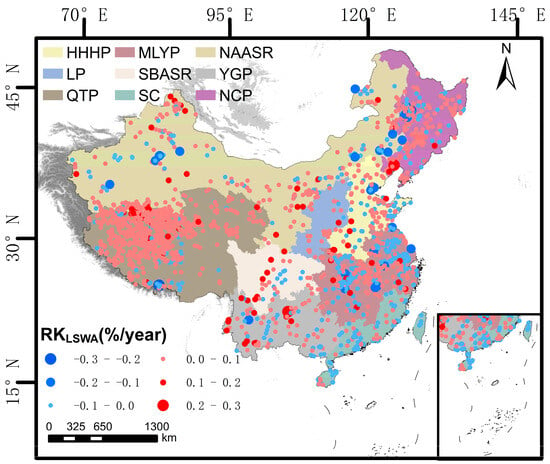
Figure 4.
Spatial scatterplot of RKLWSA in China which reflects the spatial distribution of LSWA changes in lakes. Based on the data of lakes with p-value of RKLSWA less than 0.05, the spatial scatterplot of RKLSWA in China was plotted to show the spatial distribution of changes in LSWA of lakes.

Figure 5.
The box plot of RKLSWA for lakes of different categories. Boxplots of lakes with RKLSWA p-values less than 0.05 categorized by NCP, NAASR, HHHP, LP, QIP, MLYP, SBASR, YGP, and SC, regions.

Figure 6.
The box plot of RKLSWA for lakes in different regions. Lakes with p-values less than 0.05 for RKLSWA were classified by their type as non-permafrost recharge, recharge from permafrost, exorheic lake, endorheic lake, artificial reservoir, and natural lake. (a) RKLSWA box map of whether a type of lake is replenished by permafrost, (b) RKLSWA box map of an outflow or inflow lake, and (c) RKLSWA box map of a natural lake or artificial reservoir.

Table 4.
Variance and mean of RKLSWA of lakes in different regions.

Table 5.
Variance and mean of RKLSWA in different types of lakes.
In the SBASR region, 44.8% of lakes displayed an increasing trend in LSWA, with 9.0% of lakes showing RKLSWA values in the 0.1–0.2 year−1 range. This may be attributed to the reduction in cultivated land area and decreased water consumption due to the conversion of cropland to forest, which has led to an increase in LSWA [55]. In the QTP region, nearly 57.8% of lakes have increased in area, primarily due to water supply from permanent glaciers and permafrost. Increased precipitation has been the main driver of increased lake water storage, while glacier mass loss and permafrost thaw have supplemented this increase [56]. In the LP region, about 42.1% of lakes showed an increasing area trend, which is largely due to artificial rainfall, ecological water replenishment, and other measures that reversed the trend of lake shrinkage [57]. In the NAASR region, over 45.0% of lakes had RKLSWA values significantly greater than 0. The expansion of lake areas in this region is mainly attributed to the warm and humid climate, while the shrinkage of lakes is driven by increased surface water consumption [58,59]. In SC, more than 27.5% of the lakes showed a decreasing trend in LSWA. The shrinkage of lakes may be related to lake reclamation, lakeside development, and lake enclosure [33]. In other regions such as NCP, HHHP, and YGP, there is no great variability in the LSWA changes of lakes.
Among lakes recharged by permafrost, 63.5% exhibited an increase in LSWA, whereas only 25.8% of lakes recharged by non-permafrost sources showed such an increase. The increase in lake area for permafrost-recharged lakes may be attributed to increased runoff caused by global warming. Among endorheic lakes, 57.2% displayed an increasing trend in LSWA, compared to only 26.2% for exorheic lakes. In terms of artificial reservoirs and natural lakes, over 30.0% of artificial reservoirs and nearly 36.8% of natural lakes showed an increase in LSWA, with only a small difference between the two categories.
3.2. Changes of Lake Surface Water Temperature in China
Spatially, as shown in Figure 7, Figure 8 and Figure 9, in China, 23.7% of lakes exhibit an increasing trend in maximum LSWT, while 28.3% show a decreasing trend. Regarding the changes in mean LSWT, 21.9% of lakes show an increasing trend, while 29.3% exhibit a decreasing trend. As for the minimum LSWT changes, 19.3% of lakes show an increase, while 28.3% demonstrate a decrease. Figure 10 and Figure 11 display box plots of KLSWT_max, KLSWT_mean, and KLSWT_min for different regions and lake types, and Table 6 and Table 7 summarize the mean and variance of KLSWT_max, KLSWT_mean, and KLSWT_min for different regions and lake types.
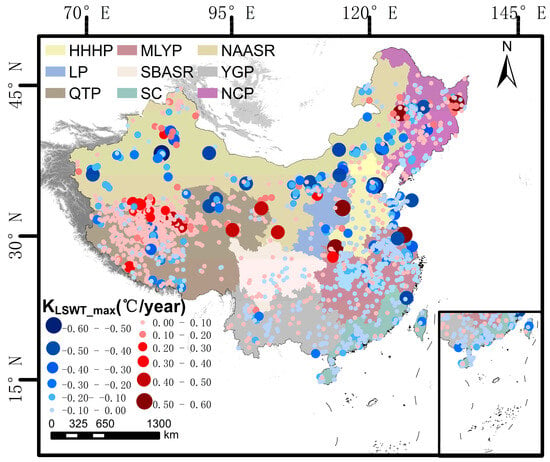
Figure 7.
Spatial scatterplot of KLSWT_max in China which reflects the spatial distribution of max LSWT changes in lakes. Based on the data of lakes with p-value of KLSWT_max less than 0.05, the spatial scatterplot of KLSWT_max in China is plotted, which shows the spatial distribution of changes in max LSWT of lakes.
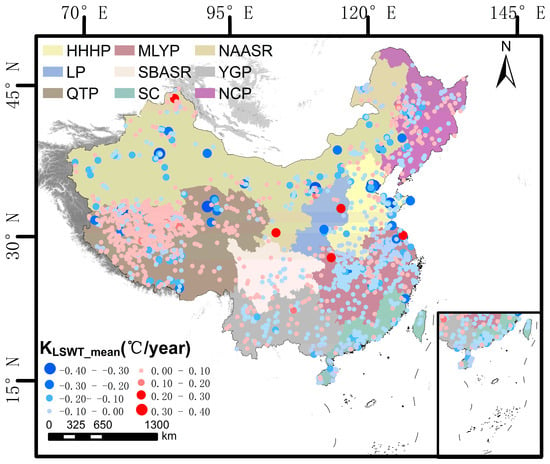
Figure 8.
Spatial scatterplot of KLSWT_mean in China which reflects the spatial distribution of mean LSWT changes in lakes. Based on the data of lakes with p-value of KLSWT_mean less than 0.05, the spatial scatterplot of KLSWT_mean in China is plotted to show the spatial distribution of mean LSWT of lakes.
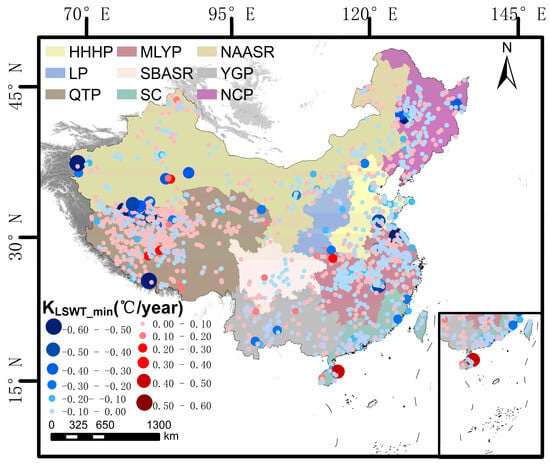
Figure 9.
Spatial scatterplot of KLSWT_min in China which reflects the spatial distribution of min LSWT changes in lakes. Based on the data of lakes with p-value of KLSWT_min less than 0.05, the spatial scatterplot of KLSWT_min in China was plotted, which showed the spatial distribution characteristics of the variation of min LSWT in lakes.
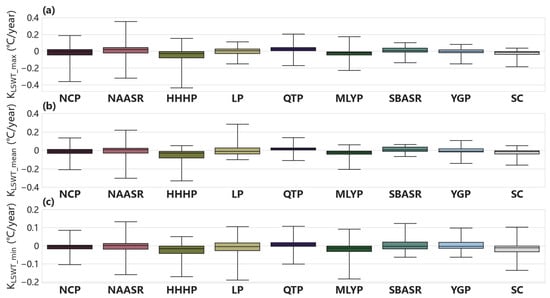
Figure 10.
Box lines of KLSWT_max, KLSWT_mean, and KLSWT_min values under different regions. Box plots of lakes with p-values less than 0.05 for KLSWT_max, p-values less than 0.05 for KLSWT_mean, and p-values less than 0.05 for KLSWT_min, classified according to NCP, NAASR, HHHP, LP, QIP, MLYP, SBASR, YGP, and SC districts. (a) KLSWT_max boxplots for lakes under different areas, (b) KLSWT_mean boxplots for lakes under different areas, and (c) KLSWT_min boxplots for lakes under different areas.
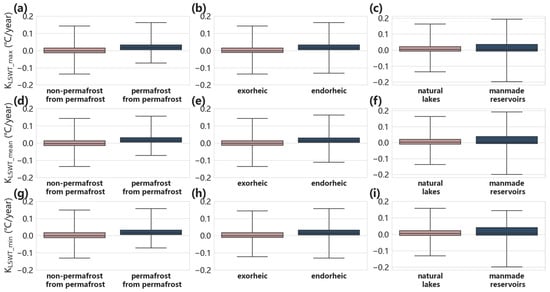
Figure 11.
Box lines of KLSWT_max, KLSWT_mean, and KLSWT_min values under different regions. The lakes with p-value less than 0.05 for KLSWT_max, p-value less than 0.05 for KLSWT_mean, and p-value less than 0.05 for KLSWT_min were classified according to their type as non-permafrost recharge, recharge from permafrost, exorheic lake, endorheic lake, artificial reservoir, and natural lake. (a) KLSWT_max box diagram of the type of lake replenished by permafrost, (b) KLSWT_max box diagram of the outflow or inflow lake, (c) KLSWT_max box diagram of the natural lake or artificial reservoir, (d) KLSWT_max box diagram of the type of lake replenished by permafrost, (e) KLSWT_max box diagram of the outflow or inflow lake, (f) KLSWT_max box diagram of the natural lake or artificial reservoir, (g) KLSWT_min box map of whether the type of lake is replenished by permafrost, (h) KLSWT_min box map of an outflow or inflow lake, and (i) KLSWT_min box map of a natural lake or artificial reservoir.

Table 6.
Variance and mean of KLSWT_max, KLSWT_mean, and KLSWT_min of lakes in different regions.

Table 7.
Variance and mean of KLSWT_max, KLSWT_mean, and KLSWT_min in different types of lakes.
In the QTP region, 49.8% of lakes display KLSWT_max greater than 0, 47.9% of lakes show KLSWT_mean greater than 0, and 36.3% of lakes exhibit KLSWT_min greater than 0. This trend is likely driven by meteorological factors, including increased downward longwave radiation, temperature, humidity, and decreased wind speed [60]. In the NAASR region, 32.8% of lakes show an increasing trend in max LSWT, and 28.4% display an increase in mean LSWT. The warming trend in this region is mainly driven by anthropogenic factors, with human activities contributing the most to climate warming [61]. In contrast, in the MLYP region, 48.1%, 48.5%, and 39.9% of lakes show KLSWT_max, KLSWT_mean, and KLSWT_min less than 0, respectively. This declining trend is likely related to the significant cooling observed between 2007 and 2012 [62]. In the HHHP region, 31.2%, 35.4%, and 33.1% of lakes showed KLSWT_max, KLSWT_mean, and KLSWT_min less than 0, while only 8.1%, 4.9%, and 7.8% of lakes showed KLSWT_max, KLSWT_mean, and KLSWT_min greater than 0, respectively, and this trend suggests that that there may be a decrease in lake temperatures at some point in time in the context of global warming, which is consistent with the decrease in temperature in the region from 2009 to 2013 found by Duo et al. [63]. In other regions such as NCP and YGP, there is no great variability in the LSWA changes of lakes.
Among lakes with permafrost recharge, the percentages of lakes showing an increase in max LSWT, mean LSWT, and min LSWT are 57.0%, 53.3%, and 39.2%, respectively. In contrast, these proportions are significantly lower in lakes without permafrost recharge, where only 12.3%, 11.1%, and 12.4% show increases in the respective LSWT categories. Among endorheic lakes, 47.7% and 44.7% of lakes show KLSWT_max and KLSWT_mean greater than 0, while in exorheic lakes, these percentages are 13.6% and 12.3%, respectively. For natural lakes and artificial reservoirs, the numbers of lakes showing an increase and a decrease in LSWT are approximately equal.
3.3. Synthetic Changes of Lake Surface Water Area and Temperature in China
3.3.1. Coupling Relationship Between LSWA and Mean LSWT in China
In order to further investigate the spatial variation of LSWA and LSWT for different lake types, we first identified lakes with statistically significant RKLSWA trends (p < 0.05), then selected those exhibiting significant KLSWT_mean (p < 0.05) trends within this subset. These selected lakes were categorized into four classes based on their variation directions: 00, 01, 10, and 11, where the first digit is 0 for KLSWT_mean less than 0 and 1 for KLSWT_mean greater than 0, and the second digit is 0 for RKLSWA less than 0 and 1 for RKLSWA greater than 0. The spatial distribution map of the relationship between KLSWT_mean and RKLSWA, as shown in Figure 12, and the number of lakes in each LSWA–mean LSWT change type (00, 01, 10, 11) in different lake categories is shown in Table 8 and Table 9. Lakes of types 00 and 11 indicate lakes where the mean LSWT and LSWA are decreasing and increasing together, while lakes of types 01 and 10 indicate lakes where the mean LSWT is decreasing (increasing) and the LSWA is increasing (decreasing). Type 11 lakes constituted 20.2% of all lakes, with 54.6% distributed in the QTP region and 20.8% located in NAASR. Comparatively, Type 00 lakes accounted for 16.0% of the total lake population, of which 41.9% were concentrated in the MLYP region.
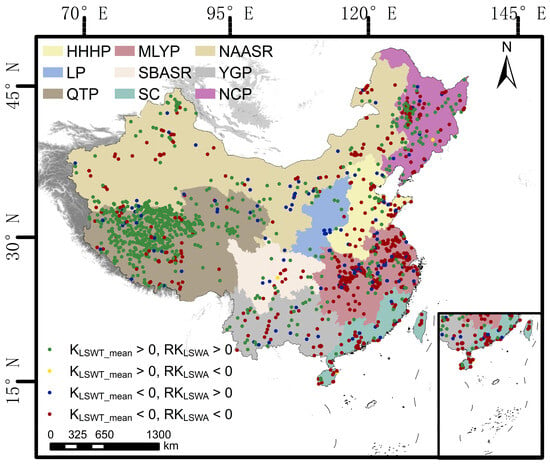
Figure 12.
The thematic map of lake classification and spatial distribution based on the relationship between KLSWT_mean and RKLSWA illustrates the distribution of lakes across China. Lakes are color-coded into four categories: red (KLSWT_mean < 0, RKLSWA < 0), blue (KLSWT_mean < 0, RKLSWA > 0), green (KLSWT_mean > 0, RKLSWA > 0), and yellow (KLSWT_mean > 0, RKLSWA < 0).

Table 8.
Number of lakes in each LSWA–mean LSWT variation type (00, 01, 10, 11) across different lake categories.

Table 9.
Number of lakes in each LSWA–LSWT variation type (00, 01, 10, 11) across different regions.
In the MLYP region, type 00 emerged as the most prevalent category, comprising 26.2% of the total distribution. The remaining lake types were predominantly classified as 01 and 11, accounting for 4.8% and 5.1% of the total proportion, respectively. Precipitation in the MLYP area is a key meteorological factor influencing LSWA [64] which may lead to independent changes in LSWA and LSWT. Lakes closer to estuaries exhibit more type 10 characteristics, due to moderated temperature fluctuations and increased water vapor from the ocean. Conversely, type 00 lakes are found further inland, where temperature fluctuations are more pronounced. In the NAASR, approximately 26.8% of lakes are type 11, primarily consisting of subtropical outwash lakes, which exhibit substantial seasonal fluctuations in temperature and water area. Temperature variations have a profound impact on snowmelt recharge, with warmer temperatures leading to increased snowmelt, thereby increasing the LSWA [65]. Conversely, as temperatures decrease, snowmelt recharge diminishes, which causes a reduction in RKLSWA. In the QTP, most lakes are type 11, accounting for 44.5%, and characterized by permafrost recharge. This phenomenon may be attributed to rising temperatures, which accelerate glacier melting, snowmelt, and permafrost degradation, thereby increasing runoff and leading to an increase in LSWA [66]. However, LSWA decline in certain areas may be associated with localized arid climates and reduced precipitation, particularly between the Himalayas and the Tanggula Mountains, as well as north of the Hengduan Mountains, where enhanced evapotranspiration and permafrost degradation may contribute to LSWA reduction [67,68].
Among lakes replenished by permafrost, over 50.0% are classified as type 11 lakes, while 4.9% are classified as type 00 lakes. In contrast, among lakes not replenished by permafrost, the proportions are 10.0% for type 11 lakes and 20.0% for type 00 lakes. This trend is likely driven by rising temperatures, which further melt permafrost and increase lake runoff, leading to an increase in LSWA for these lakes. Within the categories of endorheic and exorheic lakes, 42.5% of endorheic lakes are identified as type 11, whereas only 10.8% of exorheic lakes exhibit the same classification. Regarding natural lakes and artificial reservoirs, 22.4% of natural lakes and 11.9% of artificial reservoirs are categorized as type 11 lakes, and 17.5% of natural lakes and 10.6% of artificial reservoirs are categorized as type 00 lakes. Furthermore, in the categories of PIN and PON lakes, over 55.6% and 34.2% of lakes, respectively, exhibit characteristics of type 11 lakes.
3.3.2. Coupling Relationship Between LSWA and LSWT_mmd in China
As in Figure 13, we also identified lakes with statistically significant RKLSWA trends (p < 0.05), then selected those exhibiting significant KLSWT_mmd trends (p < 0.05) within this subset. These selected lakes were categorized into four classes based on their variation directions: 00, 01, 10, and 11, where the first digit of 0 means KLSWT_mmd is less than 0 and 1 means KLSWT_mmd is greater than 0, and the second digit of 0 means RKLSWA is less than 0 and 1 means RKLSWA is greater than 0. Lakes of types 00 and 11 indicate that lakes where the LSWT_mmd and LSWA are decreasing and increasing together, while lakes of types 01 and 10 indicate that lakes where the LSWT_mmd is decreasing (increasing) and the LSWA is increasing (decreasing). The number of lakes in each LSWA–LSWT_mmd change type (00, 01, 10, 11) in different lake categories is shown in Table 10 and Table 11. Type 11 lakes account for 18.9% of all lakes, among which 50.1% are located in the QTP area and 21.6% in the NAASR area. In contrast, type 00 lakes make up 12.2% of all lakes, with 39.2% concentrated in the MLYP region.
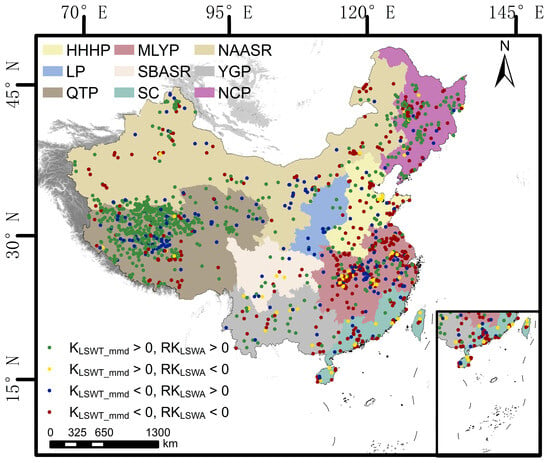
Figure 13.
The thematic map of lake classification and spatial distribution based on the relationship between KLSWT_mmd and RKLSWA illustrates the distribution of lakes across China. Lakes are color-coded into four categories: red (KLSWT_mmd < 0, RKLSWA < 0), blue (KLSWT_mmd < 0, RKLSWA > 0), green (KLSWT_mmd > 0, RKLSWA > 0), and yellow (KLSWT_mmd > 0, RKLSWA < 0).

Table 10.
Number of lakes in each LSWA–LSWT_mmd variation type (00, 01, 10, 11) across different lake categories.

Table 11.
Number of lakes in each LSWA–LSWT_mmd variation type (00, 01, 10, 11) across different regions.
In the QTP region, lakes of types 11 account for 38.2% of the total lake population. The significant rise in summer temperatures has accelerated glacier retreat and permafrost thawing [69], which in turn impacts both the surface water area and temperature of lakes. Additionally, the decrease in minimum temperatures during winter has reduced lake recharge and evapotranspiration, with minimal effects on ice formation. For lakes recharged by permafrost, both maximum and minimum temperatures may have increased, with the rate of increase in maximum temperatures surpassing that of minimum temperatures, resulting in a net rise in the temperature differential. The increase in winter temperatures, combined with reduced snowfall [70,71], has led to increased snowmelt, replenishing the lakes and driving an increase in RKLSWA. In the NAASR region, lakes of type 11 account for 26.1%, respectively, likely due to the significant impact of seasonal climate variations on lake dynamics, with annual temperature differences affecting evaporation and snowmelt recharge [72]. Precipitation remains a critical factor in determining lake size in these regions [36]. The increase in annual temperature differences exacerbates seasonal variations and precipitation fluctuations [73], which may further expand lake area. In the MLTP region, the proportion of type 00 is 18.6%. The lakes here are close to the river mouth and are less affected by the large temperature fluctuations caused by the ocean, resulting in more stable seasonal temperatures. These lakes show a tendency to shrink.
Among lakes replenished by permafrost, the proportion of type 11 lakes reaches 44.1%, whereas in lakes not replenished by permafrost, this proportion is only 10.2%. Within the categories of endorheic and exorheic lakes, the proportion of type 11 lakes in endorheic lakes is 37.4%, significantly higher than the 11.1% observed in exorheic lakes. Regarding natural and artificial lakes, type 11 lakes account for 10.9% in artificial lakes, compared to 21.0% in natural lakes, and type 00 lakes account for 8.8% in artificial lakes, compared to 13.1% in natural lakes. Furthermore, in the categories of PIN and PON lakes, the proportions of type 11 lakes are 49.2%, and 30.0%, respectively, which are significantly higher than other lake types within the same categories.
4. Discussion
4.1. Comparison with Existing Studies
As analyzed in Section 3.1 and Section 3.2, in the QTP region, 49.7% of lakes exhibited a significant increase in mean LSWT, with the majority of these lakes located in the northern and central parts, whereas lakes with a decrease in mean LSWT were predominantly distributed in the southwestern region. This spatial distribution and about 70% of the lake variation in LSWT of lakes in the QTP region is consistent with the findings of Wan et al. [74]. Additionally, 57.8% of the lakes in the QTP region showed an increasing trend in LSWA, and 7.4% of the lakes showed a decreasing trend in LSWA, which is consistent with Su et al.’s [75] finding that the gain ratios of permanent lake surface area in the Tibetan Inner Basin and the Three-River Headwaters region are 37.78% and 13.46%, respectively. In contrast, the loss ratios of permanent surface area in these two regions are much lower, at only 1.12% and 3.5%, respectively. Furthermore, Zhang et al. [34] showed that the total LSWA of lakes in the QTP increased by about 15% between the 1960s and 2015, with an average annual rate of increase of 103.00 ± 42.49 km2/yr, which is highly consistent with the results of the overall increasing trend of lake area in the QTP revealed in this study. Although Zhang et al.’s study [56] also found a general increase in LSWA in QTP lakes, with more than 80% of the lakes increasing in area between the 1970s and 2010 [76], the relative lake area change in their study was more than 100%, while the RKLSWA range reflecting the relative change of LSWA in this study was only −30–30%. This is because this study uses linear regression equation to obtain KLSWA and then divides KLSWA by the average LSWA of the lake from 2000 to 2020 to obtain the RKLSWA reflecting the changes of the lake, rather than simply dividing the LSWA of a certain year by the LSWA area of the starting time. The RKLSWA obtained in this way can better reflect the change trend of lake LSWA according to the observed values in the study time scale and avoid the disastrous impact on the determination of lake change that may be caused by the wrong observed values in a certain year.
Zhang et al. [33] reported a large number of lakes with decreasing LSWA in MLYP, where the number of disappearing lakes accounts for approximately 40% of the total lake loss in China, and Xu et al.’s study [77] found that the primary reason for the shrinkage of mid-stream lakes in the MLYP region is land reclamation and agricultural irrigation, while the fluctuations and expansion of downstream lakes are mainly influenced by precipitation and runoff. This finding is consistent with the lake area changes observed in the MLYP region in this study. Meanwhile, LSWTs in the MLYP region in this study generally show a decreasing trend, which aligns with the results of Tao et al. [78], who found a cooling effect of the water-temperature interaction in all seasons following the construction of the Three Gorges Reservoir. However, according to Huang et al.’s study [79], LSWTs in the lakes around the MLYP region are generally increasing, and this discrepancy may be due to the smaller number of lakes selected in their study.
4.2. Implications to Water Resource Management
This study reveals the changes in LSWA and LSWTs in different regions and different types of lakes in China from 2000 to 2020, which provides important decision support for water resource management. In the context of global warming, monitoring of water body changes and management of water resources are becoming more and more important, because it directly affects water security and ecological balance [80,81]. By analyzing the changes of LSWA and LSWTs of lakes, the dynamic changes of water resources can be monitored so as to avoid overdevelopment and irrational utilization of water resources and to enable them to give full play to the regulating functions of water storage, water retention, and water release [82] and effectively mitigate the impacts of hydrological events aggravated by climate change such as severe floods, snowstorms, and glacier replenishment [83]. It also helps to identify potential threats to water resources and prevent extreme events, including flooding [84,85].
In addition, lakes play an important role in supporting agricultural irrigation, industrial water supply, and urban drinking water [86], and monitoring lakes can help optimize the allocation and use of water resources, thereby contributing to the achievement of sustainable development goals, especially in the areas of agriculture, urban planning, and nature reserve management [87]. Therefore, this research not only constitutes a major contribution to the scientific community but also holds significant practical implications for policymakers and environmental management agencies.
4.3. Limitations and Future Work
There are some uncertainties and inaccuracies during the data extraction process. One of the major challenges is the absence of satellite images aroused by cloud cover, which has impeded the acquisition of complete and reliable data. This limitation has resulted in gaps and inconsistencies in temporal coverage, reducing the ability to capture continuous lake dynamics. Furthermore, inherent errors during temperature retrieval, such as limitations in inversion algorithms and satellite sensor resolution, may cause discrepancies between the extracted temperature values and the actual surface water temperature. Additionally, atmospheric interference, calibration issues, and the quality of retrieval products have exacerbated these errors.
Moreover, this study has only considered lake changes in China between 2000 and 2020, which presents limitations in terms of both temporal and spatial scale. The short time span of the data has prevented a comprehensive capture of long-term lake dynamics and their responses to climate change, especially in terms of extreme climatic events. Also, the relatively small spatial scale used in this study may not fully reflect the trends of lake changes across larger regions or multiple ecological zones.
To address these limitations, future research should incorporate monitoring data spanning a longer time period and extend to broader geographical areas, providing more representative and generalizable analysis results. Furthermore, the split-window driven temperature-and-emissivity separation (SWDTES) algorithm developed by Wang et al. [88] will be used in future studies to obtain high-precision and high-resolution LST data. Combined with the future scenario data of CMIP6, the impacts of extreme climate events such as heat wave, drought, and rainstorm on LSWA and LSWT in different regions and lake types were simulated to explore the coupling mechanism and driving factors between LSWA and LSWT_mmd. This will contribute to a better understanding of the climate adaptation capacity of lakes.
5. Conclusions
In this study, the random forest algorithm combined with JRC data was used to accurately extract LSWA data of more than 4000 lakes in China from 2000 to 2020. Then, according to the LSWA data of each year, the corresponding LSWTs data were extracted, and the RKLSWA, KLSWT_max, KLSWT_mean, KLSWT_min, and KLSWT_mmd of each lake were calculated by using regression linear equation. The variation difference of LSWA and LSWT in different types of lakes was analyzed, and the coupling relationship between LSWA and mean LSWT, LSWA, and LSWT_mmd was explored. We found that the variation of LSWA and LSWT in different regions and different kinds of lakes is very different. In QTP and NAASR regions, 57.8% and 47.0% of LSWA showed an upward trend, respectively. The LSWT of lakes in the QTP region is generally on the rise, while the LSWT of lakes in the MLYP region is generally on the decline. Approximately 20.2% of the lakes showed a simultaneous increase in mean LSWT and LSWA, while about 18.9% of the lakes showed a simultaneous increase in LSWT_mmd and LSWA as well. By analyzing the dynamics of lakes across different regions, this study highlights the significant regional differences in both lake area and water temperature changes, providing a better understanding of how climate change impacts lakes in various regions. In regions facing the dual challenges of climate change and human activities, this study offers valuable insights for decision-makers, helping to predict how lakes will respond to climate change.
Author Contributions
Conceptualization, Y.J. and M.W.; methodology, Y.J. and M.W.; validation, Y.J. and Z.L.; formal analysis, Y.J. and M.W.; investigation, M.W.; data curation, Y.J. and Z.L.; writing—original draft preparation, Y.J., Z.L. and M.W.; writing—review and editing, Y.J., Z.L. and M.W.; visualization, Y.J. and Z.L.; supervision, M.W.; project administration, Y.J.; funding acquisition, M.W. All authors have read and agreed to the published version of the manuscript.
Funding
This research was funded by the National College Students’ innovation and entrepreneurship training program (S202310491196), the Strategic Priority Research Program of the Chinese Academy of Sciences (XDA19090300), and the programs of the National Natural Science Foundation of China (Grant No. 61801443).
Data Availability Statement
The data presented in this study are available on request.
Conflicts of Interest
The authors declare no conflicts of interest.
References
- Liu, K.; Song, C.; Zhao, S.; Wang, J.; Chen, T.; Zhan, P.; Fan, C.; Zhu, J. Mapping inundated bathymetry for estimating lake water storage changes from SRTM DEM: A global investigation. Remote Sens. Environ. 2024, 301, 113960. [Google Scholar] [CrossRef]
- Lehner, B.; Döll, P. Development and validation of a global database of lakes, reservoirs and wetlands. J. Hydrol. 2004, 296, 1–22. [Google Scholar] [CrossRef]
- Wang, J.; Sheng, Y.; Tong, T.S.D. Monitoring decadal lake dynamics across the Yangtze Basin downstream of Three Gorges Dam. Remote Sens. Environ. 2014, 152, 251–269. [Google Scholar] [CrossRef]
- Ma, S.; Liao, J.; Jing, R.; Chen, J. A dataset of lake level changes in China between 2002 and 2023 using multi-altimeter data. Big Earth Data 2024, 8, 166–188. [Google Scholar] [CrossRef]
- Trumpickas, J.; Shuter, B.J.; Minns, C.K. Forecasting impacts of climate change on Great Lakes surface water temperatures. J. Great Lakes Res. 2009, 35, 454–463. [Google Scholar] [CrossRef]
- Woolway, R.I.; Kraemer, B.M.; Lenters, J.D.; Merchant, C.J.; O’Reilly, C.M.; Sharma, S. Global lake responses to climate change. Nat. Rev. Earth Environ. 2020, 1, 388–403. [Google Scholar] [CrossRef]
- Piccolroaz, S.; Zhu, S.; Ptak, M.; Sojka, M.; Du, X. Warming of lowland Polish lakes under future climate change scenarios and consequences for ice cover and mixing dynamics. J. Hydrol. Reg. Stud. 2021, 34, 100780. [Google Scholar] [CrossRef]
- Peng, Z.; Yang, K.; Shang, C.; Duan, H.; Tang, L.; Zhang, Y.; Cao, Y.; Luo, Y. Attribution analysis of lake surface water temperature changing—Taking China’s six main lakes as example. Ecol. Indic. 2022, 145, 109651. [Google Scholar] [CrossRef]
- Di Nunno, F.; Zhu, S.; Ptak, M.; Sojka, M.; Granata, F. A stacked machine learning model for multi-step ahead prediction of lake surface water temperature. Sci. Total Environ. 2023, 890, 164323. [Google Scholar] [CrossRef]
- Woolway, R.I.; Sharma, S.; Smol, J.P. Lakes in Hot Water: The Impacts of a Changing Climate on Aquatic Ecosystems. Bioscience 2022, 72, 1050–1061. [Google Scholar] [CrossRef]
- Gilarranz, L.J.; Narwani, A.; Odermatt, D.; Siber, R.; Dakos, V. Regime shifts, trends, and variability of lake productivity at a global scale. Proc. Natl. Acad. Sci. USA 2022, 119, e2116413119. [Google Scholar] [CrossRef]
- Zhang, Y.; An, C.B.; Zheng, L.Y.; Liu, L.Y.; Zhang, W.S.; Lu, C.; Zhang, Y.Z. Assessment of lake area in response to climate change at varying elevations: A case study of Mt. Tianshan, Central Asia. Sci. Total Environ. 2023, 869, 161665. [Google Scholar] [CrossRef]
- Luo, Y.; Chen, R.; Yang, K.; Zhou, X.; Jia, T.; Shang, C.; Pei, X.; Wang, Q.; Li, D.; Peng, C.; et al. Response of changes in lake area to drought and land use change. Sci. Total Environ. 2024, 947, 174638. [Google Scholar] [CrossRef]
- Ma, F.; Chen, J.; Chen, J.; Wang, T.; Han, L.; Zhang, X.; Yan, J. Evolution of the hydro-ecological environment and its natural and anthropogenic causes during 1985–2019 in the Nenjiang River basin. Sci. Total Environ. 2021, 799, 149256. [Google Scholar] [CrossRef]
- Zhang, Y.; Zhang, H.; Liu, Q.; Duan, L.; Zhou, Q. Total nitrogen and community turnover determine phosphorus use efficiency of phytoplankton along nutrient gradients in plateau lakes. J. Environ. Sci. 2023, 124, 699–711. [Google Scholar] [CrossRef]
- Nie, Y.; Sheng, Y.; Liu, Q.; Liu, L.; Liu, S.; Zhang, Y.; Song, C. A regional-scale assessment of Himalayan glacial lake changes using satellite observations from 1990 to 2015. Remote Sens. Environ. 2017, 189, 1–13. [Google Scholar] [CrossRef]
- Zhang, Z.; Chang, J.; Xu, C.Y.; Zhou, Y.; Wu, Y.; Chen, X.; Jiang, S.; Duan, Z. The response of lake area and vegetation cover variations to climate change over the Qinghai-Tibetan Plateau during the past 30 years. Sci. Total Environ. 2018, 635, 443–451. [Google Scholar] [CrossRef] [PubMed]
- Sun, J.; Zhou, T.; Liu, M.; Chen, Y.; Shang, H.; Zhu, L.; Shedayi, A.A.; Yu, H.; Cheng, G.; Liu, G.; et al. Linkages of the dynamics of glaciers and lakes with the climate elements over the Tibetan Plateau. Earth-Sci. Rev. 2018, 185, 308–324. [Google Scholar] [CrossRef]
- Woolway, R.I.; Albergel, C.; Frölicher, T.L.; Perroud, M. Severe Lake Heatwaves Attributable to Human-Induced Global Warming. Geophys. Res. Lett. 2022, 49, e2021GL097031. [Google Scholar] [CrossRef]
- O’Reilly, C.M.; Sharma, S.; Gray, D.K.; Hampton, S.E.; Read, J.S.; Rowley, R.J.; Schneider, P.; Lenters, J.D.; McIntyre, P.B.; Kraemer, B.M.; et al. Rapid and highly variable warming of lake surface waters around the globe. Geophys. Res. Lett. 2015, 42, 773–781. [Google Scholar] [CrossRef]
- Wang, W.; Shi, K.; Wang, X.; Zhang, Y.; Qin, B.; Zhang, Y.; Woolway, R.I. The impact of extreme heat on lake warming in China. Nat. Commun. 2024, 15, 70. [Google Scholar] [CrossRef] [PubMed]
- Guo, L.; Zheng, H.; Wu, Y.; Fan, L.; Wen, M.; Li, J.; Zhang, F.; Zhu, L.; Zhang, B. An integrated dataset of daily lake surface water temperature over the Tibetan Plateau. Earth Syst. Sci. Data 2022, 14, 3411–3422. [Google Scholar] [CrossRef]
- Xie, C.; Zhang, X.; Zhuang, L.; Zhu, R.; Guo, J. Analysis of surface temperature variation of lakes in China using MODIS land surface temperature data. Sci. Rep. 2022, 12, 2415. [Google Scholar] [CrossRef]
- Zhang, G.; Bolch, T.; Chen, W.; Cretaux, J.F. Comprehensive estimation of lake volume changes on the Tibetan Plateau during 1976–2019 and basin-wide glacier contribution. Sci. Total Environ. 2021, 772, 145463. [Google Scholar] [CrossRef]
- Zhang, G.; Yao, T.; Shum, C.K.; Yi, S.; Yang, K.; Xie, H.; Feng, W.; Bolch, T.; Wang, L.; Behrangi, A.; et al. Lake volume and groundwater storage variations in Tibetan Plateau’s endorheic basin. Geophys. Res. Lett. 2017, 44, 5550–5560. [Google Scholar] [CrossRef]
- Zhang, Y.; Zhang, G.; Zhu, T. Seasonal cycles of lakes on the Tibetan Plateau detected by Sentinel-1 SAR data. Sci. Total Environ. 2020, 703, 135563. [Google Scholar] [CrossRef] [PubMed]
- Webb, E.E.; Liljedahl, A.K. Diminishing lake area across the northern permafrost zone. Nat. Geosci. 2023, 16, 202–209. [Google Scholar] [CrossRef]
- Bonnema, M.; David, C.H.; Frasson, R.P.d.M.; Oaida, C.; Yun, S.H. The global surface area variations of lakes and reservoirs as seen from satellite remote sensing. Geophys. Res. Lett. 2022, 49, e2022GL098987. [Google Scholar] [CrossRef]
- Hayes, N.M.; Deemer, B.R.; Corman, J.R.; Razavi, N.R.; Strock, K.E. Key differences between lakes and reservoirs modify climate signals: A case for a new conceptual model. Limnol. Oceanogr. Lett. 2017, 2, 47–62. [Google Scholar] [CrossRef]
- Tao, S.; Fang, J.; Ma, S.; Cai, Q.; Xiong, X.; Tian, D.; Zhao, X.; Fang, L.; Zhang, H.; Zhu, J.; et al. Changes in China’s lakes: Climate and human impacts. Natl. Sci. Rev. 2020, 7, 132–140. [Google Scholar] [CrossRef]
- Ma, R.; Yang, G.; Duan, H.; Jiang, J.; Wang, S.; Feng, X.; Li, A.; Kong, F.; Xue, B.; Wu, J.; et al. China’s lakes at present: Number, area and spatial distribution. Sci. China Earth Sci. 2010, 54, 283–289. [Google Scholar] [CrossRef]
- Wang, S.; Dou, H. Chinese Lakes Inventory. In Institute of Geography and Limnology, Beijing; Publisher Science Press: Beijing, China, 1998. [Google Scholar]
- Ma, R.; Duan, H.; Hu, C.; Feng, X.; Li, A.; Ju, W.; Jiang, J.; Yang, G. A half-century of changes in China’s lakes: Global warming or human influence? Geophys. Res. Lett. 2010, 37, L24106. [Google Scholar] [CrossRef]
- Zhang, G.; Yao, T.; Chen, W.; Zheng, G.; Shum, C.K.; Yang, K.; Piao, S.; Sheng, Y.; Yi, S.; Li, J.; et al. Regional differences of lake evolution across China during 1960s–2015 and its natural and anthropogenic causes. Remote Sens. Environ. 2019, 221, 386–404. [Google Scholar] [CrossRef]
- Zhang, Y.; Deng, J.; Qin, B.; Zhu, G.; Zhang, Y.; Jeppesen, E.; Tong, Y. Importance and vulnerability of lakes and reservoirs supporting drinking water in China. Fundam. Res. 2023, 3, 265–273. [Google Scholar] [CrossRef]
- Wang, X.; Shi, K.; Zhang, Y.; Qin, B.; Zhang, Y.; Wang, W.; Woolway, R.I.; Piao, S.; Jeppesen, E. Climate change drives rapid warming and increasing heatwaves of lakes. Sci. Bull. 2023, 68, 1574–1584. [Google Scholar] [CrossRef]
- Wu, Y.; Zhong, Y.; Liu, S.; Xu, G.; Xiao, C.; Wu, X.; Xie, B.; Li, Z.; Shum, C.K. Hydrogeodesy Facilitates the Accurate Assessment of Extreme Drought Events. J. Earth Sci. 2025, 36, 347–350. [Google Scholar] [CrossRef]
- Wu, X.; Wang, Z.; Zhou, X.; Lai, C.; Chen, X. Trends in temperature extremes over nine integrated agricultural regions in China, 1961–2011. Theor. Appl. Climatol. 2016, 129, 1279–1294. [Google Scholar] [CrossRef]
- Liang, J.; Pan, S.; Xia, N.; Chen, W.; Li, M. Threshold response of the agricultural modernization to the open crop straw burning CO2 emission in China’s nine major agricultural zones. Agric. Ecosyst. Environ. 2024, 368, 109005. [Google Scholar] [CrossRef]
- Wang, R.; Wang, M.; Ren, C.; Chen, G.; Mills, G.; Ching, J. Mapping local climate zones and its applications at the global scale: A systematic review of the last decade of progress and trend. Urban. Clim. 2024, 57, 102129. [Google Scholar] [CrossRef]
- Masek, J.G.; Vermote, E.F.; Saleous, N.E.; Wolfe, R.; Hall, F.G.; Huemmrich, K.F.; Gao, F.; Kutler, J.; Lim, T.-K. A Landsat surface reflectance dataset for North America, 1990–2000. IEEE Geosci. Remote Sens. Lett. 2006, 3, 68–72. [Google Scholar] [CrossRef]
- Vermote, E.; Justice, C.; Claverie, M.; Franch, B. Preliminary analysis of the performance of the Landsat 8/OLI land surface reflectance product. Remote Sens. Environ. 2016, 185, 46–56. [Google Scholar] [CrossRef] [PubMed]
- Malakar, N.K.; Hulley, G.C.; Hook, S.J.; Laraby, K.; Cook, M.; Schott, J.R. An Operational Land Surface Temperature Product for Landsat Thermal Data: Methodology and Validation. IEEE Trans. Geosci. Remote Sens. 2018, 56, 5717–5735. [Google Scholar] [CrossRef]
- Pi, X.; Luo, Q.; Feng, L.; Xu, Y.; Tang, J.; Liang, X.; Ma, E.; Cheng, R.; Fensholt, R.; Brandt, M.; et al. Mapping global lake dynamics reveals the emerging roles of small lakes. Nat. Commun. 2022, 13, 5777. [Google Scholar] [CrossRef] [PubMed]
- Meng, Y.A.; Yu, Y.; Cupples, L.A.; Farrer, L.A.; Lunetta, K.L. Performance of random forest when SNPs are in linkage disequilibrium. BMC Bioinform. 2009, 10, 78. [Google Scholar] [CrossRef]
- Breiman, L. Random forests. Mach. Learn. 2001, 45, 5–32. [Google Scholar] [CrossRef]
- Breiman, L.; Friedman, J.H.; Olshen, R.A.; Stone, C.J. Classification and Regression Trees. In The Wadsworth & Brooks/Cole Statistics/Probability Series: Statistics: A Guide to the Unknown; Wadsworth & Brooks Series; Publisher Routledge: Abingdon, UK, 1984. [Google Scholar]
- Breiman, L. Bagging predictors. Mach. Learn. 1996, 24, 123–140. [Google Scholar] [CrossRef]
- Freund, Y.; Schapire, R.E. Experiments with a New Boosting Algorithm. In Proceedings of the ICML, Murray Hill, NJ, USA, 22 January 1996; pp. 148–156. [Google Scholar]
- Friedman, J.; Hastie, T.; Tibshirani, R. Additive logistic regression: A statistical view of boosting (with discussion and a rejoinder by the authors). Ann. Stat. 2000, 28, 337–407. [Google Scholar] [CrossRef]
- Salman, H.A.; Kalakech, A.; Steiti, A. Random Forest Algorithm Overview. Babylon. J. Mach. Learn. 2024, 2024, 69–79. [Google Scholar] [CrossRef]
- Wang, R.; Wang, M. Multi-scale analysis of surface thermal environment in relation to urban form: A case study of the Guangdong-Hong Kong-Macao Greater Bay Area. Sustain. Cities Soc. 2023, 99, 104953. [Google Scholar] [CrossRef]
- Montgomery, D.C.; Peck, E.A.; Vining, G.G. Introduction to Linear Regression Analysis; John Wiley & Sons: Hoboken, NJ, USA, 2021. [Google Scholar]
- Parchami, N.; Mostafazadeh, R.; Ouri, A.E.; Imani, R. Spatio-temporal analysis of river flow master recession curve characteristics over Ardabil province rivers. Phys. Chem. Earth Parts A/B/C 2024, 134, 103586. [Google Scholar] [CrossRef]
- Liu, W.; Dai, X.; Wang, M.; Lan, Y.; Qu, G.; Shan, Y.; Ren, J.; Li, W.; Liang, S.; Wang, Y.; et al. Area Changes and Influencing Factors of Large Inland Lakes in Recent 20 Years: A Case Study of Sichuan Province, China. Water 2022, 14, 2856. [Google Scholar] [CrossRef]
- Zhang, G.; Yao, T.; Xie, H.; Yang, K.; Zhu, L.; Shum, C.K.; Bolch, T.; Yi, S.; Allen, S.; Jiang, L.; et al. Response of Tibetan Plateau lakes to climate change: Trends, patterns, and mechanisms. Earth-Sci. Rev. 2020, 208, 103269. [Google Scholar] [CrossRef]
- Jing, Z.; Yannian, Z.; Juan, W.; Huijuan, H.; Jiye, Z. Spatio-temporal change of water area in Hongjiannao Lake and the effectiveness of protection measures. J. Desert Res. 2019, 39, 195. [Google Scholar]
- Chen, X.; Wang, Y.; Pei, H.; Guo, Y.; Zhang, J.; Shen, Y. Expansion of irrigation led to inland lake shrinking in semi-arid agro-pastoral region, China: A case study of Chahannur Lake. J. Hydrol. Reg. Stud. 2022, 41, 101086. [Google Scholar] [CrossRef]
- Wang, Y.; Shen, Y.; Guo, Y.; Li, B.; Chen, X.; Guo, X.; Yan, H. Increasing shrinkage risk of endorheic lakes in the middle of farming-pastoral ecotone of Northern China. Ecol. Indic. 2022, 135, 108523. [Google Scholar] [CrossRef]
- Wen, L.; Wang, C.; Li, Z.; Zhao, L.; Lyu, S.; Leppäranta, M.; Kirillin, G.; Chen, S. Thermal Responses of the Largest Freshwater Lake in the Tibetan Plateau and Its Nearby Saline Lake to Climate Change. Remote Sens. 2022, 14, 1774. [Google Scholar] [CrossRef]
- Zheng, S.; Zhang, B.; Peng, D.; Yu, L.; Lin, B.; Pan, Y.; Xie, Q. The trend towards a warmer and wetter climate observed in arid and semi-arid areas of northwest China from 1959 to 2019. Environ. Res. Commun. 2021, 3, 115011. [Google Scholar] [CrossRef]
- Liu, J.; Liu, S.; Tang, X.; Ding, Z.; Ma, M.; Yu, P. The Response of Land Surface Temperature Changes to the Vegetation Dynamics in the Yangtze River Basin. Remote Sens. 2022, 14, 5093. [Google Scholar] [CrossRef]
- Duo, A.; Zhao, W.; Qu, X.; Jing, R.; Xiong, K. Spatio-temporal variation of vegetation coverage and its response to climate change in North China plain in the last 33 years. Int. J. Appl. Earth Obs. Geoinf. 2016, 53, 103–117. [Google Scholar]
- Wang, W.; Teng, H.; Zhao, L.; Han, L. Long-Term Changes in Water Body Area Dynamic and Driving Factors in the Middle-Lower Yangtze Plain Based on Multi-Source Remote Sensing Data. Remote Sens. 2023, 15, 1816. [Google Scholar] [CrossRef]
- Chen, L.; Zhang, G.; Xu, Y.J.; Chen, S.; Wu, Y.; Gao, Z.; Yu, H. Human Activities and Climate Variability Affecting Inland Water Surface Area in a High Latitude River Basin. Water 2020, 12, 382. [Google Scholar] [CrossRef]
- Ma, W.; Bai, L.; Ma, W.; Hu, W.; Xie, Z.; Su, R.; Wang, B.; Ma, Y. Interannual and Monthly Variability of Typical Inland Lakes on the Tibetan Plateau Located in Three Different Climatic Zones. Remote Sens. 2022, 14, 5015. [Google Scholar] [CrossRef]
- Feng, S.; Liu, S.; Huang, Z.; Jing, L.; Zhao, M.; Peng, X.; Yan, W.; Wu, Y.; Lv, Y.; Smith, A.R.; et al. Inland water bodies in China: Features discovered in the long-term satellite data. Proc. Natl. Acad. Sci. USA 2019, 116, 25491–25496. [Google Scholar] [CrossRef]
- Mao, D.; Wang, Z.; Yang, H.; Li, H.; Thompson, J.; Li, L.; Song, K.; Chen, B.; Gao, H.; Wu, J. Impacts of Climate Change on Tibetan Lakes: Patterns and Processes. Remote Sens. 2018, 10, 358. [Google Scholar] [CrossRef]
- Gao, K.; Duan, A.; Chen, D. Interdecadal summer warming of the Tibetan Plateau potentially regulated by a sea surface temperature anomaly in the Labrador Sea. Int. J. Climatol. 2020, 41, E2633–E2643. [Google Scholar] [CrossRef]
- Chu, D.; Yong, Y.; Luobu, J.; Bianba, C. The variations of snow cover days over the Tibetan Plateau during 1981–2010. J. Glaciol. Geocryol. 2015, 37, 1461–1472. [Google Scholar] [CrossRef]
- Huang, X.; Deng, J.; Wang, W.; Feng, Q.; Liang, T. Impact of climate and elevation on snow cover using integrated remote sensing snow products in Tibetan Plateau. Remote Sens. Environ. 2017, 190, 274–288. [Google Scholar] [CrossRef]
- Wang, W.; Lee, X.; Xiao, W.; Liu, S.; Schultz, N.; Wang, Y.; Zhang, M.; Zhao, L. Global lake evaporation accelerated by changes in surface energy allocation in a warmer climate. Nat. Geosci. 2018, 11, 410–414. [Google Scholar] [CrossRef]
- Wang, X.; Zhang, X.; Zhang, W.; Zhou, H.; Shang, C.; Hua, M. The performance evaluation for δ18 O in precipitation simulated by iGCM of global typical station and investigating the reasons of δ18 O inter-annual oscillation in Hongkong station. Quat. Sci. 2018, 38, 1518–1531. [Google Scholar]
- Wan, W.; Zhao, L.; Xie, H.; Liu, B.; Li, H.; Cui, Y.; Ma, Y.; Hong, Y. Lake Surface Water Temperature Change Over the Tibetan Plateau From 2001 to 2015: A Sensitive Indicator of the Warming Climate. Geophys. Res. Lett. 2018, 45, 11177–11186. [Google Scholar] [CrossRef]
- Su, Y.; Ran, Y.; Zhang, G.; Li, X. Remotely sensed lake area changes in permafrost regions of the Arctic and the Tibetan Plateau between 1987 and 2017. Sci. Total Environ. 2023, 880, 163355. [Google Scholar] [CrossRef] [PubMed]
- Zhang, G.; Yao, T.; Xie, H.; Zhang, K.; Zhu, F. Lakes’ state and abundance across the Tibetan Plateau. Chin. Sci. Bull. 2014, 59, 3010–3021. [Google Scholar] [CrossRef]
- Xu, Y.; Cheng, X.; Gun, Z. What Drive Regional Changes in the Number and Surface Area of Lakes Across the Yangtze River Basin During 2000–2019: Human or Climatic Factors? Water Resour. Res. 2022, 58, e2021WR030616. [Google Scholar] [CrossRef]
- Tao, Y.; Wang, Y.; Rhoads, B.; Wang, D.; Ni, L.; Wu, J. Quantifying the impacts of the Three Gorges Reservoir on water temperature in the middle reach of the Yangtze River. J. Hydrol. 2020, 582, 124476. [Google Scholar] [CrossRef]
- Huang, L.; Wang, X.; Yan, Y.; Jin, L.; Yang, K.; Chen, A.; Zheng, R.; Ottlé, C.; Wang, C.; Cui, Y.; et al. Attribution of Lake Surface Water Temperature Change in Large Lakes Across China Over Past Four Decades. J. Geophys. Res. Atmos. 2023, 128, e2022JD038465. [Google Scholar] [CrossRef]
- Intergovernmental Panel on Climate Change (IPCC). Climate Change 2021—The Physical Science Basis; Cambridge University Press: Cambridge, UK, 2023. [Google Scholar] [CrossRef]
- Duan, H.; Luo, J.; Cao, Z.; Xue, K.; Xiao, Q.; Liu, D. Progress in remote sensing of aquatic environments at the watershed scale. Prog. Geogr. 2019, 38, 1182–1195. [Google Scholar] [CrossRef][Green Version]
- Chen, T.; Song, C.; Zhan, P.; Yao, J.; Li, Y.; Zhu, J. Remote sensing estimation of the flood storage capacity of basin-scale lakes and reservoirs at high spatial and temporal resolutions. Sci. Total Environ. 2022, 807, 150772. [Google Scholar] [CrossRef]
- Ho, L.T.; Goethals, P.L.M. Opportunities and Challenges for the Sustainability of Lakes and Reservoirs in Relation to the Sustainable Development Goals (SDGs). Water 2019, 11, 1462. [Google Scholar] [CrossRef]
- Belgiu, M.; Drăguţ, L. Random forest in remote sensing: A review of applications and future directions. ISPRS J. Photogramm. Remote Sens. 2016, 114, 24–31. [Google Scholar] [CrossRef]
- Hirabayashi, Y.; Mahendran, R.; Koirala, S.; Konoshima, L.; Yamazaki, D.; Watanabe, S.; Kim, H.; Kanae, S. Global flood risk under climate change. Nat. Clim. Change 2013, 3, 816–821. [Google Scholar] [CrossRef]
- Li, H.; Zhao, X.; Ding, X.; Zhang, R. The Impact of Rapid Urbanization on the Efficiency of Industrial Green Water Use in Urban Agglomerations around Poyang Lake. Sustainability 2024, 16, 8698. [Google Scholar] [CrossRef]
- Nainwal, A. Water Resource Management for Sustainable Urban Development. Math. Stat. Eng. Appl. 2021, 70, 706–712. [Google Scholar] [CrossRef]
- Wang, M.; He, G.; Hu, T.; Yang, M.; Zhang, Z.; Zhang, Z.; Wang, G.; Li, H.; Gao, W.; Liu, X. Innovative hybrid algorithm for simultaneous land surface temperature and emissivity retrieval: Case study with SDGSAT-1 data. Remote Sens. Environ. 2024, 315, 114449. [Google Scholar] [CrossRef]
Disclaimer/Publisher’s Note: The statements, opinions and data contained in all publications are solely those of the individual author(s) and contributor(s) and not of MDPI and/or the editor(s). MDPI and/or the editor(s) disclaim responsibility for any injury to people or property resulting from any ideas, methods, instructions or products referred to in the content. |
© 2025 by the authors. Licensee MDPI, Basel, Switzerland. This article is an open access article distributed under the terms and conditions of the Creative Commons Attribution (CC BY) license (https://creativecommons.org/licenses/by/4.0/).