


Dynamic Diagnosis of an Extreme Precipitation Event over the Southern Slope of Tianshan Mountains Using Multi-Source Observations


Abstract
1. Introduction
2. Data and Methods
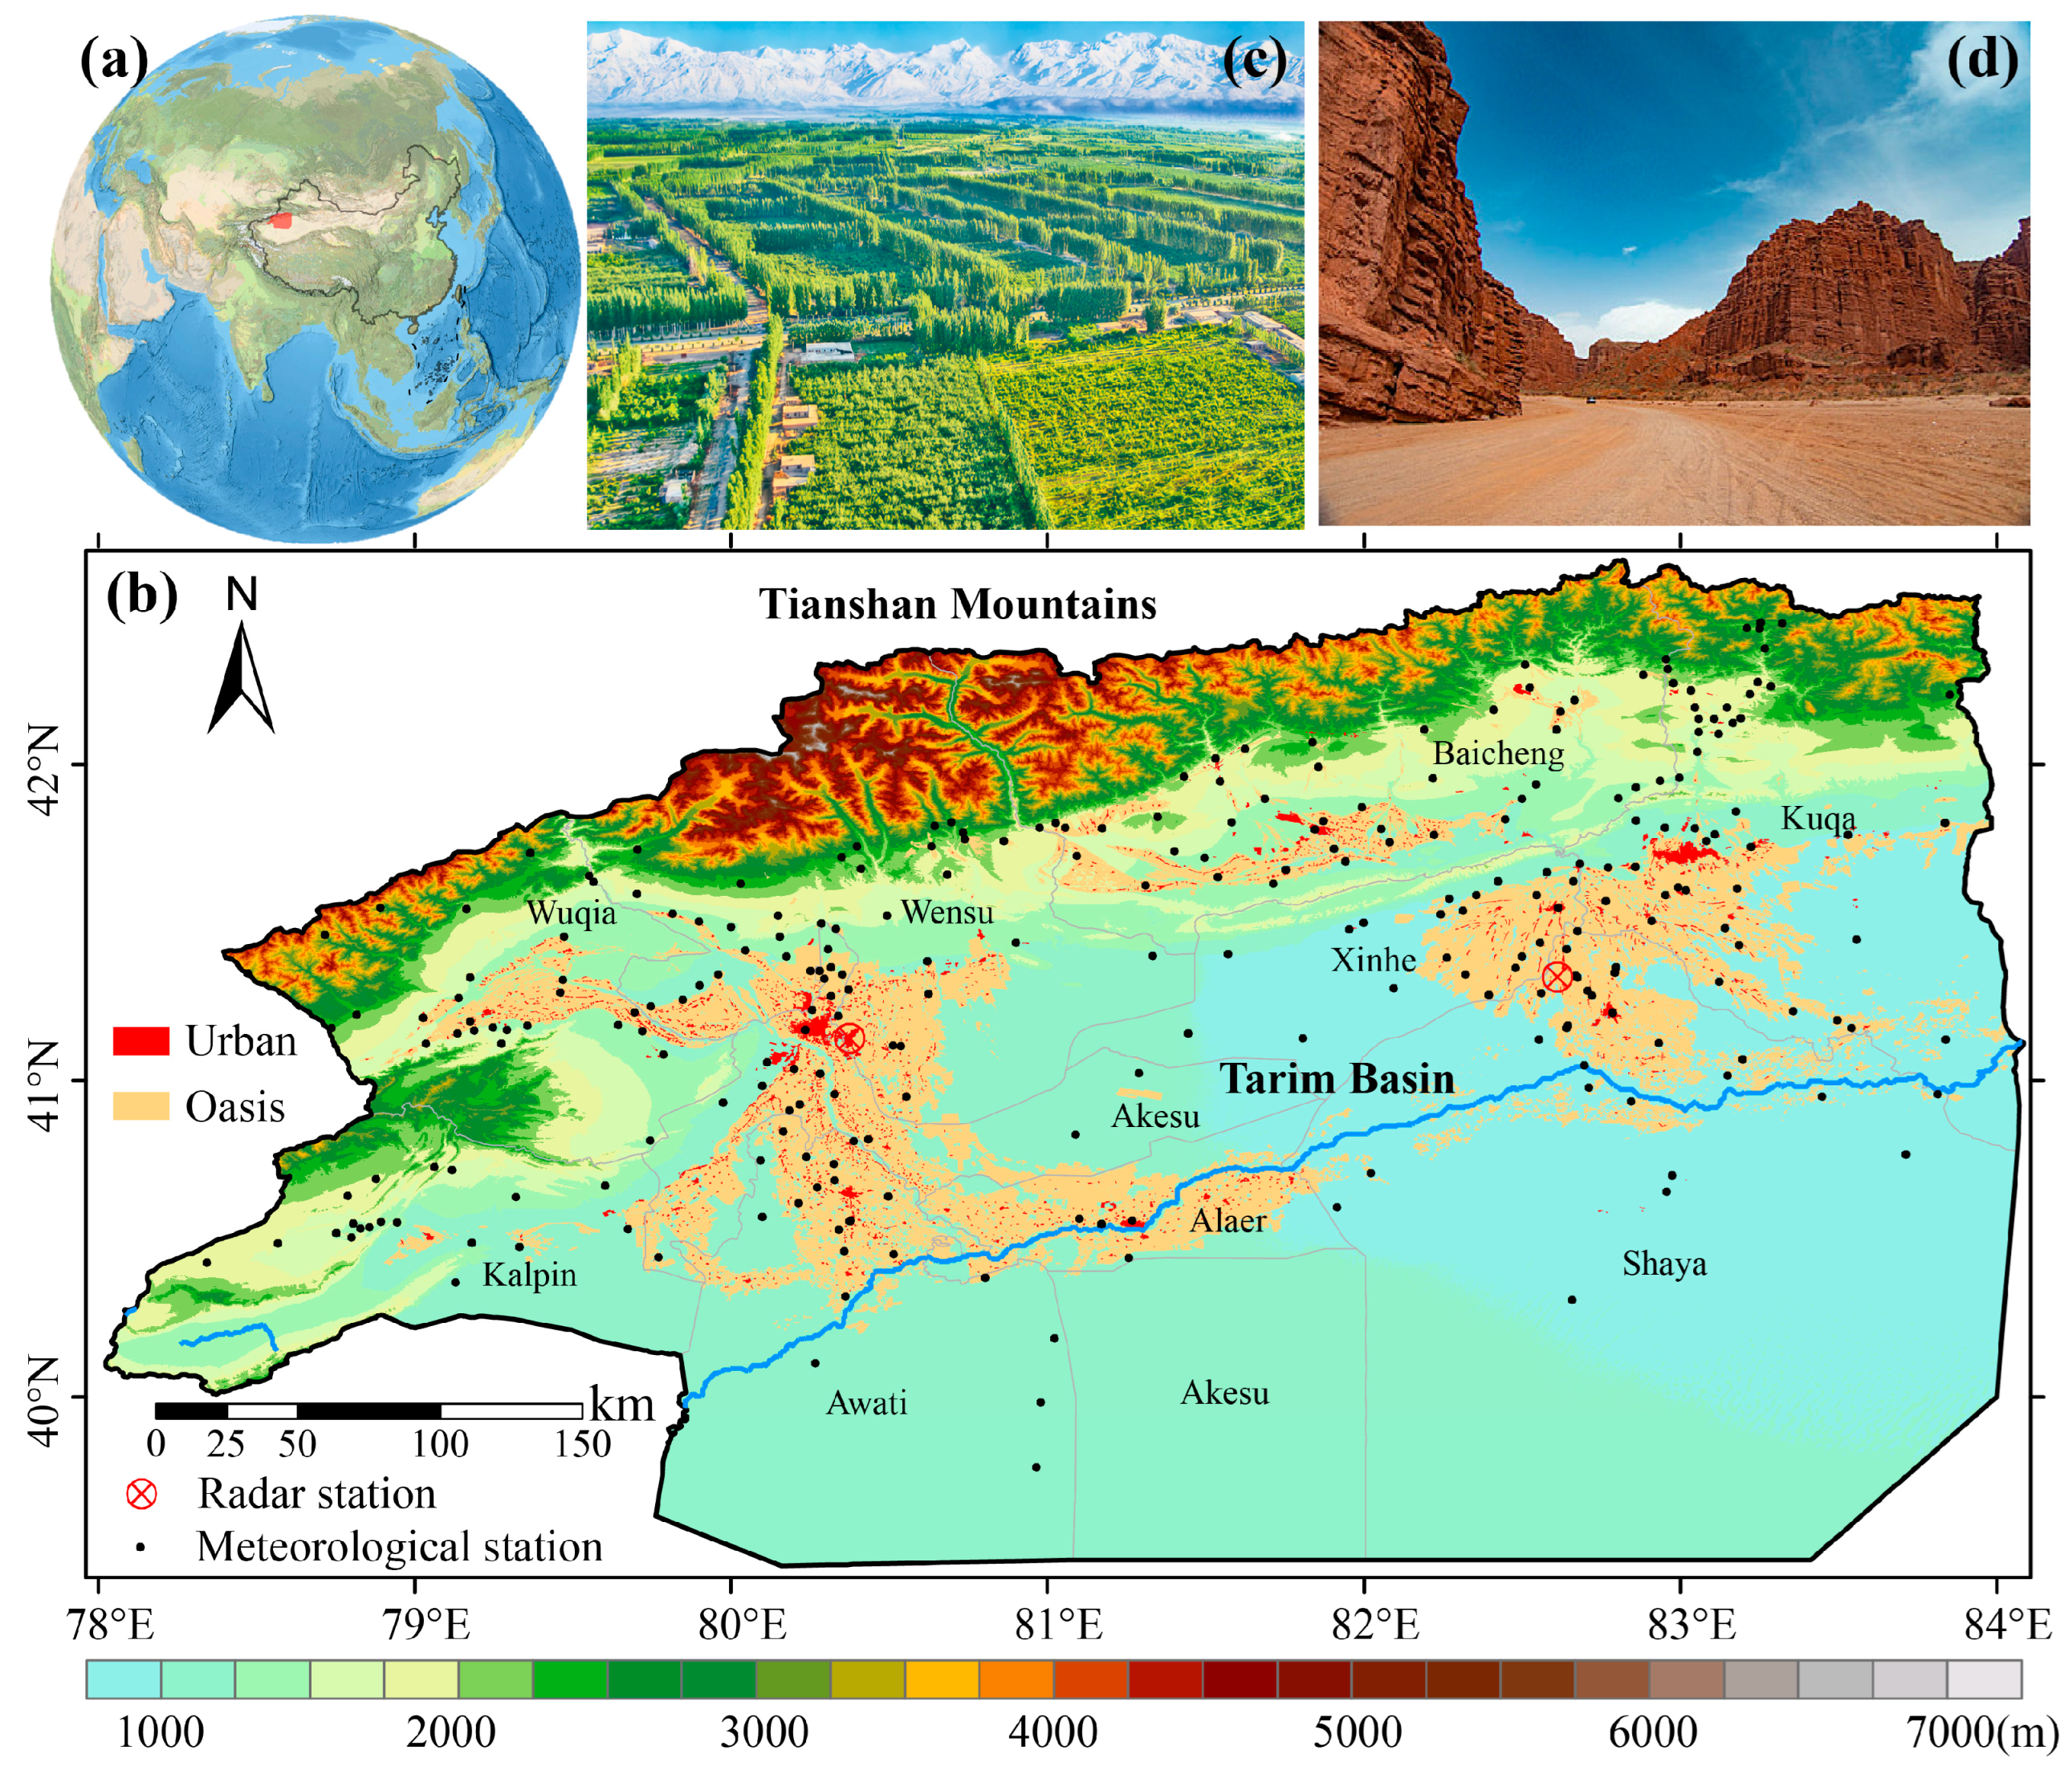
2.1. Overview of the Study Area
2.2. Data
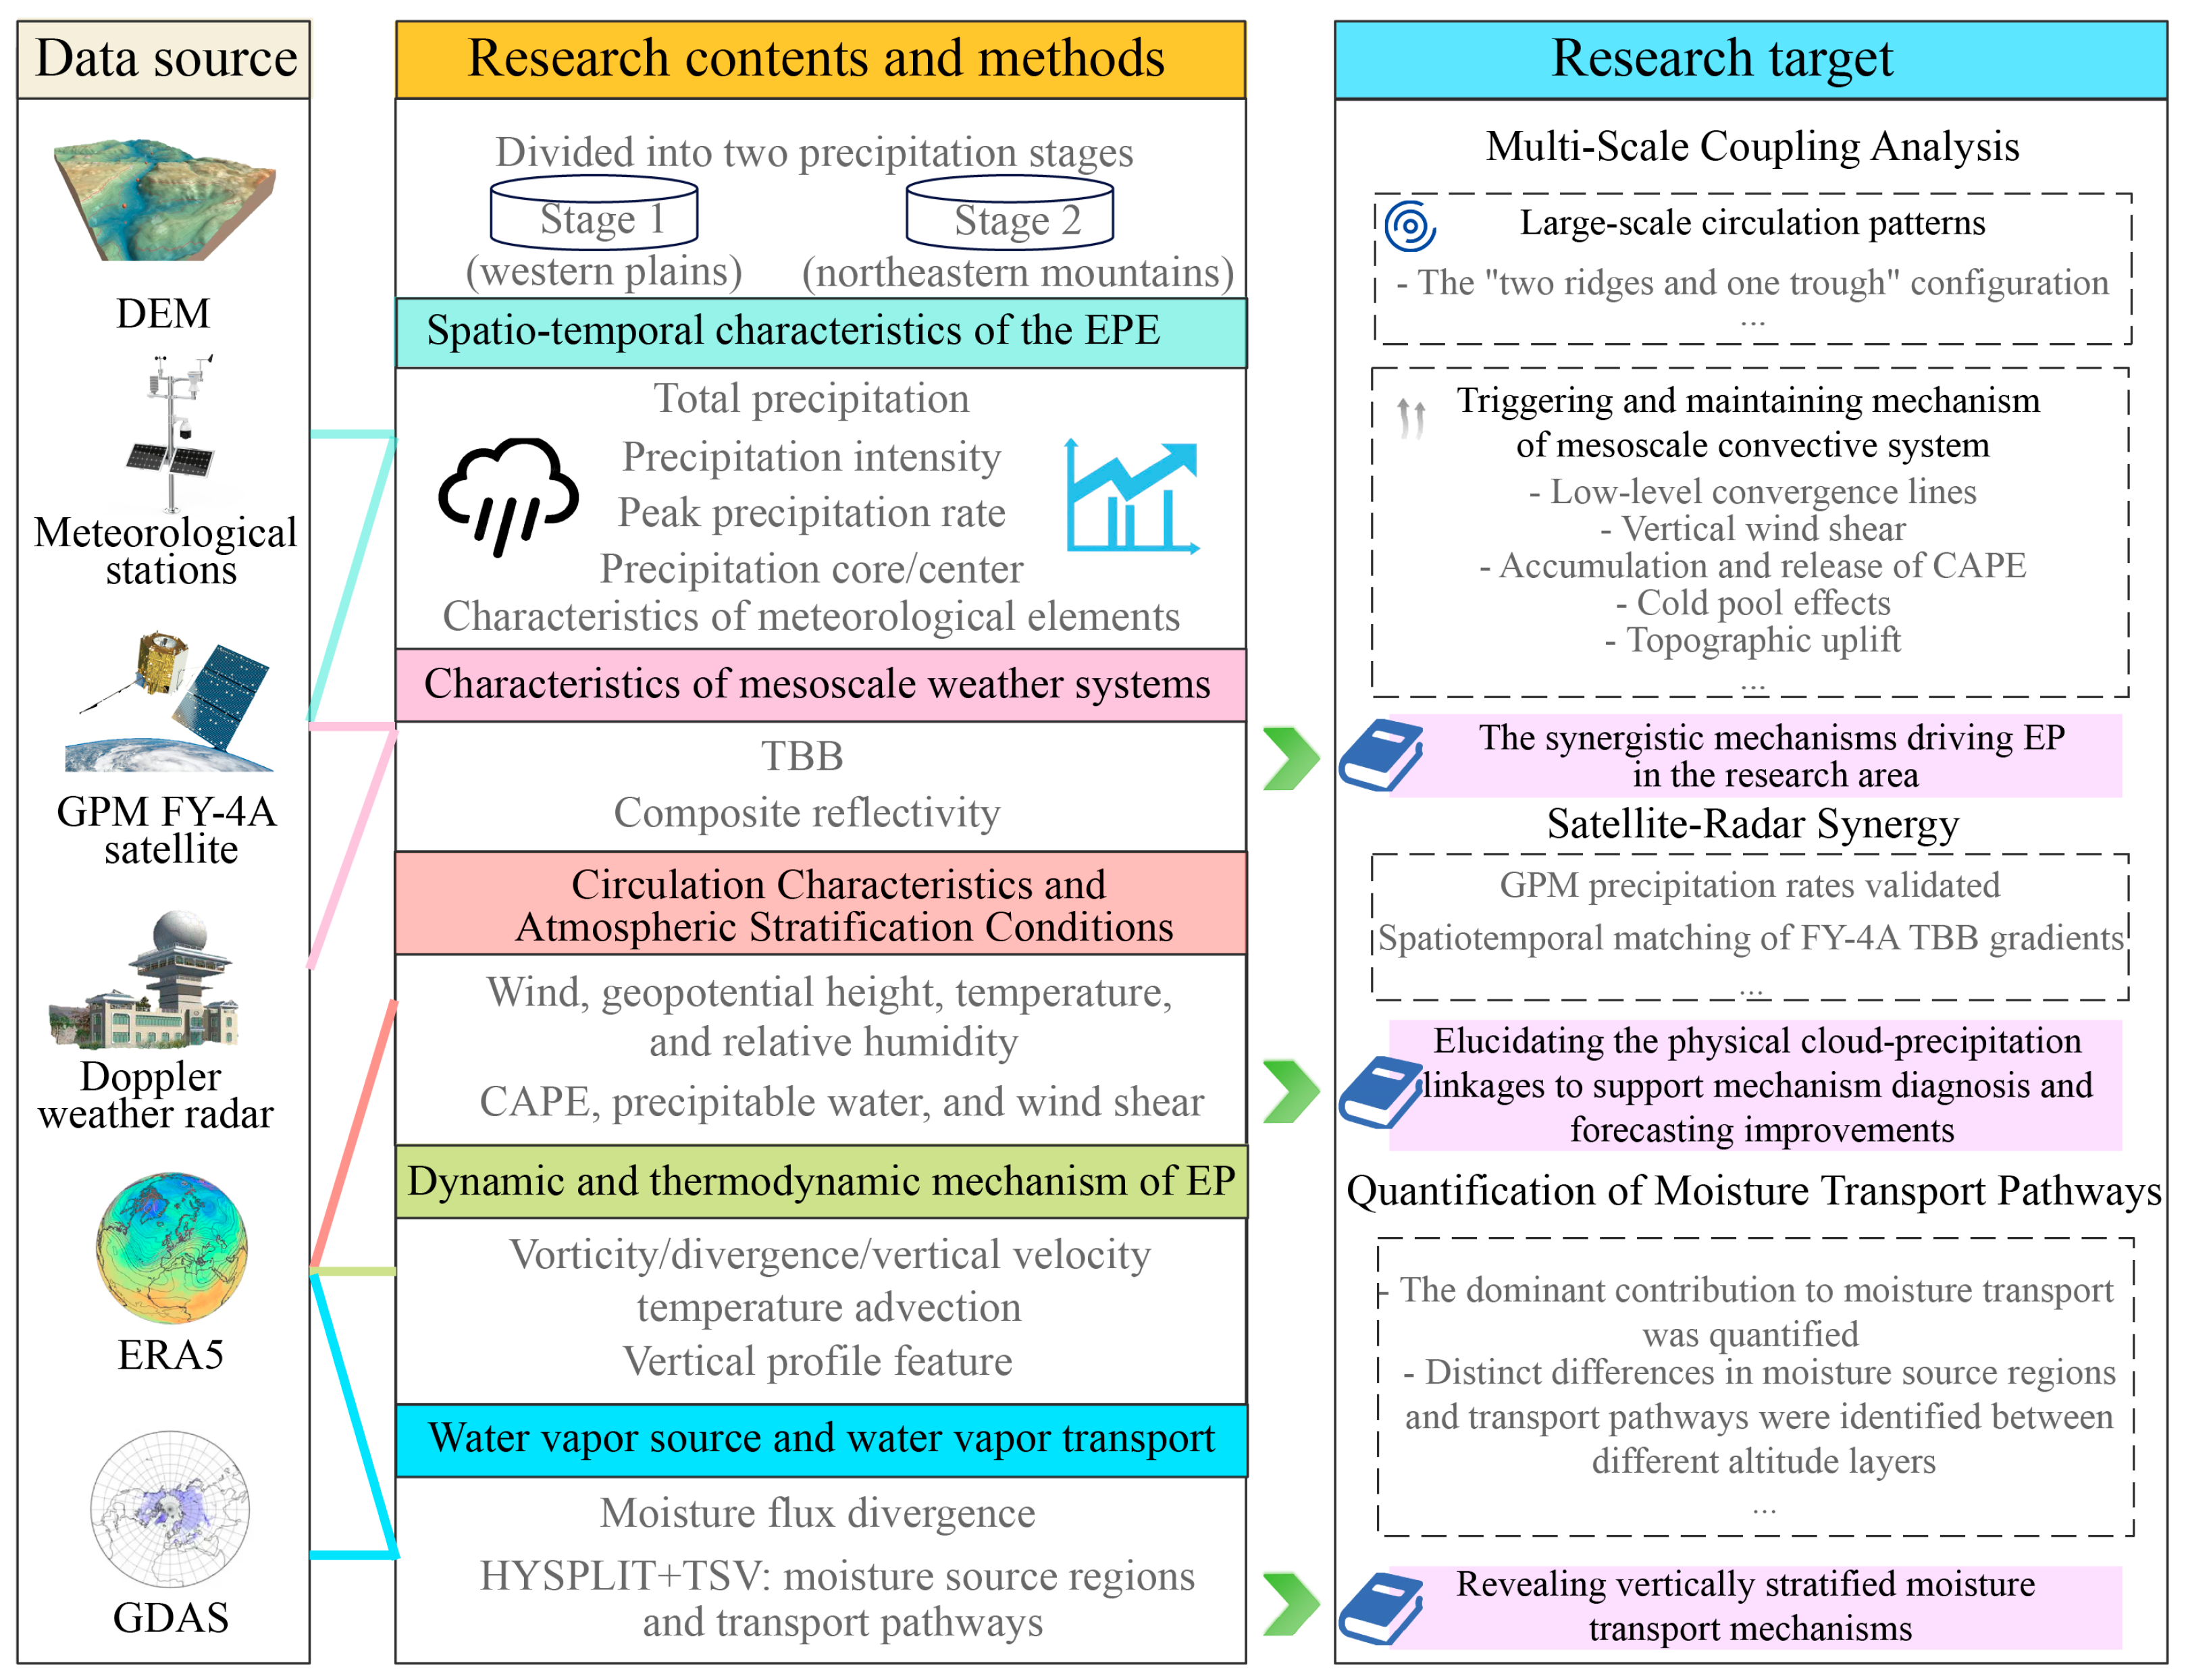
2.3. Methods
3. Result
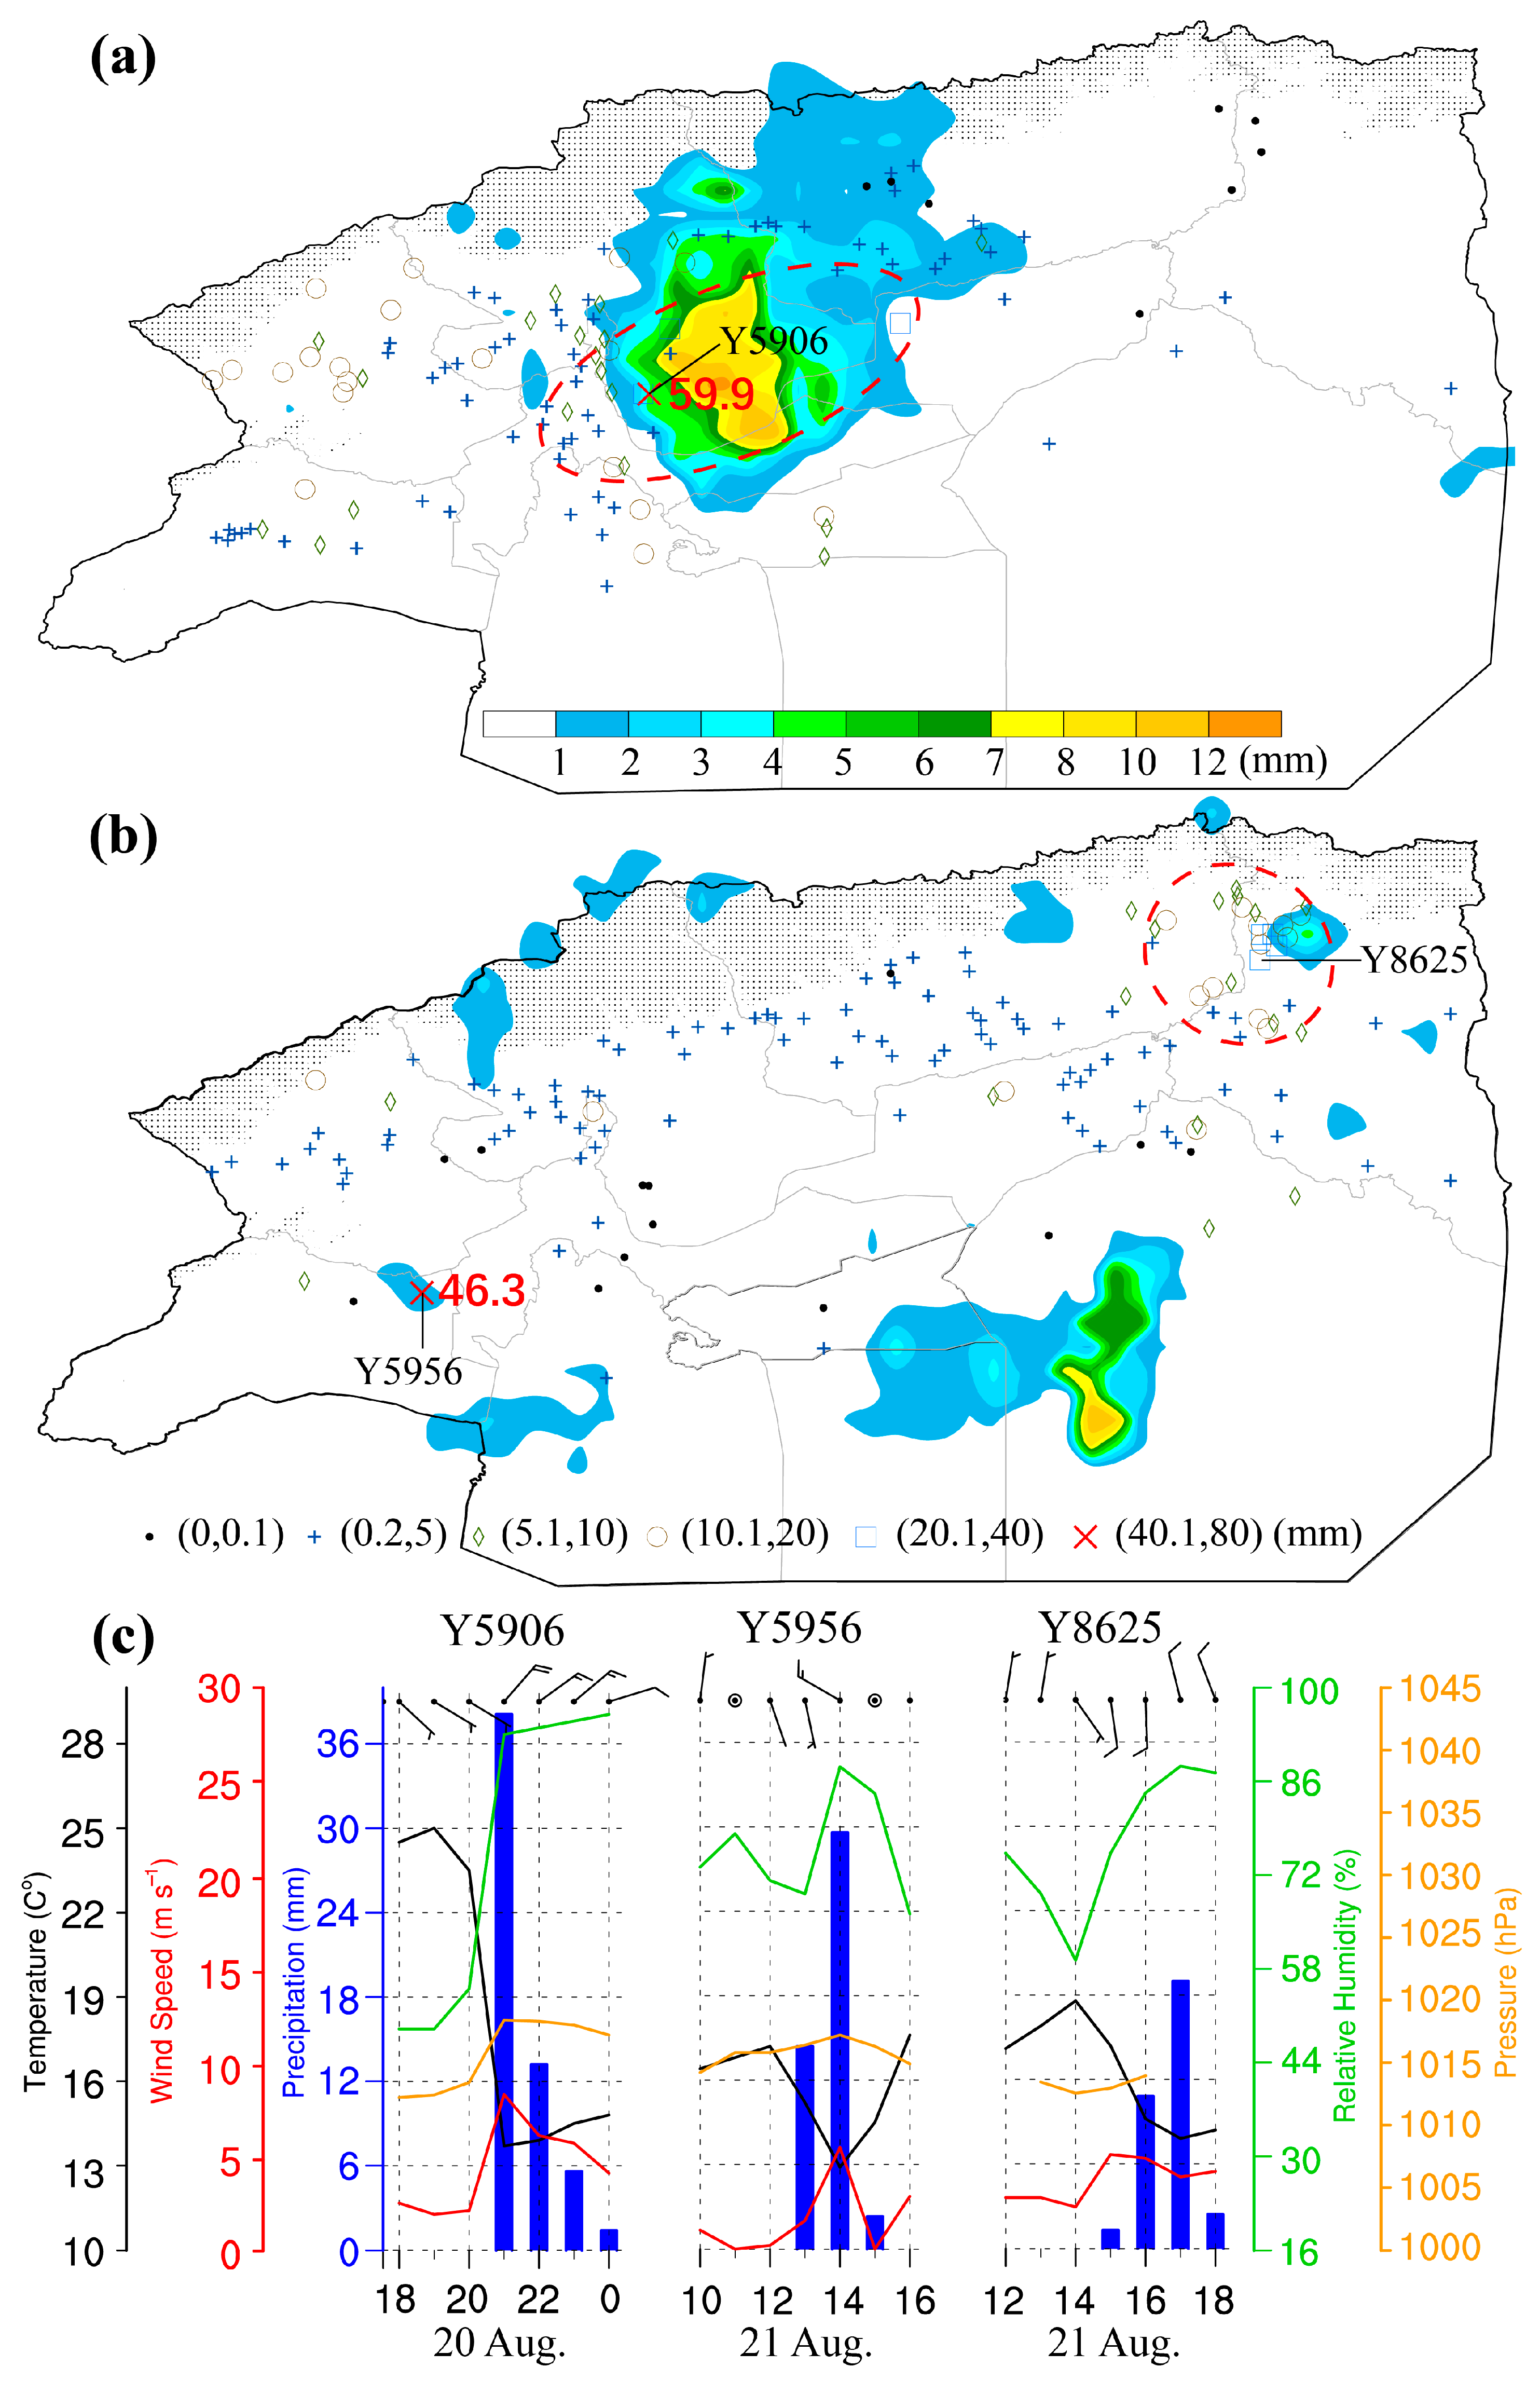
3.1. Extreme Precipitation Overview
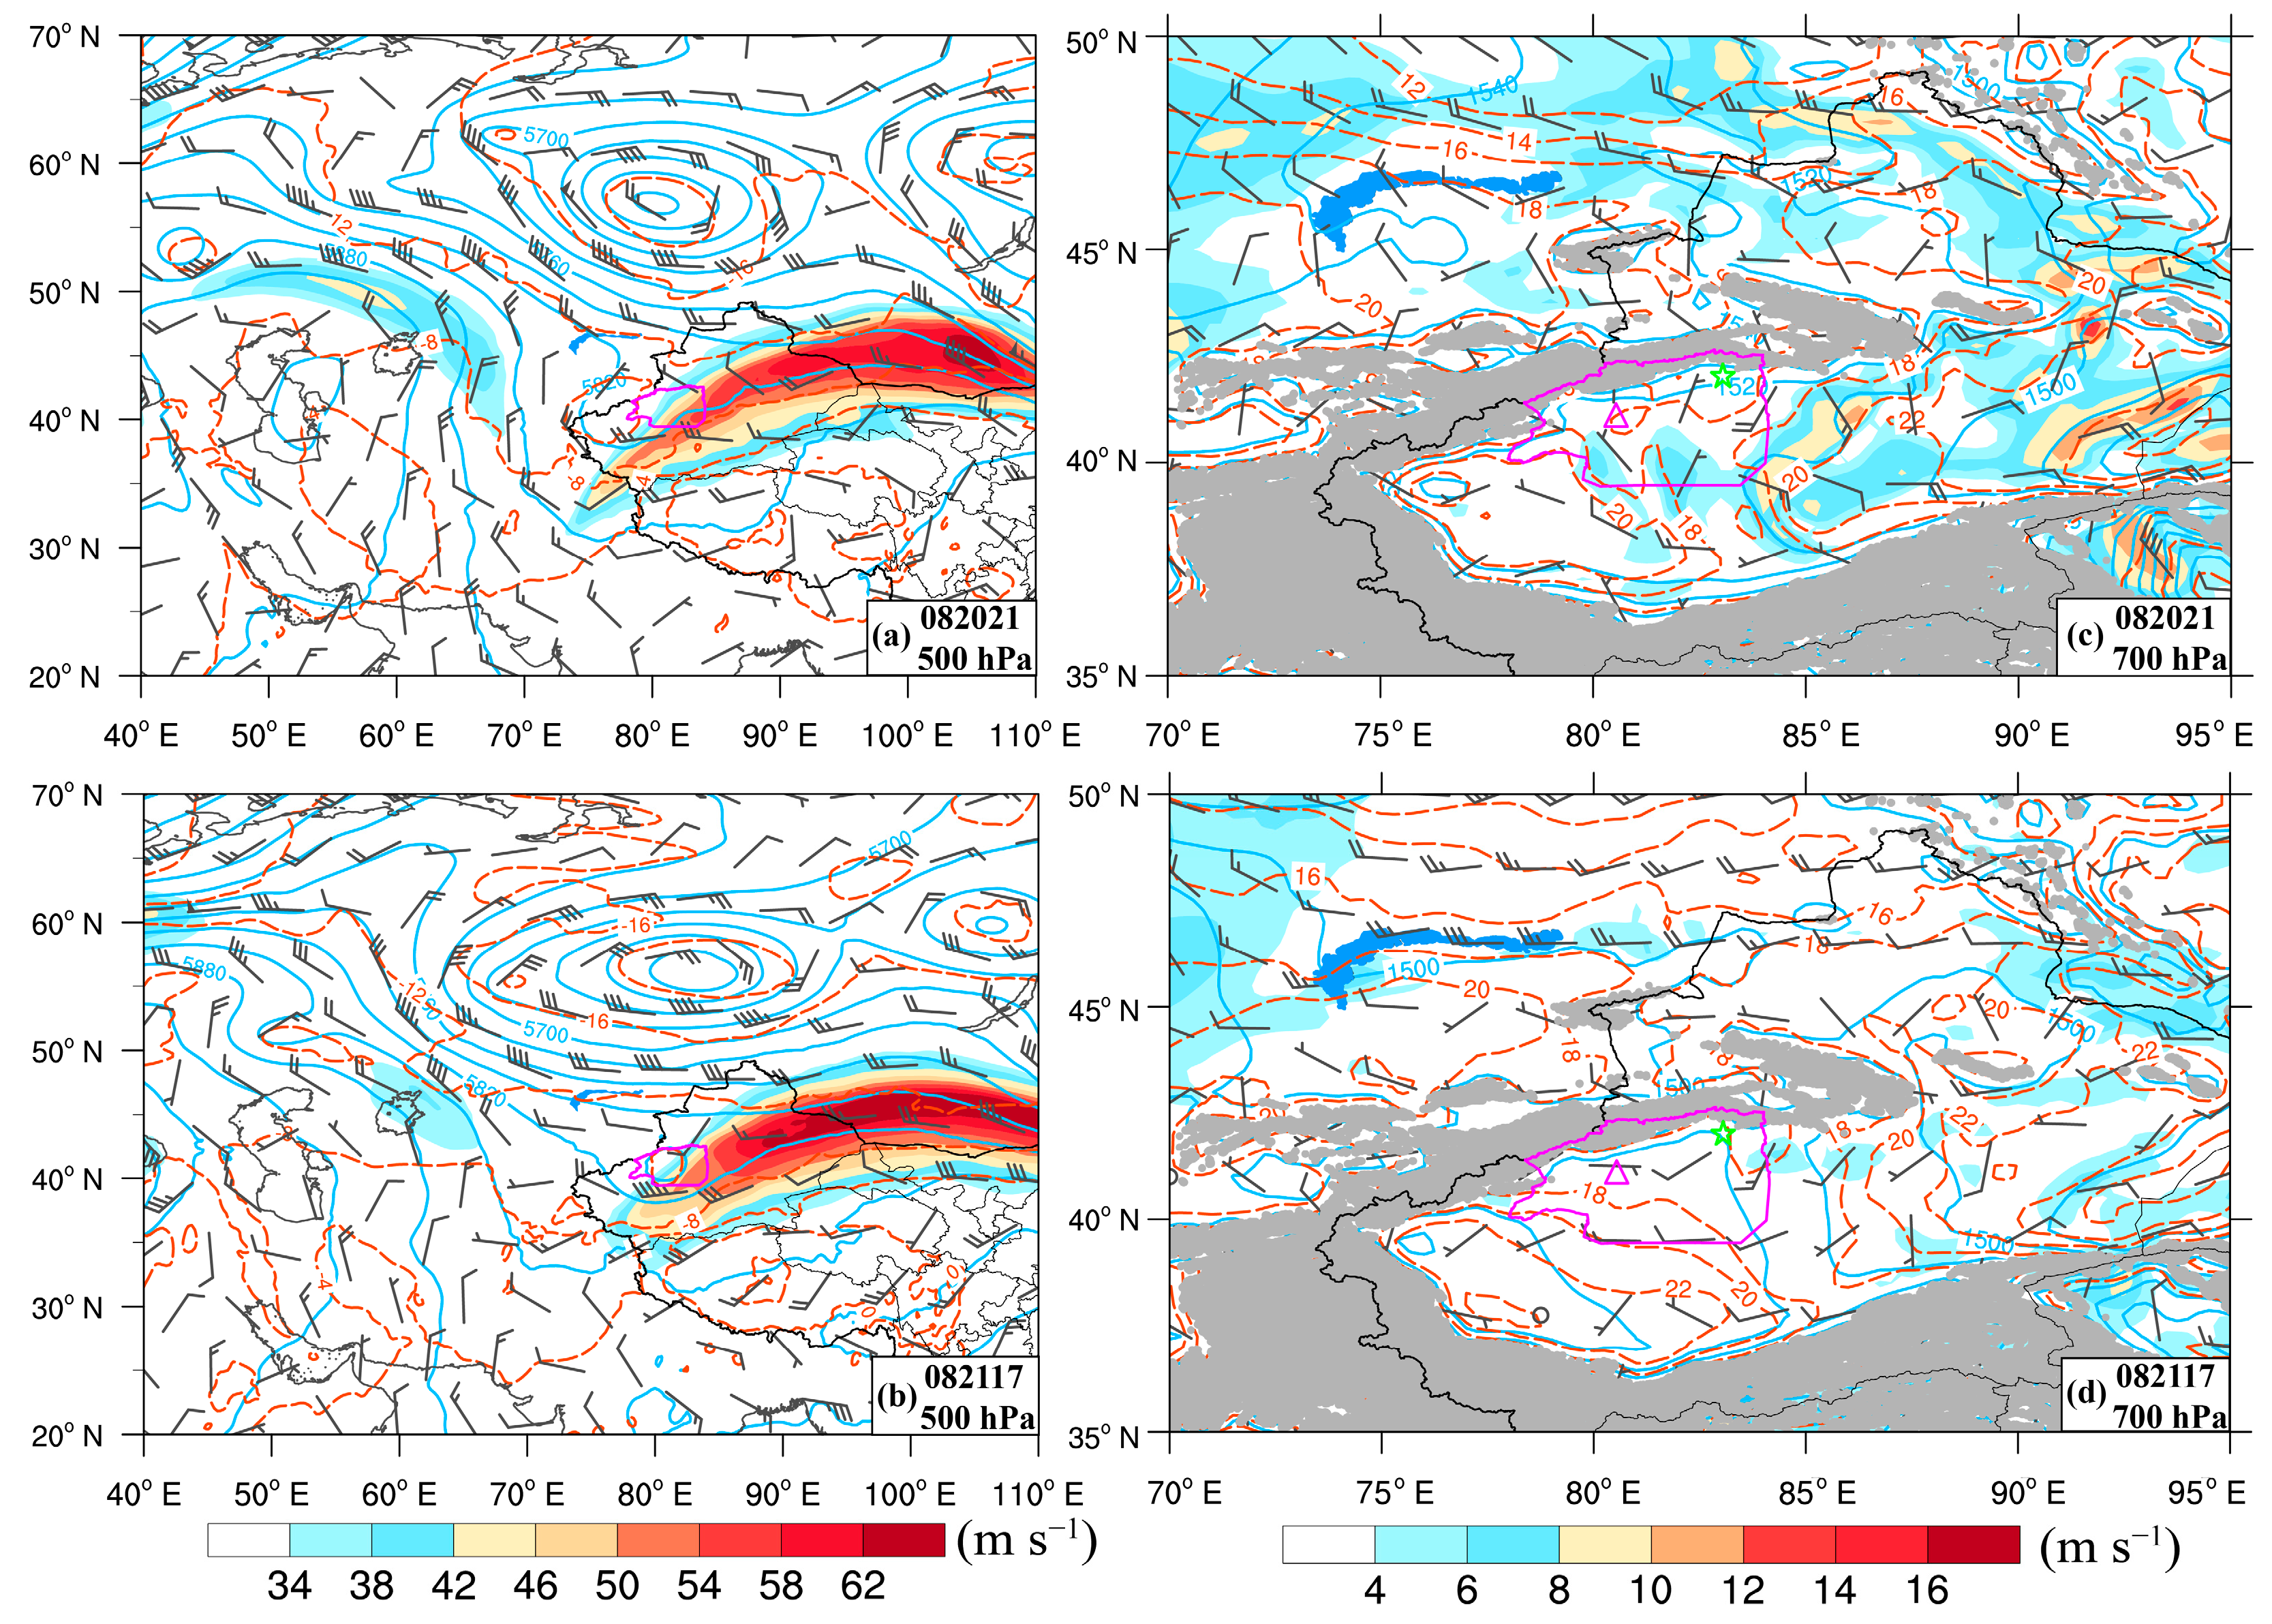
3.2. Atmospheric Circulation Pattern
3.3. Water Vapor Transport and Budget Analysis
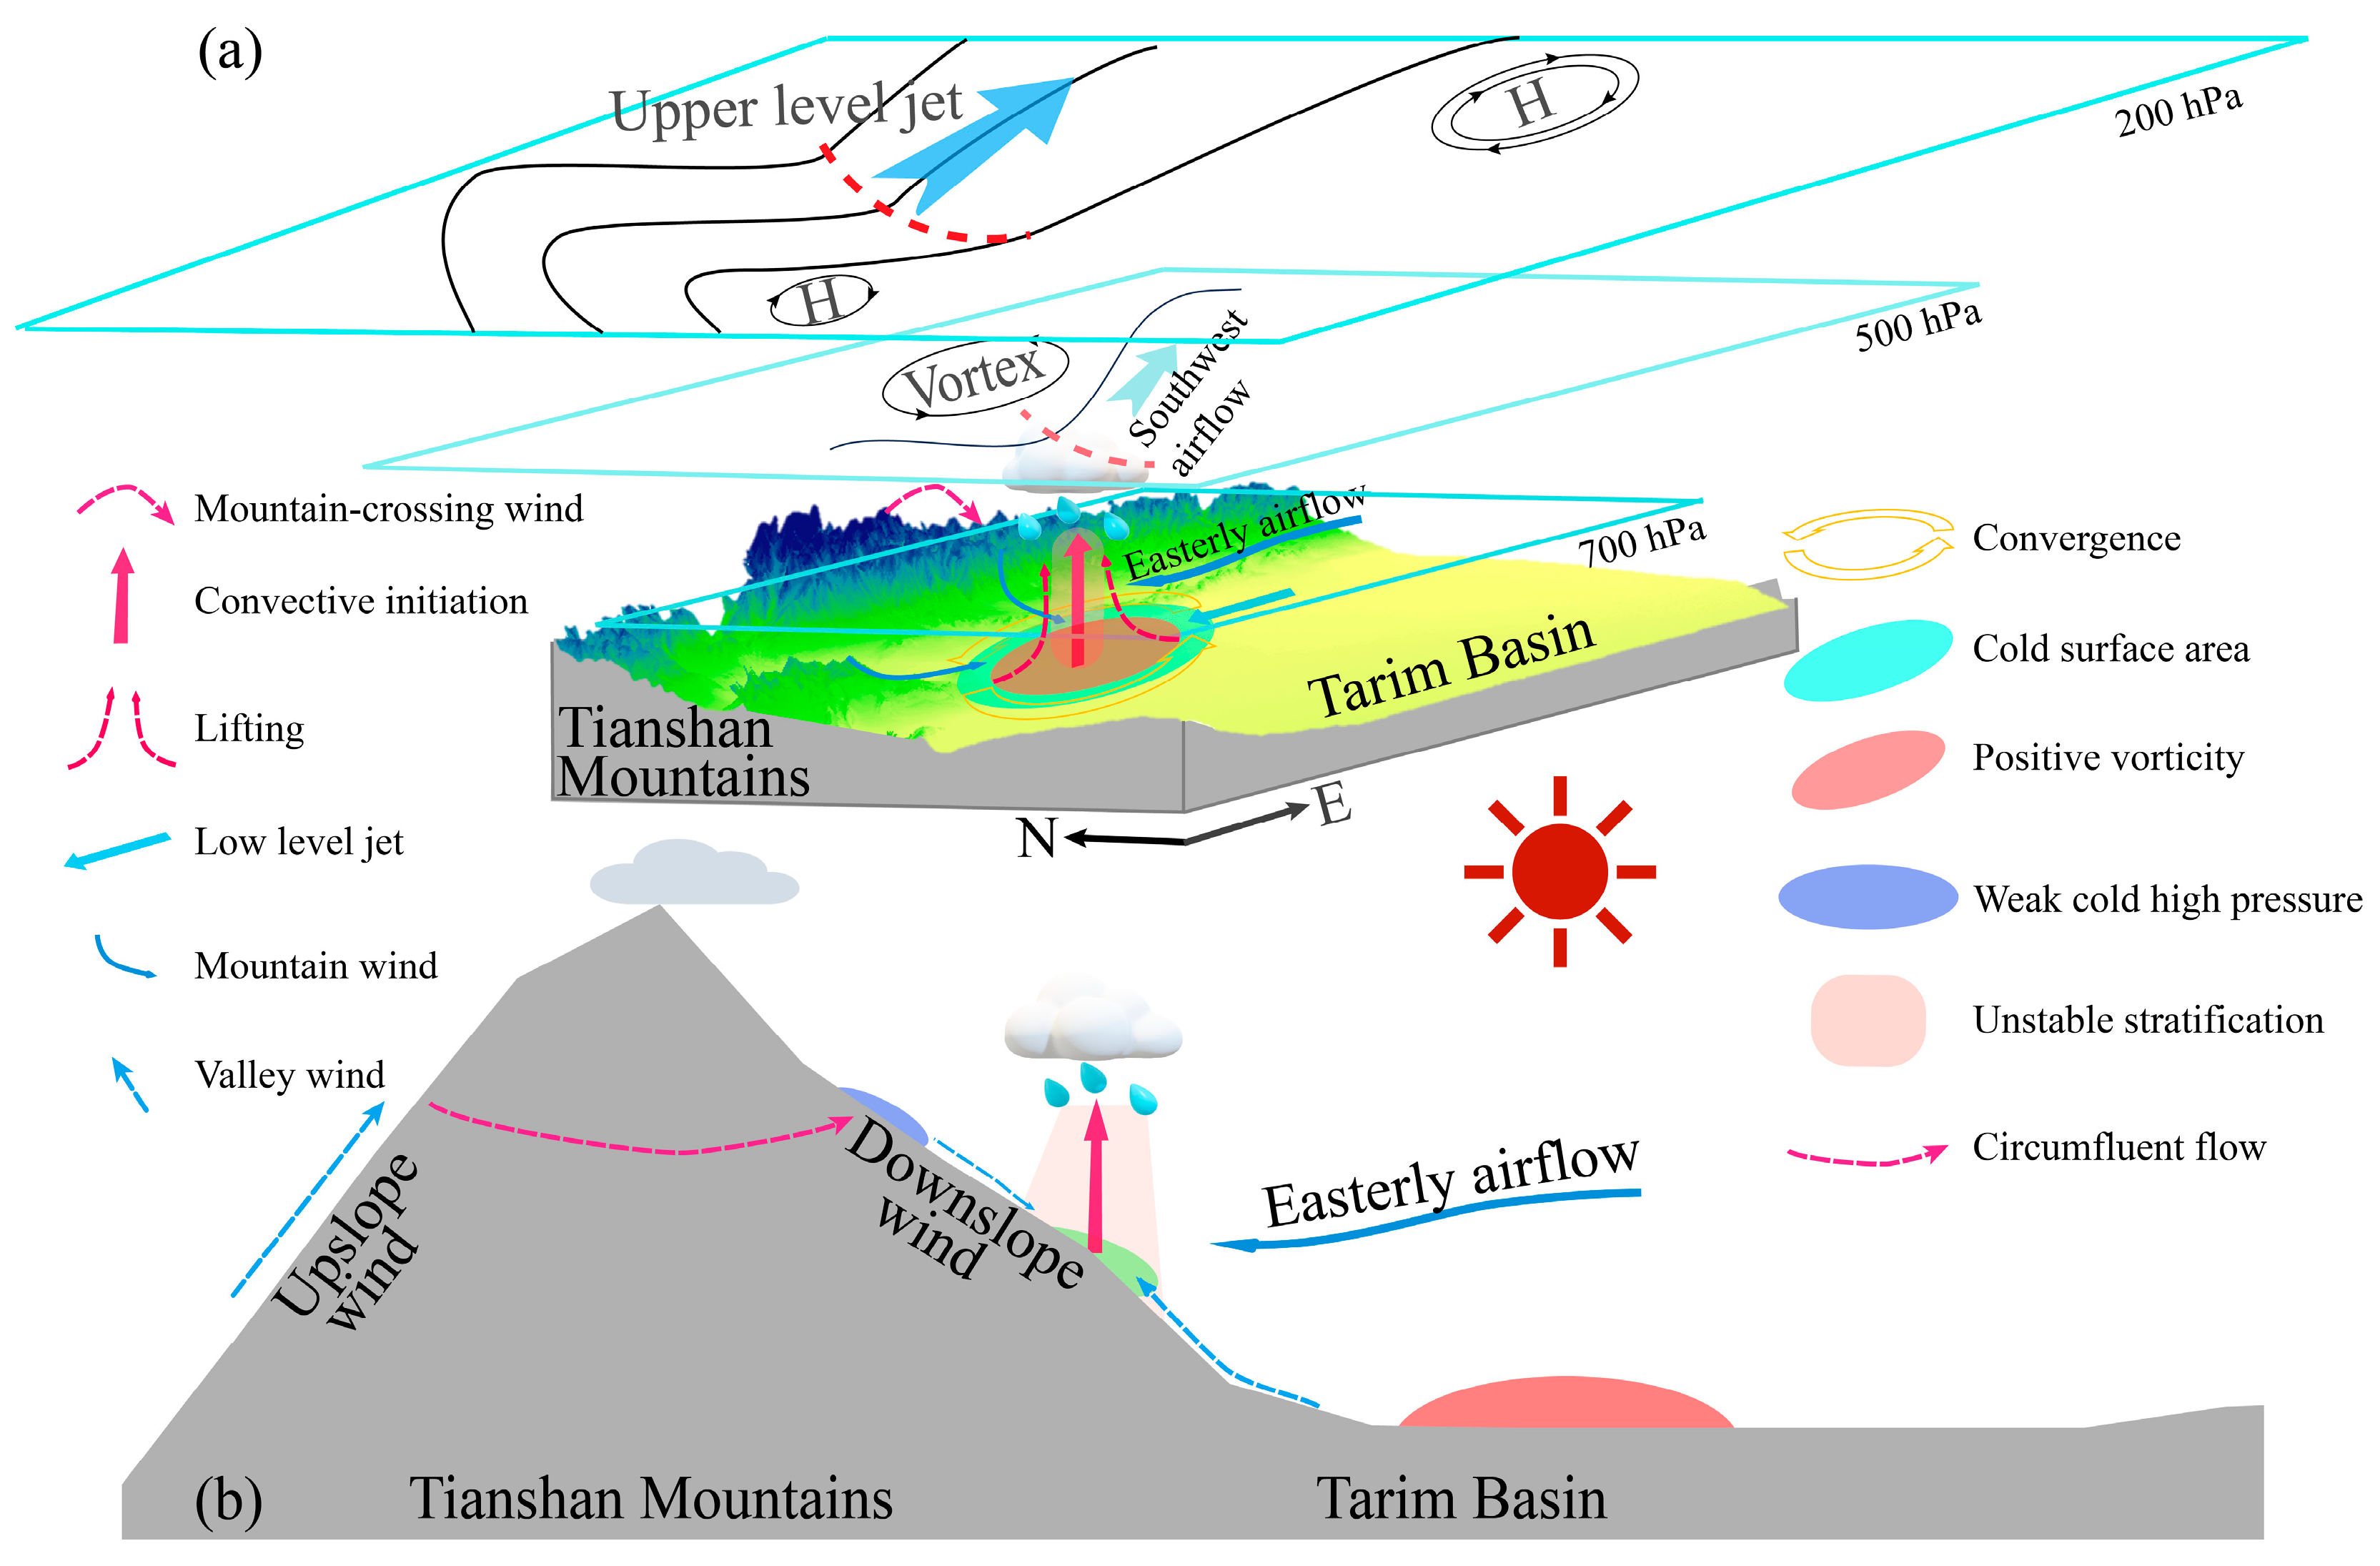
3.4. The Dynamic and Thermodynamic Mechanism of Extreme Precipitation
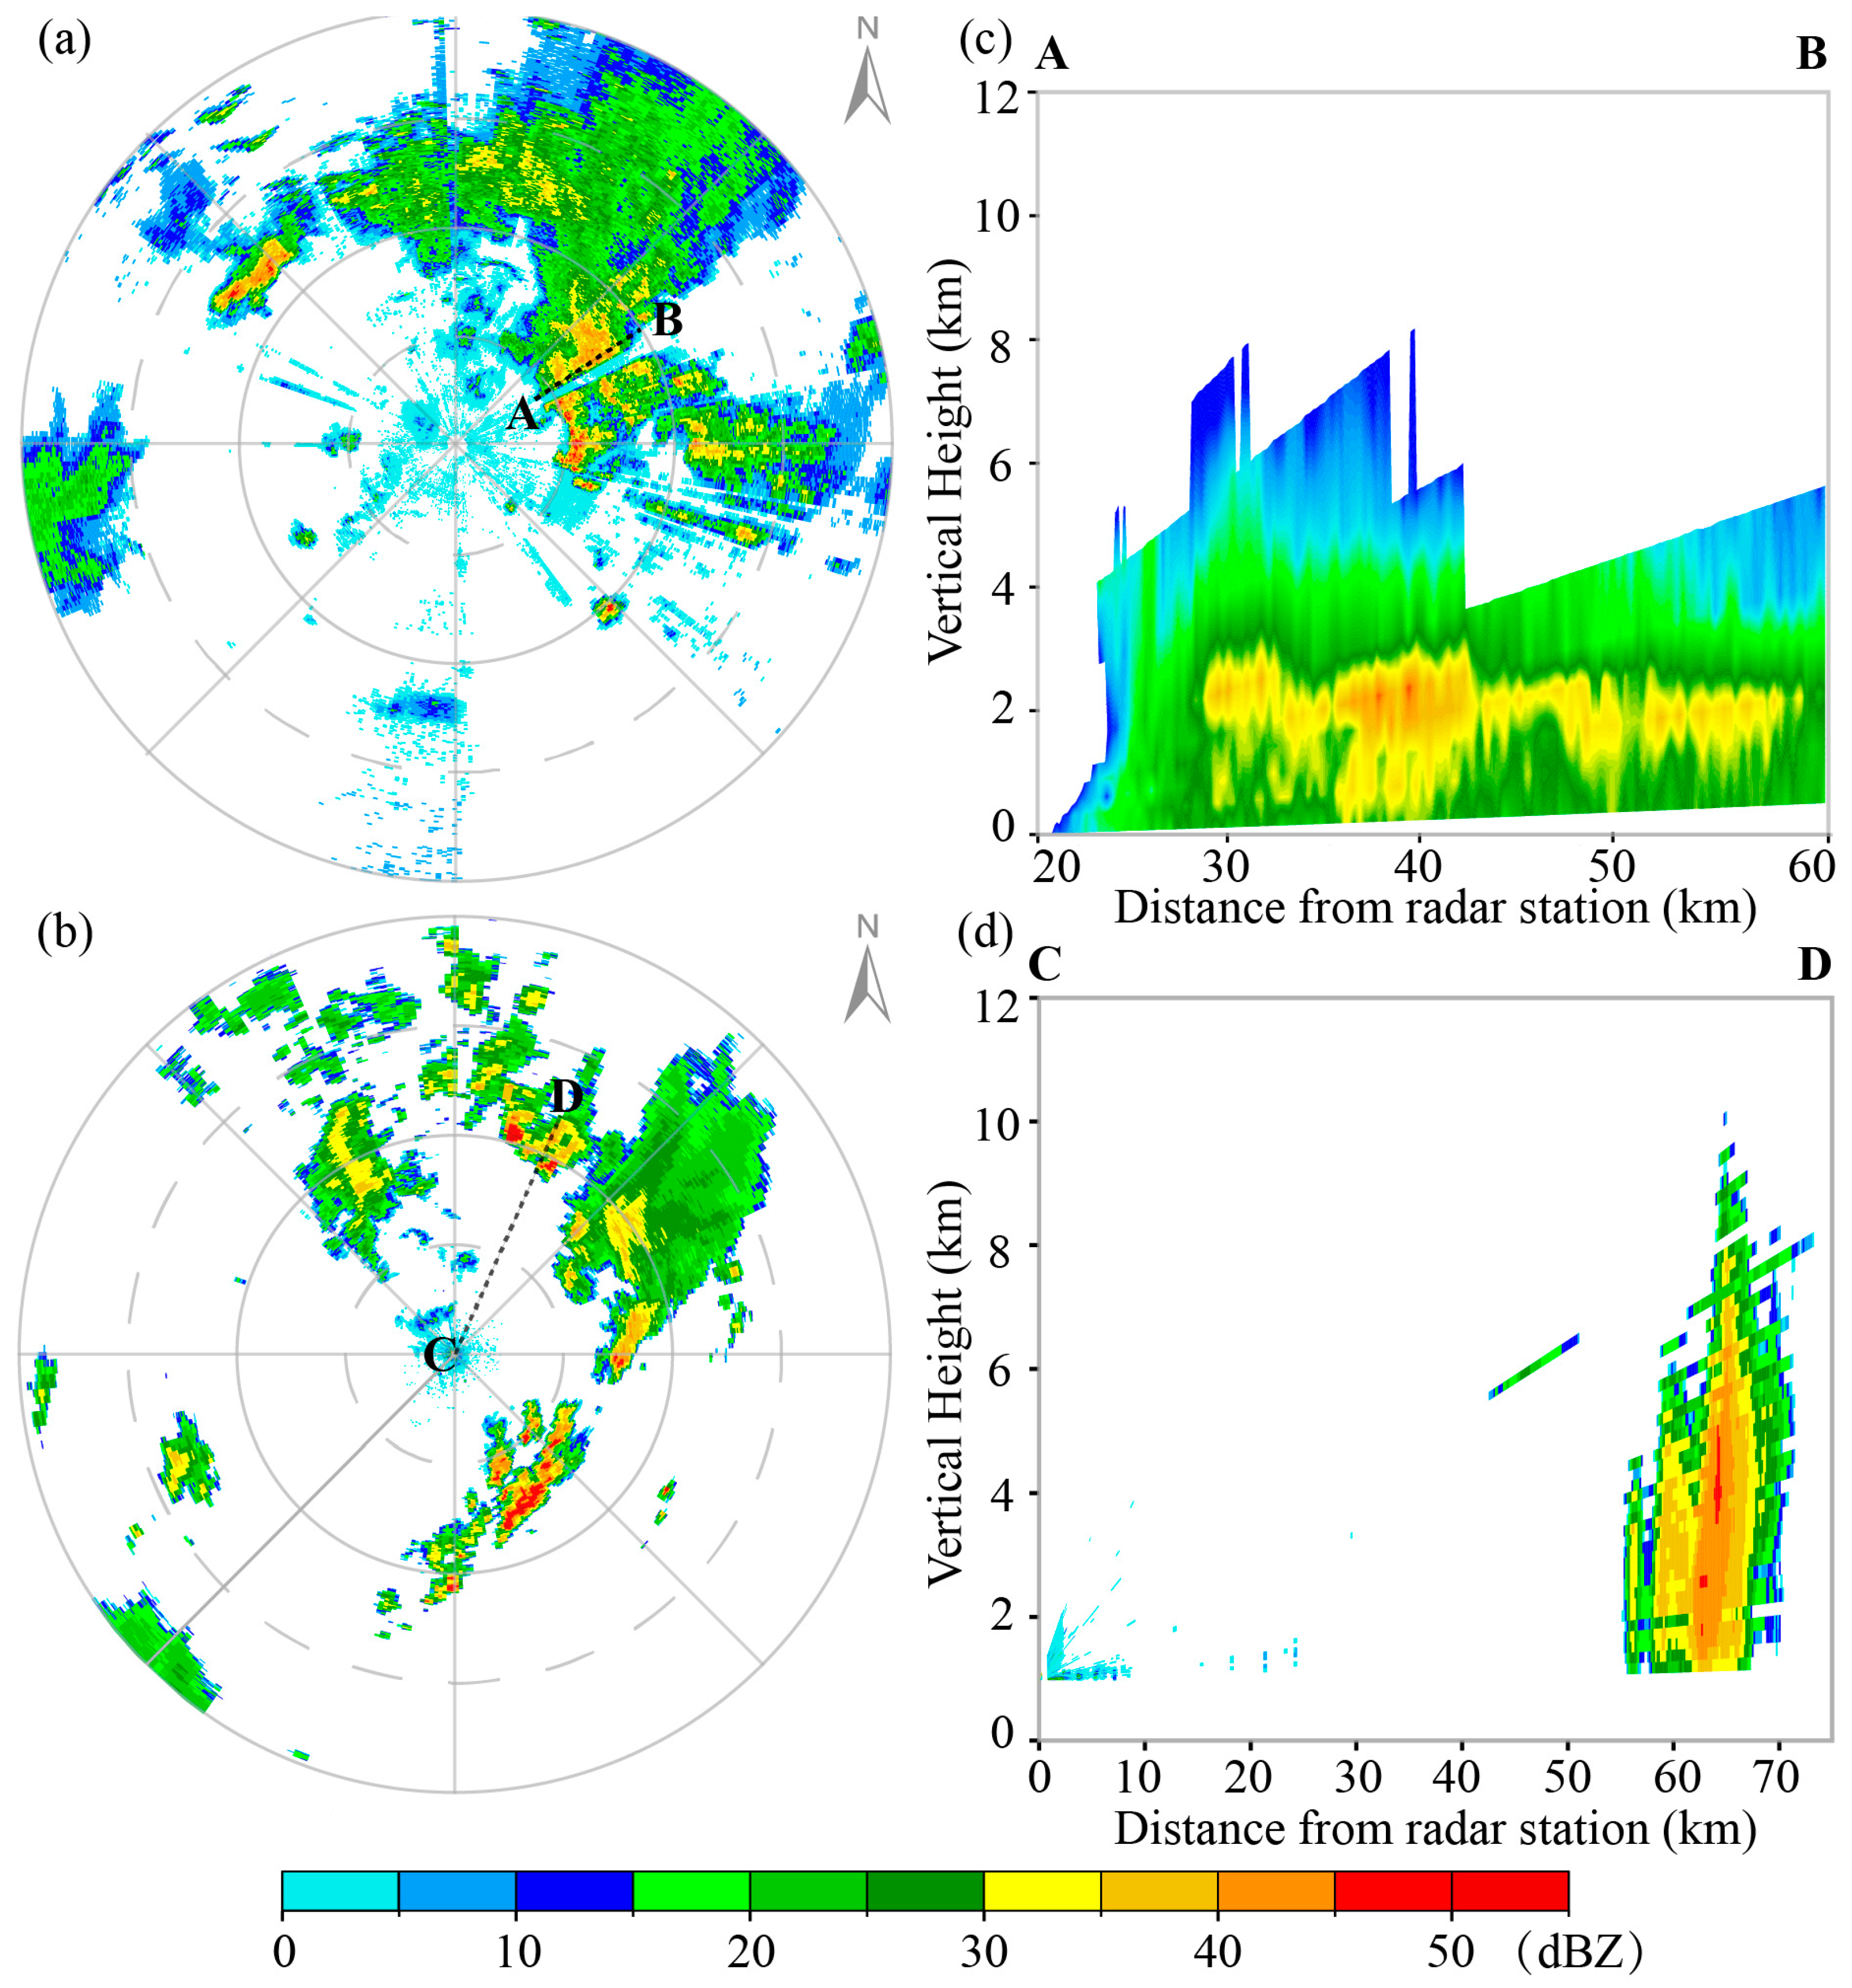
3.5. Characteristics of Mesoscale Weather Systems
4. Discussions
5. Conclusions
Author Contributions
Funding
Data Availability Statement
Acknowledgments
Conflicts of Interest
References
- Stott, P. How climate change affects extreme weather events. Science 2016, 352, 1517–1518. [Google Scholar] [CrossRef]
- Li, S.; Chen, Y.; Wei, W.; Fang, G.; Duan, W. The increase in extreme precipitation and its proportion over global land. J. Hydrol. 2024, 628, 130456. [Google Scholar] [CrossRef]
- Myhre, G.; Alterskjær, K.; Stjern, C.W.; Hodnebrog, Ø.; Marelle, L.; Samset, B.H.; Sillmann, J.; Schaller, N.; Fischer, E.; Schulz, M.; et al. Frequency of extreme precipitation increases extensively with event rareness under global warming. Sci. Rep. 2019, 9, 16063. [Google Scholar] [CrossRef] [PubMed]
- Zhang, L.; Chen, X.; Lai, R. Urban signatures of sub-daily extreme precipitation events over a metropolitan region. Atmos. Res. 2020, 246, 105204. [Google Scholar] [CrossRef]
- Zhang, D.-L. Rapid urbanization and more extreme rainfall events. Sci. Bull. 2020, 65, 516–518. [Google Scholar] [CrossRef]
- Hatsuzuka, D.; Sato, T.; Higuchi, Y. Sharp rises in large-scale, long-duration precipitation extremes with higher temperatures over Japan. NPJ Clim. Atmos. Sci. 2021, 4, 29. [Google Scholar] [CrossRef]
- Sokol, Z.; Bližňák, V. Areal distribution and precipitation–altitude relationship of heavy short-term precipitation in the Czech Republic in the warm part of the year. Atmos. Res. 2009, 94, 652–662. [Google Scholar] [CrossRef]
- Chang, C.; Chen, Y.; Huang, J.J. A comparison study on the role of urbanization in altering the short-duration and long-duration intense rainfall. Sci. Total Environ. 2023, 857, 159290. [Google Scholar] [CrossRef]
- Li, D.; Sun, J.; Fu, S.; Wei, J.; Wang, S.; Tian, F. Spatiotemporal characteristics of hourly precipitation over central eastern China during the warm season of 1982–2012. Int. J. Climatol. 2015, 36, 3148–3160. [Google Scholar] [CrossRef]
- IPCC; Zhang, X.; Adnan, M.; Badi, W.; Dereczynski, C.; Di Luca, A.; Ghosh, S.; Iskandar, I.; Kossin, J.; Lewis, S.; et al. Climate Change 2021: The Physical Science Basis. Contribution of Working Group I to the Sixth Assessment Report of the Intergovernmental Panel on Climate Change; Cambridge University Press: Cambridge, UK, 2021. [Google Scholar]
- Gimeno, L.; Sorí, R.; Vázquez, M.; Stojanovic, M.; Algarra, I.; Eiras-Barca, J.; Gimeno-Sotelo, L.; Nieto, R. Extreme precipitation events. WIREs Water 2022, 9, e1611. [Google Scholar] [CrossRef]
- Wang, C.; Zhang, S.; Li, K.; Zhang, F.; Yang, K. Change Characteristics of Precipitation in Northwest China from 1961 to 2018. Chin. J. Atmos. Sci. 2021, 45, 713–724. [Google Scholar] [CrossRef]
- Zheng, M.; Zhao, Y.; Yang, X. Variation characteristics of summer precipitation in the arid region of northwest China from 1961 to 2022. Arid Land Geogr. 2025, 48, 367–379. [Google Scholar] [CrossRef]
- Liang, Q.; Chen, Y.; Duan, W.; Wang, C.; Li, Y.; Zhu, J.; He, G.; Wei, W.; Yuan, M. Temporal and spatial changes of extreme precipitation and its related large-scale climate mechanisms in the arid region of Northwest China during 1961–2022. J. Hydrol. 2025, 658, 133182. [Google Scholar] [CrossRef]
- Sun, J.; Zhang, L.; Deng, C.; Zhu, R. Evidence for enhanced aridity in the Tarim Basin of China since 5.3Ma. Quat. Sci. Rev. 2008, 27, 1012–1023. [Google Scholar] [CrossRef]
- Zhang, X.; Chen, Y.; Fang, G.; Xia, Z.; Li, Z.; Duan, W.; Xia, Q. Increasing multiscale variability in extreme precipitation under global warming in the Tienshan Mountains, Central Asia. J. Hydrol. 2023, 626, 130158. [Google Scholar] [CrossRef]
- Shen, D.; Li, N.; Ran, L.; Yin, L.; Jiao, B.; Liu, Y. Effects of a preexisting cold pool on the initiation of an extreme rainfall in southern Xinjiang. Atmos. Res. 2024, 299, 107151. [Google Scholar] [CrossRef]
- Zhang, J.; Duan, D.; Li, X. Evolution of regional rainstorm events in China’s South-to-North Water Diversion Area, 1960–2022. Atmos. Res. 2024, 309, 107573. [Google Scholar] [CrossRef]
- Deng, H.; Pepin, N.C.; Chen, Y.; Guo, B.; Zhang, S.; Zhang, Y.; Chen, X.; Gao, L.; Meibing, L.; Ying, C. Dynamics of Diurnal Precipitation Differences and Their Spatial Variations in China. J. Appl. Meteorol. Climatol. 2022, 61, 1015–1027. [Google Scholar] [CrossRef]
- Jin, C.; He, Q.; Huang, G. A review on rainstorm research in southern Xinjiang. Trans. Atmos. Sci. 2023, 46, 82–96. [Google Scholar] [CrossRef]
- Xu, L.; Cheng, W.; Deng, Z.; Liu, J.; Wang, B.; Lu, B.; Wang, S.; Dong, L. Assimilation of the FY-4A AGRI Clear-Sky Radiance Data in a Regional Numerical Model and Its Impact on the Forecast of the “21·7” Henan Extremely Persistent Heavy Rainfall. Adv. Atmos. Sci. 2022, 40, 920–936. [Google Scholar] [CrossRef]
- Tapiador, F.J.; Turk, F.J.; Petersen, W.; Hou, A.Y.; García-Ortega, E.; Machado, L.A.T.; Angelis, C.F.; Salio, P.; Kidd, C.; Huffman, G.J.; et al. Global precipitation measurement: Methods, datasets and applications. Atmos. Res. 2012, 104–105, 70–97. [Google Scholar] [CrossRef]
- Feng, Z.; Leung, L.R.; Liu, N.; Wang, J.; Houze, R.A.; Li, J.; Hardin, J.C.; Chen, D.; Guo, J. A Global High-Resolution Mesoscale Convective System Database Using Satellite-Derived Cloud Tops, Surface Precipitation, and Tracking. J. Geophys. Res. Atmos. 2021, 126, e2020JD034202. [Google Scholar] [CrossRef]
- Zhu, L.; Chen, X.; Bai, L. Relative Roles of Low-Level Wind Speed and Moisture in the Diurnal Cycle of Rainfall Over a Tropical Island Under Monsoonal Flows. Geophys. Res. Lett. 2020, 47, e2020GL087467. [Google Scholar] [CrossRef]
- Zhao, Z.; Huang, A.; Ma, W.; Wu, Y.; Wen, L.; Lazhu; Gu, C. Effects of Lake Nam Co and Surrounding Terrain on Extreme Precipitation Over Nam Co Basin, Tibetan Plateau: A Case Study. J. Geophys. Res. Atmos. 2022, 127, e2021JD036190. [Google Scholar] [CrossRef]
- Zhao, Y.; Xu, X.; Li, J.; Zhang, R.; Kang, Y.; Huang, W.; Xia, Y.; Liu, D.; Sun, X. The Large-Scale Circulation Patterns Responsible for Extreme Precipitation Over the North China Plain in Midsummer. J. Geophys. Res. Atmos. 2019, 124, 12794–12809. [Google Scholar] [CrossRef]
- Meseguer-Ruiz, O.; Ponce-Philimon, P.I.; Baltazar, A.; Guijarro, J.A.; Serrano-Notivoli, R.; Olcina Cantos, J.; Martin-Vide, J.; Sarricolea, P. Synoptic attributions of extreme precipitation in the Atacama Desert (Chile). Clim. Dyn. 2020, 55, 3431–3444. [Google Scholar] [CrossRef]
- Chen, L.; Ford, T.W.; Swenson, E. The Role of the Circulation Patterns in Projected Changes in Spring and Summer Precipitation Extremes in the U.S. Midwest. J. Clim. 2023, 36, 1943–1956. [Google Scholar] [CrossRef]
- Zhang, Q.; Yang, J.; Duan, X.; Ma, P.; Lu, G.; Zhu, B.; Liu, X.; Yue, P.; Wang, Y.; Liu, W. The eastward expansion of the climate humidification trend in northwest China and the synergistic influences on the circulation mechanism. Clim. Dyn. 2022, 59, 2481–2497. [Google Scholar] [CrossRef]
- Abulikemu, A.; Abuduaini, A.; Li, Z.; Zhu, K.; Mamtimin, A.; Yao, J.; Zeng, Y.; An, D. Characteristics of Atmospheric Circulation Patterns and the Associated Diurnal Variation Characteristics of Precipitation in Summer over the Complex Terrain in Northern Xinjiang, Northwest China. Remote Sens. 2024, 16, 4520. [Google Scholar] [CrossRef]
- Zhao, Y.; Huang, A.; Zhou, Y.; Huang, D.; Yang, Q.; Ma, Y.; Li, M.; Wei, G. Impact of the Middle and Upper Tropospheric Cooling over Central Asia on the Summer Rainfall in the Tarim Basin, China. J. Clim. 2014, 27, 4721–4732. [Google Scholar] [CrossRef]
- Huang, W.; Feng, S.; Chen, J.; Chen, F. Physical Mechanisms of Summer Precipitation Variations in the Tarim Basin in Northwestern China. J. Clim. 2015, 28, 3579–3591. [Google Scholar] [CrossRef]
- Sun, Y.; Zhou, Y.; Wang, Y. Analysis of Dynamic Process and Moisture Source on a Heavy Precipitation Event in Southern Xinjiang Associated with the Double Upper-level Jet. Chin. J. Atmos. Sci. 2019, 43, 1041–1054. [Google Scholar] [CrossRef]
- Gao, H.; Bao, D.; Li, W.; Zheng, Z. Analysis on the Influence of Topography on a Short-Time Local Heavy Rainfall Forecast in Western Xinjiang. IOP Conf. Ser. Earth Environ. Sci. 2021, 668, 12032. [Google Scholar] [CrossRef]
- Chen, Y.-R.; Liu, B.; Cai, X.; Zhou, T.-J.; He, Q. Moisture transport and sources of an extreme rainfall event of June 2021 in southern Xinjiang, China. Adv. Clim. Chang. Res. 2022, 13, 843–850. [Google Scholar] [CrossRef]
- Ma, S.; Cao, J.; Zhao, H.; Zhou, X.; Ran, L. Decomposition of water vapor flux divergence and its application to a blizzard event over Ili Valley in Central Asia during 30 Nov to 1 Dec 2018. Atmos. Res. 2022, 270, 106079. [Google Scholar] [CrossRef]
- Ma, L.; Wei, Z.; Li, X.; Wu, S. Sources and paths of extreme cold surges over China and their associated atmospheric circulations. Int. J. Climatol. 2024, 44, 1676–1690. [Google Scholar] [CrossRef]
- Mao, X.; Xing, L.; Shang, W.; Li, S.; Duan, K. Moisture sources for precipitation over the Pamirs Plateau in winter and spring. Q. J. R. Meteorol. Soc. 2023, 150, 820–833. [Google Scholar] [CrossRef]
- Wang, Q.; Zhao, Y.; Chen, F.; Yang, Q.; Huang, A. Characteristics of different patterns of South Asia High and their relationships with summer precipitation in Xinjiang. Plateau Meteorol. 2017, 36, 1209–1220. [Google Scholar] [CrossRef]
- Yao, S.; Jiang, D.; Zhang, Z. Moisture sources of heavy precipitation in Xinjiang characterized by meteorological patterns. J. Hydrometeorol. 2021, 22, 2213–2225. [Google Scholar] [CrossRef]
- Chen, Y.; Zhang, X.; Fang, G.; Li, Z.; Wang, F.; Qin, J.; Sun, F. Potential risks and challenges of climate change in the arid region of northwestern China. Reg. Sustain. 2020, 1, 20–30. [Google Scholar] [CrossRef]
- Deng, Z.; Wu, P.; Wang, Y. Influence of Topography on Hail Cloud Distribution in Aksu Area. J. Agric. Catastrophology 2020, 10, 26–29. [Google Scholar] [CrossRef]
- Minzhong, W.; Wenshou, W.; Qing, H.; Lianmei, Y.; He, Q.; Yunhui, Z. Application of wind profiler data to rainstorm analyses in Aksu, Xinjiang. Meteorol. Appl. 2012, 20, 504–512. [Google Scholar] [CrossRef]
- Zhang, J.; Li, Q.; Zhao, W.; Lee, J.H.W.; Liu, J.; Wang, S. Relationship between Near-Surface Winds Due to Tropical Cyclones and Infrared Brightness Temperature Obtained from Geostationary Satellite. Atmosphere 2021, 12, 493. [Google Scholar] [CrossRef]
- Zeng, Y.; Yang, L.; Zhang, Z.; Tong, Z.; Li, J.; Liu, F.; Zhang, J.; Jiang, Y. Characteristics of Clouds and Raindrop Size Distribution in Xinjiang, Using Cloud Radar Datasets and a Disdrometer. Atmosphere 2020, 11, 1382. [Google Scholar] [CrossRef]
- Wei, X.; Yu, Y.; Li, B.; Liu, Z. Representativeness of Two Global Gridded Precipitation Data Sets in the Intensity of Surface Short-Term Precipitation over China. Remote Sens. 2023, 15, 1856. [Google Scholar] [CrossRef]
- Kim, K.; Park, J.; Baik, J.; Choi, M. Evaluation of topographical and seasonal feature using GPM IMERG and TRMM 3B42 over Far-East Asia. Atmos. Res. 2017, 187, 95–105. [Google Scholar] [CrossRef]
- Xie, Z.; Zhou, Y.; Yang, L. Review of study on precipitation in Xinjiang. Torrential Rain Disasters 2018, 37, 204–212. [Google Scholar] [CrossRef]
- Liu, H.; Huang, X.; Fei, J.; Zhang, C.; Cheng, X. Spatiotemporal Features and Associated Synoptic Patterns of Extremely Persistent Heavy Rainfall Over China. J. Geophys. Res. Atmos. 2022, 127, e2022JD036604. [Google Scholar] [CrossRef]
- Zhang, X.; Chen, L.; Ma, Z.; Zheng, Z.; Meng, Y. Sensitivity of Heavy Convective Precipitation Simulations to Changes in Land-Atmosphere Exchange Processes Over China. J. Geophys. Res. Atmos. 2022, 127, e2022JD037125. [Google Scholar] [CrossRef]
- Su, L.; Yuan, Z.; Fung, J.C.H.; Lau, A.K.H. A comparison of HYSPLIT backward trajectories generated from two GDAS datasets. Sci. Total Environ. 2015, 506–507, 527–537. [Google Scholar] [CrossRef]
- Gastmans, D.; Santos, V.; Galhardi, J.A.; Gromboni, J.F.; Batista, L.V.; Miotlinski, K.; Chang, H.K.; Govone, J.S. Controls over spatial and seasonal variations on isotopic composition of the precipitation along the central and eastern portion of Brazil. Isot. Environ. Health Stud. 2017, 53, 518–538. [Google Scholar] [CrossRef] [PubMed]
- Yao, J.; Li, M.; Yang, Q. Moisture sources of a torrential rainfall event in the arid region of East Xinjiang, China, based on a Lagrangian model. Nat. Hazards 2018, 92, 183–195. [Google Scholar] [CrossRef]
- Ansari, M.Y.; Mainuddin; Ahmad, A.; Bhushan, G. Spatiotemporal trajectory clustering: A clustering algorithm for spatiotemporal data. Expert Syst. Appl. 2021, 178, 115048. [Google Scholar] [CrossRef]
- Yang, X.; Zhou, H.; Zhao, K.; Tang, Z.; Zhao, Y. Variation Features of Hourly Precipitation in Xinjiang Province During 1991 -2018. Plateau Meteorol. 2020, 39, 762–773. [Google Scholar] [CrossRef]
- Li, Z.; Abulikemu, A.; Zhu, K.; Mamtimin, A.; Zeng, Y.; Li, J.; Abulimiti, A.; Kadier, Z.; Abuduaini, A.; Li, C.; et al. Diurnal Variation Characteristics of Summer Precipitation and Related Statistical Analysis in the Ili Region, Xinjiang, Northwest China. Remote Sens. 2023, 15, 3954. [Google Scholar] [CrossRef]
- Zeng, Y.; Yang, L. Triggering Mechanism of an Extreme Rainstorm Process near the Tianshan Mountains in Xinjiang, an Arid Region in China, Based on a Numerical Simulation. Adv. Meteorol. 2020, 2020, 828060. [Google Scholar] [CrossRef]
- Zhou, Y.; Liu, Z.; Liu, J.; Yang, X.; Zhang, M.; Zhou, Y. Analysis of Convection–Symmetric Instability and Triggering Mechanism for Extreme Rainstorms on the Northern Slope of the Middle Kunlun Mountains. Chin. J. Atmos. Sci. 2024, 48, 987–1011. [Google Scholar] [CrossRef]
- Draxler, R.R.; Hess, G.D. An Overview of the HYSPLIT_4 Modelling System for Trajectories, Dispersion, and Deposition. Aust. Meteorol. Mag. 1998, 47, 295–308. [Google Scholar]
- Cohen, M.D.; Stunder, B.J.B.; Rolph, G.D.; Draxler, R.R.; Stein, A.F.; Ngan, F. NOAA’s HYSPLIT Atmospheric Transport and Dispersion Modeling System. Bull. Am. Meteorol. Soc. 2015, 96, 2059–2077. [Google Scholar] [CrossRef]
- Repina, I.A.; Shestakova, A.A.; Bedanokov, M.K.; Berzegova, R.B.; Lebedev, S.A. Dynamics of the atmospheric boundary layer in the mountain-valley relief of Adygea. In The Republic of Adygea Environment; Bedanokov, M.K., Lebedev, S.A., Kostianoy, A.G., Eds.; Springer International Publishing: Cham, Switzerland, 2020; pp. 359–396. [Google Scholar]
- Pal, S.; Clark, N.E.; Lee, T.R.; Conder, M.; Buban, M. When and where horizontal advection is critical to alter atmospheric boundary layer dynamics over land: The need for a conceptual framework. Atmos. Res. 2021, 264, 105825. [Google Scholar] [CrossRef]
- Mao, J.; Ping, F.; Li, X.; Yin, L. Differences in precipitation efficiency and their probable mechanisms between the warm sector and cold front stages of a heavy rainfall event over Beijing. Atmos. Sci. Lett. 2018, 19, e802. [Google Scholar] [CrossRef]
- Park, I.-H.; Min, S.-K. Role of Convective Precipitation in the Relationship between Subdaily Extreme Precipitation and Temperature. J. Clim. 2017, 30, 9527–9537. [Google Scholar] [CrossRef]
- Orlanski, I. A Rational Subdivision of Scales for Atmospheric Processes. Bull. Am. Meteorol. Soc. 1975, 56, 527–530. [Google Scholar]
- Liu, X.; Chen, Y.; Guo, J.; Song, W.; Dan, J. Brightness Temperature Characteristics of Short-Duration Heavy Rainfall in the Chengdu–Chongqing Railway Region in China. Atmosphere 2023, 14, 896. [Google Scholar] [CrossRef]
- Mo, S.; Li, Y. Analysis of the Water Vapor Characteristics and Trigger Mechanism for a Typical Heavy Rainstorm in the Extreme Arid Region of the Southern Xinjiang. Plateau Meteorol. 2023, 42, 82–97. [Google Scholar] [CrossRef]
- Bai, X. The TBB Characteristics Analysis of Typhoon “1321” When Triggered Heavy Precipitation in Hainan. J. Chengdu Univ. Inf. Technol. 2016, 4, 408–412. [Google Scholar] [CrossRef]
- Chen, Q.; Fan, J.; Hagos, S.; Gustafson, W.I.; Berg, L.K. Roles of wind shear at different vertical levels: Cloud system organization and properties. J. Geophys. Res. Atmos. 2015, 120, 6551–6574. [Google Scholar] [CrossRef]
- LIin, L.; Lu, C.; Zhou, F. Forecast Error Source Analysis of Heavy Rainfall Events in the Meiyu period of 2020. Clim. Environ. Res. 2022, 27, 469–479. [Google Scholar] [CrossRef]
- Su, L.; Yuan, Z.; Feng, Z.; Deng, X.; Liu, Q.; Deng, T.; Wang, N. Sensitivity of HYSPLIT back-trajectories to the horizontal and vertical resolution of the meteorological input data. J. Trop. Meteorol. 2016, 32, 864–877. [Google Scholar] [CrossRef]
- Lichiheb, N.; Ngan, F.; Cohen, M. Improving the atmospheric dispersion forecasts over Washington, D.C. using UrbanNet observations: A study with HYSPLIT model. Urban Clim. 2024, 55, 101948. [Google Scholar] [CrossRef]
- Thomas, A.M.; Kurzeja, R.J. Realistic large eddy and dispersion simulation experiments during project sagebrush phase 1. Atmos. Environ. 2023, 312, 120030. [Google Scholar] [CrossRef]
- Milrad, S.M.; Lombardo, K.; Atallah, E.H.; Gyakum, J.R. Numerical Simulations of the 2013 Alberta Flood: Dynamics, Thermodynamics, and the Role of Orography. Mon. Weather Rev. 2017, 145, 3049–3072. [Google Scholar] [CrossRef]
- Wei, P.; Xu, X.; Xue, M.; Zhang, C.; Wang, Y.; Zhao, K.; Zhou, A.; Zhang, S.; Zhu, K. On the Key Dynamical Processes Supporting the 21.7 Zhengzhou Record-breaking Hourly Rainfall in China. Adv. Atmos. Sci. 2022, 40, 337–349. [Google Scholar] [CrossRef]
- Liu, B.; Tan, X.; Gan, T.Y.; Chen, X.; Lin, K.; Lu, M.; Liu, Z. Global atmospheric moisture transport associated with precipitation extremes: Mechanisms and climate change impacts. WIREs Water 2020, 7, e1412. [Google Scholar] [CrossRef]
- Min, Y.; Huang, W.; Ma, M.; Zhang, Y. Simulations in the Topography Effects of Tianshan Mountains on an Extreme Precipitation Event in the Ili River Valley, China. Atmosphere 2021, 12, 750. [Google Scholar] [CrossRef]
- Yuan, W. Diurnal cycles of precipitation over subtropical China in IPCC AR5 AMIP simulations. Adv. Atmos. Sci. 2013, 30, 1679–1694. [Google Scholar] [CrossRef]


| Region | Heavy Precipitation | Short-Term Heavy Precipitation | |
|---|---|---|---|
| (24 h) | (12 h) | (1 h) | |
| Xinjiang [48] | ≥24.1 mm | ≥20.1 mm | ≥10 mm |
| Other parts of China [19,49] | ≥50 mm | ≥30 mm | ≥20 mm |
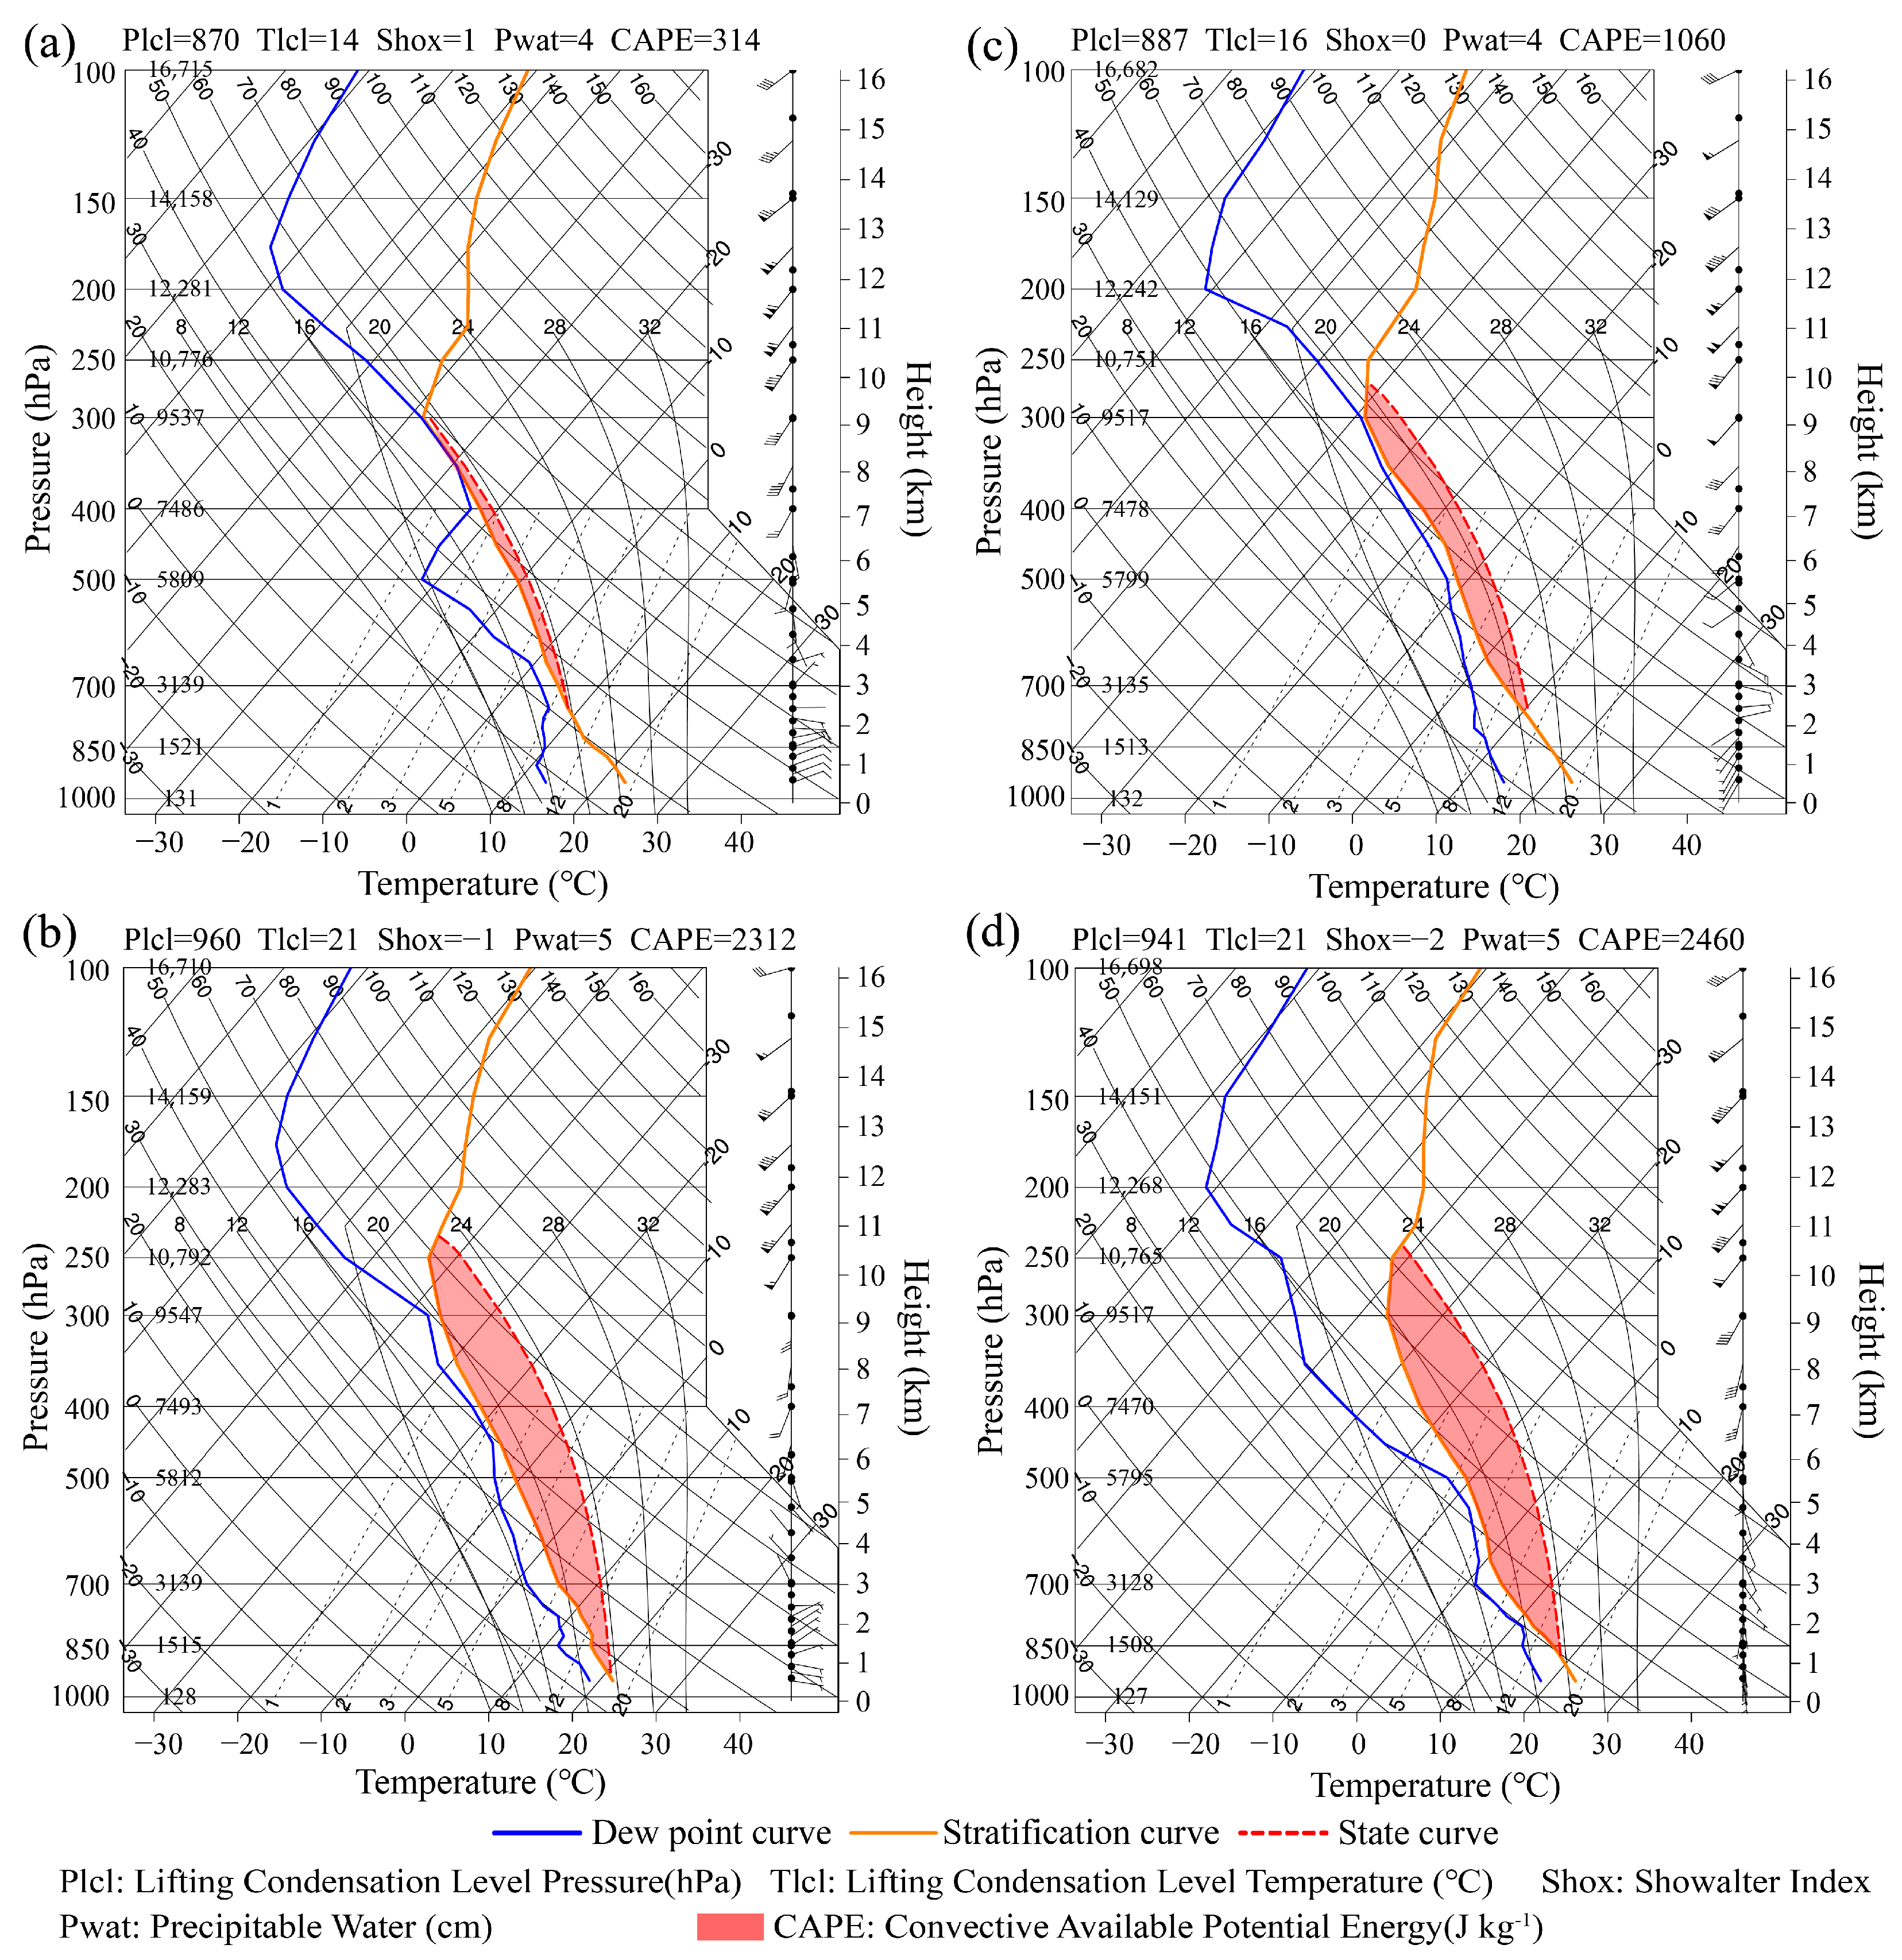
| Metric | Stage 1 (20:00 on 20 August–08:00 on 21 August 2019) | Stage 2 (08:00–20:00, 21 August 2019) | Unit |
|---|---|---|---|
| Precipitation intensity | 38.1 | 20.6 | mm h−1 |
| Shox | −1 | −2 | - |
| Pwat | 5 | 5 | cm |
| CAPE | 2312 | 2460 | J kg−1 |
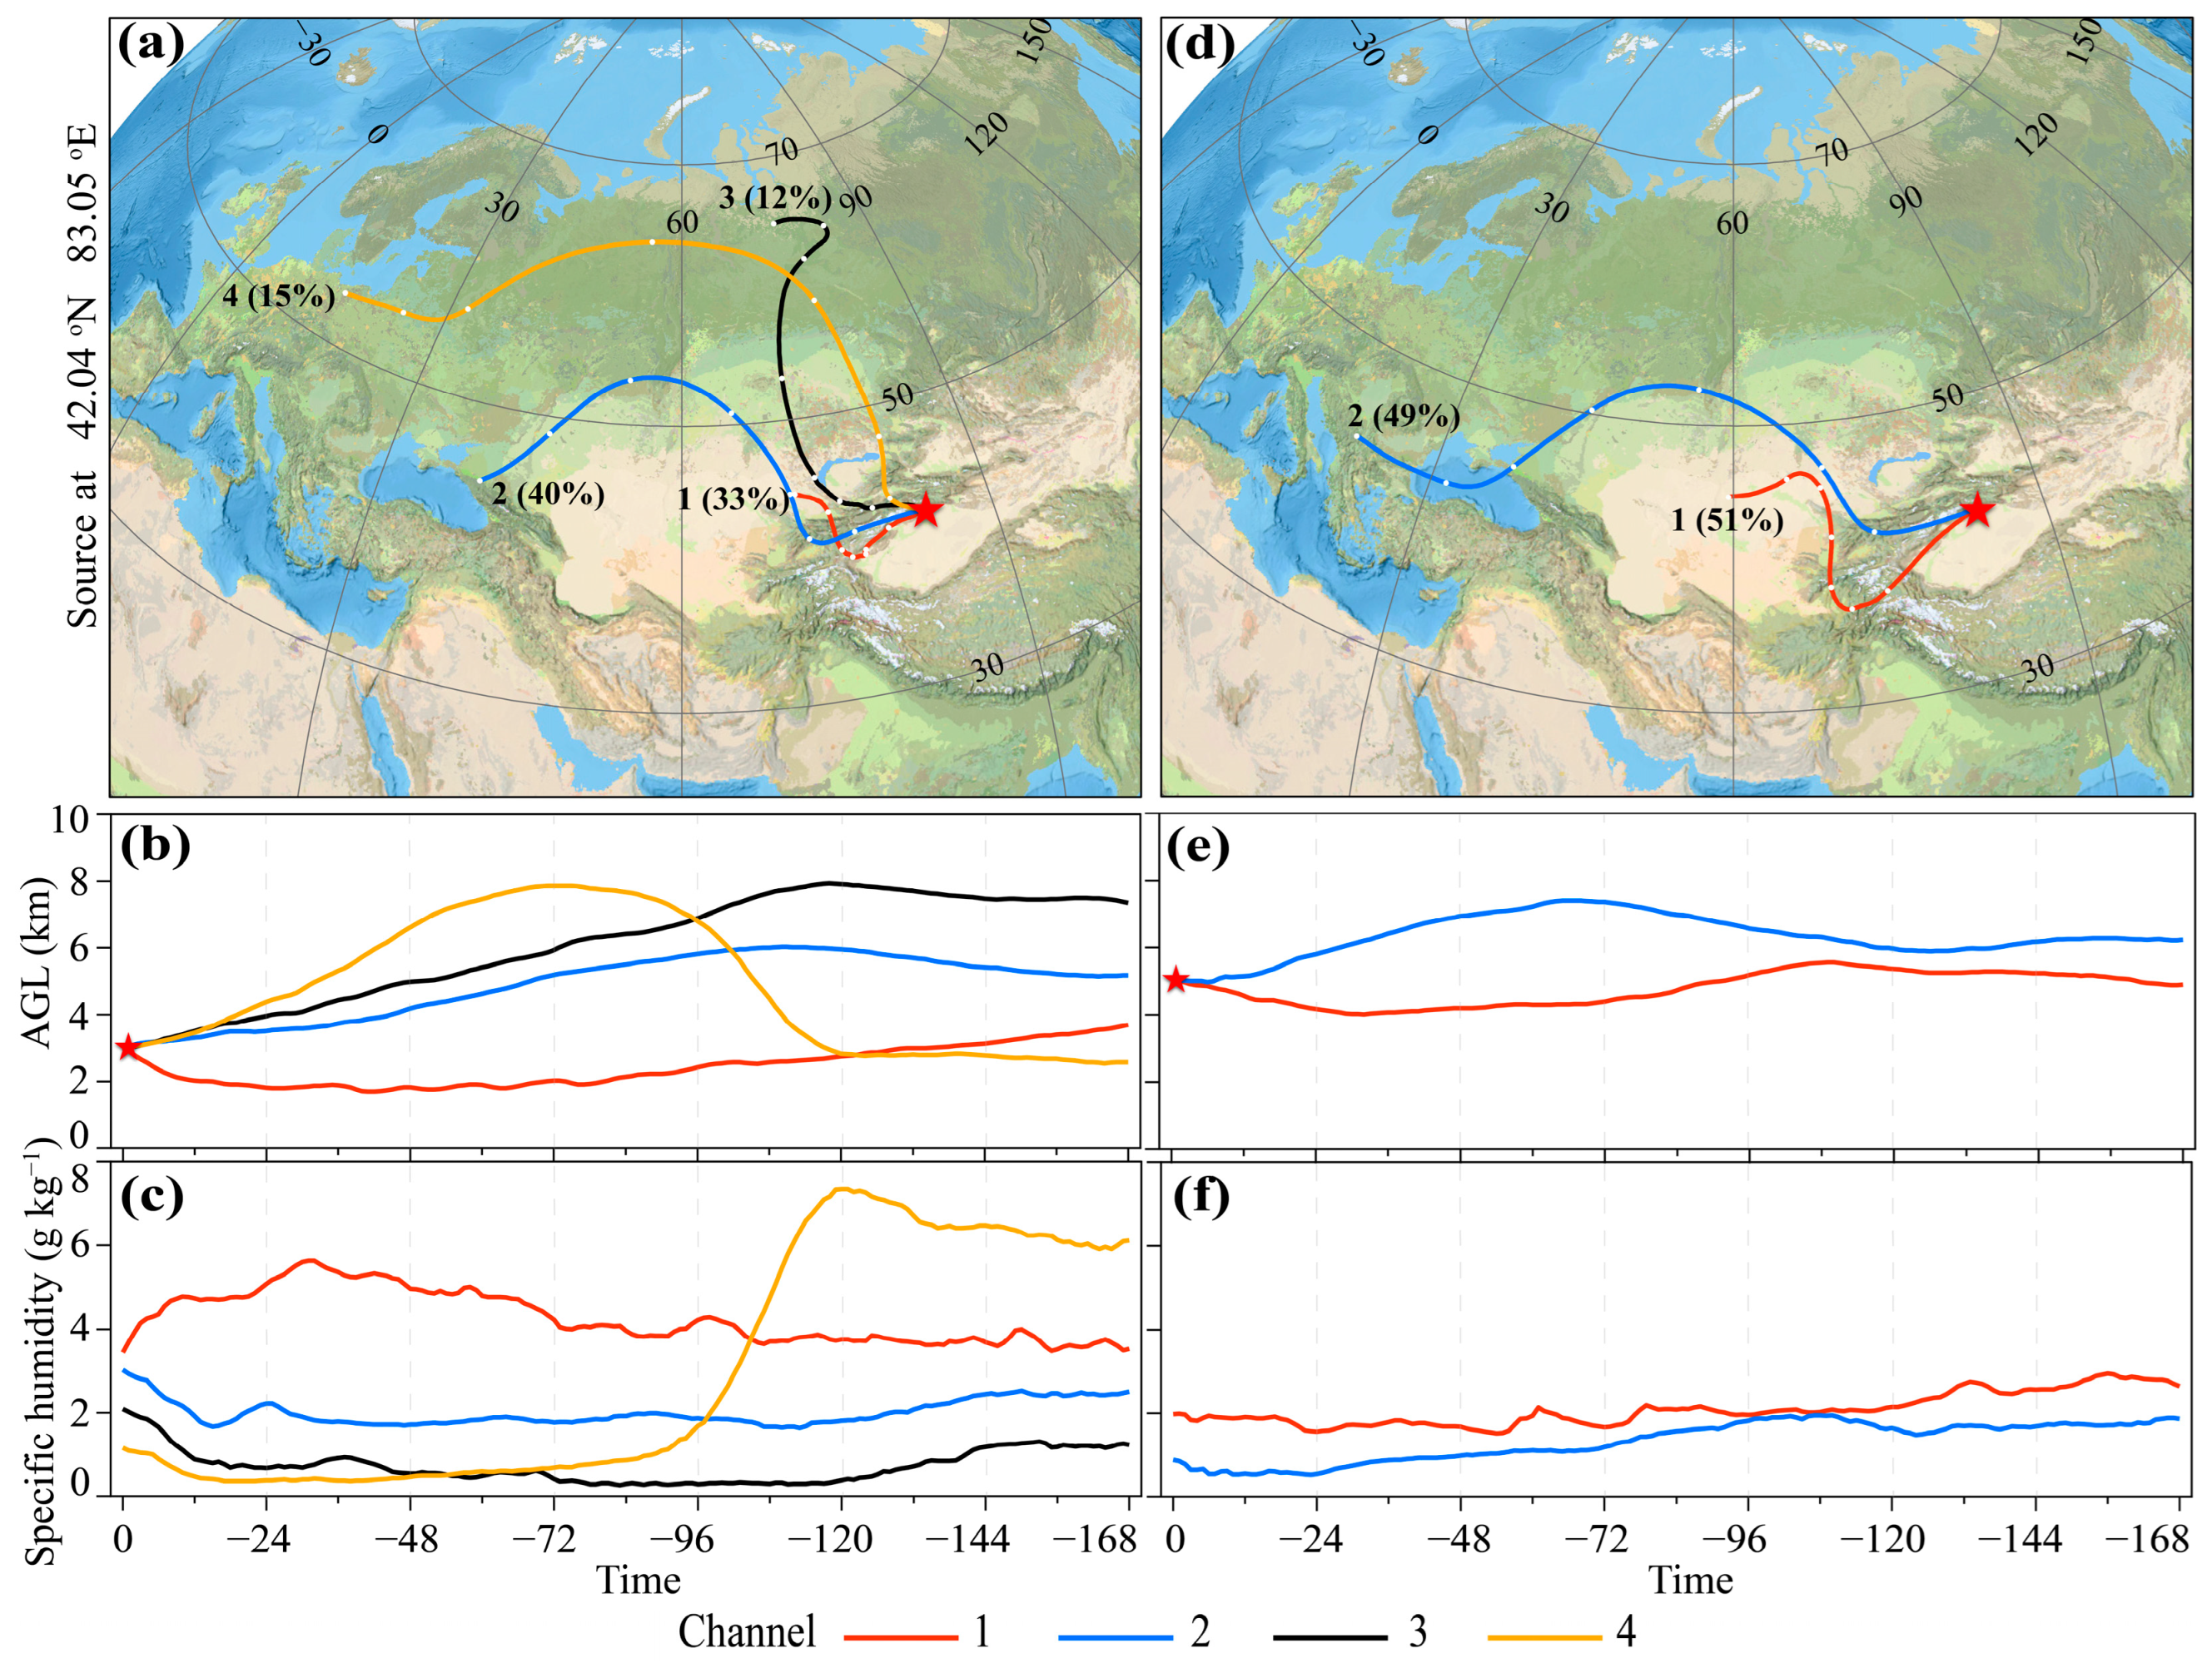
| Main water vapor sources | channel 1 and 3 channel 3, 4, and 6 | channel 1 and 2 channel 1 | 3000 m AGL 5000 m AGL |
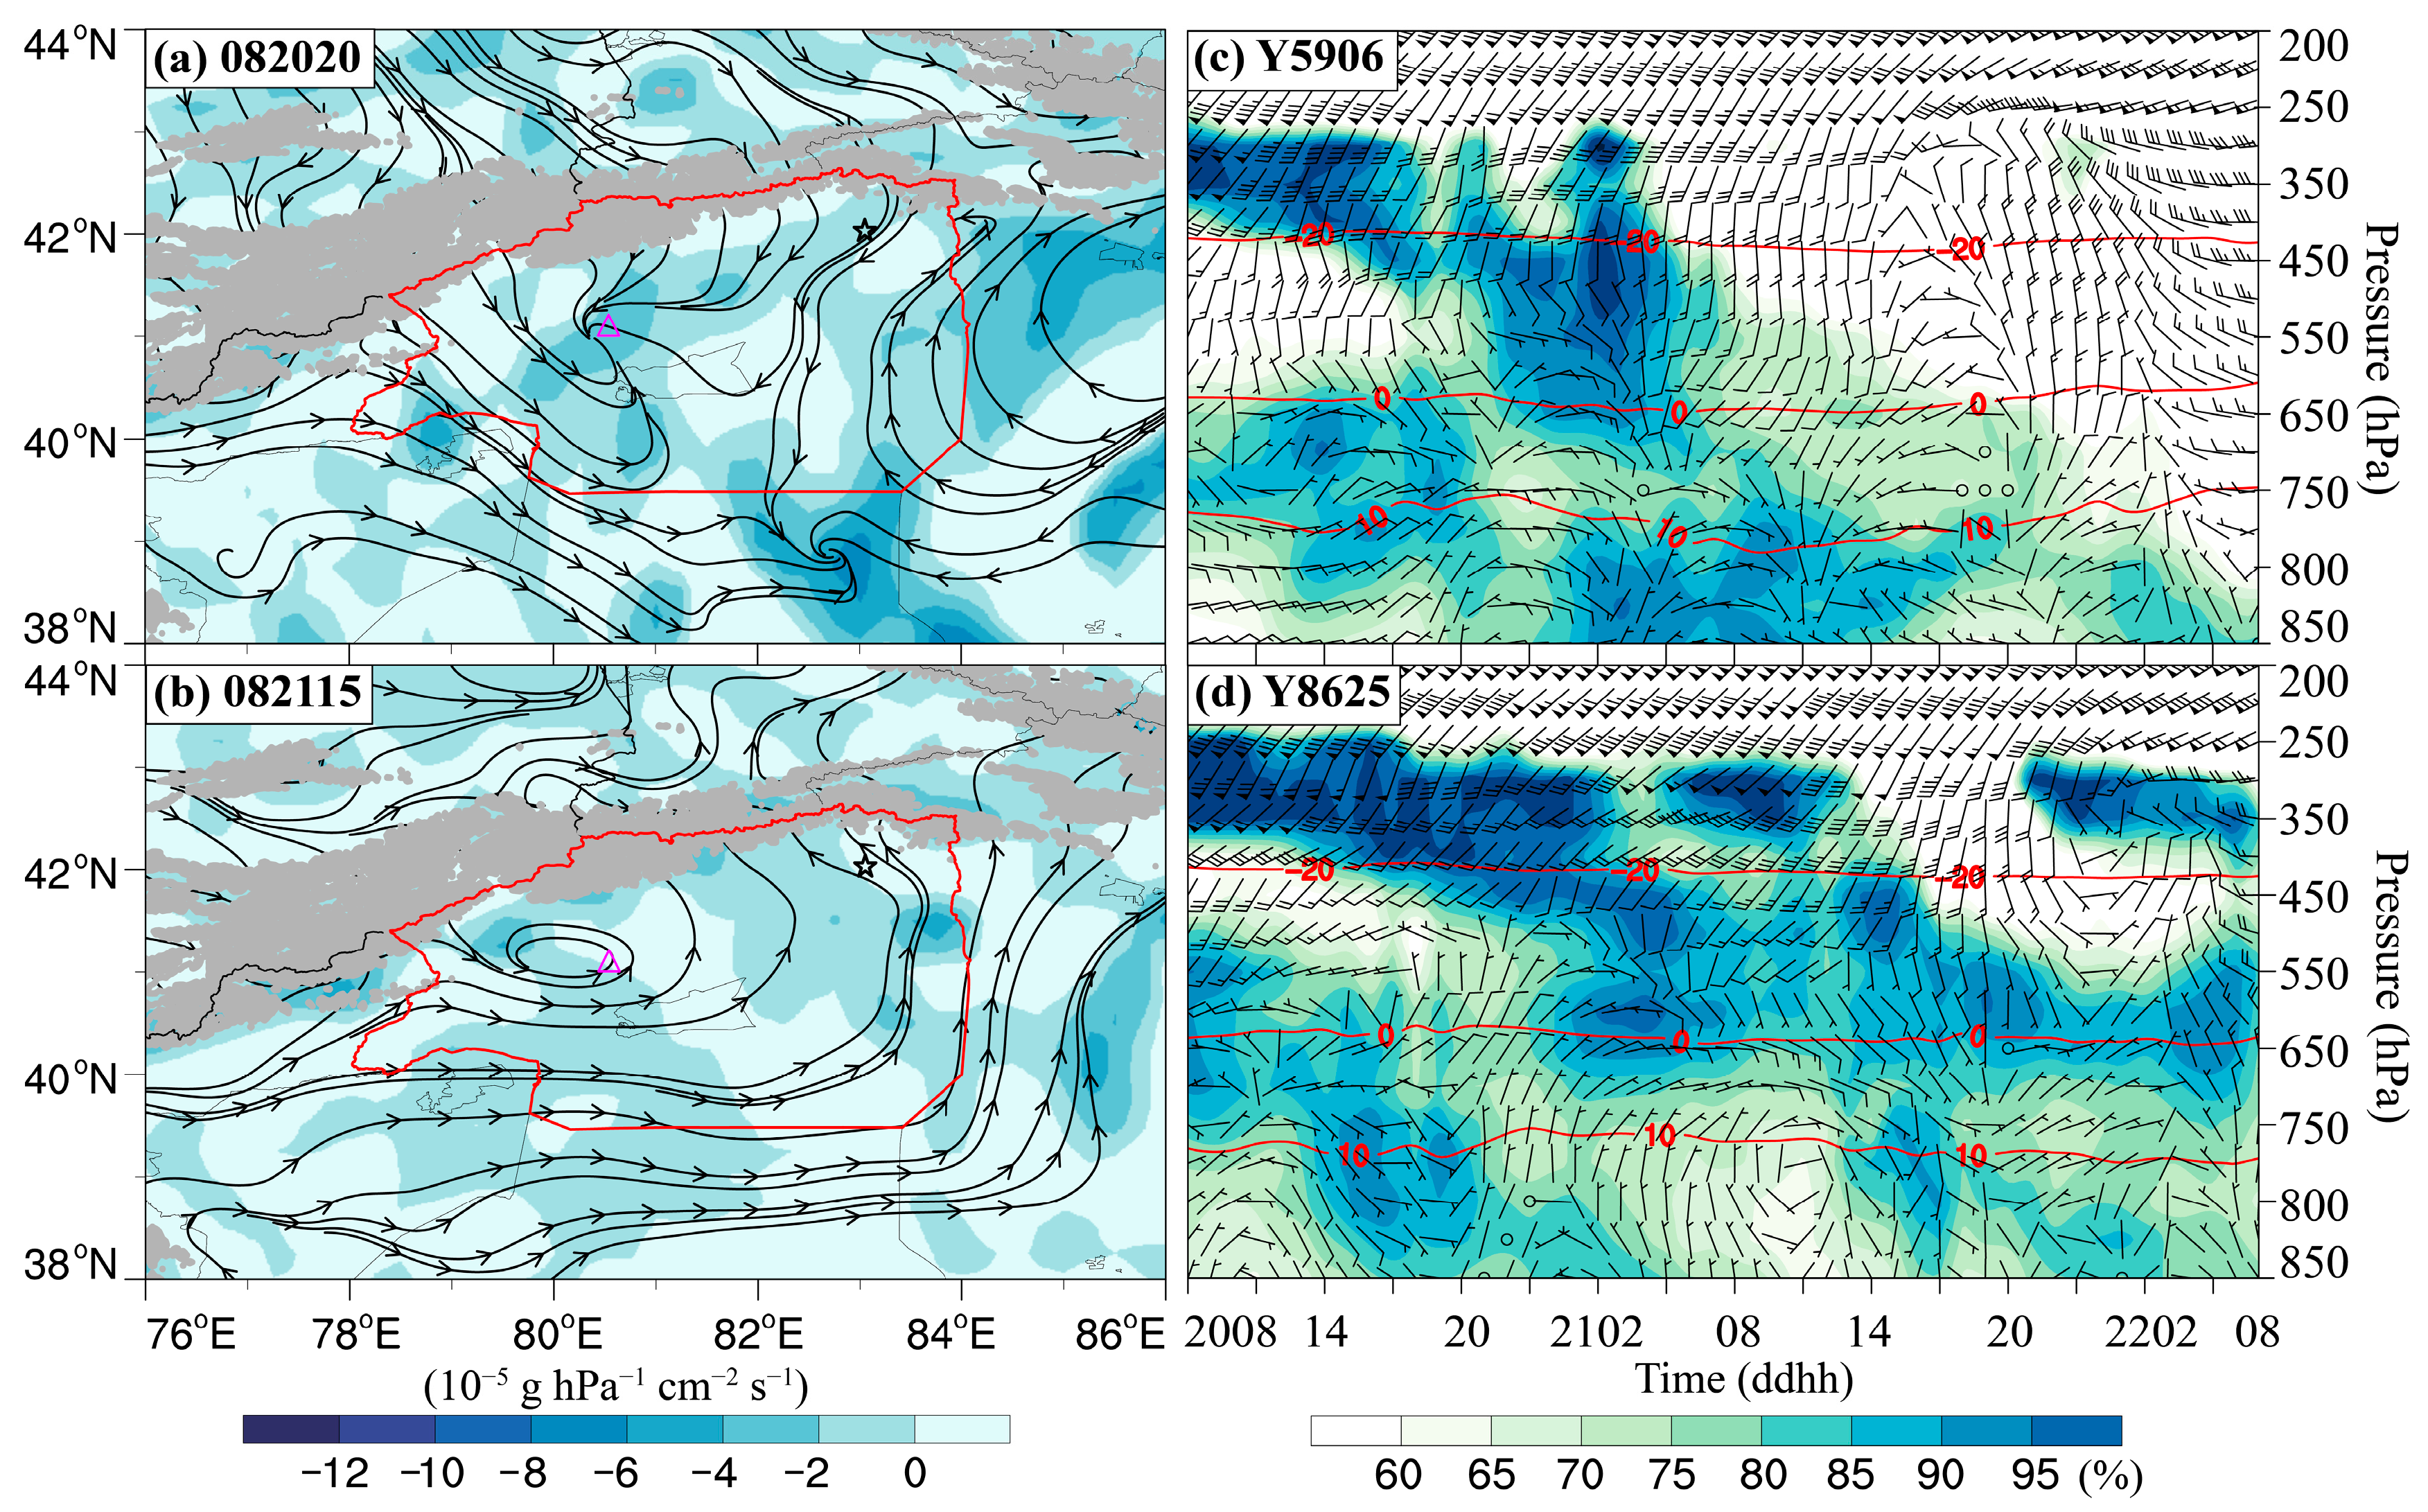
| WV flux divergence | −3 (850 hPa) −1 (700 hPa) | 0 (850 hPa) −7 (700 hPa) | 10−5 g hPa−1 cm−2 s−1 |
| Horizontal wind speed | 8 (Y5906) | 5 (Y8625) | m s−1 |
| Radar reflectivity | 30 (0.2−3 km) | 40 (1−6 km) | dBZ (Height) |
| TBB | −39.8 (21:00) | −38.9 (16:00) | °C (Time) |
Disclaimer/Publisher’s Note: The statements, opinions and data contained in all publications are solely those of the individual author(s) and contributor(s) and not of MDPI and/or the editor(s). MDPI and/or the editor(s) disclaim responsibility for any injury to people or property resulting from any ideas, methods, instructions or products referred to in the content. |
© 2025 by the authors. Licensee MDPI, Basel, Switzerland. This article is an open access article distributed under the terms and conditions of the Creative Commons Attribution (CC BY) license (https://creativecommons.org/licenses/by/4.0/).
Share and Cite
Peng, J.; Li, Z.; Yang, L.; Zhang, Y. Dynamic Diagnosis of an Extreme Precipitation Event over the Southern Slope of Tianshan Mountains Using Multi-Source Observations. Remote Sens. 2025, 17, 1521. https://doi.org/10.3390/rs17091521
Peng J, Li Z, Yang L, Zhang Y. Dynamic Diagnosis of an Extreme Precipitation Event over the Southern Slope of Tianshan Mountains Using Multi-Source Observations. Remote Sensing. 2025; 17(9):1521. https://doi.org/10.3390/rs17091521
Chicago/Turabian StylePeng, Jiangliang, Zhiyi Li, Lianmei Yang, and Yunhui Zhang. 2025. "Dynamic Diagnosis of an Extreme Precipitation Event over the Southern Slope of Tianshan Mountains Using Multi-Source Observations" Remote Sensing 17, no. 9: 1521. https://doi.org/10.3390/rs17091521
APA StylePeng, J., Li, Z., Yang, L., & Zhang, Y. (2025). Dynamic Diagnosis of an Extreme Precipitation Event over the Southern Slope of Tianshan Mountains Using Multi-Source Observations. Remote Sensing, 17(9), 1521. https://doi.org/10.3390/rs17091521