Article

MSIM: A Multiscale Iteration Method for Aerial Image and Satellite Image Registration

1
Changchun Institute of Optics, Fine Mechanics and Physics, Chinese Academy of Sciences, Changchun 130033, China
2
University of Chinese Academy of Sciences, Beijing 100049, China
3
State Key Laboratory of Dynamic Optical Imaging and Measurement, Changchun 130033, China
*
Author to whom correspondence should be addressed.
Remote Sens. 2025, 17(8), 1423; https://doi.org/10.3390/rs17081423
Submission received: 27 February 2025 / Revised: 11 April 2025 / Accepted: 14 April 2025 / Published: 16 April 2025

Abstract

:
The registration of aerial images and satellite images is a key step in leveraging complementary information from heterogeneous remote sensing images. Due to the significant intrinsic differences, such as scale, radiometric, and temporal differences, between the two types of images, existing multimodal registration methods tend to be either inaccurate or unstable when applied. This paper proposes a coarse-to-fine registration method for aerial images and satellite images based on the multiscale iteration method (MSIM). Firstly, an image pyramid is established, and feature points are extracted based on phase congruency. Secondly, the expression form of image descriptors is improved to more accurately describe image feature points, thereby increasing the matching success rate and achieving coarse registration between images. Finally, multiscale iterations are performed to find accurate matching points from top to bottom to achieve fine registration between images. In order to verify the effectiveness and accuracy of the algorithm, this paper also establishes a set of registration datasets of aerial and satellite captured images. Experimental results show that the proposed algorithm has high accuracy and good robustness, and effectively solves the problem of registration failure in existing algorithms when dealing with heterogeneous remote sensing images that have large scale differences.

1. Introduction

Image registration is the process of spatially aligning two or more images. It is the basis for the joint use of multi-source scene information and has been widely used in image fusion, image stitching, three-dimensional reconstruction, target positioning, image retrieval, and other fields [1,2,3,4]. Aerial remote sensing imaging has the advantages of flexibility, timeliness and high resolution. Based on satellite maps, aerial images and satellite images are registered, which can be used for the high-precision target positioning of aerial images [5,6,7,8,9]. However, images acquired from different angles, times, and sensors exhibit significant multimodal differences, manifested in variations such as scale, radiometric, and temporal differences. These discrepancies pose significant challenges for the registration of aerial and satellite images. Differences in sensor size, platform altitude, and field of view during image capture result in varying spatial resolutions. Due to differences in sensor radiation principles and geometric structures, the radiometric characteristics of ground objects vary across different sensors, leading to discrepancies between remote sensing images. Over time, ground feature information may change across different years, seasons, or times of day, causing significant temporal differences between the captured images.
SIFT [3] is a widely used image feature extraction and matching algorithm that has strong scale invariance and rotation invariance and can cope with a certain degree of illumination changes. However, the SIFT algorithm is generally used for homologous images, usually images obtained from the same sensor. Cross-view target localization is essentially a multimodal image registration problem [5], and the SIFT method is not applicable.
In order to extract features from images of different modalities, Kovesi [10] extended the phase difference from cosine representation to a representation method combining cosine and sine, making the representation of phase deviation more sensitive. The phase congruency is represented by phase deviation, which solves the problem of feature location and obtains image information of different scales through high-pass filtering. This provides a theoretical basis for many multimodal image registration methods [11,12]. RIFT [13] uses Log-Gabor to solve phase congruency. First, feature points are detected on the maximum moment map and the minimum moment map, and then the maximum index map is constructed for feature description, thereby improving the stability of multimodal image registration. Subsequently, researchers further proposed a rotation invariance technique based on phase advantage index value [14], which speeds up the running time and reduces memory consumption. However, this method based on phase congruency is not scale invariant and is not suitable for situations with large scale differences.
Based on the research that methods with or without scale space have similar performance under small scale change factors, SRIF obtains the scale of key points by projecting FAST key points into a simple pyramid scale space, and proposes a SIFT-like local intensity binary transform (LIBT) for feature description, thereby enhancing the internal structure information of multimodal images.
In order to solve the problem of scale difference in multimodal images, researchers have adopted the method of constructing scale space [15] and the coarse-to-fine approach [16,17]. Through our experimental verification, the existing multimodal image registration algorithm can achieve good results when the scale difference between the image to be registered and the reference image is small; however, when the scale difference is large, the registration error is large or the image registration fails, and the image registration task cannot be completed.
With the development of deep learning technology, researchers have introduced a variety of neural network models and adopted a coarse-to-fine approach to solve the image registration problem [18,19,20]. However, the effectiveness of deep learning methods is heavily dependent on the quality and diversity of the training data. Existing multimodal image registration datasets [15,21,22] are mainly obtained from indoor scenes, outdoor ground, or low-altitude drones or simulated by remote sensing data. The images in these datasets have good imaging quality and small scale differences. The algorithms trained with these datasets do not have the characteristics of large scale invariance and are not suitable for matching long-distance aerial images with a low signal-to-noise ratio. Therefore, it is necessary to construct an aerial image and satellite image registration dataset with large scale differences in order to propose and improve the registration method of aerial images and satellite images.
In summary, existing registration methods often exhibit poor adaptability when handling aerial and satellite images with large scale differences. These methods struggle to cope with image discrepancies caused by scale variations, changes in radiometric properties, or temporal differences, leading to frequent registration failures or low accuracy. To address these challenges, a multiscale iterative image registration method (MSIM) is proposed to enhance the adaptability and accuracy of multi-source image registration. Additionally, a dataset has been constructed to evaluate and validate the performance of MSIM. The innovative contributions of this study are summarized as follows:
(1)
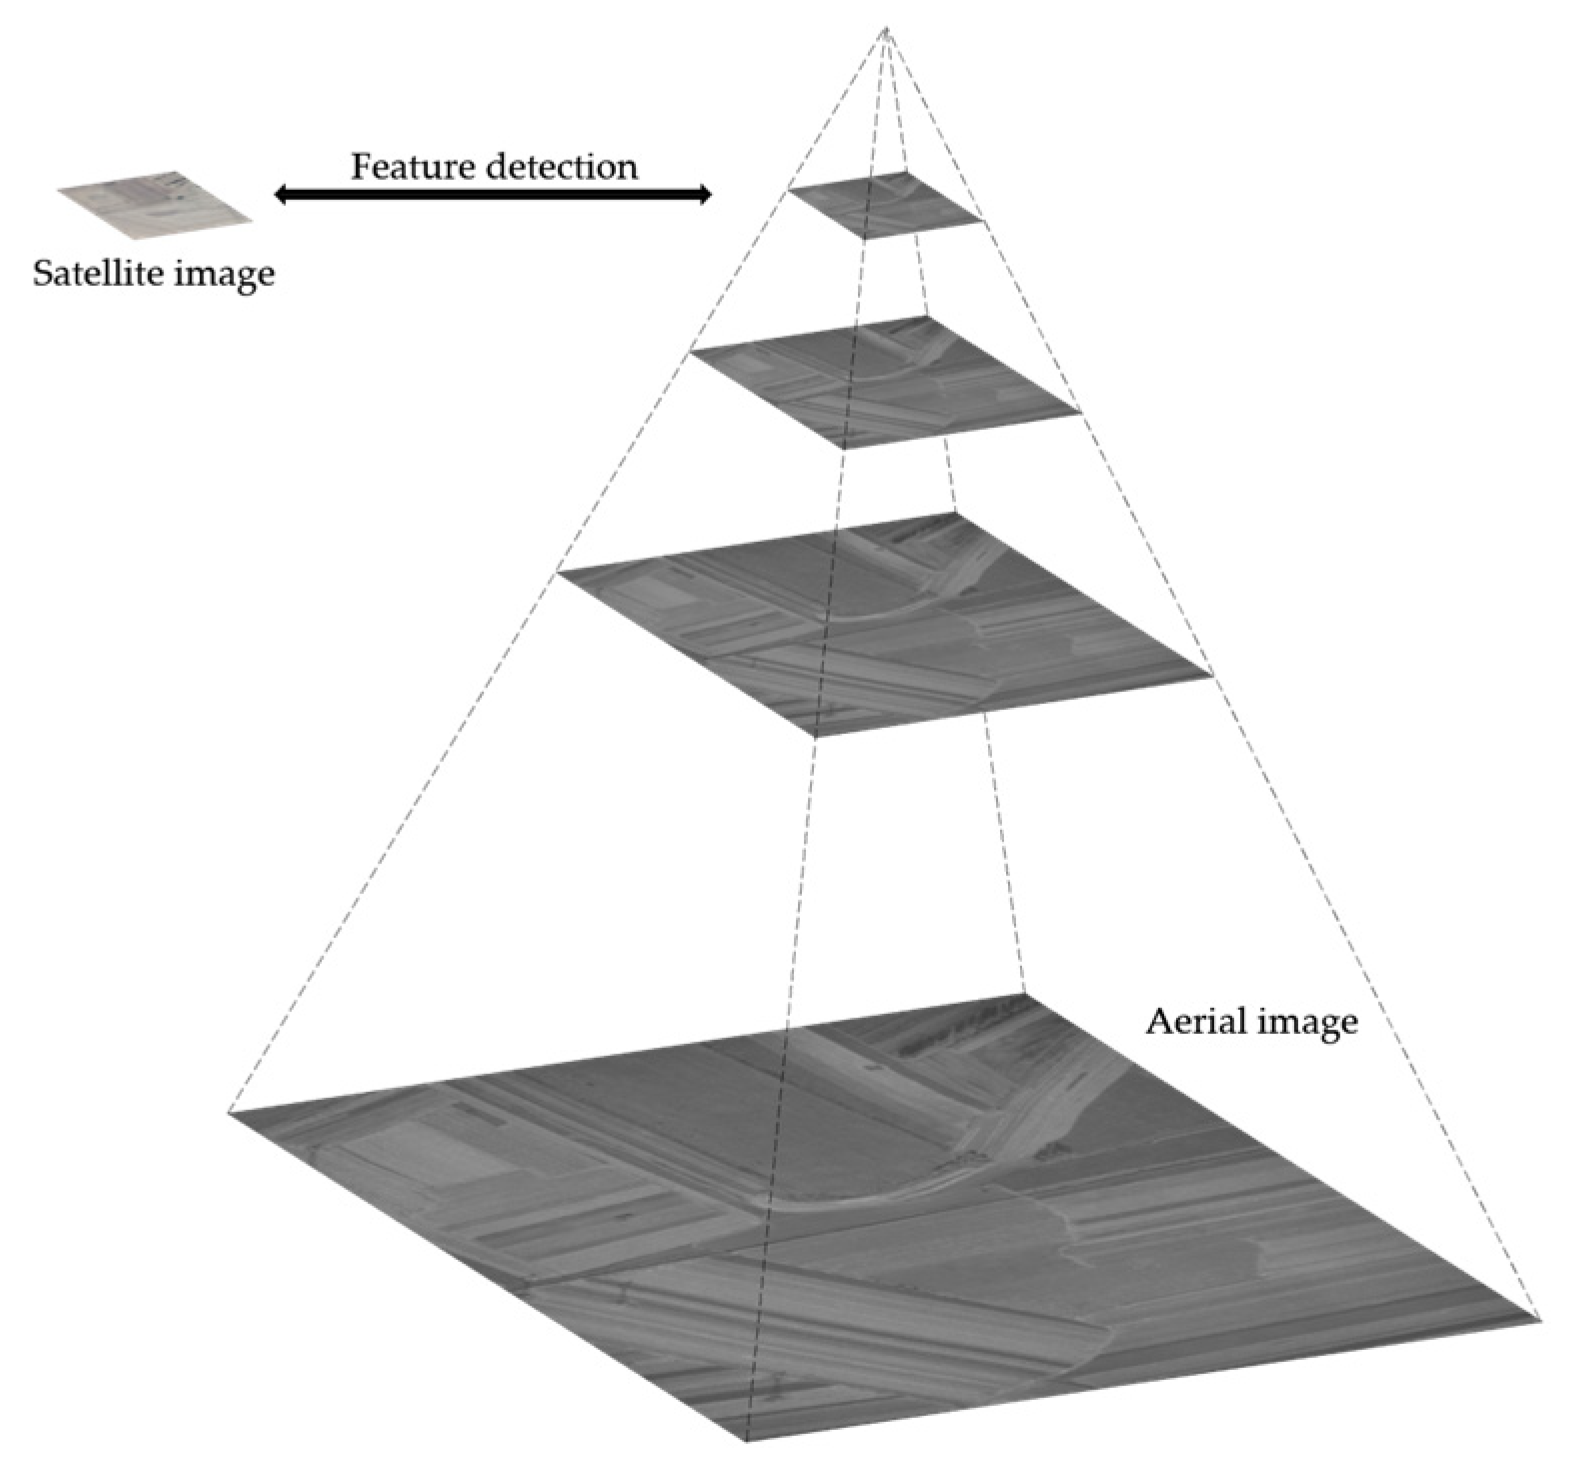
A feature detection method based on image pyramids and phase congruency is proposed. This approach eliminates scale differences through image pyramids and enhances edge features by extracting phase congruency maps, thereby significantly increasing the number of feature points.
(2)
A feature descriptor is designed which takes into account the neighborhood information weights of feature points, improving the accuracy of feature point matching.
The rest of this paper is organized as follows. Section 2 introduces our method and the data used. We first introduce the multiscale iterative aerial and the satellite image registration method, and then introduce the construction process of heterogeneous remote sensing image registration dataset with large scale differences. Section 3 conducts parameter analysis and experiments for comparison with other algorithms, and analyzes the results. Section 4 introduces the advantages and innovations of our algorithm and discusses the reasons. Finally, Section 5 summarizes this study.

2. Method and Materials

The MSIM proposed in this paper adopts a feature detection method based on image pyramids and phase congruency. By constructing a scale space for the aerial image, it overcomes the scale differences between heterogeneous images. Subsequently, the feature point descriptor is improved to perform the coarse matching of feature points between the top-level aerial image and the satellite image. Finally, a top–down multi-scale iterative method is applied to achieve fine image matching, and the homography matrix of the image transformation is estimated by accurately matching point pairs.
The homography matrix is a 3 × 3 matrix used to describe the projection transformation relationship between two planar images. As for a point p = ( x , y , 1 ) T in the image, the point can be transformed through the homography matrix H to obtain a new point p = ( x , y , 1 ) T in the transformed image, where x , y , x , y are the coordinates in the images, and 1 represents the homogeneous coordinate. The transformation relationship between the two points is expressed by Equation (1).
p = H p

2.1. Feature Detection Using Image Pyramid and Phase Congruency

In order to achieve multi-scale representation and the robust extraction of image features, this paper proposes a feature point detection method based on image pyramid and phase congruency. First, according to the scale difference between the image to be registered and the reference image, that is, the ratio corresponding to the ground sampling distance, a multiscale pyramid representation of the aerial image is constructed, as shown in Figure 1. While retaining the main structural features of the image, the influence of image noise is effectively suppressed.
Multiscale image representation is an important concept in computer vision. It can effectively capture the hierarchical structural information of an image by analyzing image features at different spatial scales. Among them, image pyramid is a classic method to achieve multiscale representation. It generates a series of image sequences with decreasing resolution by down-sampling step by step, thereby reducing the computational complexity while maintaining the main features of the image. The relationship between the top image I t and the original image I is expressed as follows:
I t = κ   I
where κ is the image pyramid factor, which depends on the ratio of the ground sampling distance between the two images. We further apply phase congruency to extract image feature points on the top-level image of the pyramid, which is comparable in size to the satellite image.
Research has shown that phase information reflects the structural and textural details of an image, providing significant advantages in describing image features. Fourier series expansion is a commonly used method for extracting phase information. Based on the Fourier series expansion at a given location x , phase congruency can be expressed as the difference between the cosine and sine [10]
Δ Φ n x = cos ( Φ n x Φ - x ) | sin ( Φ n x Φ - x ) |
where Φ n x denotes the local phase of Fourier components at position x , and Φ - x represents the global mean phase angle.
Phase congruency is a feature saliency measure based on Fourier transform, which identifies and highlights important visual features by analyzing the congruency of phase information in the local frequency domain of the image. Key features in the image, such as edges and corners, usually correspond to locations where multiple frequency components achieve phase congruency. That is, when different frequency components of the image show phase synchronization or highly similar phase values in a local area of space, this phenomenon strongly suggests the existence of structurally significant features in the area. This method can not only effectively capture the geometric structure information in the image, but also accurately locate and enhance key features in complex textures and diverse visual scenes, providing a powerful feature extraction tool for image registration.
In order to extract features from a two-dimensional image, the interval ( 0 ,   2 π ] is evenly divided into N O main directions, and a two-dimensional filter bank with N S scales and N O main directions is constructed. This filter bank can be denoted as F S , O x , y .
φ o = 2 π i N O ,   o = 1 , 2 N O
σ s = σ 1 λ s 1 ,   s = 1 , 2 , N S
F S , O x , y = 1 2 π σ s 2 exp log x 2 + y 2 f 1 2 2 log σ o n f 2 exp j atan y , x φ i
where λ is the scale factor of the filter, f1 is the center frequency of the filter, σ o n f is the ratio of the spectrum width to the center frequency, which is used to control the frequency response width, and j represents the imaginary part. The amplitude of the convolution response of the image I t and the filter bank is recorded as A n :
A n = I t F S , O x , y
The phase congruency deviation calculated along the main direction φ of the filter is denoted as P C φ , and is expressed as
P C φ = n W φ x   max ( A n x Δ Φ n x T , 0 ) n A n x + ε
where T is an estimate of the noise, and ε is a small constant to avoid the denominator being 0. The weight function W φ x in each direction can be easily obtained by the Sigmoid function:
W φ x = 1 1 + e γ c d φ x
In the formula, γ is the gain factor that controls the slope of the sigmoid function, c is the cutoff value of the filter response and d φ x represents the distribution of the filter’s response at a specific location x.
After the weighted summation of the phase congruency deviation values in all directions and normalization, the overall phase congruency can be obtained:
P C x = φ n W φ x   max ( A n φ x Δ Φ n φ x T , 0 ) n A n x + ε
According to the moment analysis theory of images, the corners and edges of the image can be determined by calculating the moments of phase congruency. The largest phase congruency moment is marked as an edge, and the largest phase congruency moment can be considered as a corner. The set of angles obtained by this method is a subset of the edge set. We superimpose the maximum moment map I M and the minimum moment map I m to obtain an enhanced edge map I e . The maximum and minimum moments of phase congruency and the enhanced edge map are calculated using the following formula:
I M = 1 2 a + c + b 2 + a c 2
I m = 1 2 a + c b 2 + a c 2
I e = I M + I m
where
a   = P C φ cos φ 2
b   = P C φ cos φ P C φ sin φ
c = P C φ   sin ( φ ) 2
On the enhanced edge map, we use the FAST (features from accelerated segment test) algorithm to detect the feature points. The 16 pixels in the circular neighborhood around each candidate corner point are examined. If there are at least nine pixels that are brighter or darker than the central pixel, then the point is determined to be a feature point. In real-time applications, high-speed feature point extraction can be achieved without significantly reducing the detection accuracy. The feature points at the top level of the pyramid F P t are given by the following formula:
F P t = x i , y i x i , y i I e , FAST I e , x i , y i
For computational convenience, the pyramid factor κ of the satellite image can be set to 1, and the corresponding set of feature points F Q is obtained using the same method. Compared with the intensity gradient quartic measurement method used by Harris [23], this phase congruency detection FAST feature point extraction method is insensitive to local contrast changes in the image, which not only improves the distinction of feature points, but also enhances the reliability of feature detection. Subsequent experiments show that this method can effectively extract significant feature points in the image while ensuring computational efficiency, and has strong robustness to image scale changes, contrast changes, illumination changes, and noise.

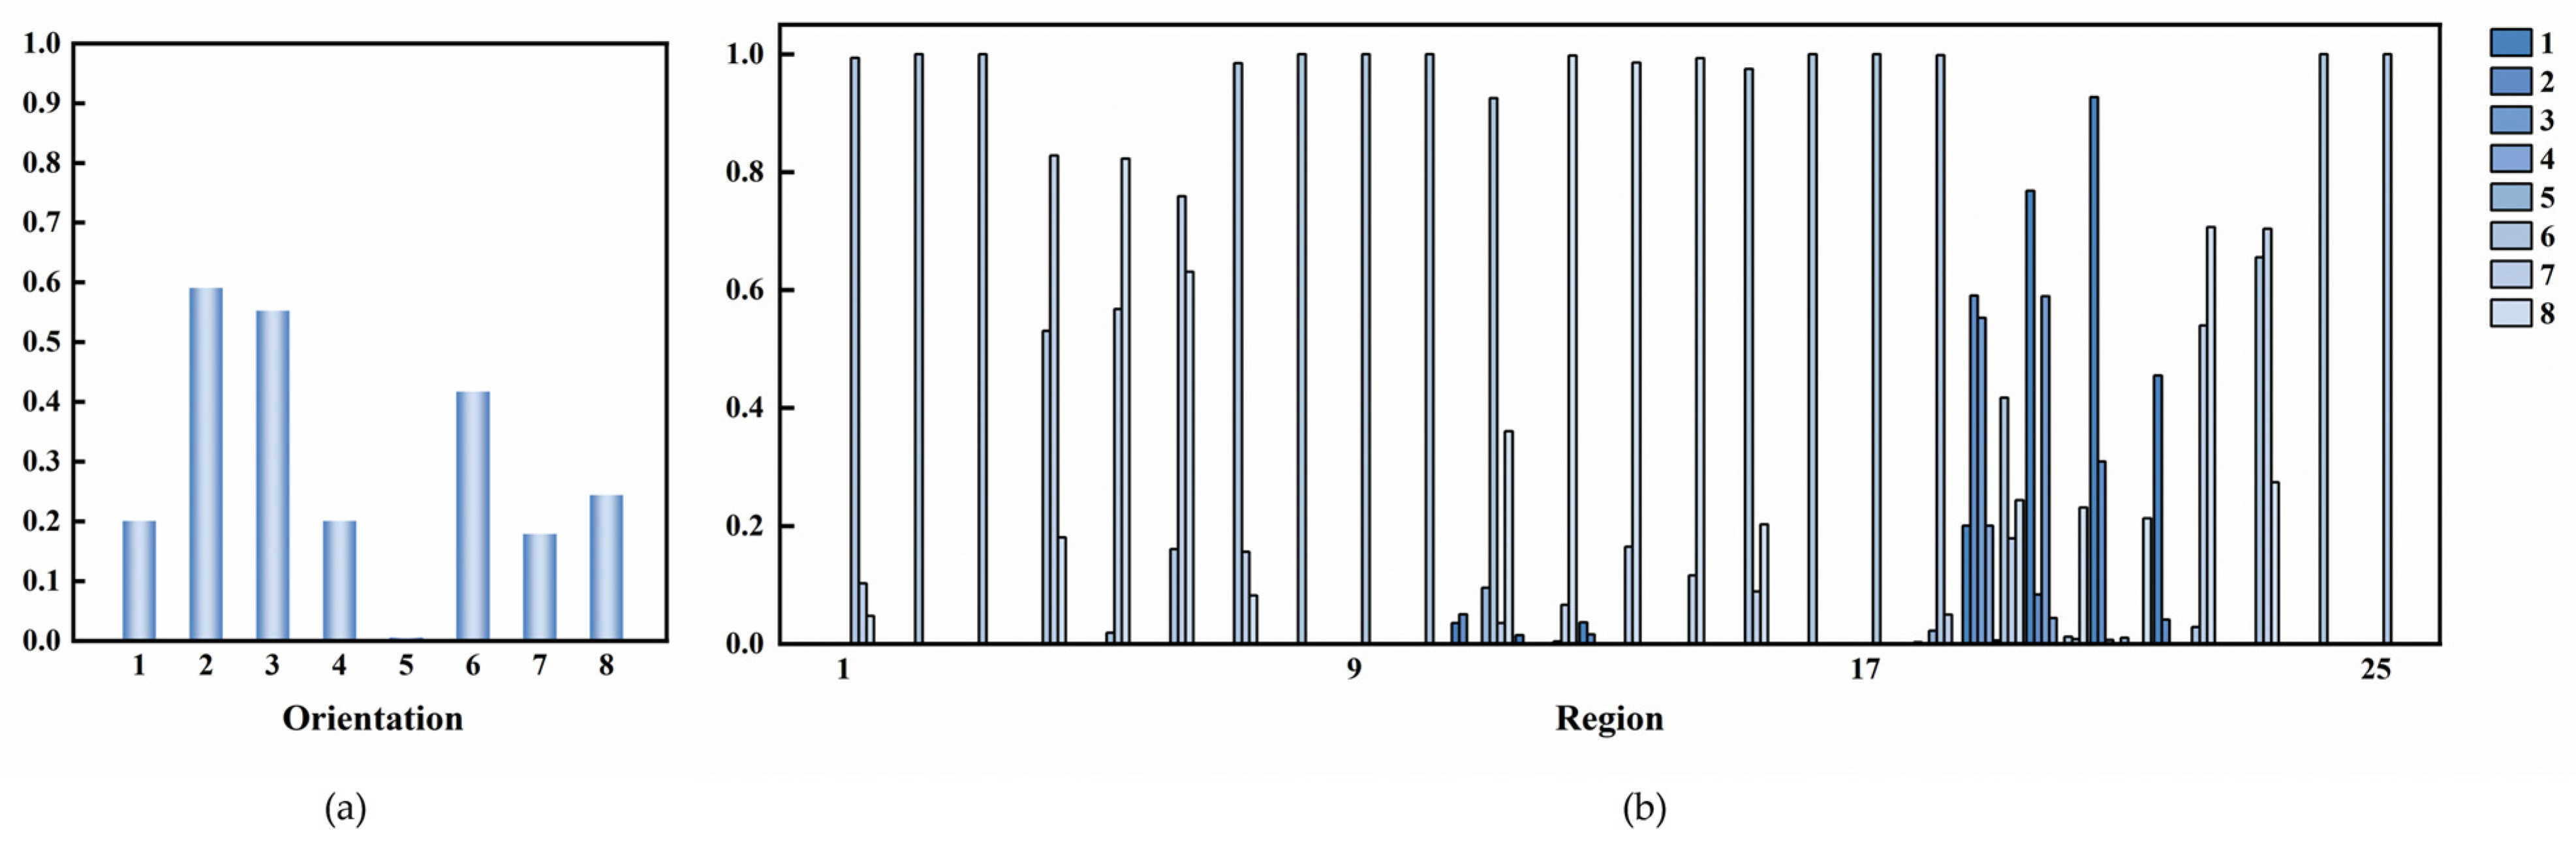
2.2. Feature Point Descriptor and Matching

After obtaining the image feature point, if only this pixel is considered without considering its neighborhood information, then this pixel is more likely to be a noise point. In fact, image features are concentrated at one point, and its neighborhood also contains some feature information. Therefore, it is usually necessary to construct a descriptor to describe the pixel information around the feature point. The descriptor is usually a vector, and the distance between descriptors represents the similarity between two feature points. Improving the image feature point descriptor can improve the accuracy of feature point matching. The gradient direction histogram in a square grid like SIFT is more commonly used because of its simple implementation method. However, this division method makes the area far away from the feature point and the area near the feature point have the same weight. In fact, in the neighborhood representing the image feature point, the closer the area is to the feature point, the more information it contains can represent the characteristics of this point, and the weight it occupies in the neighborhood descriptor should be higher. Conversely, the farther the area is from the feature point, the less information about the feature point it can contain, and the lower the weight it occupies in the feature point descriptor.
Based on this, we selected a circular area, as shown in Figure 2, when constructing the feature point description descriptor. The area consists of a central circle with a radius of R 0 and three layers of rings. From the center to the outside, the inner radius r i and the outer radius R i of the i-th ( i   0,3 ) layer of rings are expressed as:
r i = 2 i 1 R 0
R i = 2 i + 1 R 0
The three outer rings are evenly divided into eight sector rings. It is easy to derive the relationship between the area of the i-th ( i 0 , 3 ) sector ring and the area of the central circle, which can be expressed as
S i = 1 8 π R i 2 r i 2 = i π R 0 2 = i S 0 .
The area of the i-th annular sector is i times the area of the central circle.
According to the phase congruency metric constructed in Section 2.1, a maximum index map is constructed [13]. In each of the 25 regions in the neighborhood of the feature point, a histogram of the maximum value of the main direction of the filter is made (as shown in Figure 3a), and the proportion of each direction is counted. After normalization, they are connected into a 25NO-dimensional vector (as shown in Figure 3b) to obtain the feature point descriptor. In this paper, NO = 8. Experiment 3.2.1 proves that this parameter has the best effect. In this vector, the weight of the descriptor occupied by the statistical value of each region is inversely proportional to the area of the region, realizing the requirement that the closer the region to the feature point, the higher the weight. It can be expressed as:
ω i 1 S i
ω i ω 0 = 1 i
The similarity between feature points is usually expressed by the distance between descriptors. The closer the descriptors are, the more similar the two points are. Here, the Euclidean distance metric is used, and the nearest neighbor distance ratio matching strategy is used to match feature points. For each point on the aerial image, find the two points with the smallest distance on the satellite image. If the ratio of the smallest distance to the second smallest distance is less than a certain threshold, the match between the two points is considered reliable, otherwise the result is discarded. After the feature points are matched, a fast sample consensus (FSC) [24] is performed to remove the wrong matching point pairs and two sets of coarse matching point pairs, M P t ,   M Q , are obtained.
In the scale space of the pyramid structure, the feature points detected at the top layer, M P t , actually correspond to a local area of the bottom image. The matching points at the top layer of the aerial image pyramid are used as seed points to search for local feature points in the corresponding bottom area. The position coordinates of the top matching points are mapped to the next layer layer-by-layer, and the search window is defined with the point as the center. The position coordinates of the exact matching points are re-determined within the window to obtain a more accurate registration result. This method iterates downward layer by layer at multiple scales until it reaches the bottom layer of the pyramid, that is, the original resolution image, and finally obtains an accurate feature point matching result. The final set of matching points is P , Q , which can be given by the following formula:
κ P = M P t
Q = M Q
This top–down multiscale iterative strategy not only improves the accuracy of feature point positioning, but also significantly reduces the computational complexity by limiting the search range. At the same time, the scale invariance of the pyramid structure also makes this method highly resistant to scale changes.

2.3. Data

In terms of images, 30 existing images collected by aerial cameras are used. The image size is 5344 × 4008, and the ground sampling distance is about 0.16 m. For each aerial image, four satellite images of the same area and taken at different times are collected. The image size is 800 × 600, and the ground sampling distance is about 1.07 m. The ratio of the ground sampling distance of the two groups of images is about 1:6.68. According to the acquisition time of the aerial image, the shooting time of the required satellite images is determined, respectively. In each group, two images are taken earlier than the aerial image, and two are taken later. This constitutes 120 groups of image pairs with different shooting times, different ground sampling distance, and different sensors. As shown in Figure 4, 10 pairs of points with the same name are manually selected on each group of images, and these points are relatively evenly distributed on the image. Through these 10 pairs of points with the same name, the transformation matrix H of the image pair can be obtained, which is used as a standard value for algorithm evaluation. These 120 sets of aerial-satellite images and the corresponding image transformation matrix H constitute the dataset of this paper. There are three differences in this set of images: scale difference, phase difference and radiation difference, which are also the three main problems solved by this method.

3. Experiments

3.1. Metrics

When evaluating image matching algorithms, subjective and objective evaluations are often carried out from the perspectives of matching effect and accuracy.

3.1.1. Subjective Evaluation Metrics

In subjective evaluation, the matching results of the two images are judged by matching point connection diagram, chessboard diagram, and fusion diagram.
The matching point connection diagram is an evaluation method that displays two images side by side and connects the matching point pairs. It can intuitively observe whether the matching points are correct, how many there are, and whether the distribution is uniform.
The checkerboard image is obtained by dividing the satellite image I 1 ( x , y ) and the transformed aerial image I 2 ^ ( x , y ) into blocks and then stitching them together. The image stitching effect, especially the connection effect of the landmark objects at the image stitching point, can be used to obtain an intuitive evaluation of the image matching effect.

3.1.2. Objective Evaluation Metrics

In objective evaluation, the assessment is primarily based on the number of matching point pairs, root mean square error (RMSE), and computation time. In practical applications, since the image transformation relationship can be determined with more than four correctly matched points, this is not considered a major evaluation criterion. Additionally, when there is a large scale difference, many algorithms may work for certain images but yield significant registration errors or even fail for others. In such cases, using only RMSE to measure registration accuracy can effectively evaluate the accuracy for specific images but fails to provide an accurate and comprehensive assessment across multiple image sets or datasets.
In order to solve this defect, this paper introduces the root mean square error as an objective evaluation indicator to express the average error of the registration algorithm, and further uses the standard deviation, accuracy, and success rate to evaluate the robustness and accuracy of the algorithm.
  • Root Mean Square Error (RMSE)
In this paper, the matching points on the aerial image are represented as P 1 , P 2 , , P n , the coordinates of point P i are ( x i A , y i A ) , and the homogeneous coordinates are ( x i A , y i A , 1 ) . Point P i is transformed by the image transformation matrix H to obtain the corresponding point Q i . The homogeneous coordinates of point Q i are ( x i S , y i S , 1 ) . Equation (25) shows this transformation relationship.
x i S y i S 1 = H x i A y i A 1
The image transformation homography matrix obtained according to the image matching results is expressed as H ^ . The corresponding point on the satellite image obtained by the H ^ transformation of point P i on the aerial image is expressed as Q i ^ . The homogeneous coordinates of point Q i ^ are ( x i S ^ , y i S ^ , 1 ) . Equation (26) shows this transformation relationship.
x i S ^ y i S ^ 1 = H ^ x i A y i A 1
Point ( Q i , Q i ^ ) is the true value and predicted value of the matching point corresponding to point P i . The Euclidean distance between point Q i and point Q i ^ is expressed as:
Q i Q i ^ = x i S x i S ^ 2 + y i S y i S ^ 2
The root mean square error of the matching algorithm is expressed as the error between the matching points obtained by the real image transformation relationship of the aerial image feature points and the matching points obtained by the predicted image transformation relationship, that is, the arithmetic square root of the average of the sum of the squares of the Euclidean distances of the matching algorithm prediction points. The calculation formula is as follows:
RMSE = 1 n i = 1 n Q i Q i ^ 2
The root mean square error is an evaluation indicator to measure the difference between the true value and the predicted value. The smaller the root mean square error, the more accurate the algorithm and the better the effect.
  • Accuracy
Consider the matching results of a pair of matching point pairs. If Q i Q i ^ < 5 , that is, the Euclidean distance between the true value and the predicted value is less than five pixels, it means that the feature point matches accurately. Between the k-th pair of images, the ratio of the number of accurately matched feature point pairs nka to the total number of matching point pairs nk is recorded as the accuracy rate, represented by A. The higher the accuracy rate, the better. The formula is expressed as
A k = n ka n k × 100 %
  • Standard Deviation
The standard deviation is used to describe the difference between a data point and the overall mean, considering the standard deviation of the overall root mean square error and the standard deviation of the overall accuracy, respectively. The smaller the overall standard deviation, the more robust the algorithm is.
SD RMSE = k = 1 N RMSE k RMSE - 2 N
SD A = k = 1 N A k   A - 2 N
  • Success Rate
Consider the root mean square error of the matching point pairs in the k-th pair of images. If RMSE < x , the algorithm is considered to be successfully applicable to this set of images. In this paper, x = 5 or 10 is taken. When x < 10, a more accurate matching result can be observed in the matching point connection diagram, but there may be inaccurate connections in the local area of the checkerboard diagram. When x < 5, there is no obvious difference in the connection on the checkerboard diagram, and it can be considered that a more successful matching result has been achieved. If the number of image pairs successfully matched by the algorithm is Nsx, and the total number of image pairs in the experiment is N , then the proportion of Nsx in N is recorded as the success rate, expressed as SRx. The higher the success rate, the better. The success rate (SR) was calculated as follows:
SR x = N s x N × 100 %

3.2. Parameter Study

The method proposed in this paper contains several main parameters. Next, we will analyze and discuss the selection of the number of main direction parameters and scale parameters of the filter. The effectiveness of this method is proved by comparing the results of multiple moments and different descriptor shapes. We use the root mean square error and its derived quantitative indicators for judgment. The effects of different parameter selections are intuitively compared through the root mean square error interval diagram and accuracy interval diagram for each group of experiments.

3.2.1. The Number of Directions NO

When calculating the phase congruency of the image, the number of convolution directions N O should be considered. If the number of directions is too small, the feature points may not be fully extracted. If the number of directions is too large, the efficiency of the algorithm will be affected. Considering that the descriptor in this paper is designed to have eight directions, the number of convolution directions should be adjusted in theory to achieve better registration results. In order to divide ( 0,360 ° ] efficiently, this paper compares NO = 4, 6, 8, 10, and 12. The results are shown in Table 1 and Figure 5. It is easy to find that, when NO is set to 8, the image registration has the highest accuracy and the best robustness, and the accuracy and success rate are also better than other cases.

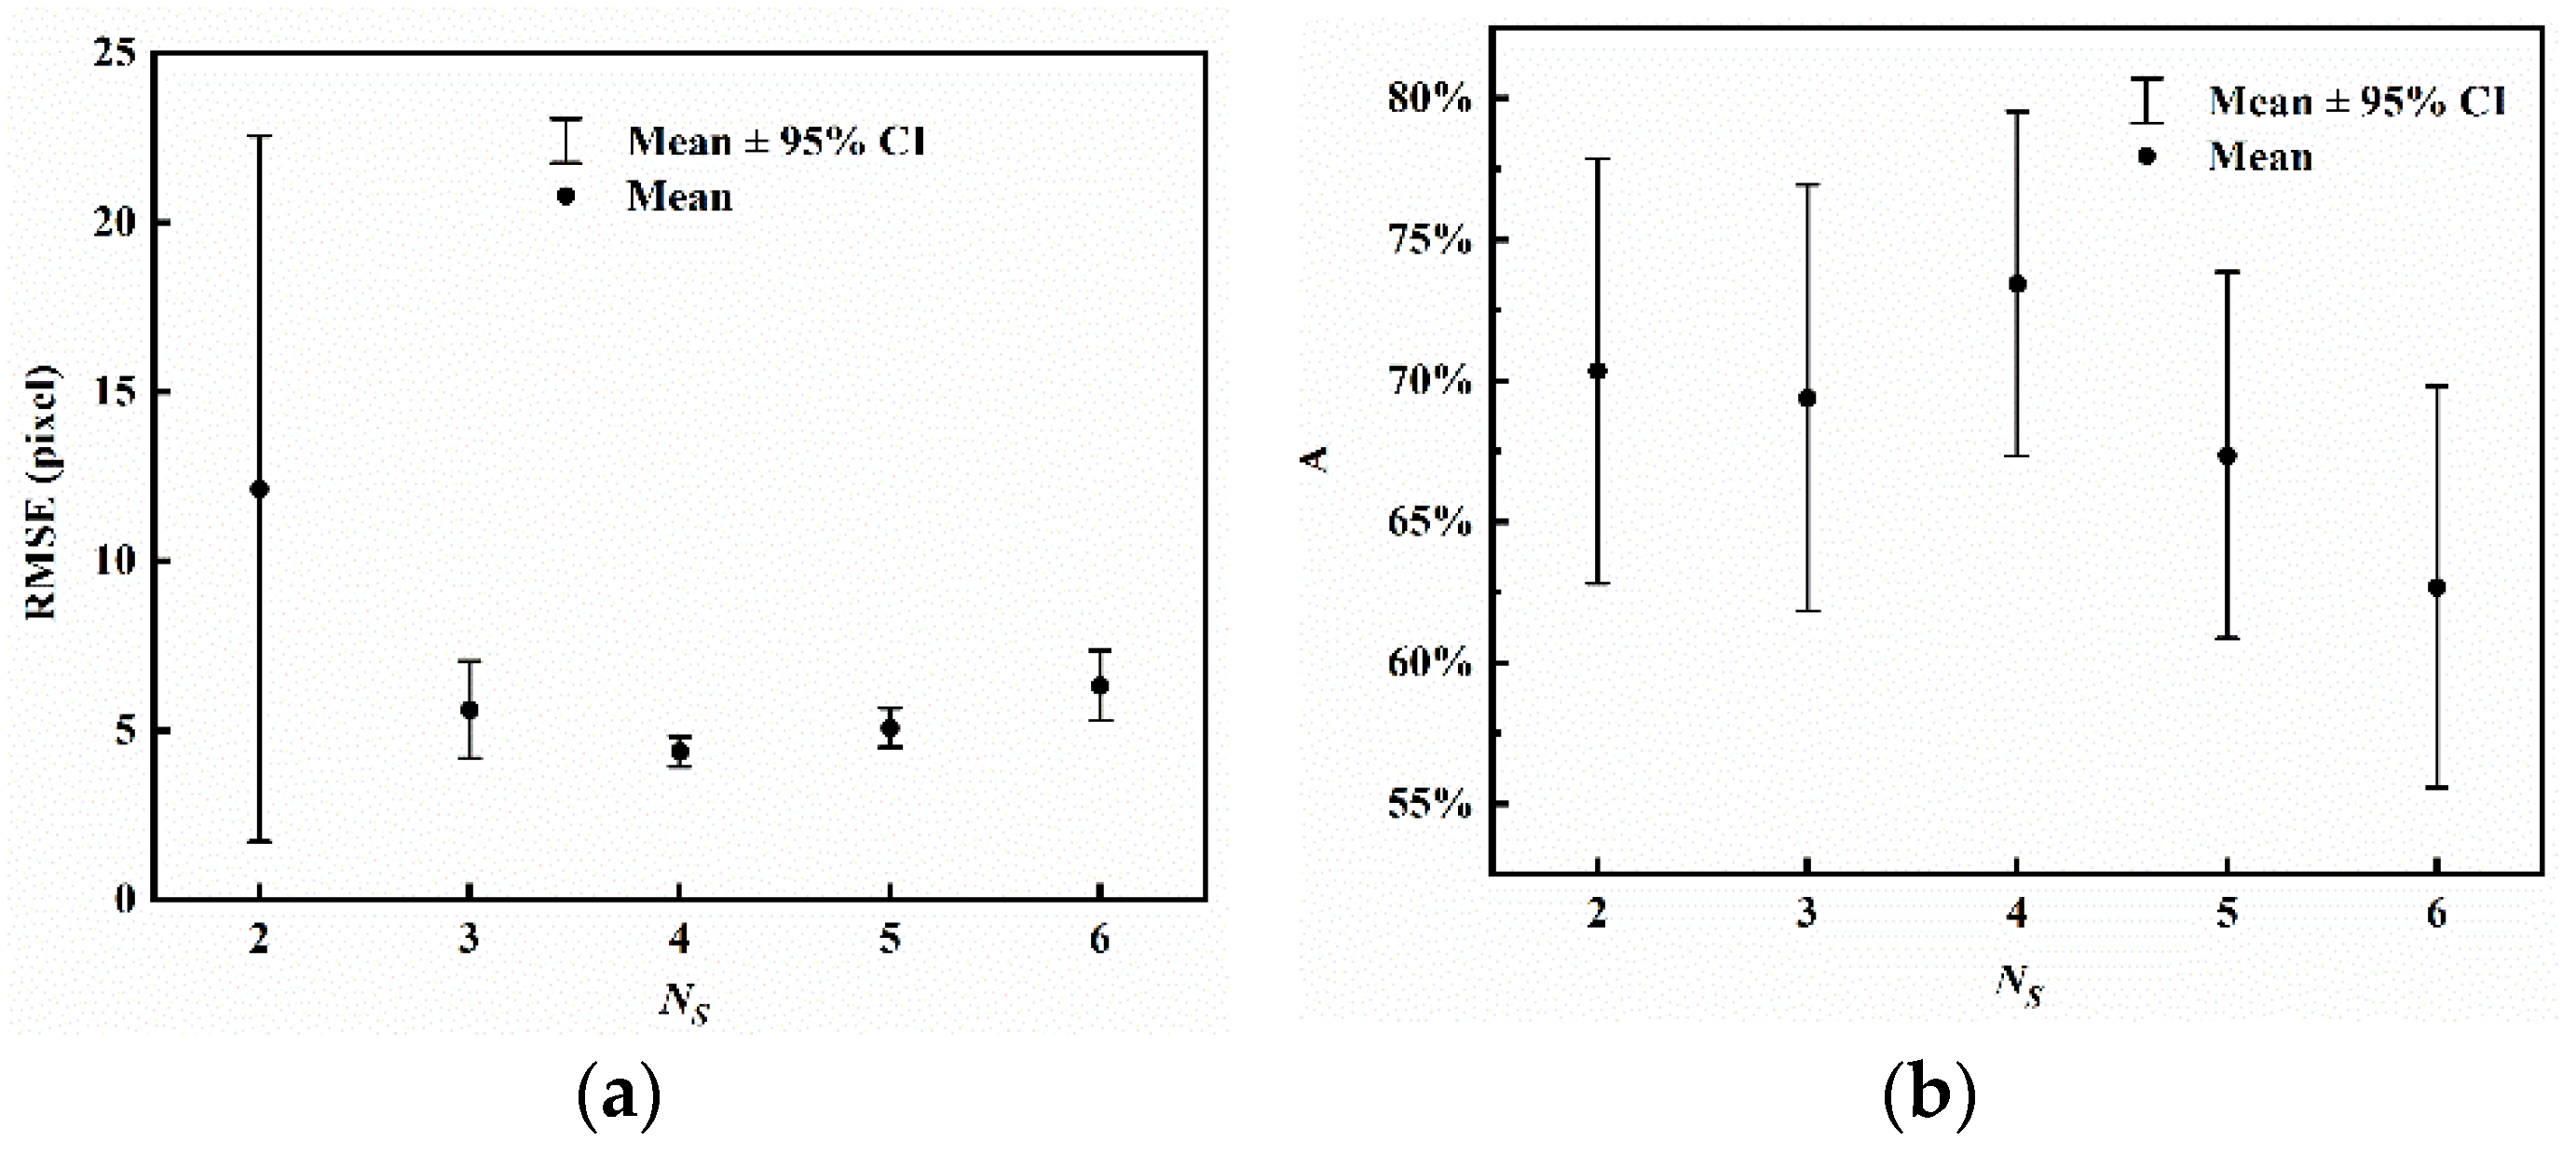
3.2.2. The Number of Scales NS

The filter scale parameter NS used in phase congruency also affects the algorithm. If the scale is too small, the image phase congruency cannot be fully expressed. More scales generally lead to a finer analysis of the image’s features, but they also increase the computational complexity. Table 2 and Figure 6 compare NS = 2, 3, 4, 5 and 6, proving the effectiveness of NS = 4.

3.2.3. Moment Selection Comparison

In the feature extraction stage, we calculated the local phase congruency for the top image of the pyramid, and extracted feature points through the enhanced edge map obtained by accumulating the maximum and minimum moment maps. Noting that some algorithms use a uniform moment extractor that averages the maximum and minimum moments, we compared several feature extraction schemes. We compared the results of registration after extracting feature points on the minimum moment map, maximum moment map, uniform moment map, and cumulative moment map, as shown in Table 3 and Figure 7.
Although the average accuracy and its standard deviation of the algorithm in this paper are slightly worse than the maximum moment map, the cumulative moment map brings more accurate and robust results in terms of the average root mean square error and its standard deviation, and this choice also performs better in terms of the registration success rate.

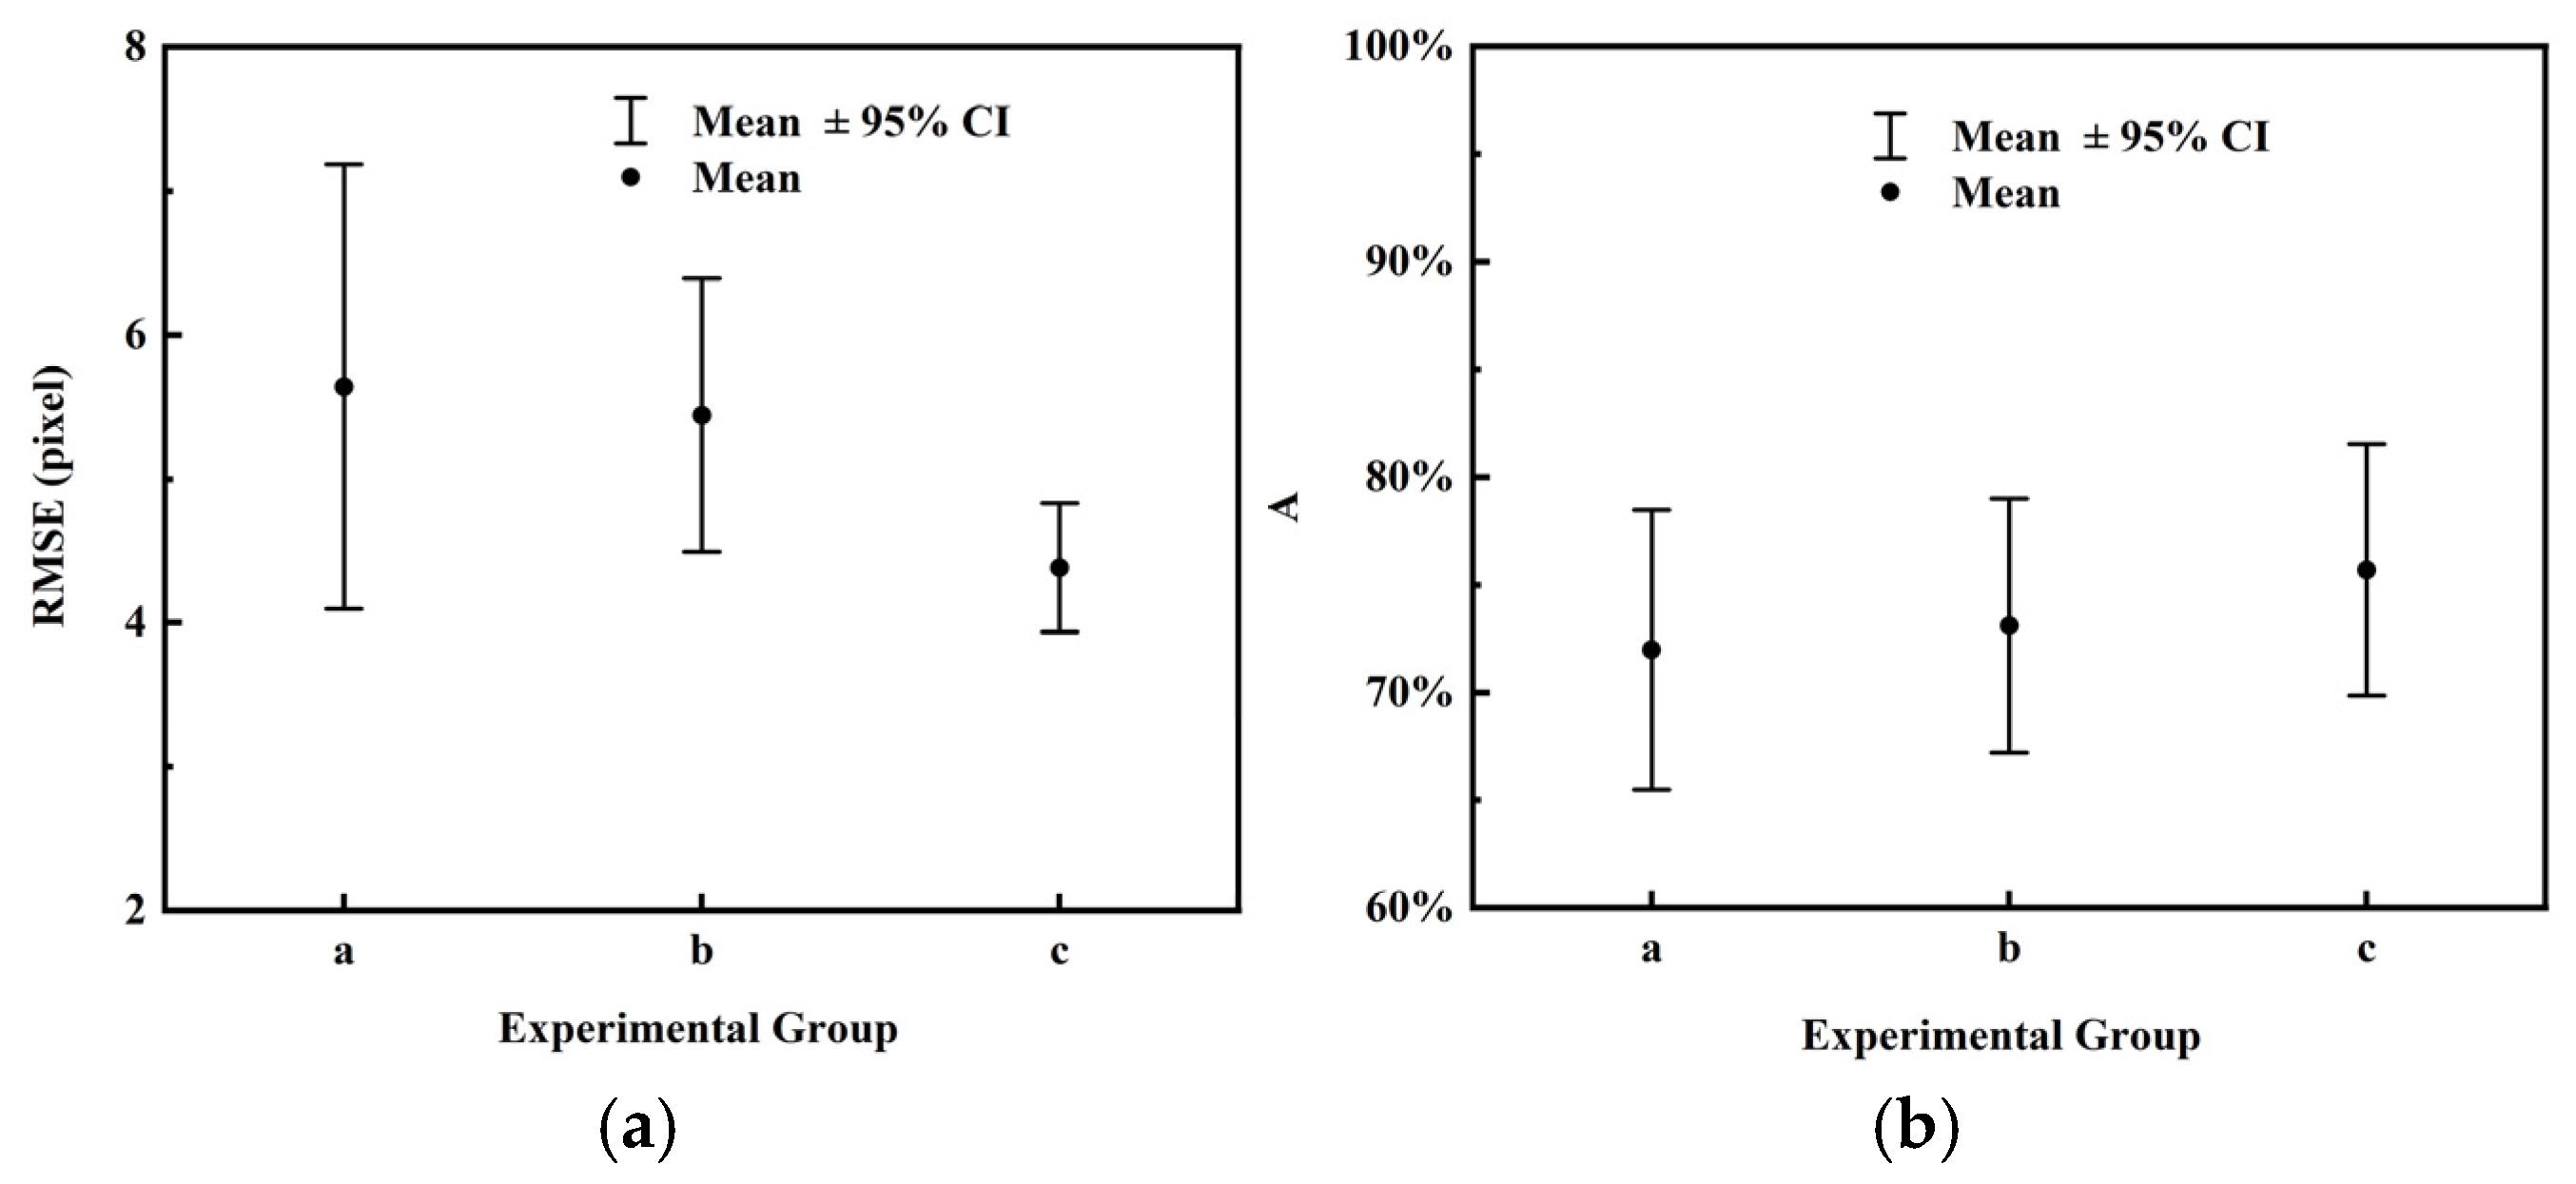
3.2.4. Comparison of Descriptor Shapes

This paper proposes to describe feature points in a circular area. To prove the effectiveness of this method, we compare it with the square area proposed by RIFT [13]. Two groups of comparative experiments are set up here. Experimental groups a and b are both square areas. In experimental group a, NO is set to 6, and in experimental group b, NO is set to 8. The results in Table 4 and Figure 8 show that the circular area feature descriptor proposed by the algorithm in this paper is better than the square area in registration, with more precise RMSE, better registration accuracy, higher success rate, smaller standard deviation, and better robustness.

3.3. Comparative Experimental Results

We compared MSIM with methods such as SIFT, RIFT, and SRIF. In the analysis of RIFT, we identified a critical limitation in original RIFT’s parameter configuration. Specifically, the parameter J is the size of the local image patch for feature description, which remains fixed across multi-scale images. However, when processing image pairs with significant resolution disparities, such as aerial and satellite image, this static parameterization becomes suboptimal. Features captured at higher spatial resolutions inherently occupy more pixels and larger areas than their lower-resolution counterparts, necessitating dynamic window scaling to maintain consistent scene coverage. To address this, we implemented a resolution-adaptive adjustment to parameter J and propose this modified approach as the RIFT-Like method. While the parameter J = 96 for the satellite image as in the original paper was effective, we proportionally scaled it to J = 640 for aerial images based on their ground sampling distance ratio. This strategic modification ensures that feature descriptors from both modalities physically encompass the equivalent image scene, thereby directly enhancing descriptor comparability across scales.
The registration algorithm was verified on our dataset. The registration results were subjectively observed through the matching point pair connection diagrams and checkerboard diagrams, and then evaluated through various objective metrics.

3.3.1. Subjective Evaluation

We conducted registration experiments on a large number of aerial images and satellite images with large scale differences, and selected three pairs of images to represent the registration results. The figures cover terrains such as roads, farmlands, cities, and rivers, including areas with complex terrain information and obvious image features, as well as some areas with sparse terrain information and less obvious image features, as shown in Figure 9, Figure 10, Figure 11, Figure 12, Figure 13, Figure 14 and Figure 15.
Figure 9 directly shows the registration results of the matching point pairs. In each subfigure, the left side is the aerial image and the right side is the corresponding satellite image. It is easy to see that the SIFT, SRIF, and RIFT methods failed to register, and the SIFT algorithm had a large number of incorrect correspondences, while the SRIF and RIFT methods had a small number of matching point pairs and the remaining corresponding points were incorrect. The RIFT-Like method is effective in specific scenarios. MSIM significantly improved the registration effect. Figure 10 is the original result of Figure 9m, depicting a scene of roads and trees. Figure 11 shows the original result of Figure 9n, showcasing a farmland scene. Figure 12 presents the original result of Figure 9o, which highlights a city and river scene. These figures clearly demonstrate the registration result of MSIM. The left side of the figure is an aerial image, and the right side is the corresponding satellite image which is scaled to the same size as the aerial image for clear comparison. The matching points of the two images are represented by red circles and green crosses, respectively, and the paired matching points are connected by yellow lines. It can be seen that the number of matching points has been greatly improved, the distribution is even, and the position correspondence is accurate.
SIFT, SRIF, and RIFT algorithms failed to register and could not obtain a valid image transformation relationship. Therefore, we only compare the registration effect of RIFT-Like method and MSIM in the following checkerboards. Figure 13, Figure 14 and Figure 15 show the registration results of the three sets of image pairs through checkerboard images, where Figures a are the registration results of RIFT-Like, and Figures d are the registration results of MSIM. In the two sets of results, local zooming is taken to obtain Figures b and c, and red boxes highlight the selected areas.
In Figure 13b, the road connection between the three blocks of the image is interrupted. In Figure 14b, the river is broken between the aerial image and the satellite image blocks and cannot be connected. In Figure 15b, the two paths cannot be connected in the left and right areas. These three images show that the image transformation matrix obtained by RIFT-Like registration is inaccurate.
Correspondingly, the road is smoothly connected at the junction of the three blocks in Figure 13c, the river is successfully connected between the blocks in Figure 14c, and the two paths are accurately connected between the two areas in Figure 15c, indicating that the image registration result obtained by the MSIM is accurate.

3.3.2. Objective Evaluation

Table 5 gives a quantitative comparison of the registration results of SIFT, SRIF, RIFT, RIFT-Like, and MSIM. In terms of SIFT, SRIF and RIFT methods, the average RMSE is much higher than 200, the average accuracy is 0, and the success rate is 0, which further shows that these algorithms fail in the registration tasks. The five-pixel registration success rate of the RIFT-Like method is 13.33%, that is, 13.33% of the image pairs can obtain the registration results with an RMSE less than 5. Similarly, 38.33% of the image pairs can obtain the registration results with RMSE less than 10, which shows that the algorithm is effective in specific cases. This is because the ground features in these images are richer and the number of feature points is greater, which makes the registration results better. The larger average RMSE and lower accuracy also show that the algorithm is not widely applicable. Compared with the RIFT-Like method, MSIM improves the average RMSE by 11.50 times and the average accuracy by 2.62 times, respectively. The average RMSE of MSIM is 4.3845, the overall standard deviation is 1.7209, the five-pixel registration success rate is 70%, and the ten-pixel registration success rate is 100%, indicating that the algorithm has obtained good registration results on most image pairs. In terms of algorithm runtime, the average time for MSIM to register per image pair is 8.6083 s, significantly outperforming RIFT-Like, which takes 53.4476 s. MSIM achieves a good balance between maintaining high registration quality and ensuring efficient performance. The proposed method, MSIM, has obvious advantages over other algorithms.

4. Discussion

Our method mainly includes feature point extraction based on image pyramid, feature point rough matching based on circular region descriptor and multiscale iterative fine registration. As can be seen from Figure 5, Figure 6, Figure 7 and Figure 8 and Table 1, Table 2, Table 3 and Table 4, we evaluated the algorithm parameters through evaluation methods such as root mean square error and its interval graph, accuracy, and its interval graph and success rate, and selected the number of directions NO, number of filter scales NS, moment selection and descriptor shape with small root mean square error, high accuracy, high success rate, and good robustness.
In the comparative experiment of aerial image and satellite image registration, we compared SIFT, SRIF, RIFT, RIFT-Like, and the proposed method. As shown in Figure 9, although SIFT [3] has scale invariance, it is not suitable for multimodal remote sensing image registration with radiation difference, intensity difference, and temporal difference. Although RIFT [13] is suitable for the registration of multimodal heterogeneous images, it does not have scale invariance. Although SRIF [15] solves the problem of multimodal image registration with small scale difference to a certain extent by establishing a projected image pyramid, it has poor registration results on images with large scale difference. The proposed method solves the problem of difficulty in the registration of aerial images and satellite images with large scale difference, radiation difference, and temporal difference. It is attributed to our algorithm model, which has a more accurate physical interpretation of the actual image. Table 5 further illustrates the good accuracy and effectiveness of the algorithm through evaluation indicators such as RMSE, accuracy, and success rate.
Although the heterogeneous image registration effect of this method has been greatly improved compared with other algorithms, it still has certain limitations. Specifically, the registration result still has an error within a few pixels. This is due to two reasons in the image data. On the one hand, satellite images may have local stitching errors or errors caused by distortion. Solving the registration error caused by image distortion is also the work we plan to explore next. On the other hand, if there is a large area of sparse feature area in the original image pair, then, when manually selecting matching point pairs, the reference point may be inaccurate. The standard image transformation relationship determined by these point pairs has an error of several pixels, which leads to a systematic error of several pixels when calculating the root mean square error of the registration result of this method. However, the ten-pixel registration success rate of this method is 100%, that is, the registration error of all images is less than ten pixels, which meets the requirements of practical applications.

5. Conclusions

This paper presents a multiscale iterative image registration method to address the challenge of registering aerial and satellite images with significant scale differences. First, an image pyramid is constructed for aerial images to eliminate scale discrepancies. Phase congruency is used to extract both edge and corner features, increasing the number of candidate matching points. Next, the feature point descriptors are improved to better match the feature information, enhancing the accuracy of coarse matching. Finally, a multiscale iteration method is employed to progressively reproject matching points from the top layer to the bottom layer of the pyramid, achieving precise registration. We also introduce a large-scale and multi-temporal aerial and satellite image registration dataset for optimizing algorithm parameters and evaluating registration results. Compared to classic methods, our method, MSIM, shows significant improvements in registration accuracy, RMSE, and success rate.
Despite achieving notable improvements in accuracy and robustness, the method has certain limitations. Due to its reliance on feature extraction, performance may be less effective in regions with sparse textures or significant image distortion. Future research will focus on addressing this challenge and broadening the applicability of multi-modal image registration. Additionally, reducing the algorithm’s complexity and enhancing computational efficiency remain key directions for further research.

Author Contributions

Conceptualization, X.L., Y.D. and C.L.; Data curation, X.L., Y.D. and C.L.; Formal analysis, X.L.; Funding acquisition, Y.D.; Investigation, X.L.; Methodology, X.L. and C.L.; Project administration, Y.D.; Resources, Y.D. and C.L.; Software, X.L.; Supervision, Y.D.; Validation, X.L. and C.L.; Visualization, X.L.; Writing—original draft, X.L.; Writing—review and editing, Y.D. and C.L. All authors have read and agreed to the published version of the manuscript.

Funding

This research was funded by the National Science and Technology Major Project of China, grant number No. 30-H32A01-9005-13115.

Data Availability Statement

The data presented in this study are available on request from the corresponding author and the first author due to privacy.

Conflicts of Interest

The authors declare no conflicts of interest.

References

  1. He, J.; Jiang, X.; Hao, Z.; Zhu, M.; Gao, W.; Liu, S. LPHOG: A Line Feature and Point Feature Combined Rotation Invariant Method for Heterologous Image Registration. Remote Sens. 2023, 15, 4548. [Google Scholar] [CrossRef]
  2. Zhang, X.; Leng, C.; Hong, Y.; Pei, Z.; Cheng, I.; Basu, A. Multimodal Remote Sensing Image Registration Methods and Advancements: A Survey. Remote Sens. 2021, 13, 5128. [Google Scholar] [CrossRef]
  3. Lowe, D.G. Distinctive Image Features from Scale-Invariant Keypoints. Int. J. Comput. Vis. 2004, 60, 91–110. [Google Scholar] [CrossRef]
  4. Wang, J.; Ma, A.; Zhong, Y.; Zheng, Z.; Zhang, L. Cross-Sensor Domain Adaptation for High Spatial Resolution Urban Land-Cover Mapping: From Airborne to Spaceborne Imagery. Remote Sens. Environ. 2022, 277, 113058. [Google Scholar] [CrossRef]
  5. Liu, C.; Ding, Y.; Zhang, H.; Xiu, J.; Kuang, H. Improving Target Geolocation Accuracy with Multi-View Aerial Images in Long-Range Oblique Photography. Drones 2024, 8, 177. [Google Scholar] [CrossRef]
  6. Zhu, B.; Ye, Y.; Dai, J.; Peng, T.; Deng, J.; Zhu, Q. VDFT: Robust Feature Matching of Aerial and Ground Images Using Viewpoint-Invariant Deformable Feature Transformation. ISPRS J. Photogramm. Remote Sens. 2024, 218, 311–325. [Google Scholar] [CrossRef]
  7. He, M.; Liu, J.; Gu, P.; Meng, Z. Leveraging Map Retrieval and Alignment for Robust UAV Visual Geo-Localization. IEEE Trans. Instrum. Meas. 2024, 73, 2523113. [Google Scholar] [CrossRef]
  8. Yang, H.; Zhu, Q.; Mei, C.; Yang, P.; Gu, H.; Fan, Z. TROG: A Fast and Robust Scene-Matching Algorithm for Geo-Referenced Images. Int. J. Remote Sens. 2024. [Google Scholar] [CrossRef]
  9. He, R.; Long, S.; Sun, W.; Liu, H. A Multimodal Image Registration Method for UAV Visual Navigation Based on Feature Fusion and Transformers. Drones 2024, 8, 651. [Google Scholar] [CrossRef]
  10. Kovesi, P. Phase Congruency: A Low-Level Image Invariant. Psychol. Res. 2000, 64, 136–148. [Google Scholar] [CrossRef]
  11. Guo, H.; Xu, H.; Wei, Y.; Shen, Y. Point Pairs Optimization for Piecewise Linear Transformation of Multimodal Remote Sensing Images by the Similarity of Log-Gabor Features. IEEE Geosci. Remote Sens. Lett. 2022, 19, 6516605. [Google Scholar] [CrossRef]
  12. Fan, J.; Xiong, Q.; Ye, Y.; Li, J. Combining Phase Congruency and Self-Similarity Features for Multimodal Remote Sensing Image Matching. IEEE Geosci. Remote Sens. Lett. 2023, 20, 4001105. [Google Scholar] [CrossRef]
  13. Li, J.; Hu, Q.; Ai, M. RIFT: Multi-Modal Image Matching Based on Radiation-Variation Insensitive Feature Transform. IEEE Trans. Image Process. 2020, 29, 3296–3310. [Google Scholar] [CrossRef] [PubMed]
  14. Li, J.; Shi, P.; Hu, Q.; Zhang, Y. RIFT2: Speeding-up RIFT with A New Rotation-Invariance Technique. arXiv 2023, arXiv:2303.00319. [Google Scholar]
  15. Li, J.; Hu, Q.; Zhang, Y. Multimodal Image Matching: A Scale-Invariant Algorithm and an Open Dataset. ISPRS J. Photogramm. Remote Sens. 2023, 204, 77–88. [Google Scholar] [CrossRef]
  16. Yang, H.; Li, X.; Zhao, L.; Chen, S. A Novel Coarse-to-Fine Scheme for Remote Sensing Image Registration Based on SIFT and Phase Correlation. Remote Sens. 2019, 11, 1833. [Google Scholar] [CrossRef]
  17. Zhang, X.; Wang, Y.; Liu, J.; Wang, S.; Zhang, C.; Liu, H. Robust Coarse-to-Fine Registration Algorithm for Optical and SAR Images Based on Two Novel Multiscale and Multidirectional Features. IEEE Trans. Geosci. Remote Sens. 2024, 62, 5215126. [Google Scholar] [CrossRef]
  18. Ye, Y.; Tang, T.; Zhu, B.; Yang, C.; Li, B.; Hao, S. A Multiscale Framework with Unsupervised Learning for Remote Sensing Image Registration. IEEE Trans. Geosci. Remote Sens. 2022, 60, 5622215. [Google Scholar] [CrossRef]
  19. Xiong, Z.; Li, W.; Zhao, X.; Zhang, B.; Tao, R.; Du, Q. PRF-Net: A Progressive Remote Sensing Image Registration and Fusion Network. IEEE Trans. Neural Netw. Learn. Syst. 2024, 1–14. [Google Scholar] [CrossRef]
  20. Tu, P.; Hu, P.; Wang, J.; Chen, X. From Coarse to Fine: Non-Rigid Sparse-Dense Registration for Deformation-Aware Liver Surgical Navigation. IEEE Trans. Biomed. Eng. 2024, 71, 2663–2677. [Google Scholar] [CrossRef]
  21. Zheng, Z.; Wei, Y.; Yang, Y. University-1652: A Multi-View Multi-Source Benchmark for Drone-Based Geo-Localization. In Proceedings of the 28th ACM International Conference on Multimedia, Seattle, WA, USA, 12–16 October 2020; pp. 1395–1403. [Google Scholar]
  22. Zhang, Y.; Zhang, W.; Yao, Y.; Zheng, Z.; Wan, Y.; Xiong, M. Robust Registration of Multi-Modal Remote Sensing Images Based on Multi-Dimensional Oriented Self-Similarity Features. Int. J. Appl. Earth Obs. Geoinf. 2024, 127, 103639. [Google Scholar] [CrossRef]
  23. Harris, C.; Stephens, M. A Combined Corner and Edge Detector; The Plessey Company: Essex, UK, 1988; p. 6. [Google Scholar]
  24. Wu, Y.; Ma, W.; Gong, M.; Su, L.; Jiao, L. A Novel Point-Matching Algorithm Based on Fast Sample Consensus for Image Registration. IEEE Geosci. Remote Sens. Lett. 2015, 12, 43–47. [Google Scholar] [CrossRef]
Figure 1. Illustration of constructing an aerial image pyramid for feature detection (the left side shows the satellite image and the right side shows the constructed aerial image pyramid).
Remotesensing 17 01423 g001
Figure 2. Feature point descriptor schematic.
Remotesensing 17 01423 g002
Figure 3. Diagram of a feature point descriptor. (a) The eight-orientation histogram of a region; (b) The weighted histogram of the 25 neighbor regions of the feature point.
Remotesensing 17 01423 g003
Figure 4. Manual selection of points on aerial and satellite images. (a) Real aerial image; (b) Satellite image scaled to match aerial image size for clear comparison; (c) Original satellite image.
Remotesensing 17 01423 g004
Figure 5. Interval plot using different descriptor parameter NO. (a) Interval plot of RMSE; (b) Interval plot of A (95% CI represents a 95% confidence interval).
Remotesensing 17 01423 g005
Figure 6. Interval plot using different descriptor parameter NS. (a) Interval plot of RMSE; (b) Interval plot of A (95% CI represents a 95% confidence interval).
Remotesensing 17 01423 g006
Figure 7. Interval plot under different moment experiments. (a) Interval plot of RMSE; (b) Interval plot of A (95% CI represents a 95% confidence interval).
Remotesensing 17 01423 g007
Figure 8. Interval plot using different region shapes. (a) Interval plot of RMSE; (b) Interval plot of A (95% CI represents a 95% confidence interval).
Remotesensing 17 01423 g008
Figure 9. Registration results shown in matched points connection images of aerial and satellite images with significant scale differences. (ac) Registration results of SIFT; (df) Registration results of SRIF; (gi) Registration results of RIFT; (jl) Registration results of RIFT-Like; (mo) Registration results of MSIM. In each subfigure, the left is the aerial image and the right is the satellite image scaled to match the aerial image size for clear comparison.
Remotesensing 17 01423 g009
Figure 10. Original registration results in the roads and trees scene of Figure 9m.
Remotesensing 17 01423 g010
Figure 11. Original registration results in the farmland scene of Figure 9n.
Remotesensing 17 01423 g011
Figure 12. Original registration results in the city and river scene of Figure 9o.
Remotesensing 17 01423 g012
Figure 13. Registration results shown in the checkerboard images of aerial and satellite images with significant scale differences. (a) Registration results of RIFT-Like; (d) Registration results of MSIM. (b) The enlarged image of the image in the red box in (a); and (c) The enlarged image of the image in the red box in (d).
Remotesensing 17 01423 g013
Figure 14. Registration results shown in checkerboard images of aerial and satellite images with significant scale differences. (a) Registration results of RIFT-Like; (d) Registration results of MSIM. (b) The enlarged image of the image in the red box in (a); (c) The enlarged image of the image in the red box in (d).
Remotesensing 17 01423 g014
Figure 15. Registration results shown in checkerboard images of aerial and satellite images with significant scale differences. (a) Registration results of RIFT-Like; (d) Registration results of MSIM. (b) The enlarged image of the image in the red box in (a); and (c) The enlarged image of the image in the red box in (d).
Remotesensing 17 01423 g015
Table 1. Quantitative comparison of the registration results using different descriptor parameter N O .
N O R M S E m e a n S D R M S E A m e a n S D A S R 5 S R 10
46.01805.234771.62%0.247755.00%90.00%
65.16523.835471.24%0.294166.67%96.67%
84.38451.720973.44%0.234670.00%100.00%
104.66212.112172.01%0.255865.00%98.33%
126.21277.239170.93%0.233655.00%91.67%
Table 2. Quantitative comparison of the registration results using different descriptor parameter N S .
N S R M S E m e a n S D R M S E A m e a n S D A S R 5 S R 10
212.134440.001870.34%0.289156.67%91.67%
35.61215.483969.39%0.290456.67%93.33%
44.38451.720973.44%0.234670.00%100.00%
55.08022.230167.35%0.249248.33%95.00%
66.32753.949462.68%0.273141.67%91.67%
Table 3. Quantitative comparison of the registration results under different moment experiments.
Group 1 R M S E m e a n S D R M S E A m e a n S D A S R 5 S R 10
a11.266322.697462.97%0.319348.33%80.00%
b4.44061.814674.36%0.217665.00%98.33%
c4.81272.077071.41%0.237856.67%100.00%
d4.38451.720973.44%0.234670.00%100.00%
1 The minimum moment map is used in Group a. The maximum moment map is used in Group b. The mean of the minimum and maximum moments is used in Group c. The sum of the minimum and maximum moments is used in Group d.
Table 4. Quantitative comparison of the registration results using different region shapes.
Group 1 R M S E m e a n S D R M S E A m e a n S D A S R 5 S R 10
a5.64075.926167.01%0.274056.67%96.67%
b5.44233.637668.97%0.245151.67%95.00%
c4.38451.720973.44%0.234670.00%100.00%
1 Square regions with NO = 6 is used in Group a. Square regions with NO = 8 is used in Group b. Circular regions with NO = 8 is used in Group c.
Table 5. Quantitative comparison of the registration results from different algorithms.
Method R M S E m e a n S D R M S E A m e a n S D A S R 5 S R 10 Time
SIFT401.457896.98940.00%-0.00%--
SRIF415.1512175.61720.00%-0.00%--
RIFT273.9546115.28890.00%-0.00%--
RIFT-Like50.396484.002128.00%0.319713.33%38.33%53.4476 s
MSIM4.38451.720973.44%0.234670.00%100.00%8.6083 s
Disclaimer/Publisher’s Note: The statements, opinions and data contained in all publications are solely those of the individual author(s) and contributor(s) and not of MDPI and/or the editor(s). MDPI and/or the editor(s) disclaim responsibility for any injury to people or property resulting from any ideas, methods, instructions or products referred to in the content.

