1. Introduction
Landslides are geological disasters that rank second only to earthquakes in severity. These events not only cause soil erosion and alter the landscape but also result in significant losses of human life and property. China experiences frequent landslide disasters. According to the 2023 China Natural Resources Bulletin published by the Ministry of Natural Resources, there were 3668 geological disasters in China in 2023, include 925 landslides (25.2% of the total). Accurately identifying landslide-prone areas is crucial for monitoring and early warning, as it can significantly enhance disaster prevention and mitigation efforts. Furthermore, identifying these areas provides essential scientific data for governments to develop land-use plans.
Landslide susceptibility estimation (LSE) has been an important tool for assessing landslide risks since it was first introduced in the 1980s [
1]. Over the years, LSE has evolved from simple statistical models to more complex machine learning techniques. Early studies relied on statistical methods, in which researchers assessed the probability of landslide occurrence in a region by integrating various influencing factors and generating susceptibility maps [
2]. Subsequently, with the rapid development of Geographic Information Systems (GIS) and machine learning technologies, significant progress has been made in the selection of landslide influencing factors, probability prediction, and classification of susceptibility levels.
In the selection of influencing factors, researchers have moved from early experience-driven approaches to more data-driven methods. For example, Li et al. [
3] proposed a factor selection method based on the information gain ratio, which notably enhanced the predictive capability of the models. Luo et al. [
4] introduced the GeoDetector method, which employs spatial variance analysis to objectively select key factors and assign weights. More recently, Zhou et al. [
5] combined GeoDetector with Recursive Feature Elimination (RFE) to further improve model performance. Additionally, Xu et al. [
6] used the Pearson correlation coefficient (PCC) and principal component analysis (PCA) to reduce the dimensionality of factors, enhancing the model’s generalizability across different regions. Chen et al. [
7] introduced a convolutional neural network (CNN)-based framework that automatically extracts key features from high-dimensional geospatial data, offering a novel approach for selecting influencing factors.
Regarding probability prediction, the research has expanded from traditional methods such as logistic regression [
8,
9] and evidence weighting [
10,
11] to machine learning techniques such as the support vector machine (SVM) [
12], decision trees, and neural networks [
13,
14]. These methods not only improve prediction accuracy but also enhance the model’s ability to capture complex nonlinear relationships. The rise of deep learning technologies in recent years has further advanced LSE. For instance, Zhao et al. [
15] combined Transformer models with geospatial data to develop a new landslide susceptibility assessment framework, which significantly improves the model’s applicability in complex terrain conditions.
In terms of prediction probability interval classification, various techniques have been proposed, ranging from the early natural breaks method [
16,
17] to ROC curve-based [
18] and clustering methods [
19]. Despite the foundation these methods provide for classification, they are often criticized for arbitrary threshold settings, a tendency that can lead to bias in susceptibility predictions. For example, Pradhan [
20] and Xie et al. [
21] proposed classification methods based on the area ratio of susceptible zones and the cumulative ratio of historical geological disasters. While these methods have optimized the scientific and practical aspects of susceptibility classification, they still lack adaptability to region-specific characteristics, which can affect their generalizability and applicability across different regions. In recent years, as more advanced methods have emerged, landslide susceptibility prediction interval classification has improved. For instance, He et al. [
22] proposed a deep-learning-based adaptive interval classification method, which dynamically adjusts the classification strategy based on regional characteristics. This approach overcomes the limitations of traditional methods and offers new directions for interval classification. Although these emerging methods show potential, they still face challenges in addressing complex geological and environmental factors, highlighting the need for further refinements to improve their reliability and accuracy in practical applications.
Despite significant progress in LSE methods, several challenges remain. For instance, current studies lack a unified framework for both factor selection and data-driven interval classification. The existing prediction probability interval classification and landslide susceptibility classification methods are often arbitrary, leading to insufficient accuracy and rationality in susceptibility classification. Furthermore, multi-level classification strategies for landslide susceptibility tend to neglect areas with low or very low susceptibility in later stages of landslide monitoring and early warning, thereby ignoring potential landslide disasters in these areas and failing to achieve disaster prevention and reduction goals. Moreover, the current quantitative evaluation of LSE results is primarily based on historical sample data, which, in essence, evaluates the model’s accuracy rather than the accuracy of the LSE results themselves. To address these challenges, this study proposes a landslide-prone area identification method based on multiple factors and adaptive probability thresholds. This method utilizes LSE to obtain the prediction probability for each point and applies the JS (Jensen–Shannon) divergence weighted sum of the landslide influencing factors to adaptively determine the probability threshold. Based on this threshold, the landslide susceptibility in the study area is classified into two levels: susceptible and non-susceptible. This experiment selects the Tongren North area of the Longwu River Basin in Qinghai as the study area and evaluates the final identification results of landslide-prone areas using total accuracy, later occurrence rate, and omission rate.
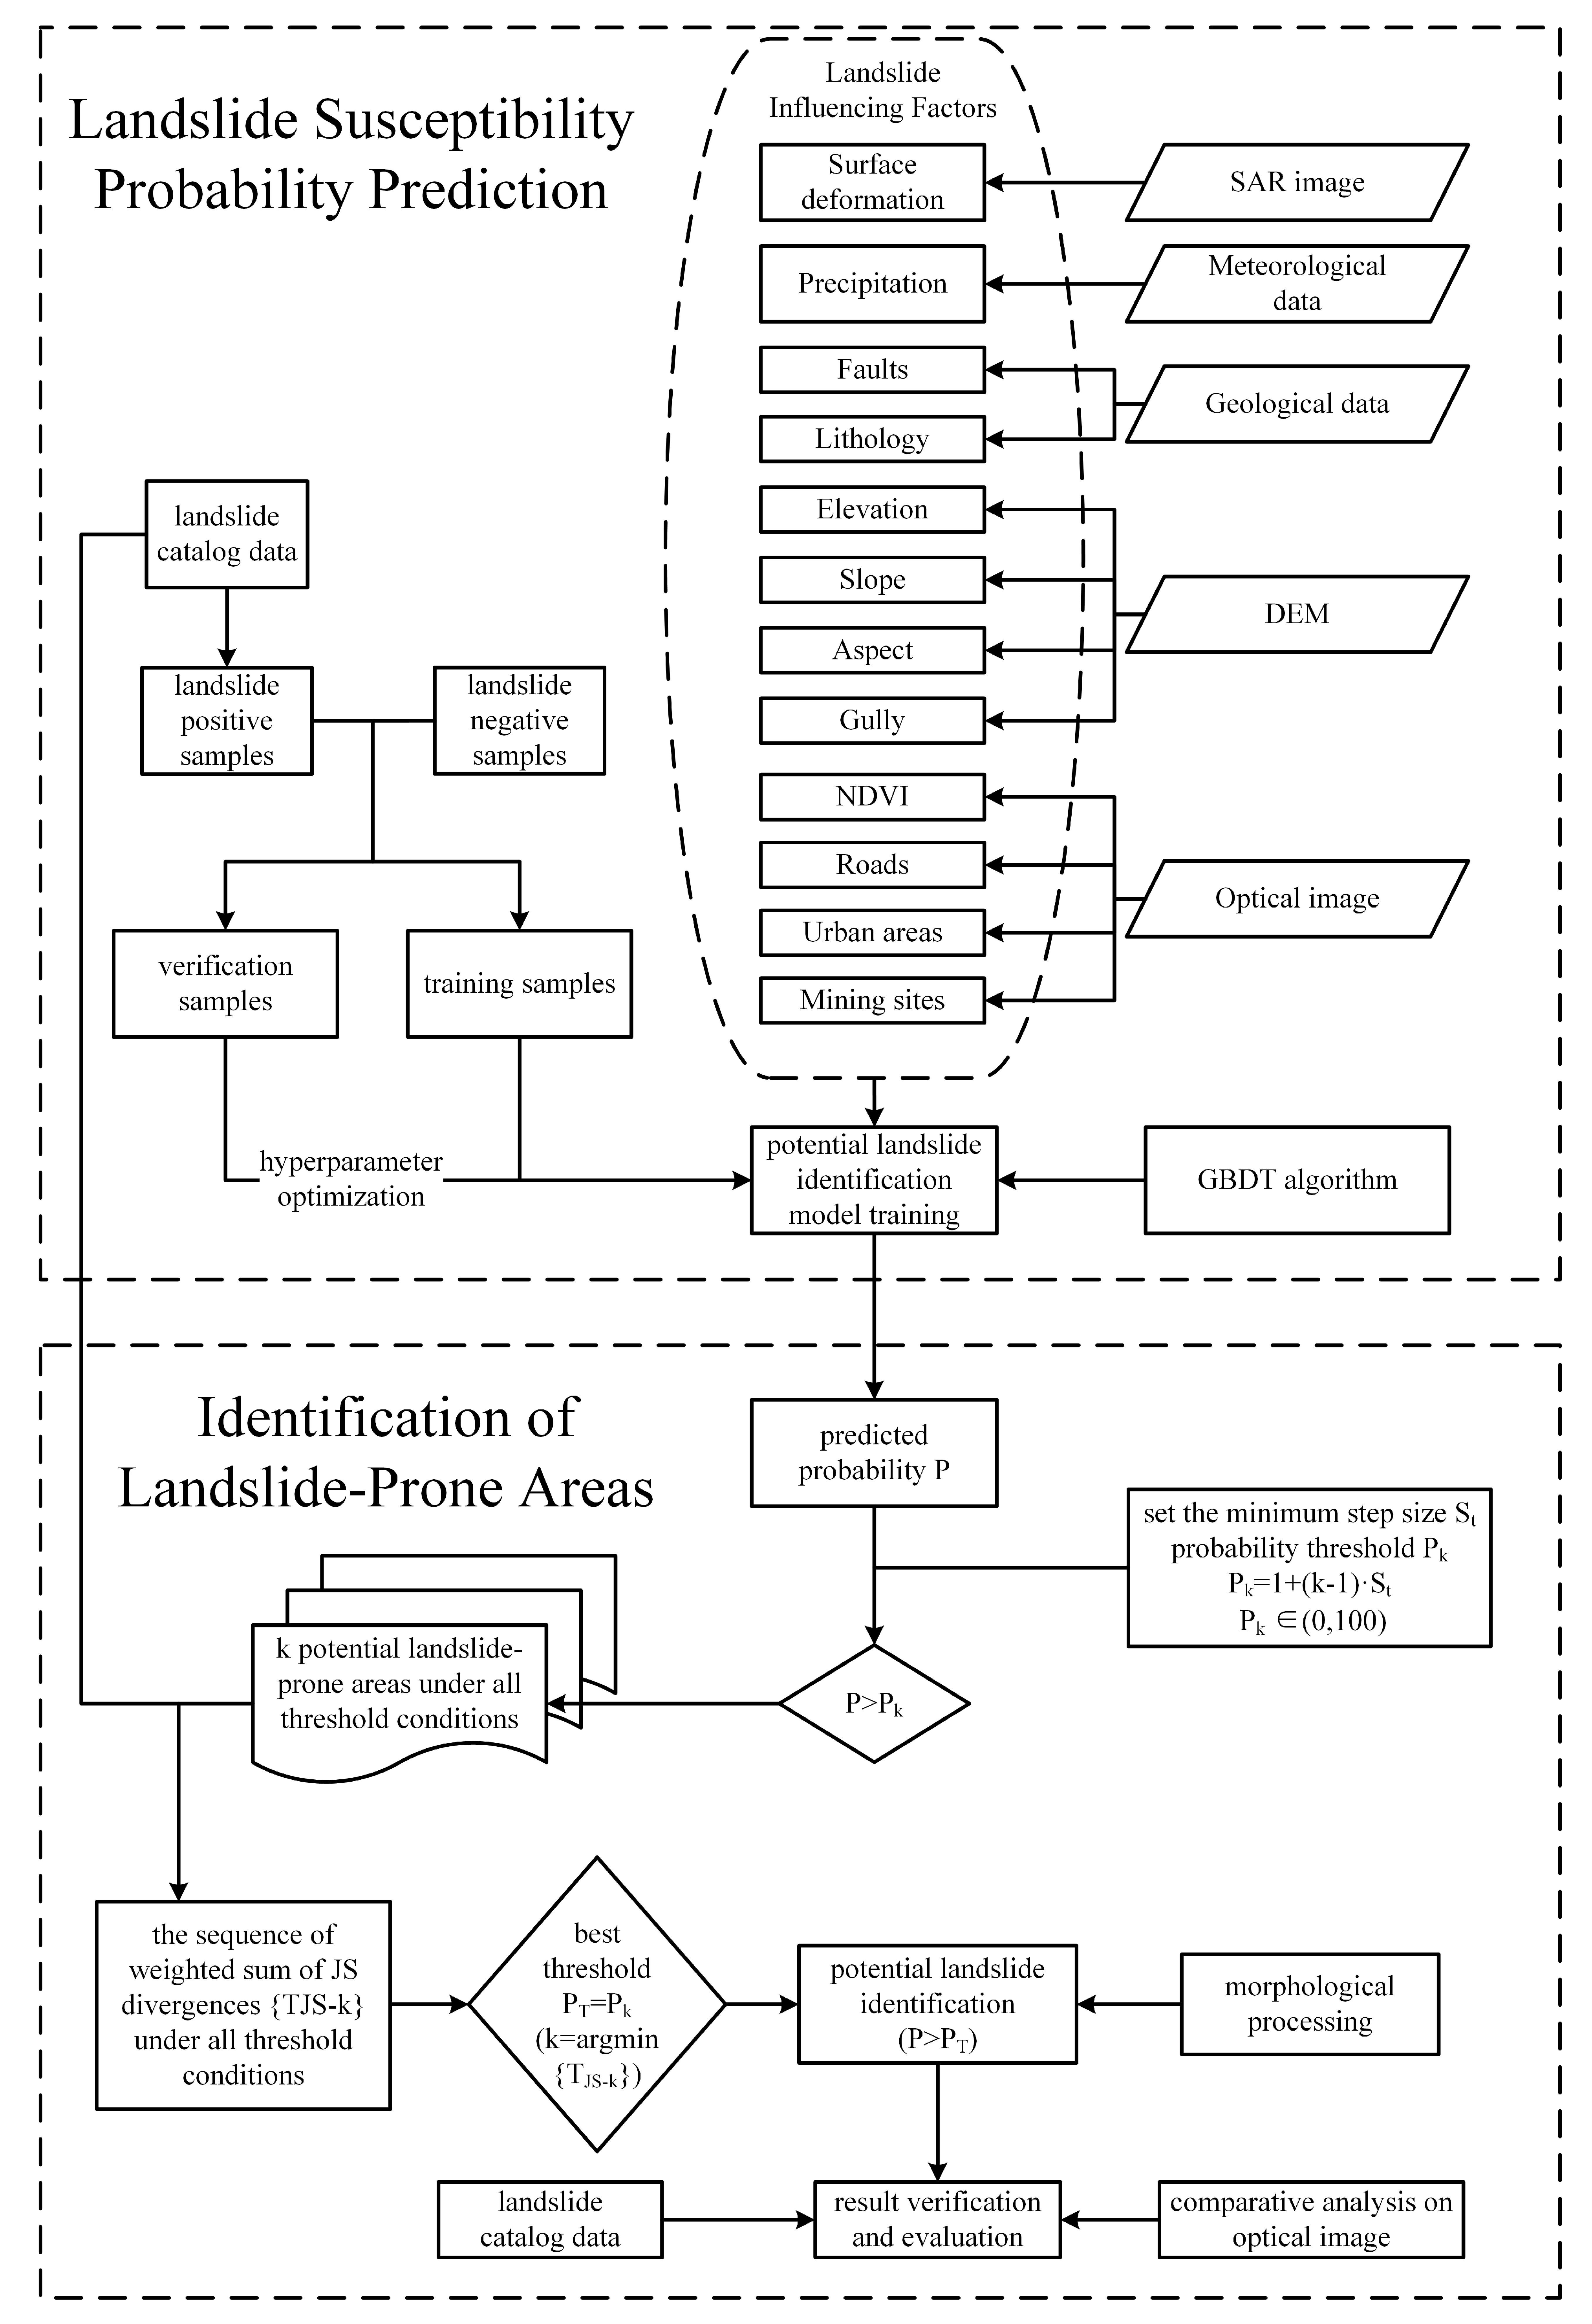
2. Methods
2.1. Landslide-Prone Area Identification Method
The landslide-prone area identification method proposed in this study is based on the concept of landslide susceptibility estimation (LSE). The overall workflow of the proposed method is shown in
Figure 1. The following sections describe the key steps in detail. This method consists of five main steps, as outlined below:
Step 1: Identification of Landslide Influencing Factors. The first step is to identify the factors influencing landslides based on the geological mechanisms in the study area. These factors are then extracted from multi-source data.
Step 2: Model Building and Prediction Probability Estimation. In the second step, landslide positive and negative samples are extracted from landslide catalog data. A comparable number of negative samples are randomly selected, and a landslide susceptibility evaluation method is applied to establish a model. The model is used to estimate the probability that each point belongs to a landslide-prone area (i.e., predicted probability, denoted P).
Step 3: Initial Threshold and JS Divergence Calculation. The initial probability threshold is set as . Points with predicted probabilities are considered potential landslide-prone points. The JS divergence (for the i-th landslide influence factor) between the landslide influence factors of the predicted points and the landslide positive samples is calculated. Based on this, the weighted sum of JS divergences for all landslide influence factors is computed.
Step 4: Threshold Increment and Calculation of the Weighted Sum of JS Divergences. The probability threshold is incrementally increased within the range of (0, 100) with a step size of (). For each threshold , the weighted sum of JS divergences for all landslide influence factors is recalculated, generating a sequence of .
Step 5: Optimal Threshold Determination and Landslide-Prone Area Identification. The threshold corresponding to the minimum value of in the sequence is selected as the optimal prediction probability threshold. Points with a predicted probability are identified as landslide-prone areas. A spatial clustering analysis is then performed to define these areas, while the remaining areas are classified as non-landslide-prone.
2.2. Calculation of the Weighted Sum of JS Divergences and Adaptive Probability Threshold
In typical landslide susceptibility evaluations, prediction probabilities are usually classified using methods such as equal interval classification or quantile-based classification, which divides the study area into categories such as very low susceptibility, low susceptibility, moderate susceptibility, high susceptibility, and very high susceptibility (or very low risk, low risk, moderate risk, high risk, very high risk) [
16]. However, these probability classification methods ignore the specific landslide characteristics of the study area, leading to a certain degree of arbitrariness. The resulting classification of very low and low susceptibility areas can often be neglected during later landslide monitoring and early warning, potentially leading to unforeseen disaster losses. To address these issues, this study adopts a statistical analysis approach to evaluate the statistical similarity between the landslide influence factors of potential landslide-prone points and landslide positive samples. JS divergence is an excellent measure of the similarity between probability distributions [
23]. The probability threshold is determined based on the highest statistical similarity assessed by JS divergence. A criterion for calculating the JS divergence between the landslide influence factors of the potential landslide-prone points and landslide positive samples is constructed. The optimal prediction probability threshold is then determined by minimizing the weighted sum of JS divergences for all landslide influence factors. Below, we provide a detailed explanation of the calculation method for the JS divergence and its weighted sum.
Let there be
N landslide influencing factors (for
), each with a weight
, and the probability density of each factor in the landslide positive samples denoted
(the histogram distribution of each factor in the positive samples). When the predicted probability threshold is
, the probability density of each factor in the potential landslide-prone points is denoted as
. For the
i-th landslide influencing factor
, the JS divergence between the landslide positive samples and the potential landslide-prone points is given by:
where
is the average distribution, and
represents the Kullback–Leibler divergence.
The KL divergence
of the
i-th landslide influencing factor
between the landslide positive samples and the average distribution
M is calculated as:
Similarly, the KL divergence
for
between the potential landslide-prone points and
M is:
Then, when the prediction probability threshold is
, the weighted sum of JS divergences for all influencing factors is denoted as
, and the calculation method is as follows:
When the prediction probability threshold traverses the entire probability range, the sequence of the weighted sum of JS divergences for all influencing factors, denoted as is obtained. Finally, the prediction probability threshold , which corresponds to the minimum value of , is taken as the threshold for dividing landslide-prone points from non-landslide-prone points.
In the above calculation, the weight of each landslide influencing factor, denoted as
, represents the contribution of a landslide influencing factor to the landslide. This weight is determined in three different scenarios. First, if all landslide influencing factors contribute equally to the landslide, then the weights of all factors are the same, i.e.,
. Second, if a landslide susceptibility evaluation algorithm (such as random forests and gradient boosting decision trees) estimates the prediction probabilities and provides the importance values of each landslide influencing factor, then the importance value of each factor is used as its weight. Third, if the landslide susceptibility evaluation algorithm cannot provide the importance values of the factors, experts can rank the importance of the landslide influencing factors based on the landslide mechanisms in the study area. On this basis, the importance of each factor is arranged in descending order and quantitatively assigned, i.e.,
. The weight of the
i-th factor is then calculated as follows:
where
is the quantified value of the
i-th factor’s importance after descending order arrangement.
2.3. Evaluation of Identification Results
The evaluation of the landslide-prone area identification results in this study is conducted from two aspects. First, the accuracy of the landslide susceptibility evaluation model is assessed using the Area Under the Receiver Operating Characteristic Curve (AUC). Second, based on prior landslide positive samples and subsequent landslide events as references, three new indicators are constructed to assessed the accuracy of the identified landslide-prone areas and their practical value for preventing future landslide disasters. These indicators are total accuracy (TA), post-occurrence rate (POR), and late omission rate (LOR).
TA is the ratio of the number of landslide positive samples falling within the landslide-prone area to the total number of landslide positive samples, i.e.,
where
is the number of landslide positive samples used in the identification of landslide-prone areas and
is the number of landslide positive samples that fall within the identified landslide-prone areas.
; the larger the TA value, the more reasonable the selection of the prediction probability threshold for dividing landslide-prone areas, and the more accurate the identified landslide-prone areas.
- (2)
Post-occurrence rate (POR):
POR is the ratio of the number of landslide events occurring within the landslide-prone area during a specific time period after the identification of landslide-prone areas to the total number of landslide events occurring in the entire study area during that period, i.e.,
where
is the number of landslide events occurring within the landslide-prone area during the specified period after identification and
L is the total number of landslide events occurring in the entire study area during that period.
; the larger the POR value, the greater the probability of landslides occurring in the identified landslide-prone areas in the future, indicating a greater need for landslide monitoring and early warning in these areas.
- (3)
Late omission rate (LOR):
LOR is the ratio of the number of landslide events that did not occur within the landslide-prone area during a specific time period after the identification of landslide-prone areas to the total number of landslide events occurring in the entire study area during that period, i.e.,
where
represents the number of landslide events that did not occur within the landslide-prone area during the specified period after identification. Clearly,
.
Since landslides are geological events that are influenced by geological conditions, natural environments, and human activities, both LOR and POR vary over time. When LOR increases and POR decreases, it indicates that the characteristics of landslide activity in the study area have started to change significantly. The practical value of the landslide-prone areas identified in the early stages for landslide disaster warning diminishes, requiring re-evaluation of the landslide-prone areas in the study area.
Compared to the AUC of the landslide susceptibility evaluation model, TA, POR, and LOR better reflect the practical value of the identified landslide-prone areas for landslide investigation, monitoring, and early warning. Notably, POR most accurately reflects the risk of landslides occurring within these areas. Furthermore, a higher POR value reflects the necessity of prioritizing landslide investigation, monitoring, and early warning for these landslide-prone areas.
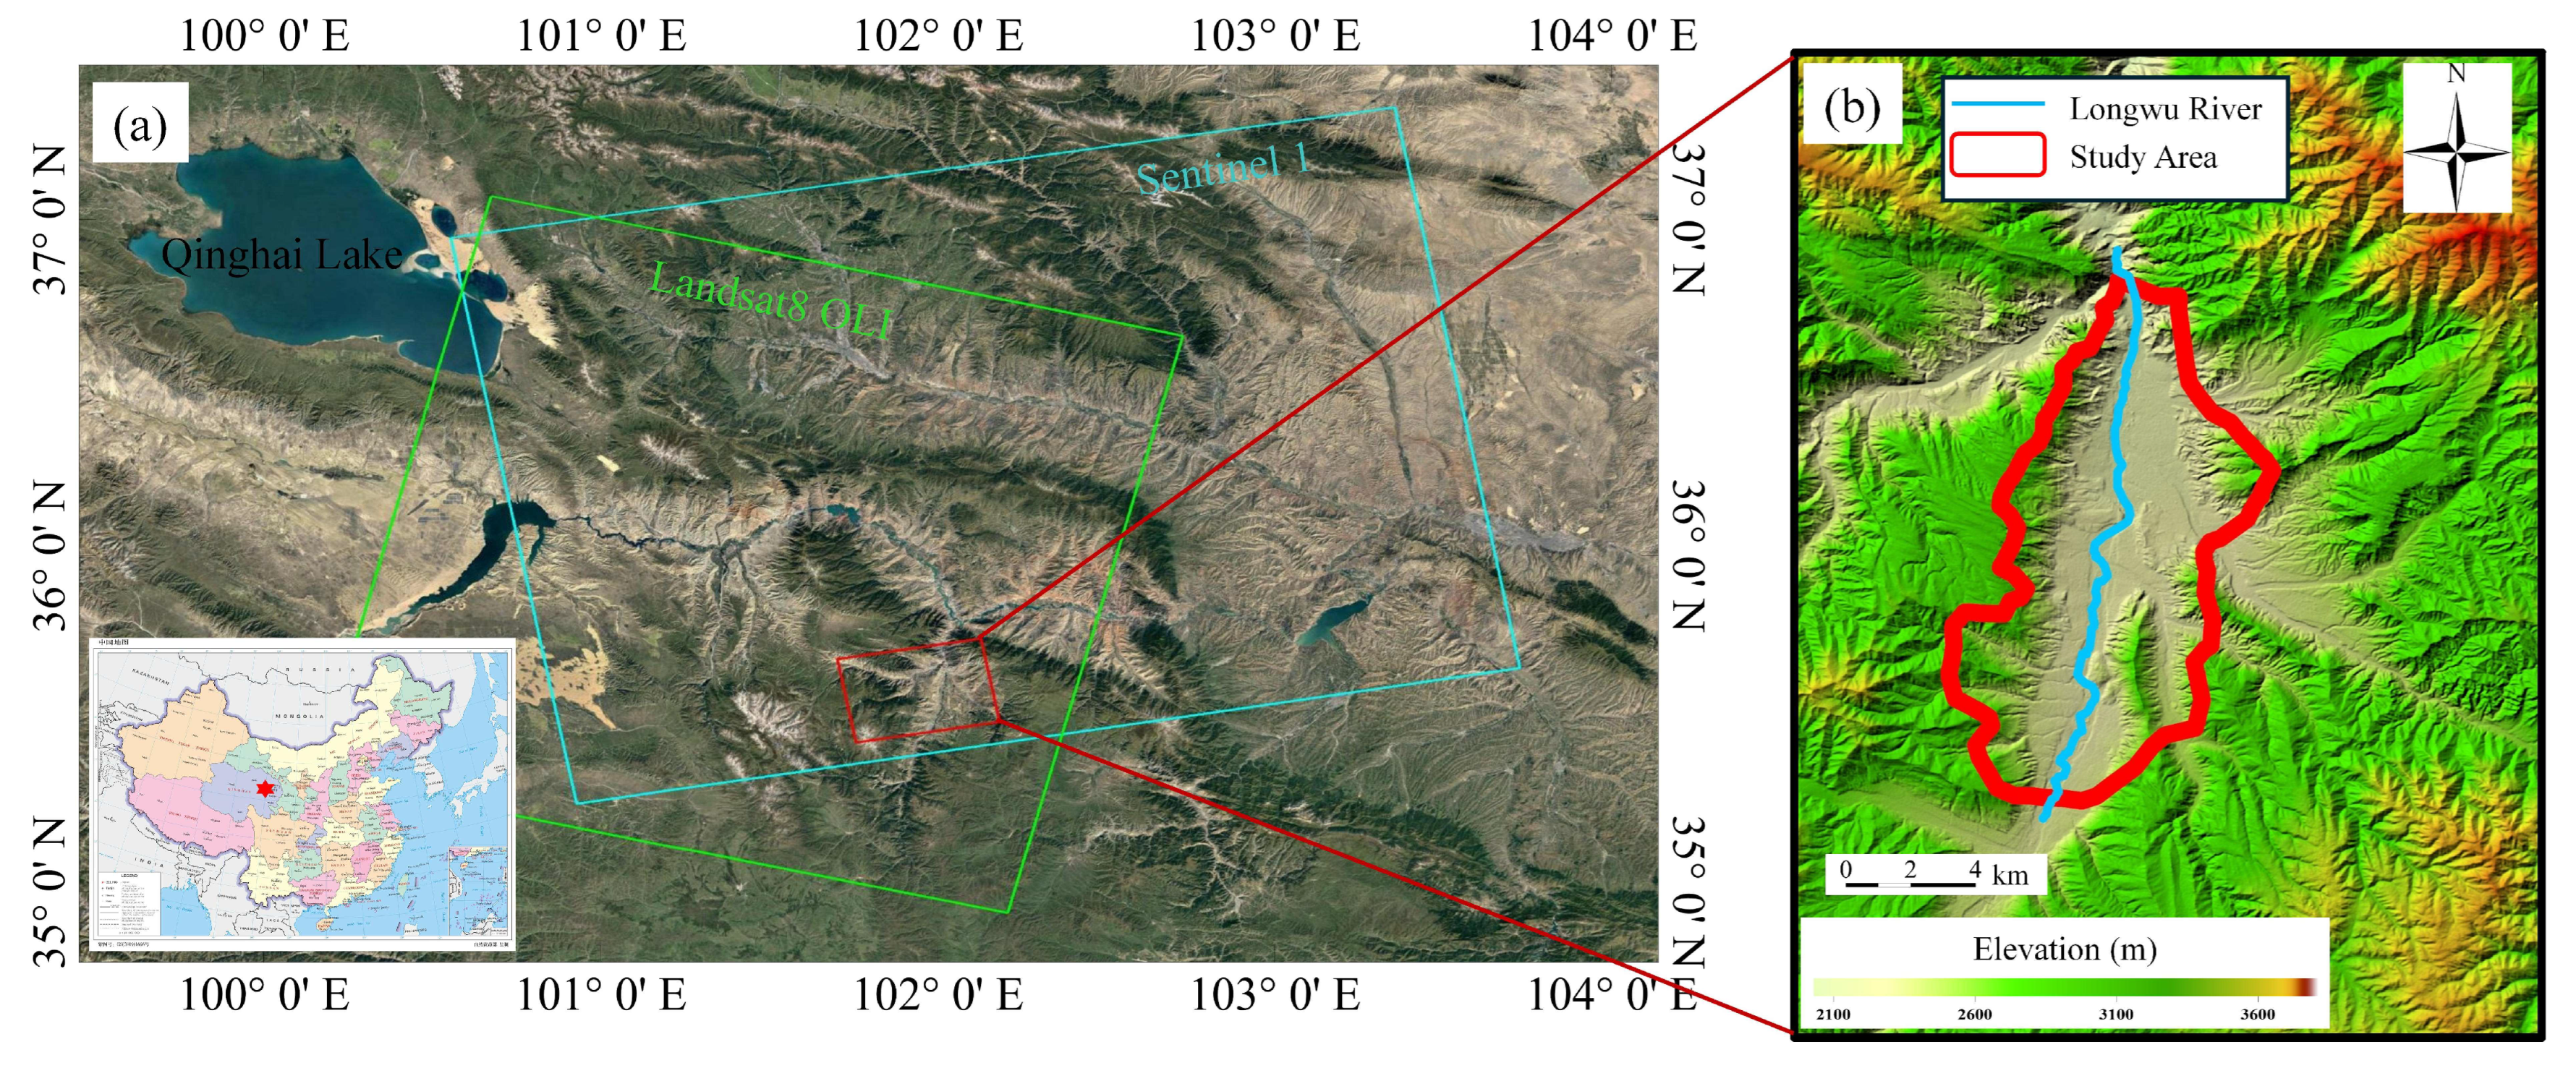
3. Study Area and Experimental Data
To validate the effectiveness of the method proposed in this study, experiments were conducted using the northern area of the Tongren region in the Longwu River Basin, Qinghai Province. This area was selected as a case study owing to its typical loess geological conditions, high landslide frequency, and accessible multi-source data including InSAR monitoring and geological maps. These attributes collectively establish this region as an ideal site for assessing landslide-prone area identification methods. Based on multi-source data collected between February 2016 and June 2017, the analysis was conducted on a pixel-by-pixel basis. Landslides occurring prior to June 2017 in the landslide catalog of the study area were used as positive samples. A gradient boosting decision tree (GBDT) algorithm was applied to build a landslide susceptibility estimation model to estimate prediction probabilities, and factor importance rankings of the influencing factors were obtained. Subsequently, the adaptive probability threshold method was applied to determine the probability threshold and identify the landslide-prone areas during this period. For the identification results, the landslide positive samples from February 2016 to June 2017 were used as a reference to evaluate the total accuracy of the identified landslide-prone areas. Additionally, landslide events between June 2017 to November 2022 were utilized to evaluate the POR and LOR of the landslide-prone areas.
3.1. Study Area
The study area is located in the southeastern part of Qinghai Province (as shown in
Figure 2), with the Longwu River running through the area in a northeast–southwest direction. The central part of the study area is a river valley, with mountains on both the eastern and western sides. The highest elevation is 3017 m, and the lowest elevation is 2184 m (as shown in
Figure 2). The vegetation coverage in the study area is relatively low, and the climate is characterized as a continental plateau, low-temperature semi-arid climate. Precipitation is concentrated from April to September, with an average annual rainfall of 568.9 mm.
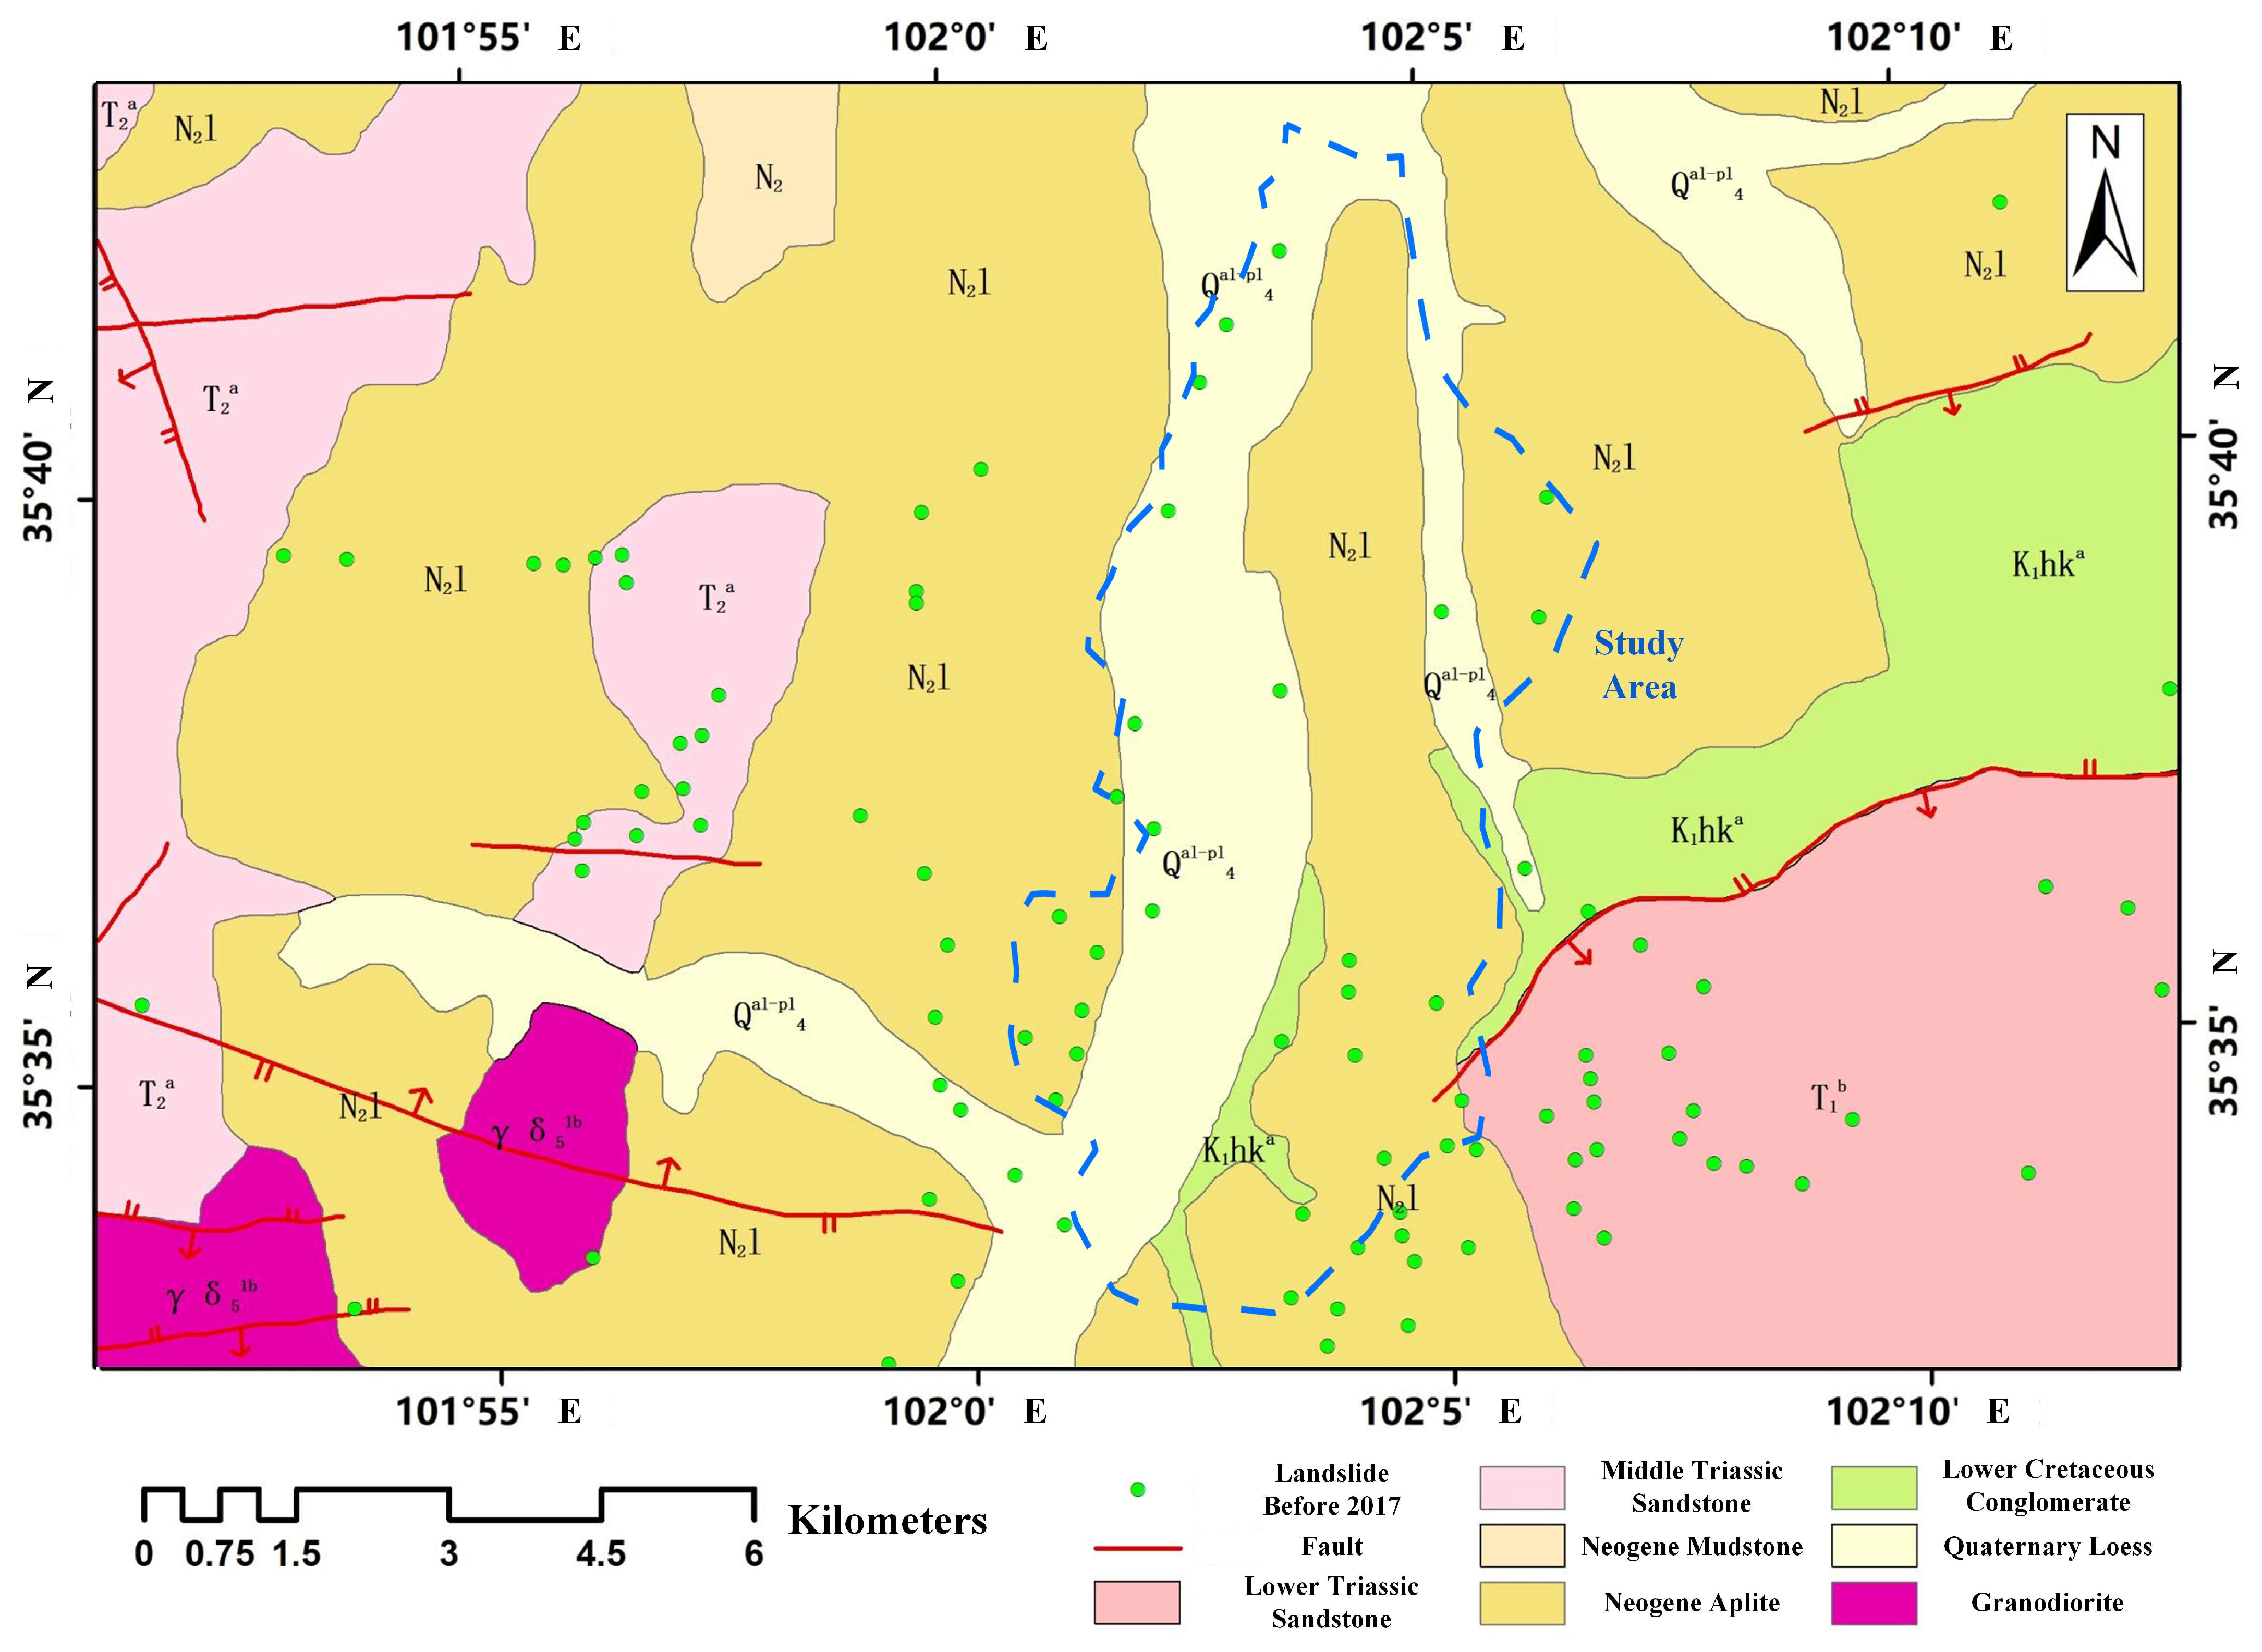
From a tectonic perspective, the faults and folds in Tongren County are well developed, and the study area is located close to these faults. The stratigraphy of the study area is primarily composed of Quaternary loess and Neogene fine-grained rocks, with local exposures of Lower Cretaceous conglomerates and Lower Triassic sandstones. The loess in the study area, of aeolian origin, is composed of silty unsaturated soil. Its distinct characteristics—including large pores, weak cementation, and high water sensitivity [
24]—predispose it to collapse, dissolution, and sliding when exposed to water [
25]. The unique natural geography and geological conditions have led to the development of landslides in the study area. According to the landslide catalog data, by June 2017, a total of 27 landslides had occurred in the study area (as shown in
Figure 3). Based on the landslide catalog and research by Sun Hao et al. [
26], the landslides in the study area are predominantly translational landslides, with landslide materials primarily consisting of loess, gravel soil, and mudstone. The development of landslides in the study area is mainly influenced by tectonic movements, river erosion, and human engineering activities [
26].
According to the landslide catalog data, the pre-failure slope angles of the landslides in the study area often exceed 20°. Furthermore, the continental plateau semi-arid climate and sparse vegetation result in limited inhibitory effects of vegetation on landslide mitigation here.
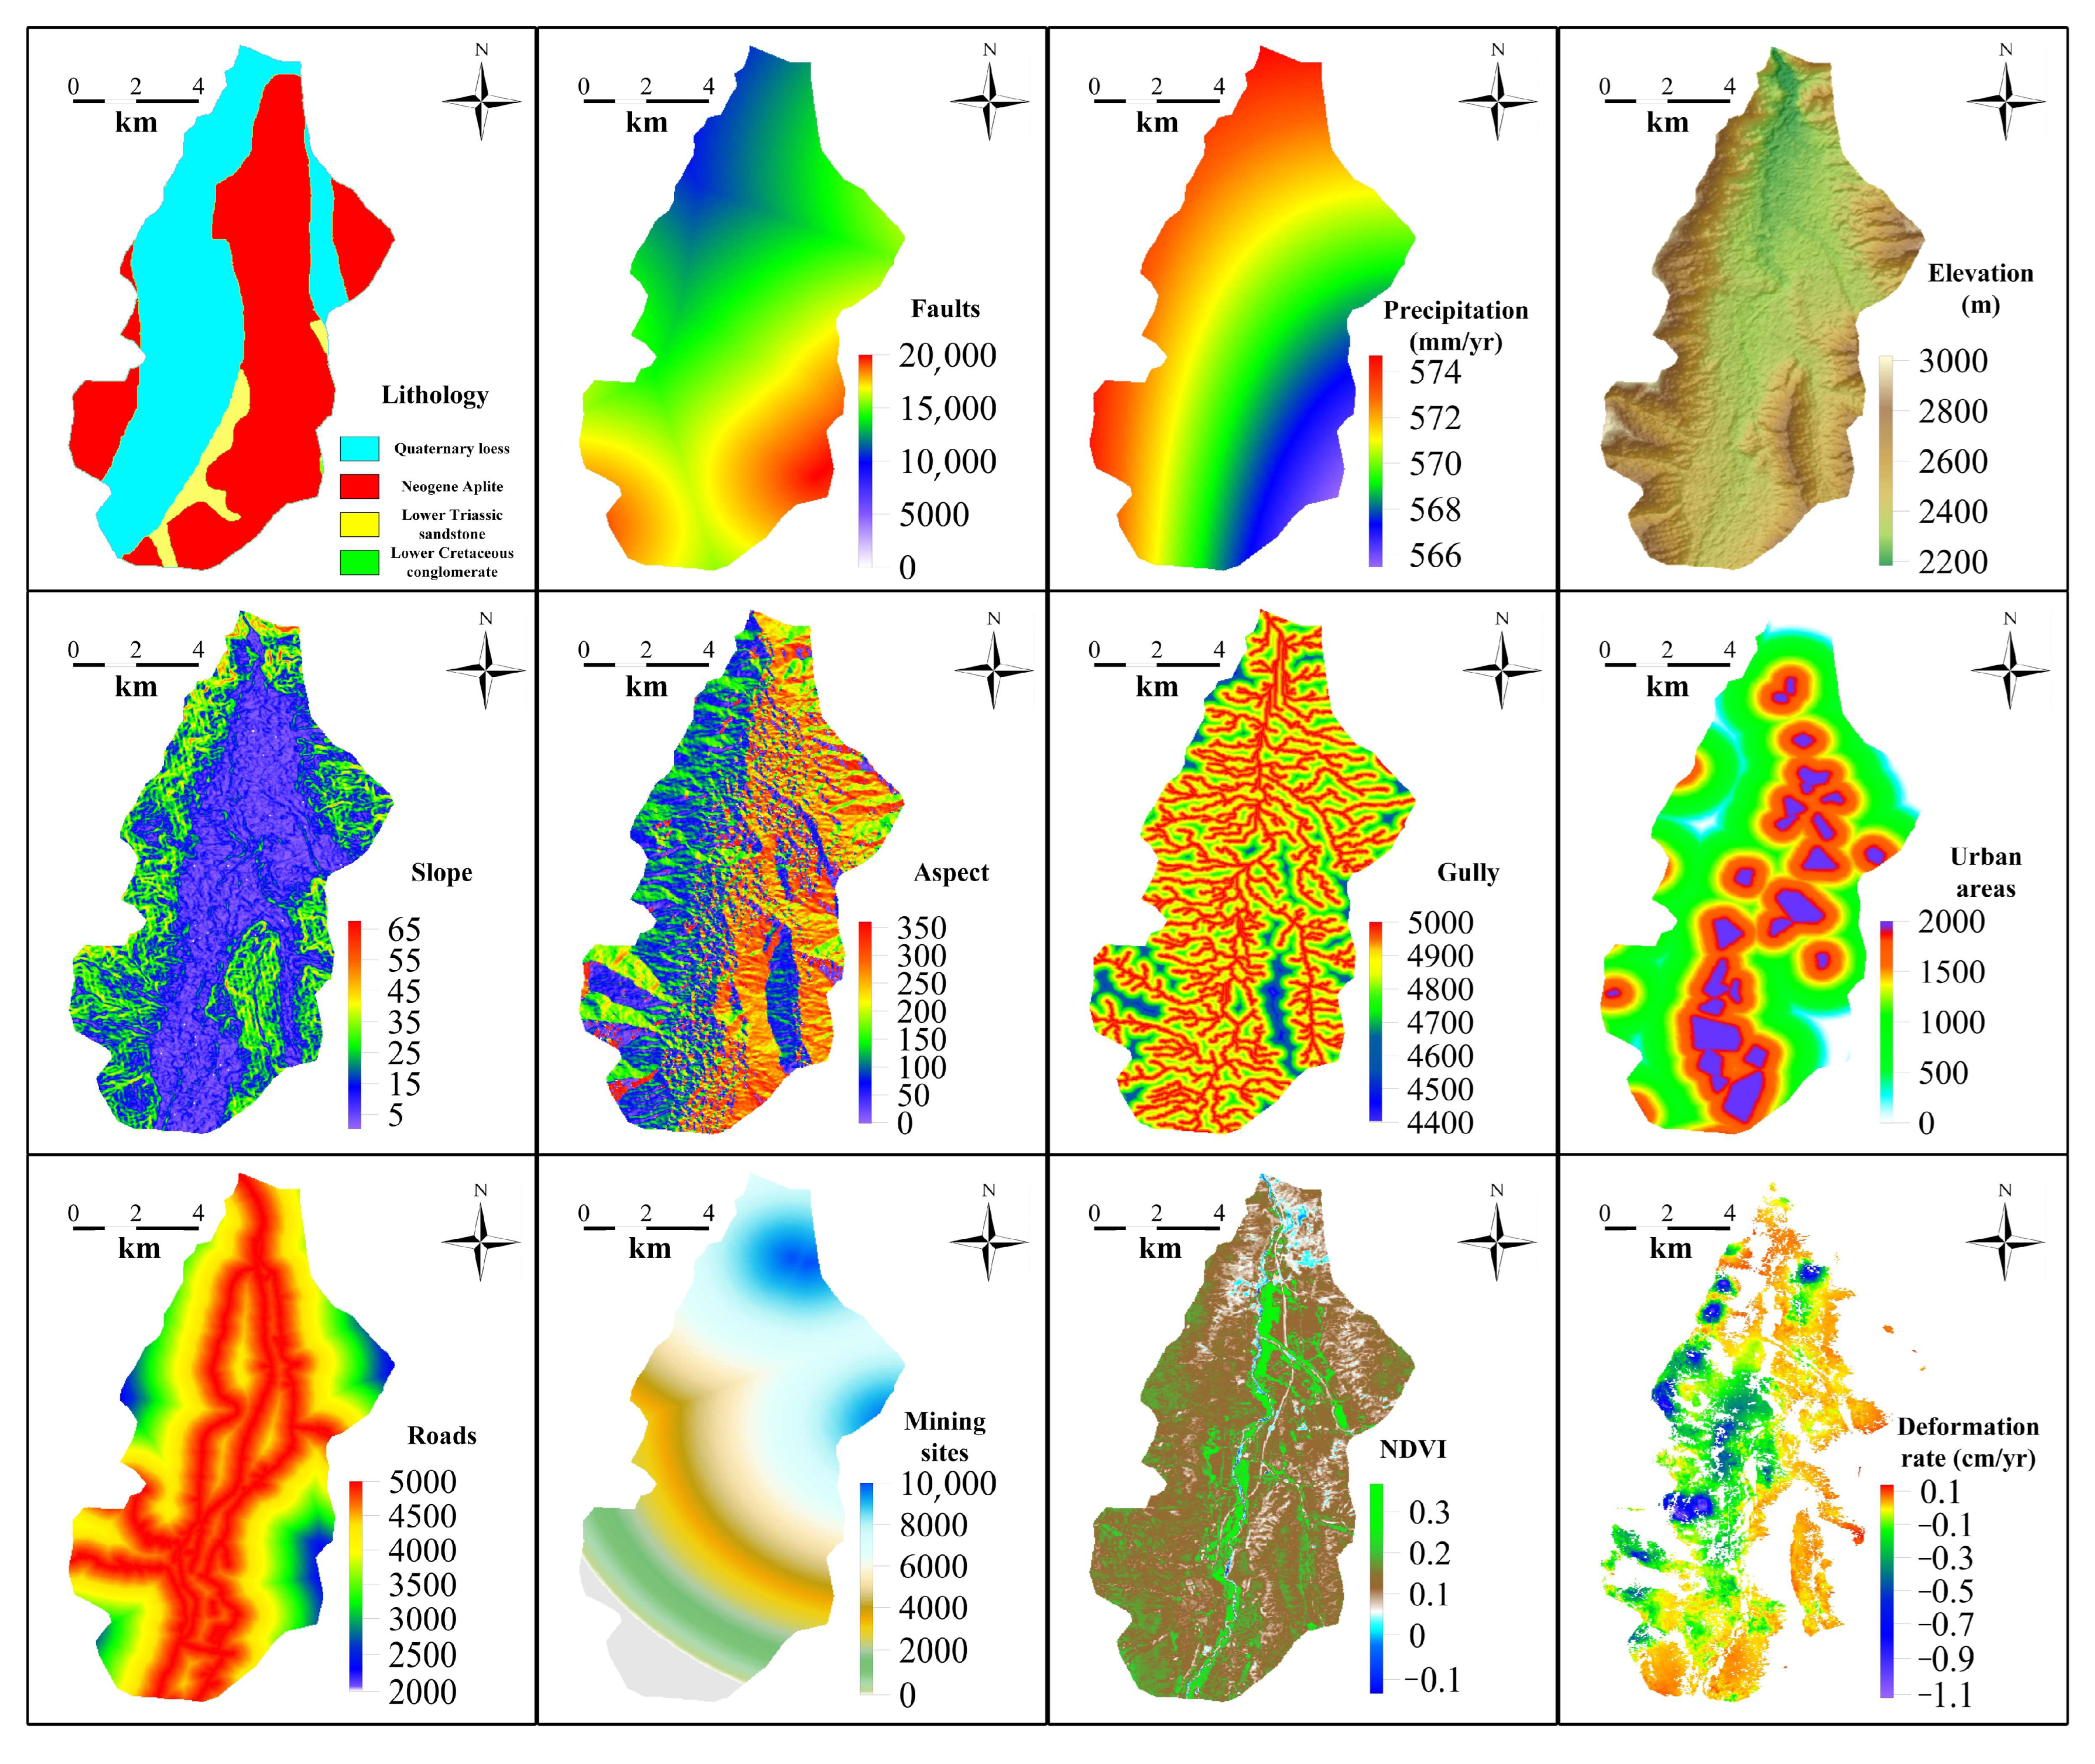
3.2. Extraction of Landslide Influencing Factors
As described in
Section 2.1, landslides in the study area are controlled by multiple factors. Based on prior studies [
24,
25,
26] and comprehensively considering geological conditions, this study selects eight major types of factors: lithology, tectonics, precipitation, topography, river erosion, human activities, vegetation coverage, and mechanical properties. These factors are further subdivided into 12 categories (as shown in
Table 1), which were extracted from the relevant data before June 2017. The results of the factor extraction are shown in
Figure 4. Subsequently, variance inflation factor (VIF) analysis was conducted to assess model reliability, revealing that all computed VIF values remained below 3.5. This finding confirms the absence of significant multicollinearity among the selected factors, thereby validating their independent explanatory capacities for subsequent susceptibility modeling.
For vegetation coverage, this study uses three Landsat 8 multispectral images from 17 April 2016, 8 September 2016, and 14 January 2017 to calculate the Normalized Difference Vegetation Index (NDVI) for each of the three time periods. The average NDVI from value is then taken to characterize the vegetation coverage of the study area. Compared to a single-period NDVI, the multi-temporal NDVI average provides a more comprehensive and accurate representation of the vegetation coverage throughout the study period.
Lithology, faults, valleys, buildings, roads, and mining sites are all qualitative factors that need to be quantified. Lithology was quantified by assigning distinct numerical values to different rock types. For faults, valleys, buildings, roads, and mining sites, the quantification was measured by the Euclidean distance from each pixel to these features. Given the spatial dependency of landslide susceptibility on proximity to these features, this study refines the quantification of these factors as follows:
where
is the optimized factor quantification value,
D is the actual Euclidean distance from the pixel to the fault, valley, building, road, or mining site, and
is the maximum influence distance of the fault, valley, building, road, or mining site.
is the geological and geomorphological unit of the pixel (faults and mining sites do not consider the geological and geomorphological unit), and
is the geological and geomorphological unit of the valley, building, or road, where
indicates that the pixel is not in the same geological and geomorphological unit as the valley, building, or road. For faults, based on the study by Guo et al. [
27],
is set to 20 km, meaning that points more than 20 km away from the fault are not considered in the fault factor. For valleys,
is 5 km, and the pixel must be located in the watershed of the valley. For buildings,
is 2 km, and the pixel must be on the same slope as the building. For roads,
is 5 km, and the pixel must be on the same slope as the road. For mining sites,
is 10 km.
It is important to note that the mechanical instability of slope geotechnical materials is the fundamental cause of landslides. However, obtaining the mechanical parameters of the slope geotechnical materials at every point in the study area remains impractical. Deformation, on the other hand, can be considered an indicator of the mechanical instability of slope geotechnical materials. Unlike traditional static factors (such as lithology and slope), InSAR deformation data can reveal the spatiotemporal evolution of surface deformation, providing insights into the mechanical properties of slope geotechnical materials. Therefore, in this study, deformation is explicitly included as a landslide influencing factor to improve the accuracy of landslide-prone area identification. Given the capability of Interferometric Synthetic Aperture Radar (InSAR) to detect subtle surface deformations over large areas [
28], this study uses 21 ascending-track SAR images of the study area acquired by the Sentinel 1-A satellite between 6 February 2016, to 24 June 2017. The distributed scatterer (DS) time-series InSAR method [
29] was employed to extract the annual average surface deformation rate of the study area. The DS-InSAR methodology was prioritized based on the study area’s geomorphological characteristics, which exhibit significant topographic relief and partial vegetation coverage coupled with insufficient persistent scatterers (PSs)—conditions under which conventional PS-InSAR implementation would yield unreliable deformation measurements. Furthermore, to maintain dimensional consistency with other landslide influencing factors in susceptibility modeling, the adopted deformation parameter represents spatially averaged deformation rates throughout the monitoring period rather than temporal deformation sequences.
4. Results
Based on the landslide catalog data from February 2016 to June 2017 in Tongren City, a total of 24 landslides occurred in the study area (as shown in
Figure 3). Using the 24 landslide points as centers, the landslide boundaries were drawn with reference to Google Earth images, generating 1299 landslide sample points (pixels). Additionally, 3638 points were randomly selected from areas outside the landslide catalog region with low slopes (below 15°) or low deformation rates (below 0.5 cm/year) as non-landslide sample points (i.e., negative samples).
First, the samples were randomly divided into training, validation, and test sets in a 60%/20%/20% ratio to ensure balanced representation of positive and negative samples across all sets. Subsequently, hyperparameters such as learning rate, number of trees, and maximum split depth were optimized using grid search with the validation set. The results showed that the optimal combination of hyperparameters was a learning rate of 0.05, 150 trees, and a maximum split depth of 7, which improved the validation accuracy from 95.95% to 96.66%.
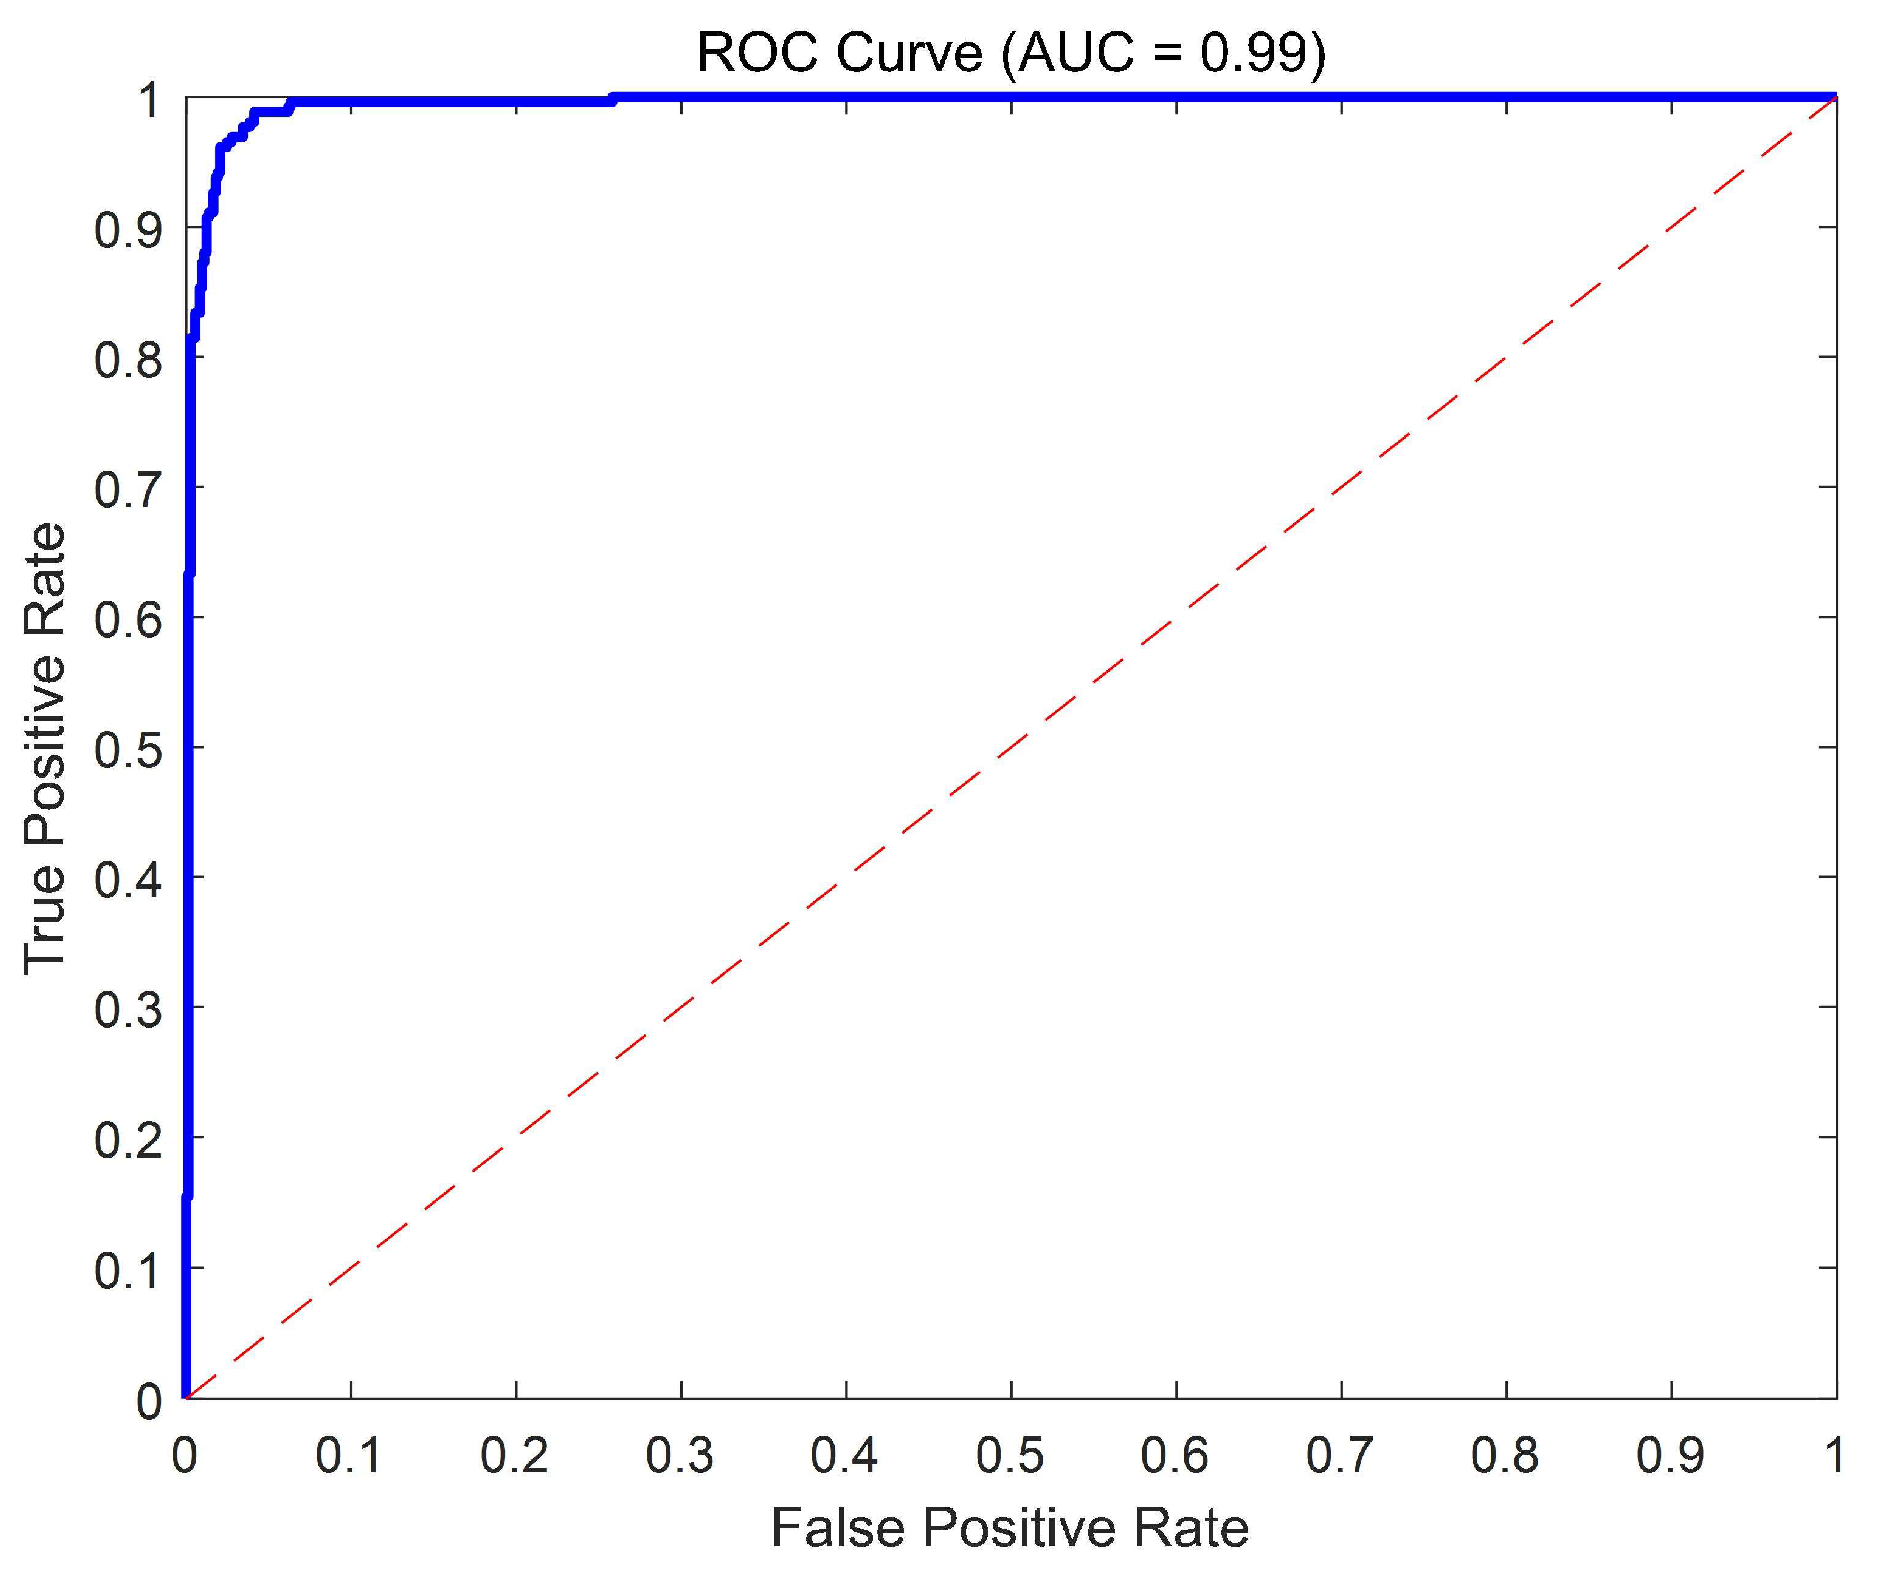
On the test set, the final model achieved a classification accuracy of 97.4%, an F1-score of 0.95, and an AUC value of 0.99 as shown in the ROC curve (
Figure 5), indicating strong classification performance. The confusion matrix (
Table 2) showed that the model exhibited stable performance in both landslide and non-landslide classifications, with low false-positive and false-negative rates, further verifying its reliability.
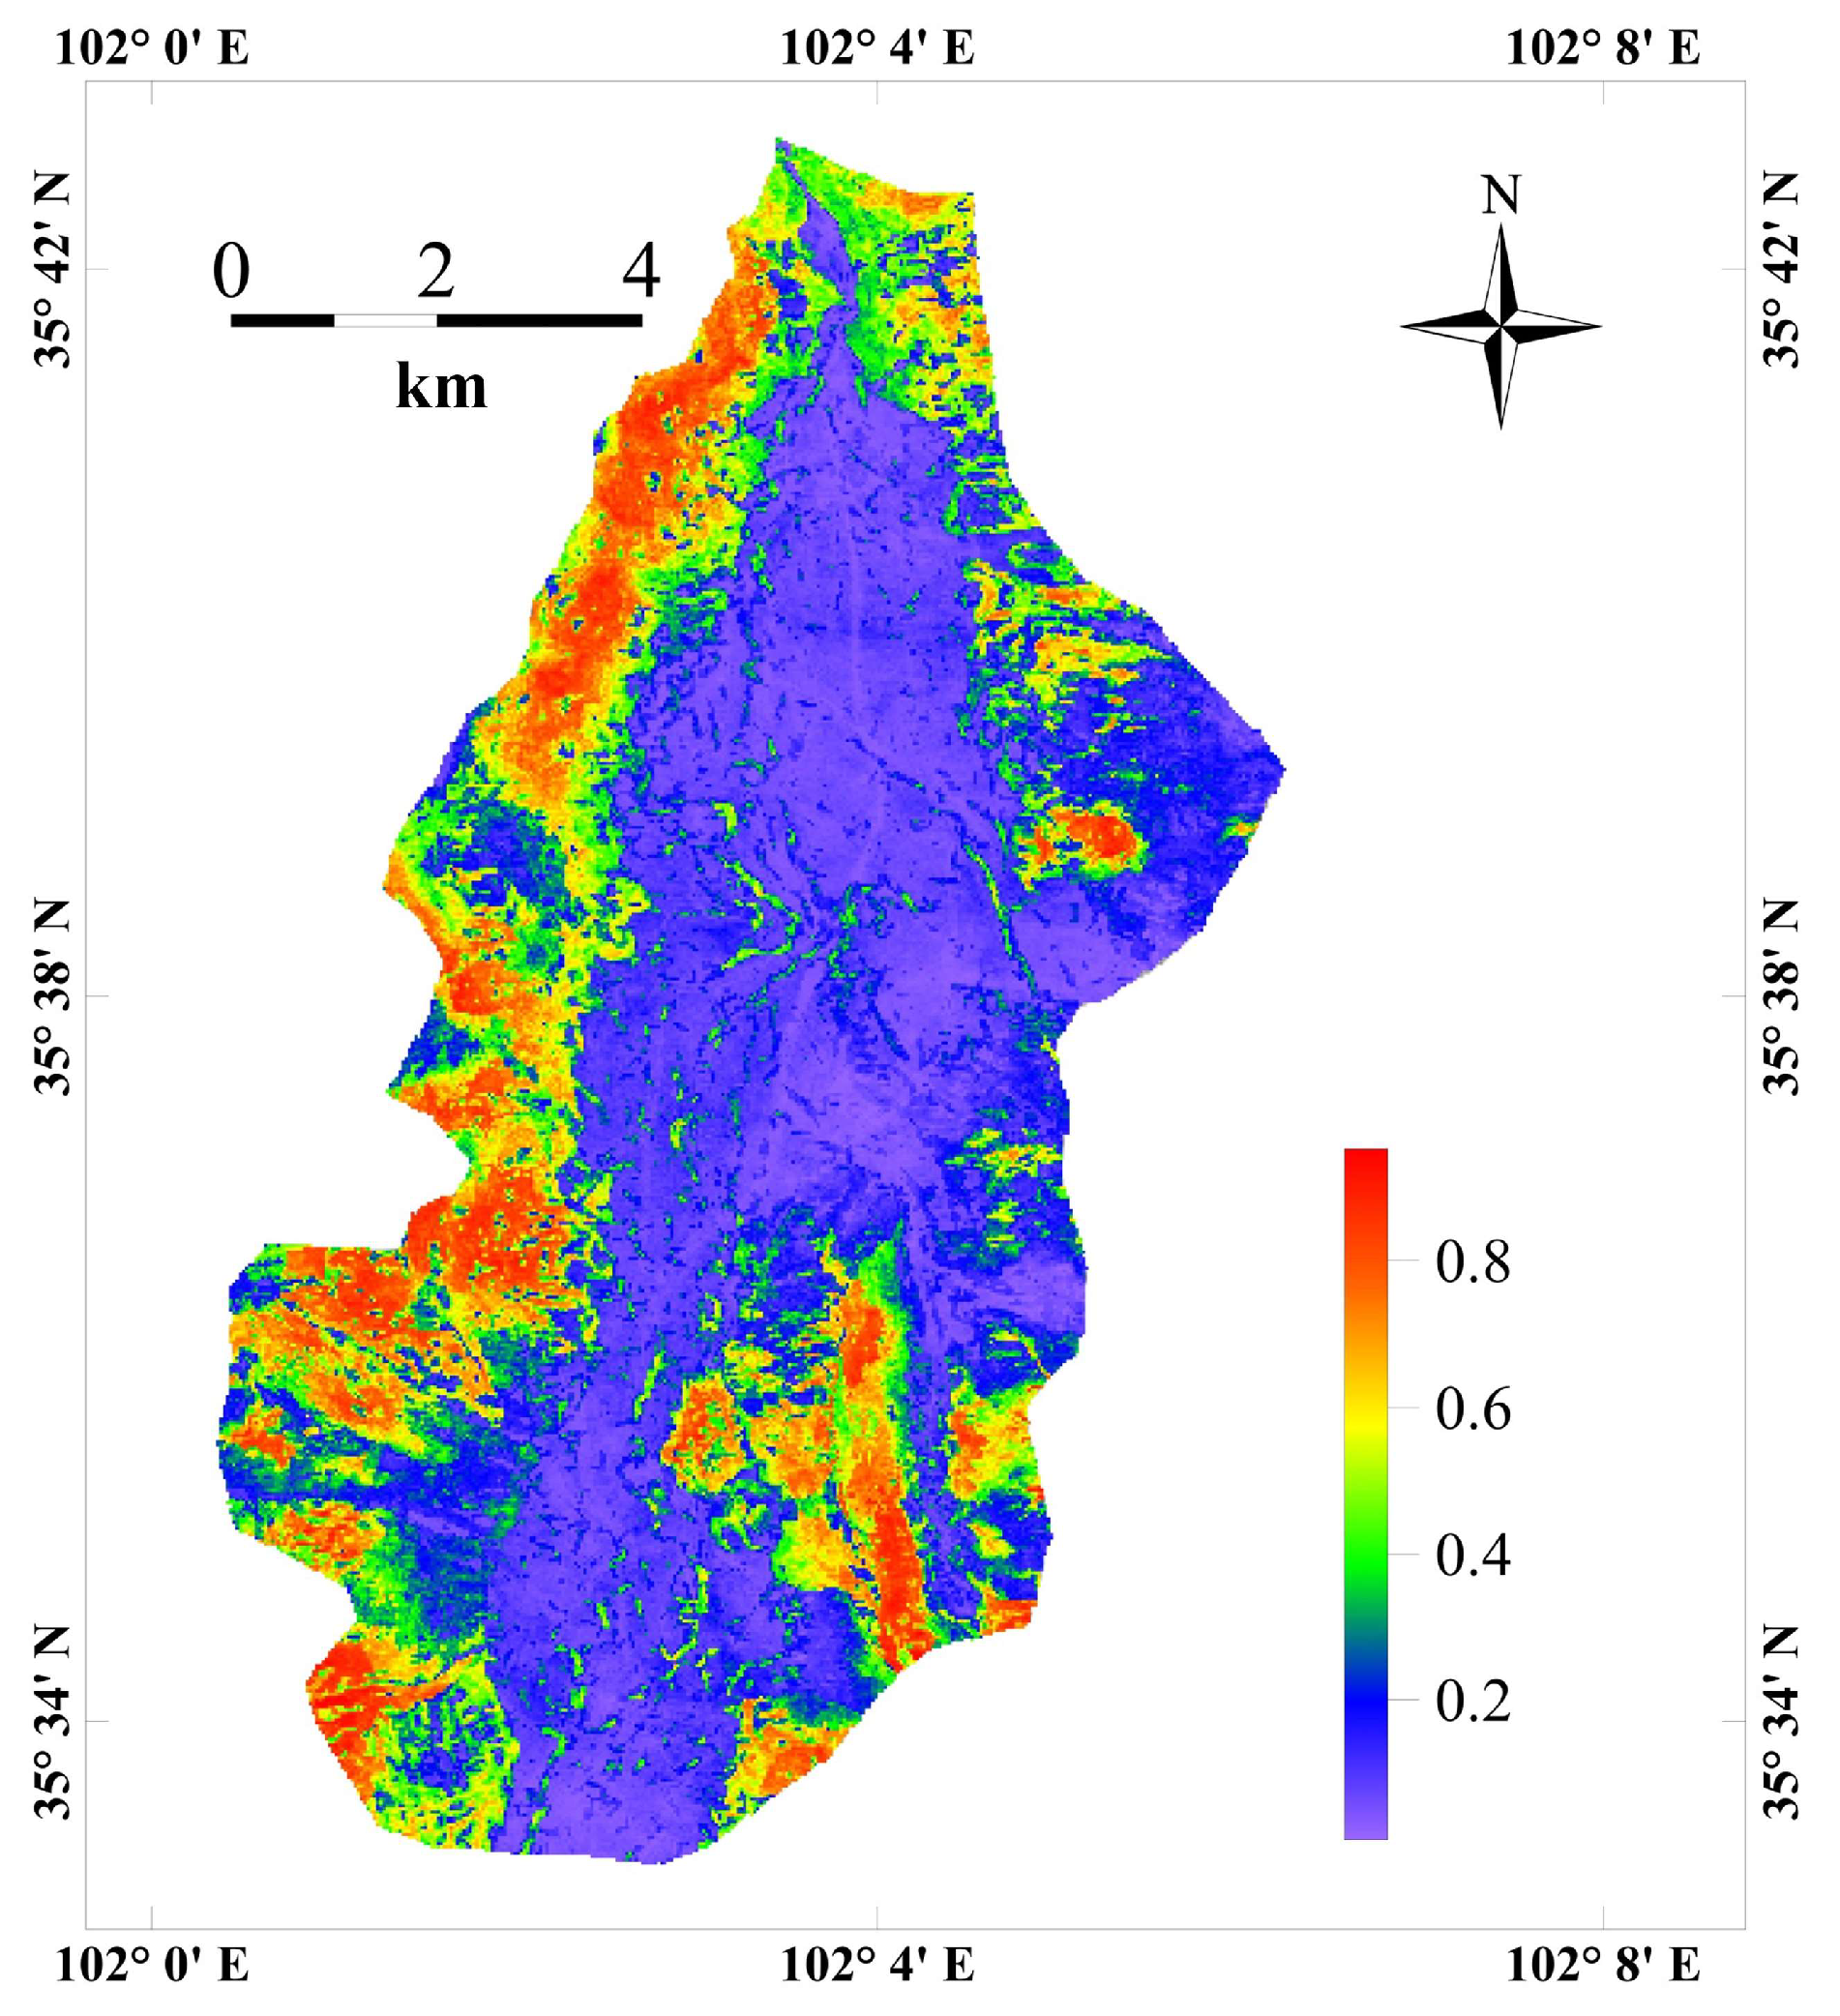
After training the classification model, the landslide susceptibility (i.e., predicted probability) for each point in the study area and the importance values of each factor were obtained, as shown in
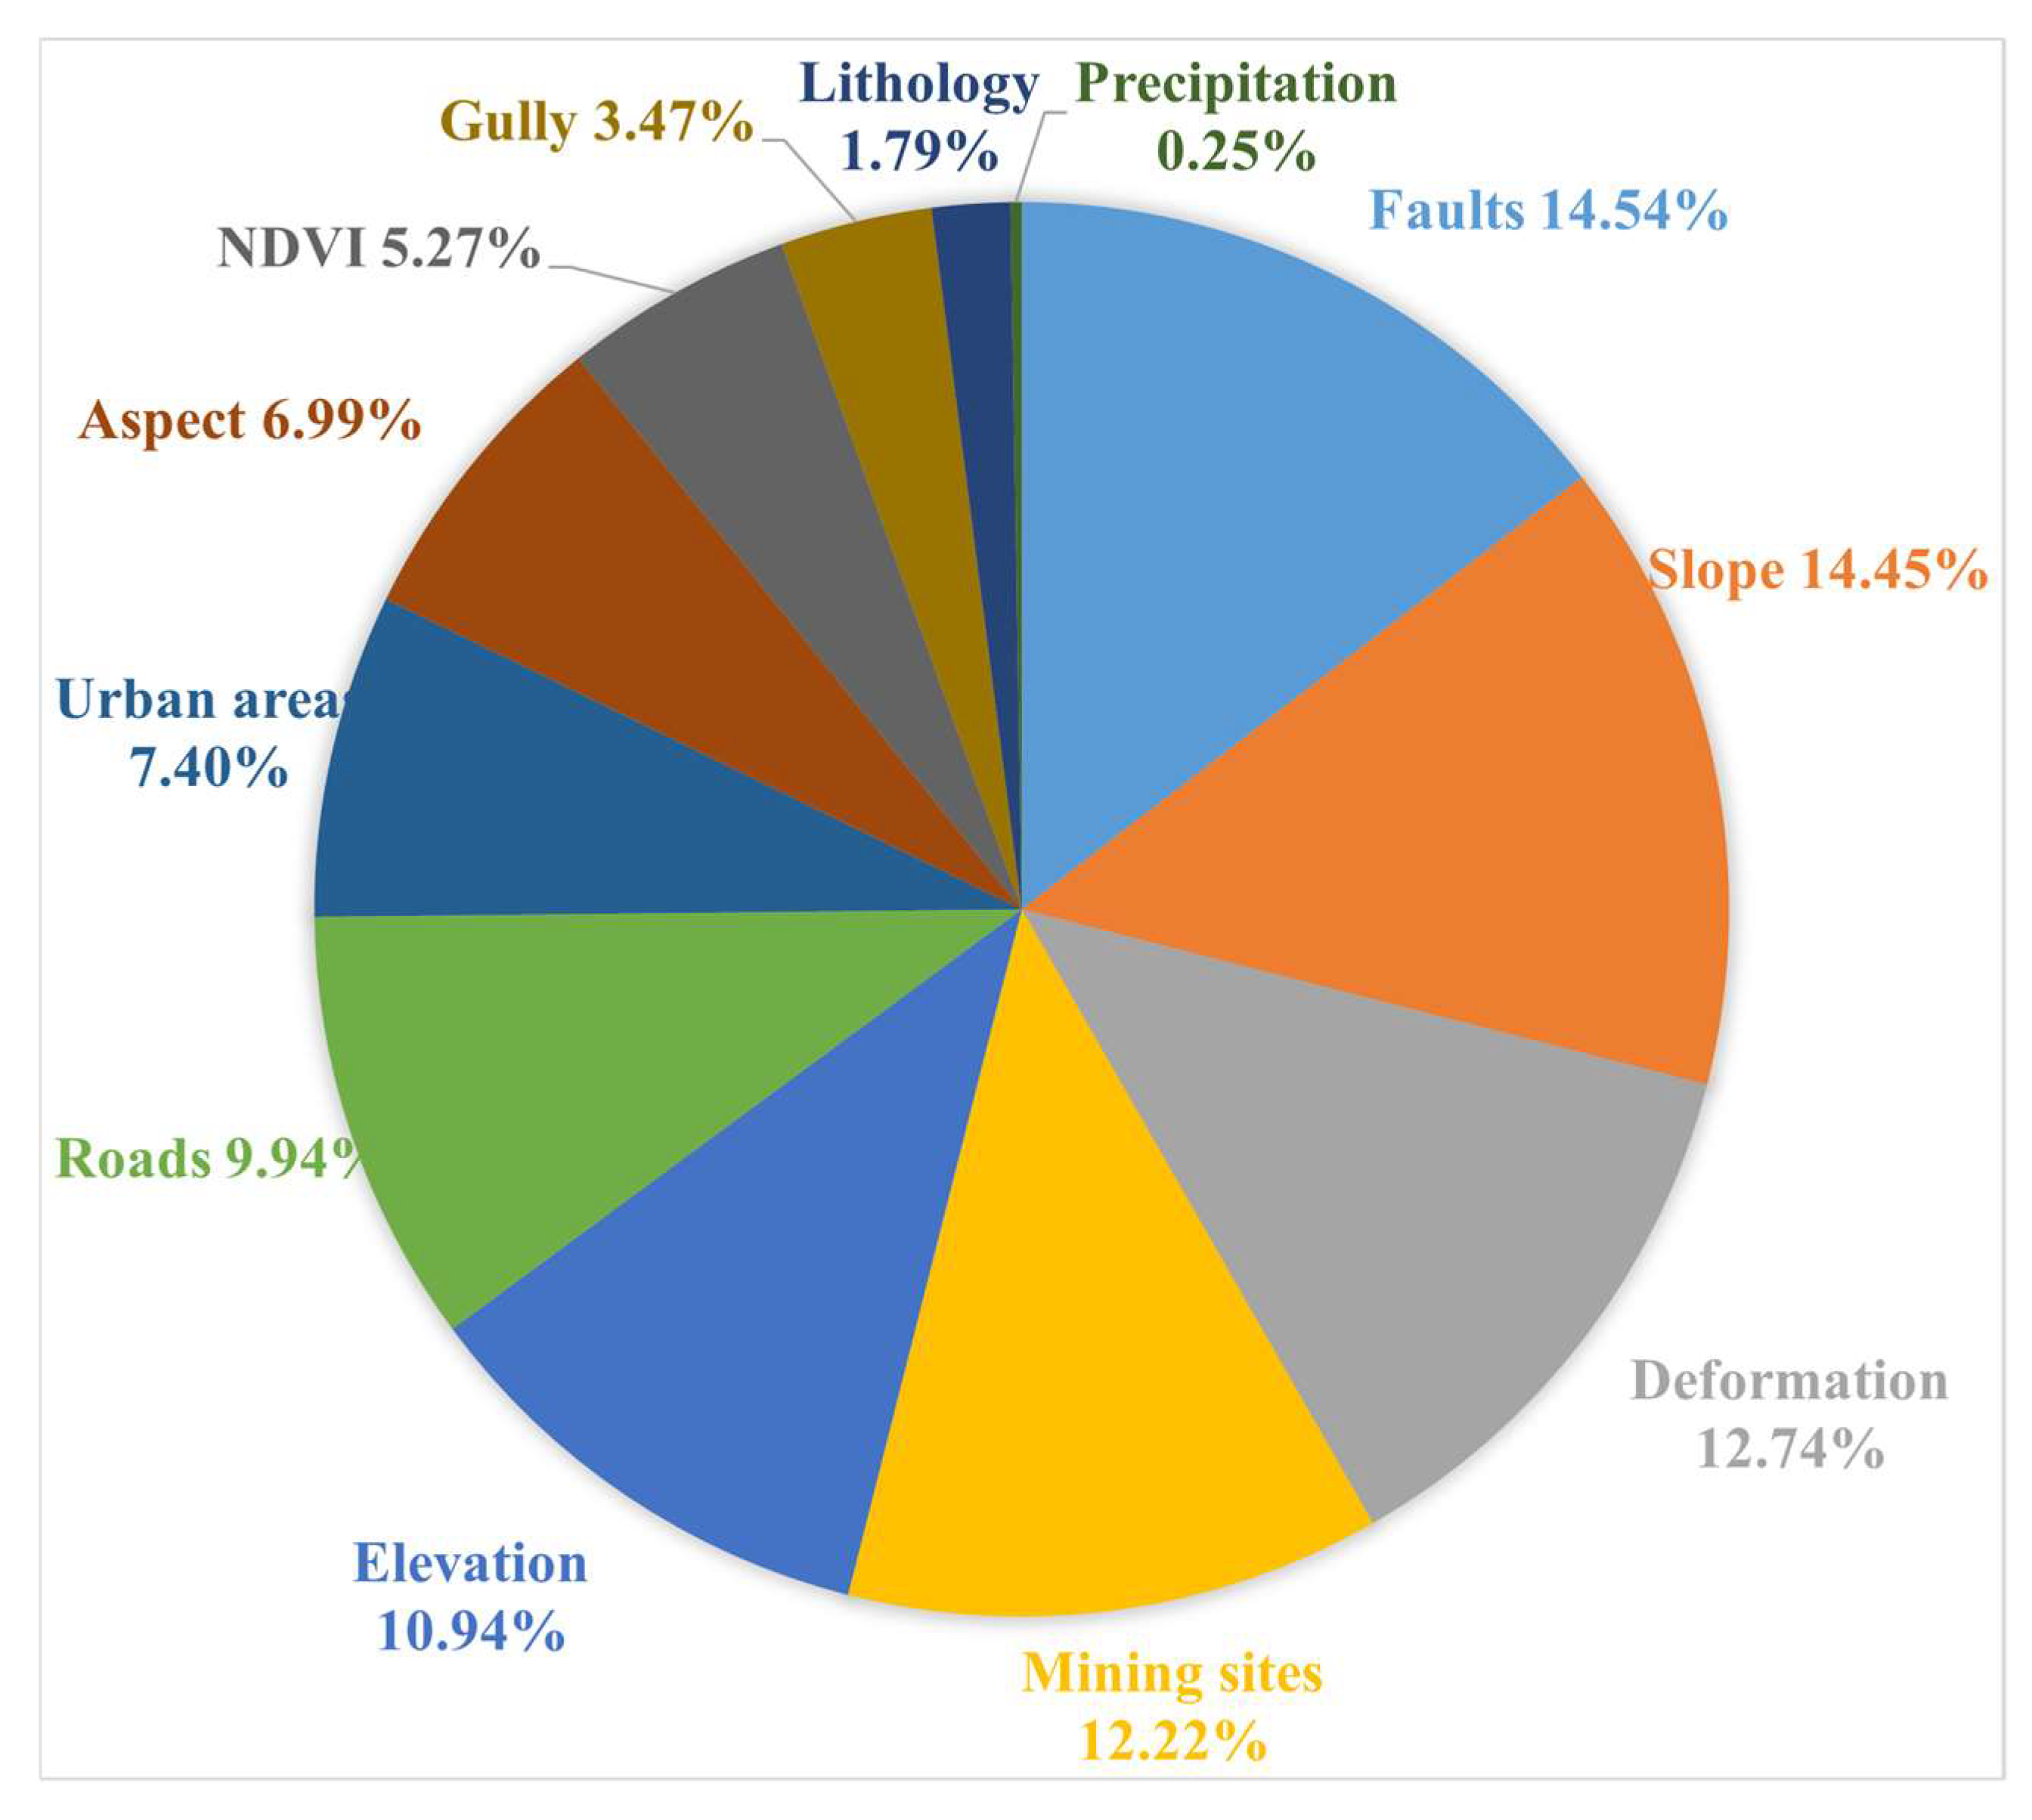
Figure 6 and
Figure 7. From
Figure 7, the results reveal the fault has the highest importance, followed by slope and deformation. The high ranking of the deformation factor reflects the sensitivity of InSAR technology to subtle surface deformations, enabling effective capture of the accumulated deformation characteristics before slope instability. Integrating the lithology of the study area, which is primarily loess (prone to hydraulic weakening), the deformation data indirectly reveal the dynamic changes in geotechnical parameters, thus establishing these as a key indicator for landslide early warning. This also demonstrates the methodological validity of including InSAR-derived surface deformation as an influencing factor for landslide-prone area identification.
While precipitation is widely recognized as a critical triggering factor for landslides, its quantified importance in this study was only 0.25%. This apparent contradiction arises from methodological constraints in precipitation data representation: First, the coarse spatial resolution of meteorological datasets (566–574 mm/year annual precipitation range) yielded minimal spatial variability, hindering localized differentiation. Second, the lack of short-duration extremes (e.g., daily or monthly rainfall peaks) obscured transient triggering mechanisms. Despite its low statistical prominence in this specific case, precipitation remains a decisive factor for landslide initiation, particularly during intense or prolonged rainfall events. Thus, its role in early-warning systems should not be dismissed, even if current data limitations constrain its model sensitivity.
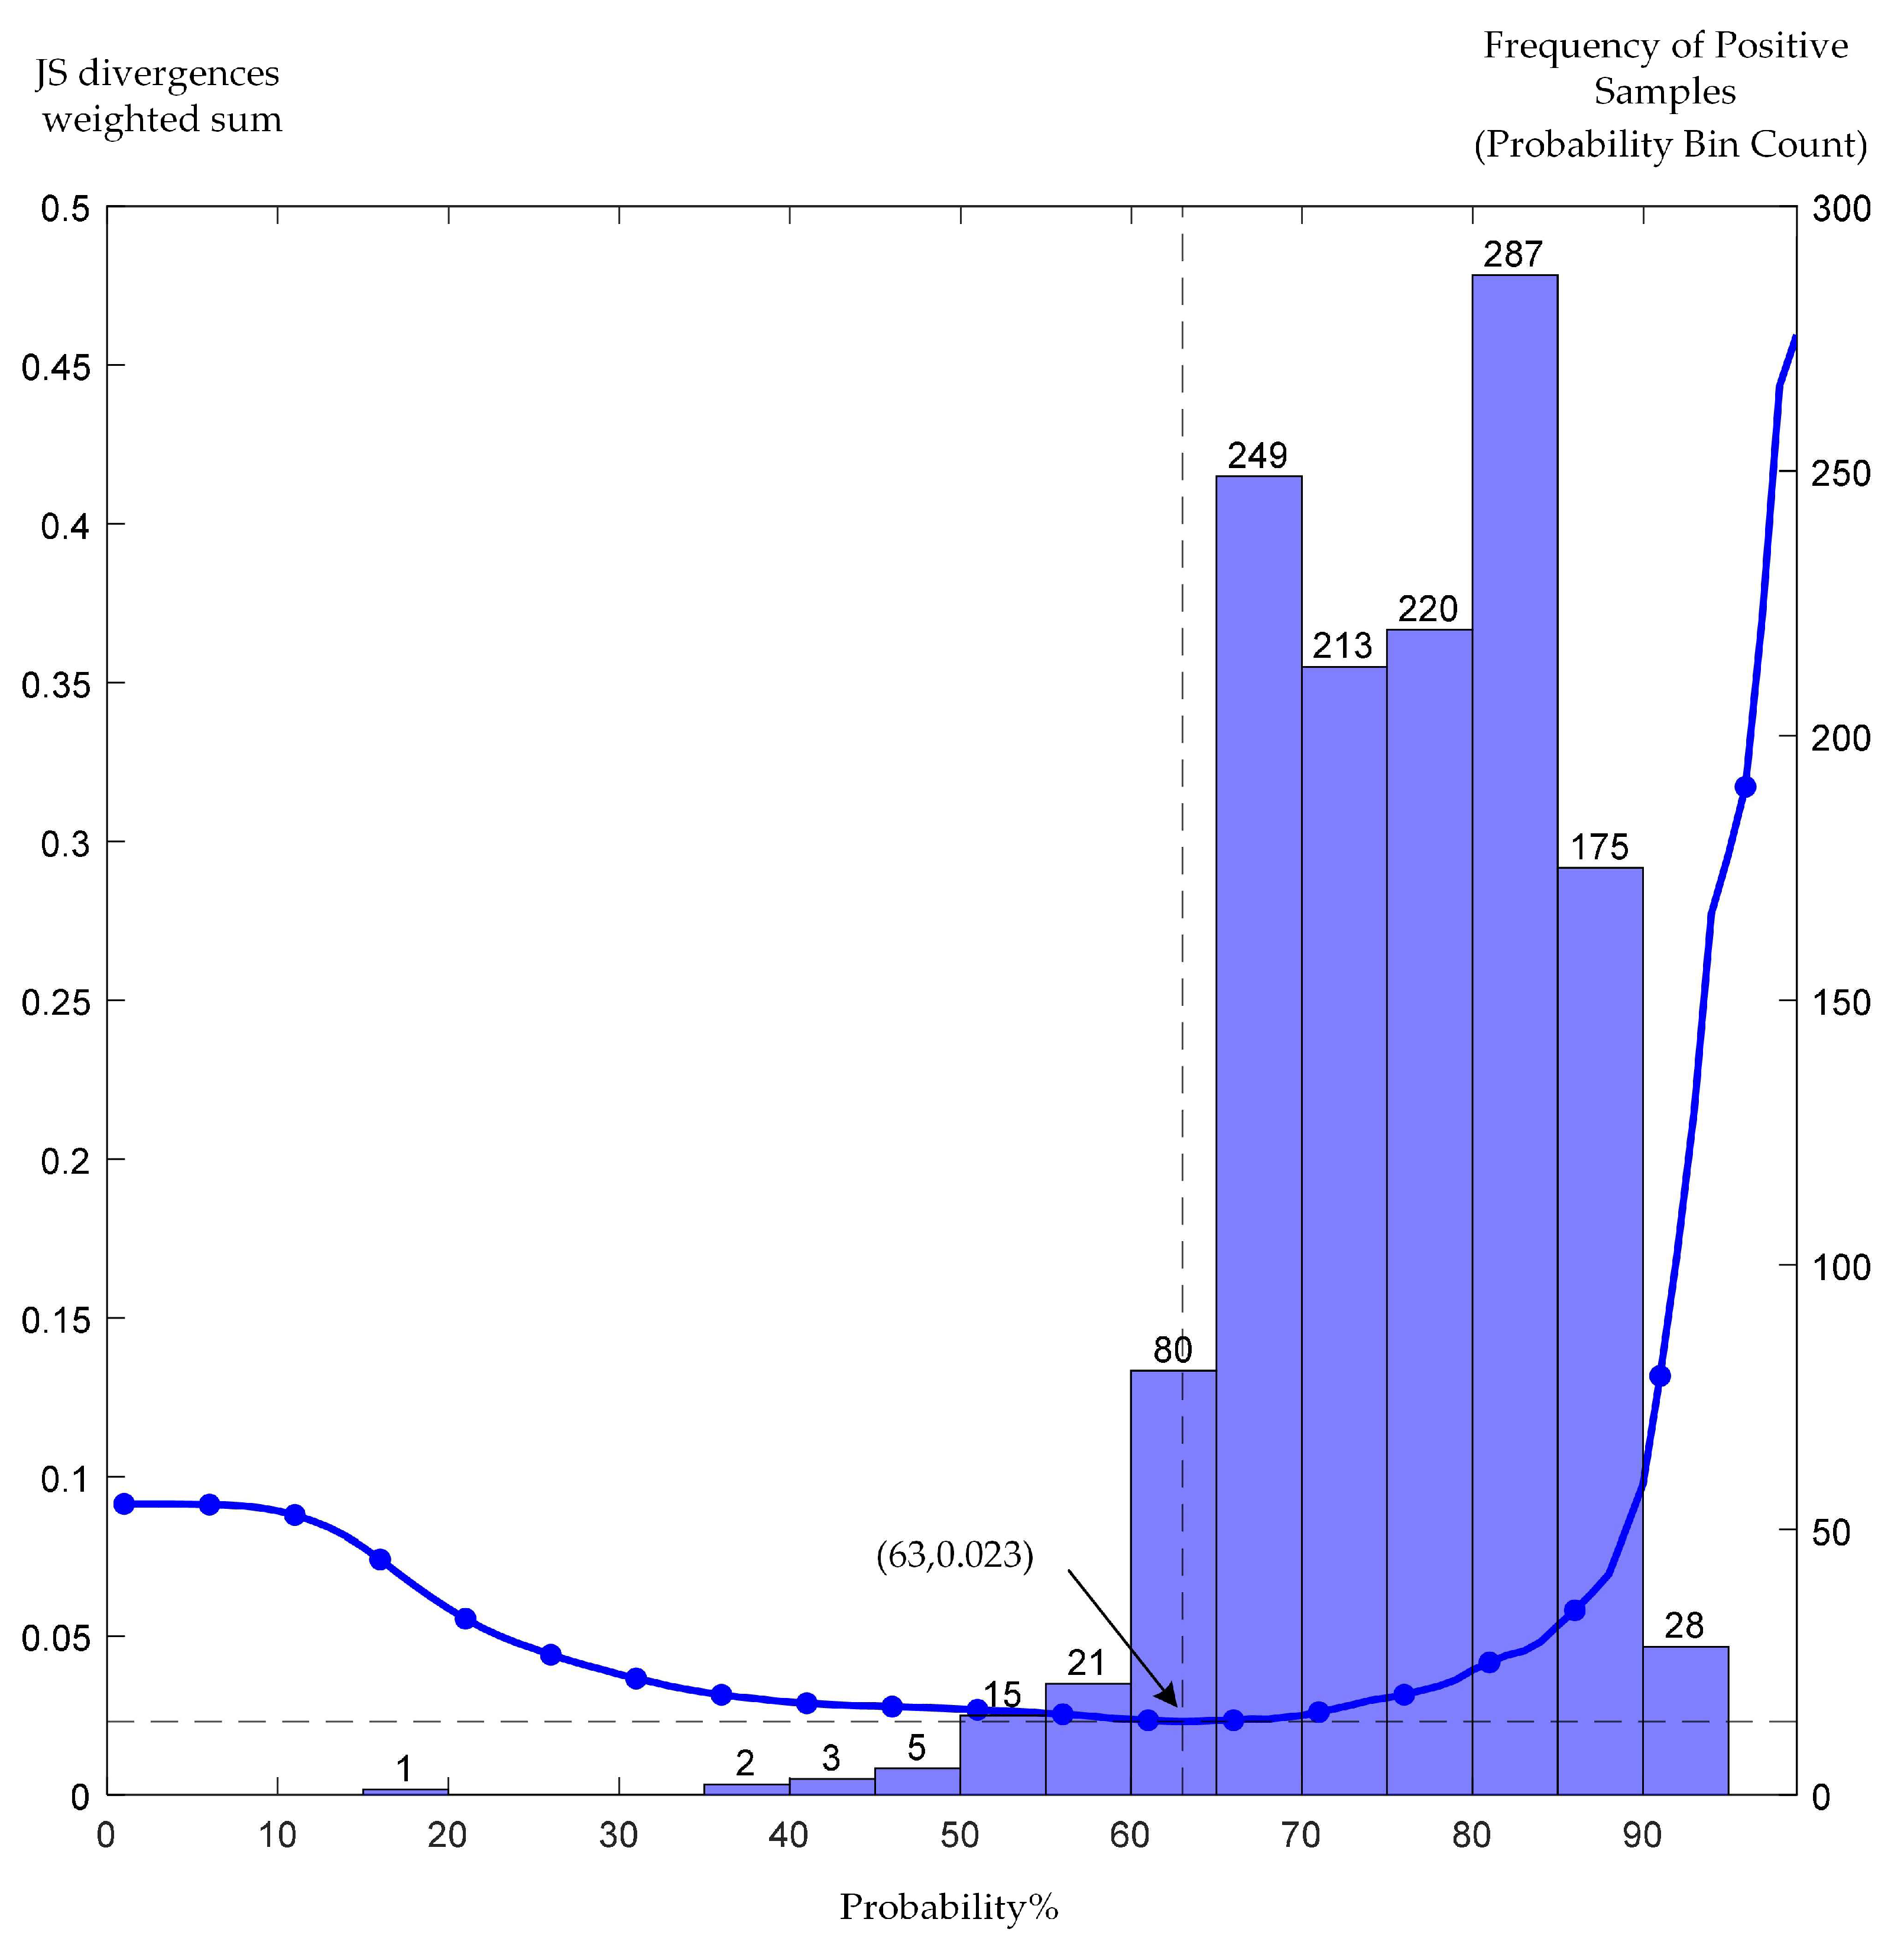
Based on the predicted probability for each point (expressed as a percentage), the weighted sum of JS divergences for each factor was calculated at probability thresholds ranging from 1% to 99%, with a step size of 1%. The results are shown in
Figure 8. From
Figure 8, the minimum weighted sum of JS divergences occurs at a 63% threshold, indicating that factors in the landslide-prone area exhibit maximal statistical similarity with positive samples. Notably, 94.1% (1222/1299) positive sample pixels fall within the identified landslide-prone area, demonstrating high spatial similarity. These results validate the 63% threshold as optimal for reliability. The landslide-prone area division based on the adaptive probability threshold determined by the weighted sum of JS divergences metric ensures the smallest difference in factor distribution between the landslide-prone area and positive samples, while maximizing statistical consistency with historical landslides. This threshold choice balances the model’s sensitivity (recall rate) and specificity (false-positive rate), avoiding misclassification of regions due to fixed thresholds in traditional quantile methods (e.g., the natural breaks method). For instance, if the threshold is set too high (e.g., 80%), false positives can be reduced, but high-slope areas may be missed. Conversely, a threshold that is too low (e.g., 40%) will enlarge the landslide-prone area, increasing monitoring costs. Therefore, this study sets the prediction probability threshold for landslide susceptibility in the study area at 63%, classifying landslide-prone areas, and applies morphological filtering to the discrete landslide-prone points. The final landslide-prone area is shown in
Figure 9, with an estimated area of approximately 13.5 km
2, accounting for about 16.3% of the total study area.
The selection of the probability threshold directly impacts the extent of the landslide-prone area and model performance. As shown in
Figure 6, if a conventional threshold of 50% is used, the area of landslide-prone zones would occupy 24.5% of the total area, about 7 km
2 more than the area corresponding to the optimal threshold of 63%. This overestimation unnecessarily increases the field investigation workload without enhancing detection accuracy, demonstrating the practical significance of the proposed method over traditional empirical thresholds.
5. Discussion
According to the landslide catalog data, historical landslides are mostly distributed on the slopes west of the Longwu River, in loess geology, and many of these slopes exhibit significant deformation funnels (
Figure 6). The deformation rate is a key controlling factor in the development of historical landslides in the study area. Between February 2016 and June 2017, 24 landslides occurred in the study area (shown as blue circles in
Figure 9), all of which occurred within the identified landslide-prone area. The total number of positive samples is 1299, and the number of positive samples in the identified landslide-prone areas is 1222, which indicates that the total accuracy of the identified landslide-prone areas is 94.07%, meaning that all historical landslides were accurately classified within the identified landslide-prone areas. From June 2017 to November 2022, a total of 9 landslides occurred in the study area (shown as red circles in
Figure 9), 7 of which occurred within the identified landslide-prone area, and 2 did not. Therefore, the post-occurrence rate for the identified landslide-prone areas is 77.78%, and the omission rate is 22.22%. This result shows that the model has high practical value for predicting landslide events over the next five years and can identify most areas that will evolve into landslides.
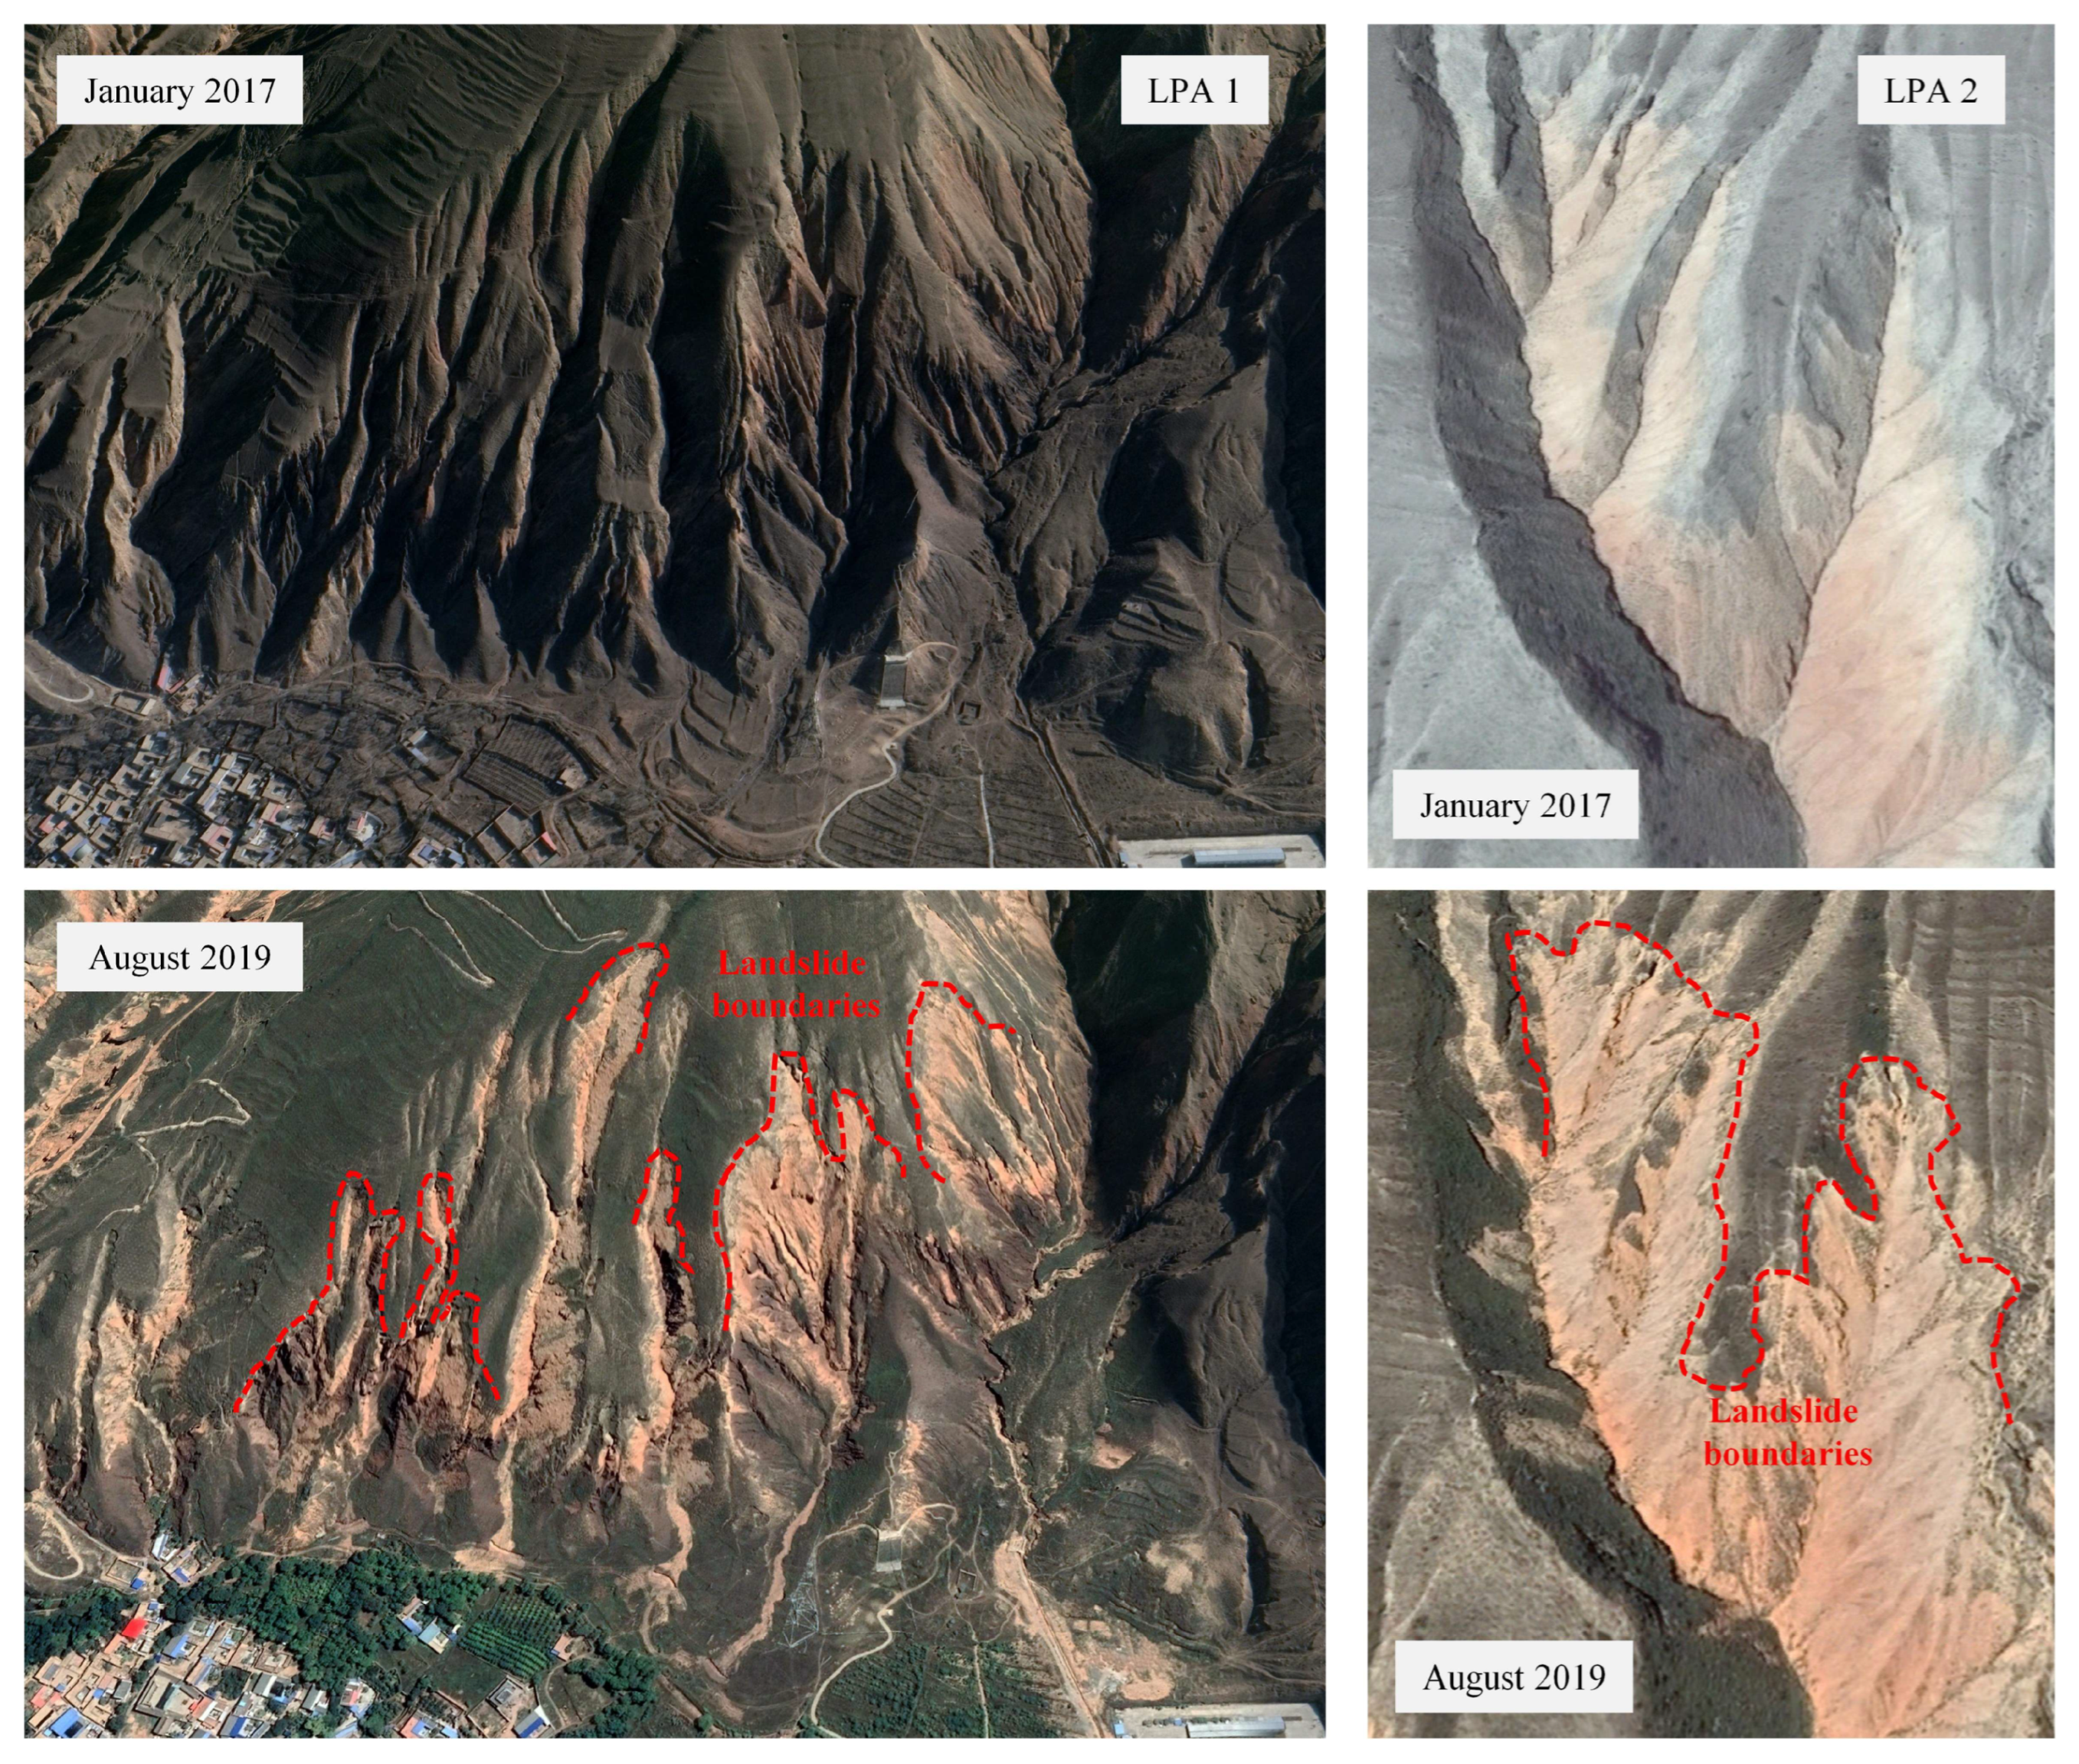
To further demonstrate the validity and accuracy of the identified landslide-prone areas, two examples (LPA1 and LPA2) of landslide-prone areas where landslides occurred after June 2017 are shown in
Figure 10. These areas are displayed based on changes observed in Google Earth images before and after June 2017. From
Figure 10, it can be seen that the mountain in LPA1 experienced multiple landslides after June 2017, while LPA2 saw a large-scale landslide across the entire mountain. The landslide body, boundaries, rear edge, and walls of the landslides are all clearly visible. The landslide activities in LPA1 and LPA2 are closely related to regional geological structures. The study area is located near the Longwu River fault zone (
Figure 3), where fault activity has fractured the bedrock, reducing the slope’s shear strength [
24]. Both LPA1 and LPA2 are located in the deformation uplift zone to the east of the Longwu River, where, although the deformation magnitude is not large, the area remains unstable under the influence of geological activities, human activities, and other factors. With a fault distance of less than 3 km and a high slope greater than 25°, multiple landslides occurred between June 2017 and August 2019. Moreover, in LPA2, the landslide material is mainly fine-grained rock, and the proximity to faults and mining sites, along with intense geological and anthropogenic activity, makes it more prone to collapses or slides in the fractured rock masses. Additionally, as shown in
Figure 11, comparing the lithology and slope dimensions reveals that the correspondence between the landslide catalog data and the landslide-prone area is quite close, further demonstrating that the characteristics of the landslide-prone areas identified by this method are consistent with historical landslides.
One limitation of this method is that its performance depends on the completeness and spatiotemporal coverage of the landslide catalog data. The landslide samples from 2016–2017 (24 events) in the study area may not cover landslide patterns under extreme events (such as rare rainfall), limiting the model’s predictive ability for rare disasters. Additionally, the landslide-prone areas identified in this study are large-scale regions and the method cannot accurately pinpoint individual landslides or precisely determine the boundaries of landslides. This is primarily because the method identifies landslide-prone areas at the pixel level, whereas landslides typically occur within a slope unit. Although the identified landslide-prone area is on a larger scale, it provides an accurate target area for further landslide investigation, monitoring, and early warning. This scale is also suitable for land-use planning. Identifying landslide-prone areas at the slope unit level is expected to improve the ability to pinpoint landslide locations and boundaries, which will be a focus of future work.
The proposed adaptive threshold method relies on statistical similarity between landslide-prone areas and historical samples, which is theoretically applicable to regions with diverse geological conditions. However, its performance in areas with significantly different landslide mechanisms (e.g., tropical regions with high vegetation coverage) requires further validation. Future studies will focus on testing the method’s stability across varied environments.
6. Conclusions
This study proposes a landslide-prone area identification method based on multiple factors and adaptive probability thresholds. By minimizing the weighted sum of JS divergences of landslide influencing factors, the method dynamically determines the optimal probability threshold, effectively solving the problem of subjectivity in threshold classification inherent in traditional grading methods. Compared to traditional quantile methods (such as natural breaks), this approach avoids regional misclassification caused by fixed thresholds (such as missing high-slope areas or over-warnings in low-risk areas). The experimental results show that this method exhibits high reliability in the application to the Longwu River Basin in Qinghai, with total accuracy of 94.07% and a post-occurrence rate of 77.78%, validating its effectiveness in identifying high-risk areas. In addition, the integration of InSAR deformation data as a dynamic factor in this study effectively captures subtle deformations before slope instability, addressing the limitation of static geological factors (such as lithology) in terms of timeliness.
Moreover, the experimental results show that landslides in the study area are mainly influenced by faults, slope, and deformation. Therefore, it is essential to conduct further landslide investigation, monitoring, and early warning in the identified landslide-prone areas, with particular focus on slopes experiencing deformation and high-slope areas near faults.
Author Contributions
Conceptualization, J.B. and X.L.; Data curation, J.B.; Formal analysis, J.B., X.L. and G.L.; Funding acquisition, X.L., Y.S. and G.L.; Methodology, J.B. and X.L.; Project administration, X.L. and G.L.; Resources, J.B.; Software, J.B., Y.S. and M.H.; Supervision, X.L. and G.L.; Validation, J.B., Y.S. and M.H.; Visualization, J.B., Y.S., M.H. and J.L.; Writing—original draft, J.B.; Writing—review and editing, J.B., X.L., J.L. and G.L. All authors have read and agreed to the published version of the manuscript.
Funding
This research was funded by the National Natural Science Foundation of China (No. U22A20565, No. 42374021 and No. 41271448), the Natural Science Foundation of Sichuan Province (No. 2022NSFSC0419) and the China Postdoctoral Science Foundation (No. 2023MD734183).
Data Availability Statement
The data are available on request.
Acknowledgments
We would like to express our gratitude to Sichuan Huadi Construction Engineering Co., Ltd., (Chengdu, China), for providing the landslide catalog data for the study area. We also thank the European Space Agency (ESA) for providing the Sentinel-1 images, as well as the National Aeronautics and Space Administration (NASA) and the United States Geological Survey (USGS) for providing the Landsat-8 images.
Conflicts of Interest
The authors declare no conflicts of interest.
References
- Brabb, E.E. Innovative approaches to landslide hazard and risk mapping. In Proceedings of the IV International Symposium on Landslides, Toronto, ON, Canada, 16–21 September 1984; pp. 307–323. [Google Scholar]
- Reichenbach, P.; Rossi, M.; Malamud, B.D.; Mihir, M.; Guzzetti, F. A review of statistically-based landslide susceptibility models. Earth-Sci. Rev. 2018, 180, 60–91. [Google Scholar] [CrossRef]
- Li, X.; Chong, J.; Lu, Y.; Li, Z. Application of information gain in the selection of factors for regional slope stability evaluation. Bull. Eng. Geol. Environ. 2022, 81, 470. [Google Scholar] [CrossRef]
- Luo, W.; Liu, C.C. Innovative landslide susceptibility mapping supported by geomorphon and geographical detector methods. Landslides 2018, 15, 465–474. [Google Scholar] [CrossRef]
- Zhou, X.; Wen, H.; Zhang, Y.; Xu, J.; Zhang, W. Landslide susceptibility mapping using hybrid random forest with GeoDetector and RFE for factor optimization. Geosci. Front. 2021, 12, 101211. [Google Scholar] [CrossRef]
- Xu, Z.; Che, A.; Zhou, H. Seismic landslide susceptibility assessment using principal component analysis and support vector machine. Sci. Rep. 2024, 14, 3734. [Google Scholar] [CrossRef]
- Chen, C.; Fan, L. Selection of contributing factors for predicting landslide susceptibility using machine learning and deep learning models. Stoch. Environ. Res. Risk Assess. 2023. [Google Scholar] [CrossRef]
- Woodard, J.B.; Mirus, B.B.; Crawford, M.M.; Or, D.; Leshchinsky, B.A.; Allstadt, K.E.; Wood, N.J. Mapping landslide susceptibility over large regions with limited data. J. Geophys. Res. Earth Surf. 2023, 128, e2022JF006810. [Google Scholar] [CrossRef]
- Sujatha, E.R.; Sridhar, V. Landslide susceptibility analysis: A logistic regression model case study in Coonoor, India. Hydrology 2021, 8, 41. [Google Scholar] [CrossRef]
- Chen, L.; Guo, H.; Gong, P.; Yang, Y.; Zuo, Z.; Gu, M. Landslide susceptibility assessment using weights-of-evidence model and cluster analysis along the highways in the Hubei section of the Three Gorges Reservoir Area. Comput. Geosci. 2021, 156, 104899. [Google Scholar] [CrossRef]
- Zhang, G.; Wang, S.; Chen, Z.; Liu, Y.; Xu, Z.; Zhao, R. Landslide susceptibility evaluation integrating weight of evidence model and InSAR results, west of Hubei Province, China. Egypt. J. Remote Sens. Space Sci. 2023, 26, 95–106. [Google Scholar] [CrossRef]
- Daviran, M.; Shamekhi, M.; Ghezelbash, R.; Maghsoudi, A. Landslide susceptibility prediction using artificial neural networks, SVMs and random forest: Hyperparameters tuning by genetic optimization algorithm. Int. J. Environ. Sci. Technol. 2023, 20, 259–276. [Google Scholar] [CrossRef]
- Aslam, B.; Zafar, A.; Khalil, U. Comparative analysis of multiple conventional neural networks for landslide susceptibility mapping. Nat. Hazards 2023, 115, 673–707. [Google Scholar] [CrossRef]
- Kikuchi, T.; Sakita, K.; Nishiyama, S.; Takahashi, K. Landslide susceptibility mapping using automatically constructed CNN architectures with pre-slide topographic DEM of deep-seated catastrophic landslides caused by Typhoon Talas. Nat. Hazards 2023, 117, 339–364. [Google Scholar] [CrossRef]
- Zhao, Z.; Chen, T.; Dou, J.; Liu, G.; Plaza, A. Landslide susceptibility mapping considering landslide local-global features based on CNN and transformer. IEEE J. Sel. Top. Appl. Earth Obs. Remote Sens. 2024, 17, 7475–7489. [Google Scholar] [CrossRef]
- Baeza, C.; Lantada, N.; Amorim, S. Statistical and spatial analysis of landslide susceptibility maps with different classification systems. Environ. Earth Sci. 2016, 75, 1318. [Google Scholar] [CrossRef]
- Zhao, X.; Chen, W. Optimization of computational intelligence models for landslide susceptibility evaluation. Remote Sens. 2020, 12, 2180. [Google Scholar] [CrossRef]
- Cantarino, I.; Carrion, M.A.; Goerlich, F.; Martinez Ibañez, V. A ROC analysis-based classification method for landslide susceptibility maps. Landslides 2019, 16, 265–282. [Google Scholar] [CrossRef]
- Yang, Y.G.; Yin, K.L.; Zhao, H.Y.; Huang, C.C.; Chen, L.X.; Zhang, Y. Landslide susceptibility evaluation for township units of bank section in Wanzhou District based on C5.0 decision tree and K-means cluster model. Bull. Geol. Sci. Technol. 2019, 38, 189–197. [Google Scholar]
- Pradhan, B. A comparative study on the predictive ability of the decision tree, support vector machine and neuro-fuzzy models in landslide susceptibility mapping using GIS. Comput. Geosci. 2013, 51, 350–365. [Google Scholar] [CrossRef]
- Xie, M.; Ju, N.; Zhao, J.; Fan, Q.; He, C. Comparative analysis on classification methods of geological disaster susceptibility assessment. Geomat. Inf. Sci. Wuhan Univ. 2021, 46, 1003–1014. [Google Scholar]
- He, Y.; Zhao, Z.; Zhu, Q.; Liu, T.; Zhang, Q.; Yang, W.; Zhang, L.; Wang, Q. An integrated neural network method for landslide susceptibility assessment based on time-series InSAR deformation dynamic features. Int. J. Digit. Earth 2024, 17, 2295408. [Google Scholar] [CrossRef]
- Englesson, E.; Azizpour, H. Generalized Jensen-Shannon divergence loss for learning with noisy labels. Adv. Neural Inf. Process. Syst. 2021, 34, 30284–30297. [Google Scholar]
- Peng, J.B.; Wang, Q.Y.; Zhuang, J.Q.; Leng, Y.Q.; Fan, Z.J.; Wang, S.K. Dynamic formation mechanism of landslide disaster on the Loess Plateau. J. Geomech. 2020, 26, 714–730. [Google Scholar]
- Wang, J.M.; Ni, Y.L.; Sun, J.Z. A study on structural joints in loess and its practical applications. J. Eng. Geol. 1994, 2, 31–42. [Google Scholar]
- Sun, H.; Li, T.T.; Pei, X.J.; Wang, S.D.; Wu, X.F.; Jiang, R.H.; Huang, Y. Revitalization mechanism and threat range prediction of Longwuxishan ancient landslide group, Qinghai Province. J. Eng. Geol. 2022, 30, 829–842. [Google Scholar]
- Guo, D.; Hamada, M. Qualitative and quantitative analysis on landslide influential factors during Wenchuan earthquake: A case study in Wenchuan County. Eng. Geol. 2013, 152, 202–209. [Google Scholar] [CrossRef]
- Liu, G.X.; Chen, Q.; Luo, X.J.; Cai, G.L. The Principle and Application of InSAR; Science Press: Beijing, China, 2019. [Google Scholar]
- Bao, J.W.; Luo, X.J.; Liu, G.X.; Chang, L.; Wang, X.W.; Shi, Y.L.; Wu, S.Y. An improved distributed scatterers extraction algorithm for monitoring tattered ground surface subsidence with DSInSAR: A case study of loess landform in Tongren county. Int. J. Appl. Earth Obs. Geoinf. 2021, 99, 102322. [Google Scholar] [CrossRef]
| Disclaimer/Publisher’s Note: The statements, opinions and data contained in all publications are solely those of the individual author(s) and contributor(s) and not of MDPI and/or the editor(s). MDPI and/or the editor(s) disclaim responsibility for any injury to people or property resulting from any ideas, methods, instructions or products referred to in the content. |
© 2025 by the authors. Licensee MDPI, Basel, Switzerland. This article is an open access article distributed under the terms and conditions of the Creative Commons Attribution (CC BY) license (https://creativecommons.org/licenses/by/4.0/).


