Article

Quality Assessment of Operational Fengyun-4B/GIIRS Atmospheric Temperature and Humidity Profile Products

1
Key Laboratory of Cloud-Precipitation Physics and Weather Modification, Beijing 100081, China
2
Institute of Desert Meteorology, China Meteorological Administration, Urumqi 830002, China
3
National Meteorological Information Centre, Beijing 100081, China
4
Xinjiang Cloud Precipitation Physics and Cloud Water Resources Development Laboratory, Urumqi 830002, China
5
Field Scientific Experiment Base of Akdala Atmospheric Background, China Meteorological Administration, Urumqi 830002, China
*
Author to whom correspondence should be addressed.
Remote Sens. 2025, 17(8), 1353; https://doi.org/10.3390/rs17081353
Submission received: 23 January 2025 / Revised: 6 April 2025 / Accepted: 9 April 2025 / Published: 10 April 2025

Abstract

:
As China’s second operational Geostationary Interferometric Infrared Sounder, Fengyun-4B/GIIRS can provide temporally and spatially continuous atmospheric temperature profile (ATP) and atmospheric humidity profile (AHP) information, which can be used in cold wave monitoring and other meteorological applications. In this study, radiosonde observations and ERA5 reanalysis are used to assess the quality of operational Fengyun-4B/GIIRS ATP and AHP products released by the National Satellite Meteorological Centre (NSMC). The results are as follows: (1) Compared to Fengyun-4A/GIIRS, due to the improvement in the instruments, the usability of Fengyun-4B/GIIRS is enhanced, and the influence of clouds and land surfaces reduces its usability under clear-sky conditions and below 900 hPa. (2) The current operational quality-flagged algorithm can identify the Fengyun-4B/GIIRS ATP and AHP products with different accuracies well, providing beneficial information to users. Taking radiosonde observations as a reference, the RMSEs of the Fengyun-4B/GIIRS ATP and AHP products with the best quality (with the quality flag of “very good”) are around 1.5K and below 2 kg/kg, respectively, which is better than those of the Fengyun-4A/GIIRS ATP product. (3) Compared to the ERA5 reanalysis, due to the different coefficients in the retrieval algorithm, systematic overestimation and underestimation occur for the Fengyun-4B/GIIRS ATP product under clear-sky conditions and cloudy-sky conditions, respectively. (4) The biases and RMSEs of the Fengyun-4B/GIIRS ATP and AHP products have significant dependence on the satellite zenith angles when the angles are larger than 50°, but when the angles are smaller than 50°, the dependence is negligible.

1. Introduction

Fengyun-4B is China’s first operational new-generation geostationary meteorological satellite and the second satellite of the Fengyun-4 series; it was launched from the Xichang Satellite Launch Centre on 3 June 2021 [1]. After one year of on-orbit testing and six months of trial operation, Fengyun-4B commenced its operation on 1 December 2022. Fengyun-4B carried the newly developed Geostationary Interferometric Infrared Sounder (GIIRS), designed and manufactured by the Shanghai Institute of Technical Physics of the Chinese Academy of Sciences. Fengyun-4B/GIIRS is a Fourier-transform infrared spectrometer [2], which has two bands [3,4]: 725 long-wave infrared channels (680–1130 cm−1) and 961 medium-wave infrared channels (1650–2250 cm−1), with a spectral resolution of 0.8 cm−1. Compared to its predecessor (Fengyun-4A/GIIRS), Fengyun-4B/GIIRS upgrades the spatiotemporal resolution from 16 km/1 h to 12 km/45 min, adds channel numbers from 689 to 725 in long-wave infrared bands, and improves the spectral resolution from 1.6 cm−1 to 0.8 cm−1 in medium-wave infrared bands, providing more observational information with a higher spatial resolution for atmospheric parameter retrieval and data assimilation [5,6].
Observations from satellite-borne interferometric infrared sounders, such as Fengyun-4A/GIIRS and Fengyun-4B/GIIRS, can be used to retrieve the atmospheric temperature profile (ATP) and atmospheric humidity profile (AHP), which are used as supplements of radiosonde and aircraft meteorological data observations [7,8]. Xue et al. [9] applied a one-dimensional variational algorithm to retrieve the ATP and AHP from Fengyun-4A/GIIRS observations and indicated that when compared with the operational products released by the National Satellite Meteorological Centre (NSMC) of the China Meteorological Administration (CMA), the accuracy of retrieval was greatly improved. Other algorithms, such as the artificial neural network [10] and convolutional neural network algorithms [11], can also be applied to retrieve the ATP and AHP from Fengyun-4A/GIIRS. Another major application of satellite-borne interferometric infrared sounder observations is assimilating radiance or the atmospheric profile retrieval product into the Numerical Weather Prediction (NWP) system. Yin et al. [12] achieved the direct assimilation of Fengyun-4A/GIIRS radiance and indicated that assimilation improved the coastal precipitation forecasts during Typhoon Maria’s landfall. Feng et al. [13] performed the experimental assimilation of the Fengyun-4A/GIIRS ATP product, and their results showed that the assimilation can improve the track forecast of typhoons.
In terms of data quality [14], the Fengyun-4A/GIIRS AHP product has not been operationally released to the public, although researchers have determined the feasibility of retrieval [15], and only the Fengyun-4A/GIIRS ATP product was released by the NMSC on 27 November 2018. Fengyun-4A/GIIRS is the first interferometric infrared sounder carried by a geostationary meteorological satellite, which significantly improves the temporal resolution of observations and provides an atmospheric parameter profile with a high vertical resolution for meteorological applications. Gao et al. [16] applied the Fengyun-4A/GIIRS ATP product to winter precipitation-type diagnosis in Southern China and indicated that the product is an important indicator to diagnose precipitation types. The Fengyun-4A/GIIRS ATP product can also be applied to cold wave monitoring, and previous research [17] has shown its ability to monitor the movement and intensity of cold air activities. With the development of instrumentation technology, Fengyun-4B/GIIRS, the successor of Fengyun-4A/GIIRS, which has more channels and a better quality of observations [3], commenced its operation on 1 December 2022. Apart from the Level 1 data and ATP product, for the first time, NSMC released its operational Fengyun-4B/GIIRS AHP product. Before the application of the Fengyun-4B/GIIRS operational AHP product, it is essential to perform validation and analyze the bias characteristic of the product, which has not been published by other researchers. Although the performance of the Fengyun-4B/GIIRS ATP product under cloudy-sky conditions has been assessed [18], a comprehensive comparison should be made between the Fengyun-4A/GIIRS and Fengyun-4B/GIIRS ATP products under different sky conditions, which will provide valuable information to continuous users. In this study, the quality of the operational Fengyun-4B/GIIRS ATP and AHP products is assessed using radiosonde observations and ERA5 reanalysis, and their bias dependence on cloud and satellite scan angles is also discussed. Furthermore, the bias characteristics of Fengyun-4A/GIIRS and Fengyun-4B/GIIRS ATP products under all-sky, clear-sky, and cloudy-sky conditions are compared in this study.
This paper is organized as follows: Section 2 introduces the Fengyun-4B/GIIRS operational ATP and AHP products, radiosonde observations, ERA5 reanalysis, and validation strategy. The results of the assessment and comparison of Fengyun-4B/GIIRS and Fengyun-4A/GIIRS atmospheric profile products are shown in Section 3. Section 4 and Section 5 provide the discussion and conclusions, respectively.

2. Data and Methods

2.1. Data

2.1.1. Operational Fengyun-4B/GIIRS ATP and AHP Products

Fengyun-4B/GIIRS is one of the main instruments carried by the Fengyun-4B satellite, and its spectral range is mainly from 4.4 μm to 6.1 μm at the mid-wave infrared band and from 8.8 μm to 14.7 μm at the long-wave infrared band. The observations of Fengyun-4B/GIIRS can be used to retrieve atmospheric profile products [19], which can provide useful information pertaining to severe weather monitoring and NWP systems [20]. Currently, the NSMC produces operational Fengyun-4B/GIIRS ATP and AHP products using a double-regression retrieval algorithm. In the algorithm, regression coefficients are calculated based on the global atmospheric profile database and the Fengyun-4B/GIIRS radiance simulations under clear-sky and cloudy-sky conditions separately. The details of the retrieval algorithm are shown in [21]. Operational Fengyun-4B/GIIRS ATP and AHP products are released in the NETCDF (NETwork Common Data Form) format with 101 vertical pressure levels. Quality flags, cloud mask, land/sea mask, and other auxiliary information are also provided in the released product file, which can be used to choose suitable products by users. Based on the quality flags and cloud mask information, all pixels with valid temperature and humidity values are categorized into the “all-sky” condition, and the pixels identified as clear and cloudy are categorized in the “clear-sky” condition and the “cloudy-sky“ condition, respectively.
Fengyun-4B/GIIRS features a 16 × 8 sensor array plane with the scan model of “step-gaze”, which can scan the area of East Asia every two hours. The NSMC provides two kinds of ATP and AHP products: (1) single-residence-point products and (2) regional-combination products, which are composed of all single-residence-point products in the complete scan of East Asia. For a more accurate assessment of the operational Fengyun-4B/GIIRS ATP and AHP products, single-residence-point products from March 2023 to January 2024, which are provided by the NSMC, are used in this study.

2.1.2. Operational Fengyun-4A/GIIRS ATP Products

Since Fengyun-4B/GIIRS is an upgrade of Fengyun-4A/GIIRS, the quality of their retrieval products should be compared, which can provide useful information to retrieval algorithm developers and meteorological applications. Fengyun-4A/GIIRS is the first infrared hyperspectral sounder carried by geostationary meteorological satellites [22], and its L1 and L2 products were released to the public on 27 November 2018. According to the arrangement of the CMA, Fengyun-4A was moved from 104.7°E to 86.5°E above the equator on 5 March 2024 and became a backup satellite [23]. Since 5 March 2024, the NSMC has stopped distributing Fengyun-4A/GIIRS L1 and ATP products because of the decline in instrument performance. Consistent with the operational Fengyun-4B/GIIRS ATP product, the operational Fengyun-4A/GIIRS ATP product was also released in the NETCDF format with 101 vertical pressure levels. For this study, the Fengyun-4A/GIIRS operational ATP product was also provided by the NSMC.

2.1.3. Radiosonde Observations

Radiosonde observations of 120 meteorological stations from March 2023 to January 2024 over China were provided by the National Meteorological Information Centre (NMIC) of the CMA, and these observations have been strictly quality-controlled by the NMIC to exclude questionable or incorrect data [24]. The process of quality control includes a missing data check, boundary value check, station climatology boundary value check, rigid value check, monotonic check, and comprehensive quality control. After the quality control process, observations are flagged with the corresponding quality flags, which include “correct”, “suspicious”, “error”, “modified”, “no observation”, “missing”, and “not quality controlled”, and only observations flagged as “correct” are used in this study.
According to the specifications for upper-air meteorological observations in China, operators release the sounding balloons two times every day at the meteorological stations, at 11:15 and 23:15 UTC, and balloons drift at the atmospheric layer over one hour before bursting. Secondly, with the help of L-band radar and the development of communication technology, the temporal resolution atmospheric profile information can be collected during the drift of the sounding balloons, including temperature, humidity, pressure, wind speed, and geopotential height.
Since the radiosonde is the most accurate observational instrument of the atmospheric profile, its observations are used to assess the operational Fengyun-4B/GIIRS and Fengyun-4A/GIIRS atmospheric profile products in this study.

2.1.4. ERA5 Reanalysis

As the latest reanalysis product released by the European Centre for Medium-Range Weather Forecasts (ECMWF), ERA5 reanalysis can provide an hourly analysis of the atmospheric temperature and humidity profile with a 0.25° spatial resolution and 37 vertical levels [25,26]. Compared to radiosonde observations, ERA5 has the advantage of spatial and temporal continuity, and by using the 4D-Var data assimilation method, ERA5 can provide atmospheric temperature and humidity profiles with consistent quality.
Since radiosonde observations are normally recorded only twice a day, in order to assess the Fengyun-4B/GIIRS atmospheric profile products more comprehensively, ERA5 reanalysis is used as a reference to analyze the bias characteristics of the Fengyun-4B/GIIRS ATP and AHP products.

2.2. Strategy of Assessment and Comparison

For the assessment using radiosonde observations, since the sounding balloon drifts for one hour after release and its drift direction and speed depend on the wind speed, the balloons may travel over 100 km before they burst. Thus, radiosonde observations are assumed to represent the atmospheric meteorologic status in the period of sounding balloon release and 135 min after its release. Using L-band radar, the locations of the balloons can be obtained every second. Thus, the following temporal and spatial matching strategy is designed and performed: (1) for temporal matching, the Fengyun-4B/GIIRS temperature and humidity profile products in the periods from 07:15 to 08:30 UTC and from 23:15 to 00:30 UTC are assessed with radiosonde observations, and (2) for spatial matching, the Fengyun-4B/GIIRS ATP and AHP products are assessed with the radiosonde observations within a distance of 12 km (the spatial resolution of Fengyun-4B/GIIRS), and linear interpolation is performed in the vertical direction. For unified variable units of radiosonde observations (variable: relative humidity; unit: %) and Fengyun-4B/GIIRS humidity profile products (variable: specific humidity; unit: g/kg), the relative humidity is converted to specific humidity based on [27]. When assessed with ERA5 reanalysis, bilinear interpolation in the horizontal direction, linear interpolation in the vertical direction, and temporal scale are performed for ERA5 reanalysis for the location and time of the operational Fengyun-4B/GIIRS and Fengyun-4A/GIIRS atmospheric profile products.
In this research, bias and Root Mean Squared Error (RMSE) were applied to analyze the performance of Fengyun-4B/GIIRS ATP and AHP products using radiosonde observations and ERA5 reanalysis, which was calculated as follows (Equations (1) and (2)).
bias = i = 1 N ( x i y i ) N
RMSE = i = 1 N ( x i y i ) 2 N
In Equations (1) and (2), bias represents the mean bias of the Fengyun-4B/GIIRS ATP (or AHP) product, and RMSE represents the Root Mean Squared Error of Fengyun-4B/GIIRS ATP (or AHP) product, which use radiosonde observations(or ERA5 reanalysis) as reference. And xi is the FY-4B/GIIRS ATP (or AHP) product, yi is the radiosonde observations (or ERA5 reanalysis), and N indicates the total number that are included in statistics.

3. Results

3.1. Analysis of Quality Flag for Operational Fengyun-4b/GIIRS ATP and AHPProducts

Since Fengyun-4B/GIIRS is an infrared instrument and therefore can be easily affected by clouds, it is necessary to provide the quality information of retrieval results to users. The NSMC released the Fengyun-4B/GIIRS ATP and AHP products with quality flags for each pixel, which divided the pixels into four categories: (1) very good, (2) good, (3) bad, and (4) do not use. Cloud mask and land/sea information are also provided in the product files.
Figure 1 shows the percentage distributions of quality flags for the operational Fengyun-4B/GIIRS ATP and AHP products under all-sky, clear-sky, and cloudy-sky conditions from March 2023 to January 2024. As shown in Figure 1a, 52.74% of the Fengyun-4B/GIIRS ATP products are flagged as “very good” or “good” under the all-sky condition, which are recommended for use by the NSMC. Under the clear-sky condition, 77.24% of the Fengyun-4B/GIIRS ATP products are categorized as “very good” or “good”, while that percentage decreases to 44.06% under the cloudy-sky condition. Furthermore, 22.76% of the Fengyun-4B/GIIRS ATP products are categorized as “bad” or “do not use” under the clear-sky condition, while that percentage increases to 55.94% under the cloudy-sky condition. For comparison, the percentage distributions of quality flags for the Fengyun-4A/GIIRS ATP products are shown in Figure 2. From Fengyun-4A/GIIRS to Fengyun-4B/GIIRS, the percentage of “very good” or “good” increases from 40.03% to 52.34% under the all-sky condition, which results from the improvements in instruments. Under the clear-sky and cloudy-sky conditions, the percentage of “very good” or “good” for the Fengyun-4B/GIIRS ATP products is also larger than that for the Fengyun-4A/GIIRS ATP products.
For the Fengyun-4B/GIIRS AHP products, all pixels are categorized as “very good” under the clear-sky condition, which means that the NSMC is confident in the quality of the product under the clear-sky condition. As shown in Figure 1b, under the cloudy-sky condition, the percentage of “very good” reduces from 100% to 74.21%, while the percentage of “bad” or “do not use” increases from 0 to 25.79%. Overall, from March 2023 to January 2024, 86.55% of the Fengyun-4B/GIIRS AHP products are flagged as “very good” or “good”, and 13.45% of the products are flagged as “bad” or “do not use”, which are not recommended for use. Compared to the Fengyun-4B/GIIRS ATP products, the usability of AHP products is better under both clear-sky and cloudy-sky conditions, which suggests that the influence of clouds on the retrieval of temperature profiles is larger than that on the retrieval of humidity profiles.
The vertical and temporal distributions of the percentages for the usable Fengyun-4B/GIIRS ATP and AHP products (quality flags with values of “very good” or “good”) are shown in Figure 3. As shown in Figure 3a, from March 2023 to January 2024, the percentage of usable Fengyun-4B/GIIRS ATP products below 1050 hPa is significantly lower than those of other vertical levels, which is caused by the interference of the surface to the Fengyun-4B/GIIRS long-wave infrared observations, leading to uncertainty in temperature profile retrieval. After mid-October 2023, the NSMC updated the operational retrieval strategy and provided the missing values below 1050 hPa of the retrieval result. On the contrary, the percentage of usable Fengyun-4B/GIIRS AHP products below 1050 hPa is close to 100%, which suggests that the retrieval process of humidity profiles is negligibly influenced by the surface. For the vertical levels over 1050 hPa, the usability of Fengyun-4B/GIIRS ATP and AHP products mainly varies from 50% to 95%.
For comparison, Figure 4 shows the percentage distributions of the usable operational Fengyun-4A/GIIRS ATP products. A significant boundary line is observed at about 950 hPa, and the percentage below 950 hPa is significantly lower than those of the other levels, which is similar to the phenomenon in Figure 3a, but the boundary line is higher for the Fengyun-4B/GIIRS ATP products, which suggests that the Fengyun-4B/GIIRS ATP products suppress the noise information from the surface more efficiently. For products between 500 hPa and 950 hPa, the percentage of usable Fengyun-4B/GIIRS and Fengyun-4A/GIIRS ATP products is similar, but above 500 hPa, the percentage of usable Fengyun-4B/GIIRS ATP products is larger than that of Fengyun-4A/GIIRS ATP products. Overall, due to the improvement in radiometric and spectral calibration accuracy (from 1.5 K to 0.8 K and from 10 ppm to better than 10 ppm [28]), the usability of the Fengyun-4B/GIIRS ATP products is better than that of the Fengyun-4A/GIIRS ATP products, especially from 100 hPa to 500 hPa and from 950 hPa to 1050 hPa.

3.2. Assessment of Fengyun-4B/GIIRS ATP and AHP Products with Radiosonde Observations

The retrieval algorithm of the Fengyun-4B/GIIRS ATP and AHP products is designed based on the absorbing difference in infrared hyperspectral channels, which may have uncertainty because of instrument manufacturing and other factors; thus, it is necessary to analyze the vertical accuracy of the ATP and AHP products. Furthermore, based on the feedback information from the retrieval process, the NSMC gives different quality flags (“very good”, “good”, “bad”, and “do not use”) to each ATP/AHP retrieval value; thus, it is also necessary to perform the quantitative accuracy assessment of ATP and AHP products with different quality flags, which can provide beneficial information to users. In this section, radiosonde observations of 120 meteorological stations from March 2023 to January 2024 over China are used to assess the Fengyun-4B/GIIRS ATP and AHP products.
Figure 5 shows the vertical distribution of biases and RMSEs between Fengyun-4B/GIIRS ATP products and radiosonde observations. As shown in Figure 5a, the biases of the Fengyun-4B/GIIRS ATP products with the quality flag of “very good” vary from −0.837 K to 0.192 K. For products flagged as “good”, biases are mainly negative, except from 900 hPa to 825 hPa. The biases of products flagged as “bad” and “do not use” are positive below 900 hPa; then, they turn negative above 900 hPa. From Figure 5b, the differences in the RMSE for the vertical distribution of products with four quality flags are evident. The RMSEs for products flagged as “very good”, “good”, and “bad” are around 1.5 K, 3 K, and 4.5 K, respectively, but for products flagged as “bad”, the variation range of RMSEs is quite large, varying from 10.065 K to 24.570 K. By comparing Figure 5a and Figure 6a, it is evident that the vertical distribution of biases for the Fengyun-4B/GIIRS ATP products flagged as “very good” is more stable than that for the Fengyun-4A/GIIRS ATP products and is around 900 hPa, and the biases of the Fengyun-4A/GIIRS ATP products can be over 1.9 K. The RMSEs of the Fengyun-4B/GIIRS and Fengyun-4A/GIIRS ATP products flagged as “very good”, “good”, and “bad” are close, except for the RMSEs of products flagged as “very good” around 900 hPa and flagged as “good” around 1000 hPa.
The values of 200 hPa, 500 hPa, and 850 hPa are normally selected to represent the high-level, middle-level, and low-level troposphere, respectively. The percentage distributions of the biases between Fengyun-4B/GIIRS ATP products, Fengyun-4A/GIIRS ATP products, and radiosonde observations at 200 hPa, 500 hPa, and 850 hPa are presented in Figure 7 and Figure 8, respectively. For the products flagged as “very good”, the percentage distributions of biases are all unimodal and basically have a symmetric structure at 200 hPa, 500 hPa, and 850 hPa. For the product flagged as “good” or “bad”, the percentage distributions of biases mainly have a bimodal structure, which can be improved by using the bias correction method. For the products flagged as “do not use”, the percentage distributions of biases are discrete.
The vertical distribution of biases and RMSEs between the Fengyun-4B/GIIRS AHP products and radiosonde observations is presented in Figure 9. As shown in Figure 9a, the biases of the Fengyun-4B/GIIRS AHP products are mainly negative regardless of the quality flags, indicating that systematic underestimation exists in the Fengyun-4B/GIIRS AHP products. The difference in the RMSE vertical distribution for products with four quality flags is evident, and the RMSE for products flagged as “very good” or “good” is lower than that of the other two categories, which indicates that the current quality flag classification algorithms can effectively identify the high-quality retrieval results.

3.3. Comparison of Fengyun-4B/GIIRS ATP and AHP Products with ERA5 Reanalysis

In comparison to the radiosonde observations, the ERA5 reanalysis has the advantage of spatial and temporal continuity, which can help in assessing the quality of Fengyun-4B/GIIRS ATP and AHP products. In the previous section, the accuracy of the products with four quality flags (very good, good, bad, and do not use) has been validated with radiosonde observations. Furthermore, common users may choose ATP and AHP products flagged as “very good” and “good”. Thus, in this section, only Fengyun-4B/GIIRS ATP products with quality flags of “very good” or “good” from March 2023 to January 2024 are selected to compare with the results of ERA5 reanalysis.
Figure 10 presents vertical and temporal distributions of biases and RMSEs between Fengyun-4B/GIIRS ATP products and ERA5 reanalysis under all-sky, clear-sky, and cloudy-sky conditions. As shown in Figure 10a, the biases are mainly distributed between −0.8 K and 0.4 K. From March to November 2023, biases are mainly positive below 600 hPa and negative above 600 hPa. In the winter, the boundary of positive and negative biases can lower to about 900 hPa. Relatively high positive biases exist between 150 hPa and 100 hPa. Under the clear-sky condition, the Fengyun-4B/GIIRS ATP products mainly overestimate the atmospheric temperature condition, especially under 500 hPa. From mid-June to mid-October 2023, the overestimated condition is rather serious, between 1000 hPa and 700 hPa, and biases can be up to 1.6K. However, under the cloudy-sky condition, the biases are mainly negative from 900 hPa to 150 hPa, indicating an underestimation for Fengyun-4B/GIIRS ATP products. Moreover, the strip with a rather large negative bias exists between 600 hPa and 400 hPa. However, below 900 hPa and over 150 hPa, the biases are mainly positive. As shown in Figure 10c, there is a jump change in biases between the Fengyun-4B/GIIRS ATP products and the ERA5 reanalysis around mid-May 2023, especially over 300 hPa. Since the ERA5 reanalysis is recognized to stably provide an accurate temperature profile, the jump change results from the quality change in the Fengyun-4B/GIIRS ATP products, which may be caused by coefficient changes in the retrieval algorithm. As shown in Figure 10d, the RMSEs between Fengyun-4B/GIIRS ATP products and ERA5 reanalysis under the all-sky condition mainly vary from 1.2 K to 2 K. The RMSEs under the clear-sky condition are mainly below 1.6 K, but from June to September 2023, rather large RMSEs exist between 1000 hPa and 750 hPa, indicating the instability of the retrieval algorithm. By comparing Figure 10e,f, although retrieval algorithms are developed under the clear-sky and cloudy-sky conditions separately, the RMSEs under the cloudy-sky condition are still larger than those under the clear-sky condition, which mainly vary from 1.6 K to 2.4 K, indicating the difficult moving effect of clouds.
In Figure 10a and Figure 11a, there is a strip of rather large negative biases existing between 150 hPa and 100 hPa for both Fengyun-4A/GIIRS and Fengyun-4B/GIIRS ATP products, resulting from the overestimation of those products under the cloudy-sky condition. By comparing Figure 10b and Figure 11b, the positive biases of Fengyun-4B/GIIRS ATP products between 1000 hPa and 500 hPa are systematically larger than those of Fengyun-4A/GIIRS ATP products under the clear-sky condition. Similar RMSE distribution patterns exist in Figure 10e and Figure 11e, but the RMSEs of the Fengyun-4B/GIIRS ATP products are lower than those of the Fengyun-4A/GIIRS ATP products below 800 hPa. The RMSEs between Fengyun-4A/GIIRS ATP products and ERA5 reanalysis are mainly from 1.6K to 2.4K, with a strip of RMSEs from 1.6 K to 2 K between 800 hPa and 600 hPa. Overall, due to the improvement in instruments and retrieval algorithm, by comparing with the Fengyun-4A/GIIRS ATP products, the Fengyun-4B/GIIRS ATP products are closer to the ERA5 reanalysis, especially below 800 hPa under the clear-sky condition.
Overall, vertical biases and RMSEs between the Fengyun-4B/GIIRS ATP products and the ERA5 reanalysis from March 2023 to January 2024 are shown in Figure 12. Biases under the clear-sky condition vary from −0.283 K to 0.675 K and are mainly positive below 300 hPa. For the cloudy-sky condition, biases are negative from 925 hPa to 150 hPa but become positive above the altitude of 150 hPa, which is consistent with the strip of positive biases existing above the altitude of 150 hPa in Figure 10c. The RMSEs under the cloudy-sky condition are rather stable, varying from 1.944 K to 2.245 K. For the clear-sky condition, the variation range of RMSE is larger, varying from 0.770 K to 1.607 K. Overall, the biases and RMSEs of the Fengyun-4B/GIIRS ATP products vary from −0.783 K to 0.341 K and from 1.592 K to 1.976 K, respectively.
Figure 13 presents the vertical distribution of biases and RMSEs between the Fengyun-4A/GIIRS ATP products and the ERA5 reanalysis. As shown in Figure 13a, biases under the all-sky, clear-sky, and cloudy-sky conditions are all negative below 800 hPa and then increase to become positive, which is different from the vertical bias distributions shown in Figure 12a. In Figure 13a, there is a jump change in biases over 150 hPa, and a similar phenomenon is also evident in Figure 12a, suggesting that a similar problem exists in the retrieval process of Fengyun-4A/GIIRS and Fengyun-4B/GIIRS ATP products, which should be improved by algorithm developers. In the comparison of Figure 12b and Figure 13b, the variation range of RMSE under the clear-sky condition is larger than that under the cloudy-sky condition, which suggests that the current operational retrieval algorithm may mistakenly include cloudy pixels in the retrieval process of ATP products under the clear-sky condition.
The percentage distributions of the biases between the Fengyun-4B/GIIRS ATP products and the ERA5 reanalysis at 200 hPa, 500 hPa, and 850hPa are presented in Figure 14. As shown in Figure 14a–c, the percentages of biases with values between −2 K to 2 K under the all-sky condition at 200 hPa, 500 hPa, and 850 hPa are 70.0%, 74.6%, and 73.7%, respectively, demonstrating that the quality of the Fengyun-4B/GIIRS ATP products at the middle-level troposphere is better than those at the high-level and the low-level troposphere. These percentages increase to 92.0%, 95.7%, and 84.4% under the clear-sky condition, but they decrease to 58.9%, 50.8%, and 61.5% under the cloud-sky condition. Furthermore, under the cloud-sky condition, the biases at the high-level and the middle-level troposphere are all mainly negative, which is consistent with the phenomenon shown in Figure 10c.
For the Fengyun-4A/GIIRS ATP products, 69.8%, 77.8%, and 66.1% of samples matched under the all-sky condition, and biases are between −2 K and 2 K. Similar to the Fengyun-4B/GIIRS ATP products, the quality of Fengyun-4A/GIIRS ATP products at 500 hPa is better than that at other two pressure levels. By comparing Figure 14d–f and Figure 15d–f, it is evident that the percentage distributions of biases under the clear-sky condition at 200 hPa and 500 hPa are similar, but at 850 hPa, the percentage distributions of biases for the Fengyun-4A/GIIRS ATP products are wider, which may result from surface noise.
As shown in Figure 16a, the Fengyun-4B/GIIRS AHP products mainly underestimate the atmospheric humidity condition under the all-sky condition. The biases are mainly from −0.8 kg/kg to −0.4 kg/kg below 500 hPa and from −0.4 kg/kg to 0.4 kg/kg above 500 hPa. Under the cloudy-sky condition, the underestimation of Fengyun-4B/GIIRS AHP product is even more severe. Especially around 850 hPa, biases can be over −1.2 kg/kg. Due to the vertical distribution of water vapour in the atmosphere, the vertical stratification phenomenon of RMSEs is very evident (Figure 16d–f), and the RMSEs decrease with the decreasing pressure. By comparing Figure 16e,f, it is evident that the vertical stratification phenomenon is more stable and has weaker seasonal variability under the clear-sky condition than under the cloudy-sky condition, and the boundaries of vertical stratification move upward in the summer and downward in the winter.
Figure 17 presents the vertical distribution of the biases and RMSEs between the Fengyun-4B/GIIRS AHP products and the ERA5 reanalysis. The biases under the clear-sky and cloudy-sky conditions show similar vertical variation patterns, all of which decrease, then increase with the increase in the altitude, and finally decrease to nearly zero. As for the vertical distribution of the RMSEs, the RMSEs under the all-sky, clear-sky, and cloudy-sky conditions all decrease with the increase in the altitude, and the RMSEs under the clear-sky condition are smaller than those under the cloudy-sky condition at all pressure levels.
Overall, compared to ERA5 reanalysis, the biases of Fengyun-4B/GIIRS and Fengyun-4A/GIIRS ATP products are mainly distributed between −2 K and 2 K, indicating that the operational retrieval algorithm can produce a temperature profile with rather high quality. However, there are systemic underestimation under clear-sky conditions and overestimation under cloudy-sky conditions, which may be caused by using different coefficients in the current operational retrieval algorithm and should be improved in future algorithms.

3.4. Dependence Analysis of Fengyun-4B/GIIRS ATP and AHP Products with Satellite Scan Angle

Since Fengyun-4B is a geostationary meteorological satellite, with the increase in the satellite scan angle, the optical depth between Fengyun-4B/GIIRS and Earth also increases, which may lead to uncertainty pertaining to the Fengyun-4B/GIIRS ATP and AHP products; thus, it is necessary to analyze their dependence on satellite scan angles. To exclude the effect of clouds and land surfaces, only matched samples over the ocean under clear-sky conditions are selected. Furthermore, 200 hPa, 500 hPa, and 850 hPa are selected to investigate the dependence at the high-level, the middle-level, and the low-level troposphere. Figure 18a,b present variations in biases and RMSEs between the Fengyun-4B/GIIRS ATP products and the ERA5 reanalysis with respect to satellite zenith angles calculated at 1° intervals. As shown in Figure 18a, biases at 200 hPa remain positive and biases at 500 hPa and 850 hPa remain negative at any satellite zenith angle. Biases at 200 hPa and 500 hPa have a negligible relationship with satellite zenith angles when the angles are less than about 50°, and then the biases decrease gradually when the satellite zenith angles are above 50°. For biases at 850 hPa, they decrease with the increase in the satellite zenith angles, and when the satellite zenith angles are more than 50°, the decreasing trend of bias is even more evident. The RMSEs at 200 hPa are maintained at about 0.82 K when the satellite zenith angles are less than 8°, and they decrease when the satellite zenith angles are between 8° and 11°. Similar variation patterns also exist for RMSEs at 850 hPa. When the satellite zenith angles are above 50°, the increase trends of RMSEs at 200 hPa, 500 hPa, and 850 hPa are more evident. For comparison, variations in biases and RMSEs between the Fengyun-4A/GIIRS ATP products and the ERA5 reanalysis with respect to the satellite zenith angles are presented in Figure 19. Biases and RMSEs are stable when the satellite zenith angles are less than 50°. When the satellite zenith angles are above 50°, the biases at 200 hPa, 500 hPa, and 850 hPa all exhibit a jump change, and the RMSEs at 200 hPa, 500 hPa, and 850 hPa all have a significant positive relationship with the satellite zenith angles.
As shown in Figure 18c,d, biases and RMSEs between Fengyun-4B/GIIRS AHP products and ERA5 reanalysis at 200 hPa and 500 hPa have a negligible relationship with the satellite zenith angles. For biases at 850 hPa, they gradually increase with the satellite zenith angles when the angles are less than 50°, and then they significantly increase from −0.608 kg/kg to −2.507 kg/kg when the satellite zenith angles increase from 50° to 60°. The RMSEs at 850 hPa show similar variation patterns, in which they gradually increase at first and then significantly increase when the satellite zenith angles are above 50°.
Huang et al. [29] indicated that the traditional radiation simulation methods of hyperspectral infrared sounders often overlook the influence of slant observation geometry by using the vertical profile assumption, leading to inadequate simulation accuracy. In the operational retrieval algorithm, the NSMC first calculates regression coefficients separately under the clear-sky and cloudy conditions using the global profile database and its simulated radiation, and in the radiation simulation process, the slant path effects are not accurately considered, which leads to the significant dependence of Fengyun-4B/GIIRS ATP and AHP products on satellite scan angles, especially when the satellite scan angles are greater than 50°.

4. Discussion

The quality of the operational Fengyun-4B/GIIRS ATP and AHP products is assessed using radiosonde observations and the ERA5 reanalysis in this study, and the study results may provide beneficial information to the developers of retrieval algorithms and the users of ATP and AHP products. Further studies can be carried out as follows:
(1)
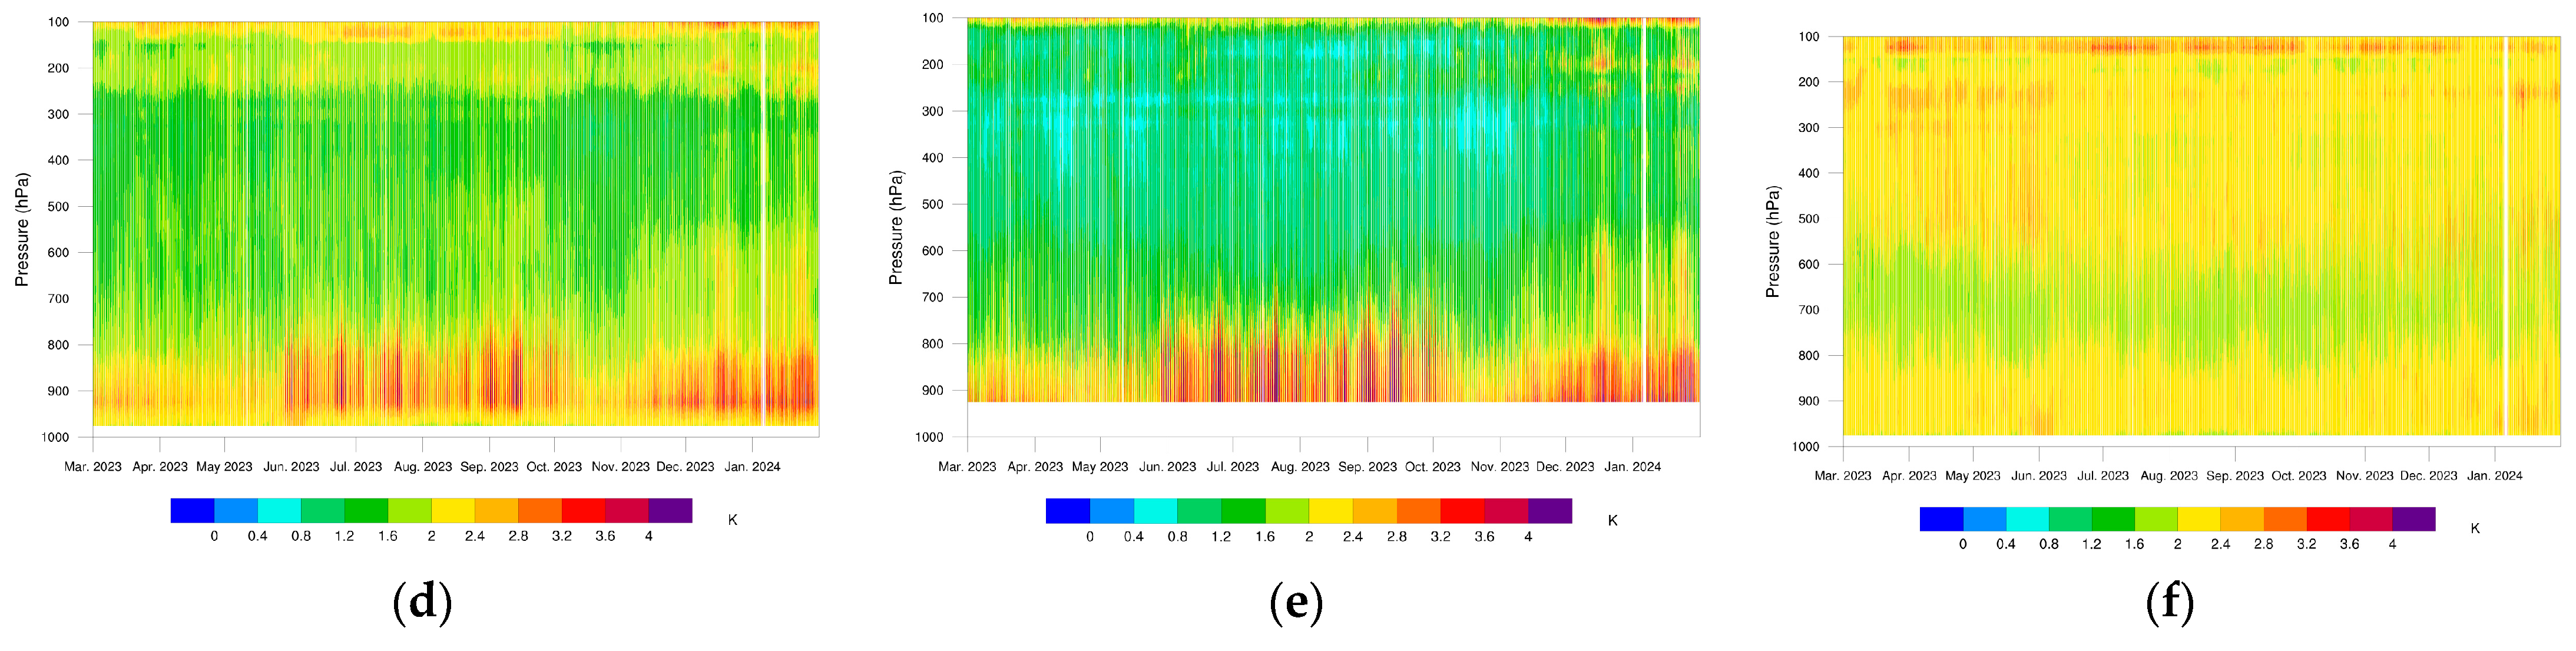
In this study, due to the spatiotemporal distribution discontinuity of radiosonde observations, the ERA5 reanalysis is used to analyze vertical and temporal bias characteristics of the Fengyun-4B/GIIRS ATP and AHP products. Although the ERA5 reanalysis is considered to be an advanced atmospheric product, it may not be a substitute for radiosonde observations [30]. Thus, in future studies, in the comparison of the Fengyun-4B/GIIRS products and the ERA5 reanalysis, the uncertainty of the ERA5 reanalysis should be considered.
(2)
The Fengyun-4B/GIIRS ATP and AHP products were assessed in this study over a period of 11 months (from March 2023 to January 2024). Such an assessment should be performed for a longer time (for example, two years) to investigate the stability of the operational retrieval algorithm.
(3)
With the development of the artificial intelligence technology, new retrieval algorithms, such as convolutional neural networks [31,32,33], etc., should be fully tested and compared with the current operational algorithm of the NSMC, which may help improve the accuracy of the operational Fengyun-4B/GIIRS ATP and AHP products.

5. Conclusions

Fengyun-4B/GIIRS is the second operational interferometric infrared sounder carried by a geostationary meteorological satellite and is an improved version of Fengyun-4A/GIIRS. The NSMC released the operational Fengyun-4B/GIIRS ATP and AHP products based on a double-regression retrieval algorithm, providing spatially and temporally continuous atmospheric temperature and humidity information around China, which can be used for precipitation-type diagnosis, cold wave monitoring, and other meteorological applications. To achieve the quantitative application of the Fengyun-4B/GIIRS ATP and AHP products, their accuracy should be assessed comprehensively in advance. In this study, we analyzed the characteristics of quality flags for the Fengyun-4B/GIIRS ATP and AHP products, and their accuracy was assessed using radiosonde observations and ERA5 reanalysis. The main conclusions drawn from this study are as follows:
  • When compared to Fengyun-4A/GIIRS, Fengyun-4B/GIIRS can provide more usable ATP products (with the quality flags of “very good” and “good”) under both clear-sky and cloudy-sky conditions. The percentage of usable Fengyun-4B/GIIRS AHP products can be over 86%. The interference of the surface leads to a low usability of Fengyun-4B/GIIRS ATP products below 1000 hPa, which should be avoided in relevant applications.
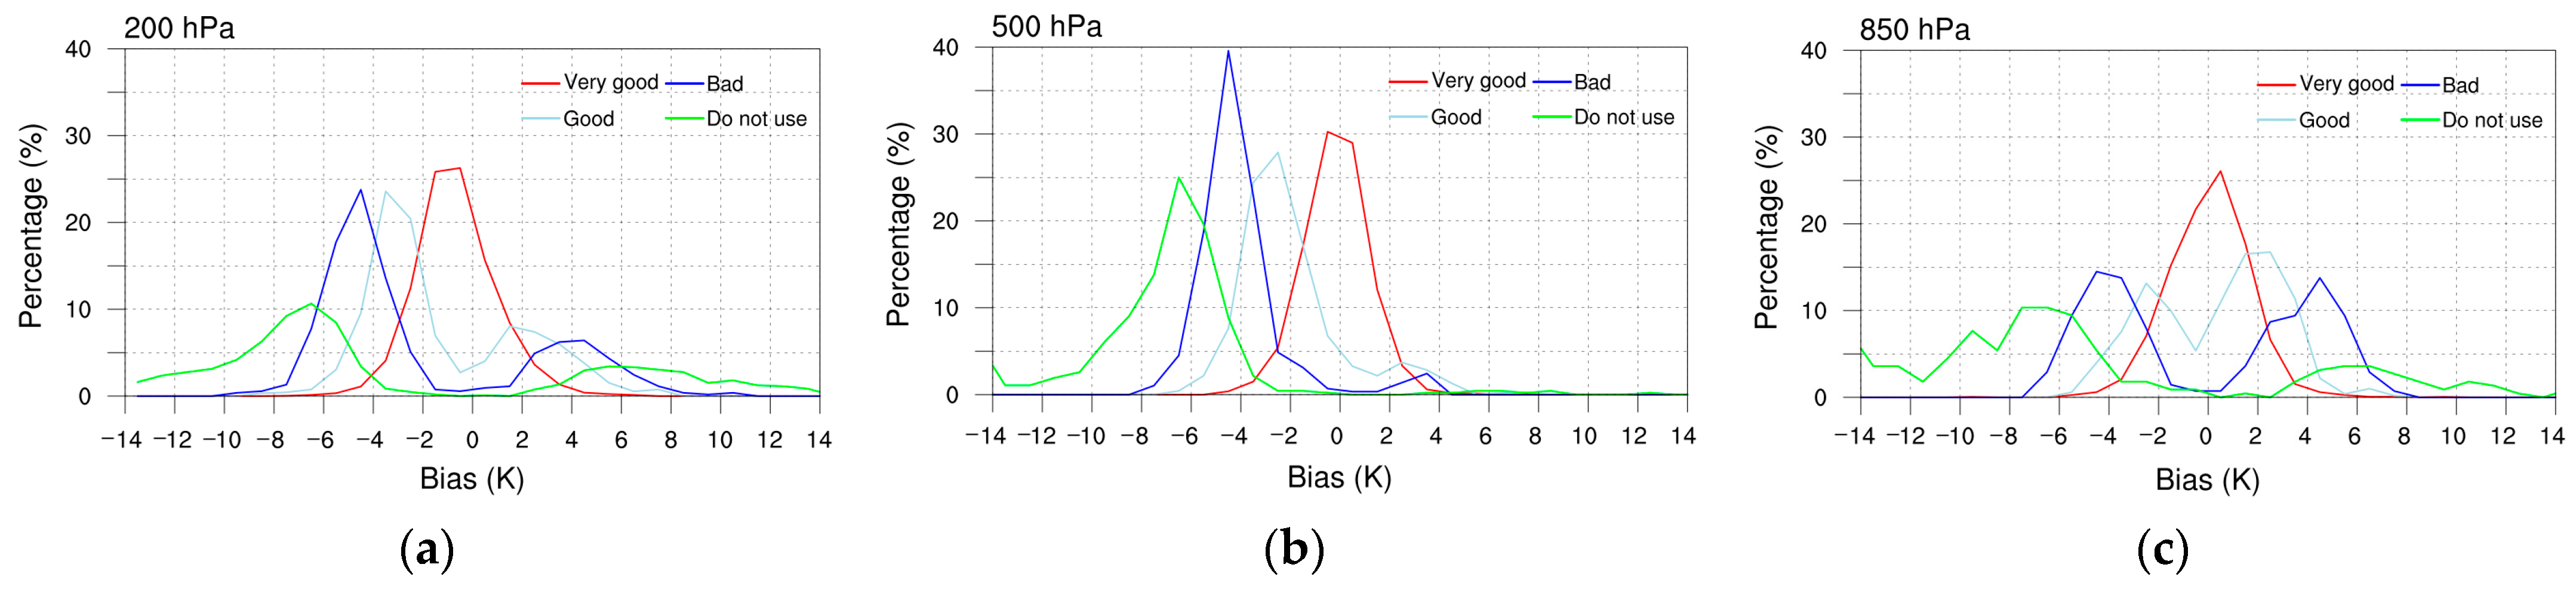
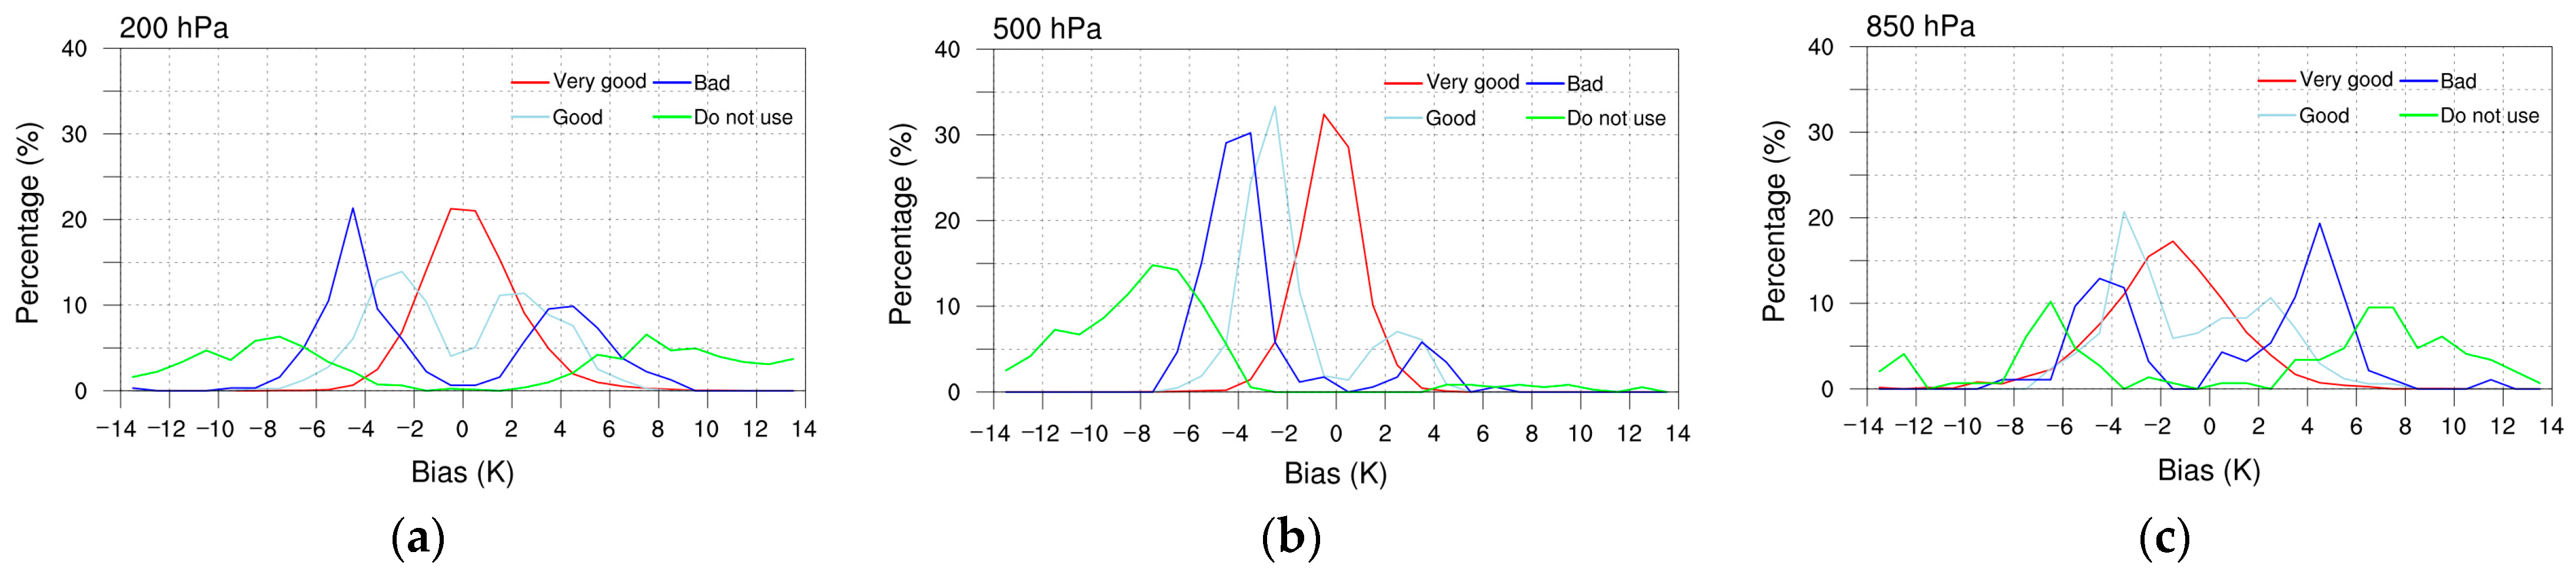
  • The assessment based on radiosonde observations demonstrates that the current quality flag algorithm can classify the Fengyun-4B/GIIRS ATP and AHP products well with different accuracies. Biases of Fengyun-4B/GIIRS ATP products with the best quality (with the quality flags of “very good”) vary from −0.837 K to 0.192 K vertically, and their RMSEs are mainly around 1.5 K, statistically outperforming the Fengyun-4A/GIIRS ATP products.
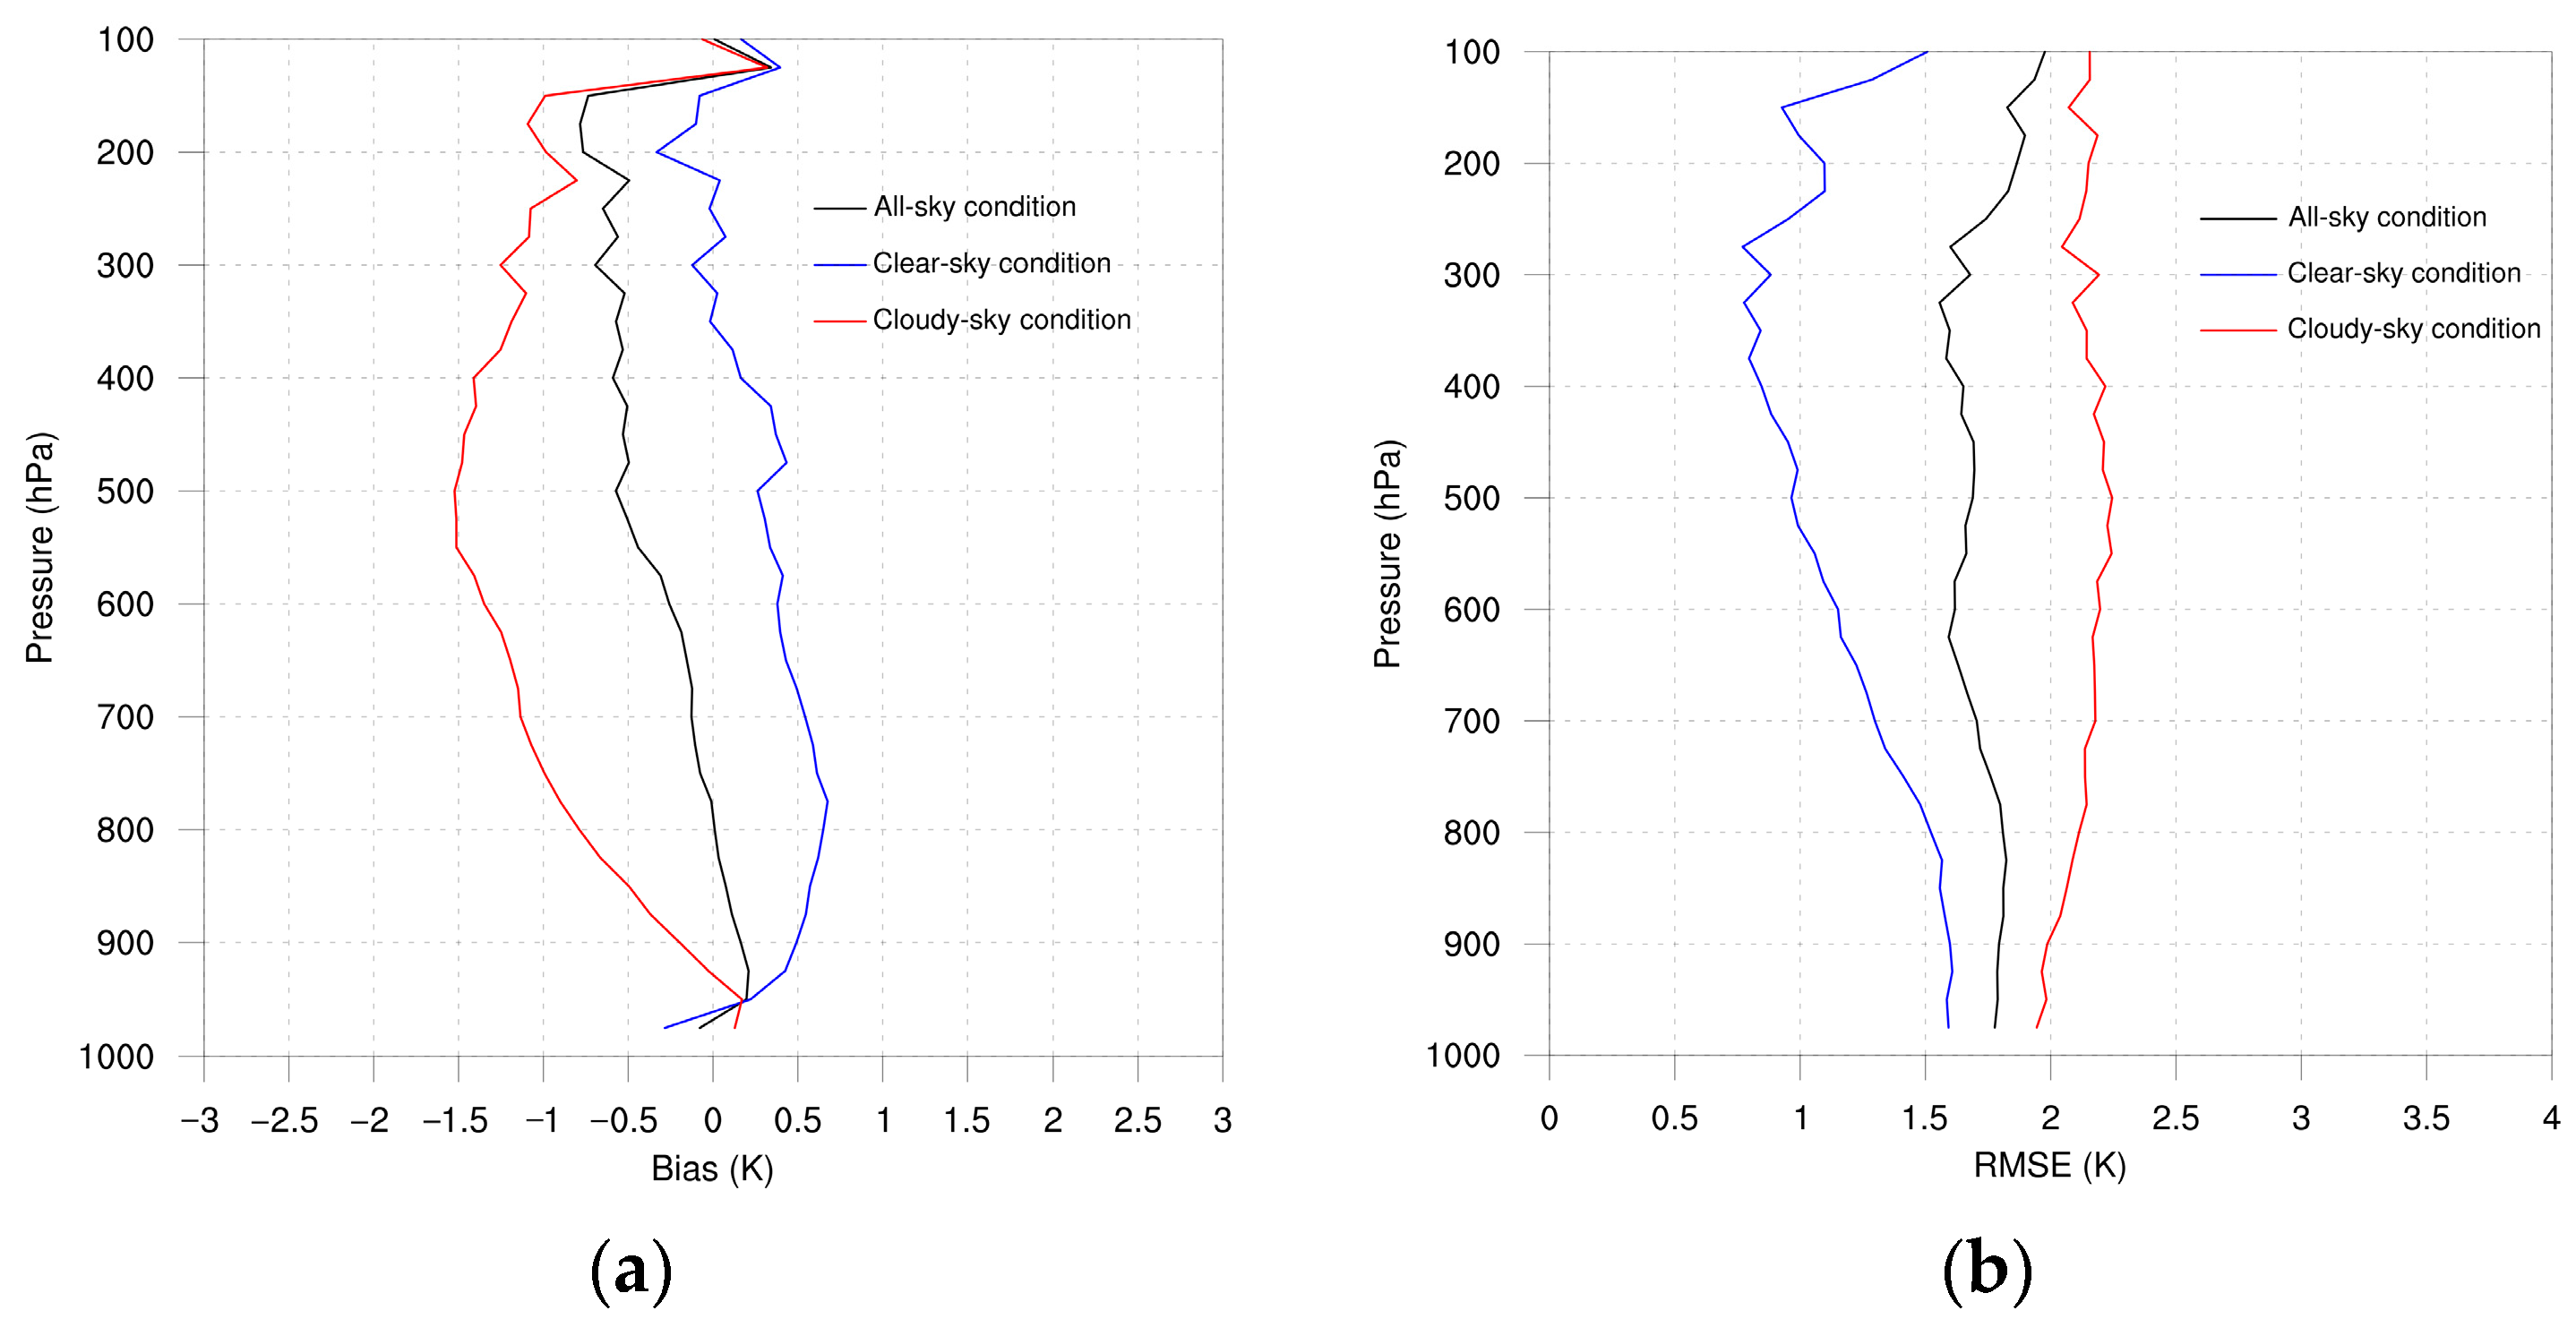
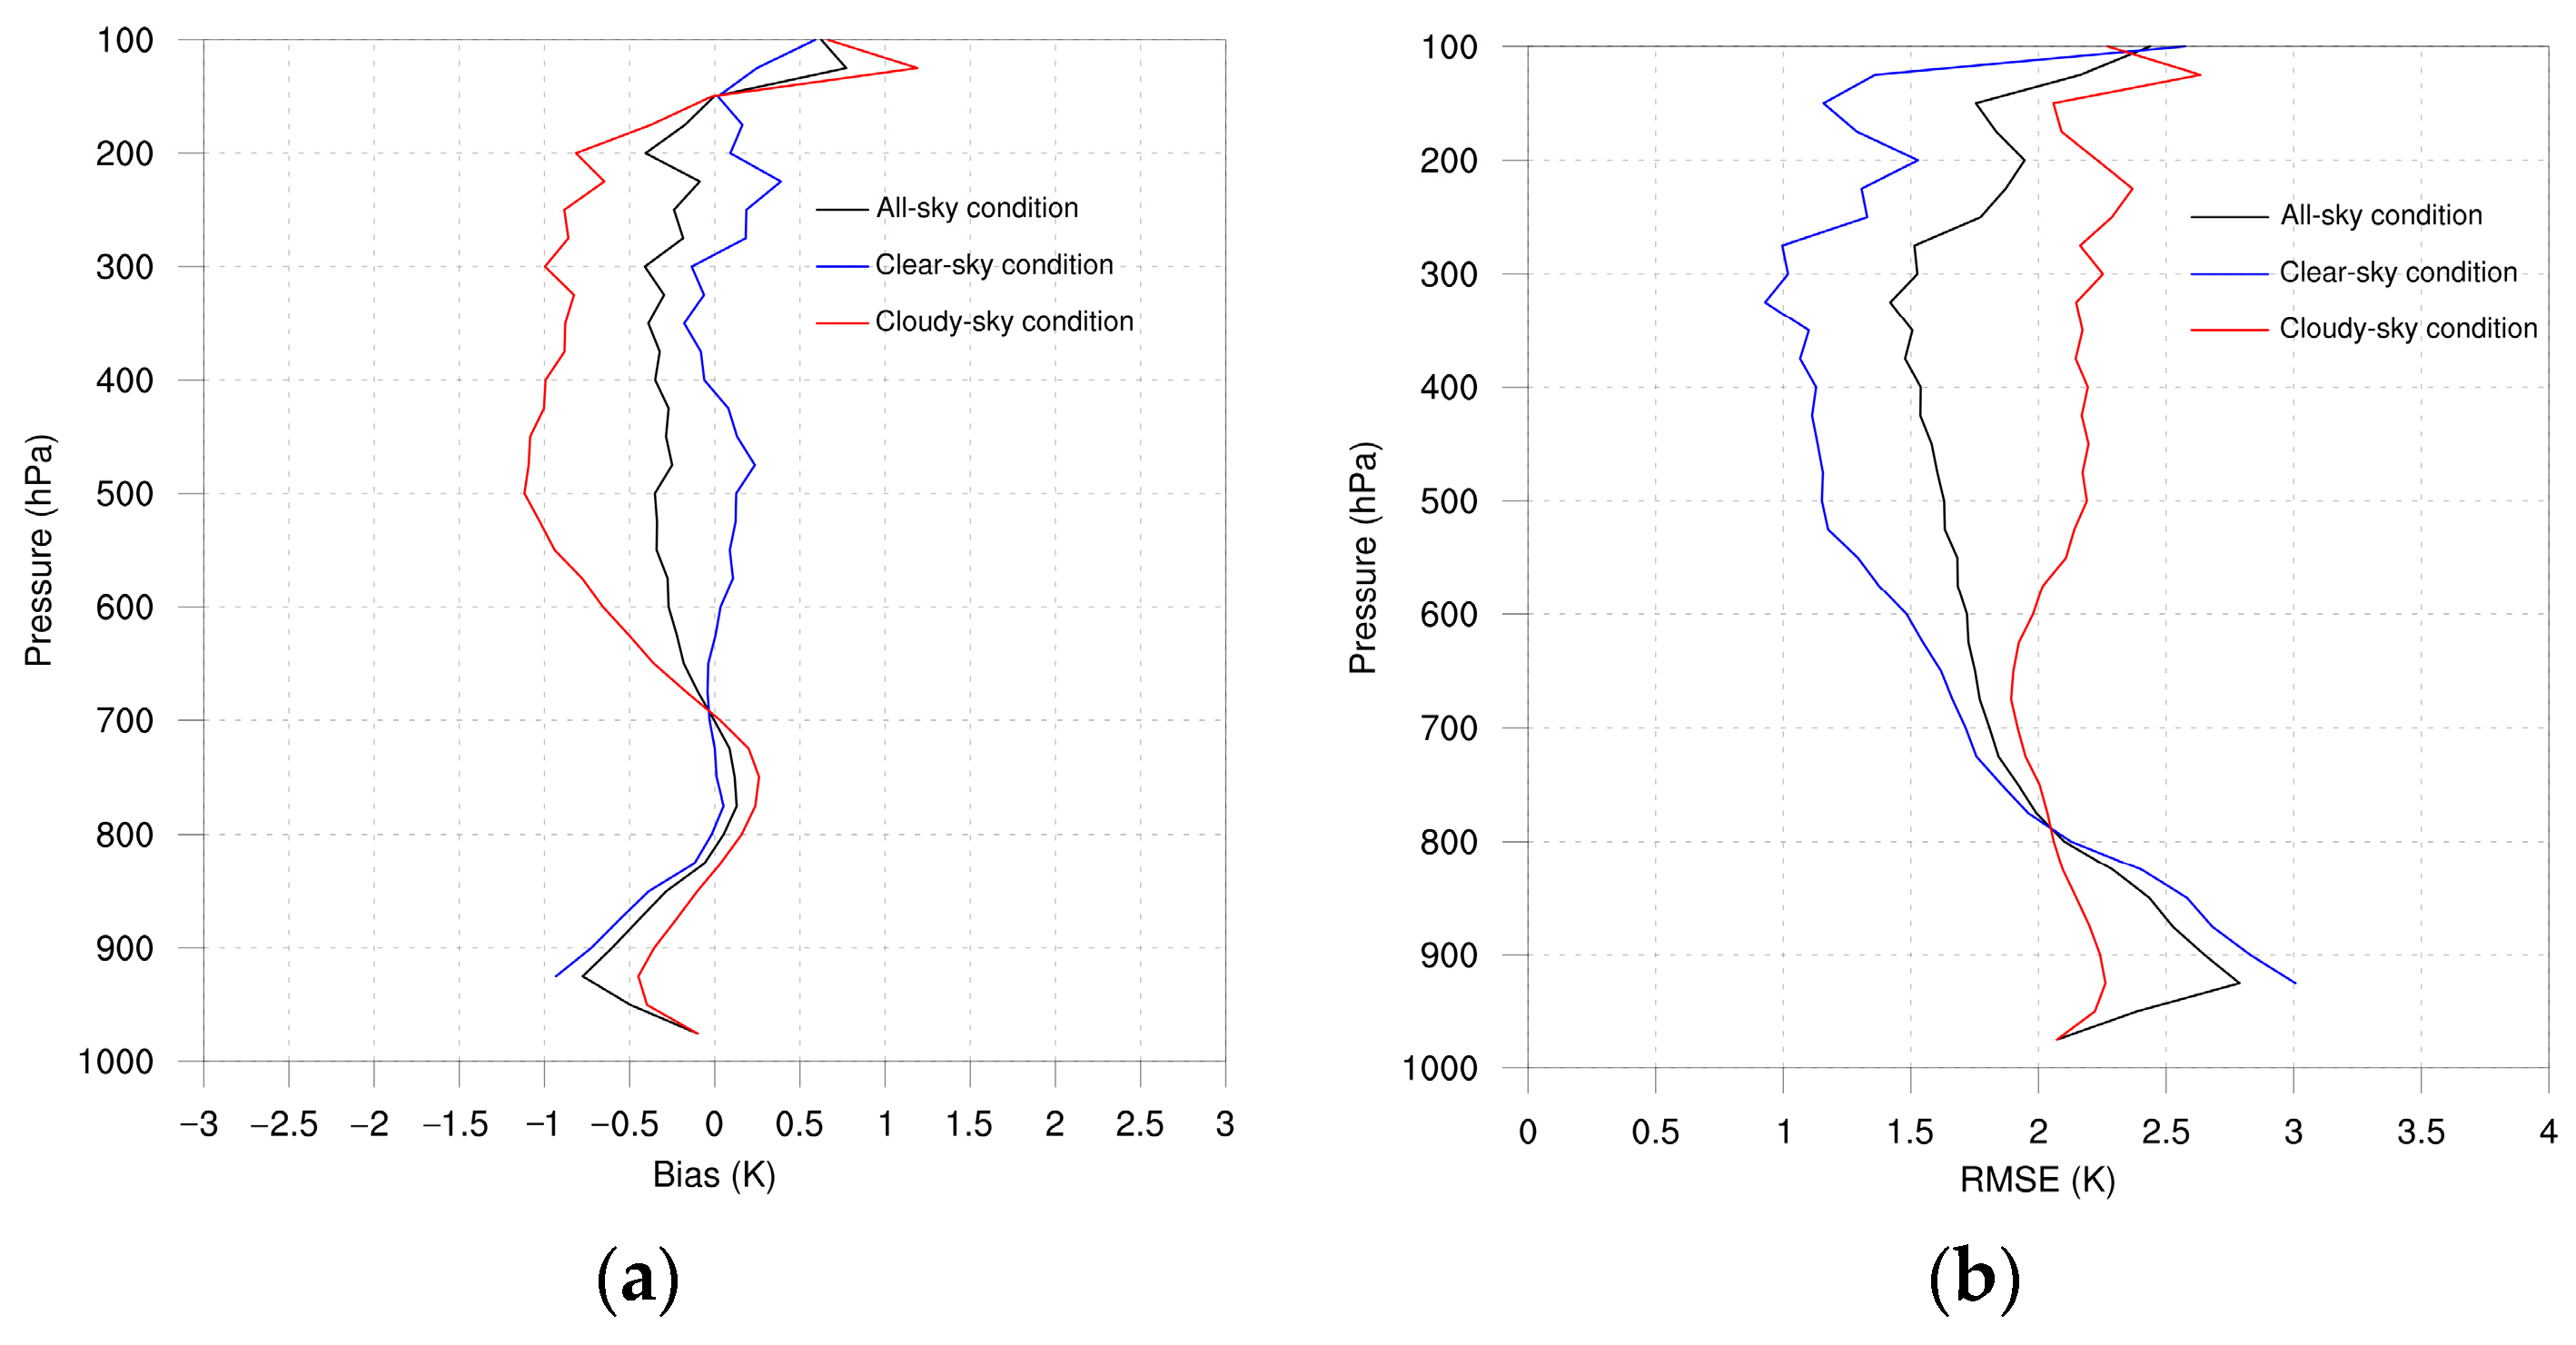
  • Using the ERA5 reanalysis as reference, the usable Fengyun-4B/GIIRS ATP products mainly underestimate and overestimate atmospheric conditions under clear-sky and cloudy-sky conditions, respectively. A similar phenomenon is also observed in Fengyun-4A/GIIRS ATP products, which suggests that the current NSMC operational retrieval algorithm may need further improvement to avoid systematic errors. However, for usable Fengyun-4B/GIIRS AHP products, a major underestimation exists under both clear-sky and cloudy-sky conditions.
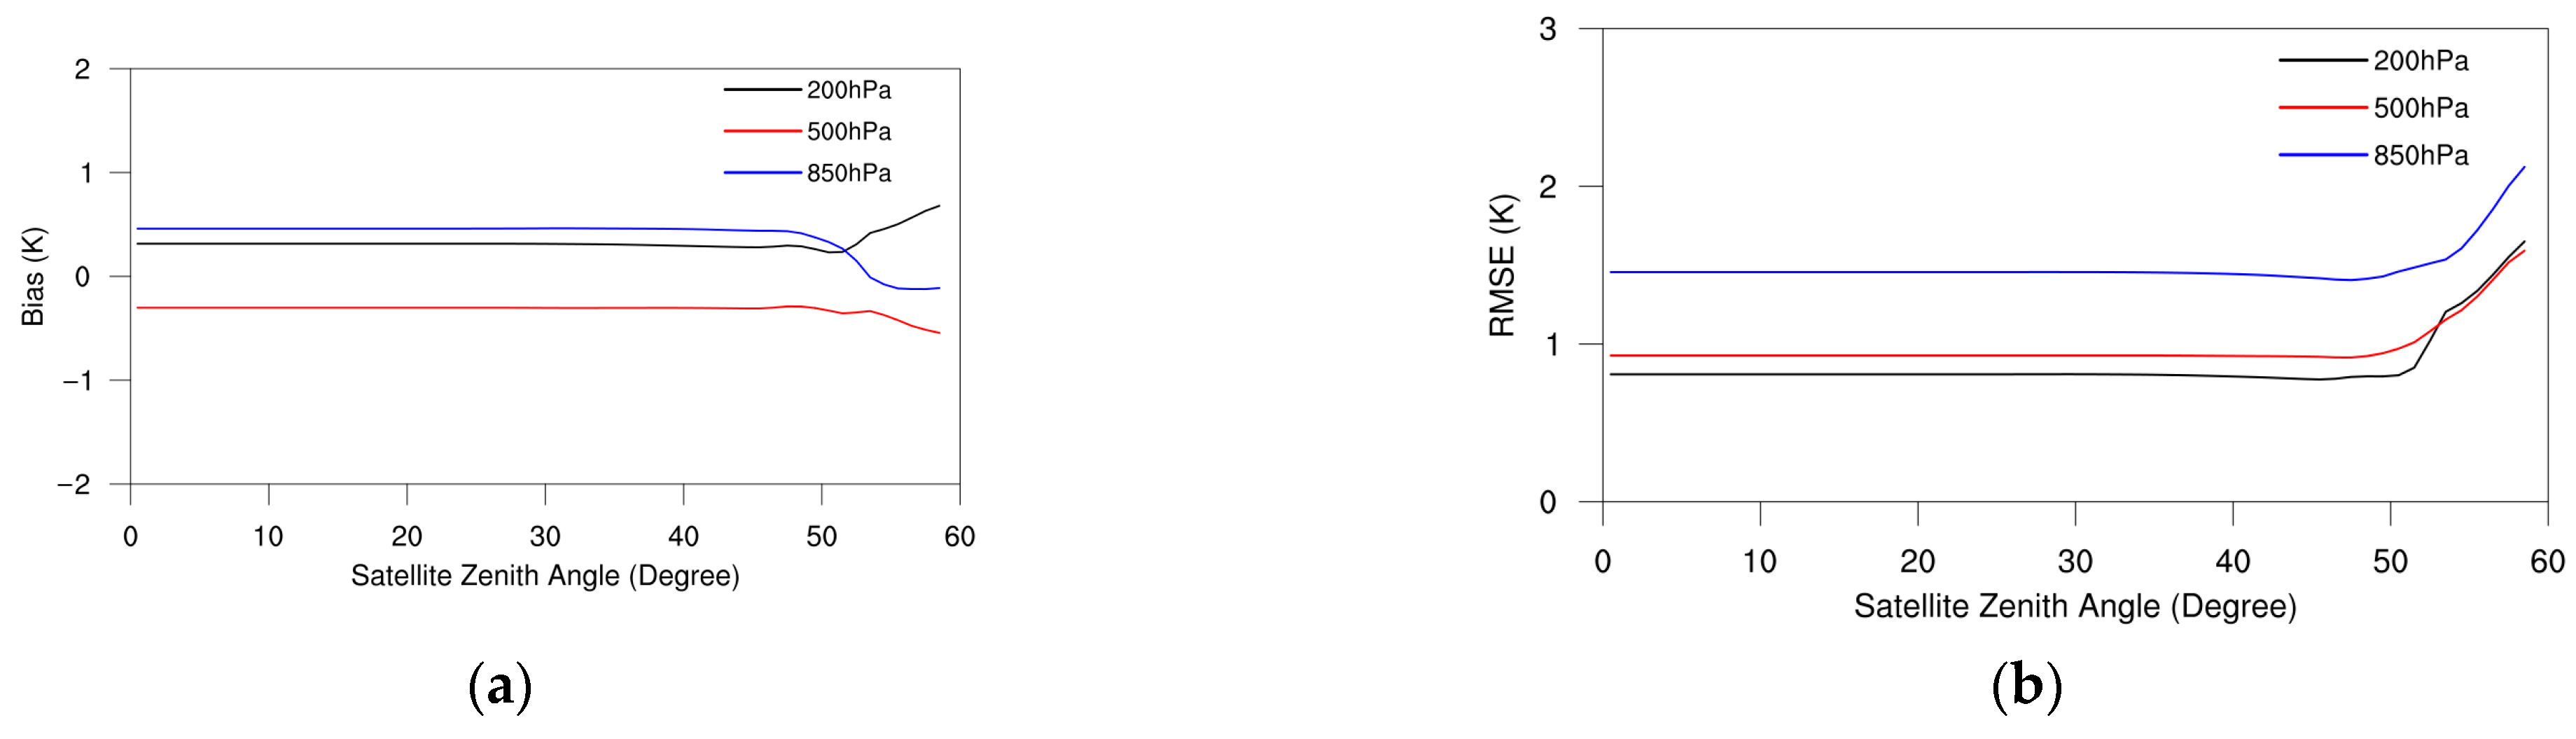
  • Biases and RMSEs of the usable Fengyun-4B/GIIRS and Fengyun-4A/GIIRS ATP products at the low-level, the mid-level, and the high-level troposphere all show a significant positive relationship with the satellite zenith angles when the angles are over 50°. For the usable Fengyun-4B/GIIRS AHP products, biases and RMSEs at the low-level troposphere seem to have a positive correlation with the satellite zenith angles when the angles are over 50°; however, for biases and RMSEs at the mid-level and the high-level troposphere, this relationship is insignificant. These findings suggest that the influence of the atmospheric slant path should be considered for ATP and AHP retrieval when the satellite zenith angles are over 50°.

Author Contributions

Conceptualization, Z.Z. and J.G.; methodology, Z.Z. and C.S.; writing—original draft preparation, Z.Z.; writing—review and editing, Z.Z. and F.Y. All authors have read and agreed to the published version of the manuscript.

Funding

This study was funded by the China Desert Meteorological Science Research Fund and the Tree Ring Research Fund (Grant No. Sqj2023013), the Innovation Foundation of Key Laboratory of Cloud-Precipitation Physics and Weather Modification (Grant No. 2023CPML-B08), the National Natural Science Foundation of China (Grant No. U2342217, 42430602) and the China Meteorological Administration Youth Innovation Team Fund (Grant No. CMA2024QN05).

Data Availability Statement

No new data were created or analyzed in this study. Data sharing is not applicable to this article.

Acknowledgments

The authors would like to thank the NSMC of the CMA for providing Fengyun-4B/GIIRS and Fengyun-4A/GIIRS data (http://satellite.nsmc.org.cn/, accessed on 10 December 2024) and the ECMWF for providing ERA5 reanalysis data (https://cds.climate.copernicus.eu, accessed on 15 December 2024). The authors also would like to thank the anonymous reviewers for their valuable comments and constructive suggestions, which greatly helped us to improve the quality of this manuscript.

Conflicts of Interest

The authors declare no conflicts of interest.

References

  1. National Satellite Meteorological Center. FY-4B Satellite. Available online: http://www.nsmc.org.cn/nsmc/en/satellite/FY4B.html (accessed on 22 January 2025).
  2. Liu, H.; Bai, W.; Ma, G.; Wang, G.; Zhang, P.; Zhang, W.; Li, J.; Wang, X.; Ao, Y.; Shen, Q. Neural network temperature and moisture retrieval technique for real-time processing of FengYun-4B/GIIRS hyperspectral radiances. Meteorol. Atmos. Phys. 2024, 136, 36. [Google Scholar] [CrossRef]
  3. Niu, Z.; Zhang, L.; Han, Y.; Dong, P.; Huang, W. Performances between the FY-4A/GIIRS and FY-4B/GIIRS Long-Wave InfraRed (LWIR) channels under clear-sky and all-sky conditions. Q. J. R. Meteorol. Soc. 2023, 149, 1612–1628. [Google Scholar] [CrossRef]
  4. Wang, W.; Huang, P.; Xu, N.; Li, J.; Di, D.; Zhang, Z.; Gao, L.; Ji, Z.; Min, M. Evaluating the First Year On-Orbit Radiometric Calibration Performance of GIIRS Onboard Fengyun-4B. IEEE Geosci. Remote Sens. Lett. 2024, 21, 1–5. [Google Scholar] [CrossRef]
  5. Niu, Z.; Wang, L.; Kumar, P. Scale Analysis of Typhoon In-Fa (2021) Based on FY-4A Geostationary Interferometric Infrared Sounder (GIIRS) Observed and All-Sky-Simulated Brightness Temperature. Remote Sens. 2023, 15, 4035. [Google Scholar] [CrossRef]
  6. Cai, X.; Bao, Y.; Petropoulos, G.P.; Lu, F.; Lu, Q.; Zhu, L.; Wu, Y. Temperature and Humidity Profile Retrieval from FY4-GIIRS Hyperspectral Data Using Artificial Neural Networks. Remote Sens. 2020, 12, 1872. [Google Scholar] [CrossRef]
  7. He, M.; Wang, D.H.; Ding, W.Y.; Wan, Y.J.; Chen, Y.H.; Zhang, Y. A Validation of Fengyun4A Temperature and Humidity Profile Products by Radiosonde Observations. Remote Sens 2019, 11, 2039. [Google Scholar] [CrossRef]
  8. Di, D.; Li, J.; Han, W.; Bai, W.G.; Wu, C.Q.; Menzel, W.P. Enhancing the Fast Radiative Transfer Model for FengYun-4 GIIRS by Using Local Training Profiles. J. Geophys. Res. Atmos. 2018, 123, 12583–12596. [Google Scholar] [CrossRef]
  9. Xue, Q.; Guan, L.; Shi, X. One-Dimensional Variational Retrieval of Temperature and Humidity Profiles from the FY4A GIIRS. Adv. Atmos. Sci. 2022, 39, 471–486. [Google Scholar] [CrossRef]
  10. Huang, P.Y.; Guo, Q.; Han, C.P.; Zhang, C.M.; Yang, T.H.; Huang, S. An Improved Method Combining ANN and 1D-Var for the Retrieval of Atmospheric Temperature Profiles from FY-4A/GIIRS Hyperspectral Data. Remote Sens. 2021, 13, 481. [Google Scholar] [CrossRef]
  11. Yao, S.H.; Guan, L. Comparison of Three Convolution Neural Network Schemes to Retrieve Temperature and Humidity Profiles from the FY4A GIIRS Observations. Remote Sens 2022, 14, 5112. [Google Scholar] [CrossRef]
  12. Yin, R.; Han, W.; Gao, Z.; Li, J. Impact of High Temporal Resolution FY-4A Geostationary Interferometric Infrared Sounder (GIIRS) Radiance Measurements on Typhoon Forecasts: Maria (2018) Case with GRAPES Global 4D-Var Assimilation System. Geophys. Res. Lett. 2021, 48, e2021GL093672. [Google Scholar] [CrossRef]
  13. Feng, J.; Qin, X.H.; Wu, C.Q.; Zhang, P.; Yang, L.; Shen, X.S.; Han, W.; Liu, Y.Z. Improving typhoon predictions by assimilating the retrieval of atmospheric temperature profiles from the FengYun-4A’s Geostationary Interferometric Infrared Sounder (GIIRS). Atmos. Res. 2022, 280, 106391. [Google Scholar] [CrossRef]
  14. Guo, Q.; Yang, J.; Wei, C.; Chen, B.; Wang, X.; Han, C.; Hui, W.; Xu, W.; Wen, R.; Liu, Y. Spectrum calibration of the first hyperspectral infrared measurements from a geostationary platform: Method and preliminary assessment. Q. J. R. Meteorol. Soc. 2021, 147, 1562–1583. [Google Scholar] [CrossRef]
  15. Wang, S.; Lu, F.; Feng, Y. An Investigation of the Fengyun-4A/B GIIRS Performance on Temperature and Humidity Retrievals. Atmos. 2022, 13, 1830. [Google Scholar] [CrossRef]
  16. Gao, Y.; Mao, D.; Wang, X.; Qin, D. Evaluation of FY-4A Temperature Profile Products and Application to Winter Precipitation Type Diagnosis in Southern China. Remote Sens. 2022, 14, 2363. [Google Scholar] [CrossRef]
  17. Ren, S.; Jiang, J.; Fang, X.; Liu, H.; Cao, Z. FY-4A/GIIRS Temperature Validation in Winter and Application to Cold Wave Monitoring. J. Meteor. Res. 2022, 36, 658–676. [Google Scholar] [CrossRef]
  18. Gao, Y.; Wang, X.; Mao, D. Performance of FY-4B GIIRS temperature products under cloudy skies and their enhancement of surface precipitation type forecasting. Atmos. Res. 2024, 302, 107305. [Google Scholar] [CrossRef]
  19. Yan, X.S.; Chen, Y.D.; Ma, G.; Qin, L.Y.; Zhang, P.; Gong, X.Y. A 3-D Cloud Detection Method for FY-4A GIIRS and Its Application in Operational Numerical Weather Prediction System. IEEE Trans. Geosci. Remote Sens. 2023, 61, 4105213. [Google Scholar] [CrossRef]
  20. Yin, R.; Han, W. Impact of Targeted Sounding Observations from FY-4B GIIRS on Two Super Typhoon Forecasts in 2024. IEEE Geosci. Remote Sens. Lett. 2025, 22, 5500805. [Google Scholar] [CrossRef]
  21. Shou, Y.X. Introduction to FY-4B Atmospheric Parameter Products. Available online: http://img.nsmc.org.cn/PORTAL/NSMC/VIDEO/FY4B/20230818/09-Atmosphere_Properties.pdf (accessed on 7 March 2025).
  22. Wang, G.; Han, W.; Yuan, S.; Wang, J.; Yin, R.Y.; Ye, S.; Xie, F. Retrieval of High-Frequency Temperature Profiles by FY-4A/GIIRS Based on Generalized Ensemble Learning. J. Meteorol. Soc. Jpn. 2024, 102, 241–264. [Google Scholar] [CrossRef]
  23. National Satellite Meteorological Center. Announcement on FY-4A and FY-4B Position Drift and Operation Service Pending. Available online: http://www.nsmc.org.cn/nsmc/en/news/130451.html (accessed on 22 January 2025).
  24. Yuan, F.; Zhou, Z.; Liao, J.; Li, Q. A quality control method for high-resolution radiosonde temperature and winddata. Atmos. Ocean. Sci. Lett. 2021, 14, 100029. [Google Scholar] [CrossRef]
  25. Hersbach, H.; Bell, B.; Berrisford, P.; Hirahara, S.; Horanyi, A.; Munoz-Sabater, J.; Nicolas, J.; Peubey, C.; Radu, R.; Schepers, D.; et al. The ERA5 global reanalysis. Q. J. R. Meteorol. Soc. 2020, 146, 1999–2049. [Google Scholar] [CrossRef]
  26. Soci, C.; Hersbach, H.; Simmons, A.; Poli, P.; Bell, B.; Berrisford, P.; Horanyi, A.; Munoz-Sabater, J.; Nicolas, J.; Radu, R.; et al. The ERA5 global reanalysis from 1940 to 2022. Q. J. R. Meteorol. Soc. 2024, 150, 4014–4048. [Google Scholar] [CrossRef]
  27. China Meteorological Administration. Statistical Methods for Upperair Climate Data. Available online: https://www.cma.gov.cn/zfxxgk/gknr/flfgbz/bz/202102/t20210210_2720389.html (accessed on 22 January 2025).
  28. National Satellite Meteorological Center. Geostationary Interferometric Infrared Sounder (GIIRS). Available online: http://www.nsmc.org.cn/nsmc/cn/instrument/GIIRS.html (accessed on 7 March 2025).
  29. Huang, P.; Li, J.; Min, M.; Li, Z.; Di, D.; Anantharaj, V.; Ahn, M.-H. Influence of Atmospheric Slant Path on Geostationary Hyperspectral Infrared Sounder Radiance Simulations. Geophys. Res. Lett. 2024, 51, e2024GL110579. [Google Scholar] [CrossRef]
  30. Jacobs, A.; Top, S.; Vergauwen, T.; Suomi, J.; Käyhkö, J.; Caluwaerts, S. Filling gaps in urban temperature observations by debiasing ERA5 reanalysis data. Urban Clim. 2024, 58, 102226. [Google Scholar] [CrossRef]
  31. Jiang, P.; Liu, R.Y.; Huo, Y.F.; Wu, Y.L.; Ye, S.R.; Wang, S.C.; Mu, X.; Zhu, L. Retrieving the Atmospheric Water Vapor Profile Combining FY-4A/GIIRS and Ground-Based GNSS PWV in Hong Kong Region. IEEE Trans. Geosci. Remote Sens. 2025, 63, 4100809. [Google Scholar] [CrossRef]
  32. Renju, R.; Raju, C.S.; Swathi, R.; Milan, V.G. Retrieval of atmospheric temperature and humidity profiles over a tropical coastal station from ground-based Microwave Radiometer using deep learning technique. J. Atmos. Sol.-Terr. Phys. 2023, 249, 106094. [Google Scholar] [CrossRef]
  33. Zhang, L.W.; Ma, Y.Y.; Lei, L.F.; Wang, Y.J.; Jin, S.K.; Gong, W. Improving Atmospheric Temperature and Relative Humidity Profiles Retrieval Based on Ground-Based Multichannel Microwave Radiometer and Millimeter-Wave Cloud Radar. Atmosphere 2024, 15, 1064. [Google Scholar] [CrossRef]
Figure 1. Percentage distributions of quality flags for Fengyun-4B/GIIRS (a) ATP and (b) AHP products under all-sky, clear-sky, and cloudy-sky conditions from March 2023 to January 2024.
Remotesensing 17 01353 g001
Figure 2. Percentage distributions of quality flags for Fengyun-4A/GIIRS ATP products under all-sky, clear-sky, and cloudy-sky conditions from March 2023 to January 2024.
Remotesensing 17 01353 g002
Figure 3. Percentage of quality flags with values of “very good” or “good” out of all valid pixels for (a) Fengyun-4B/GIIRS ATP and (b) AHP products from March 2023 to January 2024 (white colour indicates missing data).
Remotesensing 17 01353 g003
Figure 4. Percentage of quality flags with values of “good” or “very good” out of all valid pixels for Fengyun-4A/GIIRS ATP products from March 2023 to January 2024 (white colour indicates missing data).
Remotesensing 17 01353 g004
Figure 5. Vertical distribution of (a) biases and (b) RMSEs between Fengyun-4B/GIIRS ATP products and radiosonde observations.
Remotesensing 17 01353 g005
Figure 6. Vertical distribution of (a) biases and (b) RMSEs between Fengyun-4A/GIIRS ATP products and radiosonde observations.
Remotesensing 17 01353 g006
Figure 7. Percentage distributions of biases between Fengyun-4B/GIIRS ATP products and radiosonde observations at (a) 200 hPa, (b) 500 hPa, and (c) 850 hPa.
Remotesensing 17 01353 g007
Figure 8. Percentage distributions of biases between Fengyun-4A/GIIRS ATP products and radiosonde observations at (a) 200 hPa, (b) 500 hPa, and (c) 850 hPa.
Remotesensing 17 01353 g008
Figure 9. Vertical distribution of (a) biases and (b) RMSEs for Fengyun-4B/GIIRS AHP products with different quality flags under all-sky, clear-sky, and cloudy-sky conditions.
Remotesensing 17 01353 g009
Figure 10. Vertical and temporal distributions of (ac) biases and (df) RMSEs between the Fengyun-4B/GIIRS ATP products and the ERA5 reanalysis under the (a,d) all-sky, (b,e) clear-sky, and (c,f) cloudy-sky conditions.
Remotesensing 17 01353 g010
Figure 11. Vertical and temporal distributions of (ac) biases and (df) RMSEs between Fengyun-4A/GIIRS ATP products and ERA5 reanalysis under (a,d) all-sky, (b,e) clear-sky, and (c,f) cloudy-sky conditions.
Remotesensing 17 01353 g011aRemotesensing 17 01353 g011b
Figure 12. Vertical (a) biases and (b) RMSEs between Fengyun-4B/GIIRS ATP products and ERA5 reanalysis under all-sky, clear-sky, and cloudy-sky conditions.
Remotesensing 17 01353 g012
Figure 13. Vertical (a) biases and (b)RMSEs between Fengyun-4A/GIIRS ATP products and ERA5 reanalysis under all-sky, clear-sky, and cloudy-sky conditions.
Remotesensing 17 01353 g013
Figure 14. Percentage distributions of biases between Fengyun-4B/GIIRS ATP products and ERA5 reanalysis at (a,d,g) 200 hPa, (b,e,h) 500 hPa, and (c,f,i) 850 hPa under (ac) all-sky, (df) clear-sky, and (gi) cloudy-sky conditions.
Remotesensing 17 01353 g014aRemotesensing 17 01353 g014b
Figure 15. Percentage distributions of biases between Fengyun-4A/GIIRS ATP products and ERA5 reanalysis at (a,d,g) 200 hPa, (b,e,h) ~500 hPa, and (c,f,i) ~850 hPa under (ac) all-sky, (df) clear-sky, and (gi) cloudy-sky conditions.
Remotesensing 17 01353 g015
Figure 16. Vertical and temporal distributions of (ac) biases and (df) RMSEs between Fengyun-4B/GIIRS AHP products and ERA5 reanalysis under (a,d) all-sky, (b,e) clear-sky, and (c,f) cloudy-sky conditions.
Remotesensing 17 01353 g016
Figure 17. Vertical distribution of (a) biases and (b) RMSEs for Fengyun-4B/GIIRS AHP products with ERA5 reanalysis as reference under all-sky, clear-sky, and cloudy-sky conditions.
Remotesensing 17 01353 g017
Figure 18. (a,c) Biases and (b,d) RMSEs between Fengyun-4B/GIIRS (a,b) ATP and (c,d) AHP products and ERA5 reanalysis, with respect to satellite zenith angles calculated at 1° intervals over ocean under clear-sky conditions from March 2023 to January 2024.
Remotesensing 17 01353 g018
Figure 19. (a) Biases and (b) RMSEs of Fengyun-4A/GIIRS ATP products with ERA5 reanalysis as reference, with respect to satellite zenith angles calculated at 1° intervals over ocean under clear-sky conditions from March 2023 to January 2024.
Remotesensing 17 01353 g019
Disclaimer/Publisher’s Note: The statements, opinions and data contained in all publications are solely those of the individual author(s) and contributor(s) and not of MDPI and/or the editor(s). MDPI and/or the editor(s) disclaim responsibility for any injury to people or property resulting from any ideas, methods, instructions or products referred to in the content.

