Article

Can Separation Enhance Fusion? An Efficient Framework for Target Detection in Multimodal Remote Sensing Imagery

1
School of Electronic Engineering, Xidian University, Xi’an 710071, China
2
The 27th Research Institute of CETC, Zhengzhou 450047, China
3
Key Laboratory of Intelligent Perception and Image Understanding of Ministry of Education of China, School of Artificial Intelligence, Xidian University, Xi’an 710071, China
4
School of Telecommunications Engineering, Xidian University, Xi’an 710071, China
5
Key Laboratory of Shaanxi Provincial Higher Education Institutions for Vortex Electromagnetic Wave Communication, Sensing and Anti-Interference Integration, Shaanxi University of Technology, Hanzhong 723000, China
*
Author to whom correspondence should be addressed.
These authors contributed equally to this work.
Remote Sens. 2025, 17(8), 1350; https://doi.org/10.3390/rs17081350
Submission received: 28 February 2025 / Revised: 4 April 2025 / Accepted: 7 April 2025 / Published: 10 April 2025
(This article belongs to the Special Issue Remote Sensing Image Thorough Analysis by Advanced Machine Learning)

Abstract

:
Target detection in remote sensing images has garnered significant attention due to its wide range of applications. Many traditional methods primarily rely on unimodal data, which often struggle to address the complexities of remote sensing environments. Furthermore, small-target detection remains a critical challenge in remote sensing image analysis, as small targets occupy only a few pixels, making feature extraction difficult and prone to errors. To address these challenges, this paper revisits the existing multimodal fusion methodologies and proposes a novel framework of separation before fusion (SBF). Leveraging this framework, we present Sep-Fusion—an efficient target detection approach tailored for multimodal remote sensing aerial imagery. Within the modality separation module (MSM), the method separates the three RGB channels of visible light images into independent modalities aligned with infrared image channels. Each channel undergoes independent feature extraction through the unimodal block (UB) to effectively capture modality-specific features. The extracted features are then fused using the feature attention fusion (FAF) module, which integrates channel attention and spatial attention mechanisms to enhance multimodal feature interaction. To improve the detection of small targets, an image regeneration module is exploited during the training stage. It incorporates the super-resolution strategy with attention mechanisms to further optimize high-resolution feature representations for subsequent positioning and detection. Sep-Fusion is currently developed on the YOLO series to make itself a potential real-time detector. Its lightweight architecture enables the model to achieve high computational efficiency while maintaining the desired detection accuracy. Experimental results on the multimodal VEDAI dataset show that Sep-Fusion achieves 77.9% mAP50, surpassing many state-of-the-art models. Ablation experiments further illustrate the respective contribution of modality separation and attention fusion. The adaptation of our multimodal method to unimodal target detection is also verified on NWPU VHR-10 and DIOR datasets, which proves Sep-Fusion to be a suitable alternative to current detectors in various remote sensing scenarios.

1. Introduction

Target detection in remote sensing imagery (RSI) is a crucial task in numerous applications, such as urban planning, environmental monitoring, disaster response, autonomous driving, and military reconnaissance [1,2]. The rapid progress of satellite and aerial imaging technologies, along with the increasing availability of high-resolution remote sensing data, has revolutionized automated target detection capabilities [3].
Visible light images contain rich structural and textural information that aids in identifying target shapes, colors, and finer details. Traditional target detection methods for visible light images can be typically categorized into two groups: two-stage and one-stage detection algorithms. Two-stage methods, such as Fast R-CNN [4], Faster R-CNN [5], and TOOD [6], first generate candidate boxes and later refine these predictions. While these algorithms offer high accuracy, they come at the cost of significant computational complexity. One-stage algorithms such as the YOLO series [7] eliminate candidate box generation by directly predicting target locations and classifications. This design significantly enhances computational efficiency, particularly benefiting real-time applications. However, visible light-based target detection might be highly sensitive to environmental factors such as lighting, weather conditions, and shadows, which can significantly degrade the quality under adverse conditions such as nighttime or foggy environments [8].
To address the limitations of solely relying on visible light images, many studies have explored target detection tasks built on data from other modalities, such as infrared (IR) images. IR images capture thermal radiation emitted by targets, making them effective for detecting thermal sources and identifying targets even when obscured by fog, smoke, or other obstacles. Every coin has two sides. IR images often lack fine-grained structural details, making it challenging to differentiate targets with similar thermal characteristics [9].
To overcome these shortcomings, the fusion of infrared and visible images has been suggested, combining both strengths to enhance target detection performance. For example, as shown in Figure 1, fusing the two modalities can significantly improve detection accuracy compared to using a single modality. There are various methods for fusing infrared and visible light images, ranging from traditional approaches to recent deep learning techniques [10]. Traditional fusion methods can be categorized into multi-scale decomposition [11,12], saliency-based [13], sparse representation [14], optimization-based [15], and hybrid methods [16]. These methods aim to preserve the important features from both modalities while reducing the impact of noise and redundant information. However, traditional fusion techniques face challenges, such as failing to fully consider the inherent differences between infrared and visible light images, and many methods apply the same transformation or representation to both modalities, which may not adequately capture their unique characteristics.
Deep learning-based fusion methods employ pixel-level, feature-level, or decision-level fusion networks [17]. Pixel-level fusion simply concatenates the different modalities, which reduces computational complexity but introduces considerable redundant information, potentially impacting the fusion quality. Decision-level fusion models only combines the final detection results, which do not exploit the complementary information and deep interactions between the modalities. Feature-level fusion networks, on the other hand, extract and merge the features of different modalities, effectively addressing the differences between modalities while reducing data redundancy.
Even though image fusion methods have made significant progress in recent years, one of the major challenges in RSI-based target detection is small-target detection. Small targets are generally defined through absolute scale and relative proportion criteria. The absolute scale refers to targets occupying ≤32 × 32 pixels (1024 pixels) in standard 640 × 480 resolution images, as established by MS COCO [18] and adopted in optical remote sensing studies. The relative scale is defined by the area proportion threshold of targets within an image, typically benchmarked at <0.12% (corresponding to <80 pixels in 256 × 256-pixel frames) as per the SPIE [19] guidelines. Compared to larger targets, small targets typically occupy only a small portion of the overall image and lack distinct features, making them more difficult to detect in both infrared and visible images. The resolution of RSI can also be limited by sensor capabilities and atmospheric interference, further complicating small-target detection. Therefore, improving detection accuracy, particularly for small targets, remains a key focus for researchers in the field of RSI-based target detection [20,21,22,23].
Current target detectors typically process color images holistically, neglecting to explicitly model the distinct functional roles of individual RGB channels. Generally, color images are composed of three basic color channels, which are red, green, and blue (RGB). Each channel contains different visual information in the image. Nonetheless, the indiscriminate treatment of these channels ignores the different importance that individual color channels may have. Studies have shown [24] that in terms of feature representation, different color channels have different contributions to image feature extraction, which may be crucial to the subsequent detection task.
To address these issues, we propose a novel target detection approach, termed separation before fusion (Sep-Fusion). It incorporates a multimodal image fusion strategy and an attention-driven mechanism to enhance target detection performance and highlights the importance of channel separation before subsequent fusion operations. Our method is designed to effectively combine RGB and IR images, leveraging their complementary features to improve detection accuracy. The key innovations of this paper are as follows:
(1) We propose a novel concept of “separation before fusion (SBF)” for multimodal RS target detection. By introducing a modality separation module (MSM), we separate visible light images into the R, G, and B channels and treat each channel as an individual modality, such as the IR channel. This module allows for more precise feature extraction from each modality, enabling the model to better capture channel-specific target information. We also design a unimodal block (UB) to extract features from each channel separately, capturing more fine-grained information for the detection task.
(2) We employ the feature attention fusion (FAF) module to fuse the features after the MSM. We propose a spatial–channel attention mechanism (SCAM), which integrates both channel attention and spatial attention to enhance the important features within each modality. Further, the SCAM also helps the FAF module to fuse the fine-grained information between these modalities.
(3) We introduce an image regeneration module and utilize the SCAM to boost small-target detection performance. By formulating the small-target detection problem as an image super-resolution problem, low-resolution small targets can evolve into high-resolution targets through image reconstruction. By exploiting the SCAM attention, this module not only enhances the key information extracted at different scales, but also strengthens the features after the fusion of low-level and high-level features, thereby improving the quality of the reconstructed image, as well as the sensitivity to detecting small targets.
The structure of this paper is as follows: Section 2 reviews the related work; Section 3 introduces the network architecture and innovative modules of Sep-Fusion; Section 4 presents quantitative experimental results to verify the effectiveness of our method; Section 5 conducts an extended experiment to quantitatively verify why separation is needed before fusion; Section 6 concludes the paper and discusses future research directions.

2. Related Work

2.1. Unimodal Remote Sensing Target Detection

One-stage detection algorithms, renowned for their efficiency, directly predict target locations and categories without the need for region proposals. The YOLO (You Only Look Once) series has been a benchmark in this field, evolving from YOLOv1 [7] to a more advanced YOLOv10 [25]. These models focus on real-time performance and maintain high accuracy, making them well-suited for low-latency applications. Among them, YOLOv4 [26] introduced cross-stage partial networks (CSPNet) to improve feature propagation, while YOLOv5 [27] further enhanced training efficiency and model flexibility. Recent iterations, such as YOLOv8 [28] and YOLOv10, have incorporated attention mechanisms and transformer-based modules, demonstrating continuous improvements. Other notable one-stage methods include EfficientDet [29], which uses EfficientNet as its backbone and a BiFPN (bidirectional feature pyramid network) for optimal multi-scale feature fusion, and FCOS [30], which simplifies the detection pipeline by eliminating anchor boxes, excelling in dense-target detection tasks.
Two-stage detection algorithms, such as Faster R-CNN [5], adopt a proposal-based approach, generating candidate regions first and refining them in a subsequent step. These methods are celebrated for their high accuracy and robustness in complex scenarios. Cascade R-CNN [31] extends this pipeline with multiple refinement stages, enhancing performance on challenging datasets. Sparse R-CNN [32] introduces sparse proposals and dynamic convolutions, reducing computational demands while maintaining precision. TOOD [6] (task-aligned one-stage object detection) combines the characteristics of one-stage and two-stage methods and enhances feature representation and detection accuracy through task-aligned learning. Despite their strengths, two-stage models often have slower inference speeds due to their complexity. Researchers have sought to integrate lightweight backbones and attention mechanisms to improve efficiency.
In this study, our approach follows the one-stage strategy and selects the YOLO series as the backbone for its lightweight architecture and high inference efficiency. To ensure a fair comparison with mainstream multimodal remote sensing detection methods, which predominantly utilize YOLOv5-based networks, we rigorously evaluate YOLOv5 and YOLOv8 as our backbone candidates. However, it should be noted that our framework retains modular flexibility, enabling seamless replacement of the backbone with other advanced architectures to meet diverse application-specific requirements and performance objectives.

2.2. Multimodal Remote Sensing Target Detection
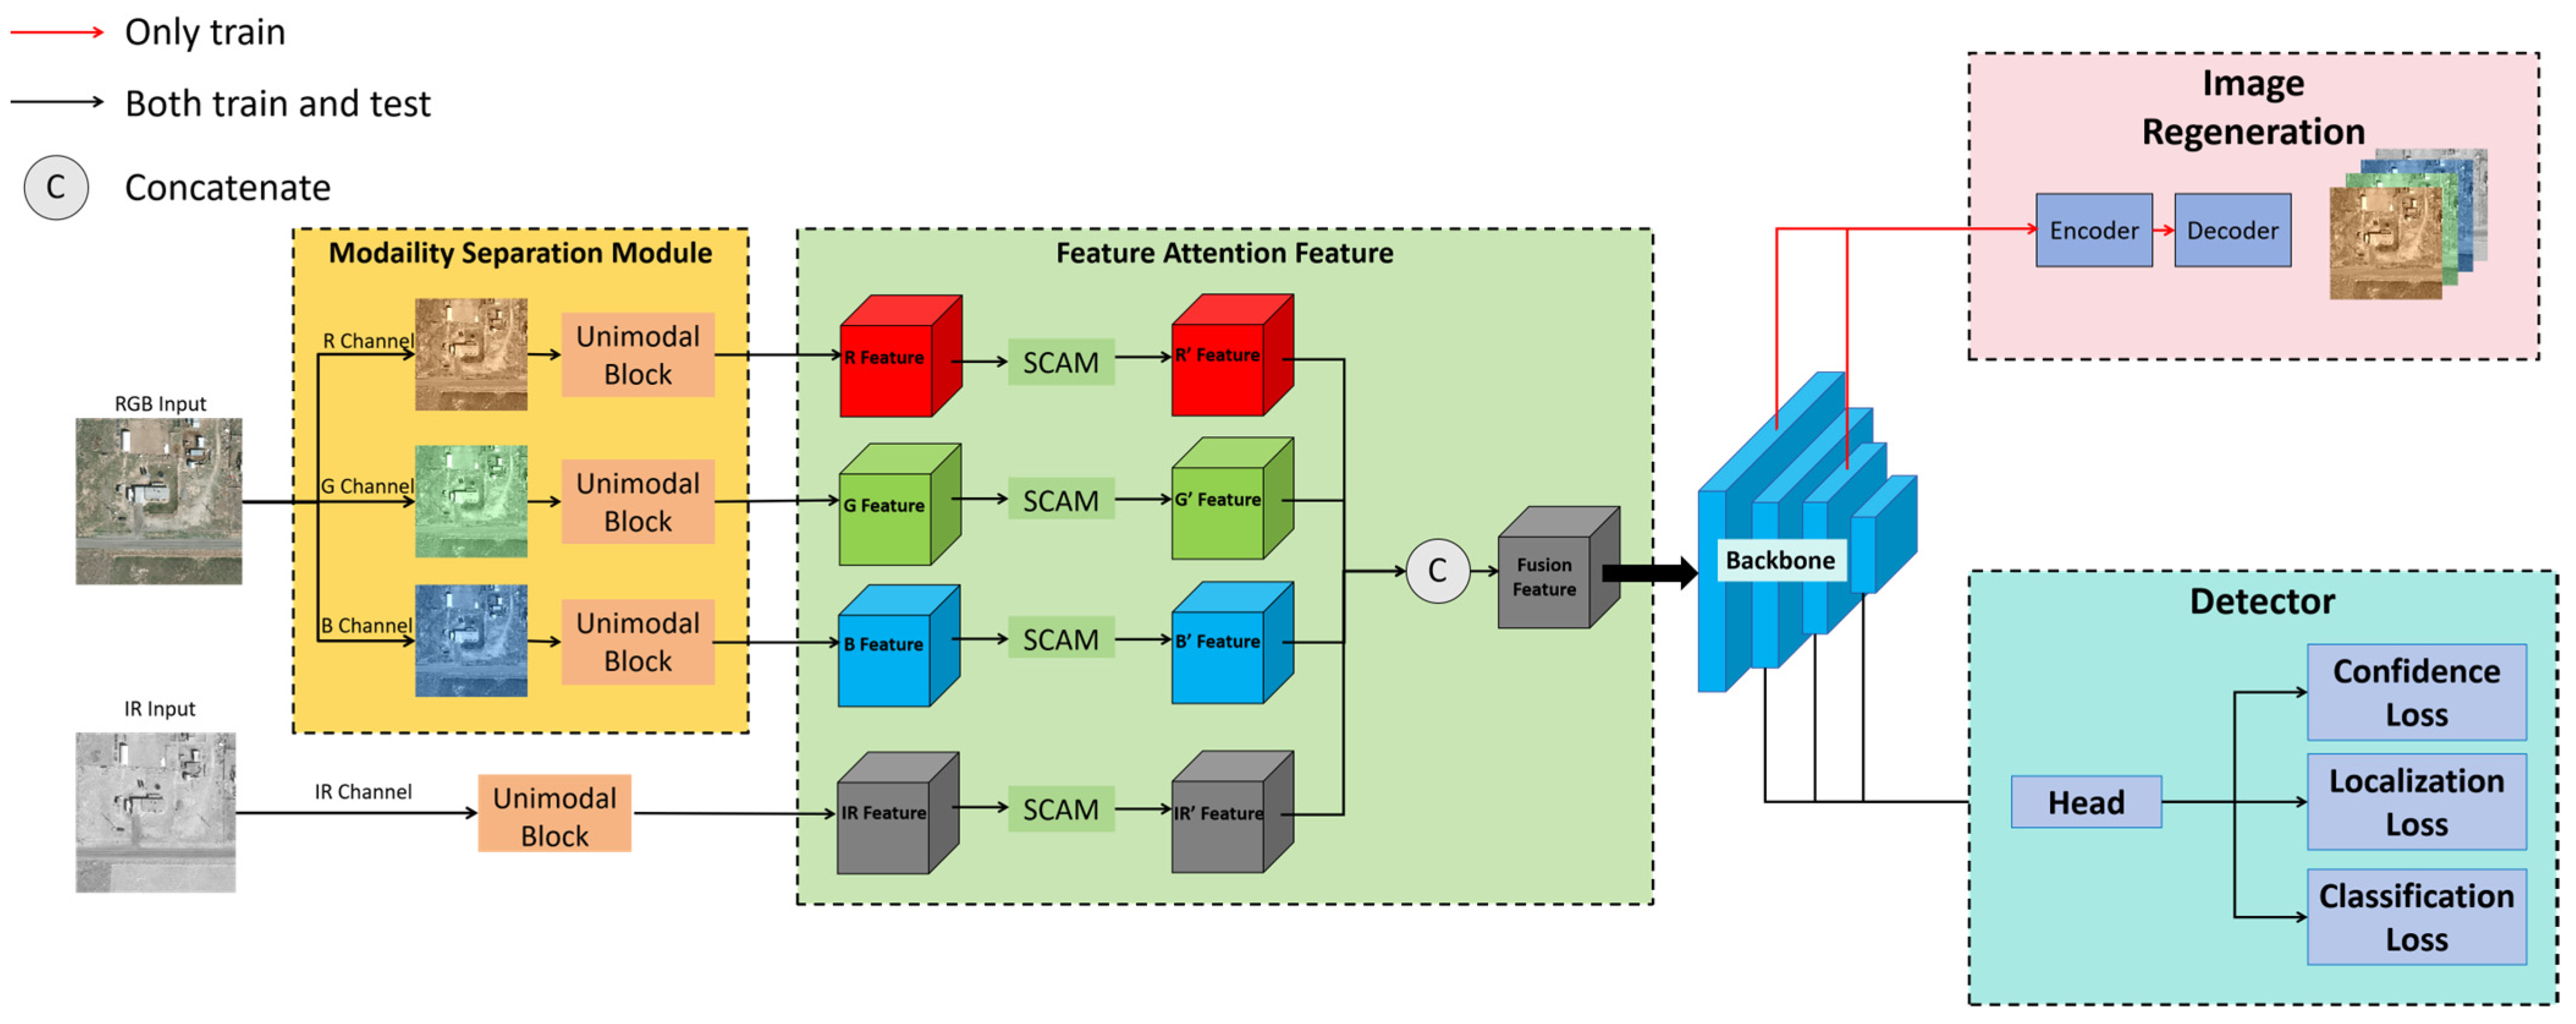
In remote sensing target detection, multimodal data fusion strategies leverage diverse information from multiple modalities such as optical images, infrared images, and radar data. Based on the fusion stage, these strategies can be categorized into pixel-level, feature-level, and decision-level fusion methods.
Pixel-level fusion approaches combine data from different modalities directly at the input stage, offering computational efficiency but often losing fine-grained details. For example, SuperYOLO [33] realizes pixel-level fusion of infrared and RGB images, and proposes a two-branch network, in which the Super-Resolution (SR) branch uses the EDSR [34] network structure to generate HR feature maps for the detection branch. In addition, there are some lightweight SR networks [35], such as HyperYOLO’s [36] FPNSR, which integrate multi-scale features to improve reconstruction quality while reducing computational requirements.
Feature-level fusion methods extract and integrate features from different modalities through parallel branches, often enhanced by attention mechanisms to strengthen modal complementarity. YOLOFusion [37] employs feature-level fusion by combining deep features extracted from both IR and RGB images. This approach ensures the retention of detailed features from each modality, while effectively merging their complementary information for improved detection. Similarly, ACDF-YOLO [38] introduces the efficient shuffle attention (ESA) module and the cross-modal difference module (CDM), enabling deeper and more focused fusion of features from visible and infrared images. YOLOrs [39] integrates RGB and infrared image data to preserve modality-specific details, enhancing target detection performance in aerial images. MF-YOLO [40] also adopts feature-level fusion and utilizes a cross-modality feature fusion strategy, which integrates features from RGB and IR images at intermediate stages, enhancing the robustness of target detection in challenging conditions.
In contrast, decision-level fusion combines modality-specific detection results at the final stage, which, while effective, is computationally redundant. IATDNN [41] leverages a similar illumination-aware weighting mechanism to integrate outputs from day and night-specific subnetworks, which improves multimodal pedestrian detection accuracy across diverse environments. IAF R-CNN [42] introduces a decision-level fusion strategy that dynamically combines detection results from RGB and thermal modalities using illumination-based weighting, effectively enhancing detection robustness under varying lighting conditions.
To leverage complementary information from multiple modalities, our method adopts a feature-level fusion strategy, which is the most used approach in the RSI target detection community. Note that some studies [43,44] further categorize multimodal fusion into four types according to the stages of fusion: early fusion, intermediate fusion, late fusion, and score fusion [37]. Generally, the ideas in these methods could benefit each other in different fusion manners.

3. Our Method

A multimodal remote sensing target detection framework significantly enhances the robustness and accuracy of target detection, especially under complex environmental conditions, by integrating the complementary information from different modalities. However, methods in related works [33,36,37,38,39,40] typically treat the RGB image as a whole modality for feature extraction, overlooking the unique contributions of individual channels. To this end, we propose to decompose the RGB image into three independent channels for feature extraction. This framework allows for a more comprehensive capture of each respective channel’s characteristics, thereby improving the feature representation. Furthermore, we incorporate an attention mechanism during feature extraction to enable the model to focus on important regions, which might be beneficial to multimodal detection. Additionally, we exploit super-resolution (SR) techniques to regenerate high-resolution images, within which the fine details of small targets could be better preserved and enlarged.
As shown in Figure 2, Sep-Fusion consists of three major modules. The first is the modality separation module (MSM), where the RGB image is divided into three channels for feature extraction. The second is the feature attention fusion (FAF) module, which performs attention-based weighting of the image features and concatenates them for inter-modal fusion. The last is the auxiliary image regeneration module, which can enhance the detection of small targets. Note that the detection head and the backbone we used are similar to classic YOLOs. They can be easily replaced by other advanced versions. The respective architectures of these three modules are detailed below.

3.1. Unimodal Block in the MSM

The unimodal block (UB) serves as a core component in the modality separation module (MSM), within which the RGB image is separated into channels R, G, and B, respectively. The structure of the UB is shown in Figure 3. For all four channels (R, G, B, and IR), the separated image passes through two convolution (Conv) layers, a bottleneck layer, and a squeeze-and-excitation (SE) block [45]. Each Conv layer consists of a 2D convolution (Conv2d), BatchNorm normalization, and a ReLU activation function. The 2D convolution uses a 3 × 3 kernel size, ensuring the capture of fine details while reducing computational overhead. The stride and padding are both set to 1, maintaining the spatial dimensions of the output feature map. The subsequent BatchNorm layer and ReLU activation function accelerate network convergence, effectively prevent gradient vanishing, and enhance the generalization ability of the model.
After the Conv layers perform initial extraction and transformation of image features, the UB module utilizes a bottleneck module and an SE layer to further optimize the quality of the feature maps. The bottleneck structure, adopted from YOLOv5 [27], is designed to reduce the number of parameters and computational complexity, achieving dimensionality reduction and compression while preserving critical information. The SE block explicitly models the interdependencies between feature channels, dynamically recalibrating the feature maps to enhance useful features and suppress the less relevant ones, thereby improving the model’s representational capacity. The final output maintains the original size of the feature maps.

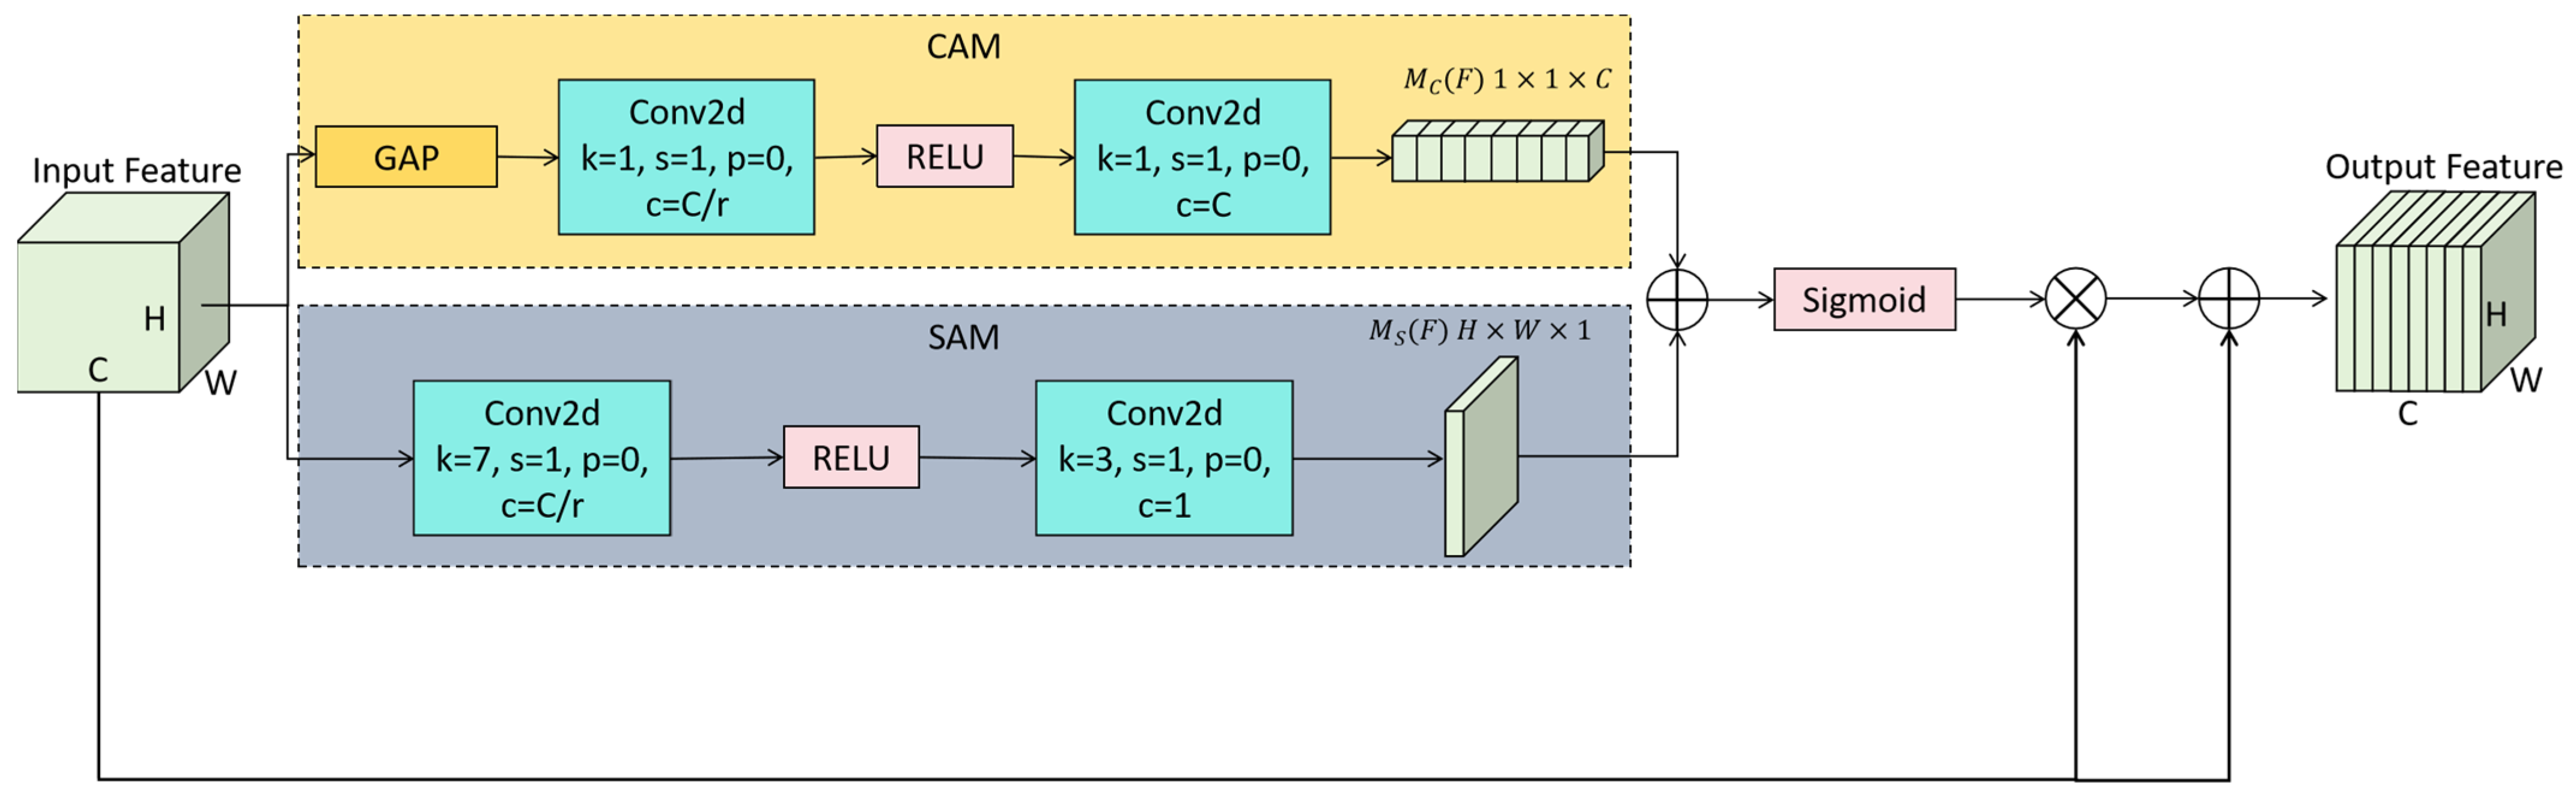
3.2. Feature Attention Fusion Module

In the feature attention fusion (FAF) module, once the unimodal image features are initially extracted, they contain essential information such as color, texture, and shape of the image. However, this information is often redundant and complex, and directly using it for subsequent tasks may lead to performance bottlenecks. A possible solution is to utilize an attention mechanism, which allows the model to automatically focus on the key regions of the image while ignoring less important background information. Such attention should better capture the critical features of the image, which might benefit the subsequent detection task.
We present the SCAM (spatial–channel attention mechanism) for the FAF module to further optimize both intra-modal and inter-modal image features. As shown in Figure 4, the SCAM consists of two concatenated independent submodules: the channel attention module (CAM) and the spatial attention module (SAM) [46]. The former performs attention operations in the channel dimension, while the latter operates in the spatial dimension. This framework enhances the feature representation ability of CNNs by combining both channel attention and spatial attention. With its simple structure, the SCAM could be an effective alternative to improve the model’s performance across various computer vision tasks.
For the CAM, the input feature map F has a size of ( H × W × C ). After global average pooling, the feature map is reduced to ( 1 × 1 × C ), which is then passed through a two-layer neural network (MLP), with the number of neurons in the hidden layer being C/r, where r is the reduction ratio, and the output layer has C neurons. The activation function used in the hidden layer is ReLU.
M c F = F a v g × W 1 × W 2
where F a v g denotes the feature derived from the input feature through global average pooling (GAP) and W 1 and W 2 are the weights of the MLP network.
The spatial attention module (SAM) is a two-layer neural network. First, it performs a 7 × 7 convolution to reduce dimensionality, followed by a 3 × 3 convolution to generate spatial attention weights. Unlike other spatial attention mechanisms, the SAM does not use pooling operations, as pooling would result in the loss of information, which can decrease the performance of small-target detection.
M s F = F × f 7 × 7 × f 3 × 3
where F is the input feature and f k × k is the convolution operation with a kernel size of k .
Once the channel and spatial attention weights are obtained, they are added together using broadcasting and then activated by the sigmoid function. This process enables the model to notice and enhance important features within each modality.

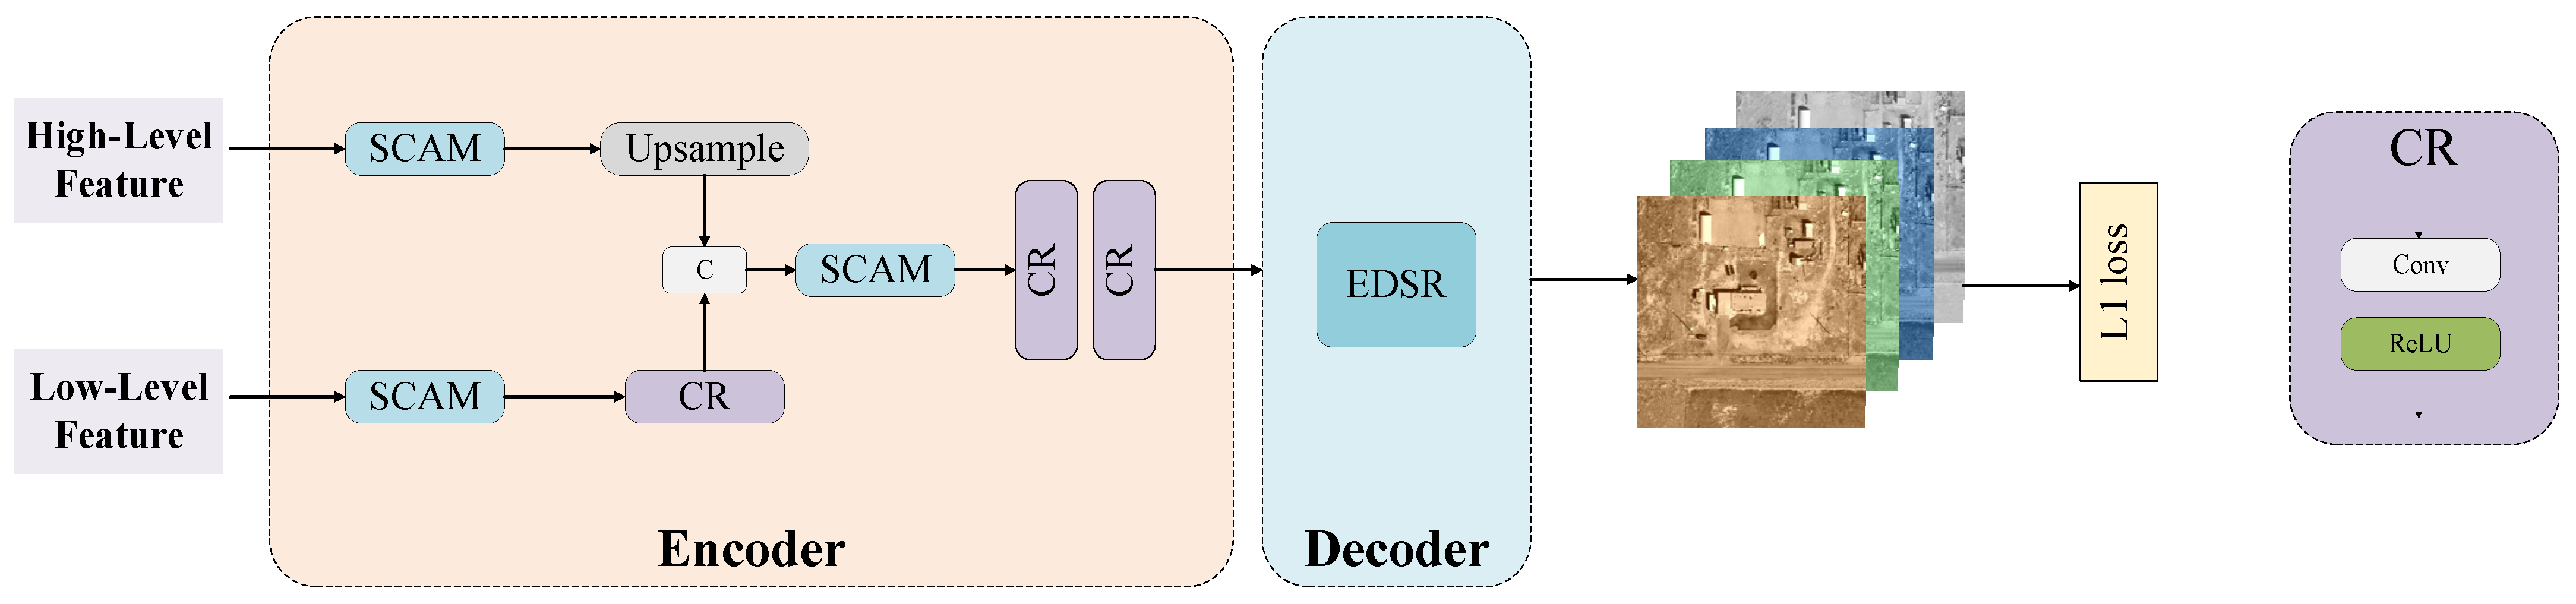
3.3. Image Regeneration Module

During the training phase, an image regeneration module is employed to enhance small-target detection accuracy. We incorporate the super-resolution (SR) module of SuperYOLO [33] into our network to convert the small-target detection problem into an image super-resolution reconstruction problem. Through image reconstruction, low-resolution small targets can be converted into high-resolution targets. This module detects two layers of features in the backbone network as input (high-level features and low-level features), obtains a super-resolution image through the encoder and the decoder, and optimizes the parameters of the backbone network with L1 loss constraints. To improve the feature extraction efficiency, we further impose the SCAM, which is the same one as proposed for the FAF module, on this module. As depicted in Figure 5, we utilize both low-level and high-level features from the backbone to combine local textures and semantic information. As we know, during image fusion, feature maps at different scales play a crucial role in determining the quality of the fusion results. This module independently performs feature enhancement and reconstruction at various resolutions, ensuring that information at each scale is fully utilized and optimized. Attention mechanisms further enhance the extracted feature maps, and through cross-scale connections and feature fusion, features at different levels complement each other, significantly improving the representational capability of the fused image.
We specifically select the features from the fifth and ninth layers of the backbone as inputs for image reconstruction, before which these features are enhanced with our spatial–channel attention mechanism (SCAM). The feature from the fourth layer, which represents the low-level image feature, is further processed through the CR block. The feature from the ninth layer, highlighting the high-level visual feature, is up-sampled to restore its original resolution. To ensure dimensional consistency, the two types of features are further concatenated and subsequently passed through the SCAM and two CR blocks to generate more effective feature representations. In the decoder, the enhanced deep super-resolution (EDSR) block from [34] is used to perform the super-resolution function, producing a final output with a resolution twice that of the input image.

3.4. Loss Function

The total loss function of the proposed model comprises four main components: localization loss, confidence loss, classification loss, and the L1 loss from the reconstruction network. The details of each component are described below.
Localization loss measures the discrepancy between the predicted bounding box and the ground-truth bounding box. We employ the complete intersection over union (CIoU) loss [47], which extends the traditional IoU loss by considering additional factors, such as the distance between bounding box centers and aspect ratio differences. The CIoU loss is defined as follows:
L C I o U = 1 ( I o U d 2 c 2 α v )
where I o U represents the intersection over union between the predicted and ground-truth bounding boxes, d is the Euclidean distance between the centers of the predicted and ground-truth bounding boxes, c is the diagonal length of the smallest enclosing box that covers both the predicted bounding box and the ground truth box, v represents the aspect ratio difference, computed as 4 π 2 arctan A R g t arctan A R p r e d 2 , and α is a weighting factor balancing the penalties for location and shape, defined as v 1 I o U + v .
Confidence loss quantifies the difference between the predicted probability of a target being present in a bounding box and the ground-truth label. Binary cross-entropy (BCE) [48] loss is utilized to compute this component as follows:
L c o n f i d = i = 0 N B C E ( p i p ^ i ) = i = 0 N p i log ( p ^ i + ( 1 p i ) log ( 1 p ^ i ) )
where N is the total number of samples and p i and p ^ i are the ground-truth and predicted confidence scores, respectively.
Classification loss evaluates the discrepancy between the predicted and ground-truth class probabilities. This component is computed using the categorical cross-entropy (CCE) [48] loss, expressed as follows:
L c l a s s = 1 N i = 1 N c = 1 C y i , c log ( y ^ i , c )
where N is the total number of samples, C is the total number of classes, y i , c is the ground-truth label for sample I and class c (equal to 1 if sample i belongs to class c, and 0 otherwise), and y ^ i , c is the predicted probability for class c of sample i.
L1 loss measures the difference between the reconstructed image and the ground-truth image in the image regeneration module, which is used to enhance the performance of the super-resolution reconstruction network. Relevant experiments in [33] demonstrated that L1 loss is more effective than L2 loss. L1 loss is defined as follows:
L 1 = X 1 X 2 1
where X 1 represents the reconstructed image and X 2 represents the ground-truth image.
Distribution focal loss (DFL) [49] is a regression loss function designed to refine the bounding box localization accuracy in target detection. Instead of directly regressing continuous coordinates, DFL models the bounding box positions as discrete probability distributions and optimizes the probabilities of neighboring values around the target coordinates. DFL is defined as follows:
L D F L = ( y i + 1 y log S i + ( y y i ) log ( S i + 1 ) )
where y is the true continuous coordinate value of the target bounding box, y i and y i + 1 are the left and right values of the interval where y is located, and S i = y i + 1 y y i + 1 y i and S i = y y i y i + 1 y i are the discrete probability distributions of the model output.
If the backbone uses YOLOv5s, the total loss function is defined as the weighted sum of L c o n f i d , L C I o U , L c l a s s , and the L 1 loss from the reconstruction network, formulated as follows:
L = L c o n f i d + λ C I o U L C I o U + λ c l a s s L c l a s s + λ L 1 L 1
where λ C I o U ,   λ c l a s s ,   λ L 1 are weighting parameters that balance the contributions of the respective loss components.
If above backbone is switched to YOLOv8s, the anchor-free design of YOLOv8 will replace the confidence loss used in YOLOv5 with the DFL. The total loss function is defined as the weighted sum of the L C I o U , L D F L , L c l a s s , and the L1 loss from the reconstruction network, formulated as:
L = λ B b o x L C I o U + λ D F L L D F L + λ c l a s s L c l a s s + λ L 1 L 1
where λ B b o x , λ D F L ,   λ c l a s s ,   λ L 1 are weighting parameters that balance the contributions of the respective loss components.

4. Experimental Results

4.1. Datasets

Our experiments utilized the multimodal Vehicle Detection in Aerial Imagery (VEDAI) dataset [50], designed for multi-class vehicle detection in aerial imagery. Collected by the Utah Automated Geographic Reference Center (AGRC) from 2012 satellite imagery, the dataset comprises 1210 high-resolution (1024 × 1024 pixels, approximately 12.5 cm spatial resolution) aerial images. Each image contains four uncompressed spectral channels: three RGB bands and one near-infrared channel. The dataset encompasses 11 vehicle categories (e.g., boats, sedans, campers, trucks). Categories with fewer than 50 instances are merged into an aggregated “other” class, resulting in eight final categories. The median target size in the VEDAI dataset is approximately 20 × 15 pixels, which conforms to the COCO small object threshold (32 × 32) [18].
To validate the adaptability of the proposed method to only visible image inputs, we selected the DIOR [51] and NWPU VHR-10 [52] datasets for unimodal adaptation experiments.
The DIOR dataset serves as a widely recognized benchmark for target detection in remote sensing imagery. This comprehensive dataset contains 23,463 high-resolution images with 192,472 annotated instances spanning 20 object categories. The classes encompass diverse targets including transportation infrastructure (e.g., airplanes, airports, bridges), sports facilities (baseball fields, basketball courts, stadiums), and industrial structures (chimneys, dams, wind turbines), along with vehicles, ships, and other critical land-use elements.
The NWPU VHR-10 benchmark contains 800 very-high-resolution (VHR) remote sensing images spanning 10 object categories. These include representative geospatial targets such as transportation infrastructure (airplanes, ships, vehicles), sports facilities (baseball/tennis courts), and military installations (tanks), with data derived from Google Earth and the Vaihingen dataset. All images were expert-annotated after standardized cropping.

4.2. Detection Metrics

IoU (intersection over union) measures the overlap between a predicted bounding box and the ground-truth box in target detection, ranging from 0 (no overlap) to 1 (perfect match). A higher IoU indicates better localization accuracy. Detection validity is often assessed using a predefined IoU threshold.
Precision (P) and recall (R) are calculated as shown in Formulas (10) and (11), respectively:
P = T P T P + F P
R = T P T P + F N
where TP (true positive) refers to the number of correctly identified positive samples, meaning the model successfully predicted a positive class when the actual label was also positive; FP (false positive) represents the number of negative samples that were incorrectly classified as positive by the model, indicating false alarms; and FN (false negative) denotes the number of positive samples that the model incorrectly classified as negative, meaning the model failed to detect actual positives.
AP (average precision) refers to the average precision for a single class in a dataset. Since a dataset often contains multiple classes, mAP is the mean value of the AP across all classes; mAP provides an overall measure of the model’s performance in detecting multiple classes, considering precision and recall at various thresholds. The specific calculation method is given by Formula (13):
A P = 1 m i m P i = P ( R ) d R
Specifically, mAP50 refers to the mAP value calculated when the IoU threshold is set to 0.5, meaning the result considers detections that meet or exceed an IoU of 0.5 between the predicted bounding box and the ground truth.

4.3. Experimental Settings

All experiments were conducted on an NVIDIA GeForce RTX 3090 GPU (32 Gb VRAM) using PyTorch 2.5.0. The software environment included Python 3.10 and CUDA 12.1. The VEDAI dataset was randomly divided into training (80%) and testing (20%) sets, with stratification to maintain class distribution consistency. We tested our method using YOLOv5s or YOLOv8s as the backbone and the detection head. These YOLO architectures include three detection heads: small-scale, medium-scale, and large-scale. The network was trained for 300 epochs using the SGD optimizer, with a momentum of 0.98. A grid search was conducted over learning rates (1 × 10⁻⁴, 5 × 10⁻⁴, 1 × 10⁻³) and batch sizes (2, 4, 8). The optimal combination (learning rate = 1 × 10⁻³, batch size = 8) was selected based on the validation mAP50; λ C I o U was set to 0.05, λ C l a s s was set to 0.5, and λ L 1 was set to 0.1, as suggested in [33]; λ B b o x was set to 7.5 and λ D F L was set to 1.5, as suggested in [28]. To implement the image regeneration module, the input images were down-sampled from 1024 × 1024 to 512 × 512 during training, while the test images were resized to maintain consistency throughout the process. During training, we followed the YOLO data augmentation pipeline to apply affine transformations, including random translation and scaling, to the input images. These operations enhanced the model’s geometric invariance to scale variations, viewpoint changes, and partial occlusions.
As shown in Figure 6, the VEDAI dataset exhibits category imbalances, with a predominance of small targets, which increases the difficulty of the detection task. In the data preprocessing phase, we employed data augmentation techniques provided by the YOLO series to balance the data distribution. For instance, the use of Mosaic data augmentation helped to randomly place targets in various positions, enhancing the uniformity and density of target distribution.

4.4. Multimodal Remote Sensing Target Detection Results

We first conducted target detection experiments on the multimodal remote sensing dataset VEDAI. We compared the performance of Sep-Fusion with state-of-the-art multimodal detection approaches (YOLOrs [39], SuperYOLO [33], YOLOFusion [37], MF-YOLO [40], HyperYOLO [36]) and classic YOLO series methods (YOLOv3 [53], YOLOv4 [26], YOLOv5 [27]). Table 1 presents the AP results for different categories and the overall mAP50 achieved by various methods. Note that the classic YOLO series methods are originally developed as unimodal approaches. In this experiment, their multimodal detection results were obtained by concatenating the pairs of images from RGB and IR modalities to meet the requirement of their networks.
The results in Table 1 show that our model performed well in the Pickup, Truck, and Other categories, with particularly notable AP results in the Other category. Compared to the classic YOLO series methods, our approach demonstrates a significant improvement in detection performance, even in the unimodal cases. When compared with the current state-of-the-art multimodal detection algorithms, Sep-Fusion (YOLOv5s) achieved a 0.7% higher mAP50 than HyperYOLO and 2.4% higher than SuperYOLO. Although Sep-Fusion (YOLOv8s) yielded the best result of 77.9% mAP50, the limited performance improvement observed over Sep-Fusion (YOLOv5s) suggests that backbone selection plays a relatively minor role, while the “separation before fusion” strategy emerges as the primary contributor to our method’s effectiveness. It is interesting to note that for each method, the multimodal detection result was better than using only one modality. Even for classic YOLO series methods, the simple concatenation of RGB and IR images produced higher mAP50 values. This indicates the benefits of multimodal fusion for target detection in remote sensing imagery.
In Table 1, we additionally reported the parameter counts (Params) and computational costs (in GFLOPs) for the selected baseline methods during the test phase, with their values sourced from implementations documented in prior literature. Given that all targets in the VEDAI dataset fall into the small-scale category, the Sep-Fusion framework exclusively employed the small-scale detector within the backbone architecture to optimize computational efficiency while maintaining detection accuracy for small targets. Specifically, when using YOLOv5s as the backbone, our method achieved higher mAP results (77.4%) with low parameter counts and GFLOPs. When using YOLOv8 as the backbone, despite the increase in parameter count and GFLOPs, our mAP50 results were further improved (77.9%).
Figure 7 visualizes the confusion matrices of Sep-Fusion (a) and SuperYOLO [33] (b) on the same training and testing sets, highlighting their classification capabilities for different classes in the VEDAI dataset. The confusion matrices in Figure 7 illustrate our method’s performance advantages through two key dimensions. First, the darker color intensity and higher numerical values along the main diagonal directly reflect improved per-category classification accuracy, as these metrics quantify the proportion of correctly identified instances within each class. Second, the sparser off-diagonal values (30 non-zero entries in our method vs. 33 in SuperYOLO) demonstrate significantly reduced misclassifications between categories. This dual improvement—both in diagonal precision and off-diagonal error suppression—validates our approach’s superior ability to discriminate fine-grained features in aerial targets, achieving lower false detection rates and higher classification reliability than the baseline method.
To intuitively compare the performance of related works, Figure 8 visualizes the detection results of YOLOv5s, YOLOv4, SuperYOLO, and our method on the VEDAI dataset. Three images with a higher number of labeled instances from the VEDAI dataset were selected for display. The first row shows the ground-truth labels, while for the displayed methods in the rest of the rows, we highlighted the detection errors using three colors. Black ellipses represent classification errors, red ellipses indicate false positive detections of non-existent targets, and blue ellipses highlight missed detections. It can be observed that YOLOv5s and YOLOv4 exhibited a higher frequency of detection errors. SuperYOLO showed better performance for missed detections (blue circle), but had more false positive detections (red circle). In general, our method showed more reliable detection results.

4.5. Ablation Experiments

To better validate the role of each module in Sep-Fusion, ablation experiments were conducted on the VEDAI dataset. By comparing the performance with and without certain modules in Sep-Fusion, the effectiveness of our proposed components was assessed. We named different combinations of modules with a varying number of Sep-Fusions, while the original Sep-Fusion was abbreviated as Sep-Fusion. The results of ablation experiments are shown in Table 2. For simplification, we chose YOLOv5s as the backbone of our model.
As shown in Table 2, the modality separation module (MSM) and the spatial–channel attention mechanism (SCAM) in Sep-Fusion contributed significantly to the model’s performance improvement. Compared to Sep-Fusion0, incorporation of the SCAM enhanced the model by 5.1%, while the MSM contributed to a 2.2% improvement. It should be noted the mAP50 of Sep-Fusion0 (without MSM and SCAM) achieved an mAP50 of 69.1%, which is significantly lower than the 77.4% achieved by Sep-Fusion (with modules enabled), thereby highlighting the indispensable role of these two modules. It should be noted the mAP50 of Sep-Fusion0 without the two modules dropped below 70%. Moreover, compared to Sep-Fusion2, the inclusion of the MSM led the full Sep-Fusion model to an additional improvement of 3.2%. This improvement was attributed to the more detailed feature extraction of the input image provided by the MSM, which enhanced the overall feature representation. In this sense, for those methods that have their own attention blocks, our MSM could serve as a Plug-and-Play module to provide additional feature augmentation effects in their tasks.

4.6. Unimodal Target Detection Adaptation Experiments

Although developed as a multimodal method, our method can be easily adapted to unimodal target detection. In Figure 2, if Sep-Fusion is applied to the visible-light modality only, we can simply delete the working line of the IR channel while the rest of the modules remain unchanged. To verify the adaptability of Sep-Fusion on unimodal datasets, we conducted experiments on NWPU VHR-10 and DIOR datasets. In the NWPU VHR-10 dataset, we selected 520 images as the training set and 130 images as the testing set, with the image size fixed at 512 × 512. In the DIOR dataset, we selected 11,725 images as the training set and 11,738 images as the testing set, with the image size fixed at 512 × 512. For our method, the training epoch was changed to 150, with the other parameters being the same as in Section 4.4. The batch size for NWPU VHR-10 was set to 8, for DIOR—to 16. We compared our Sep-Fusion with the existing baselines including Faster R-CNN [5], RetainNet [54], YOLOv3 [53], GFL [49], FCOS [30], ATSS [55], MobileNetV2 [56], ShuffleNet [57], ARSD [58], and SuperYOLO [33]. The results are presented in Table 3.
In Table 3, we compared our Sep-Fusion (YOLOv5s) with several unimodal target detection methods, including one-stage algorithms [30,49,53,54,55], a two-stage algorithm [5], lightweight algorithms [56,57], a distillation-based method [58], as well as multimodal approach SuperYOLO [33]. Our method achieved state-of-the-art mAP50 on both datasets, while maintaining parameter efficiency (Params) and computational costs (GFLOPs) nearly matching the second-best metrics across all the compared methods. Given the heterogeneous target sizes in the NWPU VHR-10 and DIOR datasets, our framework employed three dedicated detection heads (small-scale, medium-scale, and large-scale detectors) to ensure robust multi-scale target detection. Consequently, the parameter count of our model exceeded the values reported in Table 1. It is interesting to note that our method was competitive to several lightweight algorithms such as MobileNetV2 and ShuffleNet on model size, which indicates that Sep-Fusion is highly efficient in terms of computational costs. The experimental results further confirm that Sep-Fusion is well-suited for visible-light unimodal datasets, highlighting its potential for real-time target detection on mobile devices.

5. Discussion: Why Separation Before Fusion Works?

The quantitative experiments in the above sections demonstrated our method’s extraordinary detection performance over most existing approaches, as well as its strong adaptability to unimodal datasets. However, the fundamental reasons behind our SBF framework require deeper exploration. Beyond the ablation studies validating the proposed modules, we further investigated the distinct roles of different modalities in target detection through a refined experimental protocol. Specifically, we systematically evaluated various modality combinations to analyze their individual and synergistic contributions to detection accuracy. For simplification, we only trained each model for 150 epochs on the VEDAI dataset, and the rest of the experimental settings were the same as in Section 4.3. The quantitative results are shown in Table 4.
Table 4 presents the target detection results of the various modality combinations. The first two rows present the results of target detection with the IR channel and the RGB channels as inputs, respectively. The next three rows (rows 3–5) show the respective contributions of individual channels in visible light, assisted by the IR channel, to the target detection performance. Note that “RGB + IR” represents the fusion of the full RGB image (as a unified input) with the IR channel, while “R + B + G + IR” involves separating the RGB into R, G, and B channels and then fusing them with the IR channel, which is exactly the formalized version of our Sep-Fusion. Conceptually, the methods in rows 3–6 in the table correspond to the two-modal fusion setting, whereas the last row constitutes a four-modal fusion.
The mainstream framework, which took the RGB image as a single modality and fused it with the IR channel, achieved a 72.3% mAP50. This result not only outperformed the scenarios in rows 3–5 (which involved individual visible light channels assisted by IR), but also demonstrated the performance improvement in target detection by incorporating infrared data compared to the second row (RGB-only baseline). That is why “RGB + IR” is the currently prevalent fusion manner for multimodal RSI target detection. However, by virtue of our proposed “separation before fusion” framework, the separation of RGB into R, G, and B produced a better fusion result in terms of the mAP50 (see the last row). Therefore, the promising results in this extended experiment verify that channel separation does have a certain positive effect on the target detection results, which brings new insights into fusion network design for multimodal target detection, particularly for the RSI community.
Figure 9 visualizes the feature activation patterns of the FAF module. The Image panel displays the RGB input, while R, G, B, and IR represent attention heatmaps for the individual spectral channels. The RGB + IR panel illustrates the fused features when treating RGB as a unified input, whereas R + G + B + IR demonstrates our proposed SBF approach, where RGB is separated into independent channels before fusion with IR. Warmer hues (such as red) in the heatmaps indicate higher attention weights assigned by the model to the corresponding regions. A comparative analysis of the attention visualization maps across different channels (R, G, B, IR) and the original image reveals that each channel exhibited distinct contributions. The “R + G + B + IR” fusion strategy, compared to “RGB + IR,” generated deeper color intensities in the object regions and lighter tones in the background areas, thereby enhancing the saliency of the target regions and providing more discriminative features for downstream detection models.

6. Conclusions

Inspired by the well-known track-before-detect (TBD) concept in the object tracking field, this paper proposes a novel fusion structure of “separation before fusion (SBF)”, as well as a new multimodal detection method, Sep-Fusion. This method aims to enhance small-target detection performance in multimodal remote sensing images. To enhance feature extraction and capture channel-specific information, we designed a modality separation module (MSM), which separates visible light images into the individual R, G, and B channels and treats each as a distinct modality, akin to the infrared modality. This separation allows the model to better capture fine-grained features from each channel. Moreover, we employed a feature attention fusion (FAF) module combined with the spatial–channel attention mechanism (SCAM) to effectively fuse features from multiple modalities, highlighting the important information while ensuring accurate integration across the channels. Furthermore, the SCAM was applied to the image regeneration module to improve the sensitivity of the model in small-target detection.
Although developed in the multimodal setting, Sep-Fusion is adaptable to unimodal target detection, with network parameters being even lower than those of lightweight deep methods such as MobileNetV2 and ShuffleNet. Our method may not reach the best mAP50 reported in the literature, but the experiments, especially the ablation study, prove that our MSM module and SCAM can surely enhance RSI target detection capabilities, which may benefit the research along this line. In future work, we plan to improve our model for specific target types, such as rotated targets, and explore its application in few-shot scenarios. Under our SBF framework, to better extract channel features, we can also explore effective fusion frameworks from other fields [59,60]. Additionally, we aim to incorporate large visual-language models to enhance the model’s ability to leverage semantic information for target detection.

Author Contributions

Conceptualization, L.W. and D.L.; methodology, Y.W.; software, J.J.; formal analysis, R.L.; writing—original draft preparation, Y.W. and J.J.; investigation, Q.C. and J.F. All authors have read and agreed to the published version of the manuscript.

Funding

This research was supported in part by the Key Research and Development Program of Shaanxi (program No. 2024GX-YBXM-144), the Natural Science Basic Research Program of Shaanxi (program No. 2024JC-YBMS-499) and the National Natural Science Foundation of China (program No. 62271374).

Data Availability Statement

The VEDAI dataset can be found at https://downloads.greyc.fr/vedai/; accessed on 25 September 2024. The NWPU VHR-10 dataset and DIOR dataset can be found at https://gcheng-nwpu.github.io/#Datasets/; accessed on 10 August 2024.

Acknowledgments

The authors are grateful to the editors and reviewers for their constructive feedback and valuable suggestions, which significantly improved the quality of this manuscript. We also acknowledge the High-Performance Computing Platform of Xidian University for providing essential computational resources.

Conflicts of Interest

The authors declare no conflicts of interest.

References

  1. Gui, S.; Song, S.; Qin, R.; Tang, Y. Remote Sensing Object Detection in the Deep Learning Era—A Review. Remote Sens. 2024, 16, 327. [Google Scholar] [CrossRef]
  2. Wang, X.; Wang, A.; Yi, J.; Song, Y.; Chehri, A. Small Object Detection Based on Deep Learning for Remote Sensing: A Comprehensive Review. Remote Sens. 2023, 15, 3265. [Google Scholar] [CrossRef]
  3. Gerhards, M.; Schlerf, M.; Mallick, K.; Udelhoven, T. Challenges and future perspectives of multi-/Hyperspectral thermal infrared remote sensing for crop water-stress detection: A review. Remote Sens. 2019, 11, 1240. [Google Scholar] [CrossRef]
  4. Girshick, R. Fast R-CNN. In Proceedings of the IEEE International Conference on Computer Vision (ICCV), Santiago, Chile, 11–18 December 2015; pp. 1440–1448. [Google Scholar]
  5. Ren, S.; He, K.; Girshick, R.; Sun, J. Faster R-CNN: Towards Real-Time Object Detection with Region Proposal Networks. IEEE Trans. Pattern Anal. Mach. Intell. 2016, 39, 1137–1149. [Google Scholar] [CrossRef]
  6. Feng, C.; Zhong, Y.; Gao, Y.; Scott, M.R.; Huang, W. Tood: Task-Aligned One-Stage Object Detection. In Proceedings of the 2021 IEEE/CVF International Conference on Computer Vision (ICCV), Montreal, QC, Canada, 10–17 October 2021; IEEE Computer Society: Los Alamitos, CA, USA, 2021; pp. 3490–3499. [Google Scholar]
  7. Redmon, J. You Only Look Once: Unified, Real-Time Object Detection. In Proceedings of the IEEE Conference on Computer Vision and Pattern Recognition, Las Vegas, NV, USA, 27–30 June 2016. [Google Scholar]
  8. Wang, Z.; Zhan, J.; Duan, C.; Guan, X.; Lu, P.; Yang, K. A Review of Vehicle Detection Techniques for Intelligent Vehicles. IEEE Trans. Neural Netw. Learn. Syst. 2022, 34, 3811–3831. [Google Scholar] [CrossRef] [PubMed]
  9. Spinello, L.; Triebel, R.; Siegwart, R. Multiclass Multimodal Detection and Tracking in Urban Environments. Int. J. Rob. Res. 2010, 29, 1498–1515. [Google Scholar] [CrossRef]
  10. Ma, J.; Tang, L.; Xu, M.; Zhang, H.; Xiao, G. STDFusionNet: An Infrared and Visible Image Fusion Network Based on Salient Target Detection. IEEE Trans. Instrum. Meas. 2021, 70, 5009513. [Google Scholar] [CrossRef]
  11. Li, H.; Wu, X.J.; Kittler, J. MDLatLRR: A Novel Decomposition Method for Infrared and Visible Image Fusion. IEEE Trans. Image Process. 2020, 29, 4733–4746. [Google Scholar] [CrossRef]
  12. Ma, J.; Zhou, Y. Infrared and Visible Image Fusion via Gradientlet Filter. Comput. Vis. Image Underst. 2020, 197, 103016. [Google Scholar] [CrossRef]
  13. Bavirisetti, D.P.; Dhuli, R. Two-Scale Image Fusion of Visible and Infrared Images Using Saliency Detection. Infrared Phys. Technol. 2016, 76, 52–64. [Google Scholar] [CrossRef]
  14. Liu, Y.; Chen, X.; Ward, R.K.; Wang, Z.J. Image Fusion with Convolutional Sparse Representation. IEEE Signal Process. Lett. 2016, 23, 1882–1886. [Google Scholar] [CrossRef]
  15. Ma, J.; Chen, C.; Li, C.; Huang, J. Infrared and Visible Image Fusion via Gradient Transfer and Total Variation Minimization. Inf. Fusion 2016, 31, 100–109. [Google Scholar] [CrossRef]
  16. Ma, J.; Zhou, Z.; Wang, B.; Zong, H. Infrared and Visible Image Fusion Based on Visual Saliency Map and Weighted Least Square Optimization. Infrared Phys. Technol. 2017, 82, 8–17. [Google Scholar] [CrossRef]
  17. Gómez-Chova, L.; Tuia, D.; Moser, G.; Camps-Valls, G. Multimodal Classification of Remote Sensing Images: A Review and Future Directions. Proc. IEEE 2015, 103, 1560–1584. [Google Scholar] [CrossRef]
  18. Lin, T.-Y.; Maire, M.; Belongie, S.; Hays, J.; Perona, P.; Ramanan, D.; Dollár, P.; Zitnick, C.L. Microsoft COCO: Common Objects in Context. In Proceedings of the Computer vision–ECCV 2014: 13th European Conference, Zurich, Switzerland, 6–12 September 2014; Proceedings, Part v 13. Springer International Publishing: Cham, Switzerland, 2014; pp. 740–755. [Google Scholar]
  19. Drummond, O. Signal and Data Processing of Small Targets 2015. Proc. SPIE 2015, 9596, 959601-1. [Google Scholar]
  20. Xiaolin, F.; Fan, H.; Ming, Y.; Tongxin, Z.; Ran, B.; Zenghui, Z.; Zhiyuan, G. Small Object Detection in Remote Sensing Images Based on Super-Resolution. Pattern Recognit. Lett. 2022, 153, 107–112. [Google Scholar] [CrossRef]
  21. Dong, Z.; Wang, M.; Wang, Y.; Zhu, Y.; Zhang, Z. Object Detection in High Resolution Remote Sensing Imagery Based on Convolutional Neural Networks with Suitable Object Scale Features. IEEE Trans. Geosci. Remote Sens. 2019, 58, 2104–2114. [Google Scholar] [CrossRef]
  22. Courtrai, L.; Pham, M.T.; Lefèvre, S. Small Object Detection in Remote Sensing Images Based on Super-Resolution with Auxiliary Generative Adversarial Networks. Remote Sens. 2020, 12, 3152. [Google Scholar] [CrossRef]
  23. Bashir, S.M.A.; Wang, Y. Small Object Detection in Remote Sensing Images with Residual Feature Aggregation-Based Super-Resolution and Object Detector Network. Remote Sens. 2021, 13, 1854. [Google Scholar] [CrossRef]
  24. Diaz-Cely, J.; Arce-Lopera, C.; Mena, J.C.; Quintero, L. The Effect of Color Channel Representations on the Transferability of Convolutional Neural Networks. In Proceedings of the 2019 Computer Vision Conference (CVC), Vdara Hotel and Spa, Las Vegas, NV, USA, 25–26 April 2019. [Google Scholar]
  25. Wang, A.; Chen, H.; Liu, L.; Chen, K.; Lin, Z.; Han, J.; Ding, G. YOLOv10: Real-Time End-to-End Object Detection. arXiv 2024, arXiv:2405.14458. [Google Scholar]
  26. Bochkovskiy, A.; Wang, C.Y.; Liao, H.Y.M. YOLOv4: Optimal Speed and Accuracy of Object Detection. arXiv 2020, arXiv:2004.10934. [Google Scholar]
  27. Glenn, J. YOLOv5 Release v7.0. 2022. Available online: https://github.com/ultralytics/yolov5/releases/tag/v7.0 (accessed on 18 September 2024).
  28. Glenn, J. YOLOv8 Release v8.3.0. 2024. Available online: https://github.com/ultralytics/ultralytics/releases/tag/v8.3.0 (accessed on 18 September 2024).
  29. Tan, M.; Pang, R.; Le, Q.V. EfficientDet: Scalable and Efficient Object Detection. In Proceedings of the IEEE/CVF Conference on Computer Vision and Pattern Recognition (CVPR), Seattle, WA, USA, 13–19 June 2020; pp. 10781–10790. [Google Scholar]
  30. Tian, Z.; Shen, C.; Chen, H.; He, T. FCOS: Fully Convolutional One-Stage Object Detection. arXiv 2019, arXiv:1904.01355. [Google Scholar]
  31. Cai, Z.; Vasconcelos, N. Cascade R-CNN: Delving into High Quality Object Detection. In Proceedings of the IEEE Conference on Computer Vision and Pattern Recognition (CVPR), Salt Lake City, UT, USA, 18–23 June 2018; pp. 6154–6162. [Google Scholar]
  32. Sun, P.; Zhang, R.; Jiang, Y.; Kong, T.; Xu, C.; Zhan, W.; Tomizuka, M.; Li, L.; Yuan, Z.; Wang, C.; et al. Sparse R-CNN: End-to-End Object Detection with Learnable Proposals. In Proceedings of the IEEE/CVF Conference on Computer Vision and Pattern Recognition (CVPR), Nashville, TN, USA, 20–25 June 2021; pp. 14454–14463. [Google Scholar]
  33. Zhang, J.; Lei, J.; Xie, W.; Fang, Z.; Li, Y.; Du, Q. SuperYOLO: Super Resolution Assisted Object Detection in Multimodal Remote Sensing Imagery. IEEE Trans. Geosci. Remote Sens. 2023, 61, 5605415. [Google Scholar] [CrossRef]
  34. Lim, B.; Son, S.; Kim, H.; Nah, S.; Mu Lee, K. Enhanced Deep Residual Networks for Single Image Super-Resolution. In Proceedings of the IEEE Conference on Computer Vision and Pattern Recognition Workshops (CVPRW), Honolulu, HI, USA, 21–26 July 2017; pp. 136–144. [Google Scholar]
  35. Wang, L.; Li, D.; Zhu, Y.; Tian, L.; Shan, Y. Dual Super-Resolution Learning for Semantic Segmentation. In Proceedings of the IEEE/CVF Conference on Computer Vision and Pattern Recognition (CVPR), Seattle, WA, USA, 13–19 June 2020; pp. 3774–3783. [Google Scholar]
  36. Nan, G.; Zhao, Y.; Fu, L.; Ye, Q. Object Detection by Channel and Spatial Exchange for Multimodal Remote Sensing Imagery. IEEE J. Sel. Top. Appl. Earth Obs. Remote Sens. 2024, 17, 8581–8593. [Google Scholar] [CrossRef]
  37. Qingyun, F.; Zhaokui, W. Cross-Modality Attentive Feature Fusion for Object Detection in Multispectral Remote Sensing Imagery. Pattern Recognit. 2022, 130, 108786. [Google Scholar] [CrossRef]
  38. Fei, X.; Guo, M.; Li, Y.; Yu, R.; Sun, L. ACDF-YOLO: Attentive and Cross-Differential Fusion Network for Multimodal Remote Sensing Object Detection. Remote Sens. 2024, 16, 3532. [Google Scholar] [CrossRef]
  39. Sharma, M.; Dhanaraj, M.; Karnam, S.; Chachlakis, D.G.; Ptucha, R.; Markopoulos, P.P.; Saber, E. YOLOrs: Object Detection in Multimodal Remote Sensing Imagery. IEEE J. Sel. Top. Appl. Earth Obs. Remote Sens. 2020, 14, 1497–1508. [Google Scholar] [CrossRef]
  40. Li, W.; Li, A.; Kong, X.; Zhang, Y.; Li, Z. MF-YOLO: Multimodal Fusion for Remote Sensing Object Detection Based on YOLOv5s. In Proceedings of the 2024 27th International Conference on Computer Supported Cooperative Work in Design (CSCWD), Tianjin, China, 8–10 May 2024; pp. 897–903. [Google Scholar]
  41. Guan, D.; Cao, Y.; Yang, J.; Cao, Y.; Yang, M.Y. Fusion of Multispectral Data through Illumination-Aware Deep Neural Networks for Pedestrian Detection. Inf. Fusion 2019, 50, 148–157. [Google Scholar] [CrossRef]
  42. Li, C.; Song, D.; Tong, R.; Tang, M. Illumination-Aware Faster R-CNN for Robust Multispectral Pedestrian Detection. Pattern Recognit. 2019, 85, 161–171. [Google Scholar] [CrossRef]
  43. Liu, J.; Zhang, S.; Wang, S.; Metaxas, D.N. Multispectral Deep Neural Networks for Pedestrian Detection. arXiv 2016, arXiv:1611.02644. [Google Scholar]
  44. Chen, Y.; Shi, J.; Mertz, C.; Kong, S.; Ramanan, D. Multimodal Object Detection via Bayesian Fusion. arXiv 2021, arXiv:2104.02904. [Google Scholar]
  45. Hu, J.; Shen, L.; Sun, G. Squeeze-and-Excitation Networks. In Proceedings of the IEEE Conference on Computer Vision and Pattern Recognition (CVPR), Salt Lake City, UT, USA, 18–23 June 2018; pp. 7132–7141. [Google Scholar]
  46. Woo, S.; Park, J.; Lee, J.Y.; Kweon, I.S. CBAM: Convolutional Block Attention Module. In Proceedings of the European Conference on Computer Vision (ECCV), Munich, Germany, 8–14 September 2018; pp. 3–19. [Google Scholar]
  47. Zheng, Z.; Wang, P.; Liu, W.; Li, J.; Ye, R.; Ren, D. Distance-IoU Loss: Faster and Better Learning for Bounding Box Regression. In Proceedings of the AAAI Conference on Artificial Intelligence, New York, NY, USA, 7–12 February 2020; Volume 34, pp. 12993–13000. [Google Scholar]
  48. Hastie, T. The Elements of Statistical Learning: Data Mining, Inference, and Prediction; Springer: Berlin/Heidelberg, Germany, 2009. [Google Scholar]
  49. Li, X.; Wang, W.; Wu, L.; Chen, S.; Hu, X.; Li, J.; Yang, J. Generalized Focal Loss: Learning Qualified and Distributed Bounding Boxes for Dense Object Detection. Adv. Neural Inf. Process. Syst. 2020, 33, 21002–21012. [Google Scholar]
  50. Razakarivony, S.; Jurie, F. Vehicle Detection in Aerial Imagery: A Small Target Detection Benchmark. J. Vis. Commun. Image Represent. 2016, 34, 187–203. [Google Scholar] [CrossRef]
  51. Li, K.; Wan, G.; Cheng, G.; Meng, L.; Han, J. Object Detection in Optical Remote Sensing Images: A Survey and a New Benchmark. ISPRS J. Photogramm. Remote Sens. 2020, 159, 296–307. [Google Scholar] [CrossRef]
  52. Cheng, G.; Han, J. A Survey on Object Detection in Optical Remote Sensing Images. ISPRS J. Photogramm. Remote Sens. 2016, 117, 11–28. [Google Scholar] [CrossRef]
  53. Redmon, J.; Farhadi, A. YOLOv3: An Incremental Improvement. arXiv 2018, arXiv:1804.02767. [Google Scholar]
  54. Lin, T.-Y.; Goyal, P.; Girshick, R.; He, K.; Dollar, P. Focal Loss for Dense Object Detection. In Proceedings of the IEEE Conference on Computer Vision and Pattern Recognition (CVPR), Honolulu, HI, USA, 21–26 July 2017; pp. 2980–2988. [Google Scholar]
  55. Zhang, S.; Chi, C.; Yao, Y.; Lei, Z.; Li, S.Z. Bridging the Gap between Anchor-Based and Anchor-Free Detection via Adaptive Training Sample Selection. In Proceedings of the IEEE/CVF Conference on Computer Vision and Pattern Recognition (CVPR), Seattle, WA, USA, 13–19 June 2020; pp. 9759–9768. [Google Scholar]
  56. Sandler, M.; Howard, A.; Zhu, M.; Zhmoginov, A.; Chen, L.C. Mobilenetv2: Inverted residuals and linear bottlenecks. In Proceedings of the IEEE Conference on Computer Vision and Pattern Recognition (CVPR), Salt Lake City, UT, USA, 18–23 June 2018; pp. 4510–4520. [Google Scholar]
  57. Zhang, X.; Zhou, X.; Lin, M.; Sun, J. ShuffleNet: An Extremely Efficient Convolutional Neural Network for Mobile Devices. In Proceedings of the IEEE Conference on Computer Vision and Pattern Recognition (CVPR), Salt Lake City, UT, USA, 18–23 June 2018; pp. 6848–6856. [Google Scholar]
  58. Yang, Y.; Sun, X.; Diao, W.; Li, H.; Wu, Y.; Li, X.; Fu, K. Adaptive Knowledge Distillation for Lightweight Remote Sensing Object Detectors Optimizing. IEEE Trans. Geosci. Remote Sens. 2022, 60, 5623715. [Google Scholar] [CrossRef]
  59. Qin, X.; Wang, Z.; Bai, Y.; Xie, X.; Jia, H. FFA-Net: Feature Fusion Attention Network for Single Image Dehazing. In Proceedings of the AAAI Conference on Artificial Intelligence, New York, NY, USA, 7–12 February 2020; Volume 34, pp. 11908–11915. [Google Scholar]
  60. Zhang, Y.; Cheng, J.; Su, Y.; Wu, Y.; Ma, Q. ORBNet: Original Reinforcement Bilateral Network for High-Resolution Remote Sensing Image Semantic Segmentation. IEEE J. Sel. Top. Appl. Earth Obs. Remote Sens. 2023, 17, 15900–15913. [Google Scholar] [CrossRef]
Figure 1. Comparison of target detection results from unimodal and multimodal inputs using our method as an example. (a) Detection result for the RGB unimodal input, (d) detection result for the infrared unimodal input, (b,e) detection results for the RGB + IR multimodal input; (c,f) labels for the two modalities. The black ellipses represent targets that were detected incorrectly with unimodal inputs but detected correctly with multimodal inputs, while the red ellipses represent targets that were not detected with unimodal inputs but detected successfully with multimodal inputs.
Remotesensing 17 01350 g001
Figure 2. Overall architecture of the Sep-Fusion network. To realize “separation before fusion (SBF)”, in the modality separation module (MSM), RGB images are separated into three channels: R, G, and B, which are processed by the unimodal block (UB) in the same manner as the IR modality. In the feature attention fusion (FAF) module, the image features of each modality undergo the SCAM (spatial–channel attention mechanism) before concatenation, allowing for a comprehensive extraction of both intra-modal and inter-modal features. During the training phase, the image regeneration module generates super-resolution images based on features from the backbone network to enhance the model’s capability in small-target detection. The detection head and the backbone are similar to classic YOLOs.
Remotesensing 17 01350 g002
Figure 3. The structure of the unimodal block (UB).
Remotesensing 17 01350 g003
Figure 4. The structure of the SCAM includes both spatial attention and channel attention mechanisms. Unlike in the CAM, pooling operations are replaced with convolutional layers in the SAM. This modification aims to reduce the loss of original information during the feature extraction process.
Remotesensing 17 01350 g004
Figure 5. The structure of the image regeneration module.
Remotesensing 17 01350 g005
Figure 6. The statistics of the VEDAI dataset, including class distribution (top-left), bounding box dimensions and frequencies (top-right), target center positions within images (bottom-left), and height-to-width ratios of targets relative to image size (bottom-right).
Remotesensing 17 01350 g006
Figure 7. Confusion matrix plot of the predictions for both Sep-Fusion (a) and SuperYOLO [33] (b) illustrates the correspondence between the predicted results and the true labels in matrix form.
Remotesensing 17 01350 g007
Figure 8. Examples of target detection results on the VEDAI dataset using different methods, including YOLOv4, YOLOv5s, SuperYOLO, and our Sep-Fusion. The black ellipses indicate cases where the classification of the detection result was incorrect, the red ellipses represent cases where a target was detected but the label was absent in the ground truth, and the blue ellipses indicate missed detections.
Remotesensing 17 01350 g008
Figure 9. Feature visualization after FAF (feature attention fusion). R, G, B, and IR represent the visualization results of feature extraction from the individual red, green, blue, and infrared channels, respectively. “RGB + IR” denotes the fused visualization where RGB features are treated as an integrated whole and combined with IR features, while “R + G + B + IR” indicates the fusion results obtained by separately integrating the R, G, and B channels with IR features.
Remotesensing 17 01350 g009
Table 1. The quantitative detection results on the multimodal VEDAI dataset.
MethodModelCarPickupCamperTruckOtherTractorBoatVanmAP50 (%)Params (M)GFLOPS
YOLOv3 [53]IR80.267.065.547.825.840.132.753.351.561.5349.55
RGB83.171.569.159.348.967.333.555.761.161.5349.55
Muti84.572.667.161.943.065.237.158.261.261.5349.68
YOLOv4 [26]IR80.467.968.853.730.044.225.451.452.752.5038.16
RGB83.773.471.259.151.765.934.360.362.452.5038.16
Muti85.472.872.362.848.968.934.254.662.552.5038.23
YOLOv5s [27]IR77.365.366.551.625.942.421.948.949.97.075.24
RGB80.168.066.151.545.864.421.640.954.87.075.24
Muti80.868.469.154.746.764.224.245.956.87.075.32
YOLOv5m [27]IR79.267.365.451.726.744.326.656.152.221.0616.13
RGB81.170.365.554.046.866.736.249.958.821.0616.13
Muti82.572.368.459.246.266.233.557.160.621.0616.24
YOLOv5l [27]IR80.168.665.453.530.345.627.261.954.146.6336.55
RGB81.471.768.257.445.870.735.955.460.846.6336.55
Muti82.872.3269.963.948.463.140.156.462.146.6436.70
YOLOv5x [27]IR79.066.765.958.531.441.431.659.054.287.2469.52
RGB81.772.268.359.148.566.039.161.862.187.2469.52
Muti84.372.9570.161.149.967.338.756.662.687.2469.71
YOLOrs [39]IR82.073.963.854.244.054.422.043.454.7--
RGB85.272.970.350.642.776.818.638.957.0--
Muti84.178.368.852.646.767.921.557.959.7--
SuperYOLO (YOLOv5s) [33]IR87.981.476.961.639.460.646.171.065.64.8216.61
RGB90.382.776.768.553.779.558.170.372.54.8216.61
Muti91.185.779.370.257.380.460.276.575.04.8417.98
YOLOFusion (YOLOv5s) [37]IR86.775.966.677.143.062.370.784.370.8--
RGB91.182.375.178.333.381.271.862.271.9--
Muti91.785.978.978.154.771.971.775.275.912.5-
MF-YOLO (YOLOv5s) [40]Muti92.086.678.272.657.482.964.678.676.54.77-
HyperYOLO (YOLOv7) [36]Muti--------76.73.5014.01
Sep-Fusion (YOLOv5s, ours)IR87.381.572.370.645.867.949.362.167.44.8316.72
RGB88.383.570.274.163.474.259.374.873.54.8517.91
Muti90.887.476.379.768.077.862.177.377.44.8618.69
Sep-Fusion (YOLOv8s, ours)IR87.281.568.174.157.870.454.365.069.88.7522.47
RGB87.082.476.673.159.273.463.473.973.68.7724.29
Muti88.988.177.280.366.477.066.978.277.98.7825.41
The highest value in each column is marked in bold. Note that MF-YOLO and HyperYOLO did not conduct unimodal experiments, and HyperYOLO did not provide results for individual categories.
Table 2. Ablation experiment results of Sep-Fusion on the VEDAI dataset.
MethodMSMSCAMmAP50 (%)
Sep-Fusion0 69.1
Sep-Fusion1 71.3
Sep-Fusion2 74.2
Sep-Fusion77.4
The highest value in the table is marked in bold. “√” indicates that the module is used.
Table 3. The quantitative detection results on the NWPU VHR-10 and DIOR datasets.
NWPU VHR-10DIOR
MethodmAP50 (%)Params (M)GFLOPSmAP50 (%)Params (M)GFLOPS
Faster R-CNN [5]77.8041.17127.7054.1060.21182.20
RetainNet [54]89.4036.29123.2765.7055.49180.62
YOLOv3 [53]88.3061.57121.2757.1061.95122.22
GFL [49]88.8019.1391.7368.0019.1397.43
FCOS [30]89.6531.86116.6367.6031.88123.51
ATSS [55]90.5018.9689.9067.7018.9895.50
MobileNetV2 [56]76.9010.2971.4958.2010.3276.10
ShuffleNet [57]83.0012.1082.1761.3012.1287.31
ADSR [58]90.9211.5726.6570.1013.1041.60
SuperYOLO [33]93.307.6820.8671.827.7020.93
Sep-Fusion (YOLOv5s, ours)93.707.7321.3272.407.7521.39
The highest mAP50 values are marked in bold.
Table 4. The quantitative detection results of the models with different modality combinations on the multimodal VEDAI dataset.
MethodModalityCarPickupCamperTruckOtherTractorBoatVanmAP50 (%)
Sep-FusionIR80.179.775.360.535.423.245.071.058.8
RGB86.380.674.375.751.764.762.071.570.9
R + IR85.177.977.071.332.149.333.071.662.1
G + IR87.084.373.769.847.259.737.670.866.3
B + IR86.983.372.180.256.753.157.269.969.9
RGB + IR89.783.774.775.654.475.554.170.572.3
R + G + B + IR89.284.975.874.461.973.662.372.074.3
The highest value in each column is marked in bold.
Disclaimer/Publisher’s Note: The statements, opinions and data contained in all publications are solely those of the individual author(s) and contributor(s) and not of MDPI and/or the editor(s). MDPI and/or the editor(s) disclaim responsibility for any injury to people or property resulting from any ideas, methods, instructions or products referred to in the content.

