Abstract
This study employed an integrated approach combining multi-source remote sensing data and the MaxEnt model to systematically assess the ecological niche characteristics of the oriental migratory locust (Locusta migratoria manilensis) in Hainan Island, while projecting the evolution of its suitable habitats under both historical and future climate scenarios (up to 2040). Firstly, we synthesized traditional climate, soil, and topography data with remote sensing data to characterize the suitable areas of the oriental migratory locust based on MaxEnt model (with high accuracy of AUC = 0.935 and TSS = 0.76). Subsequently, six dominant environmental variables—precipitation in April (PRE04), precipitation in September (PRE09), maximum temperature in August (TMAX08), minimum temperature in December (TMIN12), NDVI in February (NDVI02), and NDVI in May (NDVI02)—were identified as key predictors. Their threshold values were determined, with PRE04, PRE09, TMAX08, and TMIN12 ranging from 39 to 44 mm, 196 to 223 mm, 31.1 to 32.2 °C, and 17.7 to 18.0 °C in high-suitability zones, respectively. Finally, these six predictors were used to assess habitat suitability across Hainan Island for both the 2001–2020 and 2021–2040 periods. Under historical climate conditions, highly suitable areas (505 km2, 1.41% of total land area) were concentrated in the western and northeastern regions, particularly in Dongfang City (46.27%), Ledong Li Autonomous County (32.91%), and Changjiang Li Autonomous County (18.39%). Future projections indicate significant habitat expansion, with total suitable areas increasing by 13.4–42.0% and highly suitable areas reaching 571–831 km2 by 2040. The study highlights the critical Dongfang–Danzhou–Ledong region for targeted locust control, providing scientific support for pest management in tropical island ecosystems under climate change.
1. Introduction
Hainan Island is located at the northern edge of the tropical zone and experiences a typical tropical monsoon climate, with an average temperature of 22–27 °C and an annual precipitation of 1639 mm [1]. These optimal tropical monsoon climate conditions not only establish the region as a crucial national breeding base for southern agricultural crops but also create favorable ecological conditions for locust proliferation. The oriental migratory locust (Locusta migratoria manilensis), a polyphagous pest feeding predominantly on graminaceous crops, completes four annual generations without diapause under sustained temperatures > 25 °C and relies on seasonal rainfall for egg hatching and nymph development [2]. Long-term observational studies suggest that the unique thermal resource distribution patterns in western coastal areas of Hainan Island provide sustained physiological resources for the continuous generational development of these insects [3]. The species’ outbreaks can result in total crop devastation, representing a substantial biological threat to regional agricultural productivity [4,5]. Consequently, the implementation of effective monitoring and control measures against oriental migratory locust infestations is paramount to maintaining agricultural stability in Hainan Island.
Over the past few decades, two major drivers of ecological decline have emerged: global climate change, manifested through increased frequency of extreme weather events such as droughts and floods, and unsustainable human exploitation of natural resources [6]. Climate projection models anticipate alterations in temperature–precipitation regimes that may fundamentally reshape locust phenological rhythms and microhabitat suitability [7,8]. As a result, the survival of natural predators has become increasingly threatened, exacerbating the frequency and severity of locust outbreaks in Hainan Island. Empirical evidence points to declining regulatory functions of predator communities in intensified agroecosystems, correlating with locust population surges. The recurrence and widespread impact of locust plagues are influenced not only by factors such as crop varieties, climatic conditions, and farmland management practices but also by the lack of advanced, large-scale monitoring and forecasting systems [9].
Currently, two main approaches are used to predict locust habitat suitability: (1) static zoning based on the selection of ecological factors [10,11] and (2) model-based assessments that incorporate species occurrence data and habitat variables [12,13]. The latter is often deemed more reliable due to its objectivity and versatility across different spatial scales. Recent methodological advancements in ecological niche modeling demonstrate improved adaptability for heterogeneous landscapes compared to traditional approaches. Among these models, the Maximum Entropy Model (MaxEnt) has been widely applied in species habitat evaluation due to its ability to utilize limited occurrence data effectively and deliver highly accurate predictions [14,15]. Traditional locust monitoring systems mainly depend on ground surveys and meteorological station data, which have proven highly effective in homogeneous landscapes such as the North China Plain and the Northwest Grasslands. Nonetheless, these approaches face considerable challenges in more complex, heterogeneous tropical island ecosystems such as Hainan Island. Notably, locust infestations in island ecosystems are not unique to Hainan; desert locusts (Schistocerca gregaria) in Madagascar and the red locust (Nomadacris septemfasciata) in Fiji demonstrate similar monitoring challenges due to fragmented habitats and microclimate diversity. The first challenge lies in the island’s fragmented topography, which constrains the coverage of monitoring networks, yielding a historically recorded survey site density of only 0.12 sites/km2, far below the 1.4 sites/km2 density in the North China Plain. Geospatial analyses reveal significant proportions of locust breeding habitats occurring in terrain units poorly served by conventional monitoring infrastructure. The second challenge stems from the significant microenvironmental variability in monsoon climates, which hinders traditional meteorological interpolation methods from accurately captured fine-scale temperature and humidity gradients at resolutions of hundreds of meters [16,17,18,19,20,21,22]. Comparative assessments highlight systematic biases in climatic parameter estimations across coastal–montane transition zones. Although remote sensing techniques have improved habitat analysis capabilities by utilizing parameters such as the Normalized Difference Vegetation Index (NDVI) and land surface temperature [23,24,25,26,27,28], there are two major limitations: (1) The selection of habitat variables is often confined to static parameters such as climate and soil, neglecting the dynamic phenological characteristics of vegetation (e.g., NDVI time-series patterns) and the interactive effects of topography. Emerging technological frameworks emphasize the critical role of high-temporal resolution vegetation indices in capturing habitat dynamics. (2) Most habitat suitability predictions are based on historical climate data, failing to incorporate risk assessments under future multi-scenario climate projections. Scholarly consensus identifies the integration of climate scenario projections as an imperative yet underdeveloped component of predictive systems.
To tackle the aforementioned challenges, this study concentrates on Hainan Island, a region prone to typical outbreaks of oriental migratory locusts, as the focal research area. Here, an integrated multi-source data approach is utilized to develop a climate–vegetation topography coordinated indicator system. This study presents an innovative integration of MODIS time-series NDVI data (capturing vegetation phenological dynamics), CMIP6 multi-scenario climate projections (SSP1-2.6, SSP2-4.5, SSP3-7.0, SSP5-8.5), and high-resolution 30 m topographic indices, effectively addressing the inherent limitations of conventional single-factor analytical approaches. This study aimed to address the following three objectives: (1) to identify the most significant predictors for characterizing the contemporary geographical distribution of oriental migratory locusts by integrating conventional climatic, edaphic, and topographic datasets with remote sensing information; (2) to determine the critical thresholds for the predominant environmental variables; (3) to evaluate habitat suitability across Hainan Island, encompassing both the past (2001–2020) and projected future scenarios (2021–2040).
2. Materials and Methods
2.1. Fundamental Characteristics of Locusts in Hainan Island
Oriental migratory locust populations in Hainan Island are primarily concentrated in the southwestern and northern regions, where environmental factors such as temperature, humidity, and vegetation cover exhibit significant spatial variability. These regions provide ideal conditions for locust reproduction due to favorable climate, abundant food resources (e.g., crops, grasses), and reduced predator pressure from natural predators. These factors collectively contribute to the increased frequency and severity of locust outbreaks. Locust outbreaks in Hainan Island typically involve multiple species; however, the oriental migratory locust remains the most dominant and destructive pest species [1].
The oriental migratory locust undergoes four generations annually, displaying overlapping life cycles where multiple developmental stages coexist both spatially and temporally. Unlike many other locust species, it does not exhibit an overwintering diapause in Hainan Island. The first generation emerges from early January to April, followed by the second generation from May to July, the third generation from July to September, and the fourth generation from September to November [7]. Among these, the third generation is the most destructive, characterized by the largest outbreak area and the highest population density. This generation inflicts severe damage on dry-seeded croplands, sugarcane plantations, fallow grasslands, and temporarily abandoned agricultural lands. The scale and intensity of these outbreaks are strongly influenced by variations in precipitation patterns and local agricultural practices, such as crop rotation and land management [29].
2.2. Data Sources and Environmental Variables
Our study focused on oriental migratory locusts in Hainan Island, China. The primary dataset comprised historical ground survey records (2001–2020) from locust outbreak areas, which contained geospatial information on outbreak locations, affected area polygons, and population density measurements. A standardized operational protocol was applied for occurrence point mapping: (1) sites were classified as locust occurrence points if oriental migratory locust densities exceeded 15 individuals/m2 (a widely accepted threshold for defining significant locust activity levels); (2) spatial–temporal clustering analysis identified 600 georeferenced occurrence points through systematic field validation; (3) all points underwent rigorous quality control to ensure spatial accuracy within ±0.5 m and temporal consistency with survey records. These points were georeferenced and their spatial distribution, along with associated environmental and ecological data, were systematically processed and analyzed using the ArcGIS 10.3 software (Figure 1). Finally, the MaxEnt modeling framework was configured to integrate a comprehensive set of 51 environmental predictors, ensuring a robust and accurate predictive model.
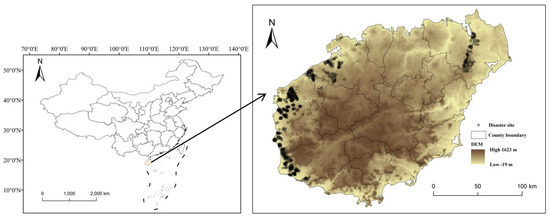
Figure 1.
Location of oriental migratory locust occurrences in Hainan Island.
Environmental variables in this study consisted of four types of data: vegetation, soil, topography, and climate. The geographic information data for the study area were sourced from the 2017 National 1:1,000,000 Fundamental Geographic Information Dataset (provided by the National Geomatics Center of China) and obtained in vector format.
- (1)
- Vegetation data included the vegetation type, Normalized Difference Vegetation Index (NDVI) and Vegetation Exposure (VE). Vegetation type was obtained from the 1:1,000,000 China Vegetation Map, provided by the Scientific Data Center of the Institute of Botany, Chinese Academy of Sciences. Vegetation conditions were derived from the MOD13A2 Version 6 dataset (available at https://lpdaac.usgs.gov/products/mod11a2v006/, accessed on 12 September 2024), which quantifies NDVI values. VE was quantified using the Ratio Vegetation Index (RVI; Table 1), defined as the ratio of the near-infrared (NIR) band to the red band in satellite remote sensing data. Monthly remote sensing data were acquired from the Google Earth Engine platform (https://earthengine.google.com/, accessed on 10 September 2024).
The calculation formula of VE is as follows:
where RVImean represents the mean Ratio Vegetation Index (RVI) from July to October for each year during the period of 2001–2020, and RVImax denotes the maximum RVI value within Hainan Island [30].
VE = RVImax − RVImean
- (2)
- Soil type data were derived from the 1:1,000,000 China Soil Map, provided by the Nanjing Institute of Soil Science, Chinese Academy of Sciences.
- (3)
- Elevation data were acquired from the ASTER GDEM V3 dataset through the Google Earth Engine platform.
- (4)
- Historical climate (2000–2020) and future climate (2021–2040) data were obtained from the WorldClim data website (https://worldclim.org/, accessed on 10 September 2024). The variables were average monthly minimum temperature (°C), maximum temperature (°C), and total precipitation (mm) [31,32].

Table 1.
Definition of environmental variables.
Table 1.
Definition of environmental variables.
| Category | Variables | Abbreviation | Resolution | Units | Data Source |
|---|---|---|---|---|---|
| Soil | Soil type | ST | 1:1,000,000 | China soil map | |
| Topography | Altitude | DEM | 30 m | m | ASTER GDEM V3 |
| Vegetation | Vegetation type | VT | 1:1,000,000 | China vegetation map | |
| Normalized difference vegetation index (Monthly averages) | NDVI | 1000 m | https://lpdaac.usgs.gov/products/mod13a2v006/, accessed on 12 September 2024 | ||
| Vegetation exposure | VE | 1000 m | |||
| Historical climate (2000–2020) | Monthly Maximum temperature | TMAX | 2.5 min | °C | https://www.worldclim.org/data/index.html, accessed on 10 September 2024 |
| Monthly Minimum temperature | TMIN | 2.5 min | °C | https://www.worldclim.org/data/index.html, accessed on 10 September 2024 | |
| Monthly total precipitation | PRE | 2.5 min | mm | https://www.worldclim.org/data/index.html, accessed on 10 September 2024 | |
| Future climate (2021–2040) | Monthly Maximum temperature | FTMAX | 30 s | °C | https://www.worldclim.org/data/index.html, accessed on 10 September 2024 |
| Monthly Minimum temperature | FTMIN | 30 s | °C | https://www.worldclim.org/data/index.html, accessed on 10 September 2024 | |
| Monthly total precipitation | FPRE | 30 s | mm | https://www.worldclim.org/data/index.html, accessed on 10 September 2024 |
2.3. MaxEnt Setting and Modeling
MaxEnt (Maximum Entropy) is a machine learning algorithm based on the principle of maximum entropy, designed to predict the potential suitability of species distributions using presence-only data and environmental variables [14]. It is particularly effective for modeling species niches, even with limited occurrence data [33,34,35]. In this study, MaxEnt version 3.4.1 (available at https://biodiversityinformatics.amnh.org/open_source/maxent/, accessed on 10 September 2024) was employed to assess the potential suitable habitats for oriental migratory locusts in Hainan Island. The dataset was divided into two subsets: 75% of the samples were randomly selected as the training set for model prediction, while the remaining 25% were reserved as the test set to evaluate model accuracy. To minimize model randomness and reduce uncertainty in the simulated results, the model was run with 10 replicates [2].
To ensure robust model convergence, the number of iterations was set to 5000, while the convergence threshold was adjusted to 10−5. This dual-parameter setup provided ample opportunity for the model to refine its predictions iteratively. The training phase was designed with an automatic termination clause, which activated upon the log loss per iteration dropping below the aforementioned threshold, thereby optimizing computational efficiency without compromising accuracy [14]. The model’s output was configured in a logistic format, offering a probabilistic interpretation (ranging from 0 to 1) of the likelihood of oriental migratory locust presence. This format was chosen for its intuitive representation and direct applicability to subsequent analytical stages [36]. Except for the specified adjustments, all other model parameters retained their default settings, maintaining a balance between customization and standardization. To identify the key determinants influencing the distribution of oriental migratory locusts, the jackknife test was employed. This methodological choice allowed for a systematic evaluation of variable importance, ensuring that the most influential factors were accurately identified and prioritized in the analysis.
The predictive accuracy of the simulation results produced by the MaxEnt model was assessed using the Area Under the Receiver Operating Characteristic Curve (AUC). This metric, ranging from 0 to 1, serves as a threshold-independent indicator of model performance, offering a comprehensive evaluation of the model’s discriminative ability [37]. The overall accuracy of the developed model was systematically categorized into five distinct levels: excellent (AUC > 0.9), good (0.8 < AUC ≤ 0.9), fair (0.7 < AUC ≤ 0.8), poor (0.6 < AUC ≤ 0.7), and fail (AUC ≤ 0.6) [38]. This tiered classification facilitated a clear and concise interpretation of the model’s predictive performance. To further validate the robustness of the MaxEnt model, the True Skill Statistic (TSS) was employed. The TSS, calculated as ‘sensitivity + specificity − 1’, provides a balanced measure of the model’s performance, with values ranging from −1 to 1. Higher TSS values, particularly those closer to 1, indicate superior model performance, reflecting both high sensitivity and specificity [39]. According to previous studies, the habitat suitability for oriental migratory locusts was classified into four distinct categories to enhance the practical application of the model results. These categories were defined as follows: highly suitable (p ≥ 0.66), moderately high suitable (0.33 ≤ p < 0.66), moderately low suitable (0.05 ≤ p < 0.33), and low suitable (p < 0.05) [40,41]. This classification scheme aids in the identification and prioritization of areas with varying levels of habitat suitability, thereby informing targeted conservation and management strategies.
2.4. Future Climate Scenarios
Future temperature and precipitation data for the period of 2021–2040 were sourced from the Coupled Model Intercomparison Project Phase 6 (CMIP6) and retrieved from the WorldClim global climate dataset, which offers a high-resolution 30 arc-second grid (https://worldclim.org/, accessed on 8 November 2024). For this study, we utilized the BCC-CSM2-MR Global Climate Model (GCM), developed by China’s National Climate Center, in conjunction with four Shared Socioeconomic Pathway (SSP) scenarios—SSP1-2.6, SSP2-4.5, SSP3-7.0, and SSP5-8.5—to project the potential habitat suitability for oriental migratory locusts in Hainan Island under anticipated future climate conditions. Among these scenarios, SSP1-2.6 represents the most sustainable emission trajectory, characterized by a radiative forcing of 2.6 W m−2 that maintains global warming below 2 °C through 2100. These intermediate pathways of SSP2-4.5 and SSP3-7.0 are characterized by radiative forcings of 4.5 W m−2 and 7.0 W m−2, respectively, reflecting moderate emission scenarios. SSP5-8.5 reflects the most extreme fossil-fueled development scenario, reaching 8.5 W m−2 radiative forcing [31,32].
The monthly average minimum and maximum temperatures, along with the total monthly precipitation for the 2021–2040 period, were systematically employed to assess the habitat suitability of oriental migratory locusts under each of the four SSP scenarios. This comprehensive approach ensures a detailed evaluation of how different climate change scenarios might impact the species’ distribution and abundance in the region.
2.5. Data Analysis
Recognizing that environmental variables within the same category may exhibit correlations, which could compromise the predictive accuracy of the model [42], a thorough analysis of these correlations was conducted. The “Corrplot” package in R version 3.4.4 was employed for this purpose [43]. To identify multicollinearity, a threshold of 0.9 was set for the Pearson correlation coefficient [44]. This threshold was selected based on precedents in ecological niche modeling studies, where a higher tolerance for variable correlation (0.8–0.9) is often adopted to retain biologically meaningful predictors while controlling for redundancy. For example, variables such as temperature seasonality and precipitation extremes may exhibit natural correlations in tropical systems but still independently influence locust habitat suitability. Variables demonstrating high collinearity were systematically assigned to separate clusters, thereby mitigating the potential effects of multicollinearity [40]. When environmental variables are highly correlated, the interpretation of their importance based on percent contribution metrics can become unclear, often resulting in lower individual contributions for correlated variables. To obtain a more accurate assessment of each variable’s influence, we employed permutation importance, which evaluates the impact of each variable on model performance independently. By examining the levels of correlation (Figure 2a) and considering variables with a cumulative permutation importance exceeding 90% (Figure 2b), we identified eleven key environmental factors crucial to the geographical distribution of oriental migratory locusts in Hainan Island. These factors include NDVI02, NDVI05, NDVI09, PRE04, PRE09, PRE10, ST, TMAX07, TMAX08, TMIN06, and TMIN12. Given the unavailability of future NDVI data, we selected a subset of the identified eight key variables—PRE04, PRE09, PRE10, ST, TMAX07, TMAX08, TMIN06, and TMIN12—to predict suitable habitats for oriental migratory locusts in Hainan Island for the period 2021–2040. This selection ensures that the predictive model incorporates the most influential environmental factors while accounting for data limitations.
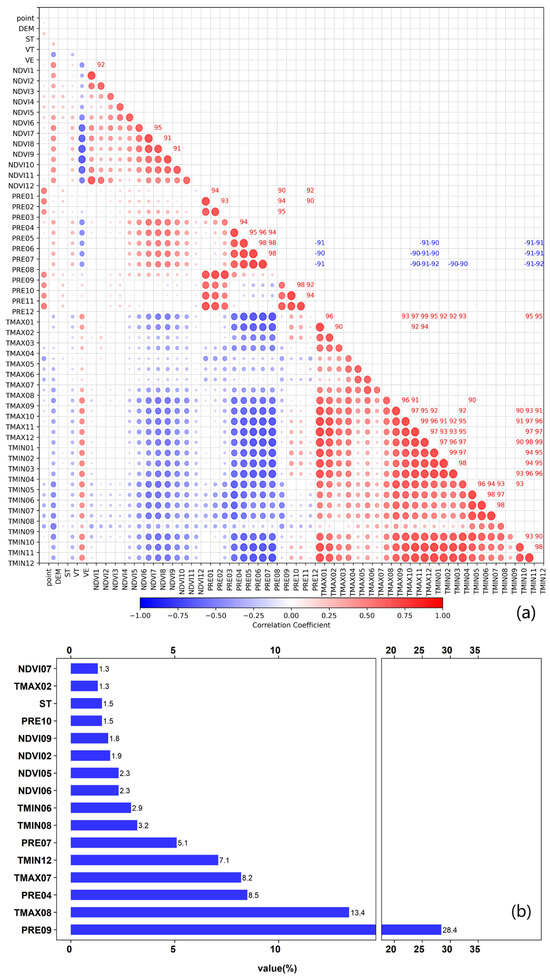
Figure 2.
Analysis of environmental variables: (a) Pairwise correlation network of all environmental variables (The numbers in Figure 2a represent correlation coefficients in percentage format); Size of the circles represents the strength of the correlation; the stronger the correlation, the larger the circle. (b) dominant predictors identified through permutation importance. Note: PRE, TMIN, TMAX, and NDVI represent monthly total precipitation, average maximum temperature, average minimum temperature, and vegetation growth index, respectively. The numbers following PRE, TMIN, TMAX, and NDVI (e.g., PRE04, TMAX08) denote the corresponding months (e.g., April for 04, August for 08). The units for percent contribution and permutation importance are percentages.
3. Results
3.1. Accuracy of Maxent Model and Dominant Environmental Variables
Conventional approaches refer to the delineation of suitable zones based on empirical indicators from previous research, using methods such as regression analysis or the analytic hierarchy process. In contrast to these methods, this study developed an optimized MaxEnt model using key environmental variables, including NDVI02, NDVI05, NDVI09, PRE04, PRE09, PRE10, ST, TMAX07, TMAX08, TMIN06, and TMIN12. The model exhibited remarkable predictive efficacy, with validation results surpassing established thresholds for ecological modeling (AUC > 0.9; TSS > 0.75). Specifically, the AUC value reached 0.935 and the TSS value was 0.76 (Figure 3a). Among individual variables, PRE04 showed the highest isolated AUC value, thereby highlighting its critical role in determining model accuracy. Additionally, the AUC values of NDVI02, NDVI05, PRE09, and TMIN06 all exceeded 80% (Figure 3b). These robust validation results confirm the model’s reliability in identifying potential habitats for oriental migratory locusts in Hainan Island.
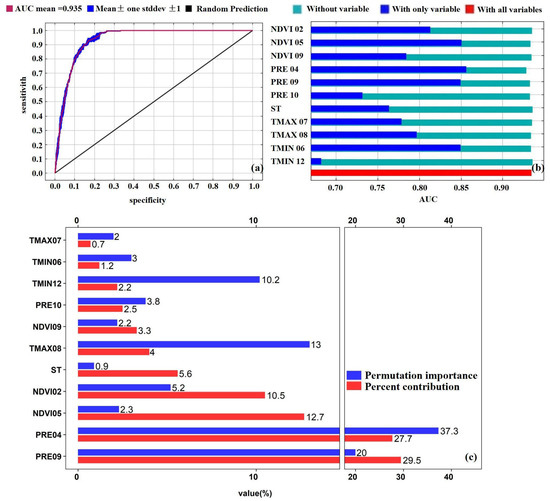
Figure 3.
ROC curves in MaxEnt model (a); AUC values derived from Jackknife tests under three scenarios: “With all variables” (model performance using full variable set), “With only variable” (predictive power of individual variables), and “Without variable” (performance degradation upon variable exclusion). Error bars represent standard deviations across replicate runs (b); percent contribution (bars) and permutation importance (lines) of variables in MaxEnt model (c). The abbreviation of the variables’ name is the same as in Figure 2.
As demonstrated in Figure 3c, the total percent contribution and permutation importance of PRE09, PRE04, NDVI02, NDVI05, TMAX08, and TMIN12 were 88% and 86.6%, respectively. The monthly total precipitation was a key determinant of habitat suitability. PRE04 and PRE09 contributed 27.7% and 29.5% to the model, with permutation importance values of 37.3% and 20%, respectively. NDVI also exerted considerable influence, particularly NDVI05 (12.7% contribution). Although temperature factors had less pronounced effects, TMAX08 and TMIN12 still exhibited notable permutation importance values of 13% and 10.2%, indicating their relevance during specific months. In contrast, the soil type (ST) showed minimal impact, with a contribution rate of 5.6% and a permutation importance of 0.9%. Overall, locust habitat suitability is predominantly governed by precipitation and vegetation conditions, while temperature and soil type play comparatively minor roles.
3.2. Threshold Values of Six Dominant Environmental Variables
The response curves illustrating the relationship between environmental variables and the occurrence probability of oriental migratory locusts in Hainan Island reveal a consistent negative correlation between locust occurrence probability and precipitation during both April and September (Figure 4a,b). Regarding precipitation variables, the threshold values for PRE04 and PRE09 across all suitable areas (p > 0.05) were determined to be 32–95 mm and 180–290 mm, respectively (Figure 4a,b). Concerning temperature variables, the threshold values for TMAX08 and TMIN12 in the entire suitable areas (p > 0.05) ranged from 31.0 to 32.3 °C and 15.2 to 19.6 °C, respectively (Figure 4c,d). Notably, the precipitation thresholds demonstrated greater constraint in high-suitability zones, with PRE04 and PRE09 narrowing down to 39–44 mm and 196–223 mm, respectively. Conversely, temperature thresholds exhibited refined precision: TMAX08 ranged between 31.1 and 32.2 °C while TMIN12 stabilized at 17.7–18.0 °C. For NDVI, the relationship between the vegetation index and locust occurrence probability exhibited a unimodal pattern during both February and May. The occurrence probability initially increased with rising vegetation index values, reaching its maximum within the range of 0.4–0.5, followed by a subsequent decline as vegetation density continued to increase (Figure 4e,f).
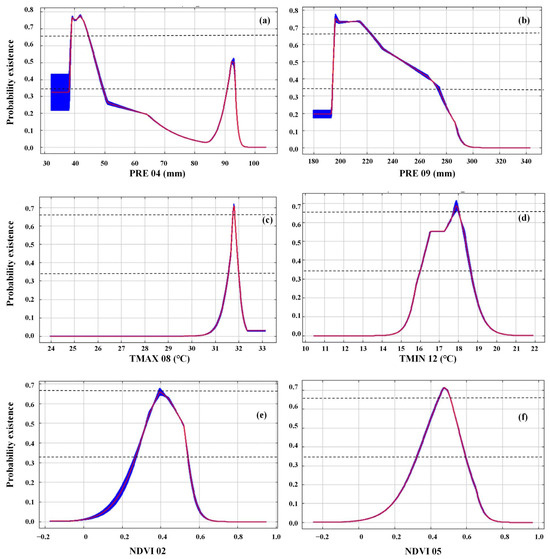
Figure 4.
Response curves of PRE04 (a), PRE09 (b), TMAX08 (c), TMIN12 (d) NDVI02 (e), and NDVI05 (f) in the MaxEnt model. Note: Response curves showed the relationships between existence probability of oriental migratory locusts and six environment variables. The blue line represents the standard deviation (SD) of ten replicates and the red line represents mean value. The abbreviation of the variables’ name is the same as in Figure 2. Two dash lines represent the boundaries for the highly suitable (p ≥ 0.66) and the moderately high suitable (0.33 ≤ p < 0.66).
3.3. Potential Suitable Areas for Oriental Migratory Locust Under Historical Climate Condition
The prediction results reveal that the distribution of suitable habitats for oriental migratory locusts in Hainan Island (Figure 5). The highly suitable areas are predominantly concentrated in the western and northeastern regions of the island, where environmental conditions are particularly favorable for the growth and reproduction of oriental migratory locusts. Notably, the areas classified as low, moderately low, moderately high, and highly suitable for oriental migratory locusts in Hainan Island cover 25,807 km2, 6888 km2, 2748 km2, and 505 km2, respectively.
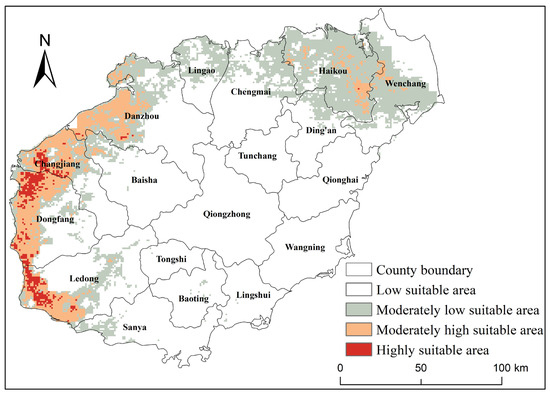
Figure 5.
The potential suitable areas for oriental migratory locusts under historical climate conditions in Hainan.
These areas account for 71.79%, 19.16%, 7.64%, and 1.41% of Hainan’s total land area. Among the highly suitable areas, the distribution is especially prominent in Dongfang City, Ledong Li Autonomous County, Changjiang Li Autonomous County, and Danzhou City. The moderately high suitable areas are mainly distributed among Dongfang City, Danzhou City, Changjiang Li Autonomous County, Ledong Li Autonomous County, Haikou City, and Wenchang City. The moderately low suitable areas are primarily located in Haikou City, Wenchang City, Danzhou City, Chengmai County, and Ledong Li Autonomous County. Overall, the highly, moderately high, and moderately low suitable areas are predominantly distributed in the northern and western regions of Hainan Island.
3.4. Potential Suitable Areas for Oriental Migratory Locust in the Future
To investigate the impacts of climate change on the distribution patterns of the oriental migratory locust in Hainan Island, we conducted a comparative analysis of habitat suitability under both historical and future climate scenarios (Figure 6 and Table 2). Our results indicate a general expansion of suitable habitats under all SSP scenarios, with the total suitable area projected to increase the most under SSP3-7.0, followed by SSP1-2.6, SSP5-8.5, and SSP2-4.5. Highly suitable areas, particularly in Dongfang City, Ledong Li Autonomous County, and Changjiang Li Autonomous County, show significant increases, though regional variations exist. In contrast, Danzhou City experiences both expansions and contractions, depending on the scenario. The trends in moderately high and moderately low suitability areas vary across scenarios, with some counties experiencing increases and others showing declines. Notably, SSP3-7.0 leads to the most substantial expansion of moderately low suitability areas, indicating a broader potential habitat range. Overall, these results highlight a heightened risk of locust outbreaks under future climate conditions, emphasizing the need for targeted monitoring and adaptive pest control strategies. Given the spatial variability in projected habitat changes, region-specific management measures will be crucial for mitigating potential agricultural and ecological impacts.
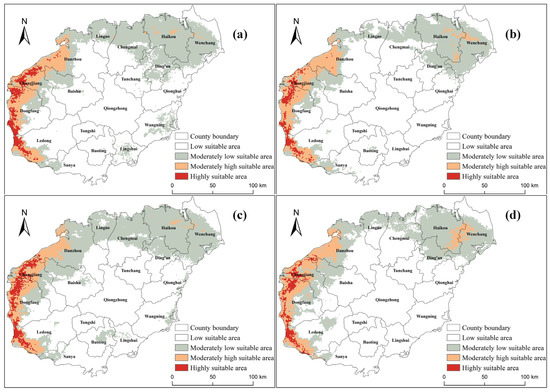
Figure 6.
The potential suitable areas for oriental migratory locusts under SSP1-2.6 (a), SSP2-4.5 (b), SSP3-7.0 (c), and SSP5-8.5 (d) during the period of 2021–2040 in Hainan Island.
Table 2.
Potential suitable areas under historical and future emission scenarios in Hainan Island.
4. Discussion
Climate change exerts profound impacts on the potential suitability of oriental migratory locust habitats. Identifying potential suitable areas for this species enables the establishment of a dynamic monitoring and early warning system. This is crucial for preventing locust disasters in tropical island ecosystems [32]. Although numerous studies have employed the MaxEnt model to examine the effects of climate change on species distribution, there is a notable lack of research focusing on forecasting the distribution characteristics of the oriental migratory locust in Hainan Island under projected future climate conditions [44,45,46]. This study addresses this gap by providing a comprehensive characterization of the outbreak patterns of oriental migratory locusts. We achieved this through the development of an optimized MaxEnt model, which integrates species distribution data with dominant environmental variables under both historical and projected future climate scenarios in Hainan Island. Our approach not only enhances the understanding of historical distribution patterns but also offers valuable insights into potential future shifts, thereby contributing to more effective locust management strategies.
When selecting habitats, species exhibit distinct responses to various environmental factors and preferentially select habitat combinations that optimally satisfy their survival requirements. Previous ecological studies have consistently demonstrated that locust outbreaks predominantly occur in moderately covered grasslands and steppe regions with elevations ranging from 900 to 1100 m [47,48]. However, our findings reveal a distinctive pattern for oriental migratory locusts in Hainan Island, where distribution patterns show limited correlation with altitudinal variation or vegetation type complexity. This phenomenon can be attributed to the region’s relatively uniform topographical relief and highly heterogeneous vegetation patterns, which create unique ecological conditions that differ substantially from those observed in continental grassland ecosystems. In addition to topographical and vegetation factors, precipitation patterns also play a critical role in shaping locust distribution in Hainan Island. In this study, the percent contribution and permutation importance of PRE04 and PRE09 are the highest with the value of 27.7% and 37.3% as well as 29.5% and 20%, respectively. The occurrence probability of oriental migratory locust initially increases with rising precipitation in PRE04 and PRE09 but subsequently declines beyond optimal thresholds. This pattern likely reflects two distinct physiological constraints: extreme aridity may induce dehydration and suppress locust activity, while excessive moisture could promote fungal contamination of locust eggs through prolonged exposure to warm, saturated soils, ultimately reducing hatching success rates [49]. Both excessively dry and wet conditions are unfavorable for locust incubation and growth [26,50]. The threshold effects observed for precipitation variables, particularly PRE04, can be attributed to the physiological requirements of oriental migratory locusts during early developmental stages. April is the peak period for egg hatching and early nymphal development, making precipitation a critical factor that influences survival rates. Moderate precipitation levels (32–95 mm) provide adequate soil moisture for successful egg incubation, as locust eggs require a sufficiently moist but well-aerated substrate to prevent desiccation while avoiding hypoxic conditions caused by excessive water saturation. Below the lower threshold (32 mm), insufficient soil moisture causes egg dehydration, reducing hatching success. Conversely, precipitation levels exceeding the upper threshold (95 mm) may lead to waterlogging, which increases fungal infections and reduces oxygen diffusion in the soil, both negatively impacting egg viability. Similar physiological constraints apply to PRE09 (September precipitation), which influences the third-generation nymphs—typically the most destructive stage. The observed optimal range (180–290 mm) reflects a balance where excessive rainfall suppresses locust activity and elevates mortality through fungal pathogen proliferation.
Furthermore, we found that the optimal occurrence probability of NDVI ranged from 0.4 to 0.5, representing an intermediate vegetation density. This phenomenon can be attributed to the thermal regulation effects of vegetation cover, where excessive vegetation (index > 0.5) creates substantial shading that reduces ground-level temperatures, thereby inhibiting locust feeding behavior and mobility [8]. In addition, locust presence demonstrates a positive correlation with surface temperature, as evidenced by physiological studies showing that each 1 °C increase in ambient temperature during the growth phase accelerates metabolic and biochemical processes by approximately 9.8%, resulting in proportionally higher feeding rates [8]. In this study, the optimal temperature ranges were identified as 31.1–32.2 °C for TMAX08 and 17.7–18.0 °C for TMIN12 for high suitable areas. Given that the first generation of locusts in Hainan Island typically does not lead to significant pest outbreaks, the population density of the second generation serves as a critical indicator for predicting the outbreak potential of the subsequent third and fourth generations. Consequently, implementing control measures during the second generation is of paramount importance, particularly during its peak occurrence period from May to July [29], which corresponds with the findings of this study. Particular emphasis should be placed on monitoring climatic conditions and locust activities during this critical period to facilitate early warning and implement preventive measures. Overall, Hainan, with its year-round absence of winter, high temperatures, and abundant rainfall, provides an ideal environment for the reproduction of oriental migratory locust.
Subsequently, this research also revealed the total suitable areas of oriental migratory locusts under historical climate conditions is 10,141 km2, with highly suitable areas covering 505 km2. The distribution is particularly prominent in Dongfang City, Ledong Li Autonomous County, Changjiang Li Autonomous County, and Danzhou City. These findings are consistent with previous studies [7]. Future suitable areas for oriental migratory locusts were projected under four climate scenarios. Compared to the baseline period (2001–2020), the total suitable area and highly suitable area are projected to increase by 13.4–42.0% and 11.6–64.6%, respectively. This expansion can be attributed to projected increases in PRE04, PRE09, TMAX08, and TMIN12 under the four future climate scenarios (Figure 7), which would enhance locust development. Generally, high-emission scenarios (e.g., SSP5-8.5) may concentrate on suitable habitats in low-elevation and high-precipitation areas, while low-emission scenarios (e.g., SSP1-2.6) may optimize warm and humid conditions that facilitate pest outbreaks. Previous studies have suggested that climate change-induced alterations in temperature and precipitation patterns significantly affect the suitability of locusts, leading to range expansion and increased invasion risks globally, particularly in Europe, Africa, and Asia [50,51,52]. Therefore, it is recommended to incorporate regional climate resilience planning, strengthen monitoring, and control measures in high-risk counties, and focus on ecological response mechanisms under extreme climatic conditions.
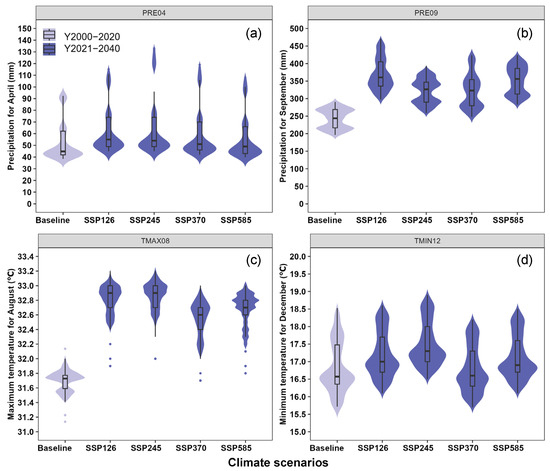
Figure 7.
PRE04 (a), PRE09 (b), TMAX08 (c), and TMIN12 (d) in Hainan Island under historical (2001–2020) and future (SSP1-2.6, SSP2-4.5, SSP3-7.0, and SSP5-8.5 for the periods of 2021–2040) climates. The abbreviations of the variables’ names are the same as in Figure 2.
The methodological framework and habitat factors selected in this study demonstrate considerable generalizability. However, several limitations stemming from data availability constraints and the inherent complexity of locust growth dynamics warrant further investigation. One limitation of this study is the exclusion of future NDVI dynamics in habitat projections. Due to the lack of high-resolution, scenario-based NDVI projections, this study relied solely on climate and soil variables for future suitability predictions. To address this specific limitation, future research could explore the statistical relationships between climate variables (e.g., temperature, precipitation) and NDVI trends to estimate potential changes in vegetation cover under different climate scenarios. Moreover, the reliance on a single general circulation model (GCM; BCC-CSM2-MR) in this study presents certain limitations, as different CMIP6 models may yield varying projections of temperature and precipitation trends. Previous studies have shown that model selection can significantly influence species distribution modeling results due to differences in parameterization, spatial resolution, and climate sensitivity. Additionally, our analysis did not account for influential factors such as typhoon patterns, which can aid long-distance dispersal, land-use intensity, which may alter microhabitat connectivity due to agricultural expansion, and pest control interventions, whose spatial and temporal patterns could establish ecological region. Despite the aforementioned limitations, our study offers valuable insights into habitat suitability and projected distribution patterns of oriental migratory locusts in Hainan Island. To advance this field of research, future efforts should concentrate on mitigating methodological constraints by incorporating principles of movement ecology and considering anthropogenic disturbance gradients. Additionally, the development of adaptive modeling frameworks is crucial, as these can harmonize predictions of climate-driven habitat suitability with the nuanced impacts of human interventions.
5. Conclusions
This study employed an optimized MaxEnt model to assess the habitat suitability of the oriental migratory locust in Hainan Island by integrating multi-source environmental variables. The model validation demonstrated robust predictive performance, with six dominant environmental variables identified: PRE04, PRE09, NDVI02, NDVI05, TMAX08, and TMIN12. Using these variables, we developed an optimal MaxEnt model that accurately predicted the total potential suitable areas, consistent with the historical distribution of oriental migratory locusts in Hainan Island. Under historical climate conditions, highly suitable habitats are concentrated in the western and northeastern regions, particularly in Dongfang City (46.27%), Ledong Li Autonomous County (32.91%), and Changjiang Li Autonomous County (18.39%). Projections under future climate scenarios indicate significant habitat expansion, with total suitable areas increasing by 13.4–42.0% and highly suitable areas expanding to 571–831 km2 by 2040. These findings highlight the critical role of precipitation and vegetation in shaping locust habitat suitability, with temperature playing a secondary role. Notably, this study identifies the Dongfang–Danzhou–Ledong region as a priority area for targeted locust control, providing scientific evidence for precise pest management strategies and climate-resilient planning in Hainan Island.
Author Contributions
Conceptualization, H.B. and Z.S.; methodology, H.B. and Z.S.; data curation, Z.S., C.N. and H.Y.; writing—original draft preparation, Z.S.; writing—review and editing, H.B., Z.S., H.Y., C.N. and W.K.; supervision, H.B., Z.S. and H.Y.; funding acquisition, H.B., Z.S. and W.K. All authors have read and agreed to the published version of the manuscript.
Funding
This work was supported by the Hainan Provincial Natural Science Foundation of China (420QN293), the Agricultural Science and Technology Innovation Program of Chinese Academy of Agricultural Sciences (ASTIP, CAAS), the Hainan Province Science and Technology Special Fund (ZDYF2024XDNY196), and the Hainan Provincial Natural Science Foundation of China (623QN325).
Data Availability Statement
The original contributions presented in the study are included in the article, further inquiries can be directed to the corresponding author.
Conflicts of Interest
The authors declare no conflicts of interest.
References
- Lu, F.; Zhao, D.; Ma, E. Grasshopper researches in Hainan Island: Status and perspectives. Chin. J. Trop. Agric. 2006, 1, 53–59. [Google Scholar]
- Ni, S. Remote Sensing Monitoring and Prediction of Grassland Locusts in the Qinghai Lake Area; Shanghai Scientific and Technical Publishers: Shanghai, China, 2002. [Google Scholar]
- Shi, W.; Yan, Y.; Zhu, E.; Zhang, W.; Lin, B. Sustainable management of locust (Locusta migratoria manilensis) using Nosema locustae in Hainan Province. Acta Phytophylacica Sin. 2001, 28, 207–212. [Google Scholar]
- Lu, F.; Xu, Z.; Zhao, D.; Wang, A. Distribution and damage of grasshoppers in Danzhou. Chin. J. Trop. Agric. 2007, 27, 31–35. [Google Scholar]
- Ding, Y. Studies on the tropical savannah locust breeding area in Hainan, a new oriental migratory locust (Locusta migratoria manilensis weyen) breeding area in China. Acta Ecol. Sin. 1995, 15, 12–22. [Google Scholar]
- Chien, F.S.; Chau, K.Y.; Sadiq, M. Impact of climate mitigation technology and natural resource management on climate change in China. Resour. Pol. 2023, 81, 103367. [Google Scholar] [CrossRef]
- Guan, J.; Li, M.; Ju, X.; Lin, J.; Wu, J.; Zheng, J. The potential habitat of desert locusts is contracting: Predictions under climate change scenarios. PeerJ 2021, 9, e12311. [Google Scholar] [CrossRef]
- Hosni, E.M.; Al-Khalaf, A.A.; Nasser, M.G.; ElShahed, S.M.; Alashaal, S.A. Locusta migratoria (L.) (Orthoptera) in a warming world: Unravelling the ecological consequences of climate change using GIS. Biodivers. Data J. 2024, 12, e115845. [Google Scholar] [CrossRef]
- Zhou, Y.; She, X.; Jin, B.; He, Z. Occurrence and control of Locusta migratoria manilensis in Dongfang, Hainan Province. Chin. J. Trop. Agric. 2019, 39, 46–50. [Google Scholar]
- Du, G.; Zhao, H.; Tu, X.; Zhang, Z. Division of the inhabitable areas for Oedaleus decorus asiaticus in Inner Mongolia. Plant Prot. 2018, 44, 24–31. [Google Scholar]
- Chen, J.; Wang, X. Progress in application of remote sensing and GIS to the study of locust habitats. Ecol. Environ. Sci. 2012, 21, 970–976. [Google Scholar]
- Wang, R.; Li, Q.; Feng, C.; Shi, Z. Predicting potential ecological distribution of Locusta migratoria tibetensis in China using MaxEnt ecological niche modeling. Acta Ecol. Sin. 2017, 37, 8556–8566. [Google Scholar]
- Huang, Y.; Dong, Y.; Huang, W.; Ren, B.; Deng, Q.; Shi, Y.; Bai, J.; Ren, Y.; Geng, Y.; Ma, H. Overwintering distribution of fall armyworm (Spodoptera frugiperda) in Yunnan, China, and influencing environmental factors. Insects 2020, 11, 805. [Google Scholar] [CrossRef] [PubMed]
- Phillips, S.J.; Anderson, R.P.; Schapire, R.E. Maximum entropy modeling of species geographic distributions. Ecol. Model. 2006, 190, 231–259. [Google Scholar]
- Zhao, S.; Wang, H.; Liu, Y. Impact of climate change on distribution of suitable niches for black locust (Robinia pseudoacacia L.) plantation in China. Forests 2024, 15, 1616. [Google Scholar] [CrossRef]
- Liu, J.; Long, Q.; Li, H. Characteristics and control strategies of the East Asian migratory locust in Hainan Island. Entomol. Knowl. 1996, 2, 79–81. [Google Scholar]
- Wu, G.; Liu, K.; Li, Z. Experiment on control effect of Locusta migratoria manilensis (Meyen) in sugarcane fields by hot fogging concentrate. Chin. J. Trop. Agric. 2002, 22, 26–27+55. [Google Scholar]
- Wu, R.; Huo, Z.; Lu, Z.; Li, X.; Jia, Z. Summarization of research on meteorological environment affecting occurrence of locusts. J. Nat. Disasters 2005, 14, 66–73. [Google Scholar]
- Chen, S.; Wulangbater; Wu, X. Response of grasshoppers’ subsistence and breeding to climatic change in Inner Mongolia. J. Nat. Disasters 2007, 16, 463–466. [Google Scholar]
- Guo, A.; Wang, J.; Wang, C.; Song, Y. Meteorological suitability index of grasshopper growth and development in Inner Mongolia. Meteorol. Sci. Technol. 2009, 37, 42–47. [Google Scholar]
- Aragón, P.; Coca-Abia, M.M.; Llorente, V.; Lobo, J.M. Estimation of climatic favorable areas for locust outbreaks in Spain: Integrating species’ presence records and spatial information on outbreaks. J. Appl. Entomol. 2013, 137, 610–623. [Google Scholar] [CrossRef]
- He, K.; Huang, J. Remote sensing of locust and grasshopper plague in China: A Review. In Proceedings of the 2016 Fifth International Conference on Agro-Geoinformatics, Tianjin, China, 18–20 July 2016; pp. 103–108. [Google Scholar]
- Chen, H.; Nie, Y.; Liu, X.; Zhang, H. Research on prediction of potential suitable areas of populus euphratica based on MaxEnt model. China Agric. Inform. 2021, 33, 46–55. [Google Scholar]
- Zhang, X.; Rao, J.; Pan, Y. Progressive approach for risk prediction of rangeland locust hazard in Xinjiang based on remotely sensed data. Trans. Chin. Soc. Agric. Eng. 2015, 31, 202–208. [Google Scholar]
- Mongare, R.; Abdel-Rahman, E.M.; Mudereri, B.T.; Kimathi, E.; Onywere, S.; Tonnang, H.E. Desert Locust (Schistocerca gregaria) invasion risk and vegetation damage in a key upsurge area. Earth 2023, 4, 187–208. [Google Scholar] [CrossRef]
- Geng, Y.; Zhao, L.; Huang, W.; Dong, Y.; Ma, H.; Guo, A.; Ren, Y.; Xing, N.; Huang, Y.; Sun, R.; et al. A landscape-based habitat suitability model (LHS model) for Oriental migratory locust area extraction at large scales: A case study along the middle and lower reaches of the Yellow River. Remote Sens. 2022, 14, 1058. [Google Scholar] [CrossRef]
- Chen, C.; Qian, J.; Chen, X.; Hu, Z.; Sun, J.; Wei, S.; Xu, K. Geographic distribution of desert locusts in Africa, Asia and Europe using multiple sources of remote-sensing data. Remote Sens. 2020, 12, 3593. [Google Scholar] [CrossRef]
- Sun, Z.; Ye, H.; Huang, W.; Qimuge, E.; Bai, H.; Nie, C.; Lu, L.; Qian, B.; Wu, B. Assessment of potential suitable habitats of the grasshopper Oedaleus decorus asiaticus in North China based on MaxEnt modeling and remote sensing data. Insects 2023, 14, 138. [Google Scholar] [CrossRef]
- Tang, X.; Lu, F. Occurrence and control of Locusta migratoria manilensis (Meyen) in Hainan Province. J. Anhui Agric. Sci. 2009, 37, 13129–13130. [Google Scholar]
- Nie, C.; Ye, H.; Zhang, S.; Guo, J.; Huang, W. Risk assessment and sustainable development countermeasures of agricultural typhoon disaster for Hainan Island of China. Trans. Chin. Soc. Agric. Eng. 2022, 38, 237–246. [Google Scholar]
- O’Neill, B.C.; Tebaldi, C.; van Vuuren, D.P.; Eyring, V.; Friedlingstein, P.; Hurtt, G.; Knutti, R.; Kriegler, E.; Lamarque, J.F.; Lowe, J.; et al. The Scenario Model Intercomparison Project (ScenarioMIP) for CMIP6. Geosci. Model Dev. 2016, 9, 3461–3482. [Google Scholar]
- Zhang, L.; Chen, X.; Xin, X. Short commentary on CMIP6 Scenario Model Intercomparison Project (ScenarioMIP). Clim. Change Res. 2019, 15, 519–525. [Google Scholar]
- Sun, Z.; Nie, C.; Ye, H.; Lu, L. MaxEnt and remote sensing-based extraction of habitable areas for the Locusta migratoria manilensis in Hainan Island. China Agric. Inform. 2023, 35, 11–23. [Google Scholar]
- Zingore, K.M.; Sithole, G.; Abdel-Rahman, E.M.; Mohamed, S.A.; Ekesi, S.; Tanga, C.M.; Mahmoud, M.E.E. Global risk of invasion by Bactrocera zonata: Implications on horticultural crop production under changing climatic conditions. PLoS ONE 2020, 15, e0243047. [Google Scholar]
- Wu, R.; Guan, J.; Wu, J.; Ju, X.; An, Q.; Zheng, J. Predictions based on different climate change scenarios: The habitat of typical locust species is shrinking in Kazakhstan and Xinjiang, China. Insects 2022, 13, 942. [Google Scholar] [CrossRef] [PubMed]
- Papier, C.M.; Poulos, H.M.; Kusch, A. Invasive species and carbon flux: The case of invasive beavers (Castor canadensis) in riparian Nothofagus forests of Tierra del Fuego, Chile. Clim. Change 2019, 153, 219–234. [Google Scholar]
- Phillips, S.J.; Dudík, M. Modeling of species distributions with MaxEnt: New extensions and acomprehensive evaluation. Ecography 2008, 31, 161–175. [Google Scholar]
- Fielding, A.H.; Bell, J.F. A review of methods for the assessment of prediction errors in conservation presence/absence models. Environ. Conserv. 1997, 24, 38–49. [Google Scholar]
- Swets, J.A. Measuring the accuracy of diagnostic systems. Science 1988, 240, 1285–1293. [Google Scholar]
- Allouche, O.; Tsoar, A.; Kadmon, R. Assessing the accuracy of species distribution models: Prevalence, kappa and the true skill statistic (TSS). J. Appl. Ecol. 2006, 43, 1223–1232. [Google Scholar]
- Sun, Z.; Hu, Z.; Ye, H.; Huang, W.; Qimuge, E.; Zhang, Y. Application of MaxEnt and remote sensing technology in grasshopper disaster risk monitoring: An example from the agricultural heritage systems of East Ujimqin Banner. J. Ecol. Rural Environ. 2022, 38, 1265–1272. [Google Scholar]
- Sillero, N. What does ecological modelling model? A proposed classification of ecological niche models based on their underlying methods. Ecol. Model. 2011, 222, 1343–1346. [Google Scholar] [CrossRef]
- R Core Team. R: A Language and Environment for Statistical Computing; R Foundation for Statistical Computing: Vienna, Austria, 2018. [Google Scholar]
- Bai, H.; Sun, Z.; Yao, X.; Kong, J.; Wang, Y.; Zhang, X.; Chen, W.; Fan, P.; Li, S.; Liang, Z.; et al. Viticultural suitability analysis based on multi-source data highlights climate-change-induced decrease in potential suitable areas: A case analysis in Ningxia, China. Remote Sens. 2022, 14, 3717. [Google Scholar] [CrossRef]
- Lu, L.; Sun, Z.; Qimuge, E.; Ye, H.; Huang, W.; Nie, C.; Wang, K.; Zhou, Y. Using remote sensing data and species-environmental matching model to predict the potential distribution of grassland rodents in the Northern China. Remote Sens. 2022, 14, 2168. [Google Scholar] [CrossRef]
- Lu, L.; Kong, W.; Qimuge, E.; Ye, H.; Sun, Z.; Wang, N.; Du, B.; Zhou, Y.; Weijun; Huang, W. Detecting key factors of grasshopper occurrence in typical steppe and meadow steppe by integrating machine learning model and remote sensing data. Insects 2022, 13, 894. [Google Scholar] [CrossRef] [PubMed]
- Puchałka, R.; Dyderski, M.K.; Vítková, M.; Sádlo, J.; Klisz, M.; Netsvetov, M.; Prokopuk, Y.; Matisons, R.; Mionskowski, M.; Wojda, T.; et al. Black locust (Robinia pseudoacacia L.) range contraction and expansion in Europe under changing climate. Glob. Change Biol. 2021, 27, 1587–1600. [Google Scholar]
- Tian, Z.; Huo, D.; Yi, K.; Que, J.; Lu, Z.; Hou, J. Evaluation of suitable habitats for birds based on MaxEnt and Google Earth Engine: A case study of Baer’s Pochard (Aythya baeri) in Baiyangdian, China. Remote Sens. 2023, 16, 64. [Google Scholar] [CrossRef]
- Zhang, H.; Sa, C.; Meng, F.; Luo, M.; Wang, M.; Bao, W.; Fang, Y. Temporal and spatial changes and driving characteristics of locust habitat in Inner Mongolia from 2001 to 2020. Chin. J. Grassl. 2024, 46, 108–121. [Google Scholar]
- Zhang, X.; Huang, W.; Ye, H.; Lu, L. Study on the identification of habitat suitability areas for the dominant locust species Dasyhippus barbipes in inner Mongolia. Remote Sens. 2023, 15, 1718. [Google Scholar] [CrossRef]
- Li, D.; Gan, H.; Li, X.; Zhou, H.; Zhang, H.; Liu, Y.; Dong, R.; Hua, L.; Hu, G. Changes in the range of four advantageous grasshopper habitats in the Hexi Corridor under future climate conditions. Insects 2024, 15, 243. [Google Scholar] [CrossRef]
- Salih, A.A.M.; Baraibar, M.; Mwangi, K.K.; Artan, G. Climate change and locust outbreak in East Africa. Nat. Clim. Change 2020, 10, 584–585. [Google Scholar]
Disclaimer/Publisher’s Note: The statements, opinions and data contained in all publications are solely those of the individual author(s) and contributor(s) and not of MDPI and/or the editor(s). MDPI and/or the editor(s) disclaim responsibility for any injury to people or property resulting from any ideas, methods, instructions or products referred to in the content. |
© 2025 by the authors. Licensee MDPI, Basel, Switzerland. This article is an open access article distributed under the terms and conditions of the Creative Commons Attribution (CC BY) license (https://creativecommons.org/licenses/by/4.0/).