Article

YOLOv5_CDB: A Global Wind Turbine Detection Framework Integrating CBAM and DBSCAN

1
School of Earth Sciences and Engineering, Hohai University, Nanjing 211100, China
2
College of Geography and Remote Sensing, Hohai University, Nanjing 211100, China
*
Author to whom correspondence should be addressed.
Remote Sens. 2025, 17(8), 1322; https://doi.org/10.3390/rs17081322
Submission received: 10 March 2025 / Revised: 30 March 2025 / Accepted: 3 April 2025 / Published: 8 April 2025
(This article belongs to the Special Issue Machine Learning and Image Processing for Object Detection)

Abstract

:
Wind energy plays a crucial role in global sustainable development, and accurately estimating the number and spatial distribution of wind turbines is crucial for strategic planning and energy allocation. To address the critical need for wind turbine detection and spatial distribution analysis, this study develops YOLOv5_CDB, an enhanced detection framework based on the YOLOv5 model. The proposed method incorporates two key components: the Convolutional Block Attention Mechanism (CBAM) to improve feature representation and the Density-Based Spatial Clustering of Applications with Noise (DBSCAN) algorithm for spatial density clustering. The method is applied to 2 m resolution World Imagery data. It detects both tubular and lattice wind turbines by analyzing key features, including turbine towers and shadows. The YOLOv5_CDB demonstrates a substantial enhancement in performance when compared with the YOLOv5s. The F1-score shows an increase of 1.39%, and the mean average precision (mAP) exhibits a 1.5% improvement. Meanwhile, the precision (P) and recall (R) values are recorded at 95.97% and 91.18%, respectively. Furthermore, YOLOv5_CDB evinces consistent performance advantages, outperforming state-of-the-art models including YOLOv8s, YOLOv12s, and RT-DETR by 1.84%, 3.98%, and 1.77% in terms of F1-score and by 3.7%, 4.5%, and 3.0% in terms of mAP, respectively. The YOLOv5_CDB model has been demonstrated to show superior performance in the global wind turbine detection domain, thereby providing a foundation for the management of wind farms and the development of sustainable energy.

1. Introduction

As global energy needs increase and public concern about the effects of climate change grows [1,2], the adoption of renewable energy has become an essential strategy for addressing climate challenges and promoting sustainable development [3]. Due to its demonstrated economic and environmental benefits, wind energy is increasingly replacing traditional fossil fuels [4]. The Global Wind Energy Council (GWEC) has reported in the 2024 Global Wind Report that the newly installed wind turbine capacity reached 117 GW in 2023, marking a 50% increase compared to the previous year. Of this increment, 106 GW came from onshore wind turbines, representing a 54% increase from 2022. This upward trend highlights the prominent status of wind energy as a driver in the global energy transition. According to the GWEC Market Intelligence projects, the cumulative newly installed capacity is projected to reach 791 GW over the next five years [5]. The industrialization of wind turbines has undergone substantial acceleration, driven primarily by reduced construction costs, rising energy prices, and supportive government policies [6].
Accurate quantification and spatial mapping of wind turbines play a critical role in three key areas: assessing development potential, optimizing resource allocation, and guiding energy distribution strategies [7,8]. Nevertheless, the absence of location data in existing wind turbine datasets has hindered the assessment of their environmental impacts. The variability in wind turbine sizes and backgrounds further complicates the detection process. These challenges underscore the urgent need for a reliable method to accurately detect the locations and quantities of wind turbines.
With the rapid evolution of remote sensing technologies, satellite-based observation has emerged as a predominant method for wind turbine detection and spatial mapping. Leveraging its short revisit times and broad-area coverage can effectively overcome the temporal discontinuities and geographical inaccessibility in traditional manual monitoring approaches. Landsat and Sentinel satellite imagery are commonly used to detect offshore wind turbines, which typically appear as discrete points in these images. Synthetic Aperture Radar (SAR) imagery is unaffected by weather and lighting conditions, providing significant advantages for continuous earth observation. Nevertheless, SAR-based target detection encounters several inherent technical challenges, particularly range ambiguity-a phenomenon predominantly caused by echo signal overlapping in wide-swath imaging modes, which can substantially compromise target detection precision and reliability. To address the challenge of range ambiguity, Chang et al. developed an innovative methodology based on blind source separation [9]. This approach effectively mitigates range ambiguity effects by exploiting the statistical independence between target and interference signals for their separation while simultaneously enhancing both the interpretability of SAR data and the reliability of target detection. The VV polarization mode of Sentinel-1 SAR demonstrates superior wind turbine detection capabilities primarily through its distinctive backscattering coefficient characteristics. The significant contrast in backscattering coefficients between wind turbine structures and surrounding water surfaces enables reliable identification and differentiation of individual turbines, providing an effective technical solution for offshore wind farm monitoring [10]. Hoeser et al. successfully detected 9941 offshore wind turbines globally from Sentinel-1 SAR images between 2016 and 2021 using two cascaded convolutional neural networks, achieving a P of 99.6% and an R of 98.8% [11]. Additionally, Zhang et al. proposed an adaptive threshold-based method to detect 6924 offshore wind turbines from Sentinel-1 SAR data worldwide, with an accuracy exceeding 99% [12]. Furthermore, Landsat and Sentinel-2 satellite imagery can capture unique spectral features reflected from wind turbine surfaces in the near-infrared band, providing robust support for effectively identifying and detecting numerous offshore wind turbines. Xu et al. utilized the near-infrared spectral characteristics of Sentinel-2 and Landsat imagery, along with a visual saliency detection algorithm, to detect 4277 offshore wind turbines in the North Sea and surrounding waters, achieving a P of 97.98% and an omission error rate of 1.33% [13]. Given the respective advantages of SAR and optical imagery, multi-source data fusion has been applied to offshore wind turbine detection [14]. Wang et al. proposed an offshore wind turbine detection method based on multi-source remote sensing data fusion. By combining the backscattering characteristics of Sentinel-1 SAR and the spectral information of Sentinel-2 MultiSpectral Instrument (MSI), and employing a feature alignment mechanism for data fusion, the method successfully detected 5986 offshore wind turbines in China waters, achieving a P of 99.93% and an R of 99.38% [15]. However, the detection of onshore wind turbines is impeded by factors such as complex background clutter and variability in wind turbine size and spatial arrangement. These factors reduce the efficacy of the same imagery [16,17]. High-resolution remote sensing imagery is invaluable for overcoming these challenges. Its exceptional ability to detect fine features makes it suitable for detecting objects in complex environments with multi-scale.
Significant progress has been made in wind turbine detection in recent years, encompassing various methods and approaches. Existing research methods can be broadly categorized into four types: saliency detection, adaptive thresholding, machine learning, and deep learning techniques. Saliency detection methods distinguish wind turbines from the background by detecting prominent local features in images. Chen et al. used satellite imagery from Google Earth to detect wind turbines in three counties of China. They generated saliency maps to efficiently detect the wind turbines’ location data and target features [18]. Adaptive thresholding methods enhance wind turbine detection by dynamically adjusting the detection threshold according to variations in image characteristics [12]. Machine learning methods use labeled training datasets and algorithms to learn wind turbine characteristics [19]. Xu et al. successfully detected offshore wind turbines in the Yellow and North Seas by integrating Sentinel-1 SAR imagery from 2015 to 2021 with the Random Forest (RF) algorithm, achieving an accuracy of 93.67% [20]. Deep learning methods have significantly advanced wind turbine detection by enabling the automatic detection of multi-level features from images. This development overcomes the need for manual feature detection in traditional methods, resulting in higher detection accuracy and more generalization. In semantic segmentation, Zhang et al. proposed a method combining deep learning and Google Earth Engine (GEE). First, they used Sentinel-2 data and multiple semantic segmentation models to build a multi-model detection framework for initial offshore wind turbine detection. Then, based on Sentinel-1 SAR data, they performed installation time detection and secondary optimization on the GEE cloud platform. The method achieved a P of 99.95% and an R of 99.91% [21]. In object detection, Chen et al. modified the YOLOv3 network structure. They integrated it with GF-1 satellite imagery to detect wind turbines across three provinces in China. Their approach outperformed Faster R-CNN and FPN, achieving a P of 95% and an R of 94% [22]. Chen et al. successfully combined YOLOv5 with EfficientNetB4 to detect wind turbine targets in Vietnam. Their approach achieved an R of 90.45% [23]. Zhai et al. enhanced wind turbine detection from multi-resolution and multi-background remote sensing images by introducing a regression term into YOLOv5. Their method achieved an average precision that was 5.92% to 15.43% higher than existing wind turbine detection approaches [24]. Meanwhile, Zhang et al. proposed an iteratively improved Faster R-CNN method for efficient wind turbine detection using 2 m resolution imagery in China, achieving a P of 97.5% [25].
Existing research still faces several unresolved key challenges. First, detecting diverse wind turbine types has yet to be fully realized, with lattice-type turbines often missed due to their resemblance to transmission towers. This could lead to a higher miss rate and reduce overall precision. Second, detecting wind turbines in large-scale and complex backgrounds remains difficult. Dense wind turbine clusters and varied environmental conditions can degrade the performance of existing methods, significantly lowering detection precision and robustness.
To overcome the aforementioned challenges, this study presents a YOLOv5_CDB algorithm for efficiently and accurately detecting wind turbines. Wind turbines and their shadows are the principal distinguishing features when constructing a high-quality, representative training dataset that guarantees the model’s adaptability to various environmental conditions. The sample dataset is derived from high-resolution World Imagery and includes tubular and lattice-type turbines. To address variability in wind turbine scale and layout, the CBAM is added to the YOLOv5 model, ensuring consistent performance when confronted with wind turbines of different scales. Furthermore, implementing a density-constrained DBSCAN clustering algorithm further improves detection precision in complex scenarios.

2. Methodology

2.1. YOLOv5_CDB Algorithm

Detecting wind turbines in remote sensing imagery poses significant challenges, including background interference and morphological variations among different turbine types, which can greatly impact the precision and reliability of detection algorithms. To tackle these issues, this study introduces a two-stage optimization framework, YOLOv5_CDB, specifically designed for wind turbine detection.

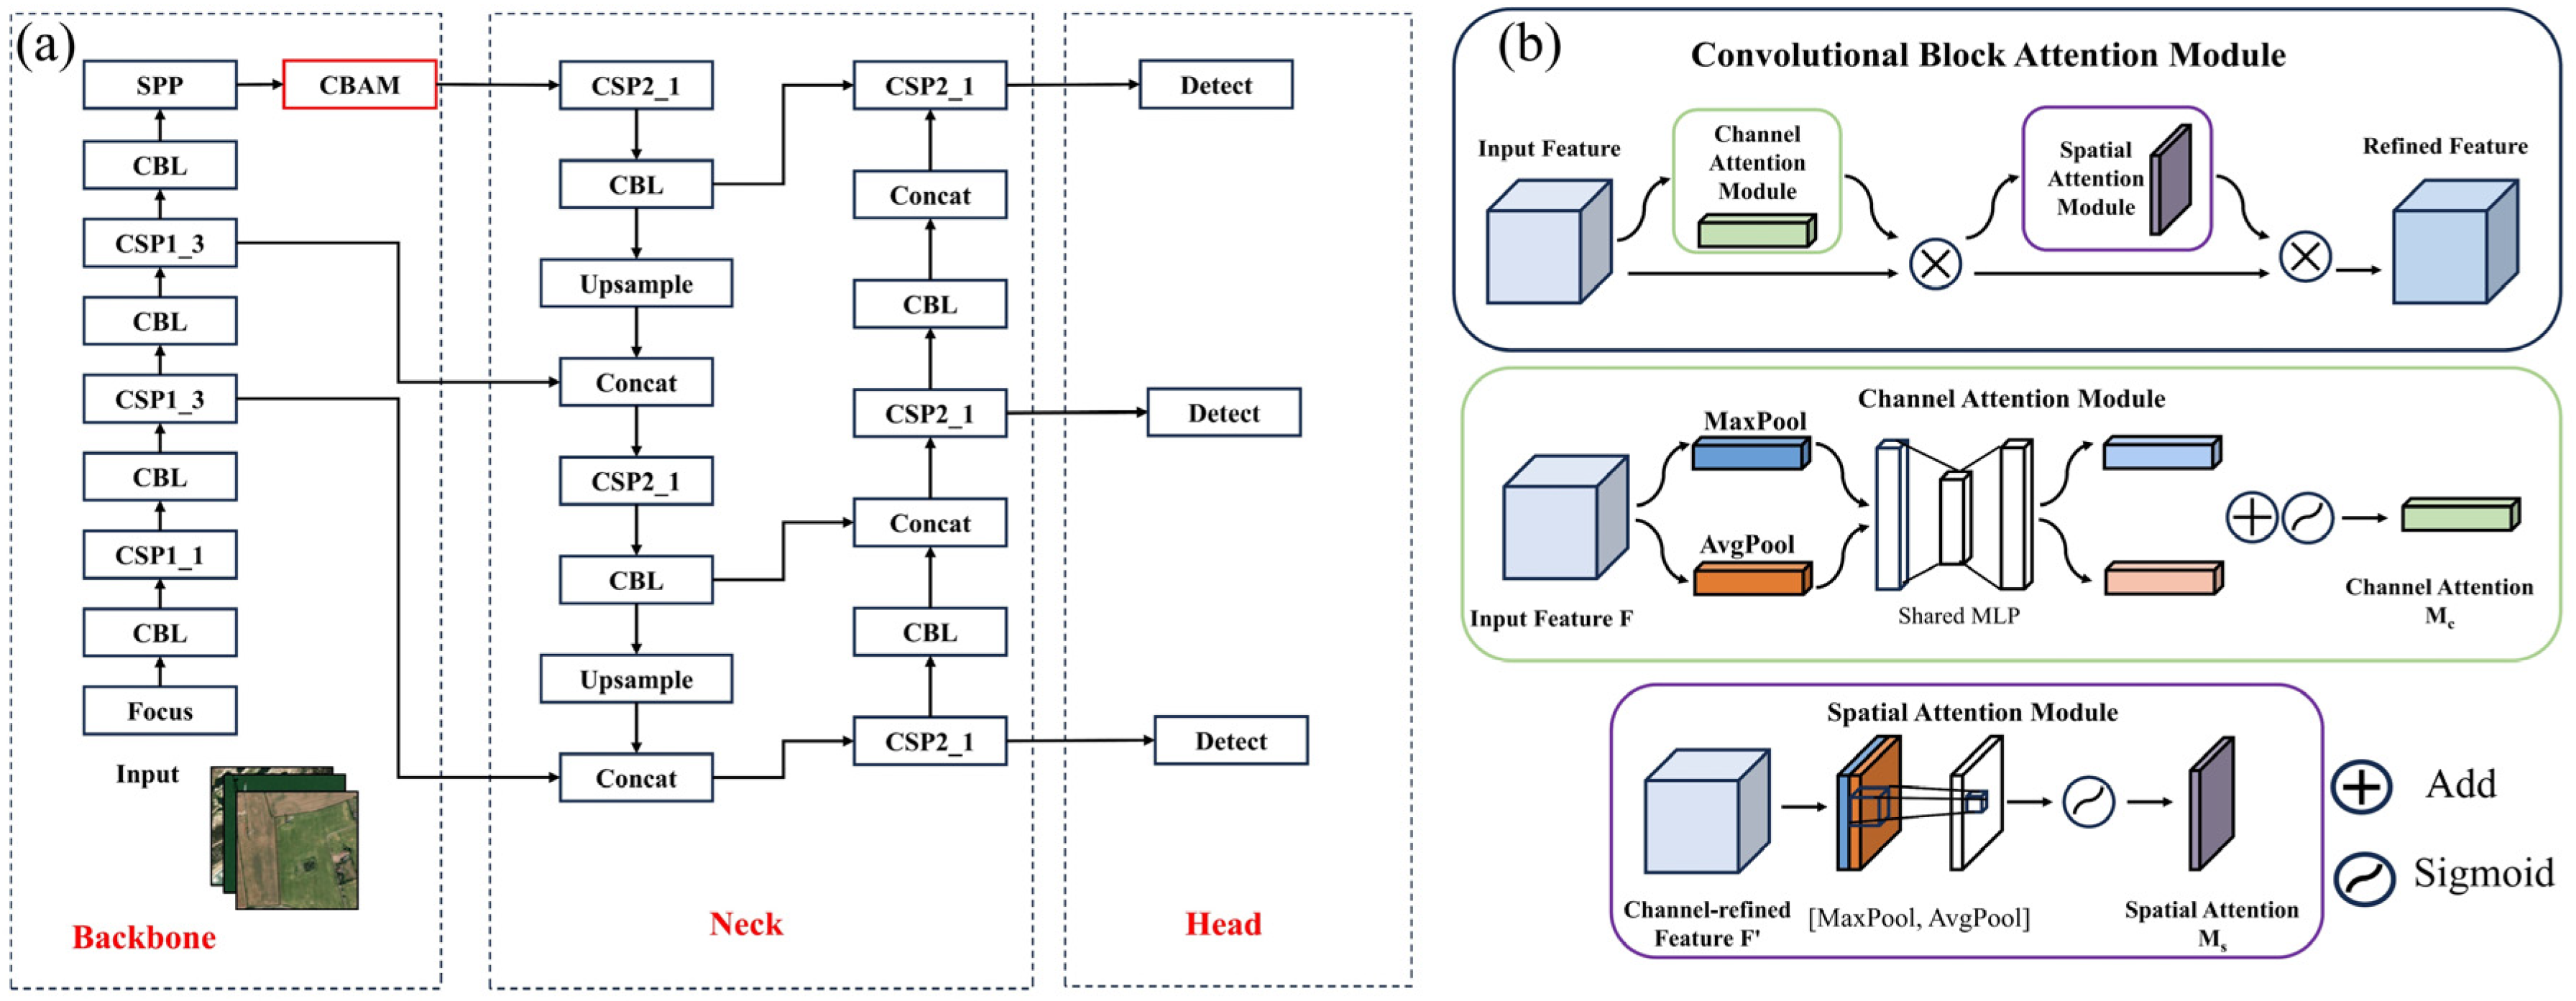
2.1.1. CBAM Optimization for Feature Enhancement of Multi-Scale Targets

The YOLO series, a widely used one-stage object detection framework [26,27,28,29,30,31], has seen extensive application in wind turbine detection in recent years. This study adopts the YOLOv5s architecture as the core framework, capitalizing on its proven performance. The YOLOv5s comprises three primary components: the backbone, neck, and head [29,32]. Specifically, CSPDarknet53 serves as the backbone to extract low-level features from the input images [33]. The neck incorporates PANet, a feature pyramid network, which enables multi-scale object detection by fusing features across multiple levels. Finally, the head network processes the fused feature maps to generate the final detection results, including class predictions, bounding box coordinates, and confidence scores.
The variations in wind turbine sizes and imaging angles result in significant differences in their appearance across different regions. These discrepancies are especially noticeable in smaller wind turbines, where the lack of distinguishing features presents considerable challenges for feature detection. To address this limitation, the CBAM was integrated, consisting of two key components: the Channel Attention Module (CAM) and the Spatial Attention Module (SAM) [34,35,36,37] (Figure 1b). The CAM improves discriminative capacity by selectively emphasizing feature channels critical to the detection task. In contrast, the SAM refines spatial feature distributions by leveraging spatial variations, enhancing overall feature representation. The overall CBAM workflow is mathematically formulated in Equation (1), which aggregates information across both channel and spatial dimensions to generate corresponding attention weights [38]. Specifically, the CAM employs global average and max pooling for feature extraction, followed by a multi-layer perceptron (MLP) to model inter-channel dependencies and compute channel attention weights (Equation (2), Figure 1b). In contrast, the SAM constructs an attention map by identifying salient spatial patterns within the feature maps. The process begins with channel-wise feature aggregation using both max pooling and average pooling operations. These pooled features are then processed through a 7 × 7 convolutional layer to incorporate local spatial context, ultimately generating the spatial attention weights (Equation (3), Figure 1b).
F = M c ( F ) F F = M s ( F ) F
M c ( F ) = σ ( M L P ( A v g P o o l ( F ) ) + M L P ( M a x P o o l ( F ) ) )
M s ( F ) = σ ( f 7 × 7 ( [ A v g P o o l ( F ) ; M a x P o o l ( F ) ] ) )
In this study, the CBAM module is integrated between the SPP and CSP modules of YOLOv5s, resulting in the YOLOv5_CBAM model. This enhancement improves feature extraction along both channel and spatial dimensions, thereby strengthening the representation of wind turbines across multi-scale convolutional layers. The model architecture, depicted in Figure 1a, clearly illustrates the placement of the CBAM module and its interaction with the YOLOv5s framework components.

2.1.2. DBSCAN Optimization for Dense Object Detection

In large-scale remote sensing imagery, the detection of wind turbines is impeded by spectrally similar objects, such as transmission towers and field ridges, which reduce detection precision. Wind turbines are commonly deployed in clusters, forming well-structured wind farms with regular spacing and systematically arranged layouts. However, specific sources of false positives, such as isolated white houses and field ridges, exhibit more dispersed spatial patterns [22,23]. To address these challenges, this study proposes a density-constrained optimization strategy that integrates Bayesian optimization with the DBSCAN clustering algorithm.
The DBSCAN algorithm detects dense regions by analyzing the spatial density of data points using two critical parameters: the neighborhood radius ( ε ) and the minimum number of points (MinPts) [23,39]. The parameter ε defines the neighborhood around each data point, with all points within this radius considered as neighbors. MinPts indicates the minimum number of points required within a point’s ε -neighborhood for it to be classified as a core point. Boundary points are defined as those that, while not meeting the MinPts threshold, reside within the ε -neighborhood of a core point. Data points that do not satisfy either condition are classified as noise and are not assigned to any cluster. This classification process is illustrated in Figure 2a.
The effectiveness of DBSCAN for wind turbine spatial clustering is fundamentally governed by two critical parameters: ε and MinPts, which directly influence clustering precision and computational performance. The neighborhood radius ε is particularly crucial; if set too low, it may fail to detect actual wind turbines due to insufficient density connectivity, while an excessively large ε may incorporate non-wind turbine objects, reducing precision. The MinPts parameter exhibits similar sensitivity; an undersized value may lead to over-clustering by erroneously detecting non-turbine points as core members, causing false detections. Conversely, an excessively high MinPts value can result in under-clustering by detecting actual wind turbines as noise or boundary points, potentially leading to missed detections. Traditional DBSCAN approaches, however, rely heavily on manual parameter tuning through repeated experimentation-a process that is both time-consuming and prone to suboptimal outcomes. To overcome these limitations, the present study introduces a Bayesian optimization framework that automatically determines the optimal parameter combination for DBSCAN, specifically the ε and MinPts. This approach substantially improves the algorithm’s adaptability to diverse spatial distribution patterns while maintaining computational efficiency.
Bayesian optimization is a global optimization methodology grounded in a probabilistic model [40]. The methodology comprises five key computational phases: (1) Initialization: randomly select initial points within the parameter space and evaluate the objective function; (2) Surrogate Modeling: construct a Gaussian process model to approximate the probabilistic distribution of the objective function; (3) Acquisition Optimization: optimize an acquisition function that balances exploration and exploitation to determine the next candidate point; (4) Evaluation and Update: evaluate the objective function at the chosen point and incorporate the new data into the model; (5) Convergence Phase: update the model iteratively until a termination criterion is met (a maximum number of iterations is reached or the objective function converges). This parameter search mechanism effectively overcomes the limitations of traditional methods, offering an improved solution for the spatial clustering of wind turbines.
Researchers have conducted precise calculations on the row and column distribution of wind turbines by incorporating the design characteristics of wind farms. The row and column distribution satisfies Equation (4) [22].
x = k 1 d , k 1 [ 2.85 , 3 ] y = k 2 d , k 2 [ 5.88 , 6 ]
The parameter d represents the wind turbine diameter, while x and y denote the row-wise and column-wise inter-turbine spacing distances, respectively. Given that the maximum rotor diameter of wind turbines worldwide ranges from 260 to 292 m, this study adopts a value of 300 m for d to facilitate a more comprehensive clustering of wind turbine distributions. According to Equation (4), the ε is defined within the range of 2d to 6d, while the MinPts is specified to vary between 2 and 10. This parameter configuration strategy aims to maximize the accurate detection of wind turbines while effectively reducing false detections, thereby significantly enhancing overall detection performance.

2.2. Technical Workflow for Wind Turbine Detection

2.2.1. Dataset Selection for Sample Labeling

This study references publicly accessible wind turbine datasets to systematically select test areas encompassing a range of environmental conditions and wind turbine typologies. These datasets further facilitate the development of a representative and diverse sample set. Due to the small size and widespread geographic distribution of wind turbines, relying on a single dataset to select the test areas and sample set may result in an incomplete representation of wind turbine types and inadequate records. This limitation can undermine the reliability of test areas and the sample set. To address this issue, this study integrates three publicly accessible datasets: the Global Wind and Solar Farms Dataset (GBWSFs) [41], the United States Wind Turbine Database (USWTD) [42], and the Deep-learning-derived Offshore Wind Turbines (DeepOWT) [11], thus enabling the selection of representative test areas and the construction of a diverse sample set.
The GBWSFs dataset encompasses global wind farms’ geographic locations and counts in 2020, derived from OpenStreetMap data. The USWTD dataset, released by the United States Geological Survey, the American Clean Power Association, and the Lawrence Berkeley National Laboratory, provides accurate geospatial coordinates for United States wind turbines from 1982 to 2024. The DeepOWT dataset was developed through cascaded convolutional neural networks applied to Sentinel-1 SAR imagery from 2016 to 2021. It provides detailed geographic coordinates and installation information for 9941 global offshore wind energy facilities.

2.2.2. Sample Creation Process

This study employs a sample set of 9846 images, each 500 × 500 pixels. These images include tubular and lattice-type wind turbines distributed across various landscapes, such as tidal flats, oceans, forests, mountains, grasslands, and deserts, as shown in Figure 3. Tubular wind turbines are constructed with a single cylindrical tower, whereas lattice-type wind turbines feature a lattice framework composed of interconnected support rods (Figure 3e–g). To enhance the model’s discriminative capability and minimize false detections, we supplemented the training dataset with 840 negative sample images devoid of wind turbines. These negative samples specifically included challenging scenarios featuring trees, buildings, transmission towers, field ridges, and other potential interference sources that share visual similarities with wind turbine shadows. Wind turbine structures typically exhibit distinct high-reflectance characteristics, whereas their shadow regions demonstrate pronounced low-reflectance properties.
To comprehensively address variations in imaging angles between shadows and wind turbines under diverse lighting conditions, as well as seasonal changes, this study systematically selected multi-temporal wind turbine sample data and conducted meticulous annotation using the Make Sense.ai platform. Specifically, in cases where shadows are present, both the wind turbine structure and its corresponding shadow regions were annotated simultaneously [43]; conversely, in the absence of visible shadows, only the wind turbine body was annotated. To improve the model’s generalization ability, a comprehensive data augmentation strategy was employed. Specifically, the original images were rotated counterclockwise by 90°, 180°, and 270° and subjected to both vertical and horizontal flip operations. The sample set was partitioned into training and validation subsets in a ratio of 8:2. A ten-fold cross-validation approach was adopted, in which the dataset was randomly divided into ten subsets. Eight subsets were selected as the training data, while the remaining two were used as validation data, thereby minimizing the potential for partitioning biases. The sample set and test areas are entirely independent in selection.

2.2.3. Model Training

Table 1 presents the key training parameters for all models employed in this study. To ensure comparability of experimental results, all training procedures were conducted under identical hardware conditions. Specifically, we performed all experiments on an AutoDL platform utilizing NVIDIA RTX3090 GPUs to guarantee consistent computational performance across trials.

2.2.4. Detection Accuracy Evaluation

To comprehensively evaluate the performance of the wind turbine detection model, this study employs four key metrics: Precision (P), Recall (R), F1-score, and mean Average Precision (mAP) (Equations (5)–(8)). The F1-score, as the harmonic mean of P and R, effectively balances the trade-off between these two metrics, providing a more holistic evaluation of model performance. As the prevailing benchmark in object detection tasks, mAP quantitatively evaluates the model’s overall detection capability across multiple classes.
P = T P T P + F P
R = T P T P + F N
F1-score = 2 × P × R P + R
mAP = 1 n i = 1 n AP i , AP = 0 1 P ( i ) d R ( i )
In this context, TP refers to correctly detected wind turbines, while FP represents false detections, where non-turbine objects are incorrectly classified. FN quantifies the number of actual wind turbines that were missed by the model.
To evaluate the model’s performance across various confidence thresholds, an initial confidence level of 0.25 was selected, and detection results were compared over a range of thresholds. In object detection tasks, a trade-off typically exists between P and R. Therefore, to provide a comprehensive assessment of the model’s detection capabilities, the F1-score was employed as the primary performance metric. However, given that wind turbine detection is particularly susceptible to interference from complex geographical backgrounds and that mAP exhibits relatively low sensitivity to false detections, this study adopts mAP as a supplementary metric to thoroughly evaluate the model’s practical performance.

3. Global Experiments

3.1. Test Areas

To evaluate the performance of wind turbine detection models, a total of 395 test areas, each spanning 10 km × 10 km, were systematically selected worldwide (Figure 4a). These areas encompass various environmental contexts, including tidal flats, marine environments, forests, mountainous regions, grasslands, and deserts (Figure 4b–d). To ensure a comprehensive evaluation of wind turbine detection, 135 regions without wind turbines, each with 10 km × 10 km dimensions, were also included. This selection strategy allowed for a robust assessment of model performance across diverse conditions. A total of 15,452 wind turbines within these 395 test areas were manually annotated using World Imagery with a resolution of 0.3 m.

3.2. Experimental Image

This study used QGIS to download high-resolution RGB imagery from World Imagery via the Application Programming Interface (API). The 2 m resolution imagery was utilized for wind turbine detection. World Imagery, provided by ESRI, aggregates various satellite imagery (e.g., Landsat, Sentinel, WorldView) and global aerial imagery, offering precise and extensive geospatial information. The platform provides global coverage with resolutions ranging from sub-meters to tens of meters, depending on the region-developed areas that typically feature higher resolutions. Its update frequency varies by region, urban and densely populated areas receive more frequent updates than rural areas.
This study employed a multi-scale gridding methodology, initially constructing a primary 100 km × 100 km grid framework, which was subsequently partitioned into 10 km × 10 km units. Remote sensing imagery in TIFF format corresponding to these 10 km × 10 km grids was acquired through the QGIS platform, with emphasis on image quality screening and historical data retrieval in regions with high cloud coverage. A Python based automated processing tool (Python 3.8) was then developed to perform batch conversion from TIFF to JPEG format and standardized cropping to 500 × 500 pixels.

3.3. Detection Performance of Model

3.3.1. Model Performance at Optimal Confidence Levels

In the domain of object detection, the YOLOv5s model has gained widespread recognition for its exceptional real-time processing capabilities and detection precision. Nevertheless, the model demonstrates limited effectiveness in detecting wind turbines, which exhibit multi-scale characteristics and are typically situated in complex geographical environments with highly similar morphological features. To overcome these limitations, we propose the YOLOv5_CDB model, which integrates CBAM with a DBSCAN-based density constraint strategy, significantly improving detection precision in challenging environmental conditions.
Table 2 summarizes the performance evaluation of the YOLOv5s and YOLOv5_CDB models across global test areas. The results reveal substantial performance enhancements achieved by the YOLOv5_CDB model over YOLOv5s. Specifically, at a confidence threshold of 0.55, the YOLOv5s model achieves its optimal performance, registering a P of 94.14%, an R of 90.19%, an F1-score of 91.12%, and an mAP of 0.896. In contrast, the YOLOv5_CDB model performs optimally at a confidence threshold of 0.45, achieving a P of 95.97%, an R of 91.18%, an F1-score of 93.51%, and an mAP of 0.911. In comparison with YOLOv5s, the YOLOv5_CDB model demonstrates relative improvements of 1.83% in P, 0.99% in R, 1.39% in F1-score, and 1.5% in mAP. These enhancements comprehensively validate the effectiveness and superiority of the proposed method, demonstrating that the YOLOv5_CDB model outperforms the YOLOv5s model in wind turbine detection tasks, providing a more reliable model choice for related research and practical applications.
As illustrated in Figure 5a, the integration of the CBAM module significantly enhances the model’s adaptability to scale variations and complex background conditions. By leveraging channel and spatial attention mechanisms, the CBAM module enables the model to focus on critical features of wind turbines, thereby improving detection performance in challenging environments. Compared with the YOLOv5s model, the YOLOv5_CBAM module detects more multi-scale wind turbines. Furthermore, Figure 5b highlights the effectiveness of the DBSCAN-based density constraint strategy in optimizing wind turbine detection. The strategy effectively constrains the target distribution area while reducing false detections caused by sparsely distributed objects such as transmission towers, field ridges, and snow-covered terrains. These improvements collectively enhance the model’s detection precision and robustness.

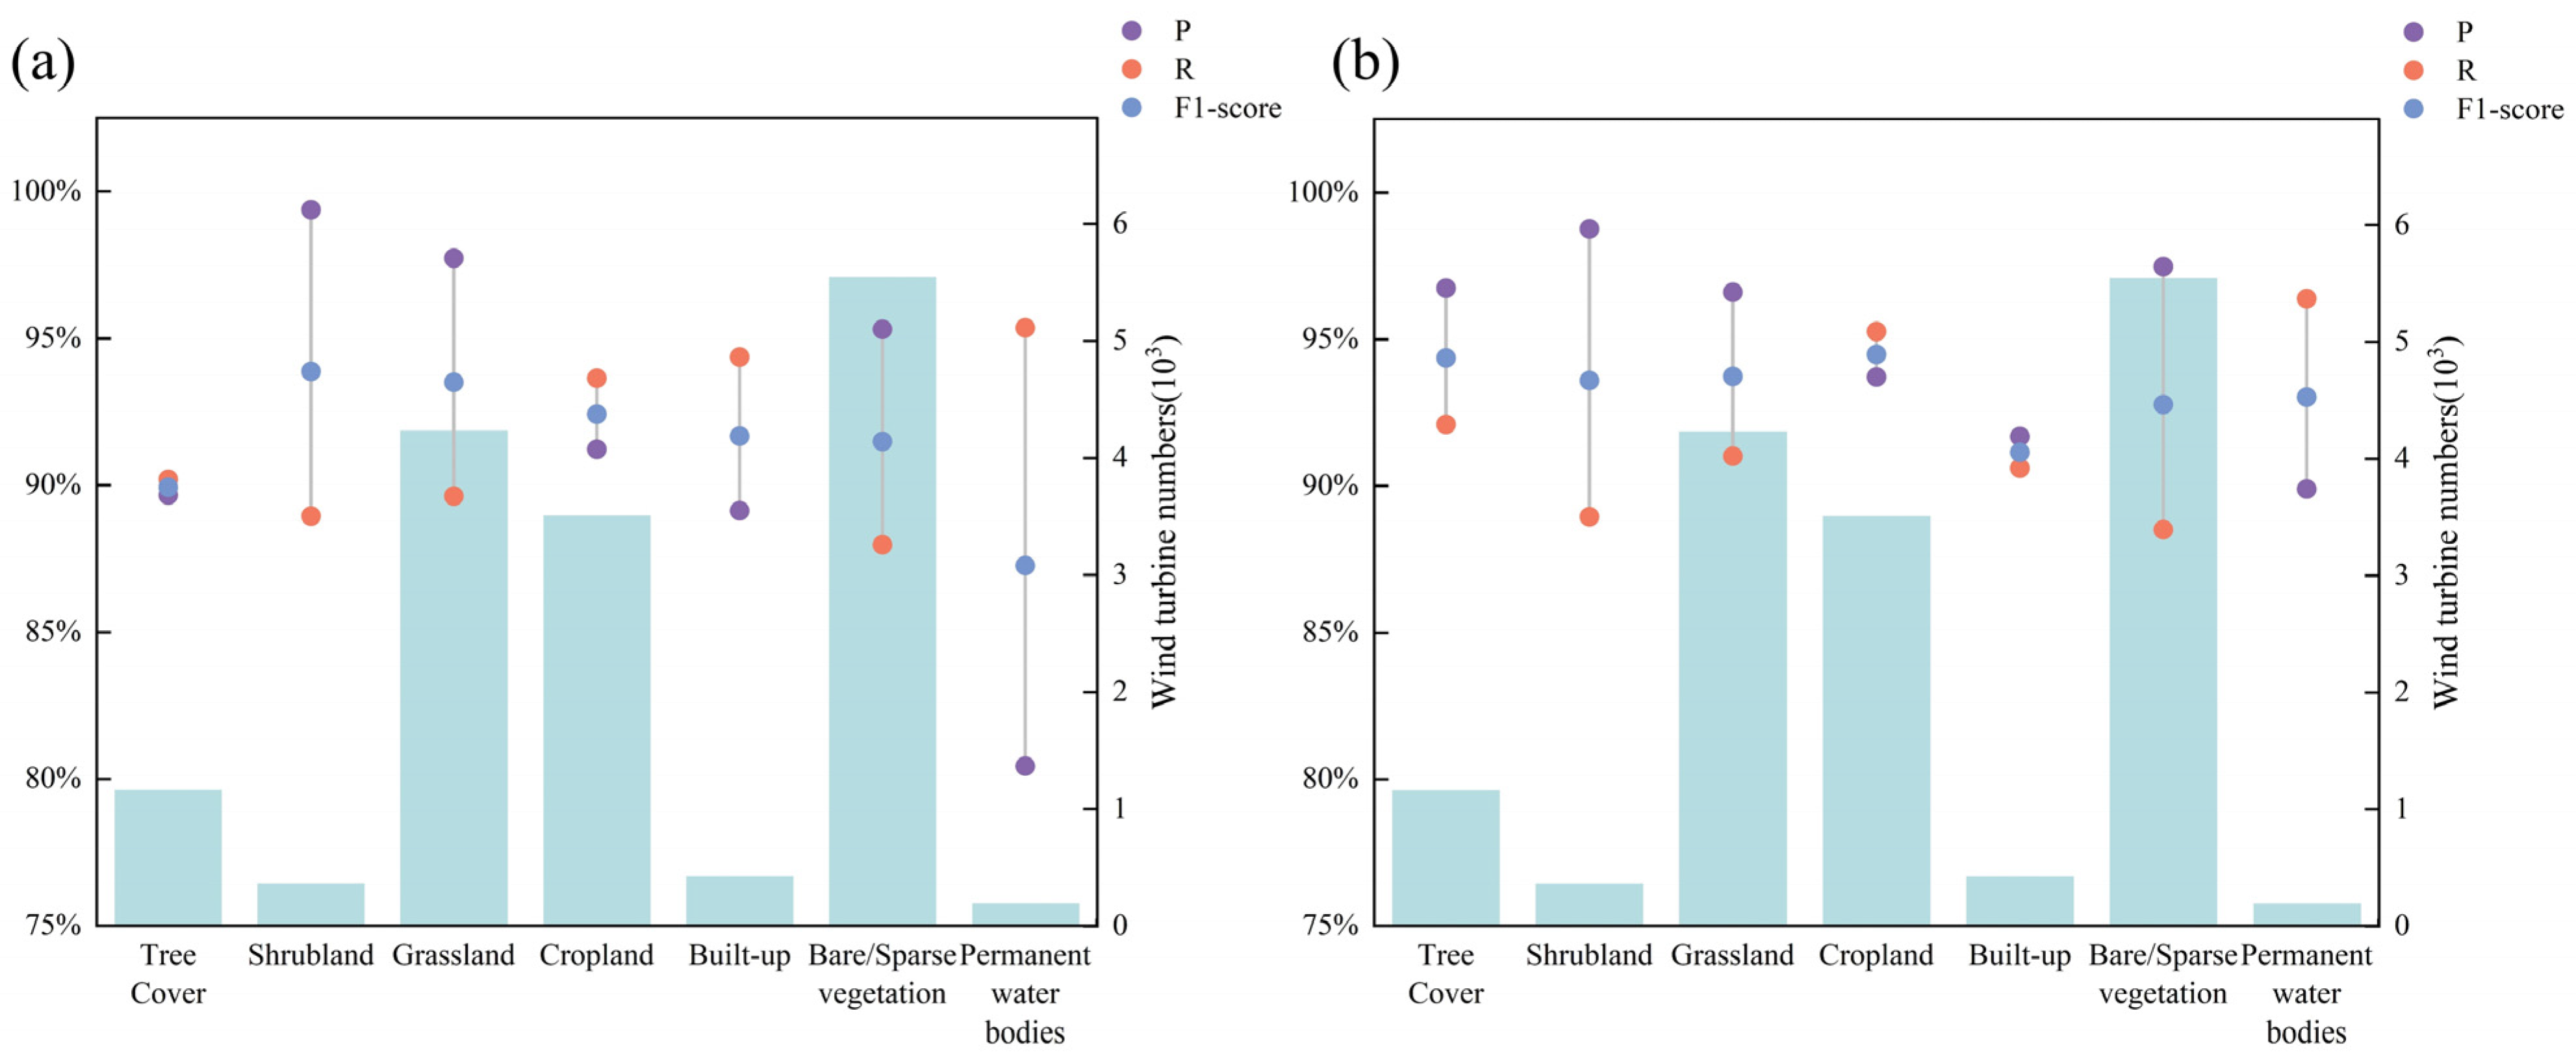
3.3.2. Model Performance Across Land Cover Classes

This study used ESA 10 m resolution land cover data to analyze wind turbine detection performance. The YOLOv5s and YOLOv5_CDB models were evaluated at optimal confidence thresholds across various land cover classes. Land cover classes with fewer than 20 samples were excluded from the analysis to ensure statistical robustness. Figure 6 illustrates models’ P, R, and F1-score across seven distinct land cover classes: tree cover, shrubland, grassland, cropland, built-up, bare/sparse vegetation, and permanent water bodies. Additionally, Figure 6 provides a visualization of the spatial distribution of actual wind turbines within these land cover classes.
Firstly, in bare vegetation areas, wind turbines constitute 35.9% of the total distribution within the test areas, representing one of the most critical and representative scenarios in this study. In these areas, the YOLOv5_CDB model demonstrates superior performance, achieving a P of 97.48% and an R of 88.51%, with improvements of 2.17% in P and 0.54% in R compared to the YOLOv5s. Notably, the F1-score exhibits a 1.28% enhancement. In cropland areas, the YOLOv5_CDB model demonstrated notable improvements, with R increasing by 1.62%, P enhancing by 2.49%, and the F1-score rising by 2.07%. In tree-covered regions, the model delivered an impressive 7.08% boost in P, alongside a 1.89% increase in R and a 4.43% improvement in the F1-score. These enhancements underscore the model’s robustness in complex, forested environments, where it effectively distinguishes wind turbines from visually similar tree features, thereby bolstering detection precision and stability. Moreover, in areas with permanent water bodies, the YOLOv5_CDB model exhibited outstanding performance, with P surging by 9.47%, R rising by 1.03%, and the F1-score improving by 5.77%. This distinct advantage in handling water-related background interference further enhances the model’s ability to accurately detect wind turbine targets.
Although the model achieved significant improvements in both P and R across most scenarios, performance fluctuations were observed in certain regions. In shrubland areas, while the YOLOv5_CDB model maintained the same R as the YOLOv5s model, its P experienced a slight decline of 0.61%. This minor reduction in P may be attributed to the complex backgrounds in these regions, which led to a marginal increase in false detections. In built-up areas, the YOLOv5_CDB model exhibited a 2.55% improvement in P despite a 3.76% decrease in R, with the overall F1-score dropping by only 0.53%. In grassland areas, the YOLOv5_CDB model achieved a P of 96.61% and an R of 91.02%. Compared to the YOLOv5s model, P decreased by 1.12% while R increased by 1.39%, resulting in an overall F1-score improvement of 0.23%, thereby indicating a better balance between P and R in these regions.
The YOLOv5_CDB model demonstrates superior performance across diverse land cover types. While minor variations in P or R occur in specific regions, the model maintains robust adaptability in most operational scenarios. Notably, it achieves substantial enhancements in both P and R metrics for bare vegetation, cropland, permanent water bodies, and tree-covered areas while simultaneously optimizing F1-score in grassland regions. Although modest reductions in P or R are observed in shrubland and built-up environments, these variations remain statistically insignificant, with F1-scores exhibiting either stability or negligible decreases. These findings collectively demonstrate the model’s exceptional capability for target detection in complex landscapes, particularly its improved environmental adaptability and operational stability in challenging conditions.

4. Discussion

4.1. Model Performance Comparative Analysis

To comprehensively assess the YOLOv5_CDB’s performance, we conducted comparative experiments between YOLOv5_CDB and current state-of-the-art detectors, including YOLOv8s, YOLOv12s, and RT-DETR for wind turbine detection. The evaluation framework quantitatively assessed detection performance using four key metrics: P, R, F1-score, and mAP.
Table 3 provides a detailed comparison of the performance evaluation results for the YOLOv5_CDB, YOLOv8s, YOLOv12s, and RT-DETR models under different confidence thresholds. The results indicate that the YOLOv5_CDB model outperforms the other three models across all performance metrics, demonstrating its remarkable advantage in complex scenarios. Specifically, at a confidence threshold of 0.45, the YOLOv5_CDB model achieves its best performance, with a P of 95.97%, an R of 91.18%, an F1-score of 93.51%, and an mAP of 0.911. At the optimal confidence threshold for each model, the YOLOv5_CDB model outperforms YOLOv8s, YOLOv12s, and RT-DETR in P by 1.77%, 6.4%, and 2.43%, further confirming its advantage in accurate detection. Additionally, in terms of R, YOLOv5_CDB achieves improvements of 1.92%, 1.7%, and 1.17% over YOLOv8s, YOLOv12s, and RT-DETR, respectively, demonstrating its superior ability to capture a greater number of targets.
The F1-score results demonstrate the superior performance of YOLOv5_CDB, showing improvements of 1.84%, 3.98%, and 1.77% over YOLOv8s, YOLOv12s, and RT-DETR, respectively. This indicates YOLOv5_CDB’s optimal balance between P and R, along with enhanced adaptability. For mAP, YOLOv5_CDB maintains its advantage, with gains of 3.7%, 4.5%, and 3% compared to YOLOv8s, YOLOv12s, and RT-DETR. Collectively, these comparative results confirm YOLOv5_CDB’s outstanding detection capability for wind turbines in complex environments across all evaluation metrics.
Notably, while YOLOv5_CDB exhibits superior overall detection performance at optimal confidence thresholds compared to both YOLOv12s and RT-DETR, the latter two models maintain competitive advantages in specific scenarios. Systematic evaluation of P and R across varying thresholds demonstrates that YOLOv12s and RT-DETR achieve substantially improved R performance at the 0.25 confidence level. The quantitative analysis shows RT-DETR attains an R of 96.15%, representing a 3.46% improvement over YOLOv5_CDB, while YOLOv12s achieves an R of 94.64%, surpassing YOLOv5_CDB by 1.95%. This performance difference likely stems from enhanced small-target detection capabilities inherent to both RT-DETR and YOLOv12s architectures, enabling superior identification of potential targets at reduced confidence thresholds. These findings underscore the context-specific strengths of different models, suggesting that practical implementations should model selection and parameter configuration to application needs.

4.2. Analysis of Detection Errors

4.2.1. Missed Detection and Contributing Factors

The detection performance of wind turbines is notably influenced by their spatial arrangement. To further explore this relationship, this study selected several representative test areas for comparative analysis, taking into account diverse layout configurations. This study examines two fundamental wind turbine layout patterns: regular and mixed. In the regular layout pattern, wind turbines are systematically arranged in a structured and predictable spatial configuration, typically organized into rows or grid formations. This layout pattern can be further categorized into two distinct types: one characterized by alternating wind turbine sizes, where large and small turbines are systematically incorporated into the layout; the other consists of wind turbines with uniform sizes across the entire arrangement. In contrast, the mixed layout pattern is defined by an irregular spatial configuration, where terrain features or environmental constraints often influence the placement of wind turbines.
Table 4 provides a systematic comparison between YOLOv5s and YOLOv5_CDB models across diverse wind turbine layout patterns. The results reveal that YOLOv5_CDB consistently outperforms YOLOv5s in all layout patterns.
In regular layouts with uniform turbine sizes, both models achieve their optimal detection performance. Notably, YOLOv5_CDB demonstrates modest yet consistent improvements over YOLOv5s, with P and R increasing by 0.7% and 1.35%, respectively. While these enhancements may appear marginal, they indicate YOLOv5_CDB’s superior capability in capturing target features within structured, homogeneous environments. For mixed layout patterns, YOLOv5_CDB shows more significant performance gains, achieving 2% higher P and 1% improved R compared to YOLOv5s. This performance advantage stems primarily from the DBSCAN algorithm’s effectiveness in noise suppression and its enhanced handling of complex backgrounds with densely distributed targets, leading to more accurate detection outcomes. For regular layouts with varying wind turbine sizes, while both models show similar precision performance, YOLOv5_CDB demonstrates a significant 8.81% higher R compared to YOLOv5s. This significant performance enhancement primarily results from the incorporated CBAM, which effectively enhances the model’s sensitivity to feature representation from smaller-scale wind turbines, particularly in heterogeneous size distributions.
It should be noted that while the YOLOv5_CDB model achieves an 8.81% improvement in R compared to YOLOv5s for detecting wind turbines with significant size variations, its overall detection performance in complex scenarios remains suboptimal. In-depth analysis reveals two primary contributing factors: medium and small wind turbines typically appear as low-contrast blurred shadows with poorly discernible structural features in remote sensing imagery, and shadows cast by larger wind turbines create occlusion effects that further compromise the accurate detection of smaller targets. These inherent challenges stemming from imaging characteristics ultimately constrain the model’s overall R performance in complex environments.

4.2.2. False Detection and Contributing Factors

Although the YOLOv5_CDB model significantly enhances detection precision, a certain degree of false detection still occurs. To thoroughly analyze this issue, we conducted a detailed classification study of the false detection results, categorizing the erroneously detected terrain features into seven distinct types: field ridges, snow-covered areas, salinized lands, transmission towers, building shadows, abandoned or dismantled wind turbines, and other categories. Table 5 summarizes the quantitative distribution and proportional representation of false detections across these categories.
Transmission towers were the predominant source of false detections (31.08%), primarily due to their structural similarities to wind turbines. Specifically, transmission towers are often arranged in an interspersed arrangement with wind turbines, and their shapes show a significant resemblance to truss-type wind turbine towers in high-resolution remote sensing images [22,25]. The structural similarities hinder the model’s ability to distinguish between transmission towers and truss-type wind turbines, leading to false detections. Furthermore, their interleaved spatial arrangement further challenges the efficacy of the density-based DBSCAN clustering algorithm, which struggles to distinguish between them, thereby exacerbating detection errors.
The detection errors associated with field ridges rank second after transmission towers, constituting 25.84% of all errors. Field ridges exhibit high reflectance as wind turbines in RGB images, particularly pronounced in flat terrain areas. This resemblance stems from an overlap in spectral reflectance ranges, which can lead models to detect field ridges erroneously [16,17].

4.3. Advantages, Limitations, and Future Research

In recent years, significant advancements have been made in wind turbine detection. Given the relatively homogeneous maritime background and the manifestation of wind turbines as simple point targets in medium-resolution remote sensing imagery, offshore wind turbines’ detection consistently achieves high detection accuracy [11,12,21]. However, in terrestrial environments, many terrain features with spectral features resemble those of wind turbines, posing a threat to achieving high-precision detection [22].
Researchers have turned to high-resolution remote sensing imagery to address this limitation, leveraging its detailed information to enhance wind turbine detection performance. While these studies have made notable progress in feature detection across diverse backgrounds and varying scales, they are often confined to relatively small geographical extents. Consequently, the generalization capacity of these studies has not been sufficiently validated over a broader range. Additionally, existing studies often ignore the impact of differences in wind turbine layout between different regions, which restricts the applicability of the detection algorithms in diverse environments.
To overcome the mentioned limitations, this study proposes a novel YOLOv5_CDB algorithm that integrates scale and density features and further validates its performance in high-resolution images globally. The algorithm improves the detection capability of wind turbines by accounting for variations in turbine layouts across diverse geographic regions. By comprehensively considering these layout characteristics, the proposed algorithm can better adapt to diverse geographical environments, improving detection accuracy and generalization ability.
Although the YOLOv5_CDB model demonstrates significant performance improvements on the global evaluation dataset, its application is constrained by the 10 km × 10 km grid size, which may exclude some wind turbines from the detection range when they fail to meet the density constraint rules. For these potentially missed targets, we first acquire high-resolution imagery of the wind farm containing the potentially missing targets. Subsequently, we perform preliminary detection using the YOLOv5_CBAM model followed by secondary validation through density constraints. Targets that satisfy the density constraint conditions within the wind farm boundaries are validated as true positives, while those failing to meet the constraints are classified as interference targets excluded during model optimization. Additionally, false positives continue to occur for features such as transmission towers and field ridges, mainly due to their spectral similarities to wind turbines in high-resolution imagery. Future research may benefit from integrating additional features or employing more sophisticated classification techniques to mitigate these problems. Moreover, further improvements in detection accuracy are still needed when dealing with densely clustered turbines or layouts with uniform sizes. Incorporating multi-scale feature fusion techniques could enhance the model’s ability to adapt to different spatial scales and distribution patterns, thereby improving robustness in diverse environments. This study primarily uses 2 m resolution optical remote sensing imagery for wind turbine detection. While these data offer rich spectral information and visual interpretability, their application is inherently limited under cloud cover and low-light conditions. Recent advances in SAR remote sensing, particularly through Sentinel-1 satellite data with digital beamforming and blind source separation techniques, demonstrate the potential to address these limitations by providing all-weather monitoring capabilities. Such multimodal data fusion could overcome single-sensor constraints and enhance detection reliability in complex environments.

5. Conclusions

This study presents a novel wind turbine detection method, YOLOv5_CDB, which integrates scale features and density constraints to improve detection performance. Incorporating the CBAM into the YOLOv5 architecture enhances the model’s capacity to effectively capture multi-scale features, enabling accurate detection across varying scales. Furthermore, integrating the DBSCAN density constraint mechanism improves detection performance by regulating the spatial distribution of detections, thereby reducing false positives and enhancing overall accuracy. To support comprehensive detection research, a wind turbine sample set including lattice and tubular types was constructed based on World Imagery images, encompassing a broad range of geographical and environmental conditions. The results indicate that, at the optimal confidence threshold, the YOLOv5_CDB model attains a P of 95.97%, an R of 91.18%, an F1-score of 93.51%, and an mAP of 0.911. The F1-score and mAP are 1.39% and 1.5% higher than those of YOLOv5s, respectively. These findings reveal that integrating scale features and density constraints significantly enhances the detection of wind turbines. In subsequent research, we aim to refine the model’s feature detection capabilities to improve its detection performance in more complex and dynamic environments. Furthermore, we intend to extend the application of this approach to large-scale monitoring of wind turbines, facilitating the real-time tracking of changes in their spatial distribution over time.

Author Contributions

Y.F. drafted the manuscript, performed the experiments, and collected the data. Y.G. revised the manuscript and developed the methodology. H.G. also revised the manuscript and assisted with data downloading. Y.S. and Y.T. provided technical guidance and supported data collection. All authors have read and agreed to the published version of the manuscript.

Funding

This research was funded by the National Key Research and Development Program of China (2023YFC3208701) and the Fundamental Research Funds for the Central Universities (Grant No. B210201035).

Institutional Review Board Statement

Not applicable.

Informed Consent Statement

Not applicable.

Data Availability Statement

Data will be made available on request.

Conflicts of Interest

The authors declare no conflicts of interest.

References

  1. Wang, D.; Huangfu, Y.; Dong, Z.; Dong, Y. Research Hotspots and Evolution Trends of Carbon Neutrality—Visual Analysis of Bibliometrics Based on CiteSpace. Sustainability 2022, 14, 1078. [Google Scholar] [CrossRef]
  2. Zheng, C.W.; Li, C.Y.; Pan, J.; Liu, M.Y.; Xia, L.L. An overview of global ocean wind energy resource evaluations. Renew. Sust. Energy Rev. 2016, 53, 1240–1251. [Google Scholar]
  3. Zheng, C.W.; Li, C.Y. Variation of the wave energy and significant wave height in the China Sea and adjacent waters. Renew. Sust. Energy Rev. 2015, 43, 381–387. [Google Scholar]
  4. Roga, S.; Bardhan, S.; Kumar, Y.; Dubey, S.K. Recent technology and challenges of wind energy generation: A review. Sustain. Energy Technol. Assess. 2022, 52, 102239. [Google Scholar] [CrossRef]
  5. Global Wind Energy Concil (GWEC). Global Wind Report 2024. Available online: https://www.gwec.net/reports/globalwindreport (accessed on 22 December 2024).
  6. Bashir, M.B.A. Principle Parameters and Environmental Impacts that Affect the Performance of Wind Turbine: An Overview. Arab. J. Sci. Eng. 2022, 47, 7891–7909. [Google Scholar]
  7. Bansal, J.C.; Farswan, P. Wind farm layout using biogeography based optimization. Renew. Energy 2017, 107, 386–402. [Google Scholar] [CrossRef]
  8. Kusiak, A.; Song, Z. Design of wind farm layout for maximum wind energy capture. Renew. Energy 2010, 35, 685–694. [Google Scholar]
  9. Chang, S.; Deng, Y.; Zhang, Y.; Zhao, Q.; Wang, R.; Zhang, K. An Advanced Scheme for Range Ambiguity Suppression of Spaceborne SAR Based on Blind Source Separation. IEEE Trans. Geosci. Remote Sens. 2022, 60, 5230112. [Google Scholar] [CrossRef]
  10. Wong, B.A.; Thomas, C.; Halpin, P. Automating offshore infrastructure extractions using synthetic aperture radar & Google Earth Engine. Remote Sens. Environ. 2019, 233, 111412. [Google Scholar]
  11. Hoeser, T.; Feuerstein, S.; Kuenzer, C. DeepOWT: A global offshore wind turbine data set derived with deep learning from Sentinel-1 data. Earth Syst. Sci. Data 2022, 14, 4251–4270. [Google Scholar]
  12. Zhang, T.; Tian, B.; Sengupta, D.; Zhang, L.; Si, Y. Global offshore wind turbine dataset. Sci. Data 2021, 8, 191. [Google Scholar] [PubMed]
  13. Xu, W.; Liu, Y.; Wu, W.; Dong, Y.; Lu, W.; Liu, Y.; Zhao, B.; Li, H.; Yang, R. Proliferation of offshore wind farms in the North Sea and surrounding waters revealed by satellite image time series. Renew. Sustain. Energy Rev. 2020, 133, 110167. [Google Scholar]
  14. Wang, K.; Xiao, W.; He, T.; Zhang, M. Remote sensing unveils the explosive growth of global offshore wind turbines. Renew. Sustain. Energy Rev. 2024, 191, 114186. [Google Scholar]
  15. Wang, F.; Zhang, S.; Hou, Y.; Wang, J. Extraction of offshore wind turbines in China by combining multispectral and SAR image data. IEEE J. Sel. Top. Appl. Earth Obs. Remote Sens. 2024, 17, 9266–9281. [Google Scholar]
  16. Mandroux, N.; Dagobert, T.; Drouyer, S.; Grompone von Gioi, R. Single date wind turbine detection on Sentinel-2 optical images. Image Process. Line 2022, 12, 198–217. [Google Scholar]
  17. Mandroux, N.; Drouyer, S.; Grompone von Gioi, R. Multi-date wind turbine detection on optical satellite images. ISPRS Ann. Photogramm. Remote Sens. Spat. Inf. Sci. 2022, V-2-2022, 383–390. [Google Scholar]
  18. Yue, A.; Chen, J. Wind turbine extraction from high spatial resolution remote sensing images based on saliency detection. J. Appl. Remote Sens. 2018, 12, 016041. [Google Scholar]
  19. Li, H.; Zhao, J.; Zhang, Y.; Zhang, Y. Recognition of windmills in remote sensingimage by SVM and morphological attribute filters. In Proceedings of the IGARSS 2018—2018 IEEE International Geoscience and Remote Sensing Symposium, Valencia, Spain, 22–27 July 2018; pp. 6923–6926. [Google Scholar]
  20. Xu, Z.; Zhang, H.; Wang, Y.; Wang, X.; Xue, S.; Liu, W. Dynamic detection of offshore wind turbines by spatial machine learning from spaceborne synthetic aperture radar imagery. J. King Saud Univ.—Comput. Inf. Sci. 2022, 34, 1674–1686. [Google Scholar]
  21. Zhang, S.; Wang, F.; Hou, Y.; Wang, J.; Guo, J. Global offshore wind turbine detection: A combined application of deep learning and Google earth engine. Int. J. Remote Sens. 2024, 45, 6601–6623. [Google Scholar]
  22. Chen, J.; Chen, J.; Meng, Y.; Deng, Y.; Jie, Y.; Zhang, Y. Detection of wind turbine towers in remote sensing based on YOLOv3 model under scale and density constraints. Remote Sens. Nat. Resour. 2021, 33, 54–62. [Google Scholar]
  23. Chen, D.; Cheng, T.; Lu, Y.; Xiao, J.; Ji, C.; Hong, S.; Zhuang, Q.; Cheng, L. A method for fast detection of wind farms from remote sensing images using deep learning and geospatial analysis. Open Geosci. 2024, 16, 20220645. [Google Scholar] [CrossRef]
  24. Zhai, Y.; Chen, X.; Cao, X.; Cui, X. Identifying wind turbines from multiresolution and multibackground remote sensing imagery. Int. J. Appl. Earth Obs. Geoinf. 2024, 126, 103613. [Google Scholar] [CrossRef]
  25. Zhang, W.; Wang, G.; Qi, J.; Wang, G.; Zhang, T. Research on the extraction of wind turbine all over the China based on domestic satellite remote sensing data. In Proceedings of the 2021 IEEE International Geoscience and Remote Sensing Symposium IGARSS, Brussels, Belgium, 11–16 July 2021; pp. 4167–4170. [Google Scholar]
  26. Qiang, H.; Hao, W.; Xie, M.; Tang, Q.; Shi, H.; Zhao, Y.; Han, X. SCM-YOLO for Lightweight Small Object Detection in Remote Sensing Images. Remote Sens. 2025, 17, 249. [Google Scholar] [CrossRef]
  27. Qiu, Y.; Xue, J.; Zhang, G.; Hao, X.; Lei, T.; Jiang, P. RS-FeatFuseNet: An Integrated Remote Sensing Object Detection Model with Enhanced Feature Extraction. Remote Sens. 2025, 17, 61. [Google Scholar] [CrossRef]
  28. Wan, Y.; Zhan, Z.; Ren, P.; Fan, L.; Liu, Y.; Li, L.; Dai, Y. Storage Tank Target Detection for Large-Scale Remote Sensing Images Based on YOLOv7-OT. Remote Sens. 2024, 16, 4510. [Google Scholar] [CrossRef]
  29. Zhao, J.; Zhang, X.; Yan, J.; Qiu, X.; Yao, X.; Tian, Y.; Zhu, Y.; Cao, W. A Wheat Spike Detection Method in UAV Images Based on Improved YOLOv5. Remote Sens. 2021, 13, 3095. [Google Scholar] [CrossRef]
  30. Gallo, I.; Rehman, A.U.; Dehkordi, R.H.; Landro, N.; La Grassa, R.; Boschetti, M. Deep Object Detection of Crop Weeds: Performance of YOLOv7 on a Real Case Dataset from UAV Images. Remote Sens. 2023, 15, 539. [Google Scholar] [CrossRef]
  31. Chen, Z.; Liu, C.; Filaretov, V.F.; Yukhimets, D.A. Multi-Scale Ship Detection Algorithm Based on YOLOv7 for Complex Scene SAR Images. Remote Sens. 2023, 15, 2071. [Google Scholar] [CrossRef]
  32. Gong, H.; Mu, T.; Li, Q.; Dai, H.; Li, C.; He, Z.; Wang, W.; Han, F.; Tuniyazi, A.; Li, H.; et al. Swin-Transformer-Enabled YOLOv5 with Attention Mechanism for Small Object Detection on Satellite Images. Remote Sens. 2022, 14, 2861. [Google Scholar] [CrossRef]
  33. Xu, X.; Zhang, X.; Zhang, T. Lite-YOLOv5: A Lightweight Deep Learning Detector for On-Board Ship Detection in Large-Scene Sentinel-1 SAR Images. Remote Sens. 2022, 14, 1018. [Google Scholar] [CrossRef]
  34. Liu, C.; Sui, H.; Wang, J.; Ni, Z.; Ge, L. Real-Time Ground-Level Building Damage Detection Based on Lightweight and Accurate YOLOv5 Using Terrestrial Images. Remote Sens. 2022, 14, 2763. [Google Scholar] [CrossRef]
  35. He, C.; Liu, Y.; Wang, D.; Liu, S.; Yu, L.; Ren, Y. Automatic Extraction of Bare Soil Land from High-Resolution Remote Sensing Images Based on Semantic Segmentation with Deep Learning. Remote Sens. 2023, 15, 1646. [Google Scholar] [CrossRef]
  36. Dong, X.; Yan, S.; Duan, C. A lightweight vehicles detection network model based on YOLOv5. Eng. Appl. Artif. Intell. 2022, 113, 104914. [Google Scholar]
  37. Zhu, L.; Geng, X.; Li, Z.; Liu, C. Improving YOLOv5 with Attention Mechanism for Detecting Boulders from Planetary Images. Remote Sens. 2021, 13, 3776. [Google Scholar] [CrossRef]
  38. Woo, S.; Park, J.; Lee, J.-Y.; Kweon, I.S. CBAM: Convolutional Block Attention Module. In Proceedings of the Computer Vision—ECCV 2018, Munich, Germany, 8–14 September 2018; Springer: Cham, Switzerland, 2018; pp. 3–19. [Google Scholar]
  39. Zhang, X.; Zhou, S. WOA-DBSCAN: Application of Whale Optimization Algorithm in DBSCAN parameter adaption. IEEE Access 2023, 11, 91861–91878. [Google Scholar]
  40. Hebbal, A.; Balesdent, M.; Brevault, L.; Melab, N.; Talbi, E.-G. Deep Gaussian process for multi-objective Bayesian optimization. Optim. Eng. 2023, 24, 1809–1848. [Google Scholar]
  41. Dunnett, S.; Sorichetta, A.; Taylor, G.; Eigenbrod, F. Harmonised global datasets of wind and solar farm locations and power. Sci. Data 2020, 7, 130. [Google Scholar]
  42. Hoen, B.D.; Diffendorfer, J.E.; Rand, J.T.; Kramer, L.A.; Garrity, C.P.; Hunt, H.E. United States Wind Turbine Database V7.2: U.S. Geological Survey, American Clean Power Association, and Lawrence Berkeley National Laboratory Data Release. 2018. Available online: https://energy.usgs.gov/uswtdb/data/ (accessed on 23 December 2024).
  43. Zhang, X.; Han, L.; Han, L.; Zhu, L. How well do deep learning-based methods for land cover classification and object detection perform on high resolution remote sensing imagery? Remote Sens. 2020, 12, 417. [Google Scholar] [CrossRef]
Figure 1. YOLOv5_CBAM model architecture. (a) Overall architecture of YOLOv5_CBAM; (b) structure of the CBAM module.
Remotesensing 17 01322 g001
Figure 2. Illustration of density-constrained principles for clustering and spatial arrangement. (a) DBSCAN clustering with MinPts = 3; (b) spatial arrangement of wind turbines based on row and column spacing.
Remotesensing 17 01322 g002
Figure 3. Wind turbines in diverse environmental backgrounds. (a,b) intertidal flats; (c,d) permanent water bodies; (eg) tree-covered areas; (h,i) croplands; (jl) bare vegetations.
Remotesensing 17 01322 g003
Figure 4. Distribution and layout patterns of wind turbine test areas. (a) Global distribution of test areas for wind turbine detection; (b) regular layout pattern of wind turbines with varying sizes; (c) regular layout pattern of wind turbines with consistent sizes; (d) mixed layout pattern of wind turbines.
Remotesensing 17 01322 g004
Figure 5. Analysis of model performance enhancements and improvements. (a) YOLOv5_CBAM surpasses YOLOv5s in improving wind turbine detection; (b) YOLOv5_CDB outperforms YOLOv5_CBAM in minimizing false detections of wind turbines.
Remotesensing 17 01322 g005
Figure 6. Detection performance of wind turbines by different models across various land cover classes. (a) Detection performance of the YOLOv5s model across different land cover classes; (b) detection performance of the YOLOv5_CDB model across different land cover classes.
Remotesensing 17 01322 g006
Table 1. Training parameter settings across all models.
ModelsInput SizeBatch SizeEpochsLearning RateMomentum/β1Weight DecayOptimizerOther
YOLOv5s640 × 640163000.010.9370.0005SGD
YOLOv5_CDB640 × 640163000.010.9370.0005SGD ε = 1796,
Minpts = 3
YOLOv8s640 × 640163000.010.90.01AdamW
YOLOv12s640 × 640163000.010.9370.0005SGD
RT-DETR640 × 640163000.010.9370.0005SGD
Table 2. Comparative performance analysis of wind turbine detection between YOLOv5s and YOLOv5_CDB models.
ConfidenceYOLOv5sYOLOv5_CDB
P (%)R (%)F1-Score (%)mAP@0.5P (%)R (%)F1-Score (%)mAP@0.5
0.2585.5293.5189.340.92692.8492.6992.760.926
0.3589.2892.6190.910.91894.7391.9793.330.918
0.4592.07 91.70 91.89 0.91095.97 91.18 93.510.911
0.5594.14 90.1992.12 0.89696.92 90.11 93.39 0.900
0.6596.24 88.17 92.03 0.87897.81 88.30 92.81 0.882
0.7598.01 83.37 90.10 0.83198.79 84.79 91.26 0.847
0.8599.81 65.87 79.37 0.65899.78 71.85 83.54 0.718
Table 3. Wind turbine detection performance metrics comparison across YOLOv5_CDB, YOLOv8s, YOLOv12s, and RT-DETR models.
ConfidenceYOLOv5_CDBYOLOv8sYOLOv12sRT-DETR
P (%)R (%)F1-Score (%)mAP@0.5P (%)R (%)F1-Score (%)mAP@0.5P (%)R (%)F1-Score (%)mAP@0.5P (%)R (%)F1-Score (%)mAP@0.5
0.2592.84 92.6992.76 0.92692.11 90.4091.24 0.88479.7394.6486.550.89979.0696.1586.770.931
0.3594.73 91.97 93.33 0.91894.20 89.26 91.67 0.87485.1692.0288.460.88388.8692.5790.680.903
0.4595.97 91.18 93.510.91195.80 87.82 91.640.86289.5789.4889.530.86693.5490.0191.740.881
0.5596.92 90.11 93.39 0.90096.78 85.99 91.07 0.84792.7286.2389.360.84196.3686.7791.310.852
0.6597.81 88.30 92.81 0.88297.61 83.41 89.95 0.82496.1381.1588.010.79898.3281.2588.970.801
0.7598.79 84.79 91.26 0.84798.60 78.74 87.56 0.78199.1766.0779.310.65799.6958.7073.900.583
0.8599.78 71.85 83.54 0.71899.77 56.1371.84 0.5611000.611.220.0071000.010.010.001
Table 4. Miss detection rate of wind turbines under different layout patterns.
ModelLayoutTP + FNPR
YOLOv5sRegular (uniform size)74298.6%96.76%
Regular (varying size)75099.8%67.06%
Mixed79994.7%94.1%
YOLOv5_CDBRegular (uniform size)74299.3%98.11%
Regular (varying size)75099.8%75.87%
Mixed79996.7%95.1%
Table 5. Categories and quantities of wind turbine detection errors.
CategoryError CountPercentage (%)
Field ridge15325.84
Snow-covered area315.24
Salinized land162.70
Transmission tower18431.08
Building shadow11018.58
Abandoned or dismantled wind turbine50.84
Other9315.71
Disclaimer/Publisher’s Note: The statements, opinions and data contained in all publications are solely those of the individual author(s) and contributor(s) and not of MDPI and/or the editor(s). MDPI and/or the editor(s) disclaim responsibility for any injury to people or property resulting from any ideas, methods, instructions or products referred to in the content.

