Article

Volume Estimation of Land Surface Change Based on GaoFen-7

1
Aerospace Information Research Institute, Chinese Academy of Sciences, Beijing 100094, China
2
University of Chinese Academy of Sciences, Beijing 100049, China
3
School of Grassland Science, Beijing Forestry University, Beijing 100083, China
4
School of Surveying and Geoinformation Engineering, East China University of Technology, Nanchang 330013, China
*
Author to whom correspondence should be addressed.
Remote Sens. 2025, 17(7), 1310; https://doi.org/10.3390/rs17071310
Submission received: 9 January 2025 / Revised: 10 March 2025 / Accepted: 18 March 2025 / Published: 6 April 2025
(This article belongs to the Special Issue Advances in Remote Sensing for Land Subsidence Monitoring)

Abstract

:
Volume of change provides a comprehensive and objective reflection of land surface transformation, meeting the emerging demand for feature change monitoring in the era of big data. However, existing land surface monitoring methods often focus on a single dimension, either horizontal or vertical, making it challenging to achieve quantitative volumetric change monitoring. Accurate volumetric change measurements are indispensable in many fields, such as monitoring open-pit coal mines. Therefore, the main content and conclusions of this paper are as follows: (1) A method for Automatic Control Points Extraction from ICESat-2/ATL08 products was developed, integrating Land cover types and Phenological information (ACPELP), achieving a mean absolute error (MAE) of 1.05 m in the horizontal direction and 1.99 m in the vertical direction for stereo change measurements. This method helps correct image positioning errors, enabling the acquisition of geospatially aligned GaoFen-7 (GF-7) imagery. (2) A function-based classification system for open-pit coal mines was established, enabling precise extraction of stereoscopic change region to support accurate volumetric calculations. (3) A method for calculating the mining and stripping volume of open-pit coal mines based on GF-7 imagery is proposed. The method utilizes photogrammetry to extract elevation features and combines spectral features with elevation data to estimate stripping volumes, achieving an excellent error rate (ER) of 0.26%. The results indicate that our method is cost-effective and highly practical, filling the gap in accurate and comprehensive monitoring of land surface changes.

1. Introduction

Volume is one of the key indicators for comprehensively and intuitively measuring changes in land surface monitoring. The methods for calculating land surface change volume can be widely applied to various fields, including vegetation volume estimation [1], dynamic monitoring of snow and ice resources [2], urban 3D monitoring [3], landslide disaster analysis [4], and mineral resource monitoring. It provides comprehensive evaluation tools for resource exploration and management, environmental protection and ecological restoration, geological disaster early warning, and evaluation, as well as urban planning and land use [5,6]. In recent years, research on land surface change monitoring has emphasized the need for multi-angle, long-term, and refined analysis. However, due to data limitations, land surface change monitoring has largely focused on 2D planes, lacking the ability to calculate change volumes [7,8]. This gap in research has made it difficult to meet the comprehensive monitoring needs for land surface changes. As a result, the calculation of land surface change volume has gradually emerged as a new area of study.
Traditional methods for calculating land surface change volume often rely on field surveys, which have several drawbacks, including the inability to perform retrospective analysis, limited coverage, and high costs. Methods such as manual measurements [9,10], unmanned aerial vehicle (UAV) surveys [11,12], and aerial surveys [13] all require on-site measurements, making it impossible to obtain data for a specific historical period. Satellite-based land surface monitoring faces three major challenges due to data limitations: incomplete monitoring angles, insufficient monitoring frequency, and inadequate monitoring resolution. Spaceborne light detection and ranging (LiDAR) [14] offers limited coverage, making it difficult to perform spatially continuous stereo-monitoring calculations. Synthetic aperture radar (SAR) data [15] is primarily used for large-scale terrain stereo change monitoring; moreover, due to its inability to provide spectral information and its resolution limitations, it is not well-suited for detailed stereo land surface change analysis [16]. Multi-view optical imagery [17,18] is constrained by the satellite’s revisit cycle and resolution limitations. It is typically combined with existing data for stereo change monitoring [19], which limits the accuracy of change volume calculations. However, with advancements in remote sensing hardware, the acquisition frequency and resolution of multi-view optical imagery have improved significantly. The application of high spatial resolution multi-view optical imagery in the calculation of land surface change volume remains an area requiring further research.
Using multi-temporal multi-view optical imagery for 3D reconstruction allows for the calculation of change volume by obtaining the stereo states of objects at different times. However, the unstable positioning accuracy of multi-view optical imagery makes it difficult to achieve geographically aligned stereo reconstruction results across multiple periods, limiting the accuracy of change volume calculations [20]. Employing a sufficient amount of high-precision ground control data for block adjustment can effectively eliminate geometric errors in multi-view optical imagery [21], thus improving the accuracy of change volume calculations. High-precision ground control data can be obtained from ground surveys [22], existing topographic maps, DEM products, SAR imagery [23], or LiDAR data [24]. Among these methods, spaceborne LiDAR data [25], such as ICESat-2/ATL08, can efficiently and cost-effectively provide accurate stereo information. For example, Shang et al. used attribute parameters from ATL08 data to extract elevation control points, achieving a root mean square error (RMSE) of 0.3 m for the control points [26]. Previous research has confirmed that high-precision control points can be extracted from ATL08 data. However, the existing methods for extracting control points from ATL08 data do not automatically filter out land surface change errors, and the obtained points often lack distinct features, making them difficult to collect.
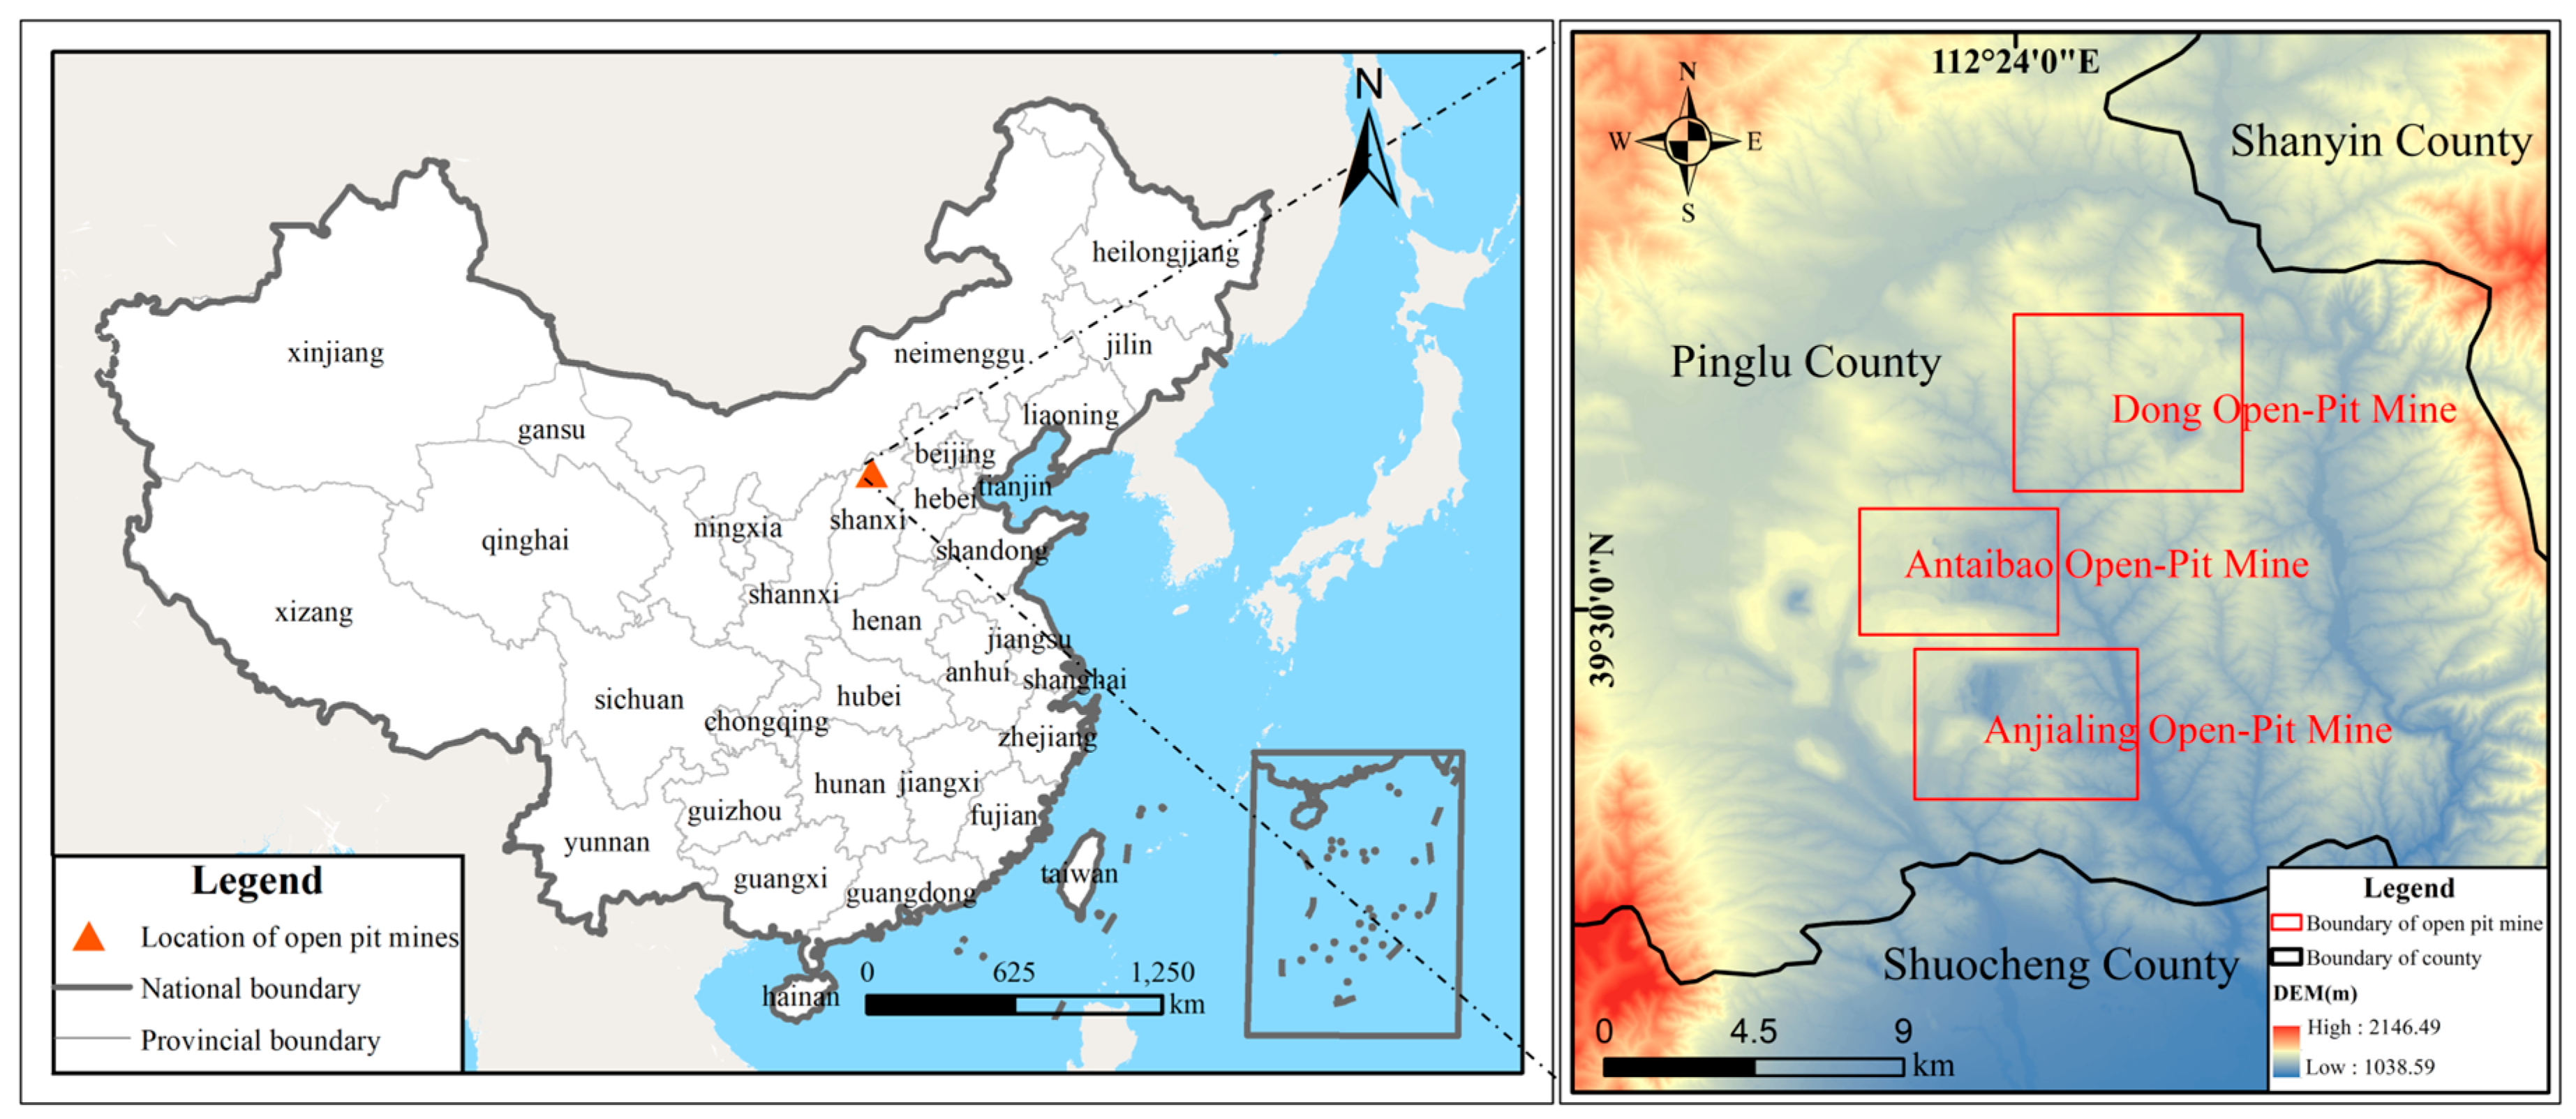
Open-pit coal mines have a strong demand for stereo change monitoring and exhibit characteristics that align well with such monitoring, making them ideal subjects for stereo land surface change monitoring [27]. Open-pit coal mining has become the dominant form of coal mining in China [28]. However, because coal resources can cause significant environmental damage, the monitoring of open-pit coal production has become a routine and essential task. The stereo monitoring of open-pit coal mines is often measured by the mining and stripping volume [29]. The mining volume refers to the total volume of overburden, rock, coal, and other materials mined over a specific period, while the stripping volume refers to the volume of overburden (commonly transported to the dump of open-pit coal mines) removed in the process [30]. Traditional monitoring methods for open-pit coal mine production are unable to accurately calculate mining volumes over large areas and across historical periods. As a result, relevant authorities face challenges in conducting comprehensive and accurate oversight of open-pit coal mining operations. At the same time, the field of prosecutorial public interest litigation has introduced new requirements for monitoring open-pit coal mines, as stereo historical data from these mines is critical for addressing illegal mining cases [31]. Against this backdrop, conducting research on calculating change volumes using high spatial resolution multi-view optical imagery, with a focus on mining and stripping volumes in open-pit coal mines, is both necessary and timely.
The land surface features in open-pit coal mine areas are diverse, which makes it difficult to accurately locate stereoscopic change region, thus greatly affecting the accurate estimation of the mining and stripping volumes [32]. In the existing process of obtaining surface change data for open-pit coal mines, surveyors typically delineate the stereoscopic change region through on-site measurements [33]. Optical imagery, with its inherent spectral information, holds promise for extracting stereoscopic change region in open-pit coal mines. However, previous studies that focus on constructing classification systems based on surface features have failed to fully capture the stereoscopic change region in a meaningful way [34]. Therefore, it is crucial to establish a functional-based classification system for open-pit coal mines in order to accurately extract the stereoscopic change region.
Given the aforementioned background, this study focuses on estimating the mining and stripping volumes of open-pit coal mines by using multi-temporal GF-7 satellite imagery to calculate changes in volume over a period, thereby enabling large-scale monitoring of historical production in open-pit coal mines. Specifically, we employ spaceborne LiDAR data to extract control points for the geometric correction of multi-view optical images. We then use photogrammetric methods to reconstruct the 3D structure of the open-pit coal mine at multiple time intervals. Additionally, we develop a new classification system to precisely extract areas of change within the mine, improving the accuracy of mining and stripping volume calculations. The objectives of this study are as follows:
(1)
Propose a control point extraction method based on spaceborne LiDAR data, which offers greater stability and ease of collection compared to existing methods.
(2)
Establish a detailed classification system for open-pit coal mines based on functional characteristics, to accurately extract areas of land surface change.
(3)
Develop a practical and effective method for calculating land surface volumetric changes using GF-7 imagery, aimed at improving the accuracy of mining and stripping volume estimations in open-pit coal mines.
(4)
Perform a quantitative assessment of the potential and limitations of using GF-7 imagery for calculating mining and stripping volumes, by comparing it to reference data.

2. Study Areas and Data

2.1. Study Areas

This study focuses on three representative open-pit coal mines within the Pingshuo Mining Area. Located in Shanxi Province, the Pingshuo Mining Area (39°23′N–39°37′N, 112°14′E–112°24′E) is the largest open-pit mining area in China, both in terms of coal mining duration and scale. The mining area extends 23 km from north to south and 22 km from east to west, covering a total area of 444.586 km2, with proven coal reserves of nearly 12.8 billion tons. Situated in the Loess Plateau, the Pingshuo Mining Area features mountainous and hilly terrain, with elevations higher in the northwest and lower in the southeast. Within this area are three large open-pit coal mines: the Dong Open-pit Coal Mine, the Antaibao Open-pit Mine, and the Anjialing Open-pit Mine (Figure 1). These mines are adjacent to each other and share similar climatic and geographical conditions. Table 1 provides a detailed comparison of the characteristics of the three open-pit coal mines.

2.2. Data

2.2.1. Gaofen-7 Satellite Images

Gaofen-7 (GF-7) is a stereo imaging satellite launched by China in 2019, and it is capable of producing optical multi-view imagery. The satellite operates in a sun-synchronous orbit with an orbital altitude of 500 km and a return period of no more than 60 days. It is equipped with two linear array stereo cameras, of which the forward camera has an inclination of 26° and the rear camera has an inclination of 5°. A GF-7DLC product includes three images: forward panchromatic image (FPA), backward panchromatic image (BPA), and backward multispectral image (BMS). The BMS contains four bands: red, green, blue, and near-infrared. The resolution of the BMS is 2.6 m, the resolution of the BPA is 0.65 m, and the resolution of the FPA is 0.8 m. This study uses two phases of Gaofen-7 DLC images on 23 October 2022 and 25 November 2023. See Table 2 for specific information. Figure 2 shows the location of the GF-7 image used in this paper.

2.2.2. ATL08 Data

The National Snow and Ice Data Center (https://nsidc.org/ (accessed on 6 March 2024)) has publicly released the ATL08 data with global coverage for free download. The ATL08 data is the L3A-level land and vegetation height product of ATLAS/ICESat-2, providing terrain and canopy height measurement data along the 100 m segment of the ground track. Its revisit period is 91 d, the elevation positioning accuracy is 0.1 m, and the horizontal positioning accuracy is better than 6.5 m [35]. Each laser point in the ATL08 data contains attributes such as longitude, latitude, acquisition time, and elevation. The spatial coverage of the ATL08 data used in this study is shown in Figure 2. Table 3 is a description of the attribute parameters used in this experiment.

2.2.3. Ancillary Data

The reference data used in this experiment include Google images, ASTER GDEMv3, and mining area monitoring data. Google images have a resolution of 1 m, with the horizontal datum referenced to the WGS84 coordinate system, sourced from 91weitu software (v18.8.9). ASTER GDEMv3 is a Digital Surface Model (DSM) product generated through optical stereo photogrammetry [36], with a resolution of 30 m and a WGS84 horizontal datum, available from the official website (https://search.earthdata.nasa.gov/search/granule?p=C1575726572-LPDAAC_ECS&fi=ASTER (accessed on 6 March 2024)). Additionally, monitoring data for the open-pit coal mines are sourced from public data on the official website of China Coal Group, the company operating the open-pit mines (https://pingshuo.chinacoal.com/col/col1508/index.html (accessed on 23 July 2024)). The data details are provided in Table 4.
Since the vertical datum of the ASTER GDEMv3 data is based on the EGM96 geoid, which differs from the elevation datum used in this experiment, ArcGIS software (v10.8) was employed to convert elevations from the EGM96 geoid to the WGS84 ellipsoid. Additionally, as the reporting dates of the open-pit coal mine monitoring data do not align with the experimental monitoring period, adjustments to the data are necessary. By assuming a consistent monthly production rate across all monitoring reports, the monthly average stripping volume of the open-pit coal mine was calculated to align with the experimental monitoring timeframe.

3. Method

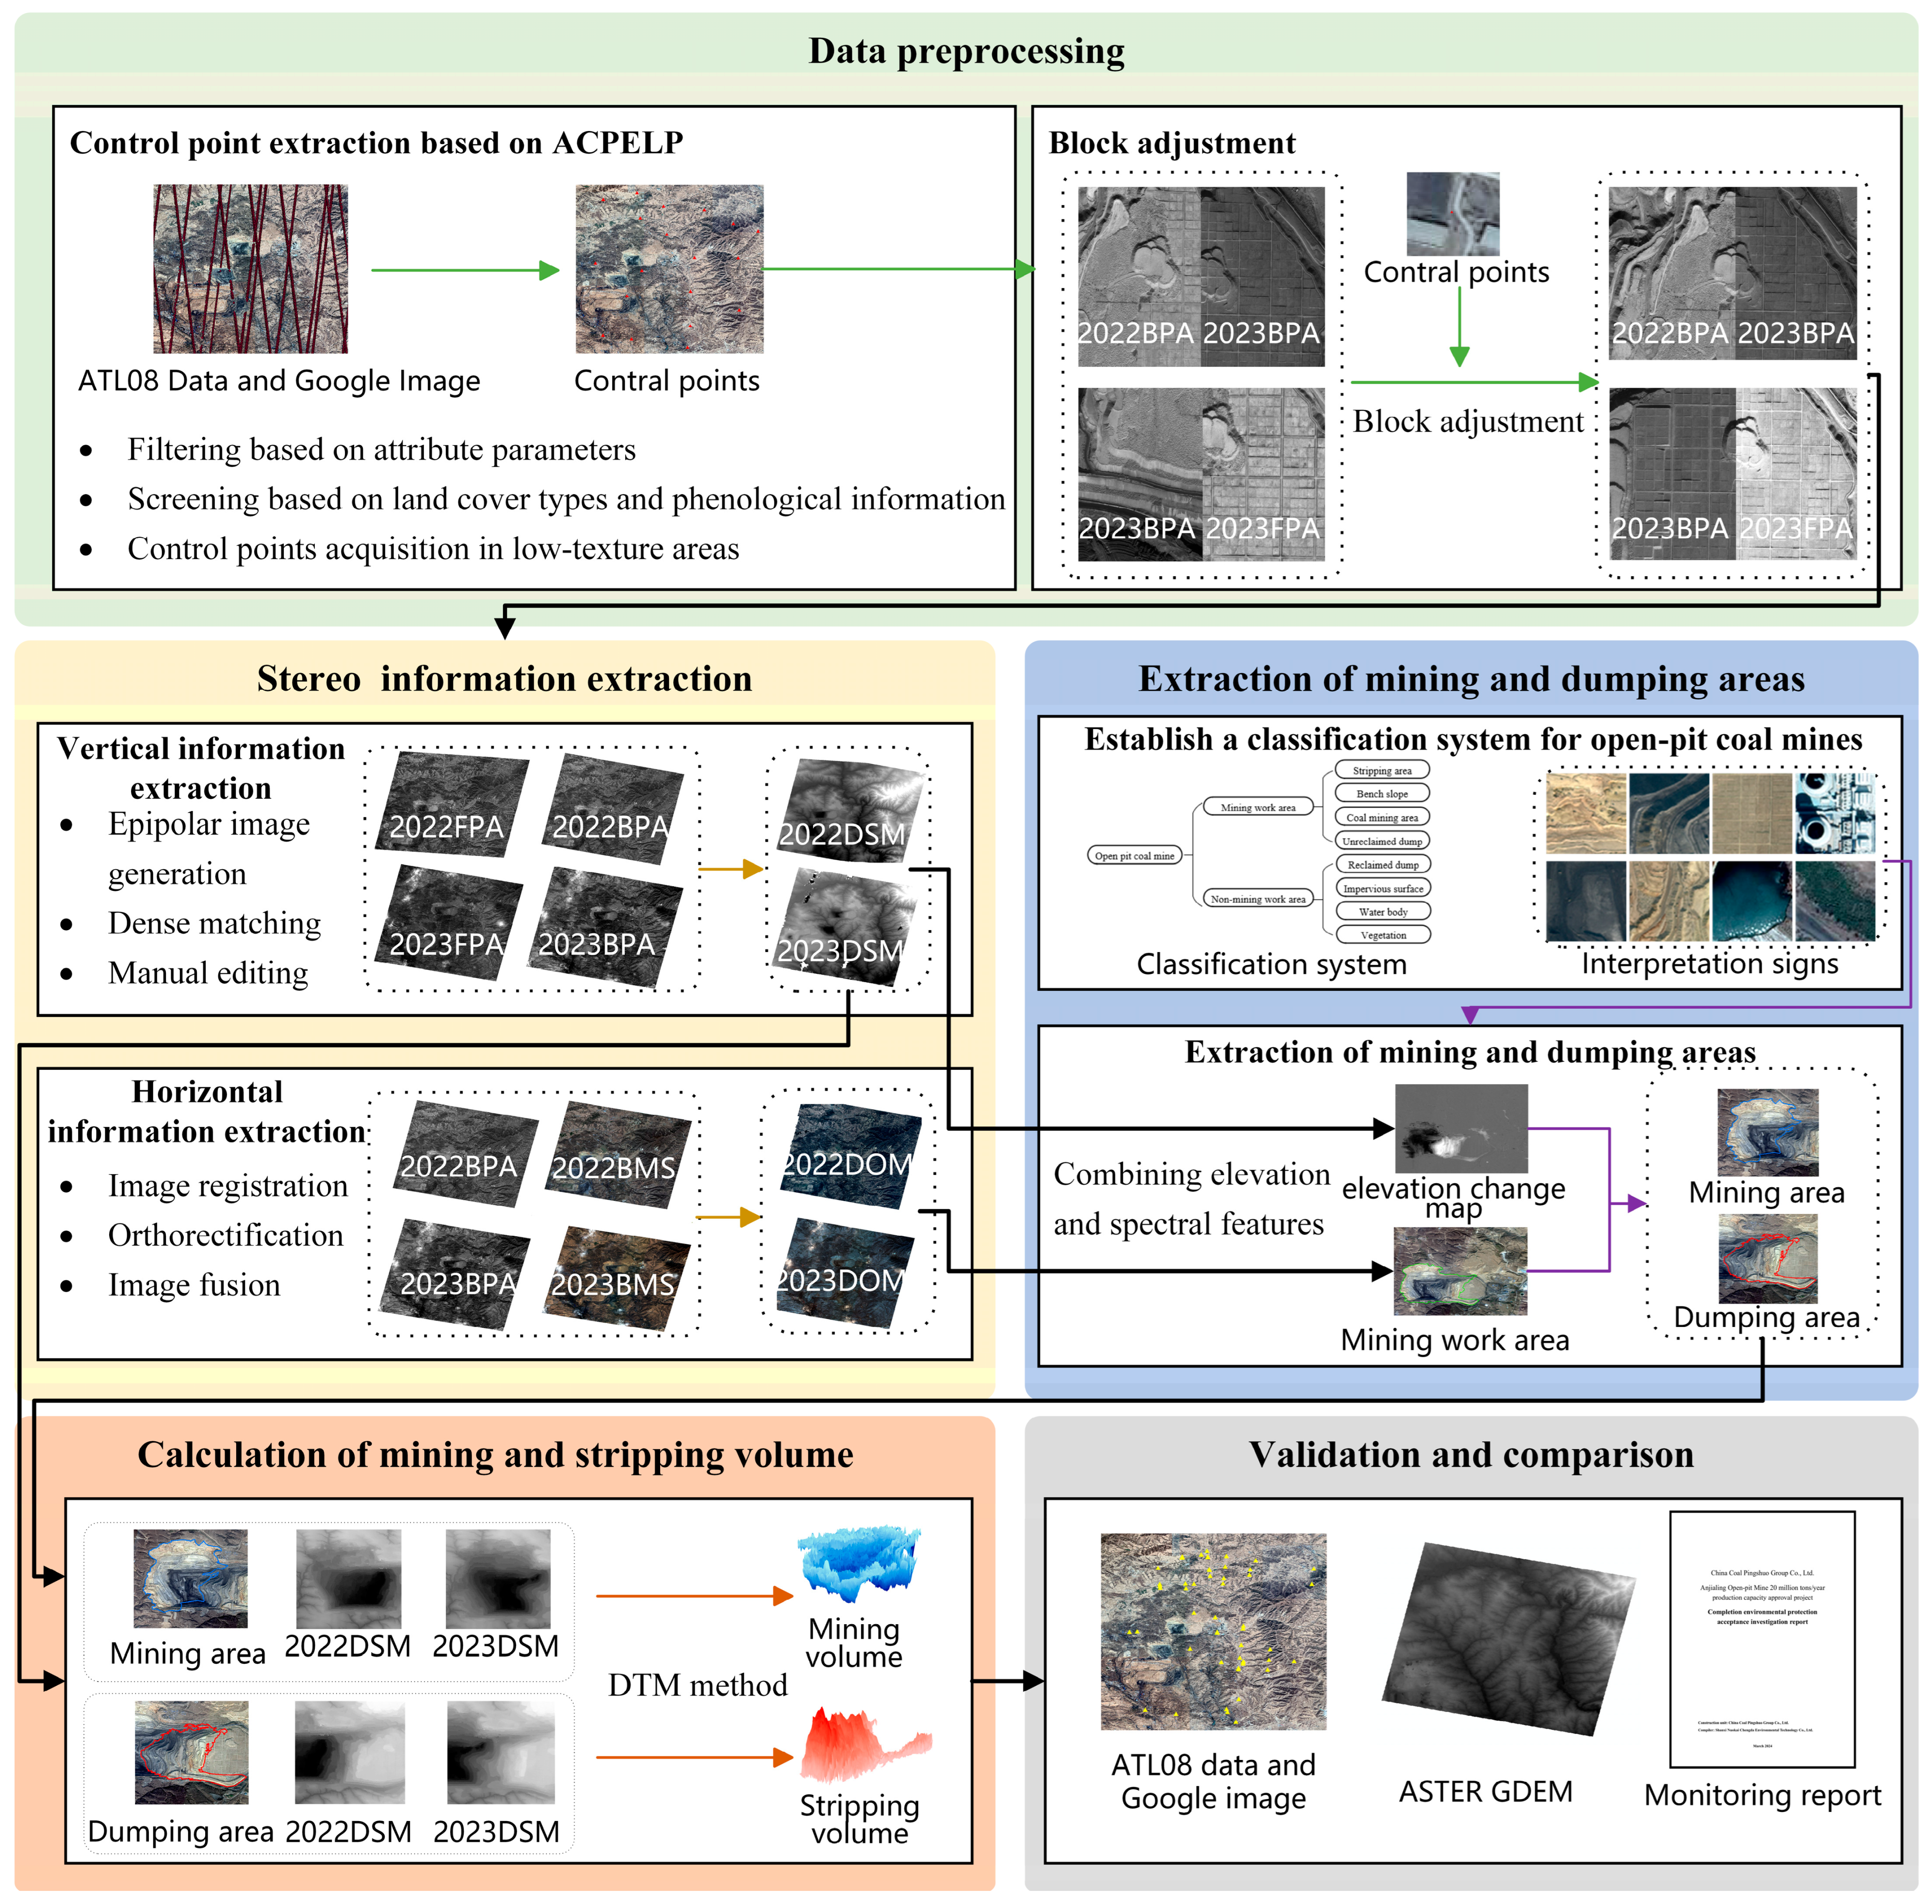
A land surface change volume calculation method based on GF-7 imagery was developed to leverage sub-meter multi-view satellite imagery for extensive, long-term, and multi-angle monitoring of land surface changes. Using a representative open-pit coal mine as a case study, this method was tested and validated, consisting of the following five main components (Figure 3): (1) ACPELP was developed to correct the geometric error of GF-7 imagery (2) Integrated photogrammetry and image processing methods to derive stereo information for two time points of the open-pit coal mines. (3) Established a detailed classification system based on mining functions, which uses elevation and spectral characteristics to distinguish mining and dumping areas, thus excluding non-mining-related changes from affecting volumetric calculations. (4) Designed a method that overlays elevation data with areas of change to calculate the change volume in open-pit mines. By applying a Digital Terrain Model (DTM) approach, the mining and stripping volumes are accurately calculated. (5) The root means square error (RMSE), MAE, maximum error (MAX), and determination coefficient (R2) were used to evaluate the method.

3.1. Data Preprocessing

The original GF-7 imagery has insufficient geometric accuracy, which does not meet the requirements for multi-temporal detailed 3D reconstruction of open-pit coal mines. While field control data can effectively correct GF-7 geometric errors, such data is often challenging to obtain. Satellite-based laser altimetry data is commonly used for satellite geometric correction. Among these, ATL08 data, with its extremely high horizontal accuracy, is highly suitable for generating control points. However, the control points generated by current methods are significantly affected by temporal variations, making them unsuitable for geometric correction of multi-temporal imagery. Therefore, this study proposes ACPELP to enhance the geometric accuracy of GF-7 images. There are three main steps: (1) obtaining control points from ATL08 production based on ACPELP; (2) regional network adjustment based on the rational function model (RFM); (3) comparative experimental settings.

3.1.1. ACPELP for Extracting Control Points from ATL08 Production

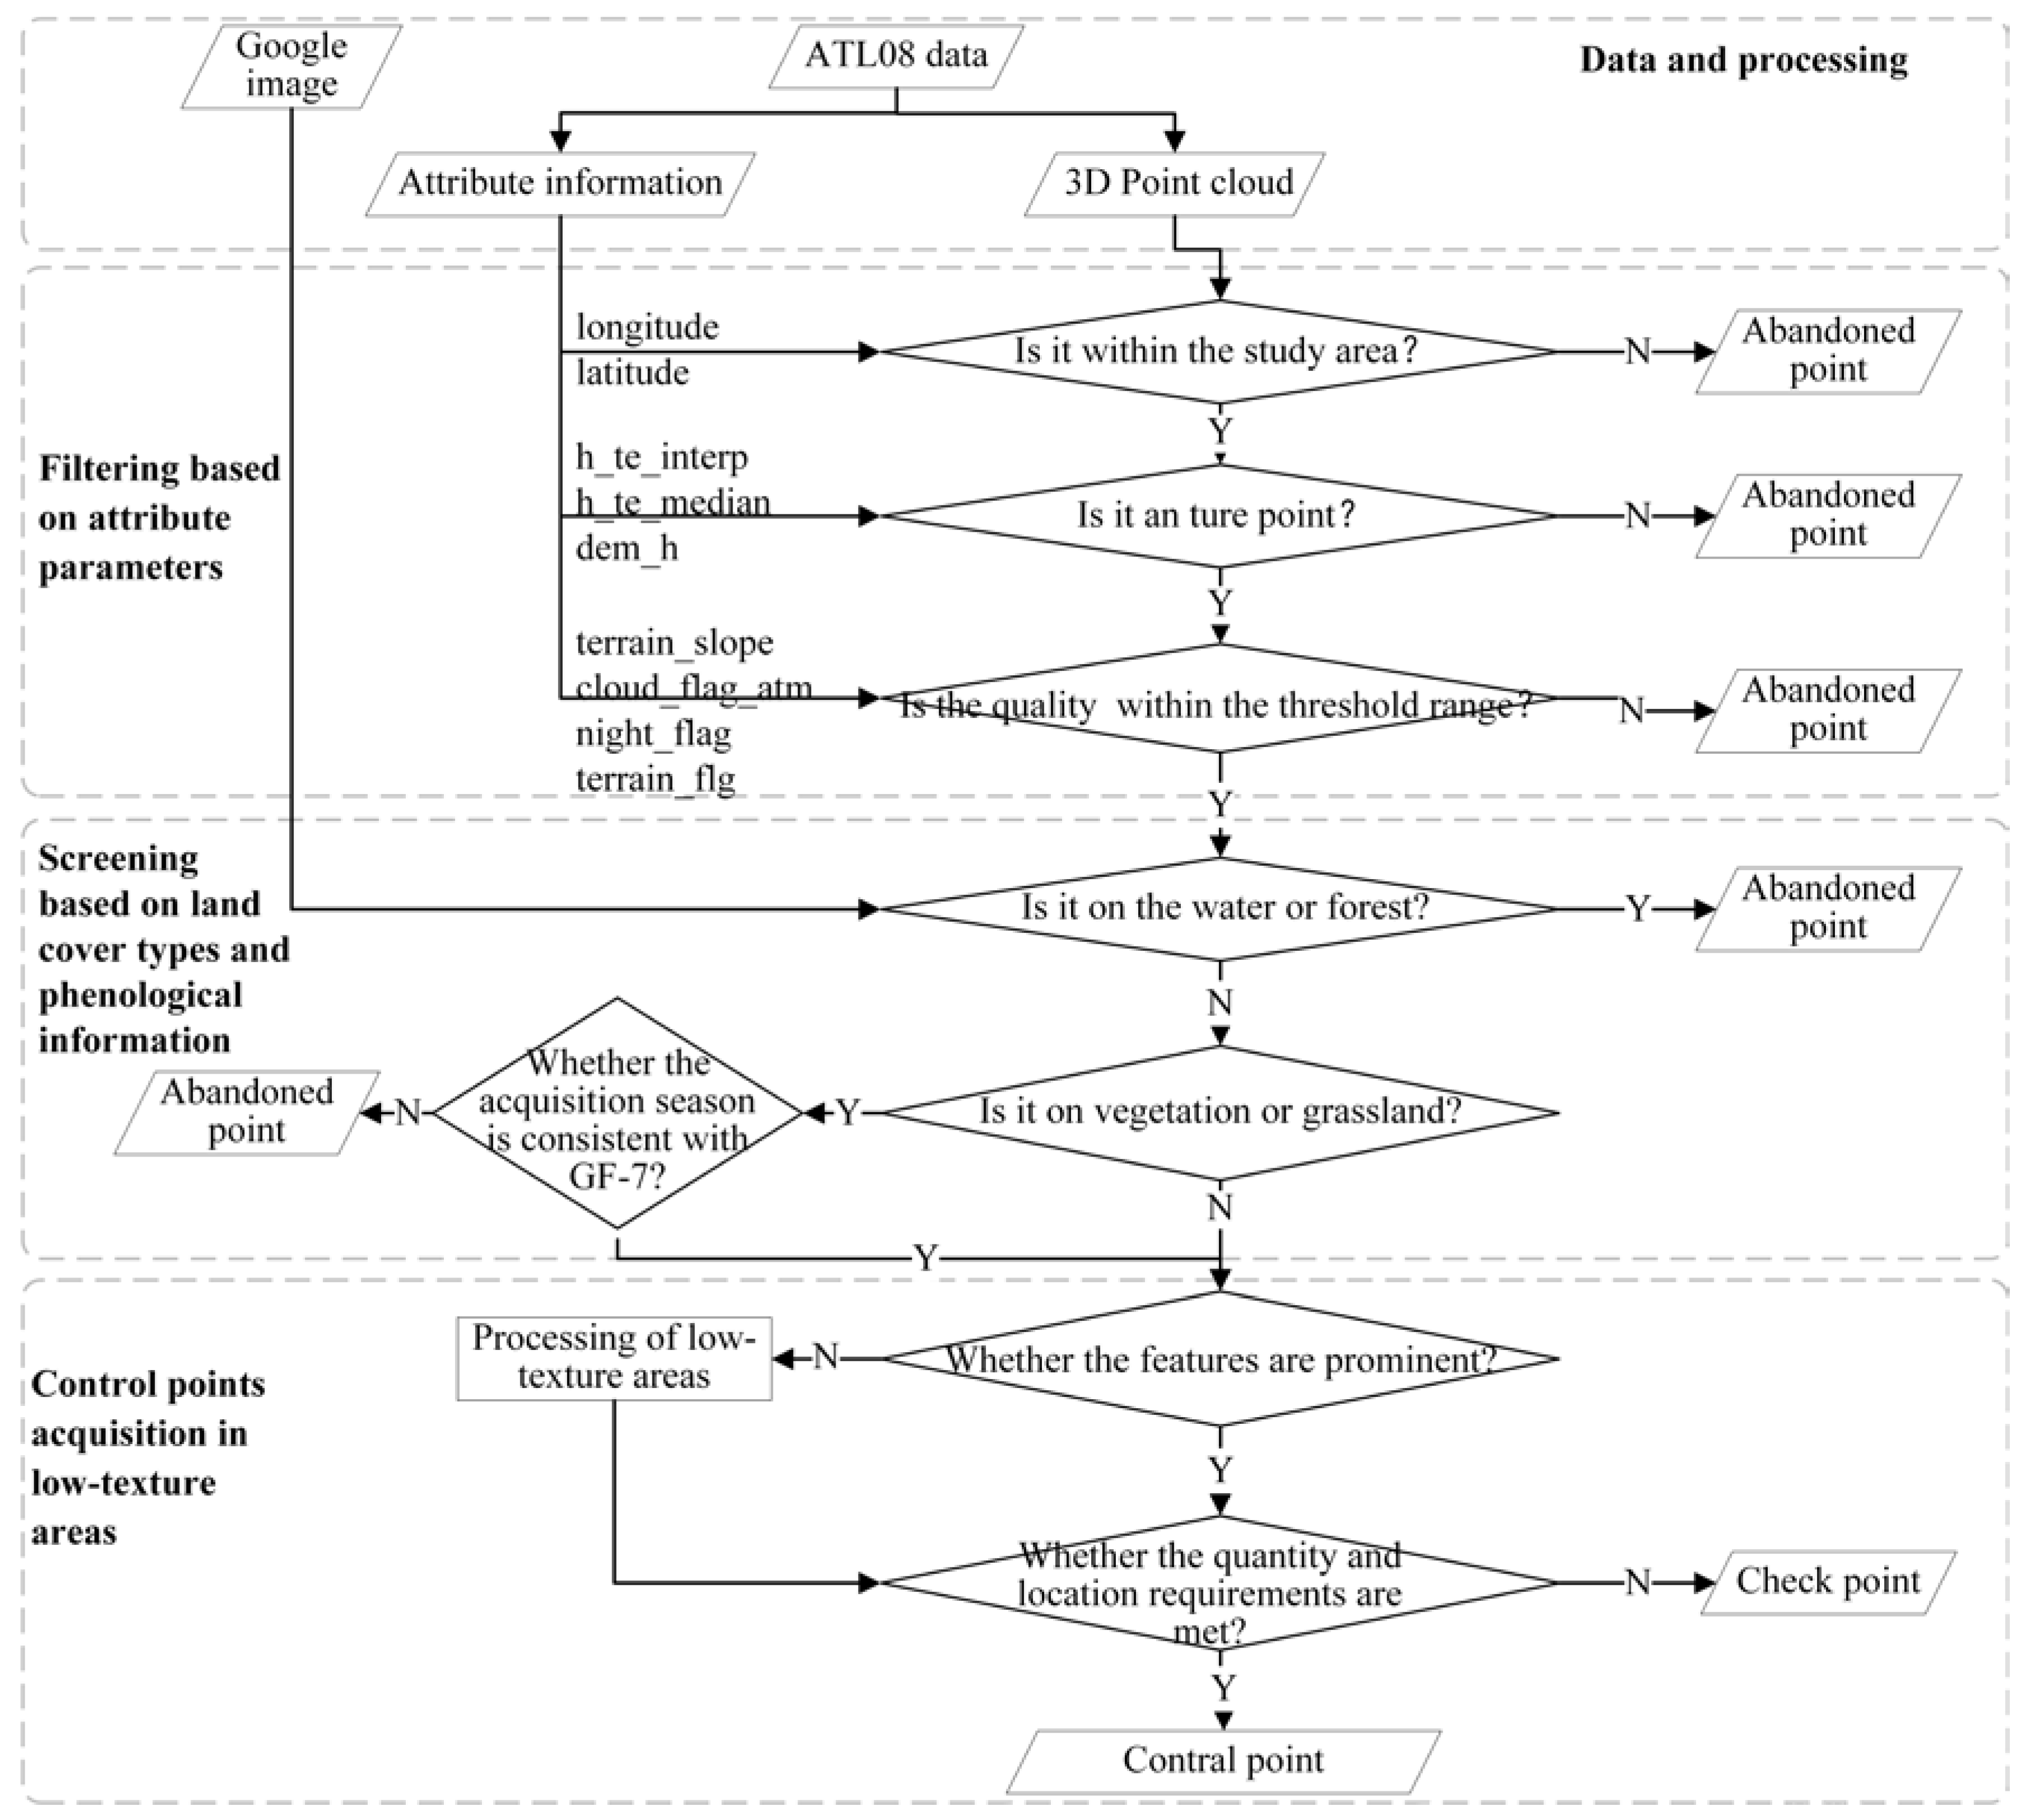
Existing extraction methods generally screen control points based on attribute parameters [37], without considering whether the elevation of the object corresponding to the laser point is easy to change and whether the control points are easy to collect. To obtain stable control points, we propose ACPELP for extracting control points from laser altimetry data (ATL08 production), which includes three steps: (1) filtering based on attribute parameters; (2) screening based on land cover types and phenological information; (3) control points acquisition in low-texture areas (Figure 4).
A.
Filtering based on attribute parameters
The purpose of filtering based on attribute parameters is to obtain high-precision laser points. The strength of the laser beam, imaging time, cloud cover, terrain quality, slope, etc., all have a great impact on the elevation of the laser point. Following the method in Wang’s study [38], the attribute parameters in Table 3 were used for the preliminary filtering of laser points.
B.
Screening based on land cover types and phenological information
The purpose of the screening process, based on land cover types and phenological information, is to identify laser points with stable elevations at three specific time points: the two GF-7 image acquisition times and the time of laser point collection. Manually comparing whether each point meets the above requirements requires a lot of time and effort and cannot be mass-produced. In the study, it was found that the ATL08 data after parameter-based screening was basically located in flat surface areas, such as cultivated land, dense forest land, water surfaces, open bare land, or impermeable surface. Laser points on water surfaces are unstable and need to be excluded. In a short period of time (1–2 years), the landforms on open bare land or impermeable surface are not easy to change. However, due to the phenological period of vegetation, the surface elevation in the vegetation area will change greatly with the seasonal images, such as dense forests or cultivated land with crops. In order to eliminate this part of the impact and to retain the majority of points, the points on vegetation or cultivated land that are not in the same season as the two GF-7 images are eliminated, and the other points can be used as candidates for the final control points.
C.
Control points acquisition in low-texture areas
The processing of control points in low-texture areas aims to obtain a sufficient number of control points with distinct features. The number of remaining laser points is relatively small, and most of the remaining laser points are located in weak texture areas. So, we performed the following steps: (1) select all points with obvious features and uniform distribution as control points; (2) generate a buffer for each remaining laser point. The length of the buffer radius is determined by the slope of the laser point and the nominal elevation accuracy of the ATL08 data; (3) obtain the point in the buffer with obvious features and closest to the laser point, assign the elevation of the laser point to this feature point, and select this feature point as a candidate control point; (4) select a suitable number of evenly distributed candidate control points together with the control points in (1) as the final control points, and select the remaining laser points as check points.

3.1.2. Block Adjustment

Block adjustment can greatly reduce the geometric errors between the GF-7 front and back images and between two GF-7 images. Block adjustment achieves geometric correction of images by utilizing the least squares method, combined with the fundamental principles of photogrammetric forward intersection, to correct geometric errors based on control points [39]. In this process, satellite imagery is geometrically rectified using the coordinate system of the control points as the reference framework. The block adjustment of this experiment was completed using PIE-Ortho7.0 software. The specific scheme is as follows: (1) Matching tie points. (2) Collect control points. (3) Block stereo adjustment based on RFM. In this process, tie points are automatically obtained through sparse matching, while control points are manually collected.

3.1.3. Comparative Experimental Settings

The proposal of ACPELP aims to address the issue of poor geometric accuracy in multi-temporal imagery correction in the absence of ground control data. In the absence of ground control data, two commonly used methods for geometric correction of imagery are: one involves block adjustment without control points, using the inherent geometric accuracy of multi-temporal images as constraints for self-correction of geometric accuracy, as demonstrated in the study by Gong et al. [40]; the other involves extracting control points based on laser altimetry data attributes for geometric correction of multi-temporal imagery, as explored in the research by Wang et al. [38].
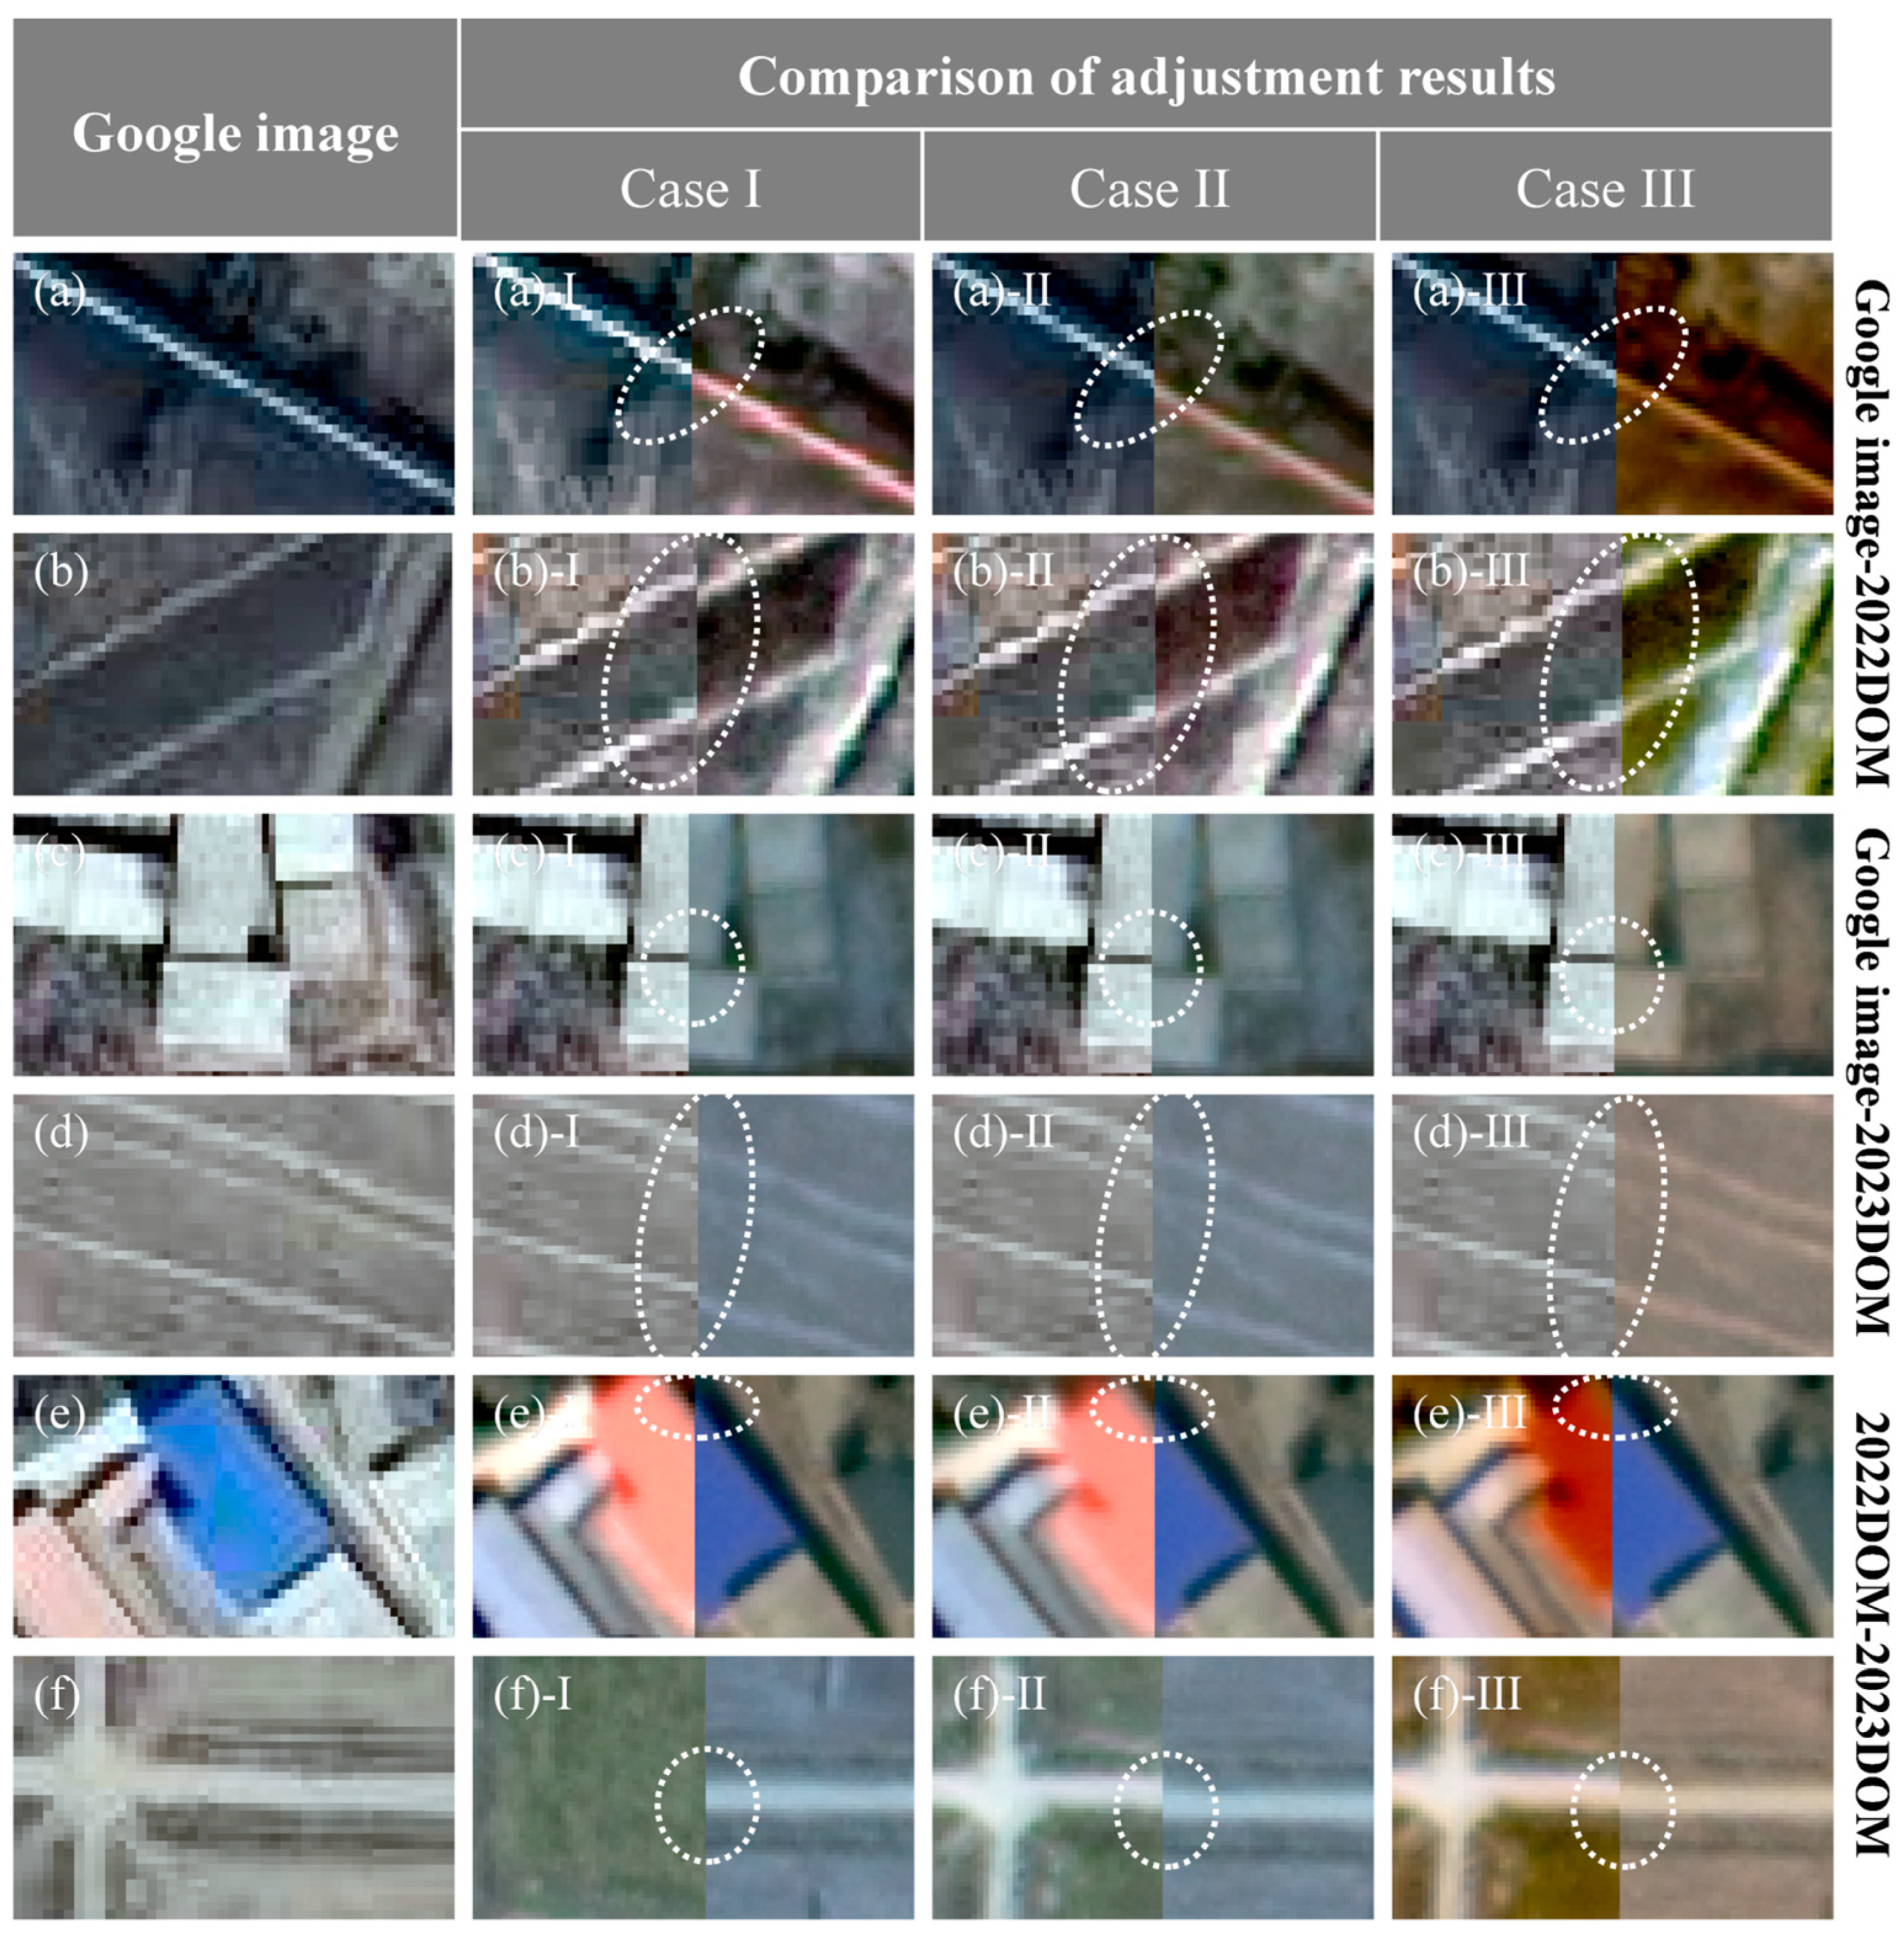
In order to verify the effectiveness of our method and prove the influence of the selection of control points, three cases were designed. In Case I, the method of Gong et al. was used for mining area information extraction; in Case II, the method of Wang et al. was applied; and in Case III, our method was employed. The detailed experimental design is as follows:
Case I: Geometric correction of GF-7 imagery without control points, in some studies, control points are not used, and only relative error correction of GF-7 imagery is performed.
Case II: Geometric correction of GF-7 imagery with control points extracted from Wang’s method represents a relatively common approach for extracting control points from laser points. It is based on reference elevation data and ATL08 attribute parameters to extract elevation control points.
Case III: Geometric correction of GF-7 imagery with control points extracted by the ACPELP method.
Compared to Case I, the ACPELP method extracts control points and performs geometric correction on GF-7 imagery based on these control points. In contrast to Case II, the ACPELP method incorporates land cover and phenological information when obtaining control points, which helps eliminate the impact of temporal variations on the control points and enhances the stability of the selected control points.
Due to the fact that the multi-temporal images, after geometric correction, contain multiple perspectives, it is difficult to quantify the accuracy directly. Moreover, the geometric accuracy of the multi-temporal images is consistent with the accuracy of the produced DSM and DOM. Therefore, in the later stages, the geometric accuracy of the DSM and DOM produced using the three methods is used to measure the accuracy of these methods.

3.2. Stereo Information Extraction

DSM and DOM provide vertical and horizontal information for land surface features, making them essential for calculating changes in volume. We used PIE-Ortho 7.0 to obtain them. In order to obtain the vertical information of the open-pit coal mine, we used photogrammetry to produce DSM before and after the changes. The whole process mainly includes epipolar image generation, dense matching, and manual inspection. In order to obtain horizontal information on open-pit coal mines, we use the methods of image registration, orthorectification, image fusion, and resampling.

3.3. Extraction of Mining and Dumping Areas in Open-Pit Coal Mines Based on Spectral and Elevation Features

The accurate boundary of the open-pit coal mining area and dumping area can eliminate the influence of stereo changes caused by non-mining activities on mining volume calculation. This study developed a method for extracting mining and dumping areas in open-pit coal mines by establishing a detailed classification system based on mining functions and combining spectral features and elevation features.

3.3.1. Construction of a Functional-Based Fine Classification System for Open-Pit Coal Mines

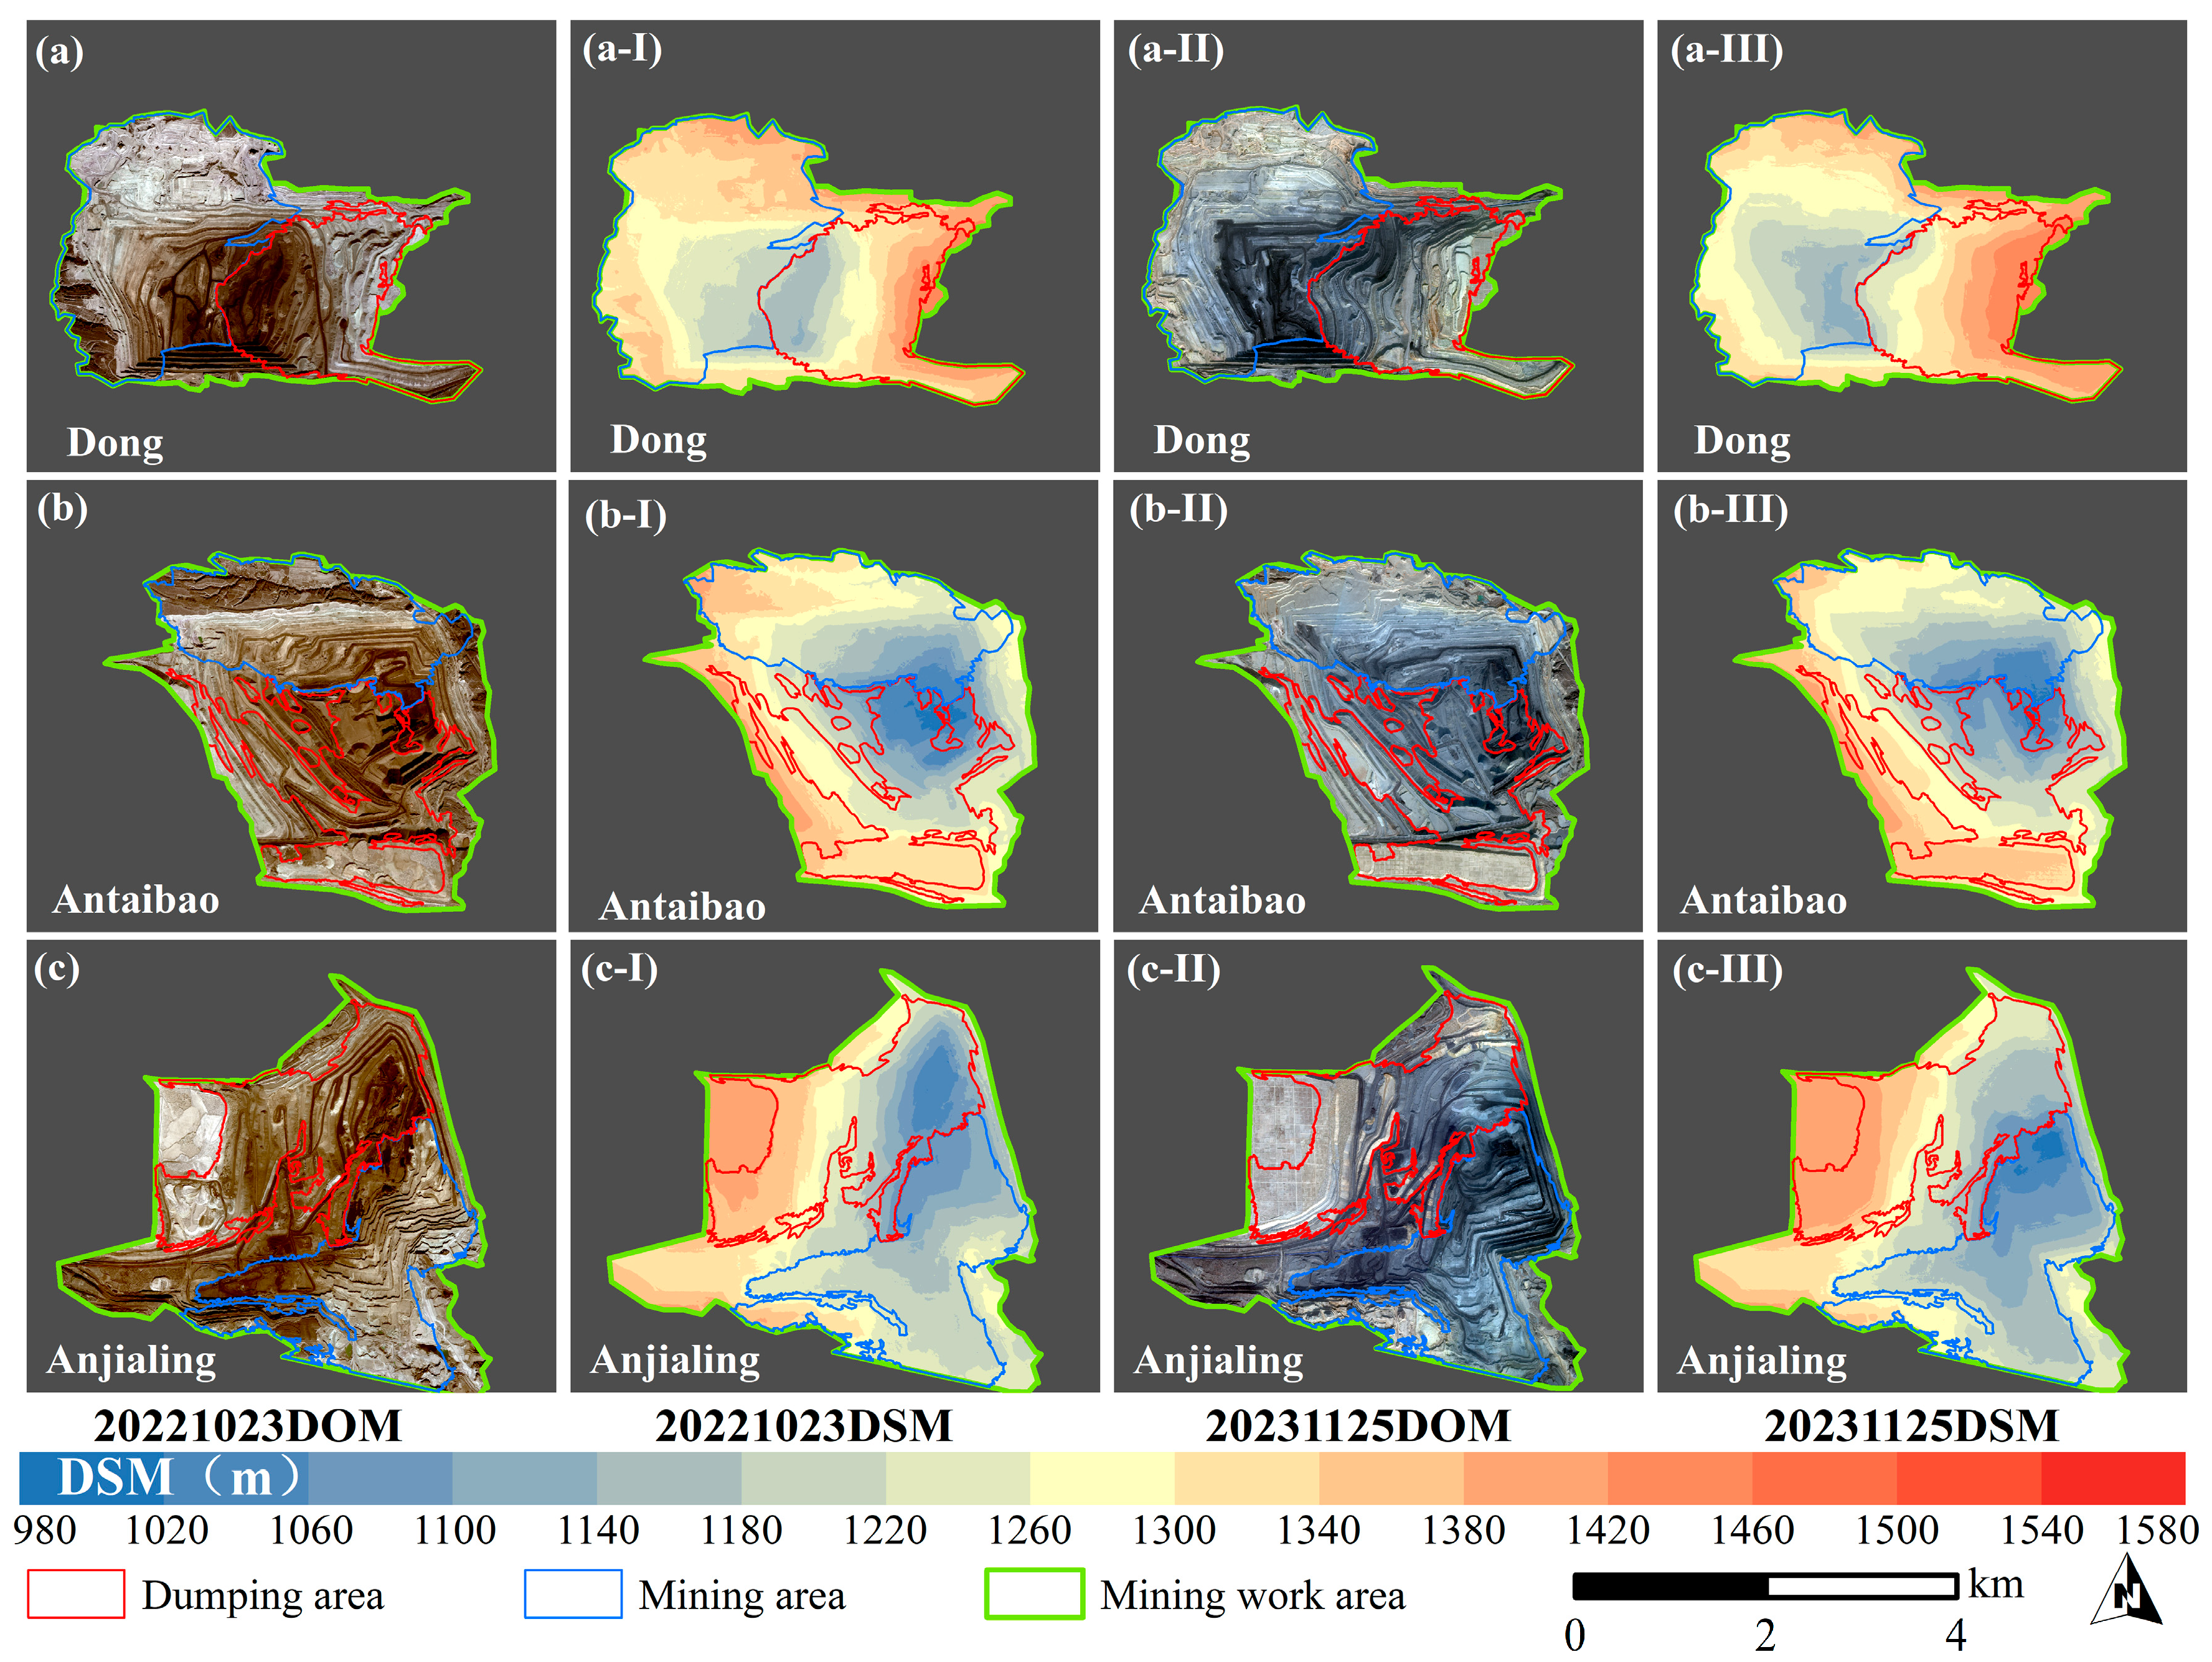
To extract areas of change, it is essential to accurately distinguish the functions of each area within an open-pit coal mine. Therefore, a function-based classification system is established for the fine classification of open-pit coal mines (Figure 5). The mining work area of the open-pit coal mine is the main site for mining activities in an open-pit coal mine, including the stripping area, bench slope, coal mining area, and unreclaimed dump. The areas of change in the first three regions represent the mining area for calculating mining volumes, while the areas of change in the last region represent the dump area for calculating stripping volumes. In order to obtain the spectral of different types of areas in open-pit coal mines, combined with the existing data of the mining area, the DOM data obtained above were manually interpreted in different areas of the open-pit coal mine mining work area, and interpretation marks were established in Figure 5. The ground features include color features, shape features, and texture features.

3.3.2. Extraction of Mining Area and Dump Area Combining Spectral and Elevation Features

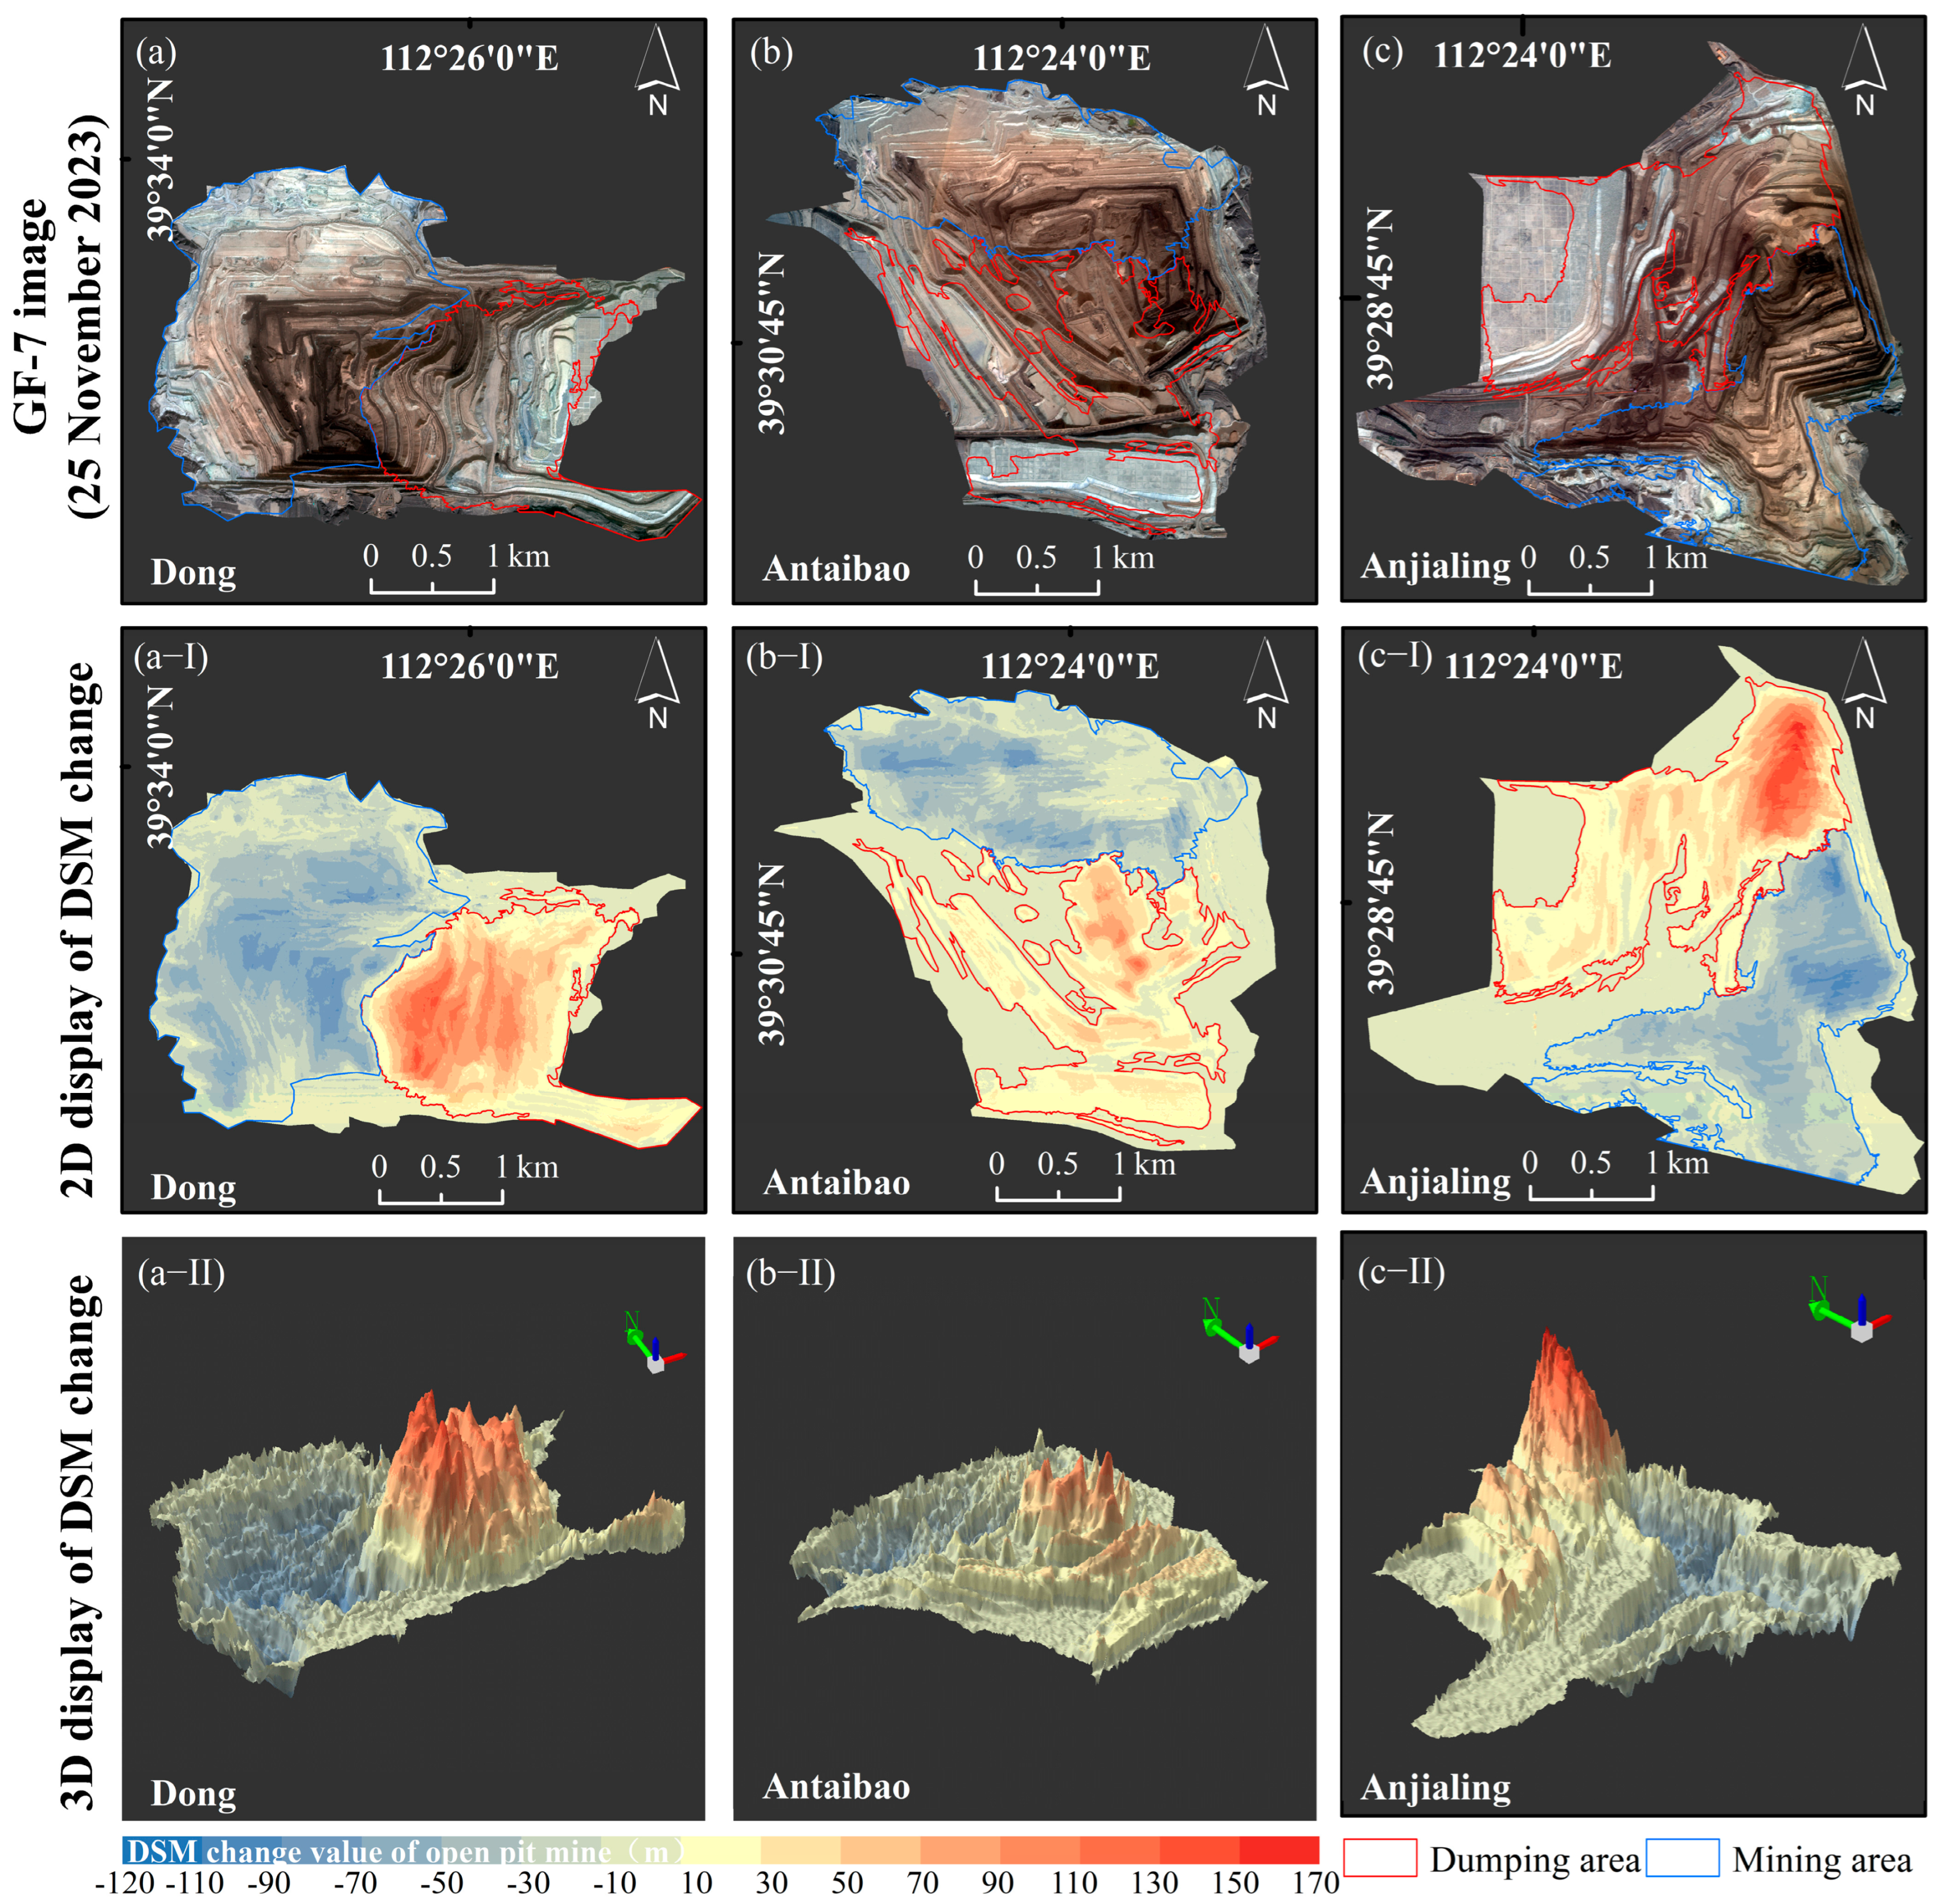
In order to obtain the mining area and dump area of the open-pit coal mine, this paper proposes a method for extracting the mining area and dump area of the open-pit coal mine by combining spectral features and elevation features. The main steps include four steps: (1) using interpretation markers, the boundaries of the open-pit mine working area are manually delineated on the two-period DOM images; (2) the two-period elevation data are then subtracted to generate an elevation change map. Based on the orthophoto, random sampling is conducted in areas with no significant changes (outside the mining area) to calculate the average elevation difference error in the elevation change map. Areas where the absolute elevation difference exceeds this average are designated as change areas, from which elevation reduction and increase zones are separately extracted; (3) the elevation reduction zone intersects with the open-pit coal mine working area to identify the mining area, while the elevation increase zone is intersected to define the dumping area; (4) both the mining and dumping areas are manually reviewed to ensure that the boundaries are accurate, complete, and consolidated.

3.4. Calculation of Mining and Stripping Volume in Open-Pit Coal Mines

To obtain the specific mining and stripping volumes for open-pit coal mines, we employ the DTM method in the boundary of the mining and dumping area. This method involves creating a triangulated network using 3D ground coordinates, enabling the calculation of mining and stripping volumes by treating each triangular section as a calculation unit within a triangular pyramid.

3.5. Accuracy Validation

Using the open-pit coal mine-related monitoring report data, check points, ASTER GDEM digital elevation products, and Google images as reference data, the calculation of mining and stripping volume in open-pit coal mines is quantitatively compared and evaluated.
The error rate (ER) is used to evaluate the stripping volume with the reference data, and the least squares method is used to evaluate the correlation between the open-pit coal mine elevation obtained in this experiment and the reference elevation data. MAE, RMSE, and MAX are used to evaluate the accuracy of the open-pit coal mine stereo information obtained in this experiment. The formula of ER is as follows:
E R = | P r P e | P r × 100 %
where P r and P e represent the reference value and estimated value of open-pit coal mine production capacity respectively.
The MAE, RMSE and MAX formulas of elevation are as follows:
M A E h = i = 1 n | h r , i h e , i | n
R M S E h = i = 1 n ( h r , i h e , i ) 2 n
M A X h = max n { | h r , i h e , i | }
where M A E h , R M S E h , and M A X h represent MAE, RMSE, and MAX of DSM, respectively; h r , i and h e , i represent the reference elevation and the measured elevation, respectively; n represents the number of pixels involved in the error calculation.
The MAE, RMSE and MAX formulas of DOM level error are as follows:
x y i = x i 2 + y i 2
M A E x y = i = 1 n x y i n
R M S E x y = i = 1 n x y i 2 n
M A X x y = max n { x y i }
where i represents the index of the point; x y i represents the plane error of a certain point; x i , y i represent the error of a point in the X and Y directions, respectively; M A E x y , R M S E x y , and M A X x y represent MAE, RMSE, and MAX of DOM, respectively; n represents the number of pixels involved in the error calculation.

4. Results

4.1. Effect of ACPELP on the Extraction Accuracy of Mining Area Information

Our study demonstrates that ACPELP produces more stable and superior outcomes. In Section 3.1.3, we designed three cases to assess the impact of control points on mining area stereo information and used check points and Google imagery for validation. Table 5 presents the accuracy of mining area stereo information from 2022 and 2023 as well as the error in overlapping areas between these two years for these cases. The DOM produced in Case III has the lowest RMSE and MAE, while the DSM has the lowest RMSE and a medium MAE. Overall, our method consistently achieves high-precision mining area stereo information with stability. A comparison between Case I and Case III shows that the inclusion of control points significantly improved the accuracy of the horizontal. Since the block adjustment without control points results in the geometric accuracy of the mining area stereo information being closely related to the original GF-7 imagery geometry, the accuracy in Case I for 2022 differs considerably from that in 2023. A comparison between Case II and Case III demonstrates that our method outperforms previous methods in terms of mining area stereo information accuracy. By incorporating phenological information during control point acquisition, more stable and accurate control points can be obtained, leading to better precision in the resulting mining area stereo information. Figure 6 illustrates the DOM comparison across the cases, revealing that our method achieves better registration, particularly in areas with buildings and farmland, yielding DOM with higher geometric accuracy. Overall, ACPELP is more stable, easily collectible, and sufficiently abundant, resulting in mining area stereo information with improved geometric accuracy and enhancing the comparability of 3D reconstruction across different phases of open-pit coal mines.
Figure 7 presents a comparison between the estimated elevation from 2022 and the reference elevation (ASTER GDEM data), the estimated elevation from 2023 and the reference elevation, and the estimated elevation between 2022 and 2023. The 2022 and 2023 estimated elevations show a strong fit with the reference elevation, achieving R2 of 0.99, with MAE and RMSE values of 7.14 m and 9.76 m in 2022 (Figure 7a), and MAE and RMSE values of 7.88 m and 10.93 m in 2023 (Figure 7b). Figure 7c reveals a high degree of consistency between the two phases of open-pit mine elevation estimates, with R2, MAE, and RMSE values of 0.97, 2.47 m, and 17.16 m, respectively, indicating high relative elevation accuracy. Overall, the two elevation estimation phases in the open-pit mine area are accurate enough for subsequent mining and stripping volume calculations.

4.2. Results of Change Area Extraction and 3D Change Information for Open-Pit Coal Mine

Table 6 summarizes the estimated 3D changes in the Dong, Antaibao, and Anjialing open-pit mines between 23 October 2022 and 25 November 2023. Due to missing GF-7 image data for Anjialing on 23 October 2022, estimates for the mining volume, mining work area, and mining area for Anjialing could not be calculated. During this period, Dong and Antaibao had mining areas of 4.74 m2 and 3.26 m2, with estimated mining volumes of 166.14 Mm3 and 90.94 Mm3, respectively. The dumping areas for Dong, Antaibao, and Anjialing were 2.89 Mm2, 3.24 Mm2, and 3.52 Mm2, with corresponding estimated stripping volumes of 141.20 Mm3, 77.23 Mm3, and 136.60 Mm3. The production capacity was highest at Dong, followed by Anjialing, with Antaibao having the lowest, aligning well with the actual operational situation.
The mining work areas of Dong, Antaibao, and Anjialing on 23 October 2022 and 25 November 2023 are shown in Figure 8. During this period, Dong was mining in the northwest direction and discharging soil to the east of the mining area (Figure 8(a)–(a-III)). The mining area was larger than the discharging area and had a relatively regular shape. Antaibao was mining in the north and discharging soil to the south (Figure 8(b)–(b-III)). The mining area and the discharging area were in the same area. The shape of the discharging area was strange and not completely continuous. Anjialing was mining in the south and discharging soil to the north (Figure 8(c)–(c-III)). The mining area and the discharging area were concentrated, which was very consistent with the actual situation.
From the 3D change of the mining work area in Figure 9(a-II)–(c-II), it can be more intuitively seen that the mining and dumping activities in the open-pit mine area are relatively concentrated as a whole, and the boundaries between the mining area and the dumping area are relatively clear. From the details, the terrain changes caused by these activities are irregular, which may be related to the distribution of coal mines inside the open-pit mining area, the construction of mining facilities, and the internal terrain structure. At the same time, it can be seen that there are many burrs in the 3D figure, which is caused by the complex terrain in the mining area. In general, the 3D construction of the mining work area well reflects the mining and dumping conditions in the open-pit mine.

4.3. Evaluation of Accuracy for Stripping Volume

The converted data in the environmental report evaluation of the Dong Open-pit Mine were used to verify the accuracy of the estimated stripping volume. The specific comparative data are in Table 7. The calculation error rate is 0.26%. As specified in the national standard GB/T21153-2007 [41] “Earth-moving machinery. Units for dimensions, performance and capacities, and their measurement accuracies”, the permissible relative error between the calculated volume and the reference value must be within a tolerance range of ±3%. The results show that our method for calculating the stripping volume of the open-pit coal mine has a high reliability.

5. Discussion

5.1. Comparative Analysis with Traditional Methods

This study demonstrates that calculating historical mining and stripping volumes of open-pit coal mines using multi-view optical imagery is feasible, with calculated results closely aligning with actual data, underscoring the method’s strong practical application value. To evaluate the accuracy of this method for calculating stripping volumes in open-pit mines, we reviewed relative errors from existing studies. Han [42] achieved stripping volume estimates with 2.90% and 1.30% error rates using UAV oblique photogrammetry and 3D laser scanning, respectively. Su [32] calculated the filling volume based on the UAV oblique photogrammetry with a relative error of less than 3%, and the average relative error was 1.17%. Kim [43] reported an 11.9% average error rate for open-pit mining volume calculated via UAV photogrammetry. Wang [44] used low-altitude UAVs to capture multi-view images, estimating mining volume with a 1.55% error rate. For our method, error rates for stripping volume estimates were 0.26%, demonstrating that our approach falls within a leading accuracy range with high practical applicability in mining volume calculations.

5.2. Estimated Production Capacity of Open-Pit Coal Mines: Preliminary Expectations

Annual production capacity is also an important monitoring metric for open-pit coal mines. Through our analysis, we found a quantitative relationship between annual production capacity and stripping volume. The annual production capacity of an open-pit coal mine refers to the tonnage of raw coal produced within a year. In monitoring reports for related mines, three key indicators are often provided: stripping volume, stripping ratio, and annual production capacity. The stripping ratio is defined as the ratio of stripping volume to annual production capacity, typically measured in cubic meters per ton (m3/t). The stripping ratio depends on the morphology of the ore body, geological conditions, and mining methods. Therefore, by obtaining the stripping volume and using a stripping ratio close to the monitoring period, we can estimate the production capacity of open-pit coal mines. This approach allows for a more comprehensive monitoring of production trends and development in open-pit mining operations.

5.3. Influence of GF-7 Acquisition Constraints on the Methodologies

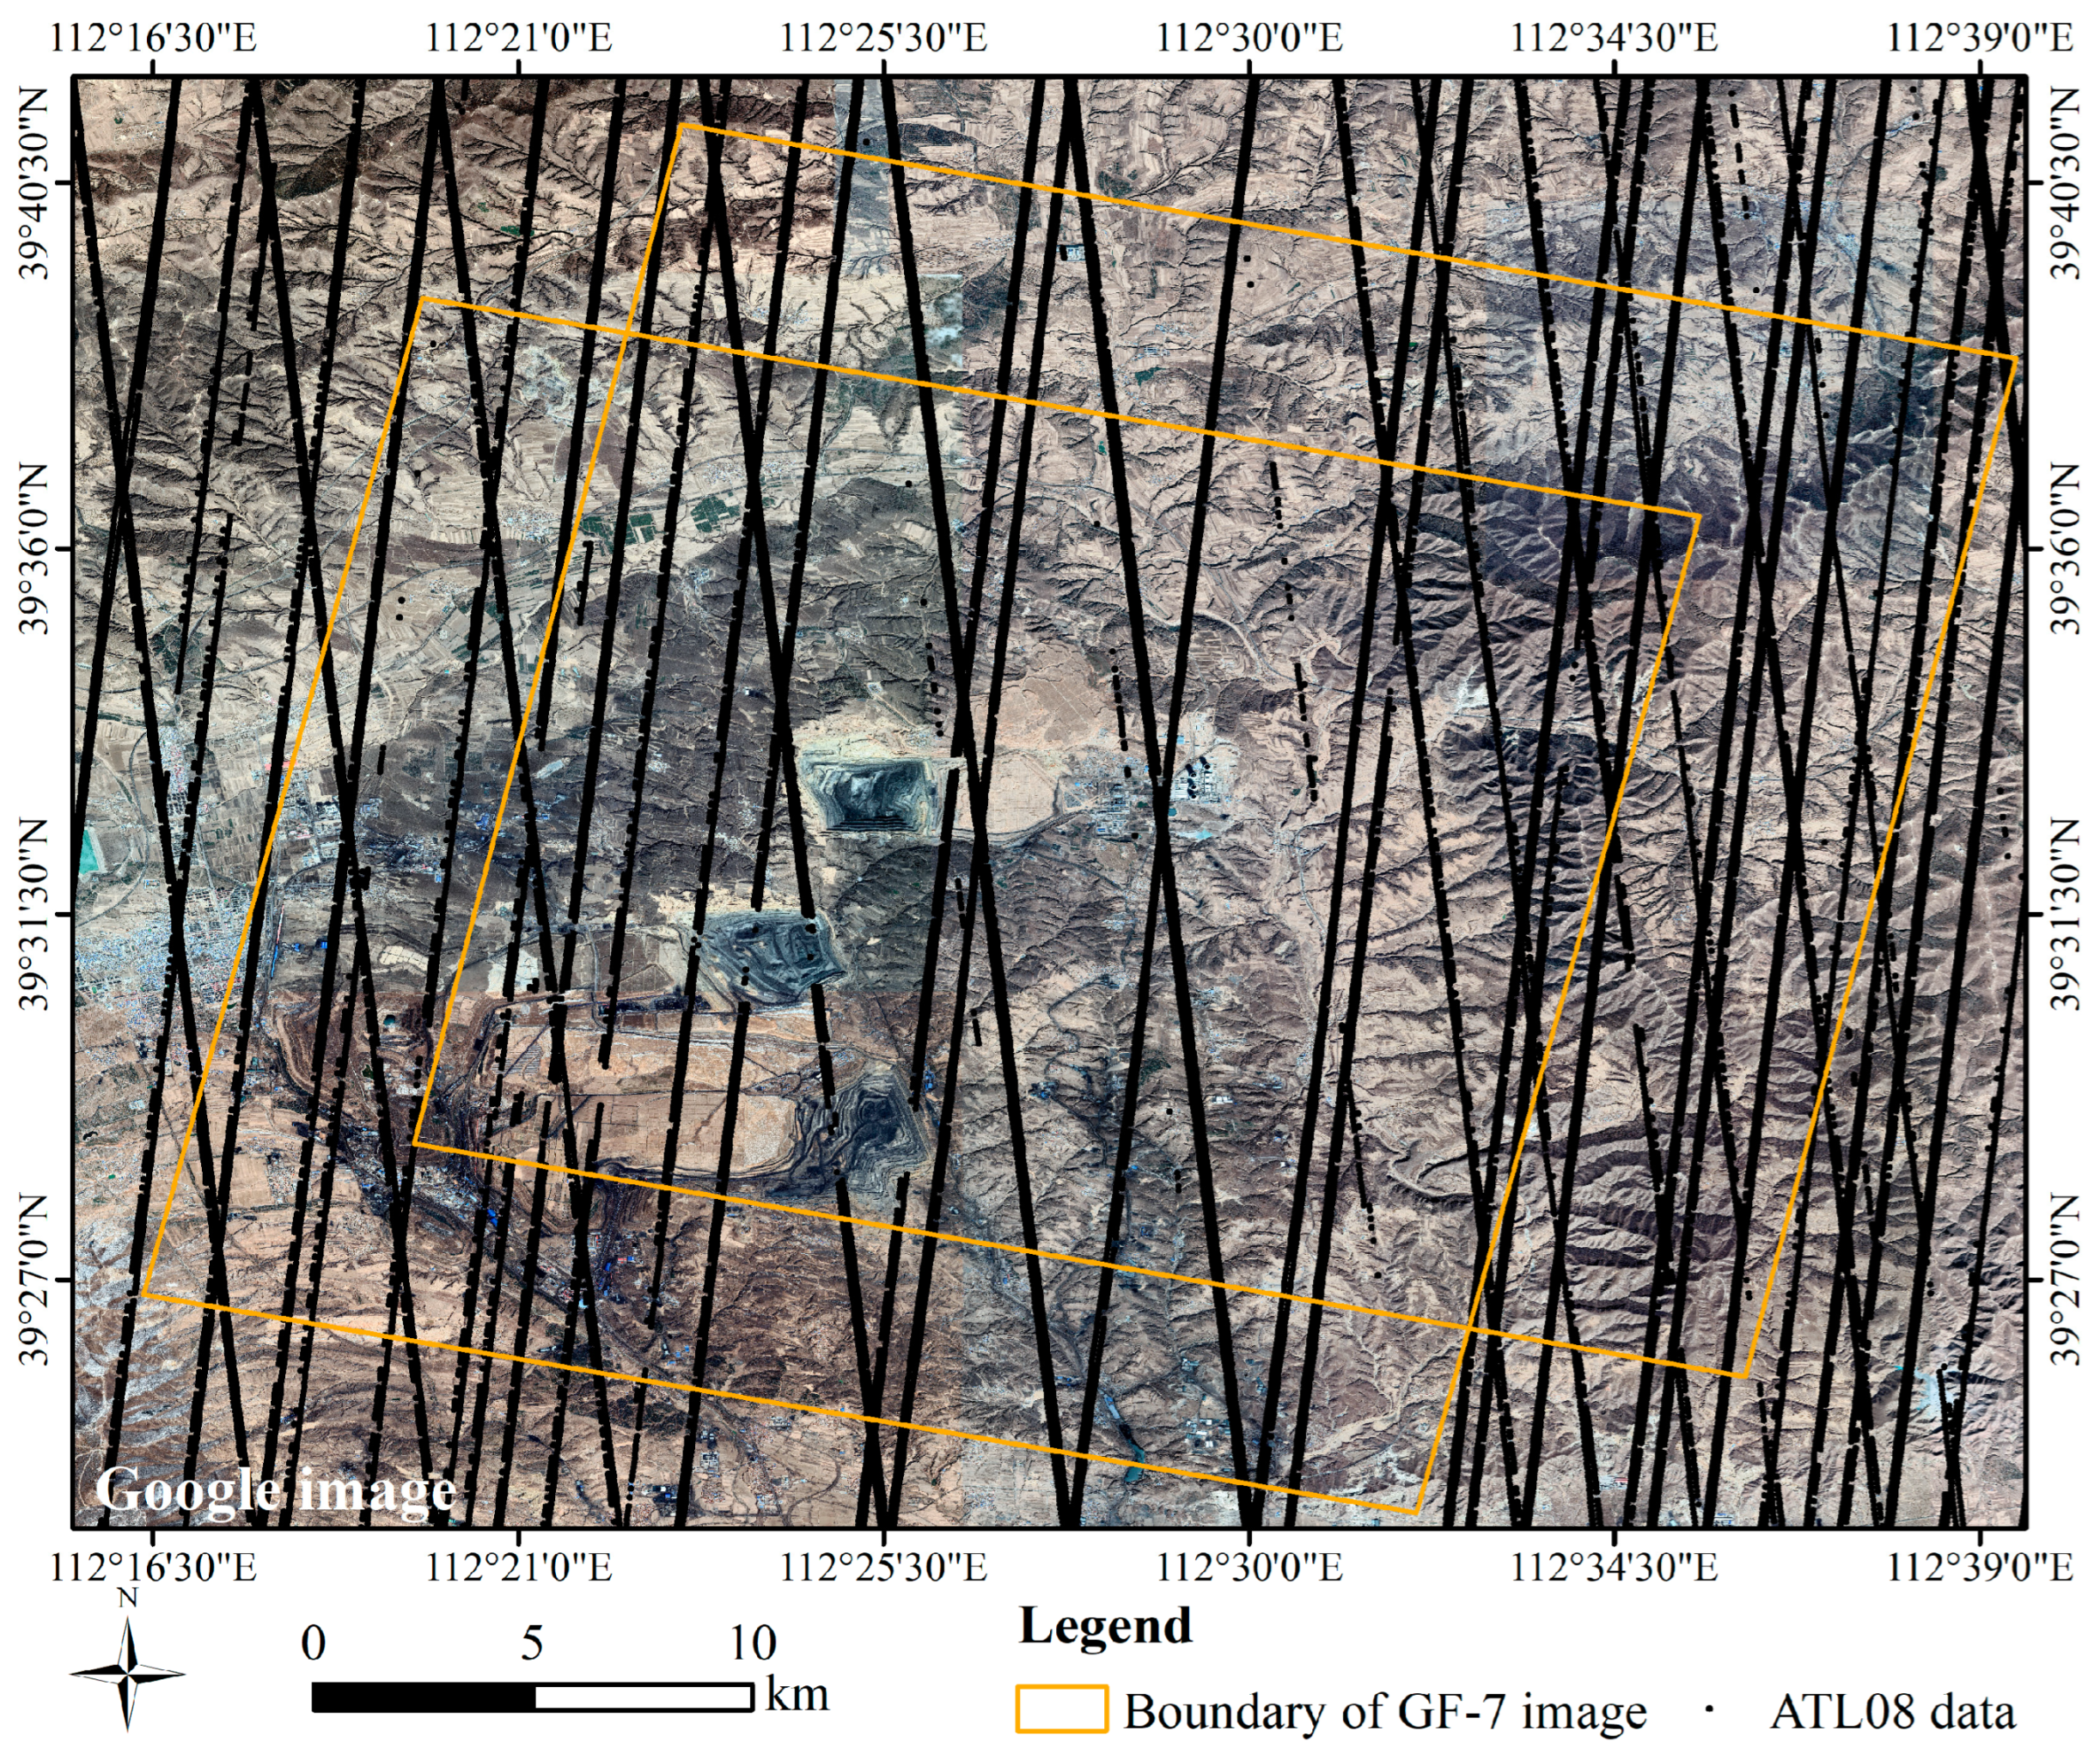
The availability of GF-7 satellite imagery constitutes a critical factor in calculating surface feature change volume. Our statistical analysis of the experimental area revealed that only six GF-7 image acquisitions were available for open-pit coal mining volume calculations between January 2022 and January 2025. Due to constraints imposed by the satellite’s revisit cycle and atmospheric interference (e.g., cloud cover and snow), the number of available GF-7 images per year in the study area remains limited. Consequently, our proposed methodology is particularly suitable for long-term surface change volume detection rather than high-frequency monitoring. For more frequent surface change volume calculations, integration with additional satellite data sources would be necessary. Currently, several global satellite datasets demonstrate comparable capabilities to GF-7 imagery, including WorldView series images, GeoEye-1 imagery, QuickBird data, and SuperView-1. While these alternatives could potentially replace GF-7 imagery in surface change calculations, significant technical challenges remain, particularly regarding the harmonization of different spatial resolutions and the elimination of pseudo-changes caused by sensor-specific characteristics.

5.4. Advantages and Limitations

In addition to its application in calculating stripping volumes for open-pit coal mines, the method presented in this paper is also well-suited for the calculation of stripping volumes in metal open-pit mines, the monitoring of three-dimensional building changes, extraction of erosion channels, the estimation of vegetation volume changes, and the calculation of landslide volumes, among others. Due to the differences in land cover types, the methods used for calculating these surface land cover changes will vary accordingly. Compared to open-pit mining areas, the calculation of changes in land cover types such as buildings, vegetation, and landslides is less complex, as these land cover types are more homogeneous, and the extraction of change areas does not require the construction of a classification system. Overall, our method demonstrates broad potential for widespread application.
Furthermore, this method enables the production of high-precision, large-scale mine height change with a 1-m resolution, offering a substantial improvement over existing elevation products such as the 30-m SRTM and 12-m TanDEM-X DEM. Compared to multi-view optical imagery, like Resource-3, our method provides higher accuracy and resolution. As the stripping volume calculations are based on multi-view optical imagery, sufficient data availability allows for nationwide estimation of historical stripping volumes of open-pit coal mines, facilitating unified verification of mining production data by relevant authorities. Specifically, in cases of public interest litigation, this method is valuable for investigating unlicensed mining, monitoring over-exploitation in legally designated areas, assessing national mineral resource inventories, and evaluating changes in mining production capacity.
Despite achieving high accuracy, this method has certain limitations and uncertainties. First, shadows along the mining area’s edges in the images affect the 3D reconstruction results for open-pit coal mines. While these effects are managed here through manual smoothing, developing an automated shadow correction method to enhance DSM accuracy is a planned improvement to further refine the stripping volume calculations. Second, traditional dense matching was used due to limited open-pit mine samples, although studies indicate that stereo-matching neural networks can yield high-quality DSM [45]. Future work will explore the 3D reconstruction of open-pit coal mines based on these neural networks. Third, the typical open-pit mine contains numerous stepped terraces with significant height differences and relatively gentle slopes within each step. Incorporating this structure into 3D reconstruction processes may improve outcomes. Fourth, while this method achieves low error rates in calculating stripping volumes, whether it can maintain accuracy in smaller open-pit mines remains to be tested. Finally, we will gather more real-world open-pit mine data for verification and as reference material for large-scale coal mining volume calculations.

6. Conclusions

To achieve more extensive, comprehensive, and detailed monitoring of land surface volumetric changes, this study proposes a method for calculating land surface volumetric changes based on high spatial resolution multi-view optical imagery. Using the mining and stripping volumes of open-pit coal mines as an example, experiments and validations were conducted, leading to the following conclusions: (1) ACPELP can assist in obtaining stereo information with horizontal and vertical errors of 1.05 m and 1.99 m, respectively. Compared to traditional methods, ACPELP significantly improves the accuracy of multi-temporal stereoscopic information retrieval. (2) A function-based fine classification system for open-pit coal mines allows for intuitive and effective extraction of stereoscopic change region. (3) The stripping volume ER obtained in this study is 0.26%, demonstrating that the proposed method offers a leading level of accuracy compared to traditional ground-based and UAV technologies
In general, considering the accuracy and application scope of this method, our research can provide a historical stripping volume calculation plan for large open-pit coal mines across the country, which has great application value for mine monitoring and the handling of illegal mining cases.

Author Contributions

Conceptualization, C.Y.; methodology, C.Y. and Q.W.; software, C.Y.; validation, C.Y. and S.L.; formal analysis, C.Y.; investigation, C.Y. and Q.W.; resources, S.L.; data curation, C.Y.; writing—original draft preparation, C.Y.; writing—review and editing, C.Y., Q.W., Y.Y., D.Y. and X.S.; visualization, C.Y.; supervision, Q.W.; project administration, Q.W.; funding acquisition, Q.W. All authors have read and agreed to the published version of the manuscript.

Funding

This research was funded by National Key R&D Program of China (2022YFC3301604) and Inner Mongolia Autonomous Region Central Government Guidance Local Science and Technology Development Fund Project (2024ZY0138).

Data Availability Statement

The data are not publicly available due to data privacy.

Acknowledgments

The authors want to acknowledge the Aerospace Information Research Institute, Chinese Academy of Sciences, NASA, Google Earth, JAXA and China Coal Pingshuo Group Co., Ltd. for providing relevant data. The authors would also like to thank the editor and reviewers for their useful comments.

Conflicts of Interest

The authors declare no conflicts of interest.

References

  1. Stylianidis, E.; Akca, D.; Poli, D.; Hofer, M.; Gruen, A.; Sanchez Martin, V.; Smagas, K.; Walli, A.; Altan, O.; Jimeno, E.; et al. FORSAT: A 3D forest monitoring system for cover mapping and volumetric 3D change detection. Int. J. Digit. Earth 2020, 13, 854–885. [Google Scholar] [CrossRef]
  2. Zhou, Y.; Li, X.; Zheng, D.; Ren, S.; Wang, Y.; LI, Z. Data, methods and perspectives of optical stereo and bistatic SAR satellites for monitoring glacier thickness change in high-mountain Asia. Acta Geod. Et Cartogr. Sin. 2024, 53, 779–800. [Google Scholar]
  3. Domingo, D.; van Vliet, J.; Hersperger, A.M. Long-term changes in 3D urban form in four Spanish cities. Landsc. Urban Plan. 2023, 230, 104624. [Google Scholar] [CrossRef]
  4. Guzzetti, F.; Mondini, A.C.; Cardinali, M.; Fiorucci, F.; Santangelo, M.; Chang, K.-T. Landslide inventory maps: New tools for an old problem. Earth-Sci. Rev. 2012, 112, 42–66. [Google Scholar] [CrossRef]
  5. Qin, R.; Tian, J.; Reinartz, P. 3D change detection—Approaches and applications. ISPRS J. Photogramm. Remote Sens. 2016, 122, 41–56. [Google Scholar] [CrossRef]
  6. Chen, P.M.; Huang, H.B.; Liu, J.Y.; Wang, J.; Liu, C.; Zhang, N.; Su, M.; Zhang, D.J. Leveraging Chinese GaoFen-7 imagery for high-resolution building height estimation in multiple cities. Remote Sens. Environ. 2023, 298, 113802. [Google Scholar] [CrossRef]
  7. Woodcock, C.E.; Loveland, T.R.; Herold, M.; Bauer, M.E. Transitioning from change detection to monitoring with remote sensing: A paradigm shift. Remote Sens. Environ. 2020, 238, 111558. [Google Scholar] [CrossRef]
  8. Xiao, W.; Cao, H.; Tang, M.; Zhang, Z.; Chen, N. 3D urban object change detection from aerial and terrestrial point clouds: A review. Int. J. Appl. Earth Obs. Geoinf. 2023, 118, 103258. [Google Scholar] [CrossRef]
  9. Gao, J.X.; Liu, C.; Wang, J.; Li, Z.K.; Meng, X.C. A new method for mining deformation monitoring with GPS-RTK. Trans. Nonferrous Met. Soc. China 2011, 21, S659–S664. [Google Scholar] [CrossRef]
  10. Labant, S.; Staňková, H.; Weiss, R. Geodetic Determining of Stockpile Volume of Mineral Excavated in Open Pit Mine. GeoScience Eng. 2013, 59, 30–40. [Google Scholar] [CrossRef]
  11. Ren, H.; Zhao, Y.L.; Xiao, W.; Hu, Z.Q. A review of UAV monitoring in mining areas: Current status and future perspectives. Int. J. Coal Sci. Technol. 2019, 6, 320–333. [Google Scholar] [CrossRef]
  12. Chen, J.; Li, K.; Chang, K.-J.; Sofia, G.; Tarolli, P. Open-pit mining geomorphic feature characterisation. Int. J. Appl. Earth Obs. Geoinf. 2015, 42, 76–86. [Google Scholar] [CrossRef]
  13. Peng, D.; Zhang, Y.; Xiong, X. 3D Building Change Detection by Combining LiDAR Point Clouds and Aerial Imagery. Geomat. Inf. Sci. Wuhan Univ. 2015, 40, 462–468. [Google Scholar] [CrossRef]
  14. Park, H.J.; Turner, R.; Yun, B.Y.; Lee, J.O. Change detection analysis using airborne LiDAR: Open-cut mine environment. In Proceedings of the XVI International Mine Surveying Congress (ISM2016), Brisbane, Australia, 12–16 September 2016. [Google Scholar]
  15. Kuck, T.N.; Silva Filho, P.F.; Sano, E.E.; Bispo, P.D.; Shiguemori, E.H.; Dalagnol, R. Change Detection of Selective Logging in the Brazilian Amazon Using X-Band SAR Data and Pre-Trained Convolutional Neural Networks. Remote Sens. 2021, 13, 4944. [Google Scholar] [CrossRef]
  16. Tsokas, A.; Rysz, M.; Pardalos, P.M.; Dipple, K. SAR data applications in earth observation: An overview. Expert Syst. Appl. 2022, 205, 117342. [Google Scholar] [CrossRef]
  17. Stojcsics, D.; Domozi, Z.; Molnar, A. Automated Volume Analysis of Open Pit Mining Productions Based on Time Series Aerial Survey. In Proceedings of the 2018 UKSim-AMSS 20th International Conference on Computer Modelling and Simulation (UKSim), Cambridge, UK, 27–29 March 2018. [Google Scholar]
  18. Tong, X.H.; Liu, X.F.; Chen, P.; Liu, S.J.; Luan, K.F.; Li, L.Y.; Liu, S.; Liu, X.L.; Xie, H.; Jin, Y.M.; et al. Integration of UAV-Based Photogrammetry and Terrestrial Laser Scanning for the Three-Dimensional Mapping and Monitoring of Open-Pit Mine Areas. Remote Sens. 2015, 7, 6635–6662. [Google Scholar] [CrossRef]
  19. Stal, C.; Tack, F.; De Maeyer, P.; De Wulf, A.; Goossens, R. Airborne photogrammetry and lidar for DSM extraction and 3D change detection over an urban area—A comparative study. Int. J. Remote Sens. 2013, 34, 1087–1110. [Google Scholar] [CrossRef]
  20. Stilla, U.; Xu, Y. Change detection of urban objects using 3D point clouds: A review. ISPRS J. Photogramm. Remote Sens. 2023, 197, 228–255. [Google Scholar] [CrossRef]
  21. Zhou, P.; Pan, H.; Tang, X. Vertical Accuracy Evaluation Model for Laser Altimetry Points and Stereo Images of the Gaofen-7 Satellite Without Ground Control Points. IEEE Trans. Geosci. Remote Sens. 2023, 61, 5622513. [Google Scholar] [CrossRef]
  22. Martínez-Carricondo, P.; Agüera-Vega, F.; Carvajal-Ramírez, F.; Mesas-Carrascosa, F.-J.; García-Ferrer, A.; Pérez-Porras, F.-J. Assessment of UAV-photogrammetric mapping accuracy based on variation of ground control points. Int. J. Appl. Earth Obs. Geoinf. 2018, 72, 1–10. [Google Scholar] [CrossRef]
  23. Montazeri, S.; Gisinger, C.; Eineder, M.; Zhu, X.x. Automatic Detection and Positioning of Ground Control Points Using TerraSAR-X Multiaspect Acquisitions. IEEE Trans. Geosci. Remote Sens. 2018, 56, 2613–2632. [Google Scholar] [CrossRef]
  24. Ni, W.; Li, Z.; Wang, Q.; Zhang, Z.; Liu, Q.; Pang, Y.; He, Y.; Li, Z.; Sun, G. Forest Height Extraction Using GF-7 Very High-Resolution Stereoscopic Imagery and Google Earth Multi-Temporal Historical Imagery. J. Remote Sens. 2024, 4, 0158. [Google Scholar] [CrossRef]
  25. Wang, S.; Liu, C.; Li, W.; Jia, S.; Yue, H. Hybrid model for estimating forest canopy heights using fused multimodal spaceborne LiDAR data and optical imagery. Int. J. Appl. Earth Obs. Geoinf. 2023, 122, 103431. [Google Scholar] [CrossRef]
  26. Shang, D.S.; Zhang, Y.S.; Dai, C.G.; Ma, Q.F.; Wang, Z.Q. Extraction Strategy for ICESat-2 Elevation Control Points Based on ATL08 Product. Ieee Trans. Geosci. Remote Sens. 2022, 60, 5705012. [Google Scholar] [CrossRef]
  27. Zhang, X.; Chen, Y.; Han, W.; Chen, X.; Wang, S. Fine mapping of Hubei open pit mines via a multi-branch global–local-feature-based ConvFormer and a high-resolution benchmark. Int. J. Appl. Earth Obs. Geoinf. 2024, 133, 104111. [Google Scholar] [CrossRef]
  28. Xu, X.; Gu, X.; Wang, Q.; Zhao, Y.; Zhu, Z.; Wang, F.; Zhang, Z. Ultimate pit optimization with environmental problem for open-pit coal mine. Process Saf. Environ. Prot. 2023, 173, 366–372. [Google Scholar] [CrossRef]
  29. Xiao, S.; Dong, G.; Wang, H. Dynamic capacity balance between stripping and mining of a dragline stripping system. Int. J. Coal Sci. Technol. 2020, 7, 380–387. [Google Scholar] [CrossRef]
  30. Hu, Z.; Zhu, Q.; Liu, X.; Li, Y. Preparation of topsoil alternatives for open-pit coal mines in the Hulunbuir grassland area, China. Appl. Soil Ecol. 2020, 147, 103431. [Google Scholar] [CrossRef]
  31. Yan, J. Leverage the function of public interest litigation to supervise and urge the rectification of illegal mining. Procuratorial Daily 2022. [Google Scholar]
  32. Su, W. 3D Modeling and Application of Open-Pit Mine Based on Tilt Photogrammetry of UAV. Master’s Thesis, Hebei University of Engineering, Handan, China, 2023. [Google Scholar]
  33. Meng, X.; Wang, T.; Cheng, D.; Su, W.; Yao, P.; Ma, X.; He, M. Enhanced Point Cloud Slicing Method for Volume Calculation of Large Irregular Bodies: Validation in Open-Pit Mining. Remote Sens. 2023, 15, 5006. [Google Scholar] [CrossRef]
  34. Zhang, M.; Wang, J.; Feng, Y. Temporal and spatial change of land use in a large-scale opencast coal mine area: A complex network approach. Land Use Policy 2019, 86, 375–386. [Google Scholar] [CrossRef]
  35. Magruder, L.; Brunt, K.; Neumann, T.; Klotz, B.; Alonzo, M. Passive Ground-Based Optical Techniques for Monitoring the On-Orbit ICESat-2 Altimeter Geolocation and Footprint Diameter. Earth Space Sci. 2021, 8, e2020EA001414. [Google Scholar] [CrossRef]
  36. Tang, X.; Li, S.; Li, T.; Gao, Y.; Zhang, S.; Chen, Q.; Zhang, X. Review on global digital elevation products. Natl. Remote Sens. Bull. 2021, 25, 167–181. [Google Scholar] [CrossRef]
  37. Zheng, Y.; Zhang, Y.; Wang, T.; Zhao, X.; Zhang, K.; Wang, L. Elevation Control Points Extraction and Accuracy Validation based on ICESat-2 Data. J. Geo-Inf. Sci. 2022, 24, 1234–1244. [Google Scholar] [CrossRef]
  38. Wang, M.; Wei, Y.; Yang, B.; Zhou, X. Extraction and Analysis of Global Elevation Control Points from ICESat-2/ATLAS Data. Geomat. Inf. Sci. Wuhan Univ. 2021, 46, 184–192. [Google Scholar] [CrossRef]
  39. YANG, M.-m.; SHANG, D.-s.; GAO, X.-m.; TONG, F.-r. Combined Adjustment for GF-14 Satellite Stereo Imagery and ICESat-2 Laser Altimetry Data. J. Earth Sci. Environ. 2024, 46, 843–852. [Google Scholar] [CrossRef]
  40. Gong, D.; Liu, S.; Han, Y.; Zhang, W. Fine 3D reconstruction methods with Gaofen-7 satellite stereo images. Opt. Precis. Eng. 2023, 31, 2147–2159. [Google Scholar] [CrossRef]
  41. GB/T 21153-2007; Earth-Moving Machinery. Units for Dimensions, Performance and Capacities, and Their Measurement Accuracies. Standards Press of China: Beijing, China, 2007.
  42. Han, L.; Li, M. Comparison and analysis of three different methods for calculating earthwork volume in mines. West. Resour. 2023, 5, 25–28. [Google Scholar] [CrossRef]
  43. Kim, D.P.; Kim, S.B.; Back, K.S. Analysis of Mine Change Using 3D Spatial Information Based on Drone Image. Sustainability 2022, 14, 3433. [Google Scholar] [CrossRef]
  44. Wang, Q.; Wu, L.; Chen, S.; Shu, D.; Xu, Z.; Li, F.; Wang, R. Accuracy Evaluation of 3D Geometry from Low-Attitude UAV collections A case at Zijin Mine. Int. Arch. Photogramm. Remote Sens. Spat. Inf. Sci. 2014, XL-4, 297–300. [Google Scholar] [CrossRef]
  45. He, S.; Zhang, J.; Chen, F.; Li, S.; Jiang, W. Deep learning method for large scene DSM generation of GF-7imagery. Acta Geod. Cartogr. Sin. 2023, 52, 2103–2114. [Google Scholar] [CrossRef]
Figure 1. Visualization of selected study area.
Remotesensing 17 01310 g001
Figure 2. Datasets and spatial coverage.
Remotesensing 17 01310 g002
Figure 3. Flowchart of the study.
Remotesensing 17 01310 g003
Figure 4. Flowchart for ACPELP. “h_te_interp”, “h_te_median”, “dem_h”, “terrain_slope”, “cloud_flag_atm”, “night_flag” and “terrain_flg” refer to attribute fields within the ATL08 dataset.
Remotesensing 17 01310 g004
Figure 5. Classification system diagram for open-pit coal mines and Interpretation signs.
Remotesensing 17 01310 g005
Figure 6. The comparison of the DOM extraction results among the three cases in Section 3.1.3. (a): Google image at transportation pipeline, (a)-I–(a)-III: Geometric accuracy of DOM 2022 compared with Google Imagery in three cases; (b): Google image at farmland, (b)-I–(b)-III: Geometric accuracy of DOM 2022 compared with Google Imagery in three cases; (c): Google image at building, (c)-I–(c)-III: Geometric accuracy of DOM 2023 compared with Google Imagery in three cases; (d): Google image at farmland, (d)-I–(d)-III: Geometric accuracy of DOM 2023 compared with Google Imagery in three cases; (e): Google image at building, (e)-I–(e)-III: Geometric accuracy of DOM 2022 compared to DOM 2023 in three cases; (f): Google image at farmland, (f)-I–(f)-III: Geometric accuracy of DOM 2022 compared to DOM 2023 in three cases.
Remotesensing 17 01310 g006
Figure 7. Validation of the estimated elevation with reference elevation for (a) comparison of estimated elevation and reference elevation on 23 October 2022, (b) comparison of estimated elevation and reference elevation on 25 November 2023, and (c) comparison of the estimated elevation on 23 October 2022 and 25 November 2023.
Remotesensing 17 01310 g007
Figure 8. Spectral information and elevation results of three open-pit coal mines, as well as extraction results of mining working area, mining area and dumping area: (a) DOM of Dong on 23 October 2022, (a-I) DSM of Dong on 23 October 2022, (a-II) DOM of Dong on 25 November 2023, (a-III) DSM of Dong on 25 November 2023; (b) DOM of Antaibao on 23 October 2022, (b-I) DSM of Antaibao on 23 October 2022, (b-II) DOM of Antaibao on 25 November 2023, (b-III) DSM of Antaibao on 25 November 2023; (c) DOM of Anjialing on 23 October 2022, (c-I) DSM of Anjialing on 23 October 2022, (c-II) DOM of Anjialing on 25 November 2023, (c-III) DSM of Anjialing on 25 November 2023.
Remotesensing 17 01310 g008
Figure 9. 2D and 3D of elevation change in the three open-pit mines: (a) GF-7 image of Dong, (a−I) DSM 2D change diagram of Dong, (a−II) DSM 3D change diagram of Dong; (b) GF-7 image of Antaibao, (b−I) DSM 2D change diagram of Antaibao, (b−II) DSM 3D change diagram of Antaibao; (c) GF-7 image of Anjialing, (c−I) DSM 2D change diagram of Anjialing, (c−II) DSM 3D change diagram of Anjialing.
Remotesensing 17 01310 g009
Table 1. Detailed information on three open-pit coal mines.
NameArea (Km2)Production Capacity (Mt/a)
Dong46.5225
Antaibao24.0320
Anjialing54.7720
Table 2. GF-7DLC product information.
GF-7DLC ProductsSpectral RangeCamera TiltResolutionWidth
FPA0.45–0.9 µm+26°0.8 m≥20 km
BPA0.45–0.9 µm−5°0.65 m
BMS0.45–0.52 µm−5°2.6 m
0.52–0.59 µm
0.63–0.69 µm
0.77–0.89 µm
Table 3. ATL08 data attribute information.
Attribute FieldsDescribes
longitudeLongitude.
latitudeLatitude.
h_te_interpInterpolating land surface elevation.
h_te_medianMedian land surface elevation.
dem_hThe reference DEM elevation of this point comes from one of the four data products: Arctic, GMTED, MSS, and Antarctic. The elevation is based on the WGS84 ellipsoidal coordinate system.
terrain_slopeSlope.
cloud_flag_atmCloud cover mark. A value greater than 0 indicates the presence of clouds or aerosols. The value range is [0,10].
night_flagNight flag, 0 means daytime, 1 means nighttime.
terrain_flgTerrain quality flag, 0 means the error is below the threshold, 1 means the error is above the threshold.
Table 4. Open-pit coal mine monitoring data from environmental impact assessment post-evaluation report.
NameStripping Volume in 2023 (Mm3)Monthly Average Stripping Volume (Mm3)
Dong130.0010.83
Table 5. Comparison of the accuracy of mining area stereo information obtained by three cases in Section 3.1.3.
DataNumberCase ICase IICase III
RMSE (m)MAE (m)MAX (m)RMSE (m)MAE (m)MAX (m)RMSE (m)MAE (m)MAX (m)
vertical2022502.201.647.942.492.316.501.681.335.17
2023 352.261.558.182.502.188.132.071.698.53
2022–2023292.511.688.112.552.048.532.241.998.66
horizontal2022 1176.293.9541.512.922.359.862.972.258.81
2023 1082.732.108.852.782.179.592.631.949.54
2022–20231088.084.4838.031.371.183.581.201.052.51
Table 6. D change results of the three open-pit mines from 23 October 2022 to 25 November 2023.
NameVolume (Mm3)Area (Mm2)Elevation (m)
MiningStrippingMining WorkMiningDumpingMaximum Mining DepthMaximum Dumping Height
Dong166.14141.208.764.742.89116.50148.54
Antaibao90.9477.239.843.263.24119.65115.61
Anjialing136.603.52110.51169.75
Table 7. Accuracy of Dong stripping volume compared with reference data.
NameAnnual Stripping Volume (Mm3)ER
Estimation ResultsReference Results
Dong141.20140.830.26%
Disclaimer/Publisher’s Note: The statements, opinions and data contained in all publications are solely those of the individual author(s) and contributor(s) and not of MDPI and/or the editor(s). MDPI and/or the editor(s) disclaim responsibility for any injury to people or property resulting from any ideas, methods, instructions or products referred to in the content.

