1. Introduction
The proliferation of advanced Earth observation (EO) constellations has revolutionized terrestrial monitoring paradigms through the continuous acquisition of unprecedented volumes of geospatial data. Central to this transformation, SAR and optical sensor fusions provide a large amount of complementary data. Optical imaging provides detailed spectral information essential for recognizing different materials and types of vegetation [
1]. Conversely, SAR systems employ active microwave illumination to derive all-weather, diurnally invariant observations, capturing surface dielectric properties and geometric structures via polarization-dependent backscattering coefficients—parameters intrinsically linked to soil moisture variability and urban morphology [
2]. This sensor fusion paradigm has catalyzed innovations in remote sensing scene classification, a critical research frontier in geospatial artificial intelligence. The task involves hierarchical semantic labeling of image scenes into distinct LULC taxonomies through features. Such classification frameworks play a vital role in environmental surveillance, urban development, and resource administration.
The past three decades have witnessed transformative advancements in creating various methods for this task due to its critical importance in numerous applications, including natural hazard assessment through landslide pattern analysis [
3,
4], geospatial object detection [
5,
6,
7,
8], LULC determination [
9,
10,
11], geographic image retrieval [
12,
13], environmental monitoring, vegetation mapping [
14], and urban planning. Integrating radar and multi-spectral data has emerged as a significant trend in remote sensing. Numerous studies have demonstrated that combining these data sources can lead to higher mapping accuracies [
15,
16,
17]. Regarding the techniques for fusing multisource remote sensing data, the most commonly employed methods are pixel-, feature-, and decision-level fusion [
18]. Pixel-level fusion combines data from two sources to produce an enhanced image, a prime example being the creation of pan-sharpened images through the integration of low-spatial-resolution multi-spectral images and high-spatial-resolution panchromatic images. However, this method may not fully leverage the individual data sources as they are not separately analyzed in the context of image classification. Feature-level fusion combines multiple feature sets before classification, while decision-level fusion fuses outcomes from various classifiers, which may utilize different features or classification techniques. Notably, feature-level fusion dominates operational implementations due to its advantages of straightforwardness and proven effectiveness [
19,
20]. In [
21], SAR and panchromatic (PAN) features are combined into the multi-spectral (MS) images through the “à trous” wavelet decomposition and modified Brovey transform (MBT). The MBT operates by locally adjusting each MS image according to the ratio of the new intensity to the original intensity of components. This novel intensity component is generated by merging SAR and PAN features through a feature selection process. In [
22], a fusion technique has been developed that integrates the wavelet transform with the IHS transform to combine high-resolution SAR images with moderately spatially resolved MS images. In this process, a new approximation image based on wavelet is created using the intensity component of MS images and a weighted combination of SAR features, preventing the over-injection of SAR intensity information.
Recently, the synergistic deployment of Sentinel-1 and Sentinel-2 satellite image time series (SITS) has proven effective for LULC mapping, showing the advantages of using such optical and radar SITS in this area. Significant instances include employing optical S2 SITS to generate land cover maps on a national scale [
23]. Recent advancements in remote sensing imaging technology provide abundant data for both research and practical applications. The Sentinel-1 and Sentinel-2 satellites offer Synthetic Aperture Radar (SAR) and optical imagery at a spatial resolution of 10 m, aiding numerous Earth observation projects. Nevertheless, effectively leveraging the complementary data from these sensors remains a critical challenge in remote sensing [
24]. Combining the polarimetric features of SAR data with optical data enhances the ability to differentiate complex urban structures, emphasizing the importance of choosing suitable SAR properties to improve fusion results [
2]. Divergent physical measurement principles between SAR polarimetry (sensitive to dielectric/geometric properties) and optical reflectance (material-specific spectral signatures) raises the challenge of cross-modal feature incongruence. After acquiring a set of aligned SAR-optical images, various traditional pansharpening techniques have been adapted for SAR–optical pixel-level integration. Generative adversarial network (GAN)-based architecture is introduced, featuring a U-shaped generator and a convolutional discriminator. This network employs multiple loss functions to effectively remove speckle noise while retaining considerable structural details [
25]. Moreover, atmospheric conditions, such as cloud cover, often impact optical imagery, which can significantly degrade spectral and spatial quality. Fortunately, SAR data are largely unaffected by weather, making it an ideal tool for enhancing optical images. Several methods have been developed to create cloud-free optical images using auxiliary SAR data from the same location [
26,
27]. Specifically, a straightforward residual model is used to learn directly from the data pairs to produce cloud-free images, proving effective even under heavy cloud coverage [
28].
In computer vision, the remarkable achievements of deep learning have been primarily motivated by addressing the problem related to image classification, which involves assigning one or more labels to a given picture. To achieve this, numerous researchers have utilized the ImageNet database, which comprises millions of annotated images [
29]. In remote sensing, this task is commonly known as scene classification, where one or more labels are assigned to a remote sensing image or scene. Significant progress has also been made in this domain in recent years, accompanied by an increasing number of specialized datasets [
30]. Recent advancements have shifted towards automating fusion through deep learning methodologies like convolutional neural networks (CNNs). These models automatically extract and combine features from SAR and optical data, resulting in substantially better accuracy for LULC classification compared to conventional approaches [
31]. Image fusion can integrate corresponding information from multiple image sources, leverage the benefits of multi-sensor data, and broaden the range of image applications [
32]. Optical images provide clear visuals and abundant spectral details. Synthetic Aperture Radar (SAR) captures the scattering characteristics of objects in almost any weather conditions, both day and night, and SAR images contain detailed texture features and roughness information [
33]. Therefore, the fusion of SAR and optical images can take advantage of images rich in spatial, spectral, and scattering information, facilitating precise identification of targets and mapping the distribution of objects on the ground [
34,
35]. Recently, the application of deep learning in the fusion of multisource remote sensing data has gained attention. A common approach in this domain involves designing a dual-branch network structure. Initially, each branch independently extracts features from various data sources. These features are then combined using techniques such as feature stacking or concatenation. Subsequently, the integrated features are processed by a classifier layer to produce the ultimate classification outcomes [
36,
37,
38]. The robustness of data fusion in scene classification is enhanced by addressing distribution shifts and detecting out-of-distribution data. Synthetic Aperture Radar (SAR) and optical imagery are combined to improve performance in land cover classification tasks, even when distribution shifts occur due to factors such as cloud cover or sensor malfunctions. Various data fusion techniques, including deep learning-based methods, investigate how to manage scenarios where only certain data sources are impacted by distribution shifts [
39]. A dual-input model performs image-level fusion using SAR and optical data through principal component analysis (PCA) and incorporates feature-level fusion techniques for effective multimodal data integration. Deep learning approaches successfully merge the complementary features of SAR and optical images [
40]. The GAN method can convert optical data to SAR data and vice versa for detecting temporal changes in LULC. This demonstrates the potential of combining optical and SAR data for enhanced scene classification by integrating Sentinel-1 and Sentinel-2 datasets [
41].
Many current models utilize shallower classifiers that are probably insufficient for learning complex hierarchical features. This limitation hinders their capacity to identify the intricate patterns and details essential for precise classification. Basic feature extraction techniques employed by simpler architectures may overlook vital information in high-dimensional data. Certain models may find it challenging to manage the high dimensionality of multi-spectral optical and SAR data, resulting in inefficiencies and potential information loss during dimensionality reduction. Lacking effective mechanisms to handle high-dimensional inputs, these models might discard crucial features or become overwhelmed by irrelevant ones. To overcome these issues, we proposed a model that addresses the limitations of existing models by combining SAR and optical data with appropriate structure and fusion strategies. It utilizes a novel deep CNN architecture for advanced feature extraction, incorporating a shared feature extraction network that efficiently captures and leverages spatial and spectral features. The features can be fused at either the Early or Late stage. The model used Sentinel-1 and Sentinel-2 imagery from the SEN12MS [
42] dataset to evaluate the effectiveness of the models. These innovations enhance accuracy, robustness, and generalization in land type classification using SAR and optical imagery. The rest of the paper is organized as follows:
Section 2 describes the dataset used in this study,
Section 3 outlines the classification methods employed,
Section 4 presents the results,
Section 5 discusses the experimental findings, and
Section 6 concludes the study.
2. Dataset
Sentinel-1 and Sentinel-2 are integral components of the Copernicus Programme, spearheaded by the European Space Agency (ESA). This initiative is aimed to ensure a steady, detailed, and readily accessible flow of data for observing the Earth. Sentinel-1 consists of satellites that utilize C-band Synthetic Aperture Radar (SAR) to capture images of the Earth’s surface under all weather conditions, day and night. In contrast, Sentinel-2 operates with a two-satellite configuration that uses multi-spectral imaging technology across 13 spectral bands covering the visible, short-wave, and near-infrared light spectrum. Collectively, Sentinel-1 and Sentinel-2 provide a robust toolset for tracking environmental changes, supporting agricultural operations, and advancing climate change studies, with their high-frequency and high-resolution data capabilities. This technology is particularly effective for monitoring changes in soil, water bodies, inland waterways, vegetation, and coastal zones.
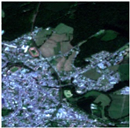
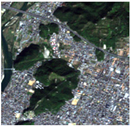
This paper uses the SEN12MS dataset [
42] to fuse the SAR and optical imagery for land use/land cover classification. The SEN12MS dataset is a distinctive compilation of georeferenced multi-spectral imagery that merges data from the Sentinel-1 and Sentinel-2 satellite missions. It is tailored to facilitate the evaluation and development of deep learning models and data fusion methods in the remote sensing field. Featuring aligned Synthetic Aperture Radar (SAR) and optical images, the SEN12MS dataset provides extensive coverage across different seasons and diverse global landscapes. It was collected from various locations worldwide, encompassing a range of land types and geographic regions. The dataset includes remote sensing imagery from multiple continents. The dataset comprises 180,662 patches spread globally and covers all seasons. Each patch in the dataset is provided at a pixel resolution of 10 m and measures 256 × 256 pixels. The dataset includes SAR images from Sentinel-1 featuring two polarimetric channels (VV and VH) and optical images from Sentinel-2 composed of 13 multi-spectral channels (B1, B2, B3, B4, B5, B6, B7, B8, B8a, B9, B10, B11, and B12) with ten bands focused on land surface observations (bands 2–4 and 8, each with a 10 m resolution; and bands 5–7, 8A, 11, and 12, each with a resolution of 20 m) and three bands aimed at atmospheric observations (bands 1, 9, and 10, each with a 60 m resolution). Sentinel-1 images are unaffected by clouds, while the Sentinel-2 images are made cloud-free by mosaicking based on GEE-based procedures. We randomly selected 12,000 patches from the SEN12MS dataset. The number of single-label images is 3140 and multi-label images are 8860. Single-label classification images are assigned with only one label. In multi-label classification, labels are assigned to each scene for all classes that cover more than 10% of the image. There are six classes with land/land cover labels: Forest, Cropland, Water, Barren, Urban/Built-up, and Savanna. Selected images are split randomly into one of two groups for training (80%) and validation (20%).
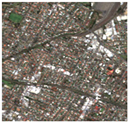
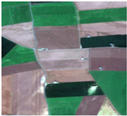
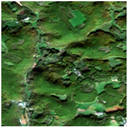
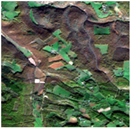
Figure 1 shows some of the samples of Sentinel-1 and Sentinel-2 from the SEN12MS dataset.
3. Methods
Convolutional neural networks (CNNs) have recently been utilized in numerous tasks in computer vision, significantly enhancing performance in areas such as image scene classification and object detection. Despite these advancements, the classification accuracy largely depends on features that can precisely represent the image scenes. Therefore, effectively leveraging the feature learning capabilities of CNNs is vital for scene classification. The proposed methods are designed to optimize the combined advantages of two satellite data types. The core of these methods involves merging the Sentinel-1 and Sentinel-2 datasets through a fusion strategy that preserves the spatial and spectral information, using a technique that identifies nonlinear associations between the datasets. Subsequently, feature extraction is performed by CNN to derive the most significant features from the optical and radar data, enhancing land type classification.
3.1. Early Fusion
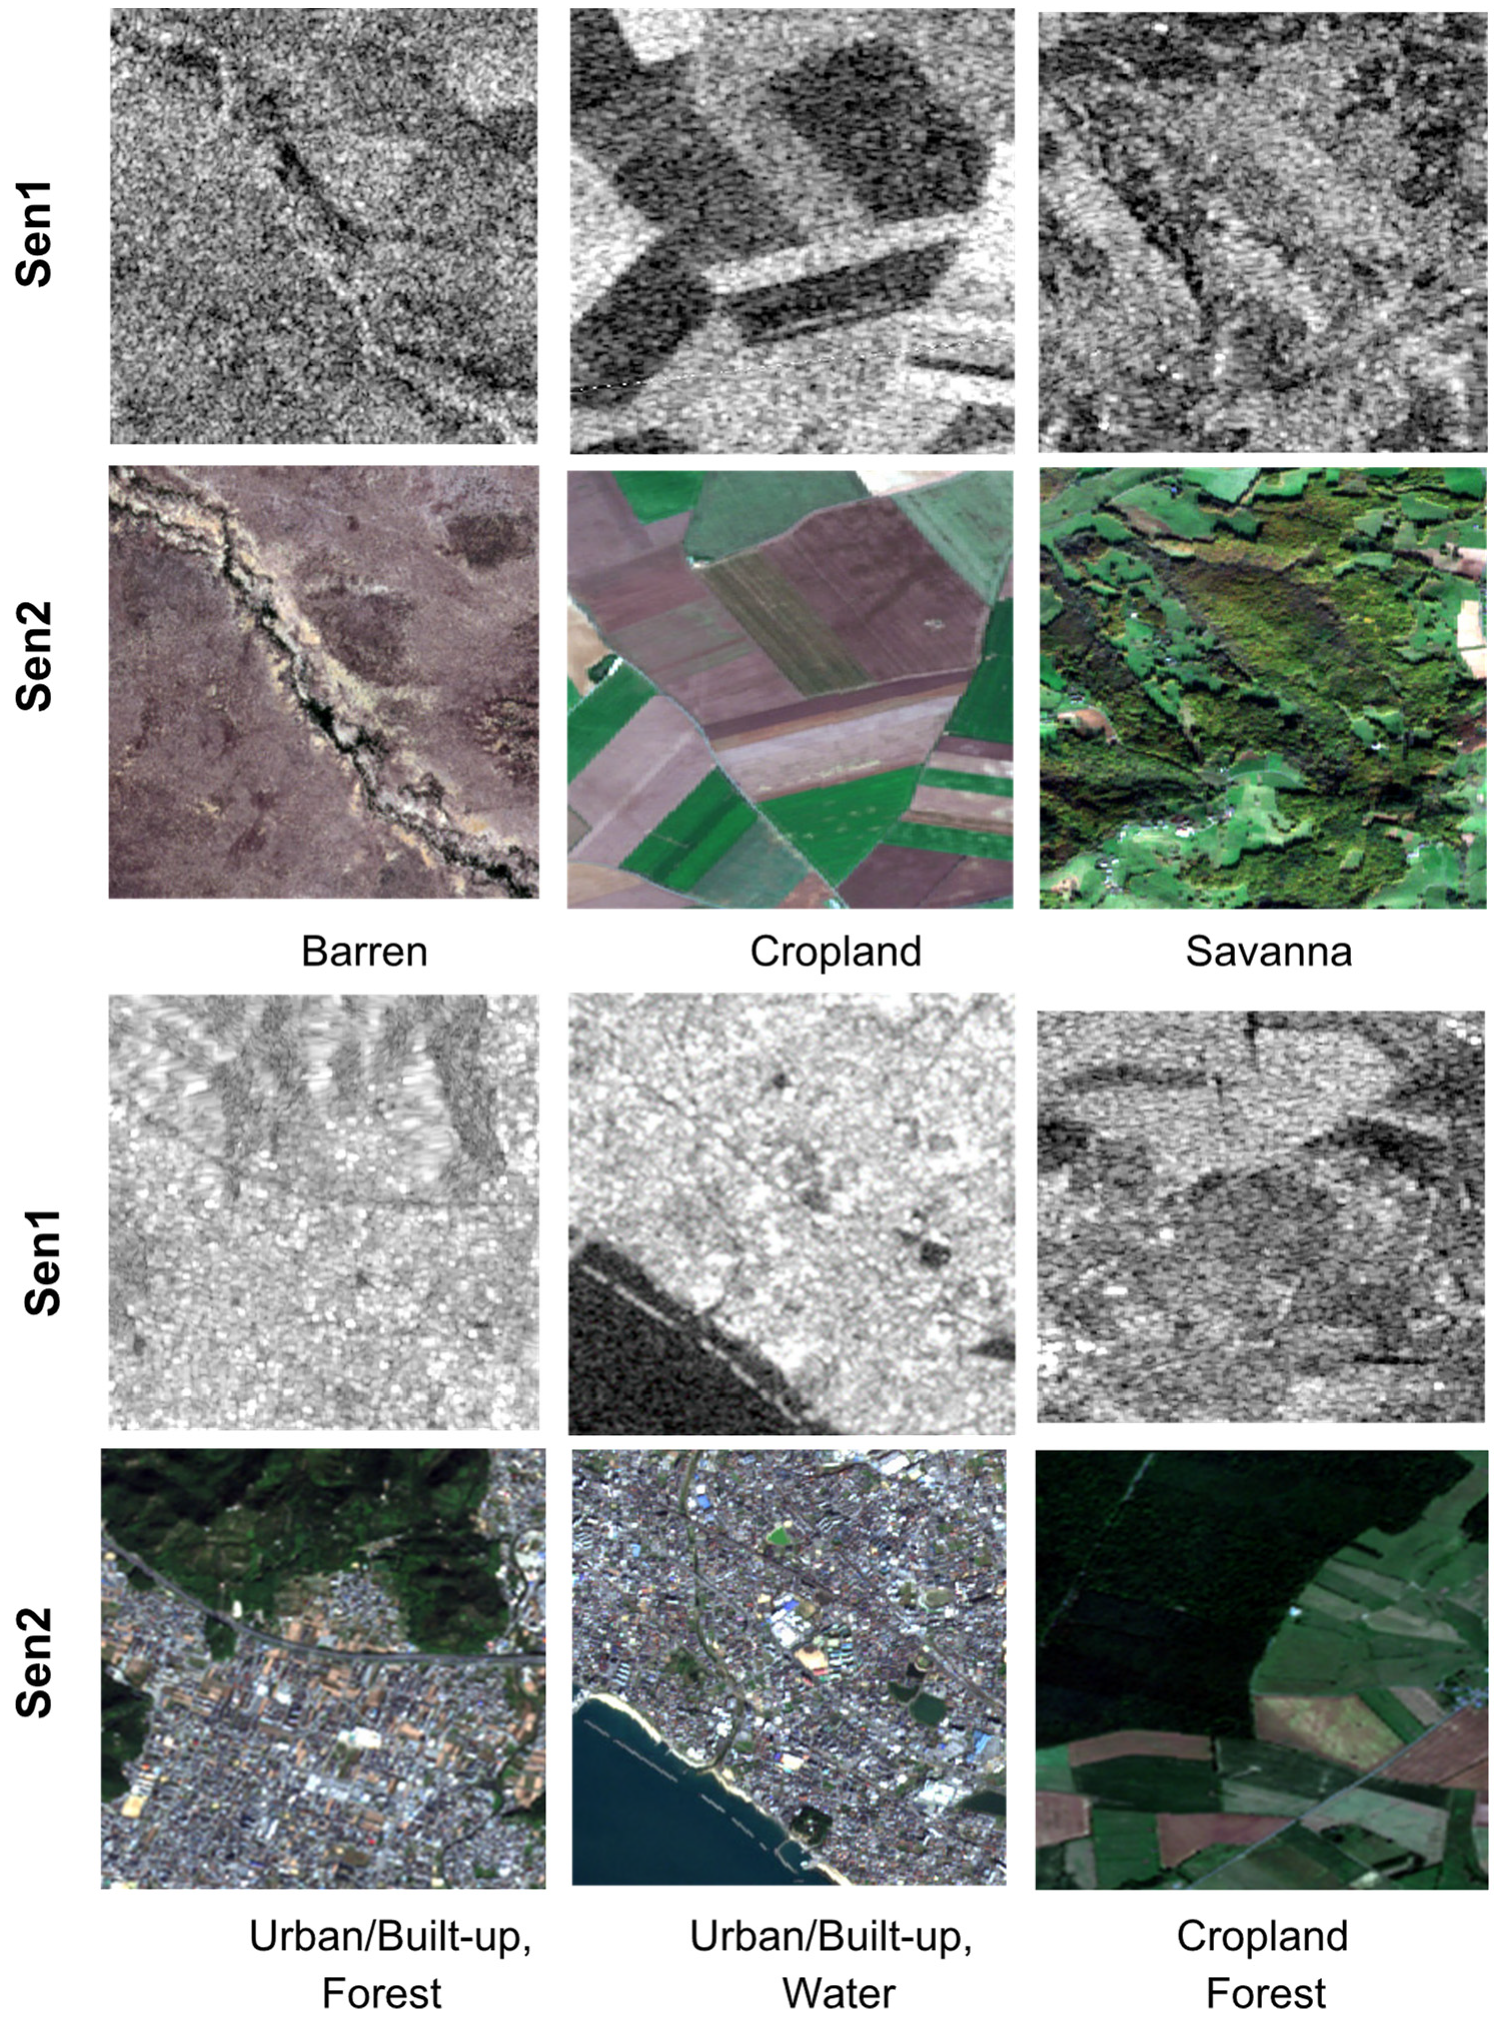
The proposed model employs Early Fusion techniques to integrate Synthetic Aperture Radar (SAR) and optical imagery to classify images into distinct LULC categories. It can process SAR images with 2 channels and optical images with 13 multi-spectral channels, all with an input size of 256 × 256 pixels. The preprocessing stage normalizes the values of the SAR and optical channels to a range between 0 and 1 to avoid biased feature extraction. In the Early Fusion block, these normalized channels are concatenated into a single input tensor of shape (256, 256, 15). This tensor is then input into a convolutional network for shared feature extraction. The convolution comprises four blocks with filter sizes increasing from 32 to 256, enabling the network to capture hierarchical feature representations. Each block uses 3 × 3 kernels for capturing local spatial features while maintaining computational efficiency and ReLU activation to prevent vanishing gradient issues and accelerate convergence, along with batch normalization and 2 × 2 max-pooling to reduce spatial dimensions while retaining key features and preventing overfitting. Extracted features are then processed by the classification head, which includes dense layers with 128 and 64 units, respectively, employing ReLU activation and dropout rates of 0.5 for regularization. The final dense layer comprises 6 activation units corresponding to the six target classes.
The model is flexible for both single-label and multi-label classification. Single-label classification uses a binary categorical cross-entropy loss function and a softmax activation function in the output layer. For the multi-label classification, a sigmoid activation function is used for each output neuron with a binary cross-entropy loss function. The flexible classification output layer can switch between softmax and sigmoid activations based on the specific task. This architecture effectively combines SAR and optical imagery data to create a robust and accurate classifier, ensuring high accuracy and generalization through efficient feature extraction and regularization methods. An overview of the proposed Early Fusion model is depicted in
Figure 2. The details of layers and filters used in the Early Fusion model are mentioned in
Table 1.
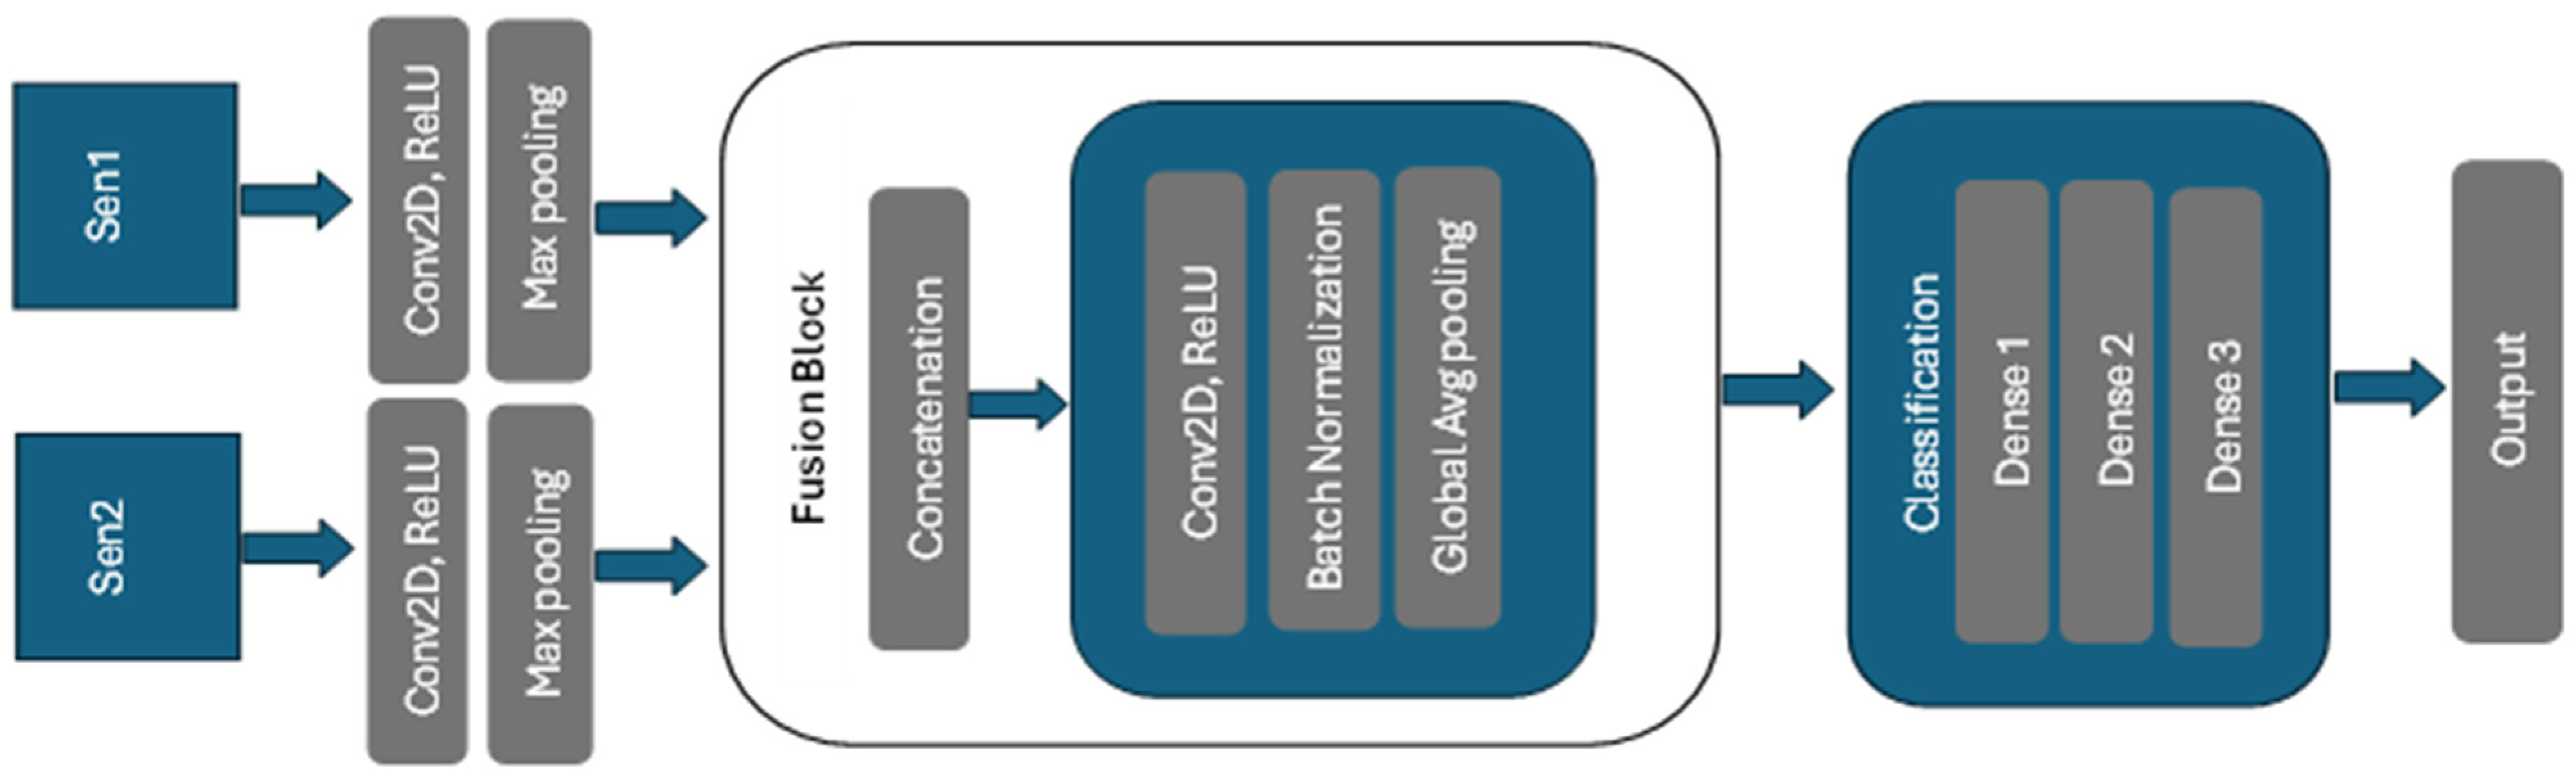
3.2. Late Fusion
The Late Fusion model is designed with separate feature extraction pathways for optical and Synthetic Aperture Radar (SAR) imagery which are later fused to optimize the classification of images into six distinct classes. The SAR pathway processes 2 channels, while the Optical pathway handles 13 multi-spectral channels. Both paths start with a Conv2D layer comprising 32 filters, ReLU activation, a 3 × 3 kernel, and the same padding, followed by a MaxPooling2D layer with a 2 × 2 pool size. During the Late Fusion stage, outputs from both pathways are concatenated into a combined feature map. The combined map is subsequently processed by another Conv2D layer featuring 64 filters, a 3 × 3 kernel, ReLU activation, and the same padding. This is followed by batch normalization to improve training stability and performance.
A Global Average Pooling2D layer is then applied to reduce the spatial dimensions and effectively summarize the feature maps. The classification head processes these fused and pooled features through dense layers. The first dense layer consists of 128 units with ReLU activation, followed by a dropout layer with a 0.5 rate to mitigate overfitting. Next, a second dense layer with 64 units and ReLU activation is followed by a dropout layer with a rate of 0.5. The output is then passed through a dense layer with 6 units, using either softmax activation for single-label classification with binary categorical cross-entropy loss or sigmoid activation for multi-label classification with binary cross-entropy loss. This setup provides the probability distribution across the six target classes. This architecture ensures that features from both SAR and optical imagery are effectively captured and integrated, resulting in a robust and accurate classifier capable of handling complex multi-channel input data. An overview of the proposed Late Fusion model is depicted in
Figure 3. The details of layers and filters used in the Late Fusion model are in
Table 2.
3.3. Training Settings
In training our deep learning model, we utilize the Adam optimizer [
43] due to its efficiency and adaptive learning rate features, setting the learning rate
to ensure stable convergence. To achieve a balance between model performance and computational efficiency, we use 32 batches. The training duration range is from 50 to 100 epochs, depending on when the model converges allowing for sufficient training time while preventing unnecessary computations. The final number of epochs is set to 100. To ensure proper generalization, 20% of the training data are reserved for validation. We employ early stopping to prevent overfitting, which monitors the validation loss and stops training if there is no improvement within 10 epochs. Additionally, if the validation loss increases a learning rate scheduler decreases the learning rate by a factor of 0.1, with a patience period of 5 epochs. This adaptive approach helps refine the learning process, potentially enhancing performance and expediting convergence.
3.4. Evaluation Metrics
The classification models are evaluated using
for single-label classification and the
for multi-label classification. We report class-wise metrics for six classes, the average of class-wise values, and the overall average across all samples. This approach ensures a fair evaluation, considering the imbalance in class distribution. Equation (1) refers to accuracy and Equation (4) refers to the
. Here,
refers to true positives (correctly classified into the class),
to true negatives (correctly classified into other classes),
to false positives (incorrectly classified into the class), and
to false negatives (incorrectly classified into other classes).
4. Results
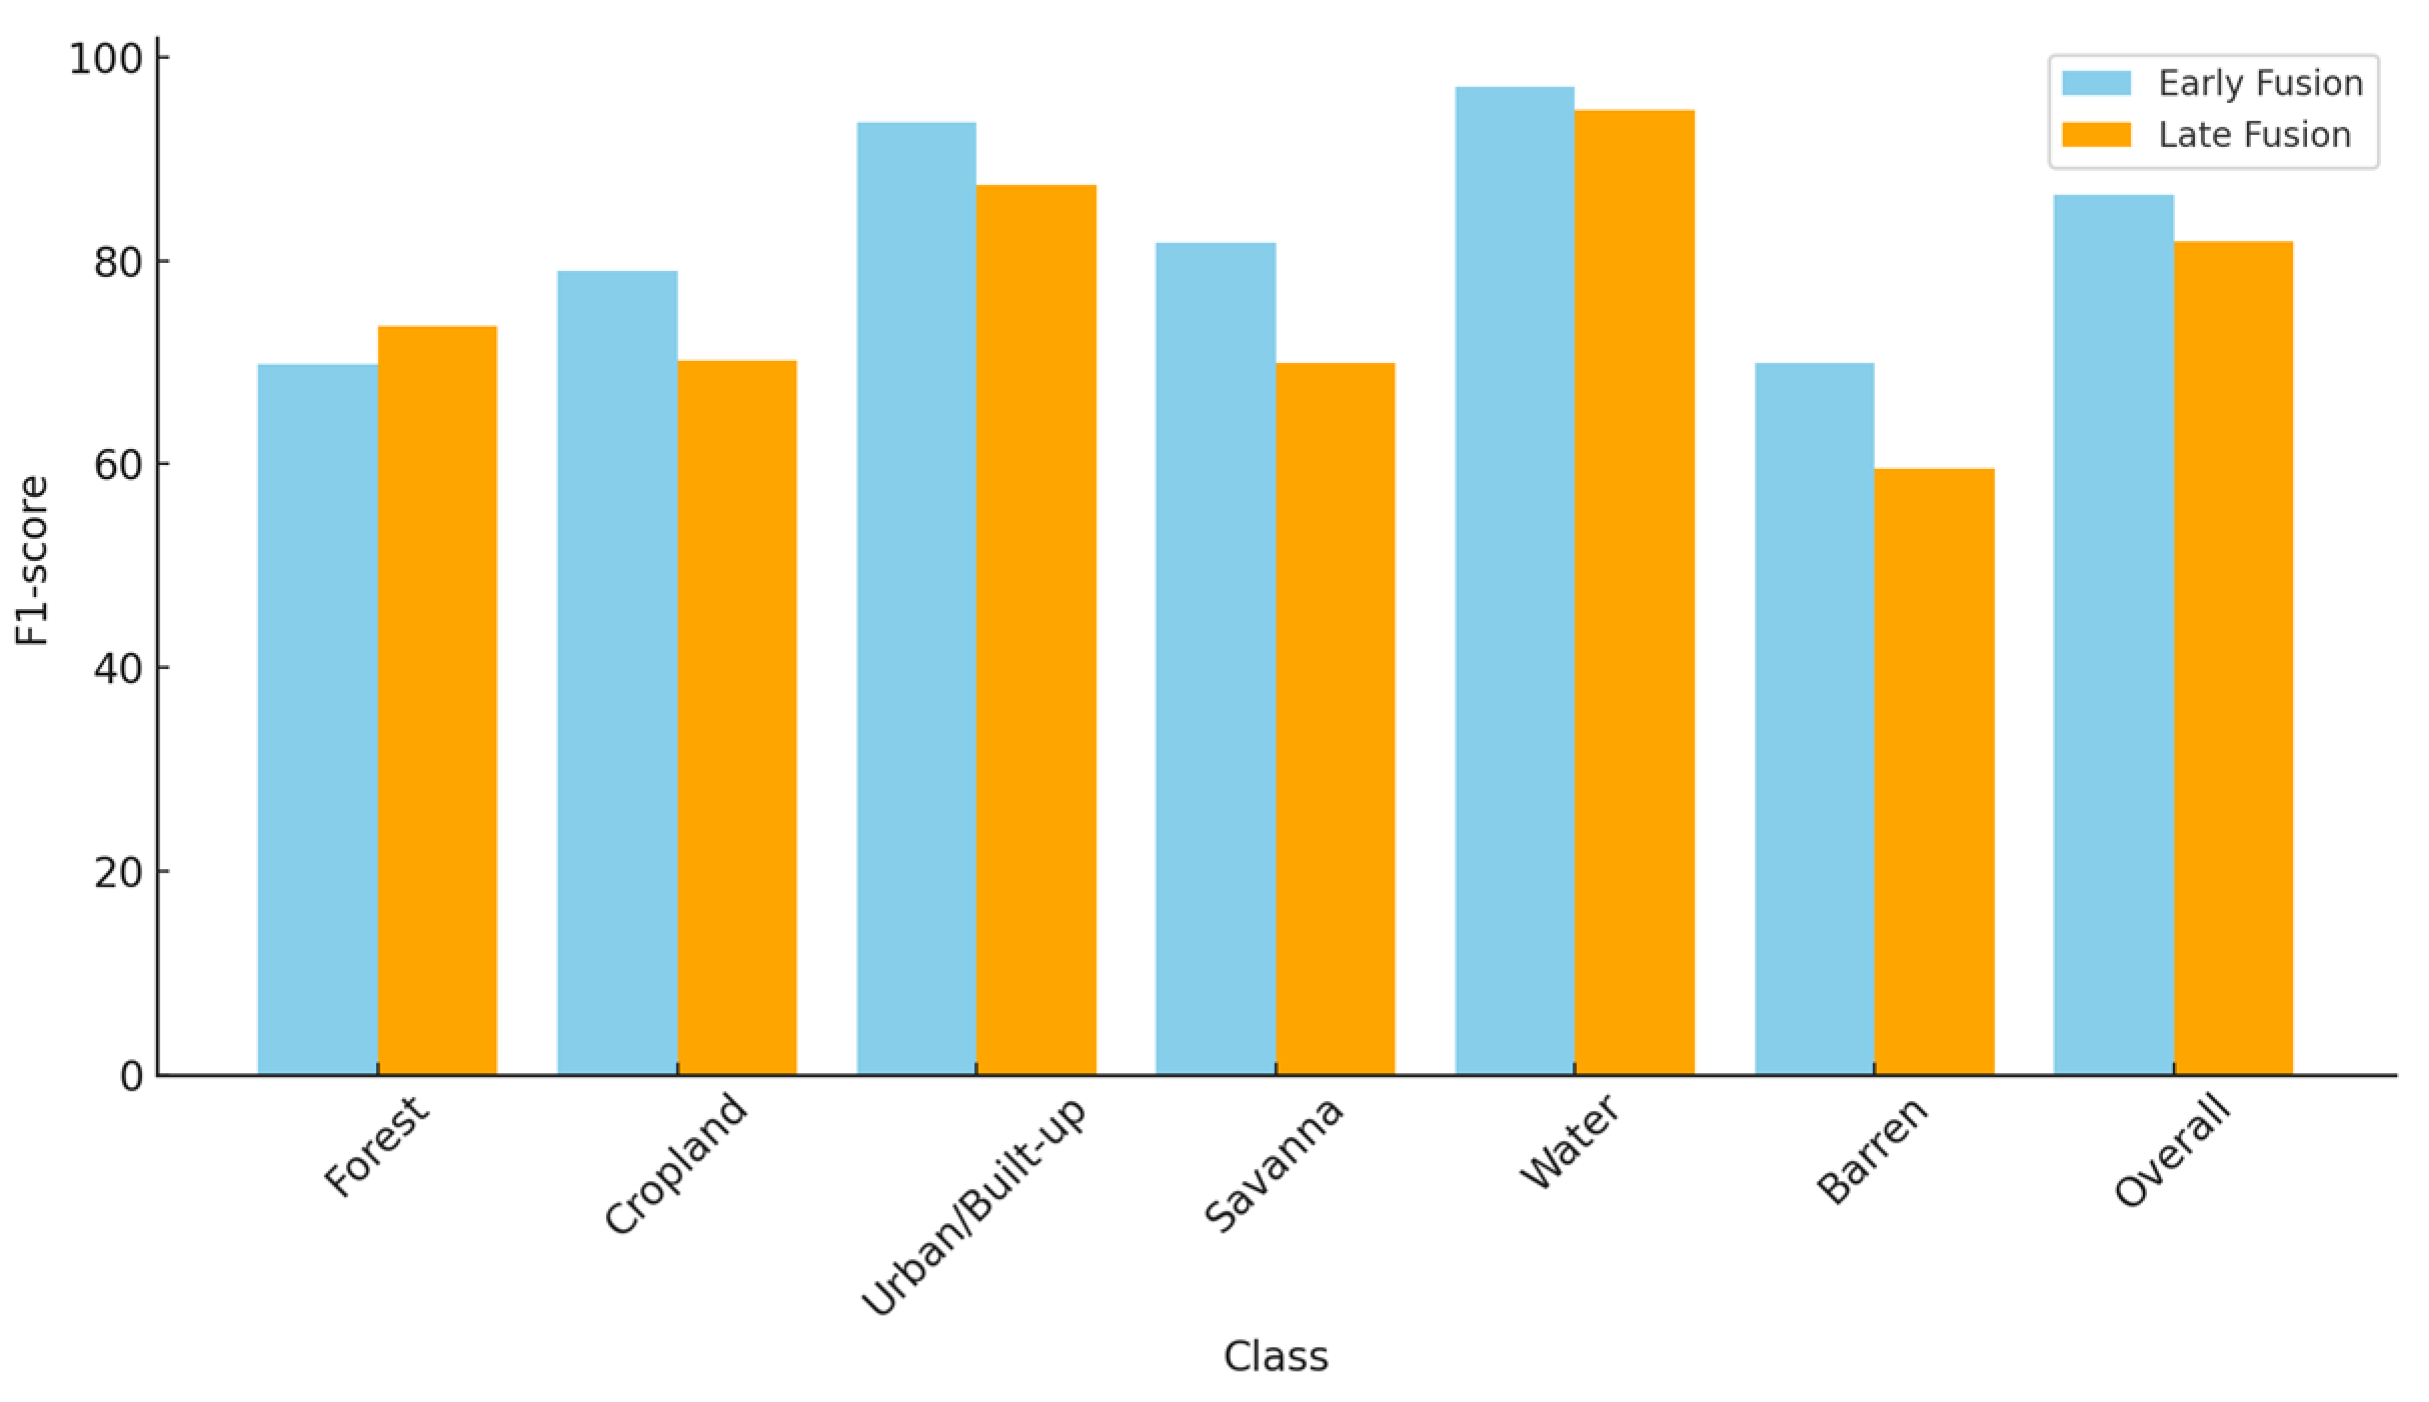
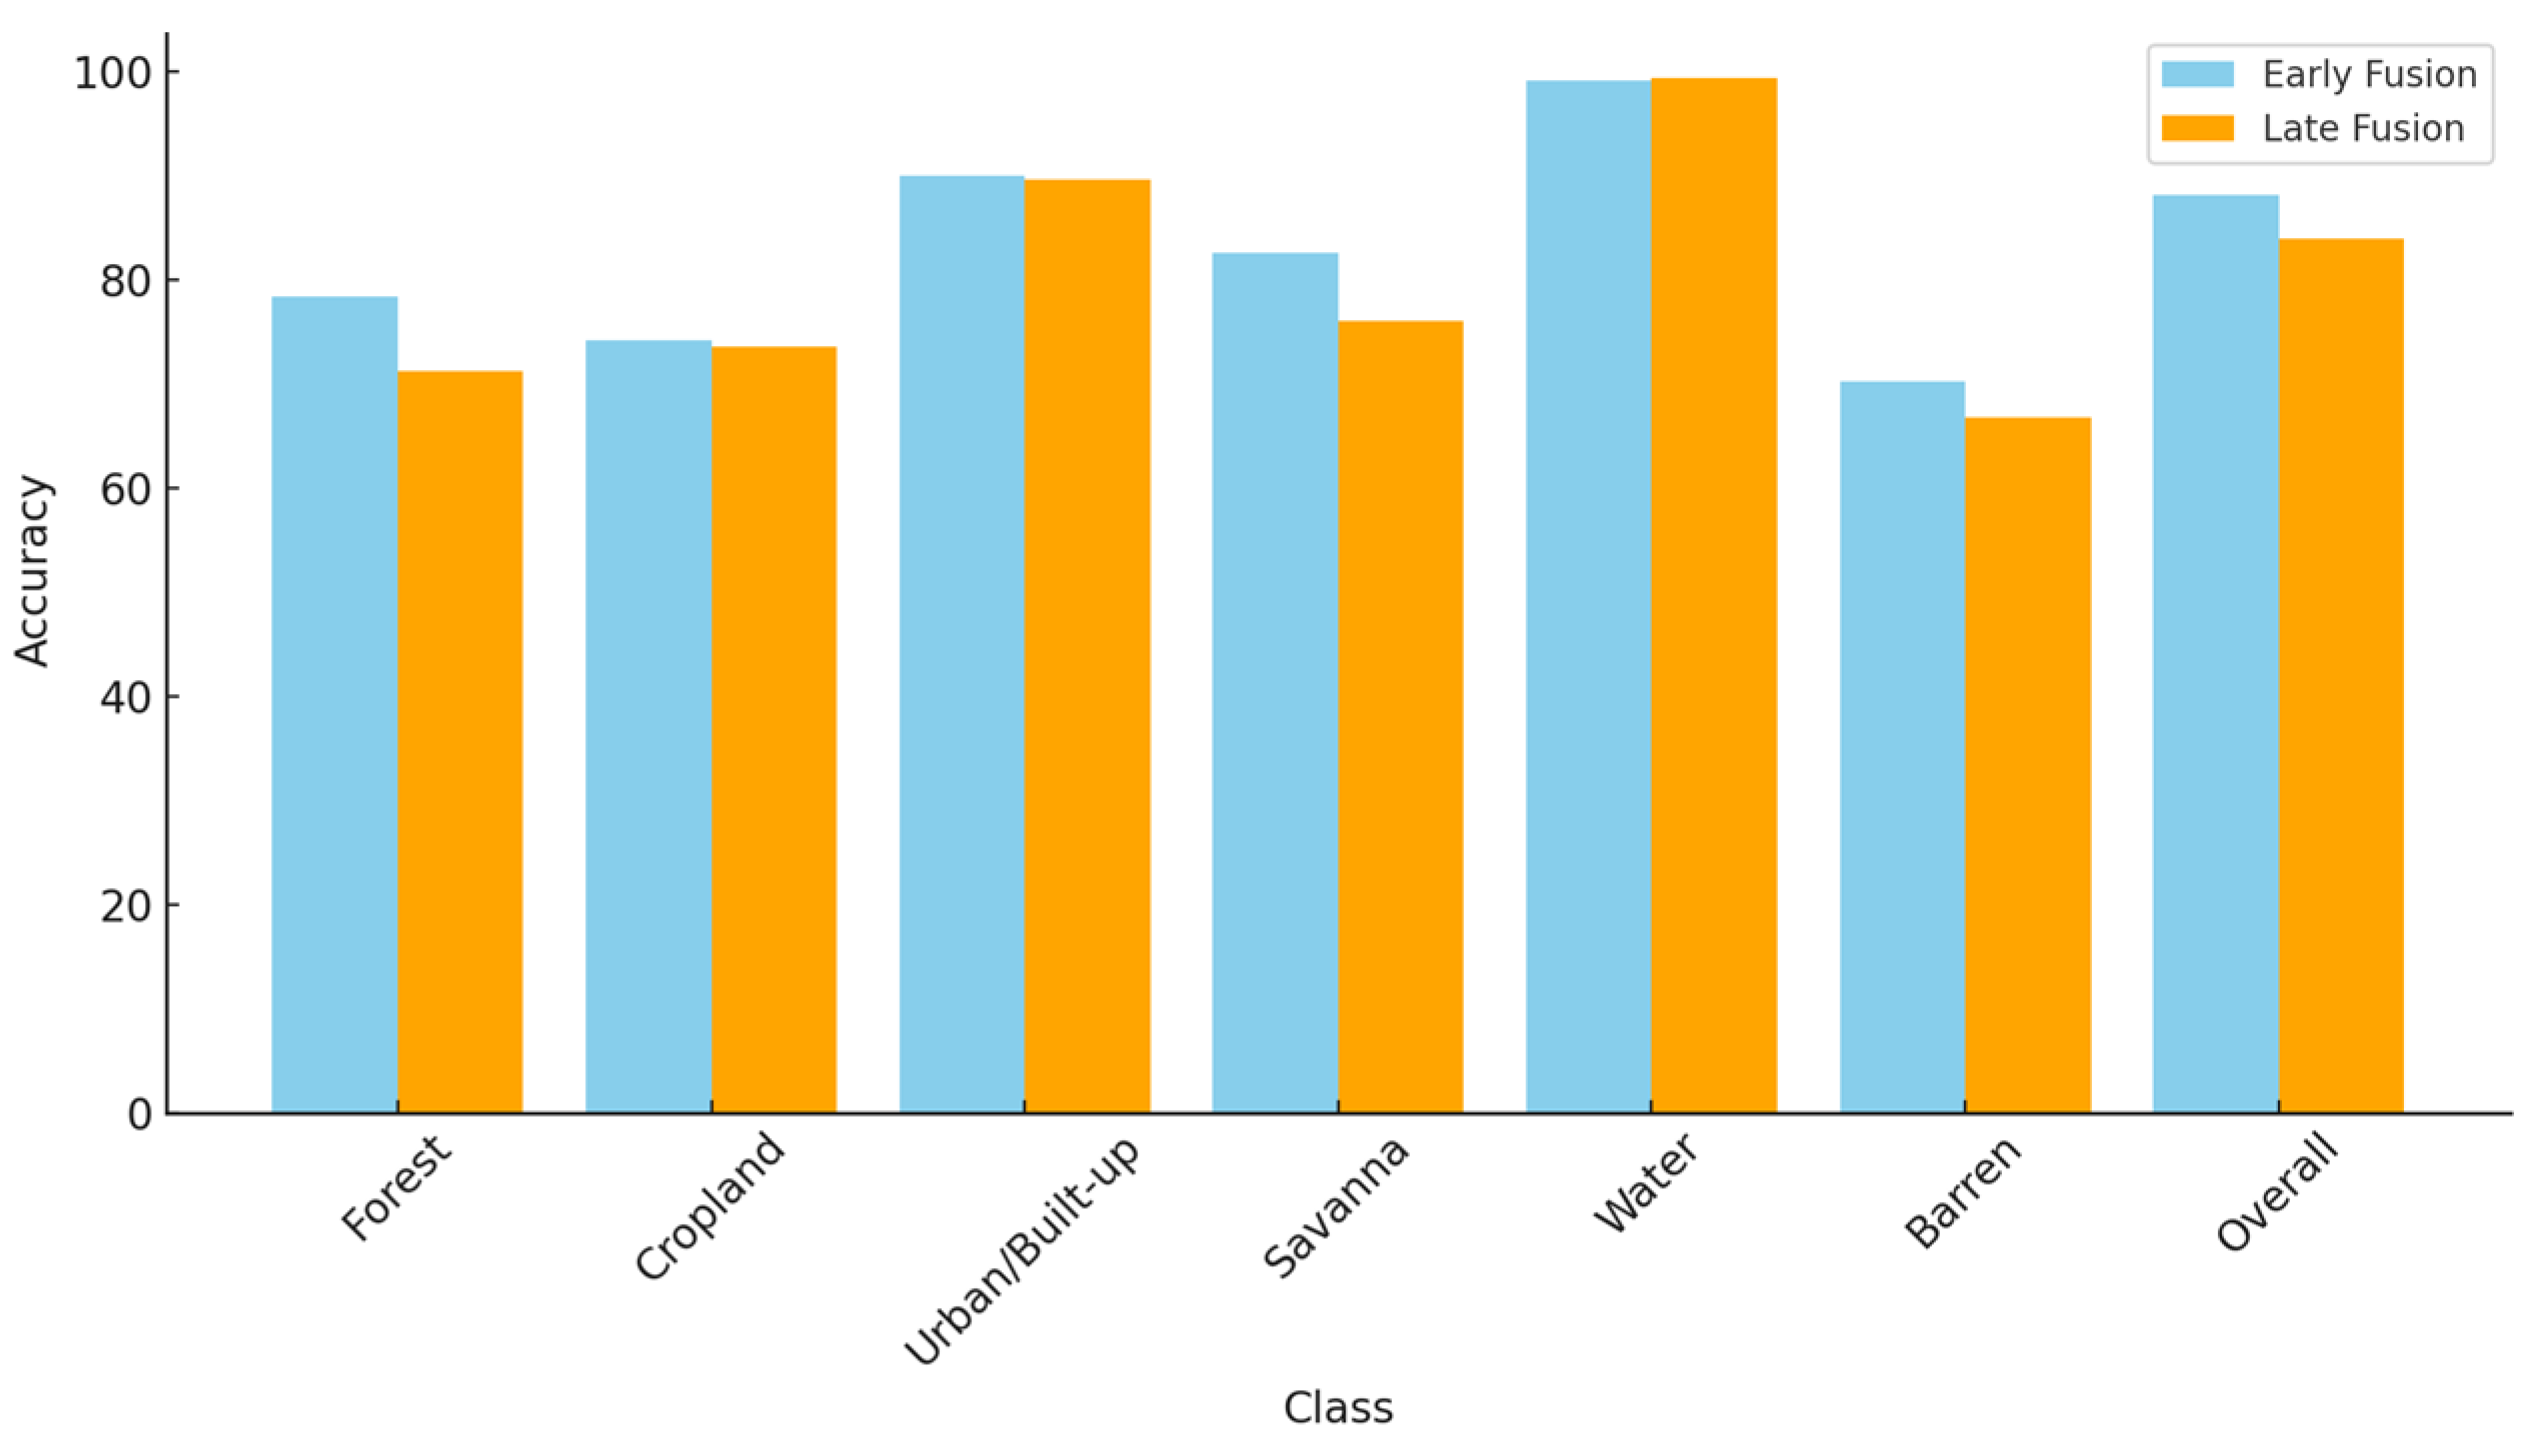
The fusion model, incorporating Sentinel-1 and Sentinel-2 data, was evaluated using Early and Late Fusion strategies. Overall, the Early Fusion strategy outperforms the Late Fusion strategy. Early Fusion achieves an overall accuracy of 88.12%, compared to 83.96% for Late Fusion. Similarly, the overall F1 score for Early Fusion is 86.53%, while Late Fusion records 81.87%. These findings indicate that Early Fusion provides more precise and dependable scene-based classifications across various land types. The F1 score and accuracy achieved for each class are depicted in
Figure 4 and
Figure 5. Examples of predicted images are shown in
Table 3.
According to each class’s accuracy and F1 score, Water emerges as the top-performing class in both the Early Fusion and Late Fusion strategies, demonstrating exceptional accuracy and F1 scores of approximately 94% or higher. Early Fusion maintains a particularly robust F1 score of 97.10%, highlighting its effectiveness in accurately identifying water bodies within multi-class scene classification tasks. In contrast, barren areas show subpar performance across both fusion strategies, achieving accuracies ranging from 66.79% to 70.18% and F1 scores below 70%. Late Fusion notably struggles more with barren land classification, reflected in its lower F1 score of 59.51%. The Forest class exhibits varied performance between the two strategies. Early Fusion achieves a higher accuracy at 78.36% but a lower F1 score of 69.83%, suggesting difficulties in precise forested area classification.
In contrast, Late Fusion achieves a higher F1 score of 73.59% but a lower accuracy of 71.15%, indicating a different balance between precision and recall compared with Early Fusion. Built-up areas perform very well with both fusion strategies, achieving high accuracy levels over 89% and F1 scores above 87%. Early Fusion shows slightly better performance in both metrics for this class. Cropland and Savanna achieve average results: Cropland achieves an F1 score of 78.98% with Early Fusion while Late Fusion have a slightly lower F1 score of 70.22%, and both strategies maintain an accuracy above 73%. The Savanna class performs reasonably well, achieving over 75% accuracy in both strategies, but Late Fusion faces more challenges, attaining an F1 score of 69.99%, which indicates difficulty in balancing precision and recall for this class. The analysis shows that Early Fusion generally outperforms Late Fusion in both accuracy and F1 score across most land cover classes, as well as in overall performance. However, specific classes like Forest and Water exhibit higher F1 scores with the Late Fusion strategy, suggesting that the optimal fusion strategy may depend on the specific application or class. Nonetheless, Early Fusion remains the more effective method for integrating Sentinel-1 and Sentinel-2 data in this context.
Figure 4 presents typical samples of land use and land type classification results. For single-label classification, all land use types are correctly classified by both the Early and Late Fusion strategies. For multi-label classification, Cropland and Savanna are often misclassified due to their similar features, while the Late Fusion strategy misclassifies Forest as Water because of its dark appearance.
Next, the classification performance of the proposed method is compared with existing deep learning models including ResNet [
44], VGGNet [
45], and GoogleNet [
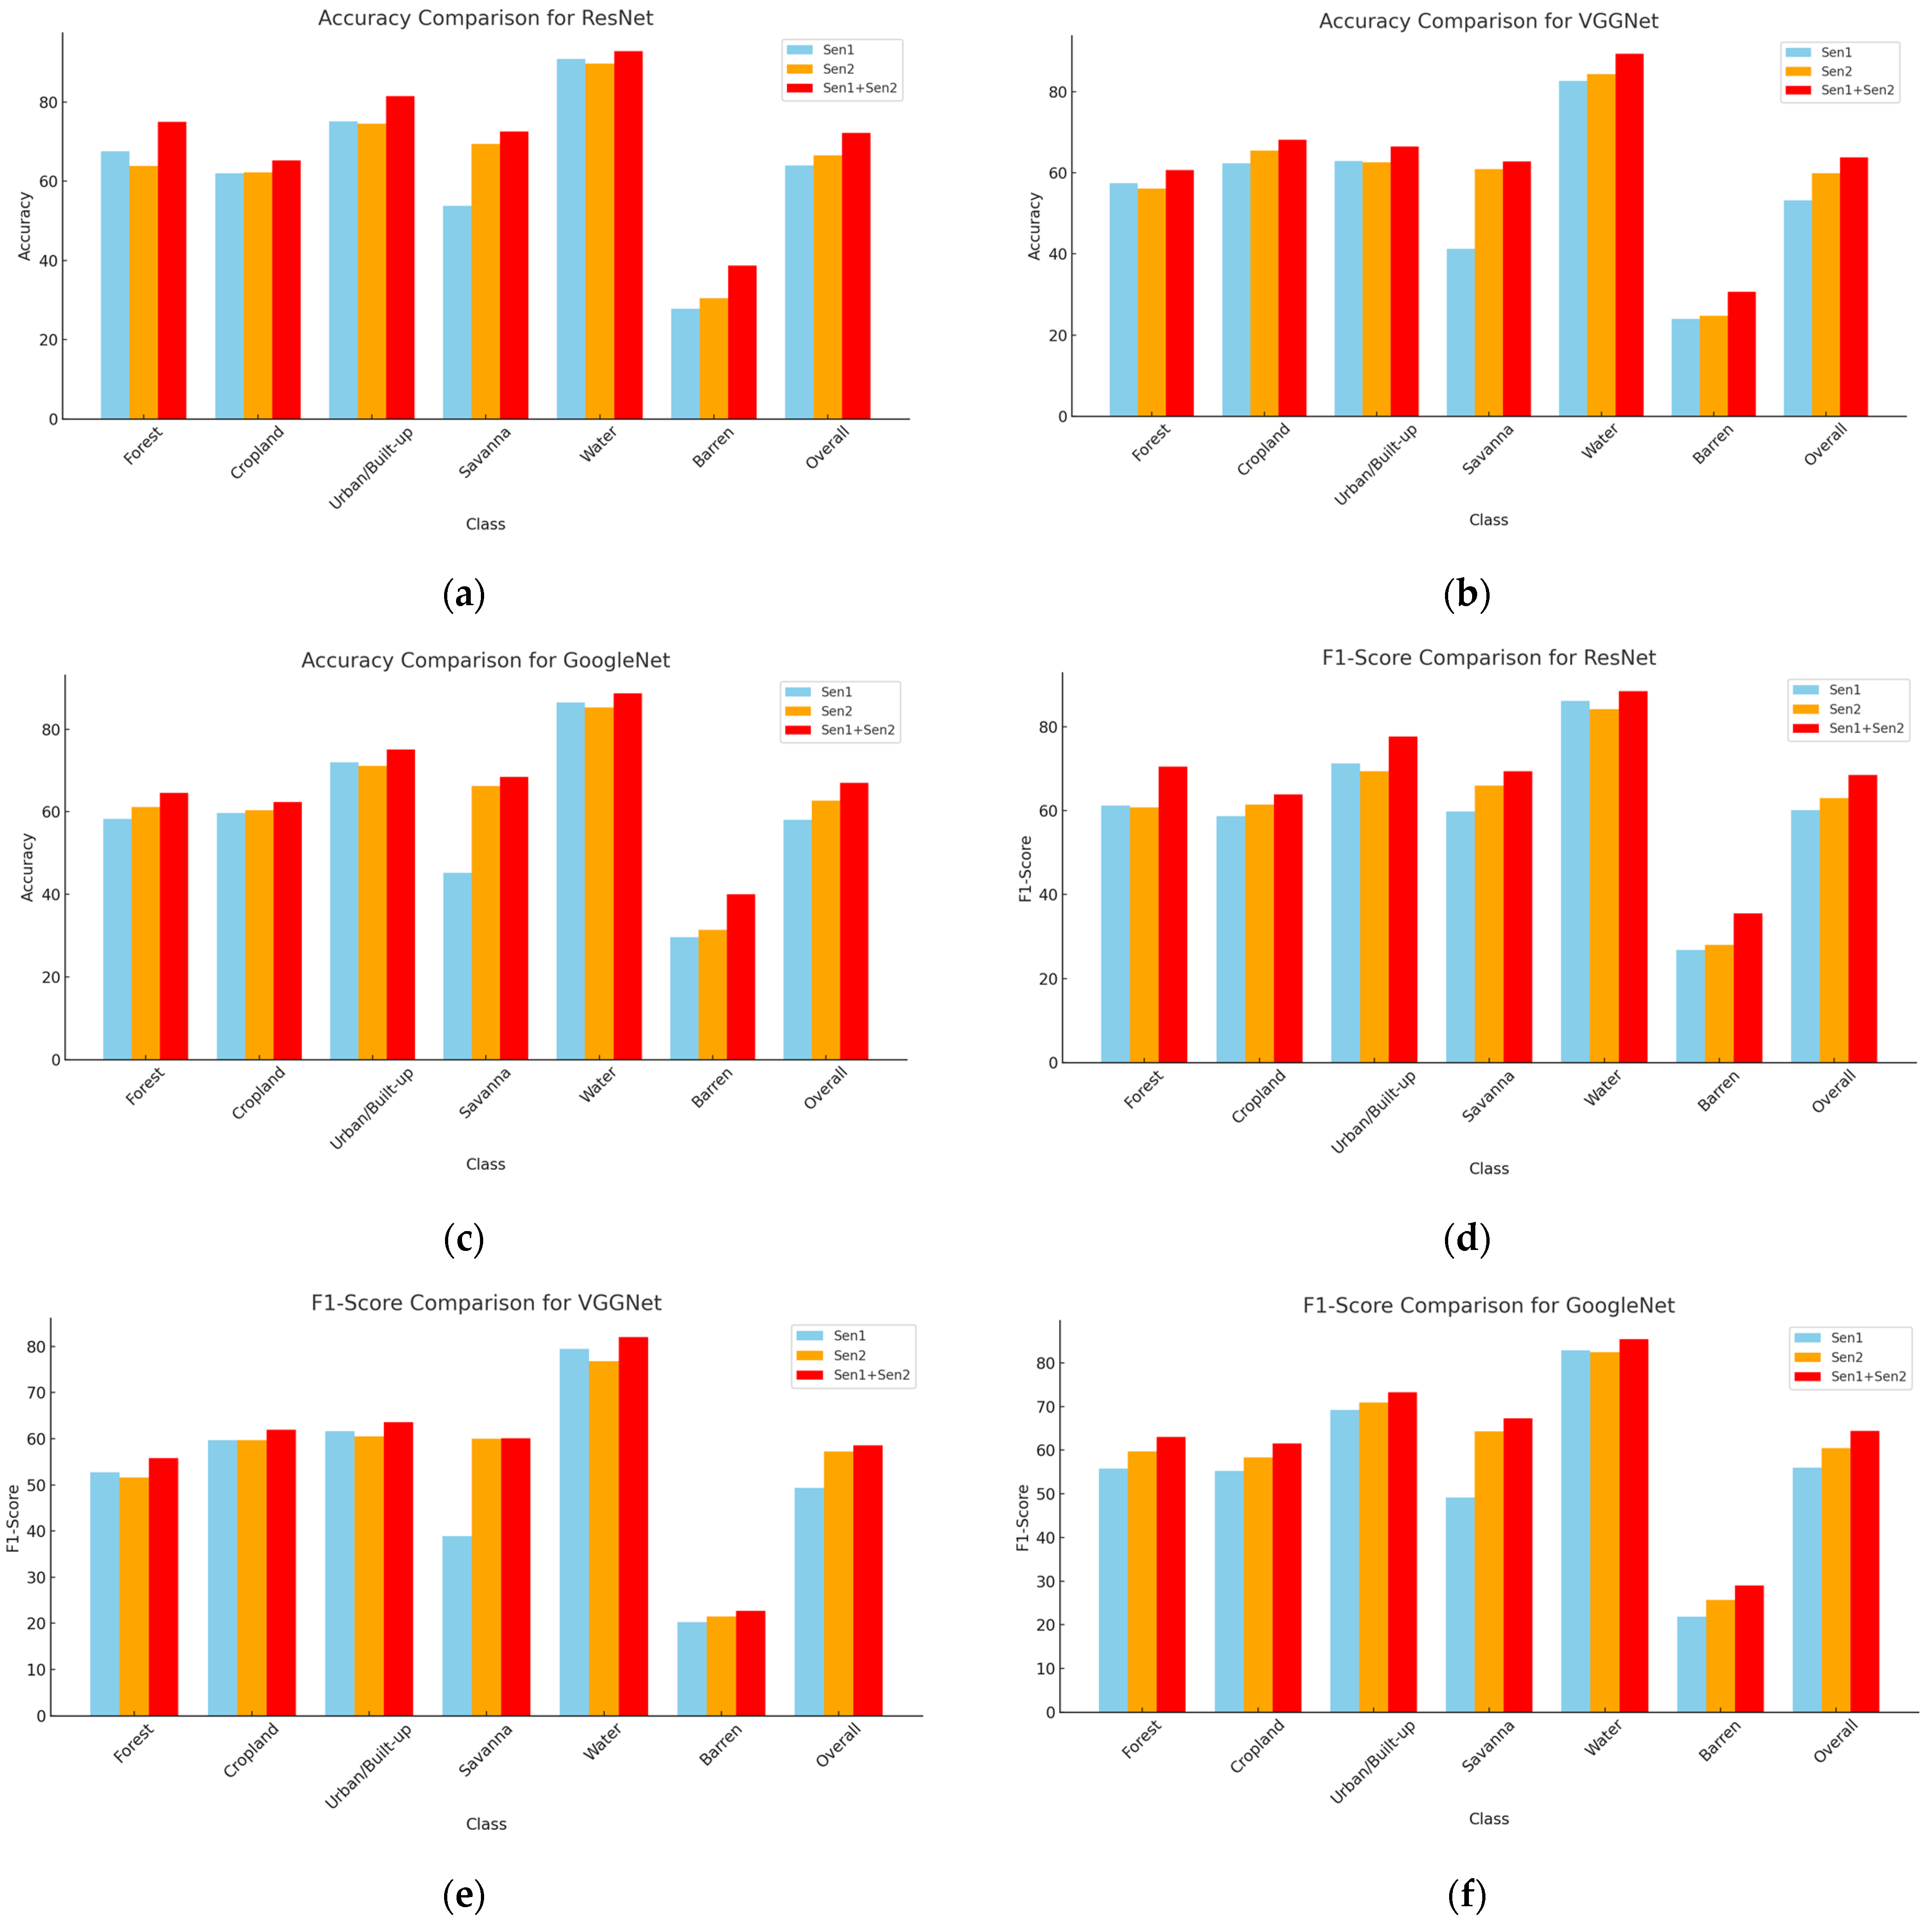
46]. We used the Sentinel-1 (Sen1) and Sentinel-2 (Sen2) datasets individually as the input of these single-source methods. We also used multimodal Sen1+Sen2 imagery on these three models by modifying the input layer to accept multi-channel inputs. For ResNet, we utilized pre-trained weights from ImageNet and fine-tuned the model on the SAR and optical dataset. For GoogleNet, we adapted the input layer to handle multi-channel data and modified specific inception modules to emphasize feature extraction of SAR and optical data.
Similarly, for VGGNet, we modified the input layer for the SAR and optical channels and fine-tuned the model with a lower learning rate to enhance its performance on the SAR and optical dataset. We compared their performance to the multisource fusion method proposed in this study for land type classification. We utilized pre-trained models, adjusted them based on the dataset, and fine-tuned the hyperparameters to suit our needs. The single- and multi-label imagery ResNet demonstrated higher accuracy than GoogleNet and VGGNet. However, the existing models did not perform as well overall compared to the proposed fusion method. ResNet achieved approximately 64% accuracy, whereas GoogleNet and VGGNet scored 58% and 53% on the Sen1 dataset, respectively. On the Sen2 dataset, ResNet attained around 66% accuracy, with GoogleNet and VGGNet achieving 62% and 59%, respectively. With the multisource input, the ResNet model recorded about 72% accuracy, while GoogleNet and VGGNet reached around 63% and 60%, respectively. The details of the results obtained by existing models are displayed in
Figure 6 and the overall results of the existing and proposed models are included in
Table 4.
5. Discussion
The classification results demonstrate that the proposed multisource fusion method significantly surpasses existing deep learning models, including ResNet, GoogleNet, and VGGNet, in land-type classification tasks involving single-label and multi-label imagery. Models trained and fine-tuned on single-source datasets (Sen1 and Sen2) delivered moderate performance, with ResNet consistently outperforming GoogleNet and VGGNet, achieving higher accuracy across most land cover classes. However, the single-source approaches struggled to fully exploit the complementary features available in multi-sensor data, resulting in suboptimal outcomes. ResNet achieved accuracy levels of around 64% on Sen1 and 66% on Sen2, with corresponding F1 score improvements. In comparison, GoogleNet and VGGNet yielded lower accuracies, ranging from 53% to 62% across the datasets. Despite ResNet’s relatively better performance, the limitations of single-source methods became evident, as relying solely on individual sensor data restricted the ability to generalize across diverse land cover types.
Conversely, the proposed Early Fusion and Late Fusion strategies produced notable improvements by integrating multi-sensor data at different stages of the learning process. Early Fusion, in particular, achieved an overall accuracy of 88.12% and an F1 score of 86.53%, significantly surpassing ResNet’s best performance on combined datasets (72.15% accuracy and 68.54% F1 score). This highlights the critical importance of feature-level integration for effectively leveraging complementary spatial and spectral information. The class-level analysis further emphasizes the superiority of the fusion approach. The fusion strategies dramatically enhanced classification accuracy for challenging categories such as Barren and Forest, where single-source models performed poorly. Early Fusion, for instance, improved Barren classification accuracy from 38.67% (ResNet) to 70.18%, showcasing its effectiveness in resolving ambiguities in less distinct classes. Additionally, for high-performing classes such as Water and Urban/Built-up, the fusion method produced even more refined results, achieving near-perfect accuracy and F1 scores. These outcomes highlight the transformative potential of multisource fusion techniques. Current deep learning models also face challenges in multisource data fusion. VGGNet has a limited capacity to capture multiscale features and is computationally intensive. The inception modules of GoogleNet struggle to effectively capture SAR-specific features, while ResNet is a powerful model that tends to overfit during certain iterations when using both SAR and Optical data together. By capturing complementary features from multi-sensor data, the fusion strategies not only enhance classification accuracy but also improve robustness across diverse and challenging land cover scenarios.
Overall, the proposed fusion approaches perform well on single-label and multi-label data. The Water, Built-up, and Cropland categories consistently achieve high accuracy and F1 scores across both fusion strategies, demonstrating strong classification performance. In contrast, the Barren, Savanna, and Forest categories exhibit more variability, with some metrics indicating fluctuation in accurate classification and balanced precision and recall. These findings emphasize the strengths of the Early Fusion strategy as compared to the Late Fusion strategy in classifying various land use/ land cover types using Sentinel-1 and Sentinel-2 data.
Early Fusion outperforms Late Fusion because SAR and optical images contain complementary information. The proposed Early Fusion model effectively utilizes data from both sensor types to enhance performance. In Early Fusion, SAR and optical images are combined at the input level, allowing the network to extract joint features from both modalities from the beginning. A deep CNN learns to suppress SAR noise by leveraging optical data as contextual information. Since the fusion happens early, the network can identify correlations between optical textures and SAR patterns, which helps reduce noise interference. Neural networks excel at distinguishing features when trained on both noisy (SAR) and clean (optical) inputs simultaneously. This allows the model to prioritize relevant optical features while naturally mitigating SAR noise. In contrast, Late Fusion first extracts features from SAR and optical data separately before combining them. This approach presents challenges. Since SAR noise remains present during feature extraction, the SAR branch learns less discriminative and noisier representations. Meanwhile, the optical branch extracts clean features, but early interaction does not occur between the two modalities. As a result, when fusion happens later, the model integrates high-quality optical features with noisy SAR features, ultimately leading to reduced classification accuracy. Early Fusion enables the model to capture cross-modality relationships from the beginning. By integrating SAR data at an early stage, specific features in the SAR data better complement spectral features in the optical data, allowing the model to learn not only modality-specific features but also those that arise from their interaction, resulting in more robust feature representations that improve classification accuracy. In Late Fusion, SAR and optical data are processed independently before being combined at a later stage. This method maintains the unique properties of each modality while restricting the network’s capacity to effectively utilize cross-modal interactions. Since fusion occurs only after feature extraction, the model may miss important shared information, leading to less efficient multimodal learning.


