
Deformation Monitoring Exploration of Different Elevations in Western Sichuan, China

 ,
,
Abstract

1. Introduction
2. Study Area and Data
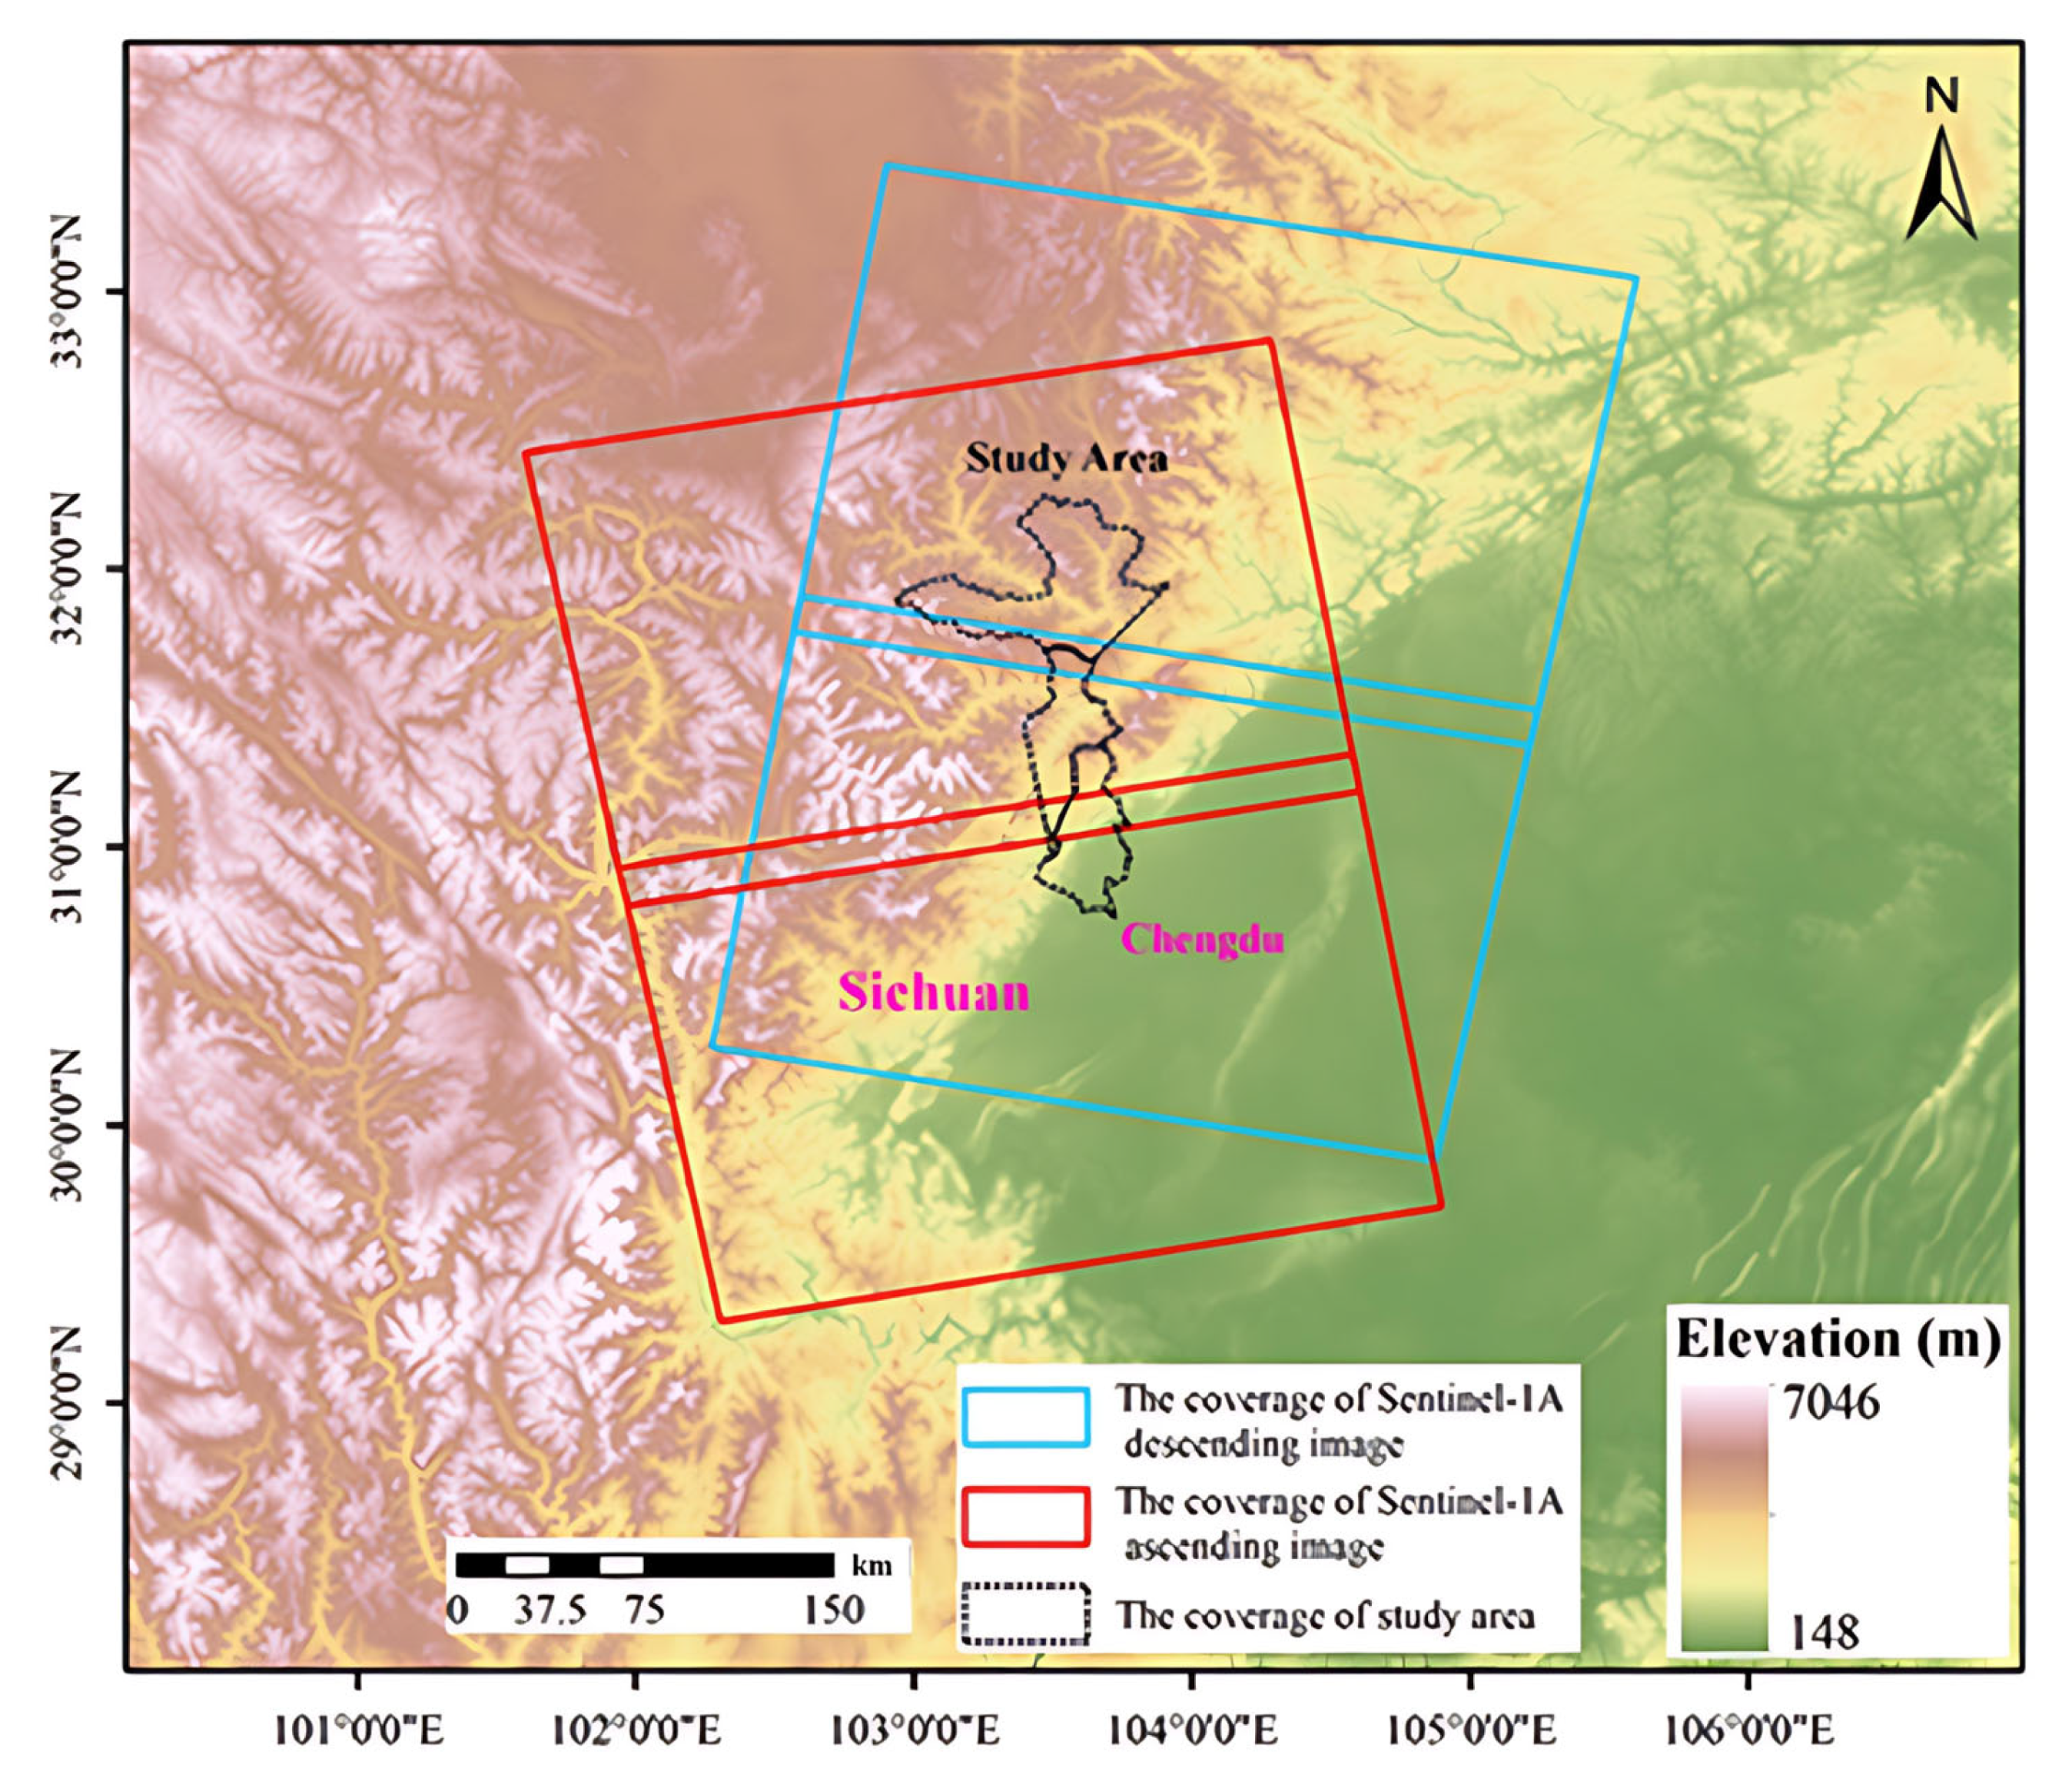
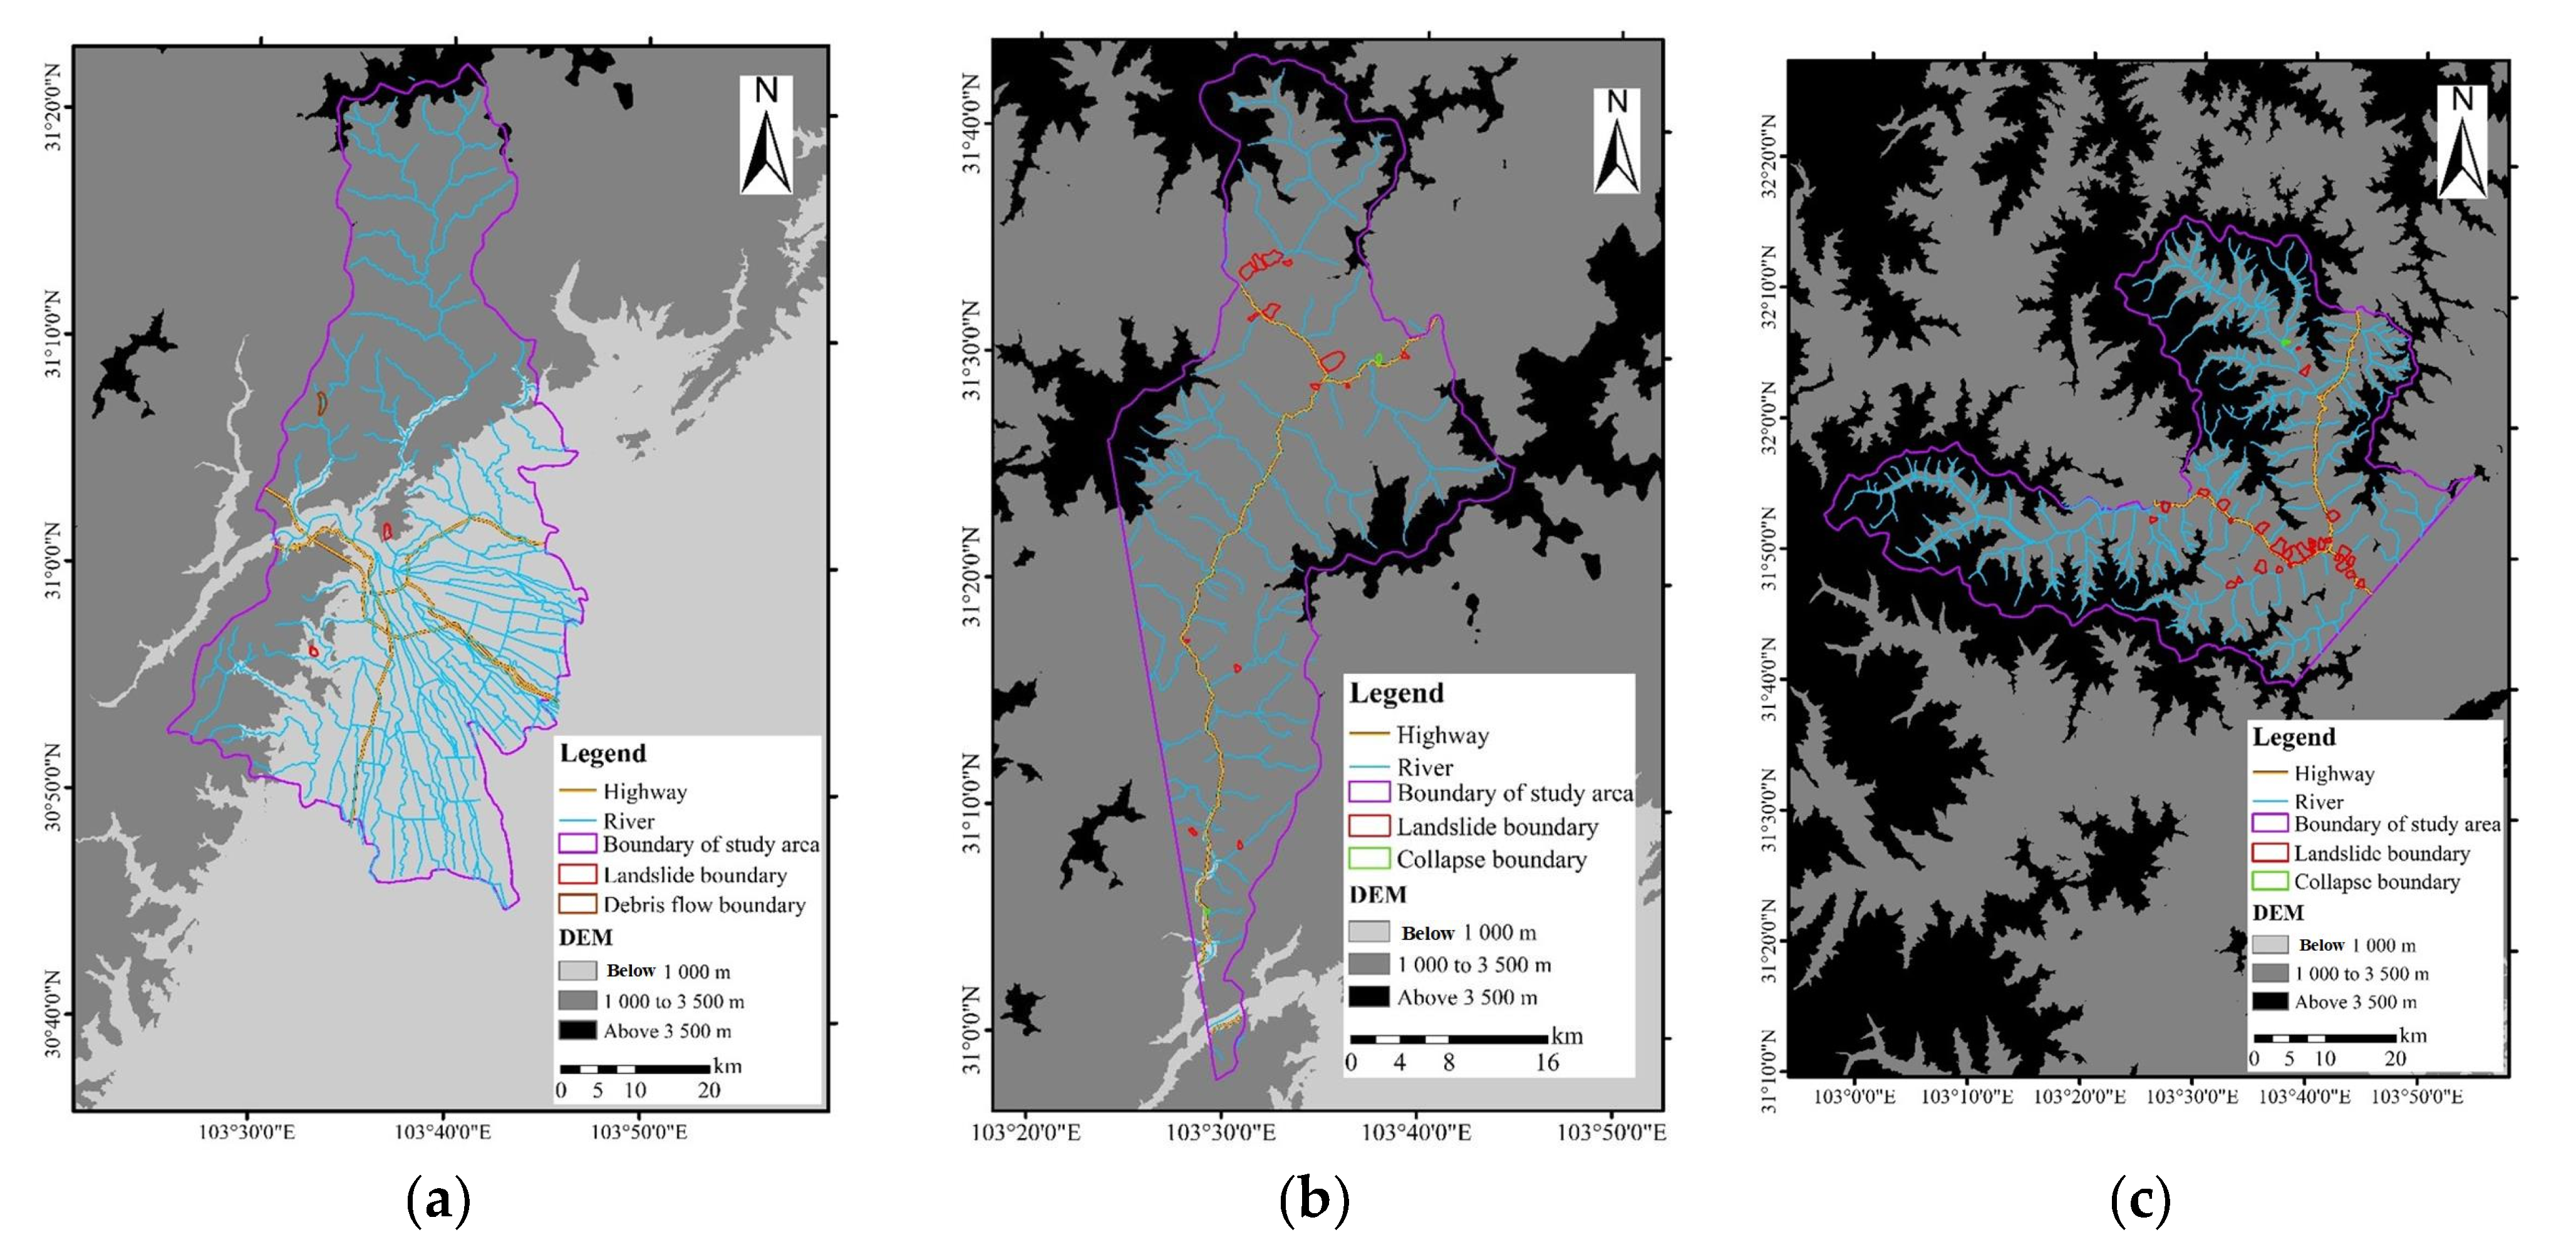
2.1. Study Area
2.2. Data and Processing Tools
3. Method
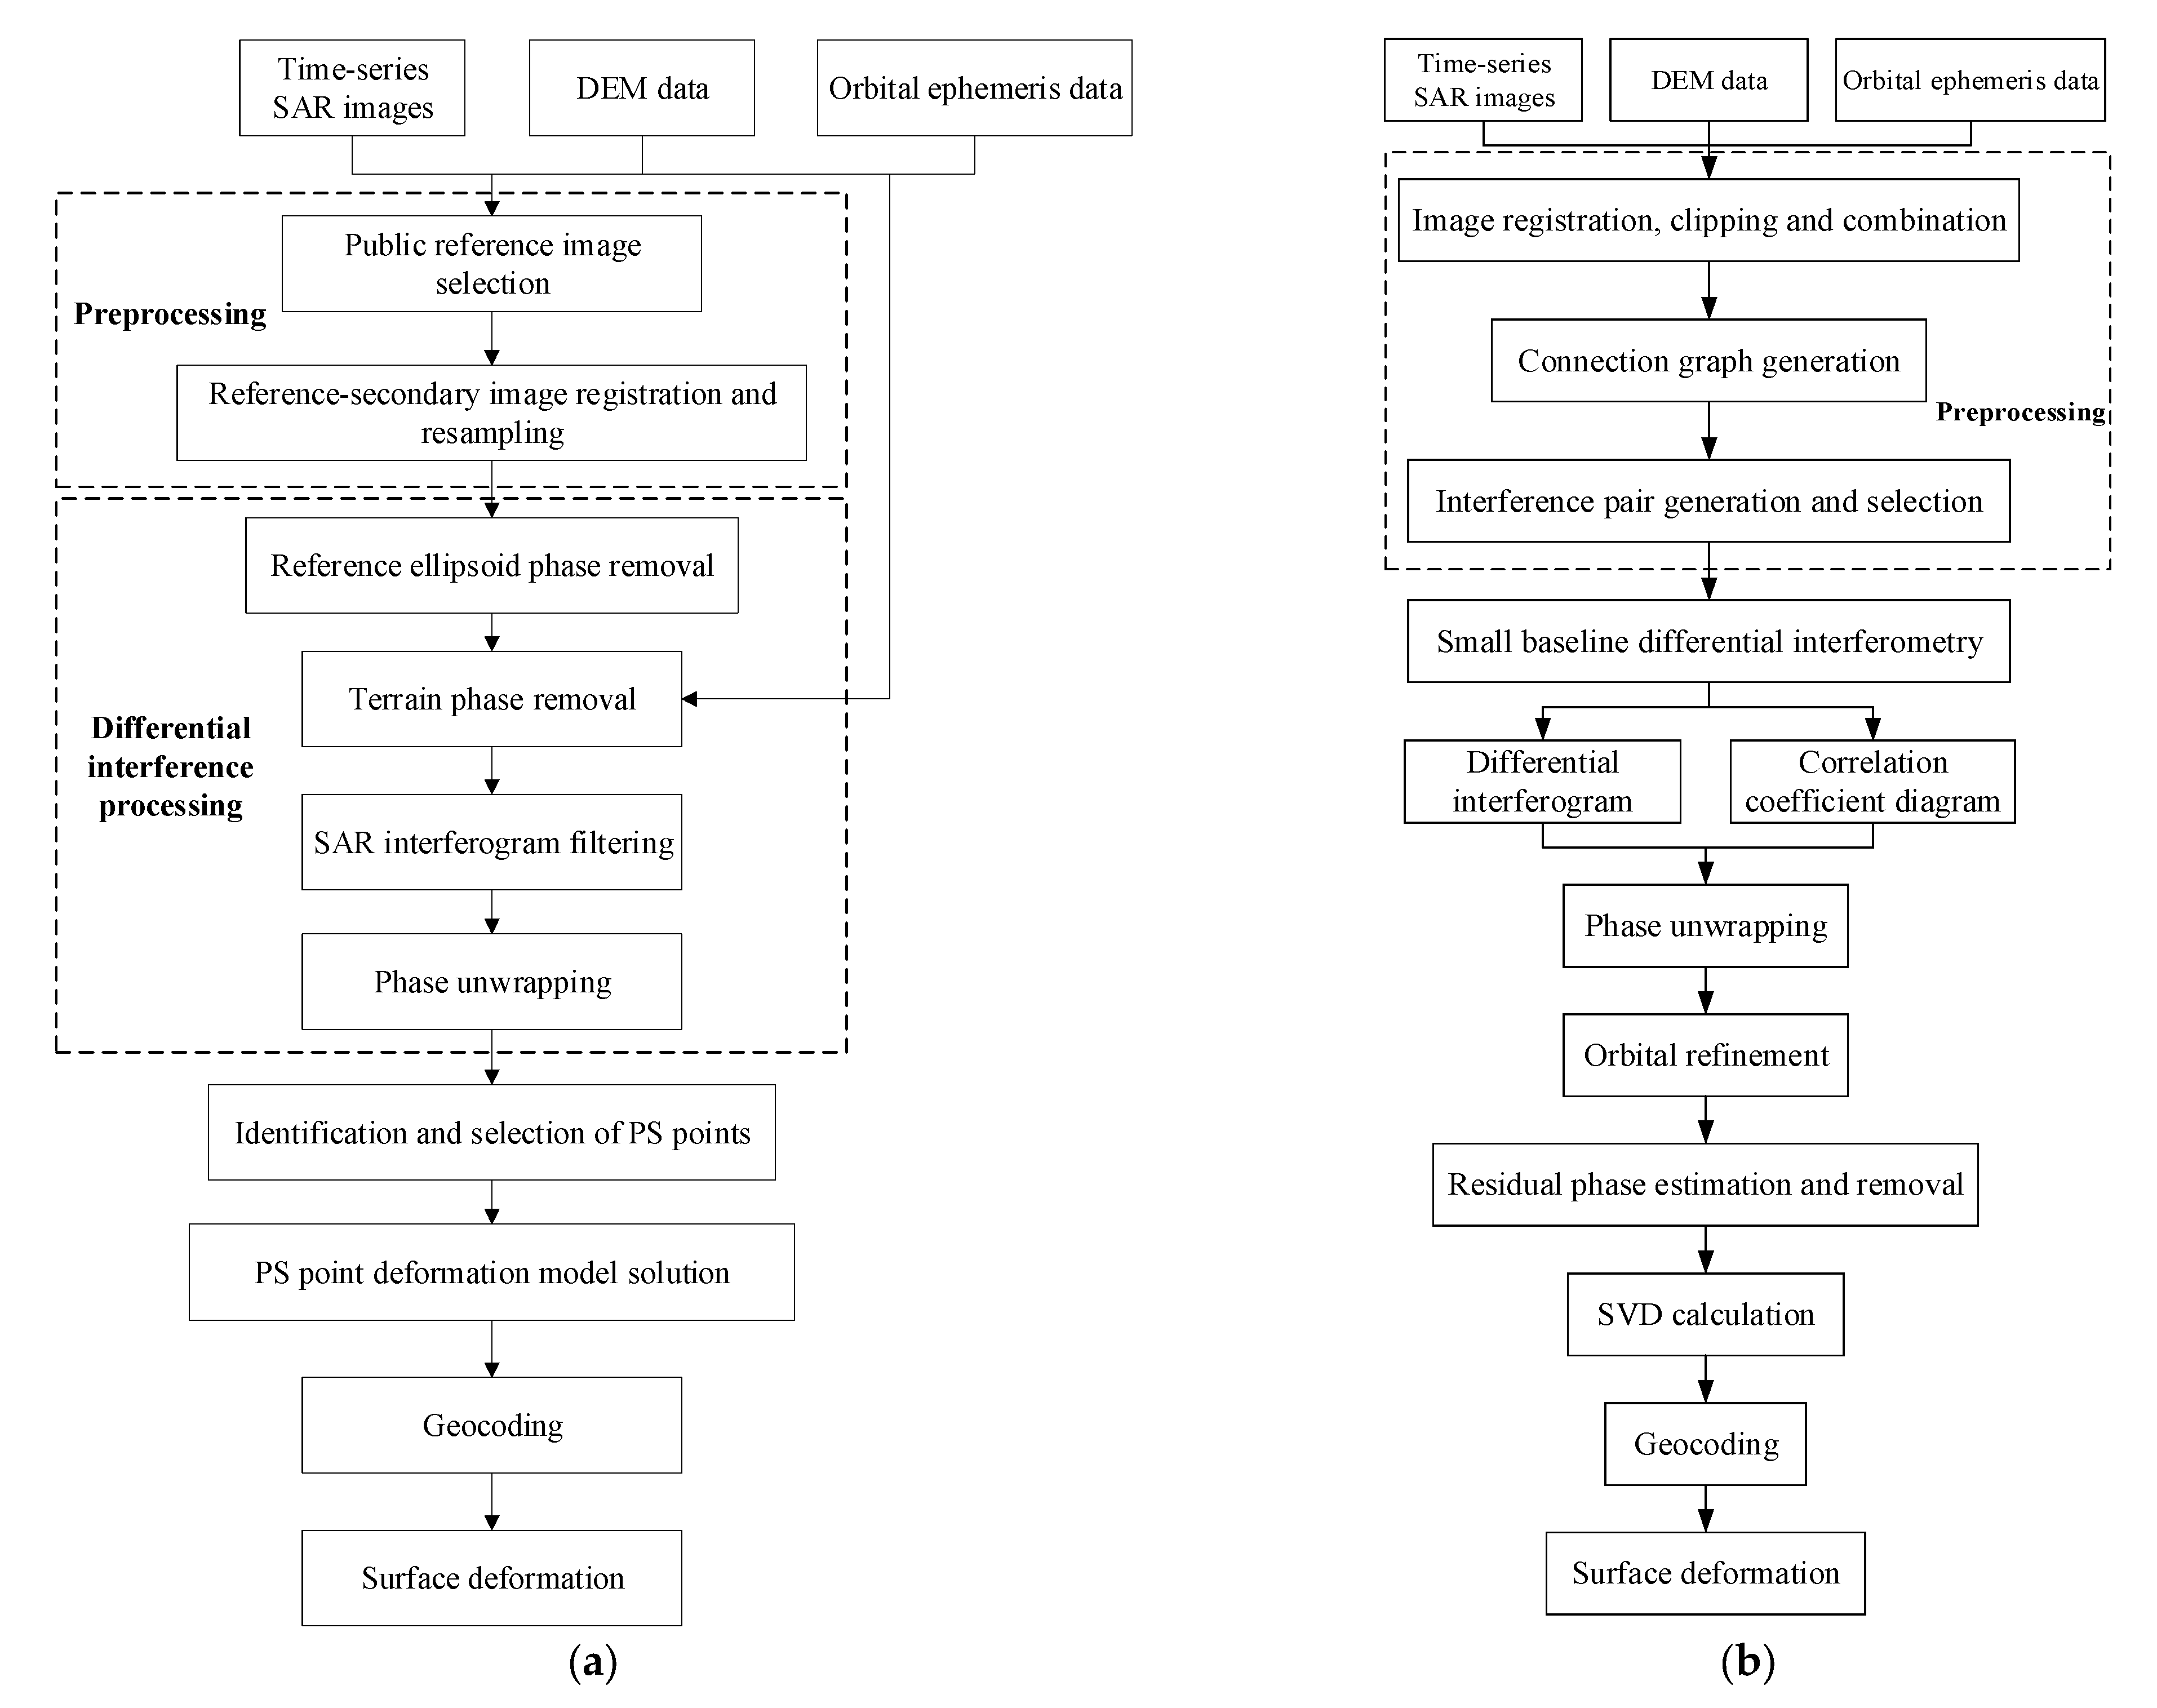
3.1. PS-InSAR
3.2. SBAS-InSAR
3.3. DS-InSAR
4. Results
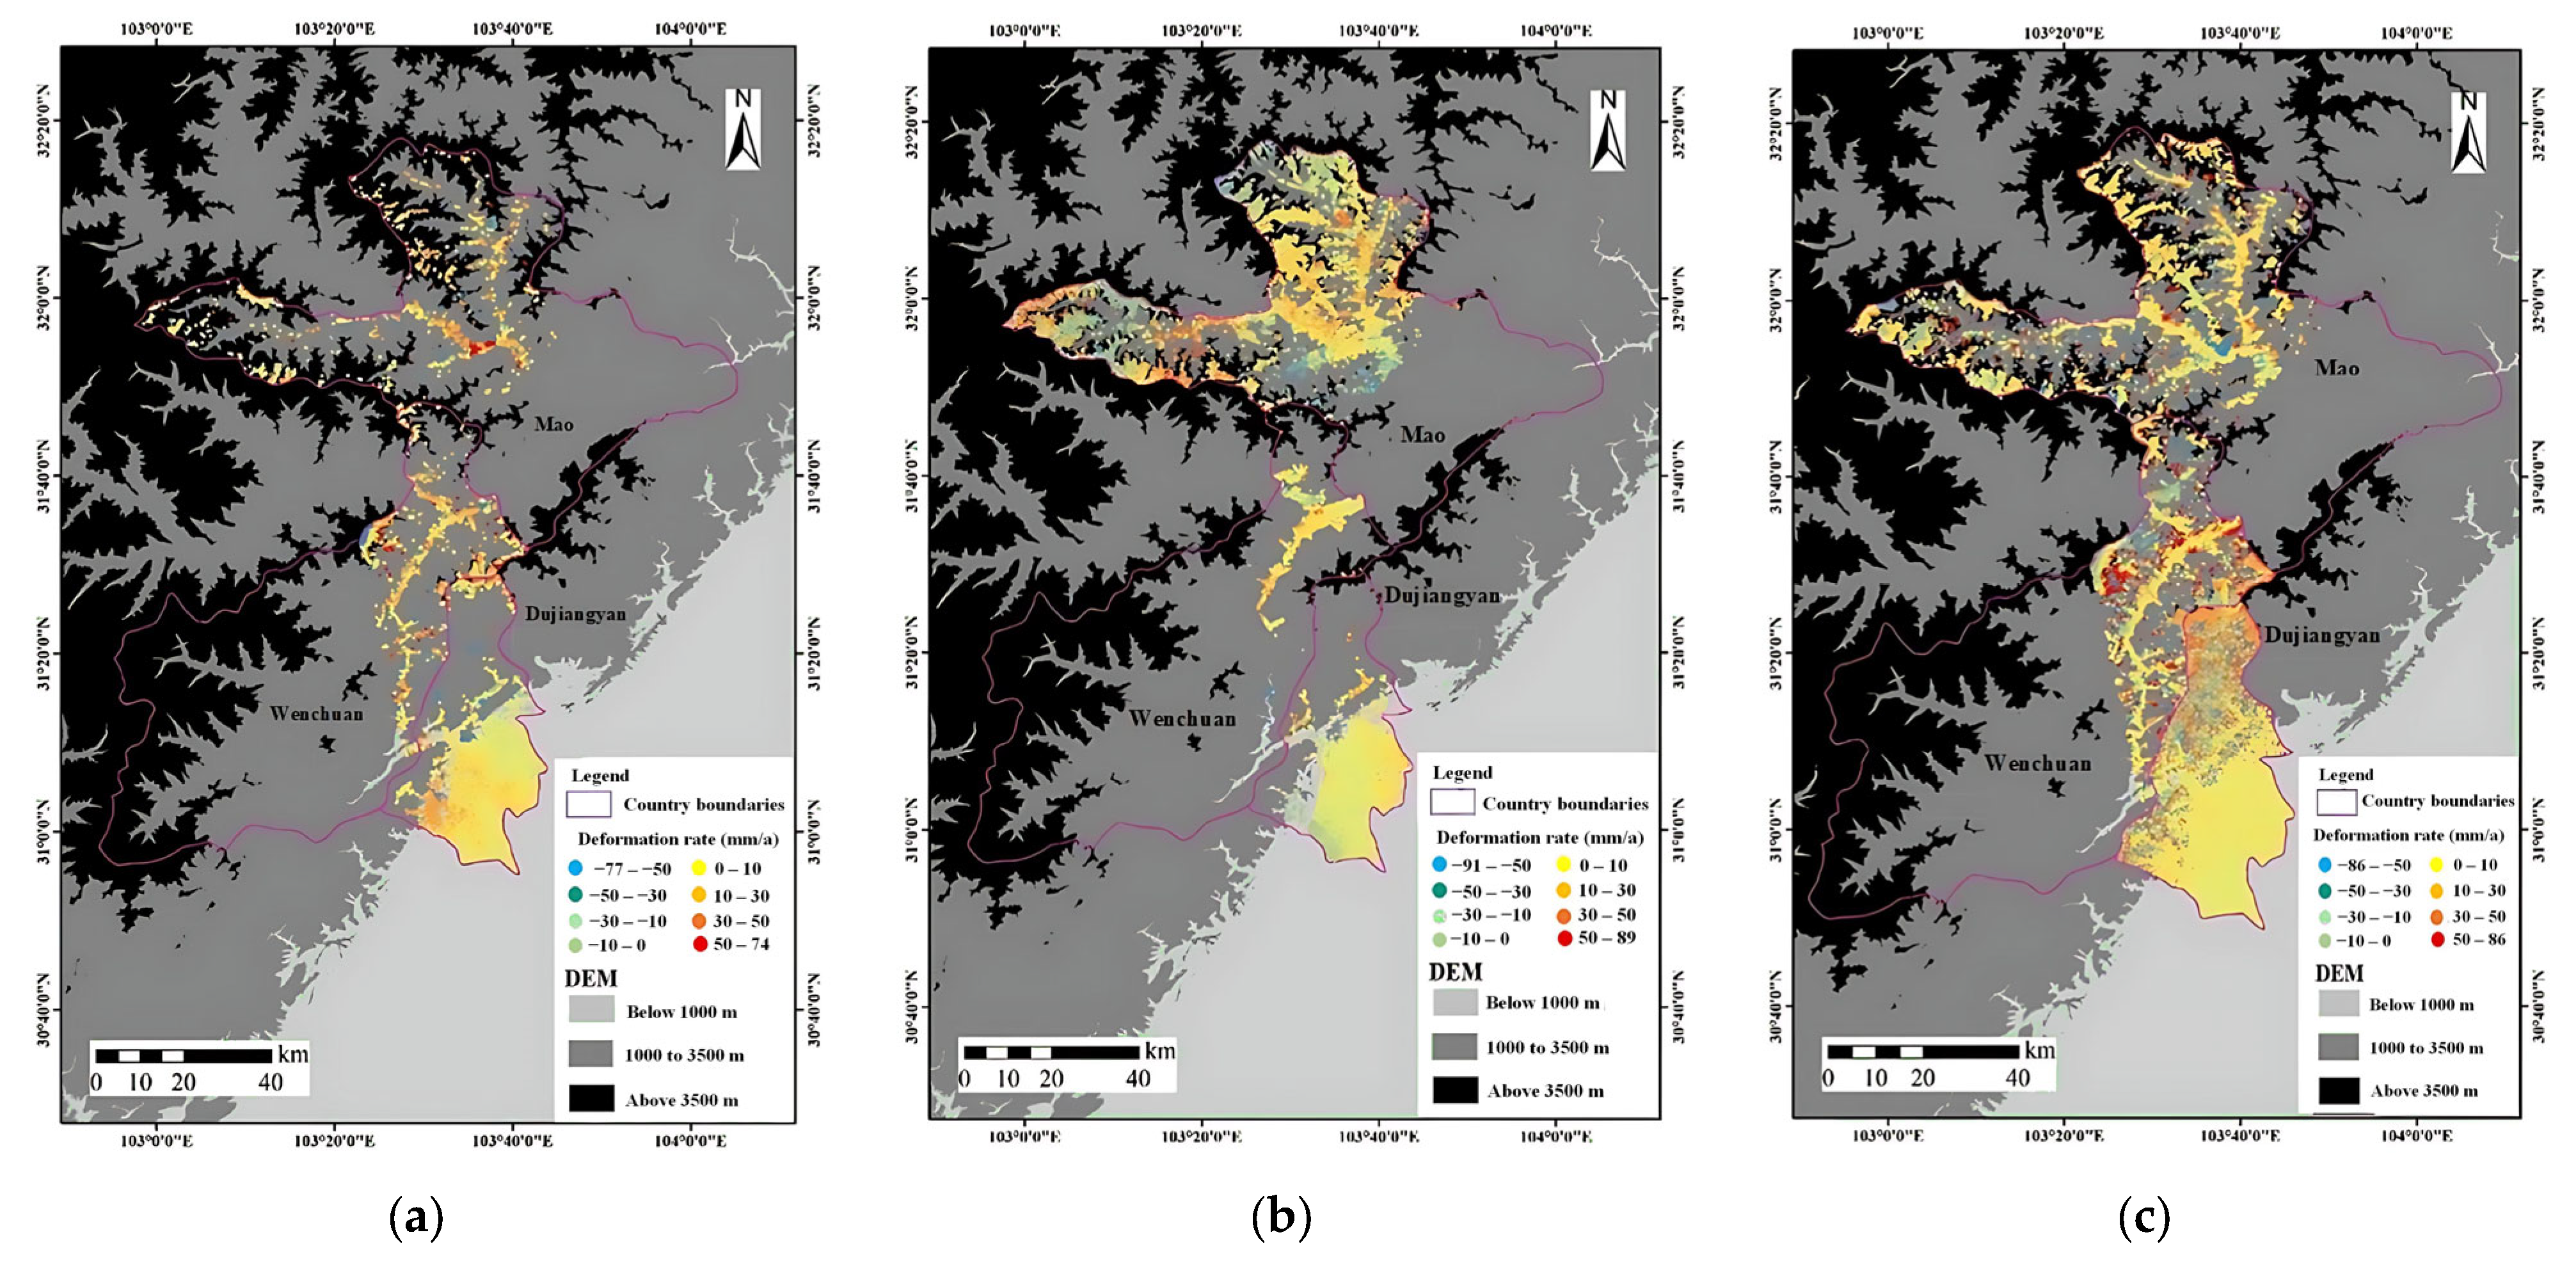
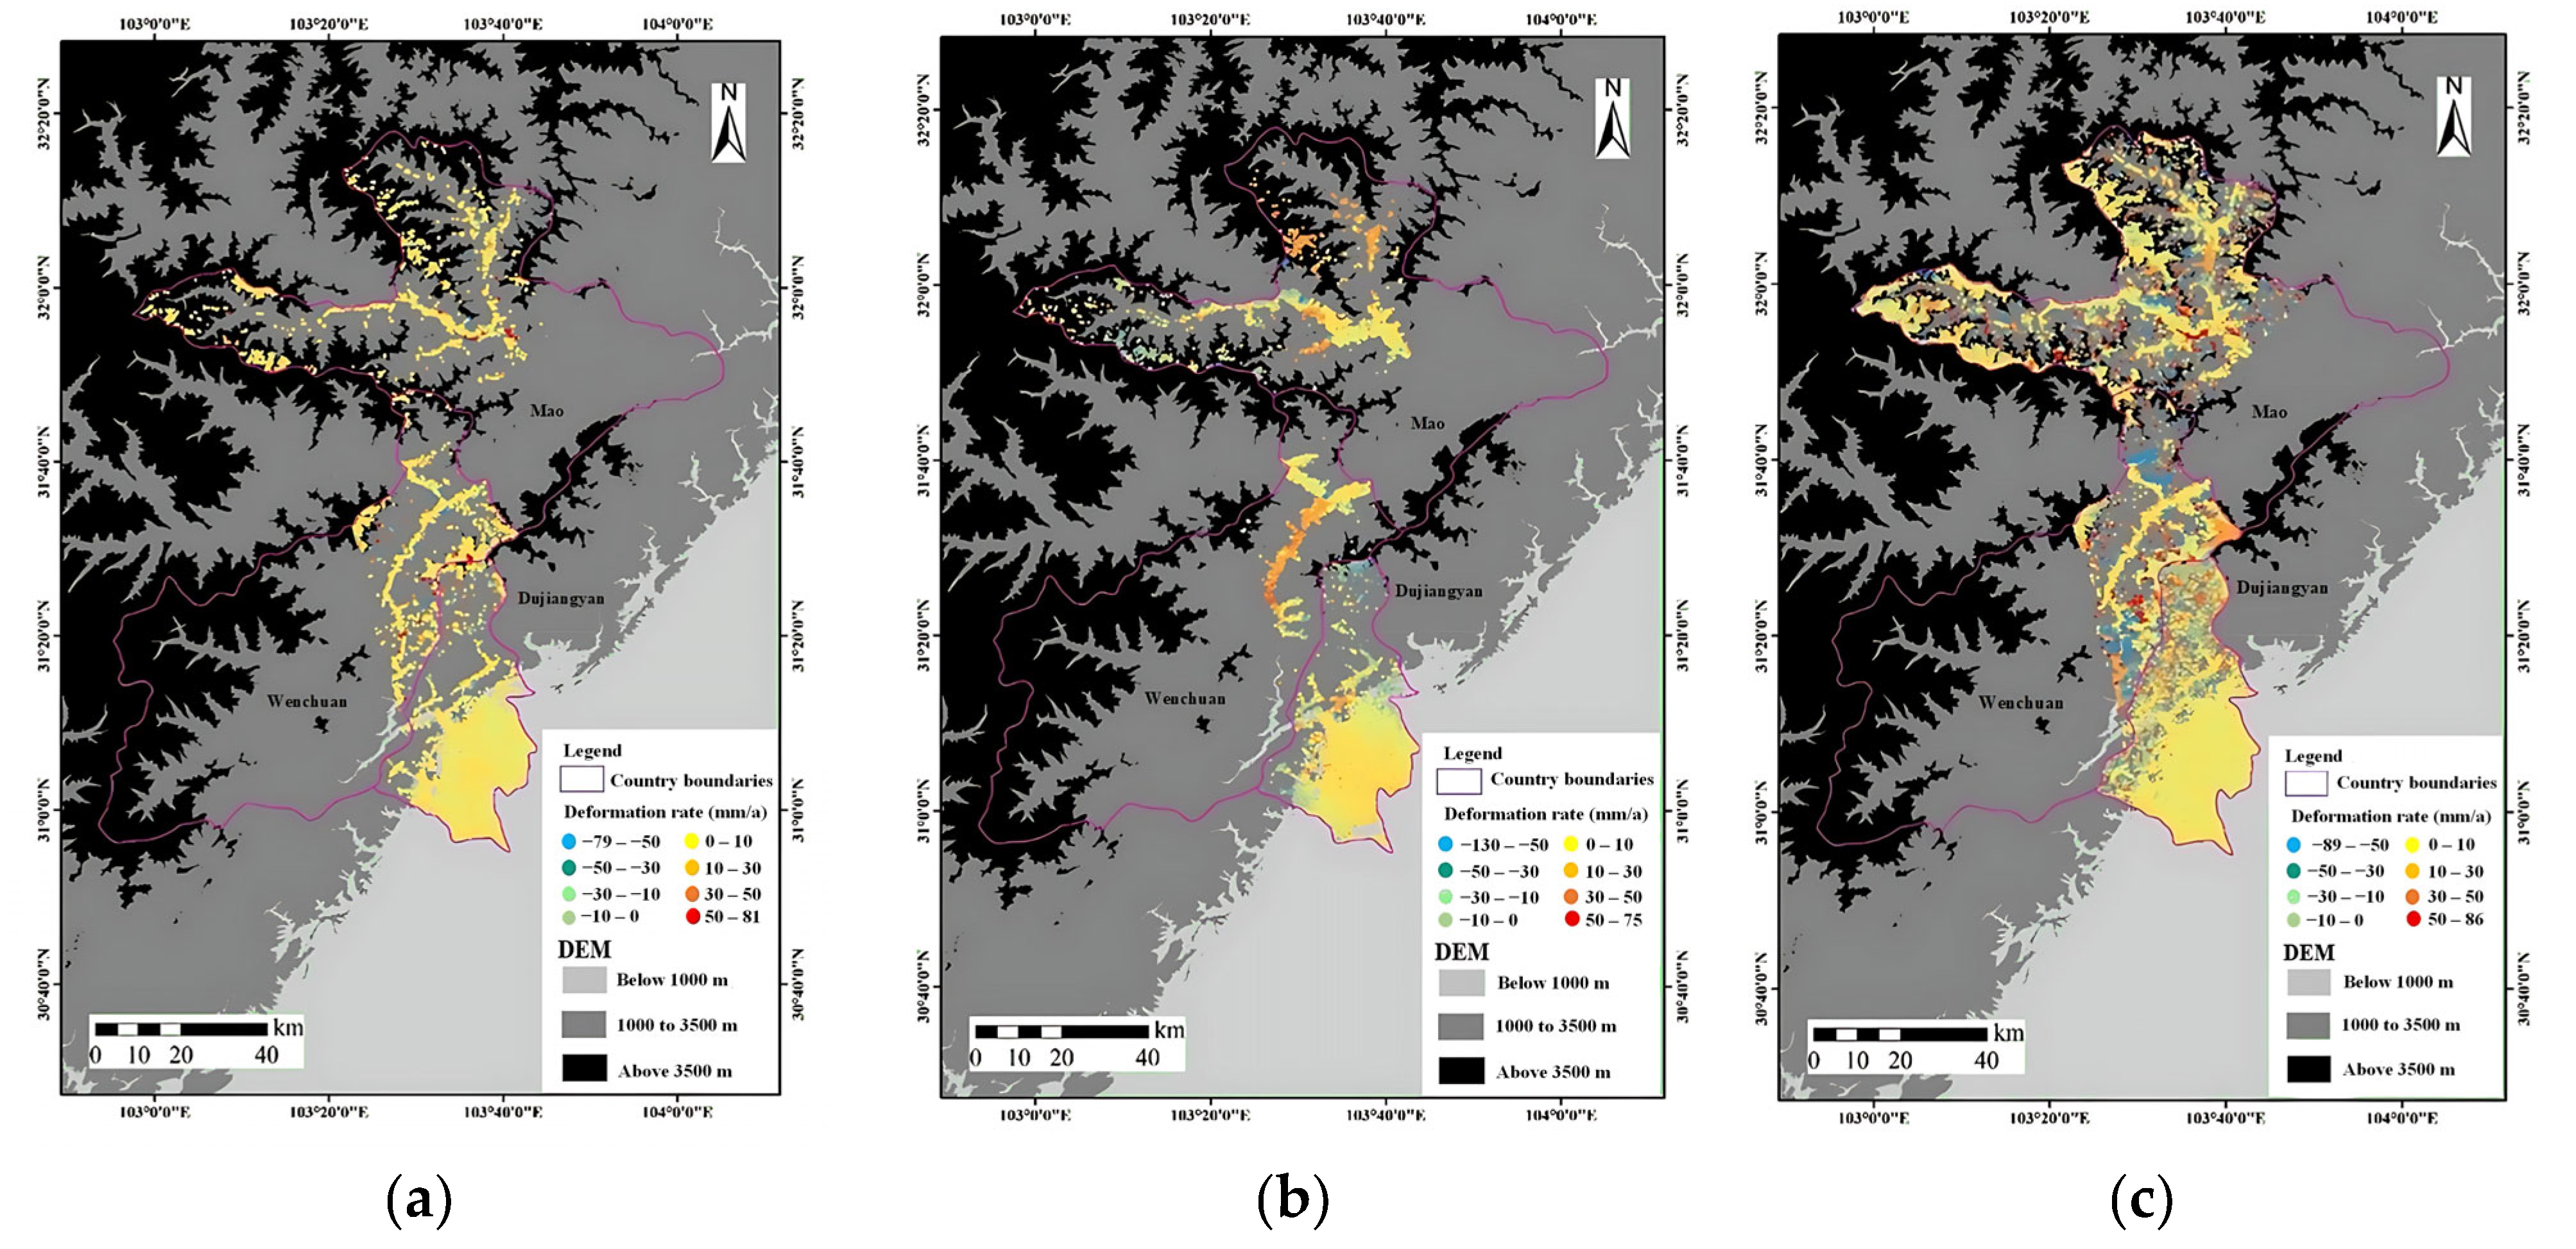
4.1. Surface Deformation and Spatial Distribution
4.2. Distribution of Potential Geological Hazard Monitoring
5. Discussion
6. Conclusions and Outlook
Author Contributions
Funding
Data Availability Statement
Conflicts of Interest
References
- Tan, Q.; Huang, Y.; Hu, J.; Zhou, P.; Hu, J. Application of artificial neural network model based on GIS in geological hazard zoning. Neural Comput. Appl. 2021, 33, 591–602. [Google Scholar] [CrossRef]
- Zhang, X.; Wu, Y.; Zhai, E.; Ye, P. Coupling analysis of the heat-water dynamics and frozen depth in a seasonally frozen zone. J. Hydrol. 2021, 593, 125603. [Google Scholar] [CrossRef]
- Wang, X.; Zhang, Q.; Zhao, C.; Qu, F.; Zhang, J. A novel method of generating deformation time-series using interferometric synthetic aperture radar and its application in Mexico City. Remote Sens. 2018, 10, 1741. [Google Scholar] [CrossRef]
- Haque, U.; Blum, P.; da Silva, P.F.; Andersen, P.; Pilz, J.; Chalov, S.R.; Malet, J.-P.; Auflič, M.J.; Andres, N.; Poyiadji, E.; et al. Fatal landslides in Europe. Landslides 2016, 13, 1545–1554. [Google Scholar] [CrossRef]
- Intrieri, E.; Carlà, T.; Gigli, G. Forecasting the time of failure of landslides at slope-scale: A literature review. Earth-Sci. Rev. 2019, 193, 333–349. [Google Scholar] [CrossRef]
- Froude, M.J.; Petley, D.N. Global fatal landslide occurrence from 2004 to 2016. Nat. Hazards Earth Syst. Sci. 2018, 18, 2161–2181. [Google Scholar] [CrossRef]
- Scheikl, M.; Angerer, H.; Dolzlmuller, J.; Poisel, R.; Poscher, G. Multidisciplinary monitoring demonstrated in the case study of the Eiblschrofen rockfall. Felsbau 2000, 18, 24–29. [Google Scholar]
- Loew, S.; Gschwind, S.; Gischig, V.; Keller-Signer, A.; Valenti, G. Monitoring and early warning of the 2012 Preonzo catastrophic rockslope failure. Landslides 2017, 14, 141–154. [Google Scholar] [CrossRef]
- Zebker, H.A.; Goldstein, R.M. Topographic mapping from interferometric synthetic aperture radar observations. J. Geophys. Res. Solid Earth 1986, 91, 4993–4999. [Google Scholar] [CrossRef]
- Neelmeijer, J.; Motagh, M.; Wetzel, H.-U. Estimating spatial and temporal variability in surface kinematics of the Inylchek Glacier, central Asia, using TerraSAR–X Data. Remote Sens. 2014, 6, 9239–9259. [Google Scholar] [CrossRef]
- Albano, M.; Barba, S.; Saroli, M.; Moro, M.; Malvarosa, F.; Costantini, M.; Bignami, C.; Stramondo, S. Gravity-driven postseismic deformation following the Mw 6.3 2009 L’Aquila (Italy) earthquake. Sci. Rep. 2015, 5, 16558. [Google Scholar] [CrossRef]
- Walter, T.; Subandriyo, J.; Kirbani, S.; Bathke, H.; Suryanto, W.; Aisyah, N.; Darmawan, H.; Jousset, P.; Luehr, B.-G.; Dahm, T. Volcano-tectonic control of Merapi’s lava dome splitting: The November 2013 fracture observed from high resolution TerraSAR-X data. Tectonophysics 2015, 639, 23–33. [Google Scholar] [CrossRef]
- Bamler, R.; Hartl, P. Synthetic aperture radar interferometry. Inverse Probl. 1998, 14, R1. [Google Scholar] [CrossRef]
- Rosen, P.A.; Hensley, S.; Joughin, I.R.; Li, F.K.; Madsen, S.N.; Rodriguez, E.; Goldstein, R.M. Synthetic aperture radar interferometry. Proc. IEEE 2000, 88, 333–382. [Google Scholar] [CrossRef]
- Rott, H. Advances in interferometric synthetic aperture radar (InSAR) in earth system science. Prog. Phys. Geogr. Earth Environ. 2009, 33, 769–791. [Google Scholar] [CrossRef]
- Casu, F.; Manconi, A.; Pepe, A.; Lanari, R. Deformation time-series generation in areas characterized by large displacement dynamics: The SAR amplitude Pixel-Offset SBAS technique. IEEE Trans. Geosci. Remote Sens. 2011, 49, 2752–2763. [Google Scholar] [CrossRef]
- Wu, Q.; Jia, C.; Chen, S.; Li, H. SBAS-InSAR based deformation detection of urban land, created from mega-scale mountain excavating and valley filling in the Loess Plateau: The Case Study of Yan’an City. Remote Sens. 2019, 11, 1673. [Google Scholar] [CrossRef]
- Wang, B.; Zhao, C.; Zhang, Q.; Lu, Z.; Li, Z.; Liu, Y. Sequential estimation of dynamic deformation parameters for SBAS-InSAR. IEEE Geosci. Remote Sens. Lett. 2020, 17, 1017–1021. [Google Scholar] [CrossRef]
- Chen, Y.; Yu, S.; Tao, Q.; Liu, G.; Wang, L.; Wang, F. Accuracy verification and correction of D-InSAR and SBAS-InSAR in monitoring mining surface subsidence. Remote Sens. 2021, 13, 4365. [Google Scholar] [CrossRef]
- Hussain, M.A.; Chen, Z.; Wang, R.; Shoaib, M. PS-InSAR-based validated landslide susceptibility mapping along Karakorum Highway, Pakistan. Remote Sens. 2021, 13, 4129. [Google Scholar] [CrossRef]
- Lyu, M.; Ke, Y.; Li, X.; Zhu, L.; Guo, L.; Gong, H. Detection of seasonal deformation of highway overpasses using the PS-InSAR Technique: A case study in Beijing Urban Area. Remote Sens. 2020, 12, 3071. [Google Scholar] [CrossRef]
- Wang, H.; Feng, G.; Xu, B.; Yu, Y.; Li, Z.; Du, Y.; Zhu, J. Deriving spatio-temporal development of ground subsidence due to subway construction and operation in delta regions with PS-InSAR data: A case study in Guangzhou, China. Remote Sens. 2017, 9, 1004. [Google Scholar] [CrossRef]
- Narayan, A.B.; Tiwari, A.; Dwivedi, R.; Dikshit, O. A novel measure for categorization and optimal phase history retrieval of distributed scatterers for InSAR applications. IEEE Trans. Geosci. Remote Sens. 2018, 56, 5843–5849. [Google Scholar] [CrossRef]
- Ferretti, A.; Fumagalli, A.; Novali, F.; Prati, C.; Rocca, F.; Rucci, A. A new algorithm for processing interferometric data-stacks: SqueeSAR. IEEE Trans. Geosci. Remote Sens. 2011, 49, 3460–3470. [Google Scholar] [CrossRef]
- Berardino, P.; Fornaro, G.; Lanari, R.; Sansosti, E. A new algorithm for surface deformation monitoring based on small baseline differential SAR interferograms. IEEE Trans. Geosci. Remote Sens. 2002, 40, 2375–2383. [Google Scholar] [CrossRef]
- Hooper, A. A multi-temporal InSAR method incorporating both persistent scatterer and small baseline approaches. Geophys. Res. Lett. 2008, 35, L16302. [Google Scholar] [CrossRef]
- Anfinsen, S.N.; Eltoft, T. Application of the Matrix-Variate Mellin transform to analysis of polarimetric radar images. IEEE Trans. Geosci. Remote Sens. 2011, 49, 2281–2295. [Google Scholar] [CrossRef]
- Eneva, M.; Adams, D.; Falorni, G.; Morgan, J. Surface deformation in Imperial Valley, CA, from satellite radar interferometry. Trans. Geotherm. Resour. Counc. 2012, 36, 1339–1344. [Google Scholar]
- Zhang, Y.; Li, Y.; Dong, J.; Fan, Q.; Che, B.; Zhang, L.; Zhou, Y.; Liao, M. Landslide hazard detection in Markam with time-series InSAR analyses. Natl. Remote Sens. Bull. 2021, 23, 987–996. [Google Scholar]
- Wang, Y.; Wang, S.; Wang, N. Application of Time Series InSAR Technology in Early Identification of Geological Hazards in the Northern Part of Central Development Zone of Nepal. South China Geol. 2023, 39, 536–547. [Google Scholar]
- Huang, S.B.; Chang, Z.Q.; Xie, C.; Tian, B.S. Deformation monitoring of frozen soil in salt lake area based on SBAS-InSAR. Adv. Geosci. 2020, 10, 100–120. [Google Scholar]
- Ma, Y.; Liu, T.; Yu, Z.; Jiang, C.; Lu, Z. Assessment of numerical weather models with different spatial resolutions on tropospheric delay correction for InSAR. IEEE J. Sel. Top. Appl. Earth Obs. Remote Sens. 2024, 17, 14133–14144. [Google Scholar] [CrossRef]
- Tang, P.; Chen, F.; Guo, H.; Tian, B.; Wang, X.; Ishwaran, N. Large-area landslides monitoring using advanced multi-temporal InSAR technique over the Giant Panda habitat, Sichuan, China. Remote Sens. 2015, 7, 8925–8949. [Google Scholar] [CrossRef]
- Stephens, M.A. Use of the Kolmogorov-Smirnov, Cramer-Von Mises and related statistics without extensive tables. J. R. Stat. Soc. Ser. B (Methodol.) 1970, 32, 115–122. [Google Scholar]
- Press, W.H.; Teukolsky, S.A.; Vetterling, W.T.; Flannery, B.P. Numerical Recipes 3rd Edition: The Art of Scientific Computing; Cambridge University Press: Cambridge, UK; New York, NY, USA, 2007. [Google Scholar]
- Lv, X.; Yazıcı, B.; Zeghal, M.; Bennett, V.; Abdoun, T. Joint-scatterer processing for time-series InSAR. IEEE Trans. Geosci. Remote Sens. 2014, 52, 7205–7221. [Google Scholar] [CrossRef]
- Cao, N.; Lee, H.; Jung, H.C. Mathematical framework for Phase-Triangulation Algorithms in distributed-scatterer interferometry. IEEE Geosci. Remote Sens. Lett. 2015, 12, 1838–1842. [Google Scholar] [CrossRef]
- Ferretti, A.; Prati, C.; Rocca, F. Permanent scatterers in SAR interferometry. IEEE Trans. Geosci. Remote Sens. 2001, 39, 8–20. [Google Scholar] [CrossRef]
- Yan, Y.; Doin, M.-P.; Lopez-Quiroz, P.; Tupin, F.; Fruneau, B.; Pinel, V.; Trouve, E. Mexico City subsidence measured by InSAR time series: Joint analysis using PS and SBAS approaches. IEEE J. Sel. Top. Appl. Earth Obs. Remote Sens. 2012, 5, 1312–1326. [Google Scholar] [CrossRef]
- Azar, M.K.; Hamedpour, A.; Maghsoudi, Y.; Perissin, D. Analysis of the deformation behavior and sinkhole risk in Kerdabad, Iran using the PS-InSAR method. Remote Sens. 2021, 13, 2696. [Google Scholar] [CrossRef]
- Zhou, L.; Guo, J.; Hu, J.; Li, J.; Xu, Y.; Pan, Y.; Shi, M. Wuhan surface subsidence analysis in 2015–2016 based on Sentinel-1A data by SBAS-InSAR. Remote Sens. 2017, 9, 982. [Google Scholar] [CrossRef]
- Zhang, L.; Dai, K.; Deng, J.; Ge, D.; Liang, R.; Li, W.; Xu, Q. Identifying potential landslides by Stacking-InSAR in southwestern China and Its Performance Comparison with SBAS-InSAR. Remote Sens. 2021, 13, 3662. [Google Scholar] [CrossRef]
- Aimaiti, Y.; Yamazaki, F.; Liu, W.; Kasimu, A. Monitoring of land-surface deformation in the Karamay oilfield, Xinjiang, China, Using SAR Interferometry. Appl. Sci. 2017, 7, 772. [Google Scholar] [CrossRef]


| Disaster | Landslides | Collapses | Debris Flows | Ground Collapses | Total | Proportions | |
|---|---|---|---|---|---|---|---|
| Intervals | |||||||
| <1000 m | 218 | 45 | 27 | 3 | 293 | 16.6 | |
| 1000~3500 m | 736 | 467 | 270 | 2 | 1475 | 83.3 | |
| >3500 m | 0 | 2 | 0 | 0 | 2 | 0.1 | |
| Total | 954 | 514 | 297 | 5 | 1770 | 100 | |
| Proportions | 53.9 | 29.0 | 16.8 | 0.3 | 100 | ||
| Methods | Number of Deformation Feature Information Points | Total | |||||||
|---|---|---|---|---|---|---|---|---|---|
| <1000 m | 1000~3500 m | >3500 m | |||||||
| PS-InSAR | Ascending | 59,981 | (0) | 12,165 | (12) | 19,212 | (0) | 91,358 | (12) |
| Descending | 60,977 | 15,212 | 18,431 | 94,620 | |||||
| SBAS-InSAR | Ascending | 74,090 | (0) | 137,316 | (24) | 90,452 | (0) | 301,858 | (24) |
| Descending | 276,551 | 148,610 | 2715 | 427,876 | |||||
| DS-InSAR | Ascending | 182,960 | (2) | 80,430 | (30) | 111,335 | (0) | 374,725 | (32) |
| Descending | 179,739 | 91,211 | 116,570 | 387,520 | |||||
| Elevation | Types of Geological Hazards | Total | ||
|---|---|---|---|---|
| Landslide | Collapse | Debris Flow | ||
| <1000 m | 1 | 1 | 0 | 2 |
| 1000~3500 m | 42 | 2 | 1 | 45 |
| >3500 m | 0 | 0 | 0 | 0 |
Disclaimer/Publisher’s Note: The statements, opinions and data contained in all publications are solely those of the individual author(s) and contributor(s) and not of MDPI and/or the editor(s). MDPI and/or the editor(s) disclaim responsibility for any injury to people or property resulting from any ideas, methods, instructions or products referred to in the content. |
© 2025 by the authors. Licensee MDPI, Basel, Switzerland. This article is an open access article distributed under the terms and conditions of the Creative Commons Attribution (CC BY) license (https://creativecommons.org/licenses/by/4.0/).
Share and Cite
Zheng, Z.; Li, Y.; He, Y.; Xie, C.; Zhu, M.; Shao, T.; Huang, W.; Hu, J.; Su, B.; Tang, H. Deformation Monitoring Exploration of Different Elevations in Western Sichuan, China. Remote Sens. 2025, 17, 1284. https://doi.org/10.3390/rs17071284
Zheng Z, Li Y, He Y, Xie C, Zhu M, Shao T, Huang W, Hu J, Su B, Tang H. Deformation Monitoring Exploration of Different Elevations in Western Sichuan, China. Remote Sensing. 2025; 17(7):1284. https://doi.org/10.3390/rs17071284
Chicago/Turabian StyleZheng, Zezhong, Yizuo Li, Yong He, Chuhang Xie, Mingcang Zhu, Tianming Shao, Weifeng Huang, Jinchi Hu, Baiyan Su, and Huahui Tang. 2025. "Deformation Monitoring Exploration of Different Elevations in Western Sichuan, China" Remote Sensing 17, no. 7: 1284. https://doi.org/10.3390/rs17071284
APA StyleZheng, Z., Li, Y., He, Y., Xie, C., Zhu, M., Shao, T., Huang, W., Hu, J., Su, B., & Tang, H. (2025). Deformation Monitoring Exploration of Different Elevations in Western Sichuan, China. Remote Sensing, 17(7), 1284. https://doi.org/10.3390/rs17071284