1. Introduction
In August 1986, the mobile SOUSY mesosphere stratosphere–troposphere very-high-frequency (VHF) (MST) radar (see [
1]) was installed near the village of Katlenburg-Lindau and operated for a one-week period together with the SOUSY VHF MST radar (see [
2]) located in the Harz Mountains of Germany, about 27 km distant. For logistical reasons, the mobile radar was operated with a limited antenna array and peak power such that it was effectively a tropospheric wind profiling radar (WPR). The intention of this campaign was to compare the results of these two closely spaced radars with particular emphasis on measurements of the momentum flux terms in the troposphere and lower stratosphere.
In Equation (1),
is the perturbation of the zonal wind component around its temporal mean,
is the corresponding meridional wind component,
the perturbation of the vertical wind component, the overbar indicates a temporal covariance, and
is the mean atmospheric density. At the time of the observations, it had recently been demonstrated to the MST radar community that Doppler radars could be used to measure the density-normalized fluxes with
able to be obtained from a standard model [
3]. Measurements of the momentum flux then allow the mean drag to be calculated from the divergence with height of the momentum flux terms for nonrotating flow [
4].
One motivation for the campaign was that contemporaneous experiments with general circulation models had suggested that unresolved gravity wave motions played a significant role in the momentum balance of the lower atmosphere [
5]. These authors found that a mean zonal drag of about
in the lower stratosphere would be sufficient in their model to permit a reasonable mean meridional (i.e., poleward) flow and bring zonal wind speeds into better agreement with observations. Ref. [
5] summarized some of the then-observational evidence that suggested that orographically induced waves played an important role in the large-scale momentum budget of the lower atmosphere. This included direct evidence in the form of aircraft observations of momentum fluxes and flux divergences (e.g., [
6,
7]) and indirect evidence in the form of surface observations of pressure drag over mountainous areas (see, e.g., [
8,
9] and references therein).
The second motivation for the campaign was to compare the fluxes measured within the Harz Mountains with measurements made on the surrounding plains. Ref. [
3] recognized that flux measurements in the presence of stationary waves would not necessarily yield correct values when using their approach, a result supported by measurements made by [
10] using the Poker Flat MST radar apparently in the presence of such waves that showed the assumption of horizontal homogeneity of the statistics of the motions might not hold in that case. Of course, the fluxes measured by the two radars could be both different and correct, and so understanding the wave fields present during the observations is important.
In the decades since the work described by [
5] and the Harz/Lindau radar campaign observations (hereinafter DualRad), numerous studies have verified the importance of gravity wave drag in the general circulation models and attempted to develop parametrization schemes based on global observations (see e.g., [
11,
12]). Ref. [
12] pointed out that radar measurements of fluxes are available at only a few locations and then often for only limited periods, as did [
11]. Consequently, these authors placed most of their emphasis on techniques capable of providing a global view suitable for parameterization schemes to be incorporated into global circulation models and thus focused largely on satellite and rawinsonde observations. These approaches typically yield the mean absolute momentum flux
without directional information, but progress has recently been made in obtaining both the momentum flux and its directionality (see e.g., [
13]).
Radars and lidars can provide good temporal and spatial measurements of gravity waves, and instrumented aircraft transects can provide detailed information on the wave spectrum. Ref. [
14] review the observational requirements for model parameterizations and emphasize the need for a more precise specification of sources and wave characteristics in the upper troposphere and lower stratosphere. Thus, campaign observations to better understand and parameterize the role of gravity waves in the global circulation are still very important. More recent campaigns are now rather more sophisticated, making use of both ground-based and aircraft observations and models (see e.g., [
15,
16,
17]).
Nevertheless, the results we present here are still of interest, because comparisons of closely spaced wind profiling radar observations are relatively rare, radar measurements of tropospheric and stratospheric momentum fluxes are sparse, and the successful operation of a very small Doppler beam steering (DBS) radar operating in the lower-VHF band is of particular interest from a technical perspective.
2. Experiments
2.1. General
The measurement of the density-normalized upward flux of horizontal momentum using Doppler radar is described in [
3]. With narrow radar beams directed at
and
from the zenith in the east–west plane and the mean square radial perturbation velocities for a particular range of frequencies measured in these beams being
and
, respectively, the density-normalized upward flux of zonal momentum for that frequency range is given by:
A similar expression applies for the north–south plane and
and
:
Equations (3) and (4) are a special case of the velocity azimuth display (VAD) analysis of mean square radial perturbation velocities
measured at a beam azimuth
, as described by [
18] and given by:
The terms are the mean square values of the fluctuating components of the wind field, that is, twice the kinetic energy per unit mass for the zonal, meridional, and vertical components, respectively. The terms are the horizontal momentum flux, the upward flux of zonal momentum, and the upward flux of meridional momentum, all per unit mass, respectively. Together, these six terms make up the density-normalized Reynolds stress tensor (RST).
To solve for these six terms, observations of need to be made in six non-redundant azimuthal directions at a fixed off-zenith angle to provide suitable equations to solve. For most MST- or ST-class radars, there would be either three or five beams directed off-zenith at the same angle towards the north, east and vertical, or north, south, east, and west, and to the vertical, respectively, and so the actual parameters that can be measured are limited. For the five-beam radar case, all terms of the RST except are available directly from the five mean square radial velocities because there are only five equations to solve for the six terms. Of course, could be calculated once have been calculated from the radial velocities, but this is a rather more involved process with a number of assumptions involved.
The major assumption required in the deviation of Equations (3) and (4) to the solution of Equation (5) for the RST terms is that the statistics of the motions are homogeneous between the beams. In the presence of stationary waves, for example, in the lower atmosphere in those mountainous regions where many MST radars are (or were) located, the estimate of the momentum flux given by Equations (3) and (4) may not be correct because the assumption of statistical homogeneity may not be satisfied. Aircraft measurements (e.g., see [
16]) provide spatial rather than temporal averages of the
terms and are thus not as subject to the same potential error.
Given the importance of measurements of these flux terms, it is valuable to attempt to determine experimentally just how the presence of stationary waves might affect these estimates, and this was one aim of the experimental design of the present work. We attempted to do this by comparing measurements made in two areas of different topography, and although this does not guarantee the presence of such waves, it was hoped that this would provide insight into the uncertainties associated with these measurements. In the observational period, the jet stream moved over northern Germany and the radar sites. This is another known source of wave generation (see e.g., [
19]), and so there are two potential wave sources during the campaign.
2.2. Topography
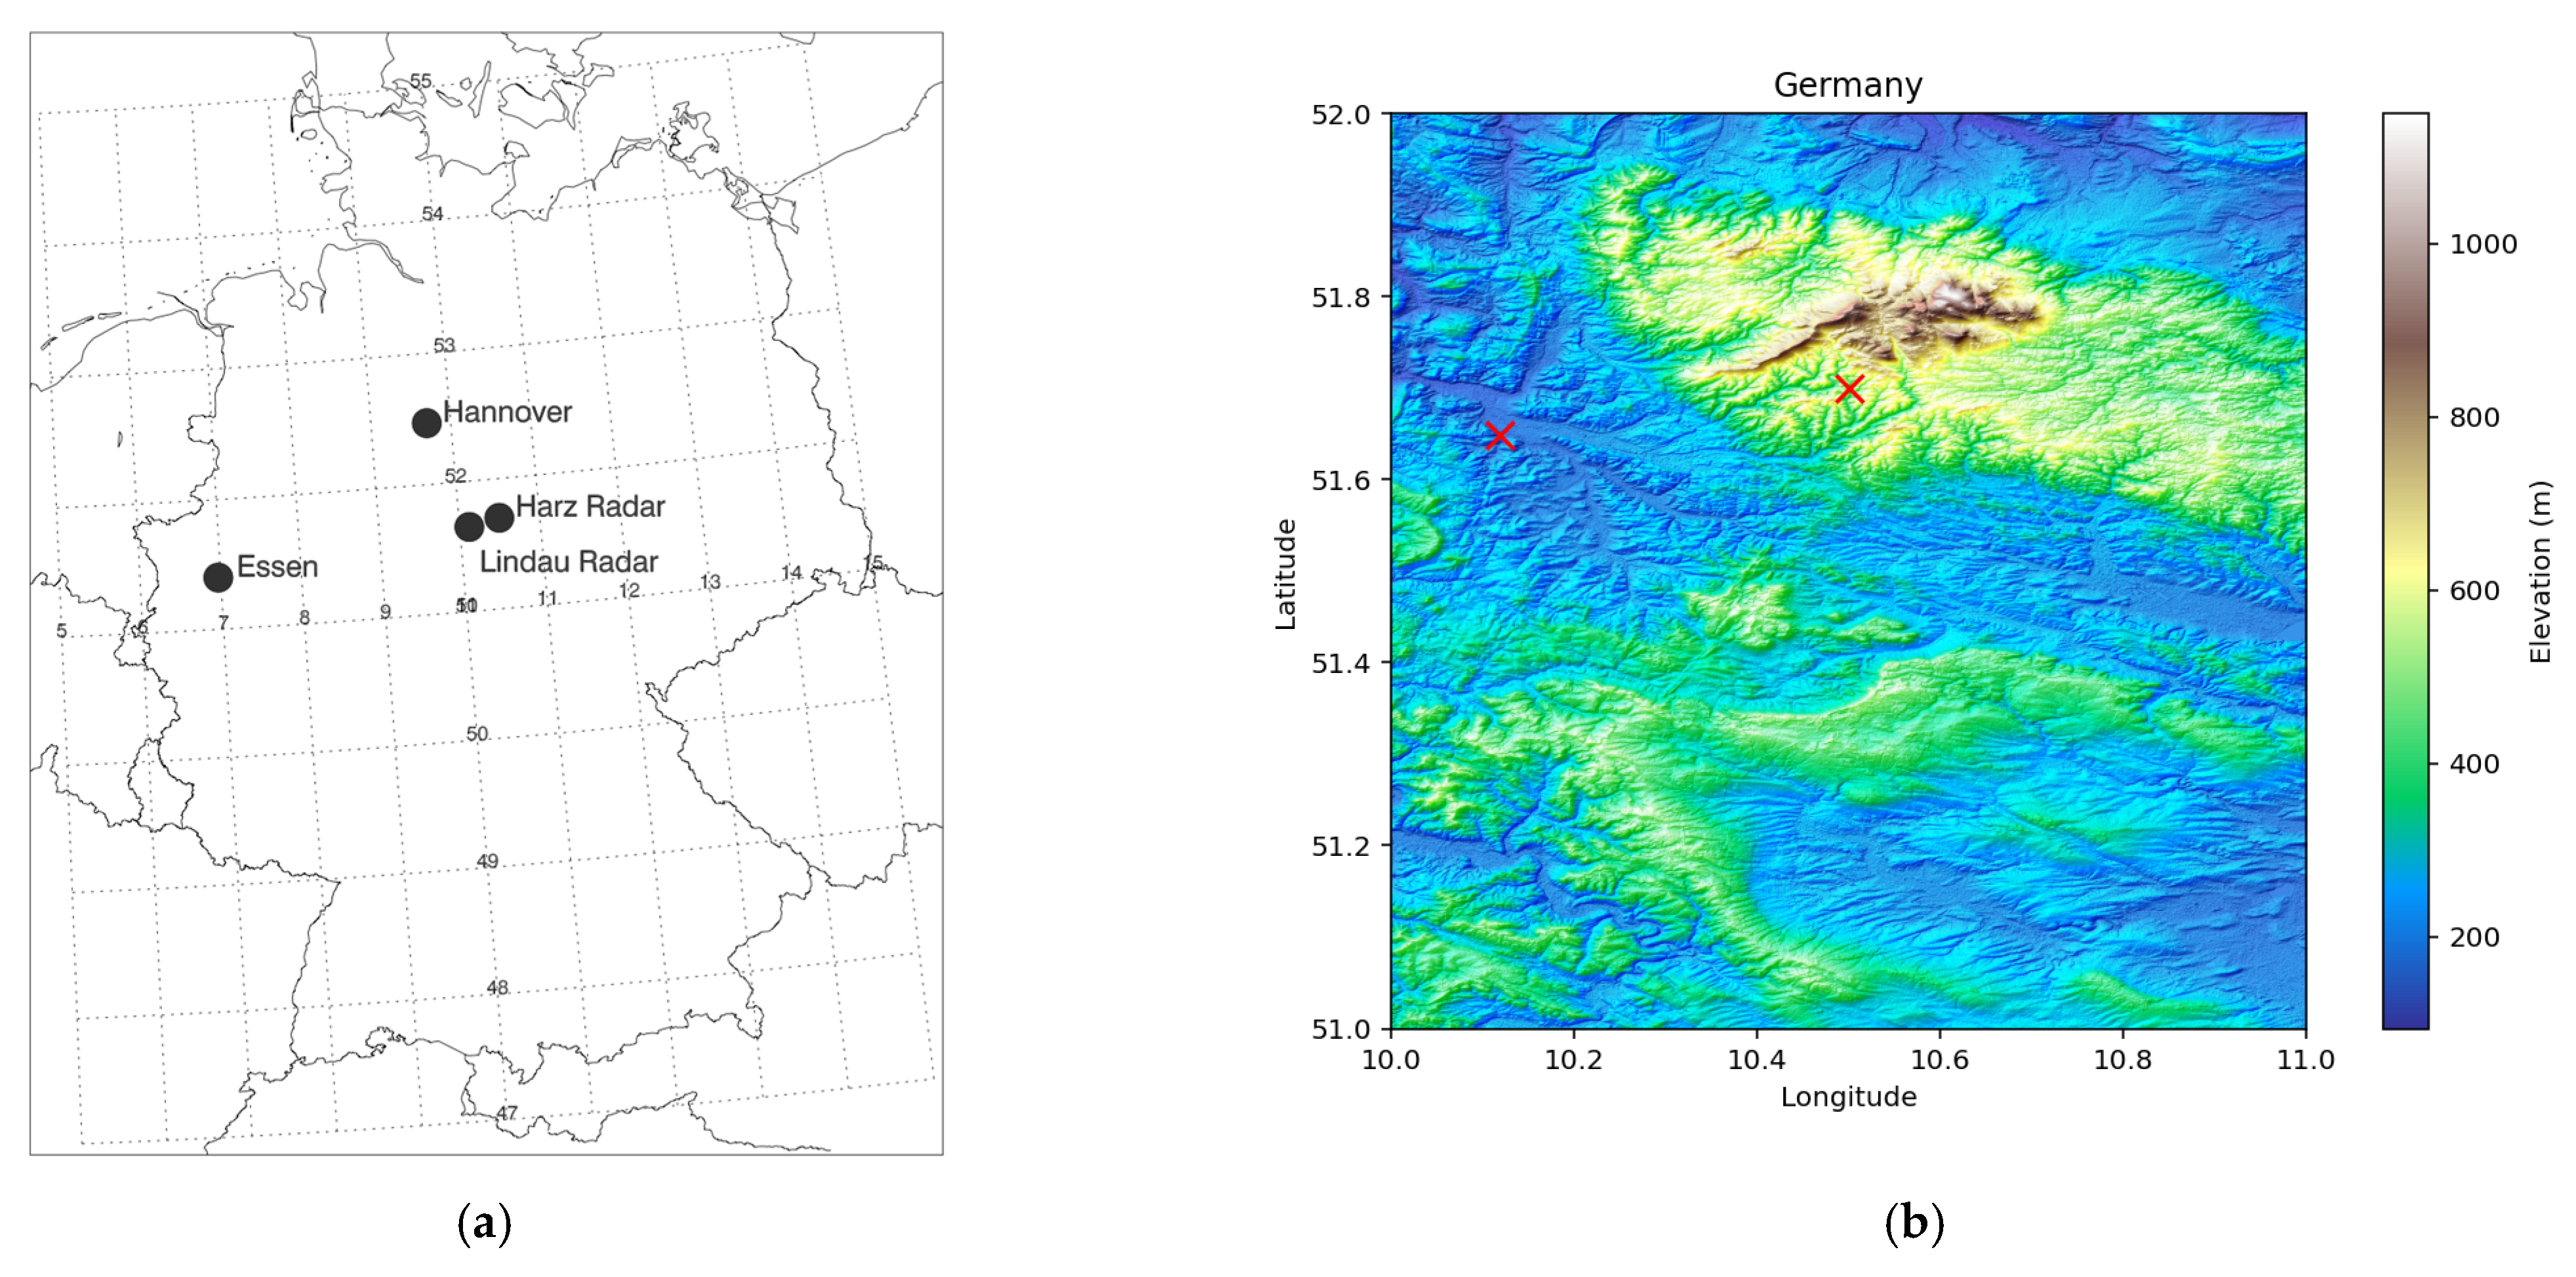
The Harz Mountains are in northern Germany, extend around 110 km along a SE-to-NW axis, and are about 35 km at their widest. The highest point is the Brocken, at 1141 m, which is taken to divide the Upper and Lower Harz. The Upper Harz is a rolling plateau about 1000 m high in the west and 500 m high at its center, interspersed with deep valleys. The Lower Harz consists of the southeastern and larger part. From a modeling point of view, the Harz can be considered a low isolated mountain range. The locations of the two radars are shown in
Figure 1a. The Lindau radar site (51.65°N, 10.12°E) is about 150 m above mean sea level on the plain and the Harz radar site about 450 m above mean sea level on the southern edge of the Harz. The locations of the Hannover (52.38°N, 9.73°E) and Essen (51.4°N, 6.97°E) radiosonde launch sites are also shown.
Figure 1b shows the topology in the region of the two radars, as well as their locations.
2.3. Experimental Design
The Harz SOUSY VHF MST radar was a first-generation MST radar and provided the template for many subsequent VHF MST radars. It was situated in a valley near Bad Lautenberg in the Harz Mountains of northern Germany (51°42′N, 10°30′E) and operated between 1978 and the late 1990s. Another similar relocatable MST radar, the mobile SOUSY radar, was operated at several locations around the world beginning in 1980, as described by [
20], before being installed near Andenes on the island of Andøya in northern Norway (see, e.g., [
21]). In August 1986, prior to being installed in Norway, it was installed in a limited form about 27 km away from the Harz radar near the village of Lindau at the then Max-Planck-Institut für Aeronomie (MPAe) (see
Figure 1).
The operating parameters of the two radars appropriate for this experiment are shown in
Table 1. Some restrictions of the mobile radar peak power and antenna array dimensions were necessary for the Lindau radar configuration, and so the power–aperture product (4.47 × 10
5 W m
2), a useful figure of merit, was two orders of magnitude less than that for the Harz radar (6.30 × 10
7 W m
2). More extensive technical details relating to these two radars may be found in [
1,
2]. Briefly, a higher duty cycle allows the radar to put more average power out, but in a pulsed system, this necessitates a higher pulse repetition frequency. This limits the maximum usable range. This means that there is a balance between the usable power and height coverage. Increasing the pulse length and phasing the pulses allows the radar to be operated with the maximum average power without reducing the height resolution. There is also a limit to the maximum duty cycle a particular transmitter will allow, in this case 4%. The radars are running identical parameters, and so the difference in evaluating radar performance is the power and the antenna aperture size. There is an expected 21.4 dB difference in the SNR between the radars based on their power–aperture products. This is consistent with the SNR profiles measured in the vertical beams of the two radars, as we show below.
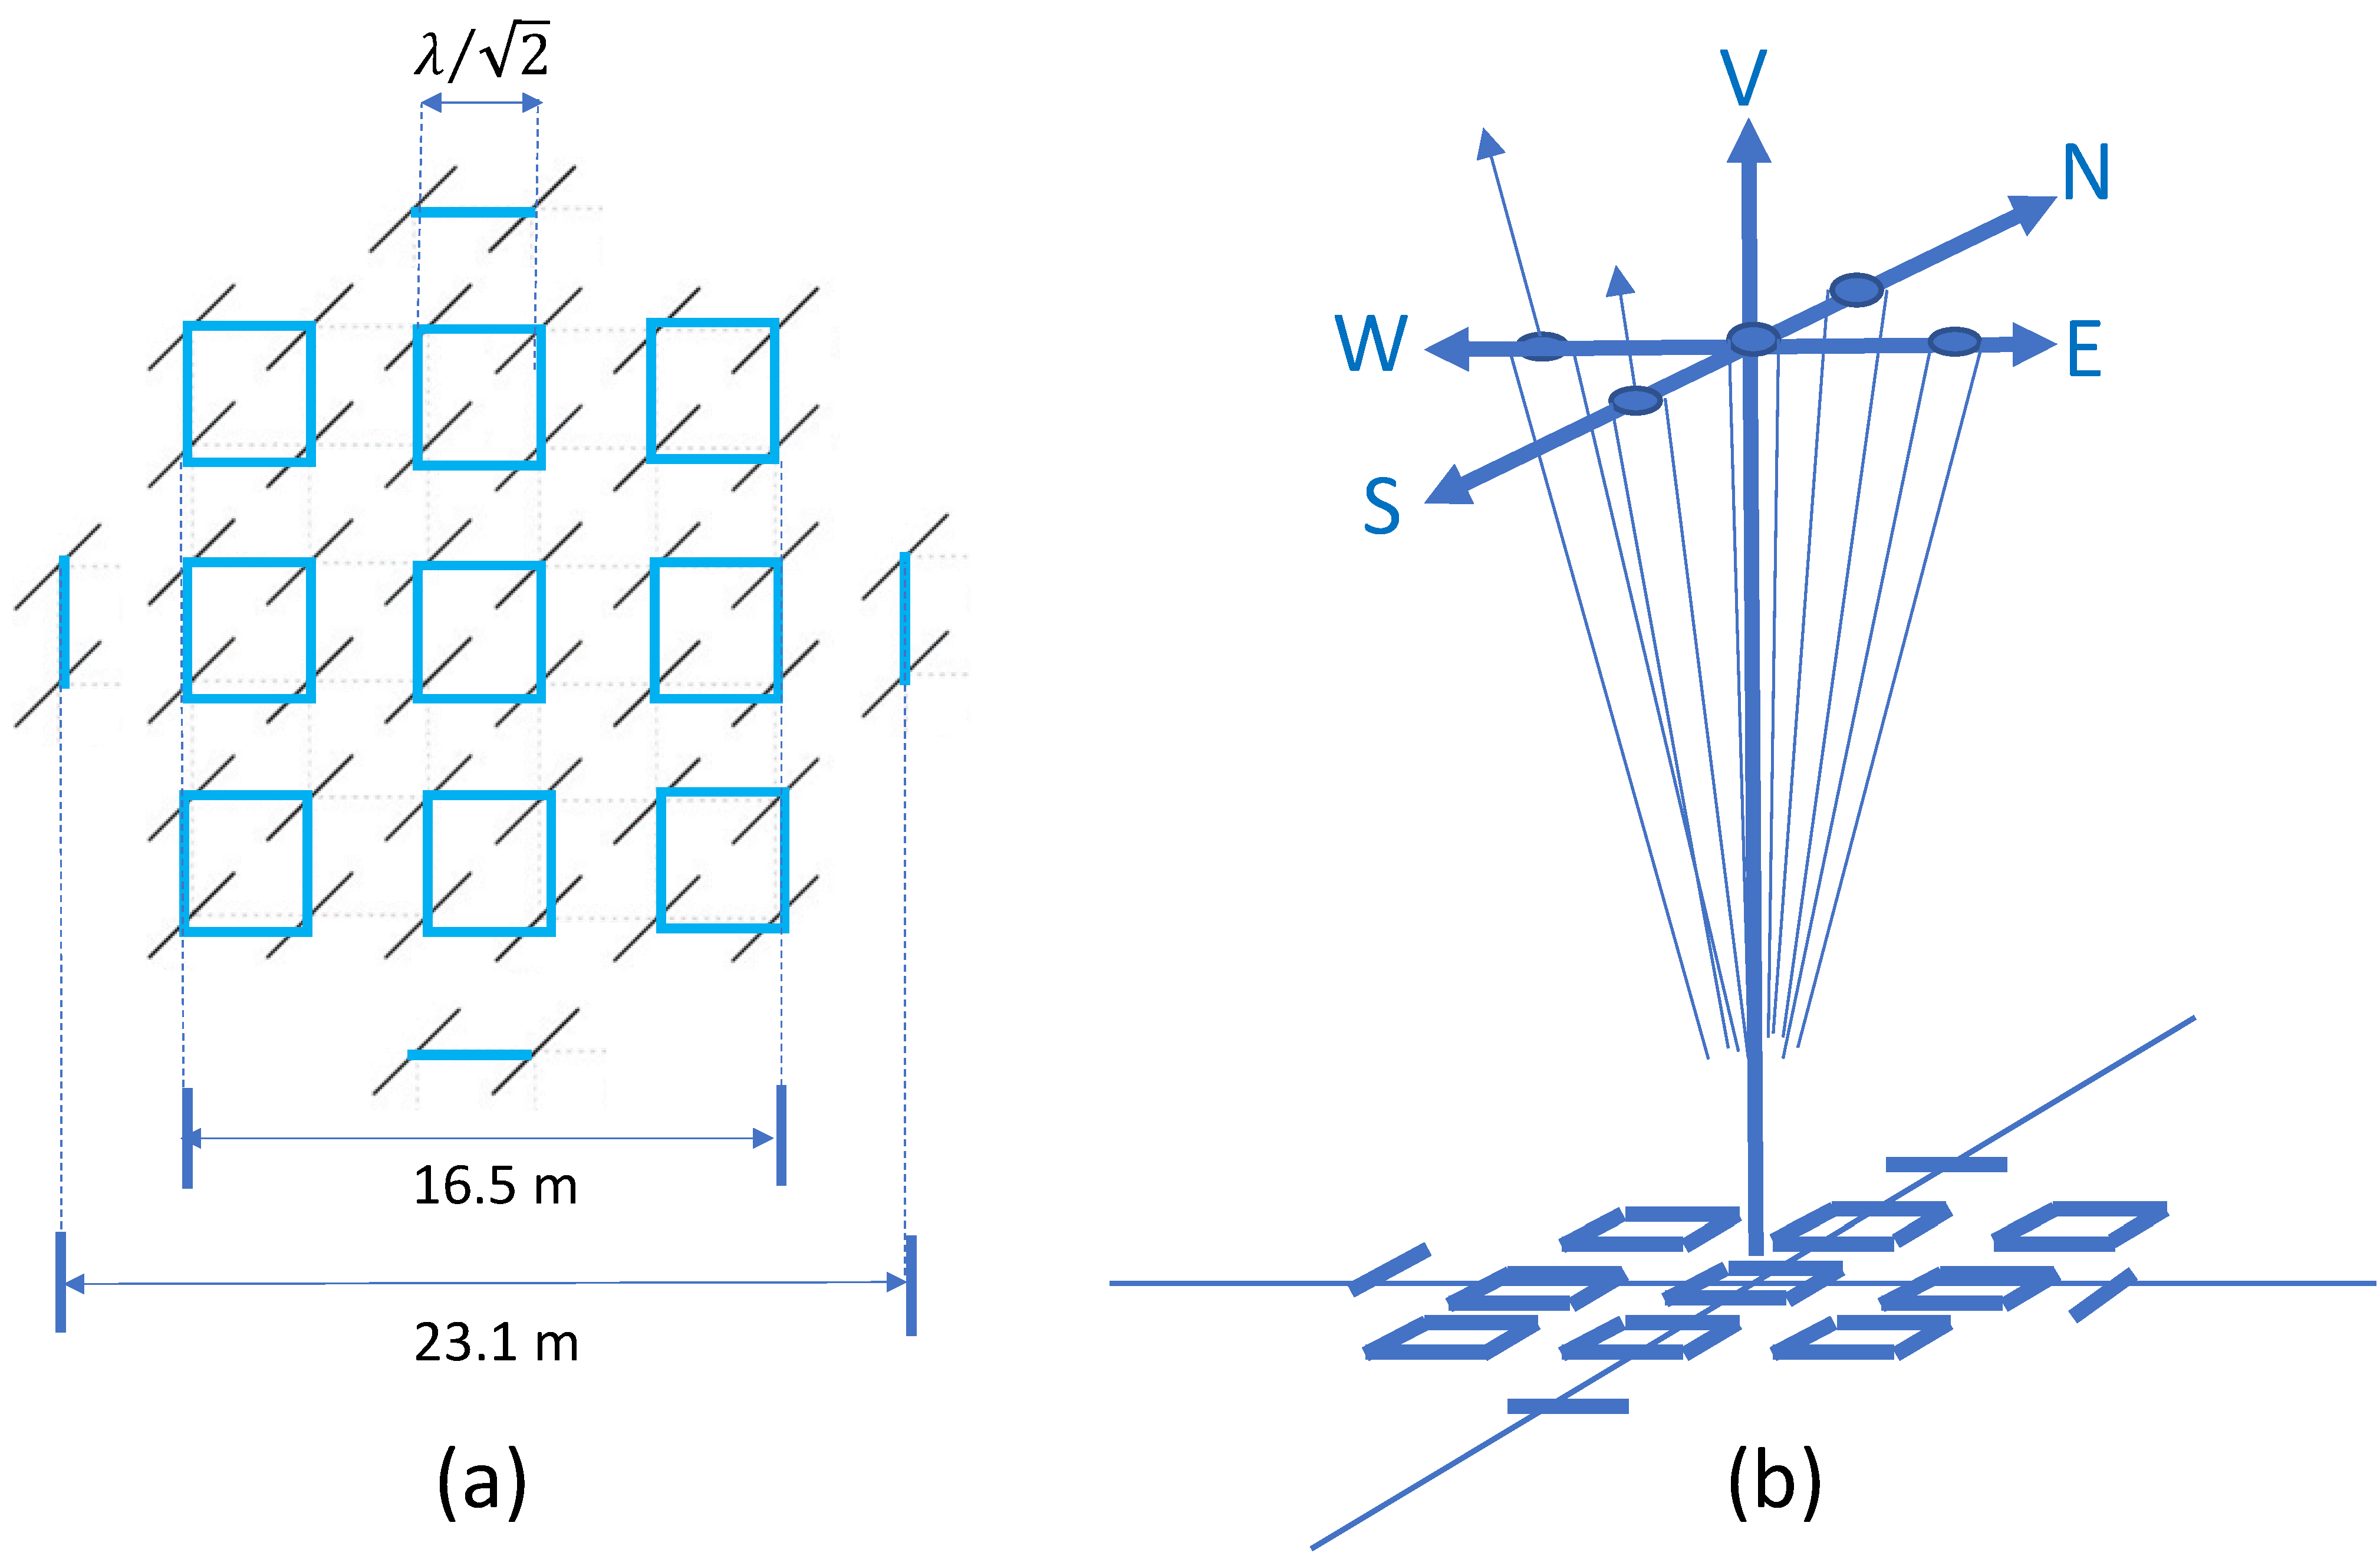
The DualRad radars were operated on a campaign basis with data recorded on magnetic tape. Tapes needed to be changed manually every 1.5 to 2 h. Both radars were operated in a 5-beam configuration with beams directed vertically and off-zenith towards the north, south, east, and west (see
Figure 2). This allowed five of the six components of the RST (all those apart from
) to be obtained directly from the mean square radial velocities [
23]. In addition, the Harz radar was operated for two days with beams directed vertically at ±15° and ±7.5° to the zenith in the east–west plane, as shown in
Figure 3. This allowed comparison of spatially separated measurements of
to be obtained and so permitted a limited investigation into the validity of the assumption of the horizontal homogeneity of the statistics of the motions to be conducted. During these observations, the
terms were not available from the Harz radar.
In the case of the Harz experiment with five beams in the same (EW) plane, it was not appropriate to calculate mean values through an inversion of the entire system of radial velocity equations because we were interested in differences between the pairs of beams. Rather, we applied Equation (3) to the beam pairs. For consistency, we applied this and the corresponding equation for the north and south beams (Equation (4)) to obtain the fluxes for all of the Harz radar data, and we chose to follow the same approach with the Lindau radar.
We also note here that some doubt about the validity of the mean angle of arrival of radar returns within the beam exists because of its large beamwidth. For example, Ref. [
24] used the Harz radar with additional spaced antenna groups to measure in-beam angles of arrival for the main vertical beam of the radar. They found corrections of the vertical velocity of 5% to 200% were required when averaged over 8 min or more. We note that the Harz radar beamwidth is 5° while the Lindau radar beamwidth is 12°, increasing the potential for off-vertical returns from the Lindau radar. One of the advantages of the dual-beam approach to measuring momentum fluxes is that is does not require a measurement of vertical velocity, this generally being regarded as difficult.
In total, measurements were obtained over a period of approximately seven days, from 18 August (day 230) until 25 August (day 237) 1986. A break of about 2 days’ duration occurred in the Harz radar data after the first day of observations, and two other breaks of a total duration of about half a day occurred during the last days of operation, so about another 3.5 days of continuous operation were available for this radar. This consisted of two days of E, W @ 7.5°: E, W @ 15°, and V operation, followed by 1.5 days of E, W, N, S @ 7.0°, and V operation. After the first day of Lindau radar operation, a period of approximately one day of intermittent radar operation followed. Radar operation was more or less continuous after this, so about 5 days of continuous operation were available for this radar. Consequently, there were about 3.5 days of near-continuous simultaneous operation of the two radars. The operating modes and duration of the radar observations in these modes for the Harz and Lindau radars are summarized in
Table 2. A total of about 4.6 days of data were available for the Harz radar and a total of about 6.3 days of data were available for the Lindau radar when outages are accounted for, with a total of about 4.6 days of simultaneous operation during the seven days of observation.
The Lindau Radar
The Lindau Radar arrangement appears to be relatively unique in terms of being a usable lower-VHF-band DBS wind profiling radar with a small antenna array. In sum, 13 antenna subgroups of 4-element Yagi antennas were installed (of the 144 groups possible). These consisted of nine groups of four antennas and four groups of two antennas. A schematic of the antenna arrangement is shown in
Figure 2. Antennas were arranged on a square grid with a basic spacing of
. This resulted in an effective antenna aperture of about
, which is small in terms of the radar wavelength (
). The small antenna aperture results in relatively large beamwidths (~12°), because the far-field antenna pattern is basically the Fourier transform of the aperture, as is familiar from optics. A larger aperture results in a smaller beamwidth, and vice versa. Wide beamwidths require a correction for the look direction of the beam, as it is biased back towards the azimuth by the aspect-sensitive nature of radar backscatter at these frequencies. Experience at medium frequencies (MFs) using the large (in physical area, but not in wavelength) Buckland Park (BP) antenna array, which has comparable beamwidths, had shown that such corrections were possible [
25], as we discuss below.
The lowest usable height was about 3 km because of the relatively long pulse codes (10 bit) used. Without coding, the lowest height available on the Harz radar, and so also for the Lindau radar, is about 1.4 km (see e.g., [
26]), a value determined by the PIN diode-based transmit–receive (TR) switch recovery time and ground and other clutter sources. The transition from the near to far field occurs at about 1.8 km for the Harz radar. This is where the antenna beam Fraunhofer polar diagrams are fully formed and so this was another experimental design consideration. Interestingly however, more recent work has indicated that valid wind results can be obtained within the near field where the radar is operating in “searchlight” mode (see e.g., [
27]). The peak power able to be used with the Lindau radar was limited to about 17 kW by the small number of antennas within the array and so by their individual power ratings and also by an issue in the high-power PIN diode when used in this configuration.
Other approaches to small WPRs have been used. For example, work in France explored small lower-VHF-band DBS radars for wind profiling below the usual lower height limit for larger radars set by TR switches and ground clutter (see e.g., [
28] and references therein). In Australia, an extensive comparison between radiosonde and radar winds from a 44.75 MHz WPR using both DBS and the spaced antenna (SA) technique (see e.g., [
29]) concluded that for stratospheric–tropospheric (ST) operation, the DBS approach was preferred, whilst for boundary layer and tropospheric (BLT) operation, the SA approach was preferred [
30]. Consequently, small 55 MHz wind profiling BLT radars using the SA technique were developed for operational use in the Australian Bureau of Meteorology observation network [
31] and the DBS technique was used for operational use with ST WPRs in the same network [
27]. By using passive TR switches, these radars can recover winds starting from heights equal to about two range gates from the ground when using uncoded pulses, typically 300 m for the BLT radars and 500 m for the ST radars, a considerable improvement on the older PIN diode approach used for TR switches. We note that 500 m is within the near field for these ST radars.
3. Results
3.1. Time Series Processing
The DualRad radars were operated with 150 m range resolution using a 10-bit complementary code. Data points were coherently integrated for 0.174 s, and a 64-point time series of 11.2 s was created for each beam direction used and written to tape for offline analysis. A beam sequence of EWEWEWNSNSNSVVVVVV was used on both radars. This meant that a five-beam sequence was completed in about 3.4 min. Radial velocities, powers, and spectral widths calculated from the moments of the time series were then calculated to yield one record at this time interval. The same process was applied to the Harz radar EWEWEW (7.5°) EWEWEW (15°) VVVVVV sequence. A more detailed description of the general data analysis and the quality controls applied to these data is given in [
32].
Because Equations (3) and (4) require differentiating two like quantities, extra care must be taken to remove spurious data. These were removed by twice applying a 3-sigma cutoff filter to the SNR time series and removing the corresponding velocities and spectral widths. Time series of velocities were also separately subjected to a 3-sigma filter. The source of the spikes is uncertain, but strong meteor returns are a possibility for some of the spikes. We do note that the temporary radar site was located near roads, buildings, and in open ground. This contrasts with the Harz radar, which was in an electrically quiet valley within the mountains. A 0 dB cutoff in the signal-to-noise ratio (SNR) was used for both the Lindau and Harz radar radial velocities, although we restricted some subsequent Lindau analysis to yield wind velocities and radial velocity variances to SNRs corresponding to 3 dB or more. This is indicated where required below.
For the momentum flux calculations, we are often interested in the variances of the time series for different frequency bands. To filter the time series, a spline was applied and the splined values used to fill in missing data points. A fifth-order Butterworth filter with appropriate cutoffs was then applied to this modified time series. Variances were then calculated for the filtered time series, using only values corresponding to those times when real data were obtained. All the time series were treated in the same way. In this work, we considered all periods less than the inertial period at this latitude of 15.1 h but note that most of the flux contribution was from periods longer than 8 h.
3.2. Lindau Radar Performance
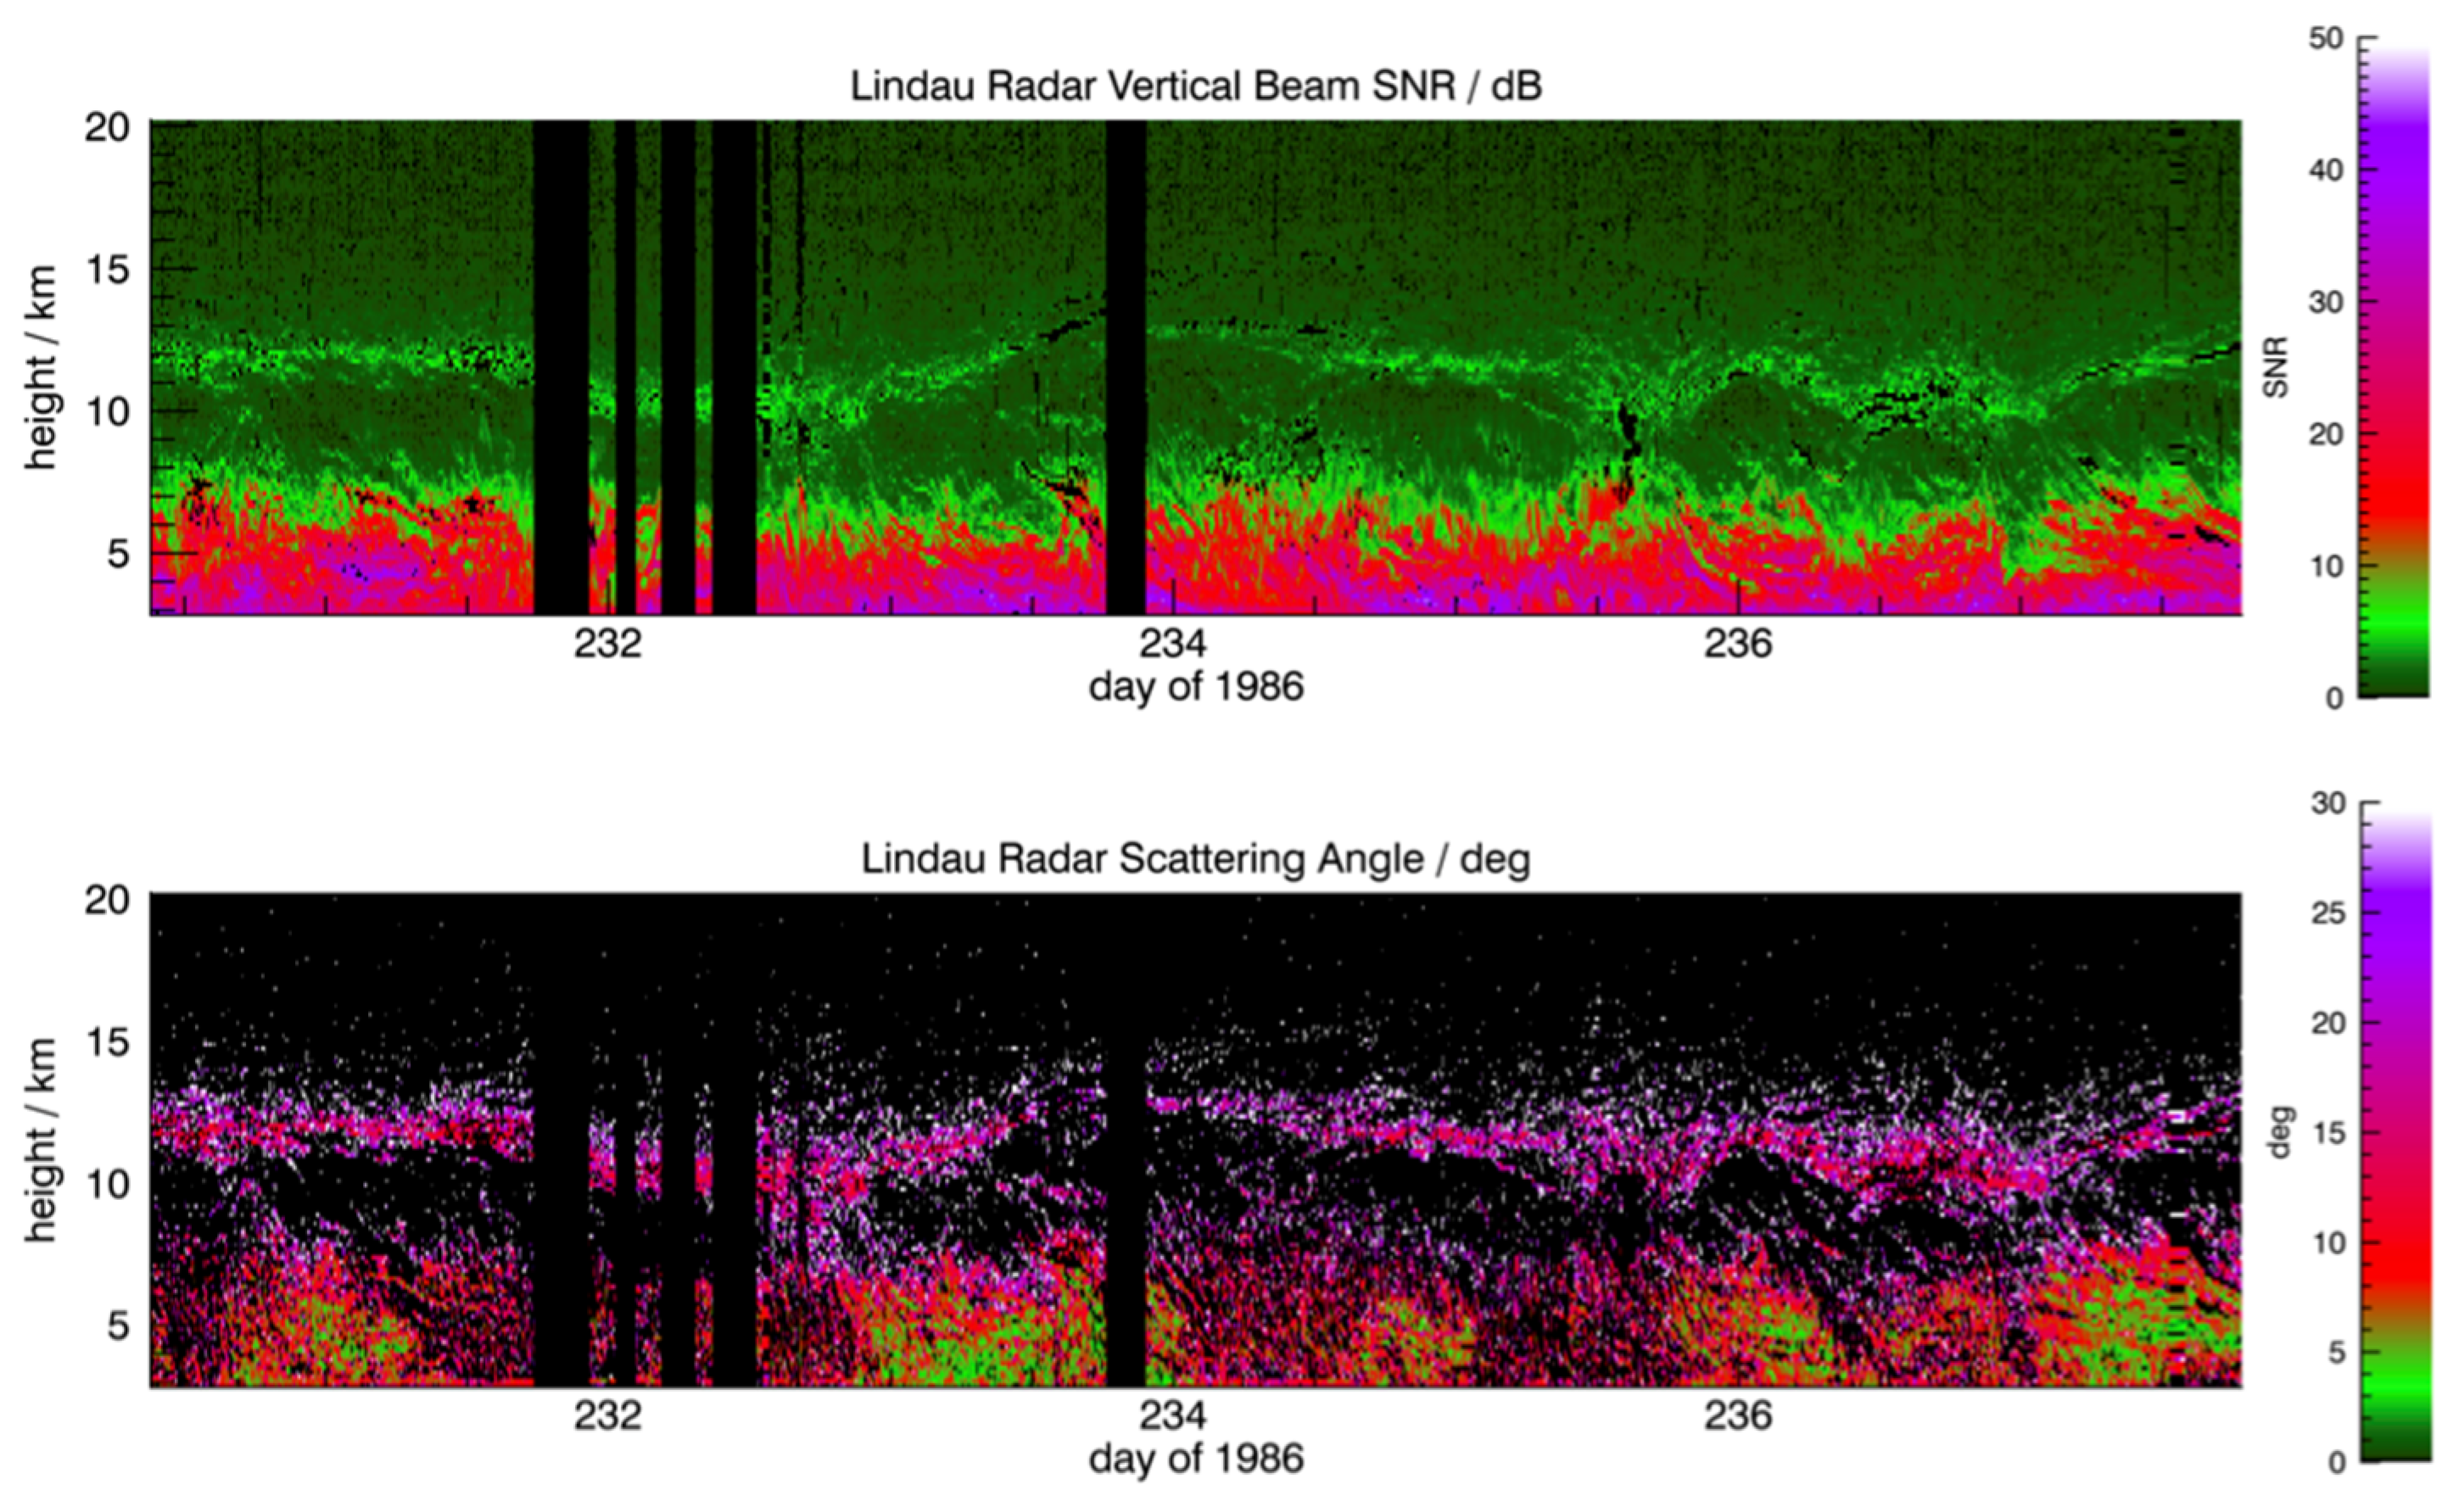
An indication of the performance of the Lindau radar may be gained by inspection of
Figure 4. This figure shows the SNR for the Lindau radar vertical beam as a function of height and time for the entire observational period. The figure shows that descending layers are evident through much of the seven-day period. Artifacts are evident in the first four range gates, that is, for the first 600 m of the observations. These correspond to what appears to be saturation in the vertical beam powers, which is evident in both the Lindau and Harz radars, and we excluded these data from further analysis. It is evident from this figure that the radar tropopause is readily detected as a region of increased SNR and that it is quite dynamic in height, varying from about 10 to 12.5 km. No usable horizontal winds were recovered from this region, however.
Correction for the Wide Beams
We have noted the uncertainty concerning the Lindau radar vertical beam measurements above. In addition, because the Lindau radar beamwidths are relatively large and the backscattering regions quite anisotropic, the effective off-vertical beam angles are somewhat less than the apparent beam angles, and a correction must be applied. This may be calculated by assuming a Gaussian fall-off in backscattered power with increasing off-zenith angle and calculating the product of this angular distribution with the known antenna array polar diagram. This was first applied by [
33] using SOUSY Harz MST radar data. This approach yields an effective polar diagram that can be used together with the backscattered powers measured in the vertical and off-vertical beams to yield an effective beam pointing angle
and the width of the angular polar diagram of the backscatter
. The effective off-zenith angle was calculated and applied where necessary in the present study.
Other corrections have been described by [
34] in the ionosphere and [
25] in the mesosphere–lower thermosphere (MLT) region. Ref. [
22] also describes its application to polar mesosphere summer echoes (PMSEs), which are similarly quite aspect-sensitive, and discusses some of the limitations of the approach that are relevant here. It was noted that it is best suited to small values of
and becomes increasingly insensitive as it increases and that there is also a question around the most suitable time interval over which to calculate it. For a statistically valid measure of momentum flux, long averaging intervals of the mean square radial velocities are required, but during this period
and hence
will vary, as we see below, but the application of Equations (3) and (4) requires a single value of
for the averaging interval, and so we have two competing requirements. In this work, we used the average values calculated for all observations. Another relevant study is that by [
35] who used hybrid Doppler interferometry (HDI) with the Buckland Park Medium Frequency (MF) DBS radar [
36,
37] to measure angles of arrival within radar beams of comparable width to those of the Lindau radar. These also showed great variability, and so while the beam look directions can be corrected in a mean sense, we can expect considerable variability and thus uncertainty over time. We begin our analysis with this correction.
3.3. Aspect Sensitivity and Effective Beam Angles
The aspect sensitivity of the atmosphere can be quantified using the approaches described by [
33], and
Figure 4 also shows the scattering angles
corresponding to the vertical beam SNRs. These have been calculated using individual (~3 min) profiles of returned power. The scattering angle is a measure of the anisotropy of the backscatter from the atmosphere, and in this figure, it tends to be small, with values of between 5 and 10°, that is, it suggests an anisotropic scattering process, but there are many periods with much larger (more isotropic) values. Unlike the values below 8 km, the values near the radar tropopause are unlikely to be representative because the off-zenith beam SNRs are very low.
The Harz radar beams are also relatively wide, and the correction for aspect sensitivity has also been applied to that radar,
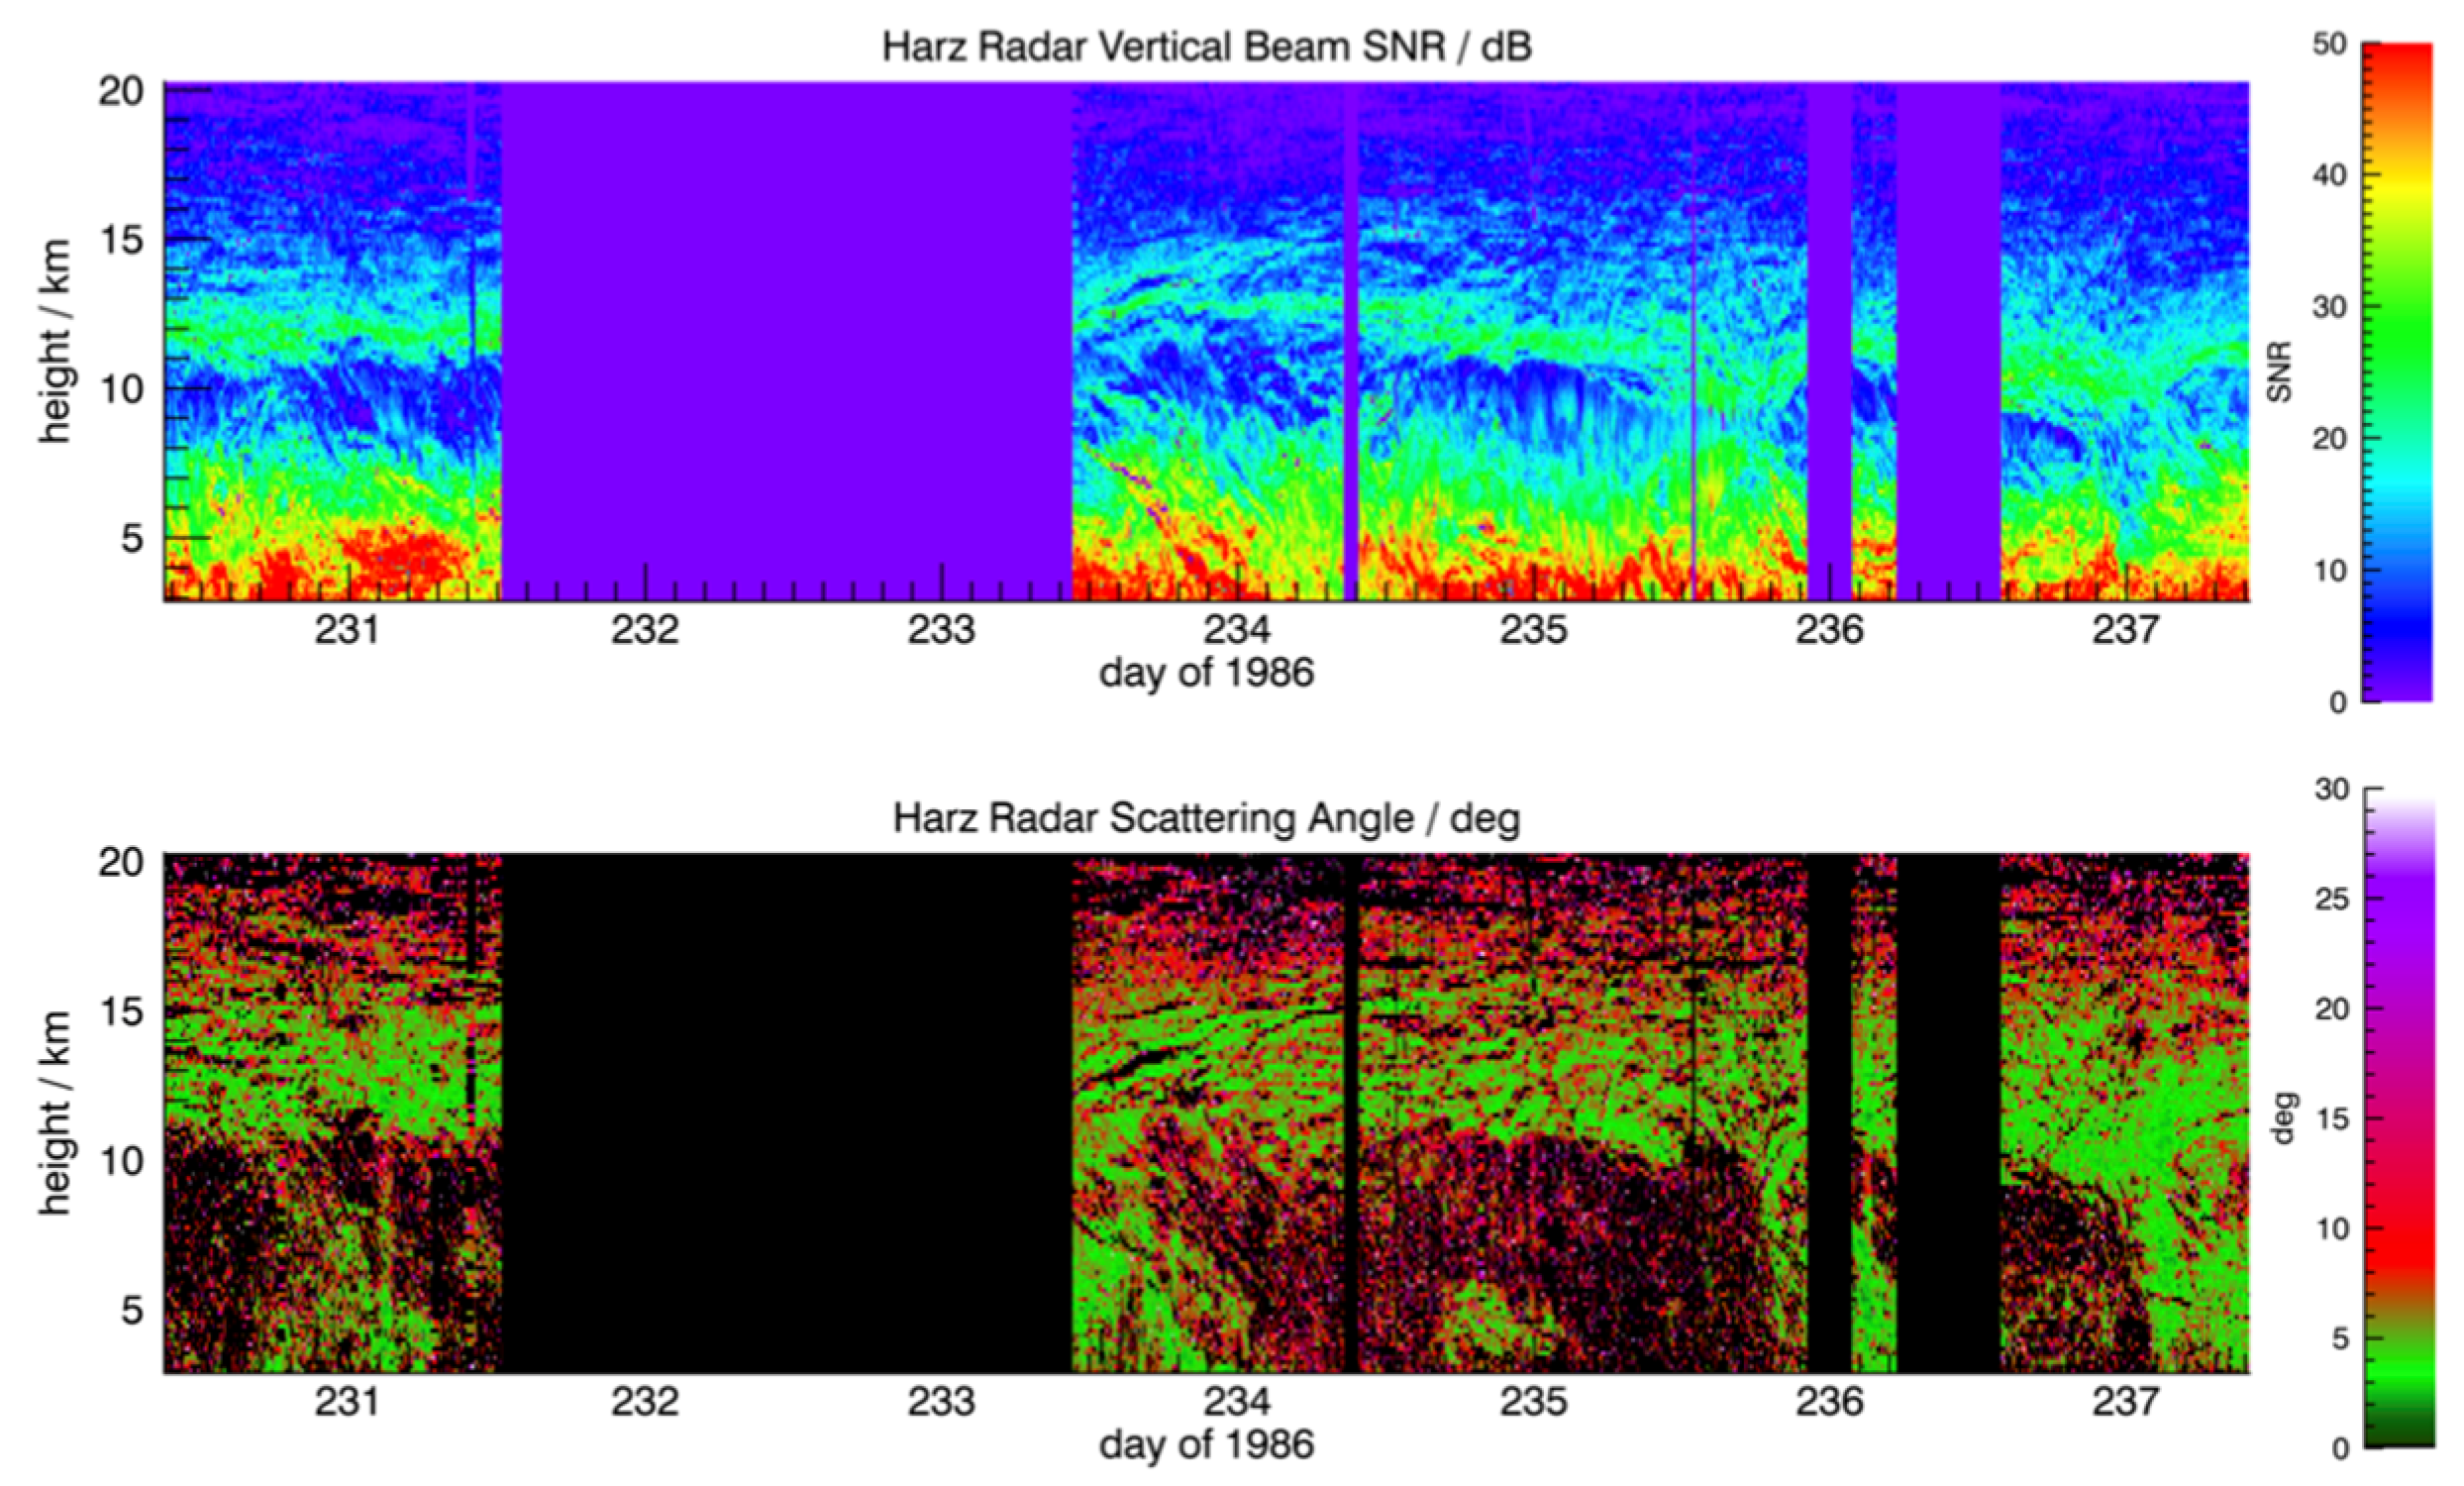
Figure 5 shows the SNR and scattering angle for the Harz radar for the entire observational period. The relative variations in power are similar to those of the Lindau radar and so show that the Lindau results do provide a good indication of the height of the radar tropopause. In the region below the tropopause, the variations in the Harz values of
are similar to the Lindau results, varying between 3.5° and 10°. More confidence can be taken in the values near the tropopause in the Harz case, and these are small, generally less than 5°. The need for correction for aspect sensitivity when using the Harz radar was also noted by [
38].
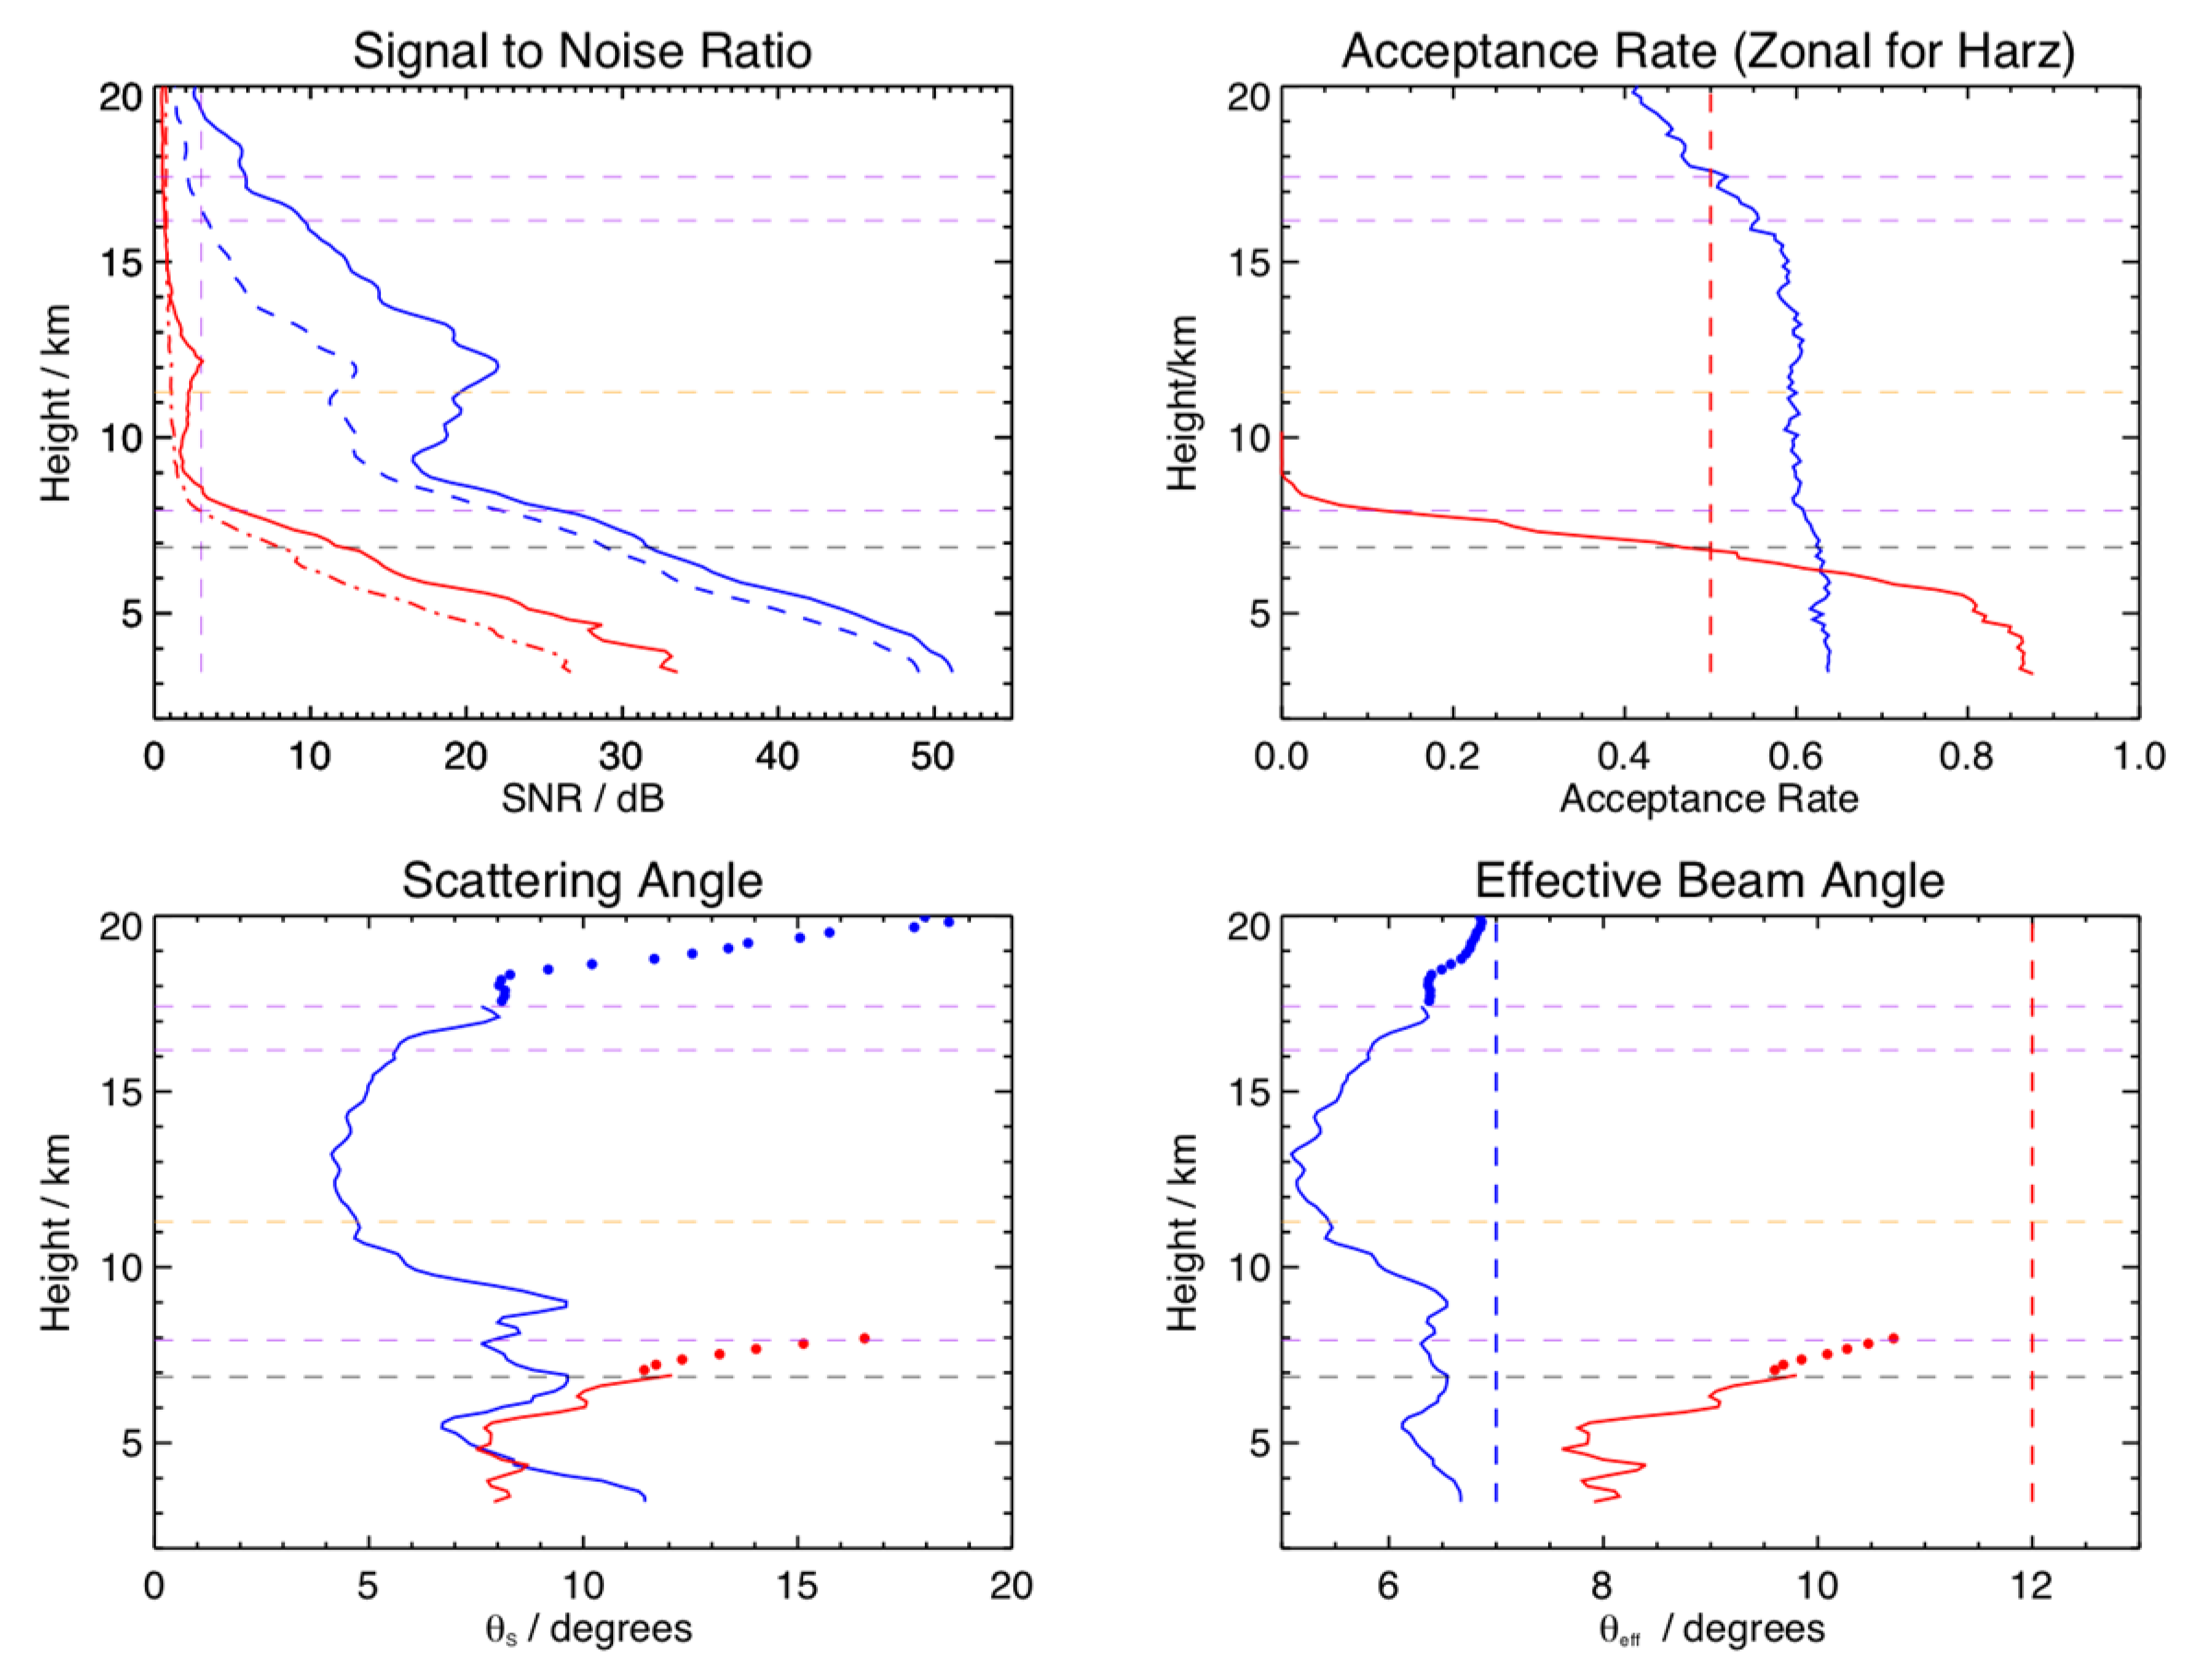
Figure 6 shows a summary of the vertical and off-vertical signal-to-noise ratios, aspect sensitivity, and effective beam directions measured by the two radars for the entire observational period. For the Lindau radar, the mean of the four off zenith power profiles has been used. For the Harz radar, we have used the EW 7° and 7.5° beams together to obtain coverage through the entire period. There is a 3 dB difference in SNR between the vertical and off-vertical beams for the Harz radar. There is about a 7 dB difference for the Lindau radar up to about 6.5 km, above which the off-vertical and vertical SNRs converge, apparently converging at 0 dB at 9 km. This suggests that the SNRs in the off-vertical beam are not representative because of lower data rates above about 6.5 km. The SNRs in the vertical beams for both radars fall off at about 7.4 dB per km until about 9 km. At this height both vertical and off-vertical profiles of the Lindau radar SNR are below the 3 dB noise threshold. The Harz radar vertical beam SNRs recover through the radar tropopause, increasing by about 1.7 dB per km until peaking near 12 km, before falling off again by about 3.1 dB per km until 19 km. The mean vertical beam radar tropopause is located just below 12 km for both radars, with a 19.1 dB difference in the SNRs. There is a 19.6 dB mean difference in the vertical beam SNRs between the Harz and Lindau radars below 7.5 km. This is in fair agreement with the ratio of 21.4 dB for the power–aperture (PA) products of the two radars.
The aspect sensitivity results for the Lindau radar have been restricted to heights where the corresponding off-zenith SNR is greater than 3 dB, which corresponds to about a 12.5% off-vertical beam radial velocity acceptance rate. There is general agreement between the aspect sensitivity of about 7° to 11° measured by the Lindau and Harz radars between 4 and 6.5 km before the Lindau results increase. Below 4 km, the Harz results are about 4° larger. The Harz results are around 8.5° below 9 km before falling to around 5° above that height. The corresponding effective beam angles show an underestimation of the apparent beam angle for both radars. This varies from about 0.5° to 2° for the Harz radar and from 1° to 4° for the Lindau radar. Further studies of lower atmosphere aspect sensitivity using the Harz radar have been reported by [
33,
38].
The 15° off-zenith Harz SNR results were analyzed and found to conform with a Gaussian falloff in power with increasing off-zenith angle. The 15° off-zenith beam SNRs fall to 3 dB near 11 km and to 0 dB near 20 km. It is generally accepted that in the lower VHF band, the scattering angle falls off as a Gaussian from the zenith, but somewhere between there and 15°, it takes on a more isotropic value. This means that wider beams can be used at larger angles without the need to correct for aspect sensitivity. Many DBS VHF radars are designed with this in mind and operate extremely well with an off-zenith angle of 15° (see e.g., [
27]). We do note, however, that [
39] used the MU radar (see e.g., [
40]) with 320 beam directions to investigate aspect sensitivity and argued that there was no angle between 0° and 40° off-zenith at which non-aspect-sensitive scatter was always observed in the lower-VHF band. These authors were most interested in estimating turbulence intensity, where this is likely to be an issue.
To verify that our aspect sensitivity corrections were valid, we compared daily corrected winds from each radar and the radiosonde winds from Hannover and Essen. These showed excellent agreement, and so we have confidence that this approach is valid for subsequent calculations, at least for periods of this and longer durations.
3.4. Mean Winds
During the observational period, the jet stream was located over northern Germany. Sonde launches were available from Hannover, about 90 km distant NNW from the Harz radar. These help interpret the winds above about 8 km in the case of the Lindau radar, and provide insight into the meridional winds in the case of the Harz radar. Sonde winds show that the jet moves back and forth over northern Germany, taking maximum zonal wind values at the beginning of the campaign, again near the middle of the campaign, and finally at the end of the campaign. The peak value is + at 11.6 km at day 234.0. All zonal wind values are positive. The meridional winds vary between at 9.8 km on day 233.0 and at 9.3 km on day 235.5. Meridional winds take a value greater than at the time zonal winds exceed + on day 237. The tropopause is located at about 11.3 km for the Hannover radiosonde results. The mean radiosonde wind results from radiosondes launched from Essen, about 241 km distant SSW from the Harz radar are quite consistent with the Harz results and indicate a tropopause height of about 11.5 km.
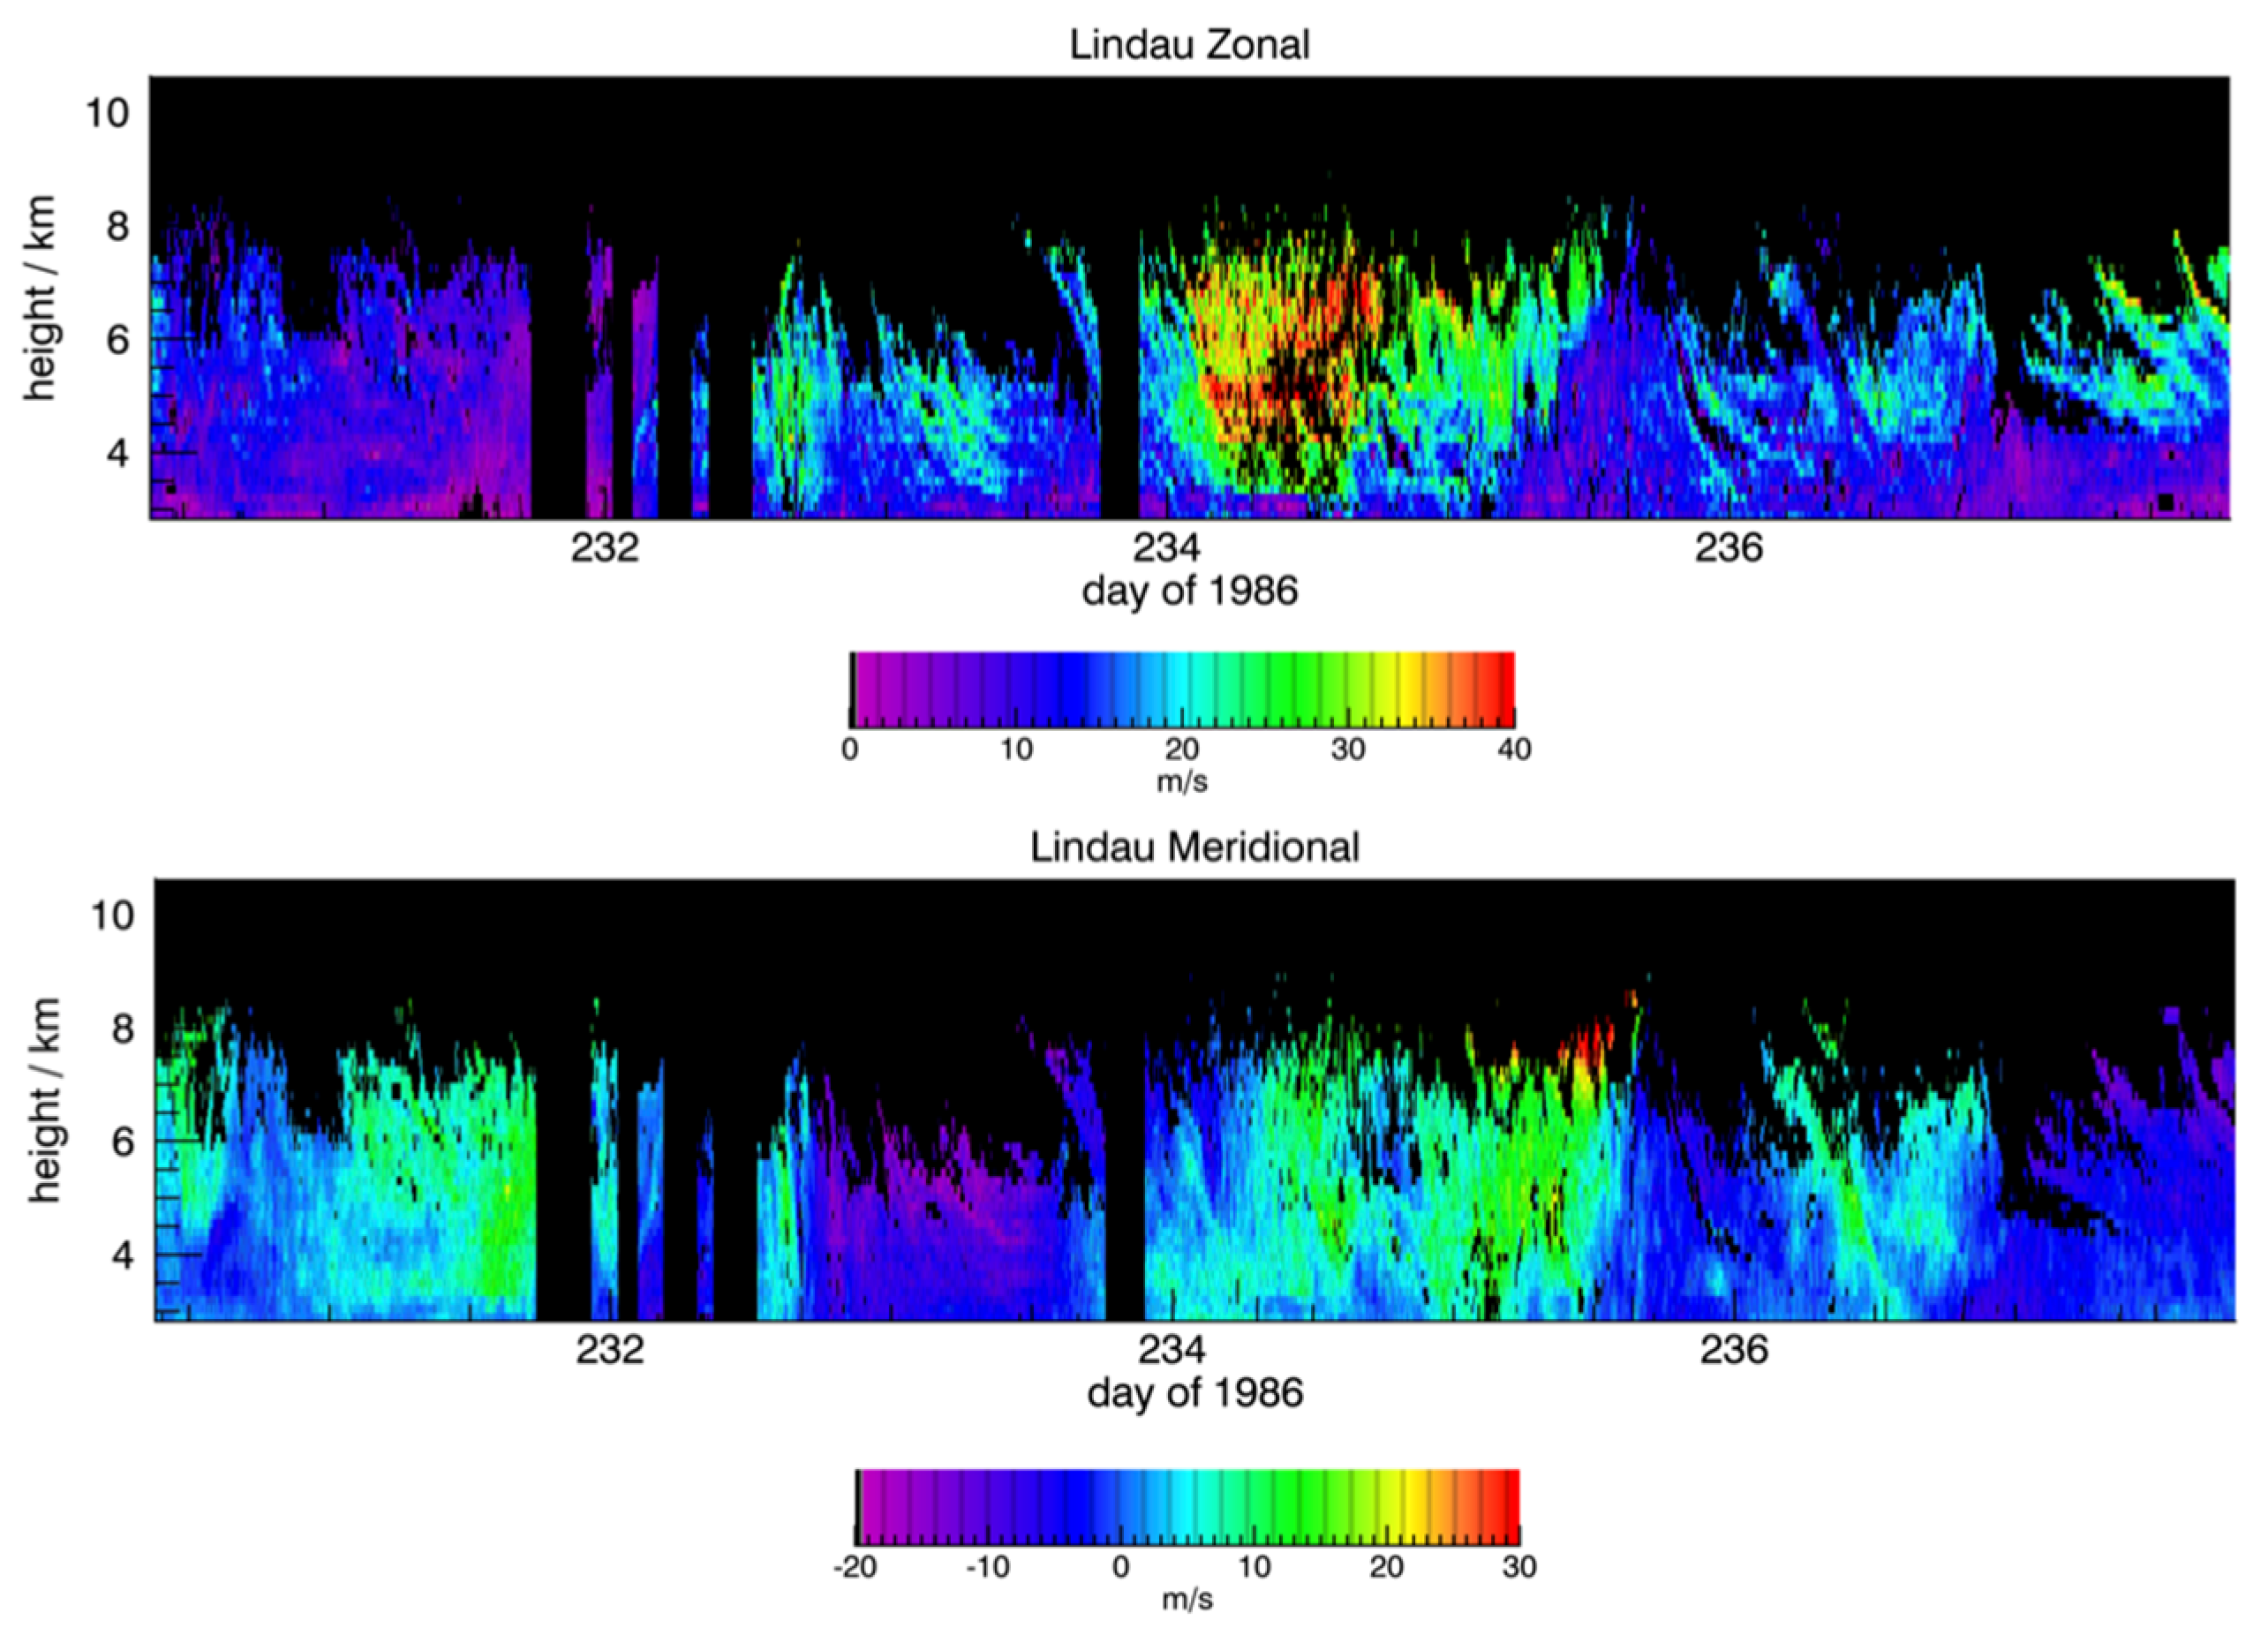
The winds measured during the campaign with the Lindau radar are shown in
Figure 7. The winds measured using the Harz radar are shown in
Figure 8. These diagrams clearly illustrate the periods of missing data for each radar for the campaign. The mean winds have been calculated from individual 3 min mean radial velocity profiles as:
and:
As we have noted above, in the case of the Lindau radar, the beamwidths are large, but in the case of the off-vertical beams can be corrected in a mean sense for aspect sensitivity. This is not so for the wide vertical beam, and so this approach to obtaining the horizontal winds was used. This is preferrable in any case than using only a vertical and an off-vertical beam, because the latter approach results in a term that depends on the vertical velocity
, which in the case of an eastward and vertical beam is:
where
is the mean zonal wind velocity and
is the height. The error associated with this is small, but there is no such error in Equation (6) or (7). This is discussed extensively by [
23]. We note that Equations (5) and (6) are also special cases of the VAD analysis described by [
18], and the interested reader is directed there for a full discussion.
There is good agreement between the form and magnitude of the radiosonde and radar winds. The lower levels of the jet are clear in the Lindau zonal winds during day 234 and in the meridional during day 233, and the development of the jet is quite evident in the Harz zonal winds. The zonal wind ranges from to + and the meridional from − to + . The maximum in the zonal wind jet occurs during the 2-day period (day 233.429 to day 235.51) when the Harz radar was operated with beams directed at 7.5° and 15° off-zenith towards the east and west.
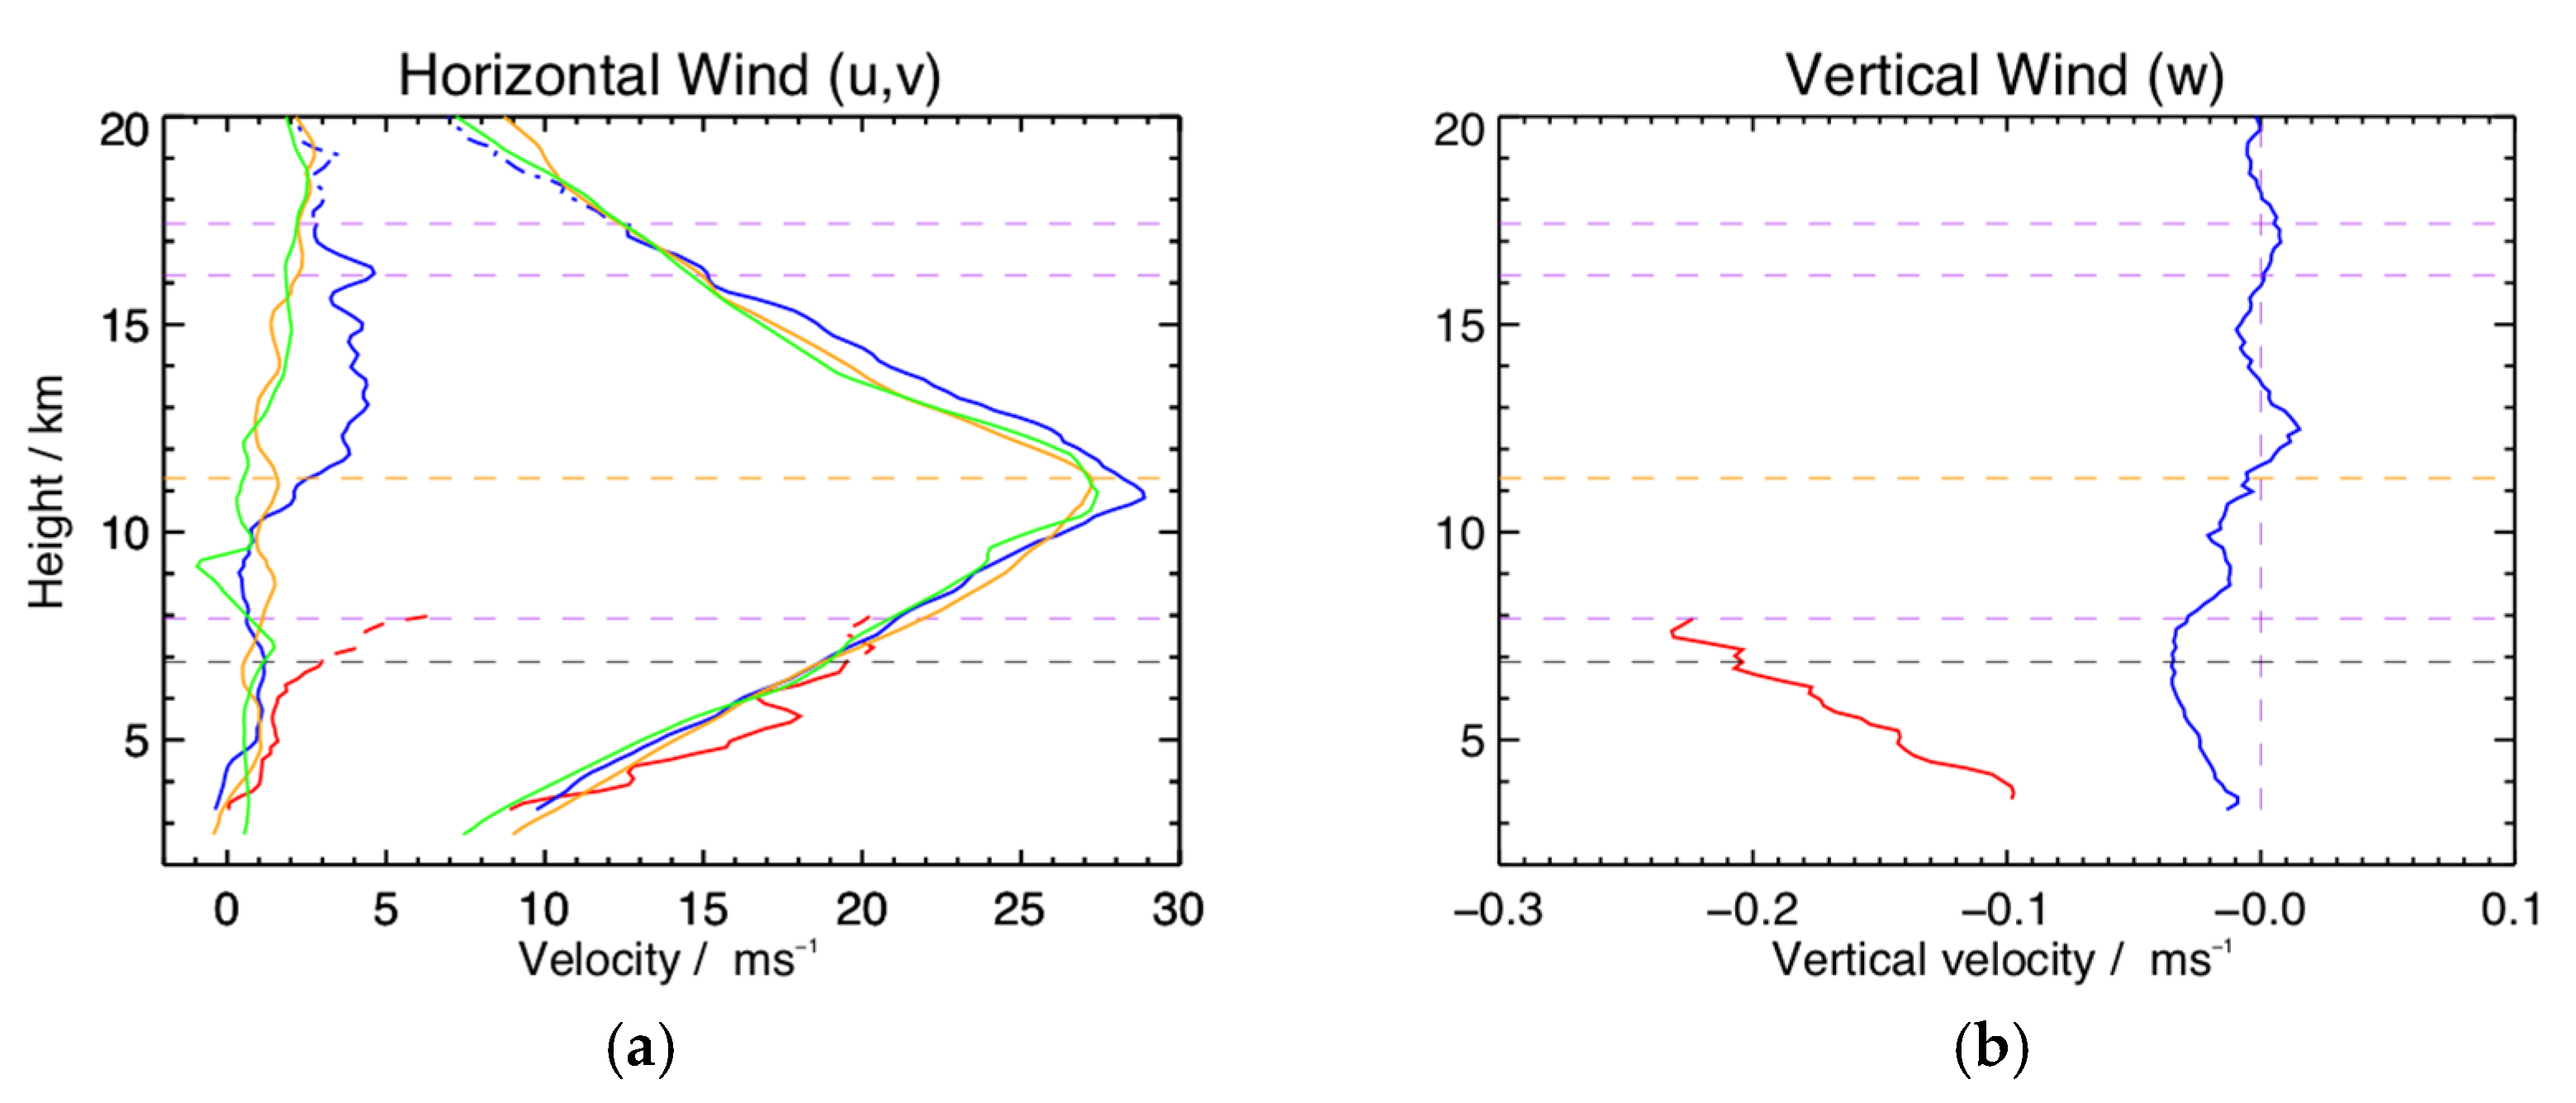
The zonal mean wind profiles for the two radars over the entire observational period corrected for aspect sensitivity are shown in
Figure 9. The Harz radar provides a profile to 20 km, with a jet with a mean maximum velocity of about
near 11 km. The mean SNR is equal to 3 dB near 16.2 km, the 50% acceptance rate is near 17.5 km, and we have used a broken line for the profile above this height. The Lindau radar zonal wind profile agrees well with that of the Harz radar to a height near 7 km. The 50% height is 6.9 km, and we have used dotted lines above this level. This appears to be the maximum usable mean height if we take the Harz profile as a reference. Above this height, the profile increasingly diverges from the Harz values. This is not due to the aspect sensitivity correction, as the uncorrected values are very similar in form. Rather, it seems to be due to the limited number of accepted velocities, and inspection of the SNR profile shows the mean off-vertical beam profile below 3 dB at 7.9 km. Some of the small-scale structure in the Lindau profile does result from the correction for the aspect sensitivity and is likely a limitation to this approach to wind profiling (small array, wide beams). The Lindau meridional profile indicates light mean winds in this direction, but we have noted the considerable variation from day to day in both the radar and radiosonde winds in this component. We note that the Harz radar meridional winds correspond to about 2 days of observations only.
This figure also shows the mean Hannover and Essen radiosonde winds. The Hannover winds are the mean of 35 6 h-interval flights (one missing), the Essen profiles the mean of 15 12 h-interval flights (one missing). The aspect sensitivity correction results in a larger and possibly overcorrected zonal value at the peak of the jet. The uncorrected value is about
lower at the peak of the jet. Ref. [
41] reported on the Harz radar observations during a jet stream passage and noted similar levels of agreement.
Figure 9 also shows the mean vertical velocities for the Harz and Lindau radars for the entire observational period. Harz values are typically less than
. The Lindau magnitudes are much larger, and values range from
. The largest vertical velocities are found during the time of the maximum in the zonal component of the jet during day 234. The measured vertical velocities were compared with the vertical velocities calculated from the off-vertical beams using the expression (for the case of the east and west beams) of:
where
is the mean vertical wind velocity and
is the height. The results agree to within the experimental error for both east–west and north–south beam combinations with similar magnitudes and forms. This consistency suggests that the radar is actually seeing these vertical velocities. A tilted ground plane or persistent tilted scattering structures, and hence tilted beam directions, could result in this agreement, but the tilt would have to be such that the implied vertical velocity from both the east–west and north–south planes was similar, an unlikely condition. In any case, the antenna field was installed in such a way as to ensure that there was no tilt. Despite our argument about the use of vertical and off-vertical beams to calculate the horizontal winds made above for 3 min winds, we also compared the mean horizontal velocities calculated in this way for the entire period of observation as a further check on the vertical velocities. These indicated that the vertical velocities were valid. A net downward motion would be consistent with subsidence associated with the trough indicated by the tropopause height and meridional wind direction at that time. This corresponds to the period in which the Harz radar was offline, and so a comparison of mean vertical velocities over the entire period could represent an averaging bias. However, inspection of the Lindau vertical winds over the entire observational period indicates that the winds during this period are typical of those throughout the 7 days of observation with the caveat that there are data breaks at the time of the trough, but not sufficient to bias the 7-day mean to this extent. Consequently, although the Lindau vertical velocities are much larger than the Harz vertical velocities, we have no reason to believe that the other radial velocities from this radar are incorrect. We note that the Lindau vertical velocities are not used to calculate any additional parameters and that they are effectively excluded from further analysis.
For the Harz results, the sign of the velocity is downward below the mean peak of the jet, a feature noted by [
42], with a zero velocity above when the wavelike variation about the zero-velocity line above the peak of the jet if the mean wind is subtracted. However, their values were closer to
.
3.4.1. Mountain Waves and the Harz
Ref. [
43] provides a review of ST radar observations of waves over mountainous areas and includes a discussion of observations from an internal MPAe report describing SOUSY Harz radar results relating oscillatory height profiles of both horizontal and vertical velocity observed in the troposphere in the fall to mountain lee waves. This work found amplitudes of about
in the horizontal and
in the vertical with a vertical wavelength of about 2 km in the lower troposphere. An extensive series of ST radar investigations of wave motions are those over the Welsh mountains conducted using the Aberystwyth MST radar (see, e.g., [
44,
45,
46], and references therein).
In an interesting discussion, ref. [
47] brings together the history of the theory of mountain waves (with examples from Wales) and pre-war German observations of mountain waves by glider pilots. The Harz are a well-known source of mountain waves, and in the last few decades, the conditions for wave generation have been a subject of investigation by glider pilots for this reason. Ref. [
48] summarizes these results and concludes that mountain waves occur preferentially in the fall and winter months in the lee of the Harz, that is, to the northeast, when the prevailing wind direction is from the southwest with average wind speeds of
(
) or directed more perpendicularly to the longitudinal direction of the mountain range. Ref. [
48] also gives more precise requirements, viz.: (1) the wind direction should be
° between 500 and 5500 m; (2) the wind speed should be more than
on the ground and 18
above; and (3) there should be an inversion layer with an increase of about 1–2 °C between 100 and 200 m above the ridge line or a stable stratification of 1300–2200 m MSL. The first two conditions are met during some periods of our observations, and so we would expect mountain waves to be present some of the time. Surface winds from the Hannover radiosonde observations indicate that all days except for days 232 to 234 and days 235.5 and 237.5 would be conducive to the production of mountain waves. We now consider what wave motions are present in the Lindau and Harz radar data during the observational period.
3.4.2. Wave Motions
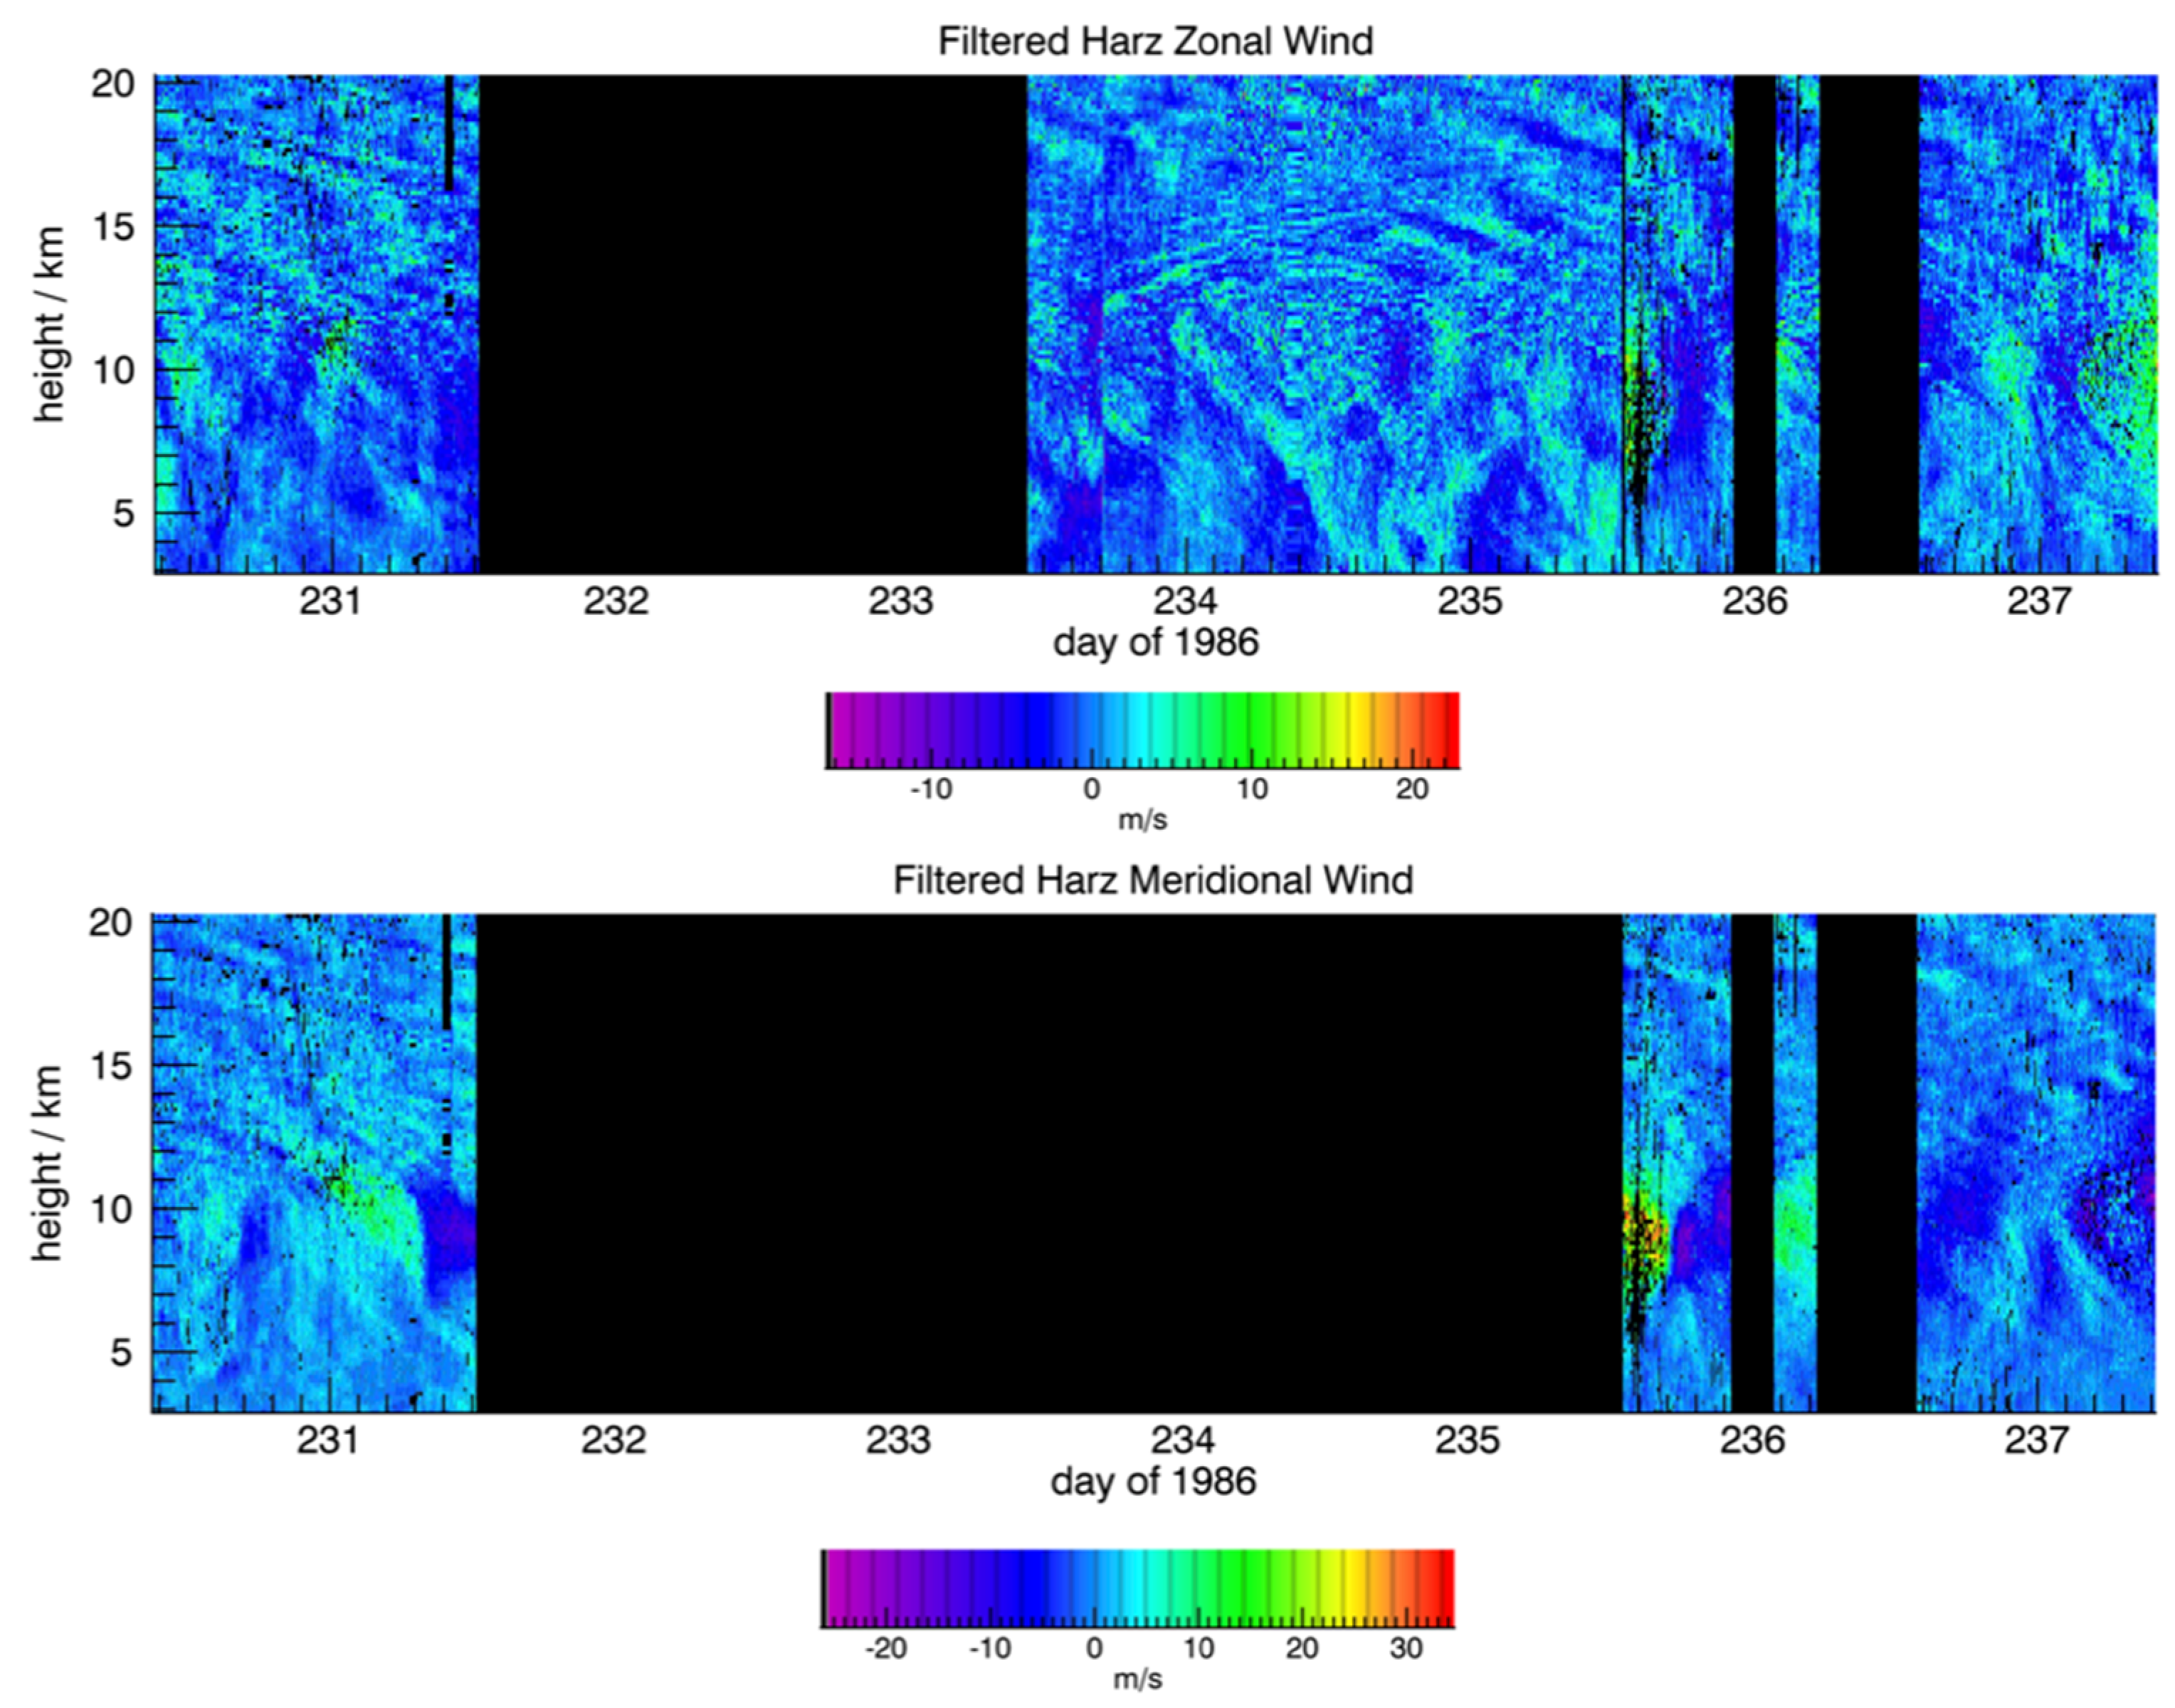
Filtered horizontal winds for the Harz radar are shown in
Figure 10. These show ground-based periods between 0.1 and 15.1 h, the latter period we recall as being the inertial period at this latitude. There are a number of interesting features present. Tilted gravity wave phase fronts are evident both above and below the height of the jet peak. In the stratosphere, these correspond to downward propagation of longer-period waves, evident in both the zonal and meridional wind components (when available). Their period is close to that of the inertial period. Upward propagating waves of shorter period are present above the jet peak on day 234 and 237. In the case of the vertical winds, close inspection indicates vertical phase fronts below the zonal peak of the jet on days 231, 234, 235 and 237. Downward- and upward-propagating waves corresponding to those evident in the horizontal winds are also noted. Similar structures are evident in the SNR and
height–time plots. For example, the Harz values of these parameters show upward-propagating waves on day 233 (see
Figure 5). This kind of correspondence has also previously been noted by [
49].
For the corresponding filtered Lindau winds (not shown in the interests of brevity and because many of the features are evident in the unfiltered winds shown in
Figure 7), both the zonal and meridional components show a dominance of tilted wavefronts corresponding to downward wave propagation for gravity waves. This is most evident after day 232. Prior to this and below about 4 km, the phase fronts are vertical, corresponding to non-propagating waves. In the case of the vertical wind, unfiltered and filtered, the phase fronts indicate non-propagating waves. A generalized Lomb–Scargle periodogram analysis [
50] indicates that near 6 km, the dominant periods in the filtered time series are 3.7, 6.2, and 10.6 h.
In summary, there are both stationary and propagating waves evident in all three components of the winds in the case of the Harz radar and in the horizontal winds of the Lindau radar. The vertical wind component of the Lindau radar is restricted to heights below about 8 km, and in this height range is dominated by stationary waves with amplitudes of in the 0.1- and 15.1 h-period range.
3.5. Momentum Flux
3.5.1. Uncertainties
As we have noted above, the Harz radar was operated with beams directed
for a 2-day period of continuous data during the 7-day observational period. The
terms calculated from the 15° and 7.5° beam pairs are shown in
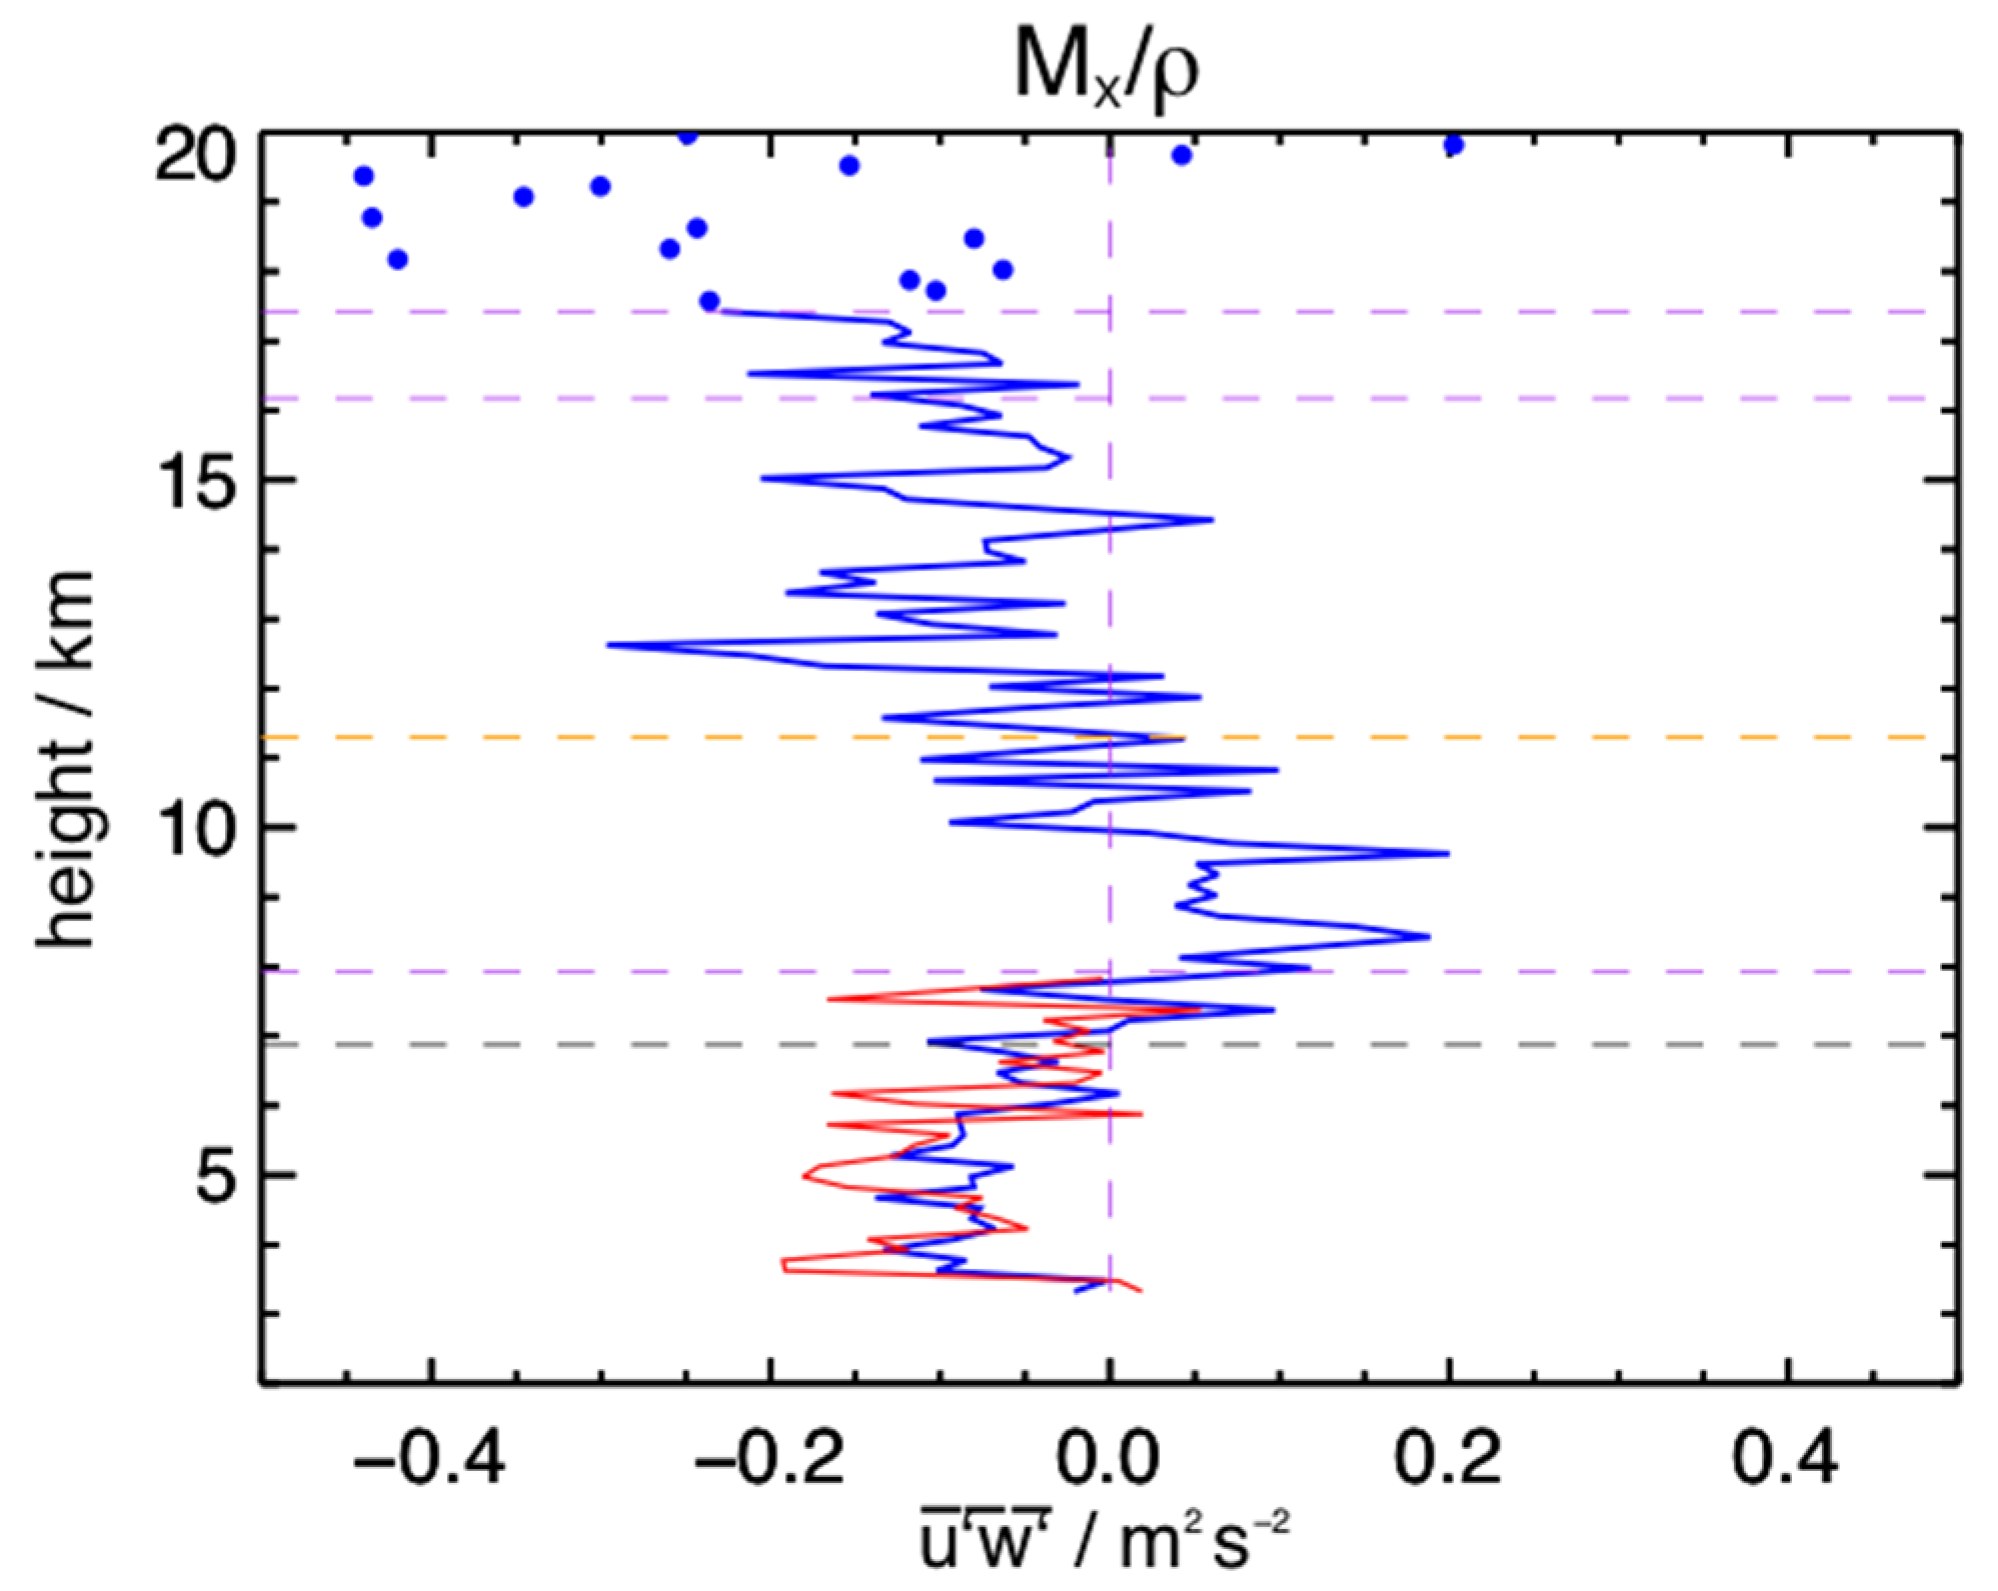
Figure 11. A data corruption error means that radial velocity variances and data rates in the
beam are unsuitable for flux calculations above about 8.0 km, so we have restricted the values for this pair of beams in this figure to heights below this. Coincidentally, this also corresponds well with the Lindau radar height coverage. While the data are unsuitable for flux calculations, the mean radial velocities agree well for the 15° off-zenith beams and the winds calculated from them agree well with those from the 7.5° beams over the entire height range.
Inspection of
Figure 11 indicates that the beam pairs are measuring the same fluxes up to 8 km, with values lying between about
. This suggests that the assumption of horizontal homogeneity of the statistics of the wind variances is valid at least for this period of observation and range of heights. However, we do note that the beams are closely spaced, particularly when the finite beamwidths are considered (see
Figure 3) and the aspect sensitivity is taken into account, so this may not be a general result. It does provide confidence that local effects due to orography are minimal for the Harz radar for this period in this height range and that we may validly compare the Harz and Lindau radar
terms. If we accept that the beams are measuring the same quantity, then we may use the mean relative absolute difference between them to estimate an uncertainty. The corresponding value for this height range for this period is
. We will return to these Harz radar results below.
The corresponding uncertainty for the Lindau radar is expected to be higher than this because of the lower SNRs and larger beamwidths, but we have no direct way of calculating the instrumental uncertainties directly from the observations. Instead, we have calculated the RMS error from the daily observations, used the mean absolute value of this error calculated over the valid height range of the observations, and then used the mean absolute value of the flux over the same height range to calculate a mean relative error for the entire observational period. This results in a value of for the Lindau radar for the term and for the term. These values include both geophysical variations and instrumental uncertainties. As a comparison, if we apply the same approach to all of the Harz results for the height range up to 8.0 km appropriate to the two-day period discussed above, we obtain values of and , noting that we have only 5 and 3 days of data for the and terms, respectively. For the entire height range, the respective values are and . Again, these values will contain both instrumental and geophysical contributions. Consequently, we choose to use the directly measured value of for the instrumental uncertainty in the Harz radar and terms over the entire height range in the remainder of this work.
3.5.2. The Lindau Radar
The
terms for the entire campaign for the Lindau radar are shown in
Figure 12. The 50% acceptance and 3 dB heights are indicated (6.9 and 7.9 km, respectively), and the error bars for a mean relative error of
respectively, are plotted. Values of the density-normalized fluxes are similar in form and magnitude and generally less than
and increase from negative values below about 3.7 km to positive values above for the
component and negative values below 4 km to positive above for the
component. The useful height coverage is limited, from 3.3 to 6.9 km, but the height resolution is very good, at 150 m. The profiles themselves are quite noisy, so this may not be an advantage, and using a longer pulse would produce a natural range averaging and increase height coverage. As we have noted above, the height range could have been extended down to 1.4 km for this radar by alternating a monopulse experiment with the coded pulse experiment, as used by [
26].
3.5.3. Radar Comparisons
Using the Gadanki MST radar, ref. [
51] found that averages of about one day led to statistically valid measurements of tropospheric and lower stratospheric momentum flux, and so we begin by comparing daily results from the Harz and Lindau radars.
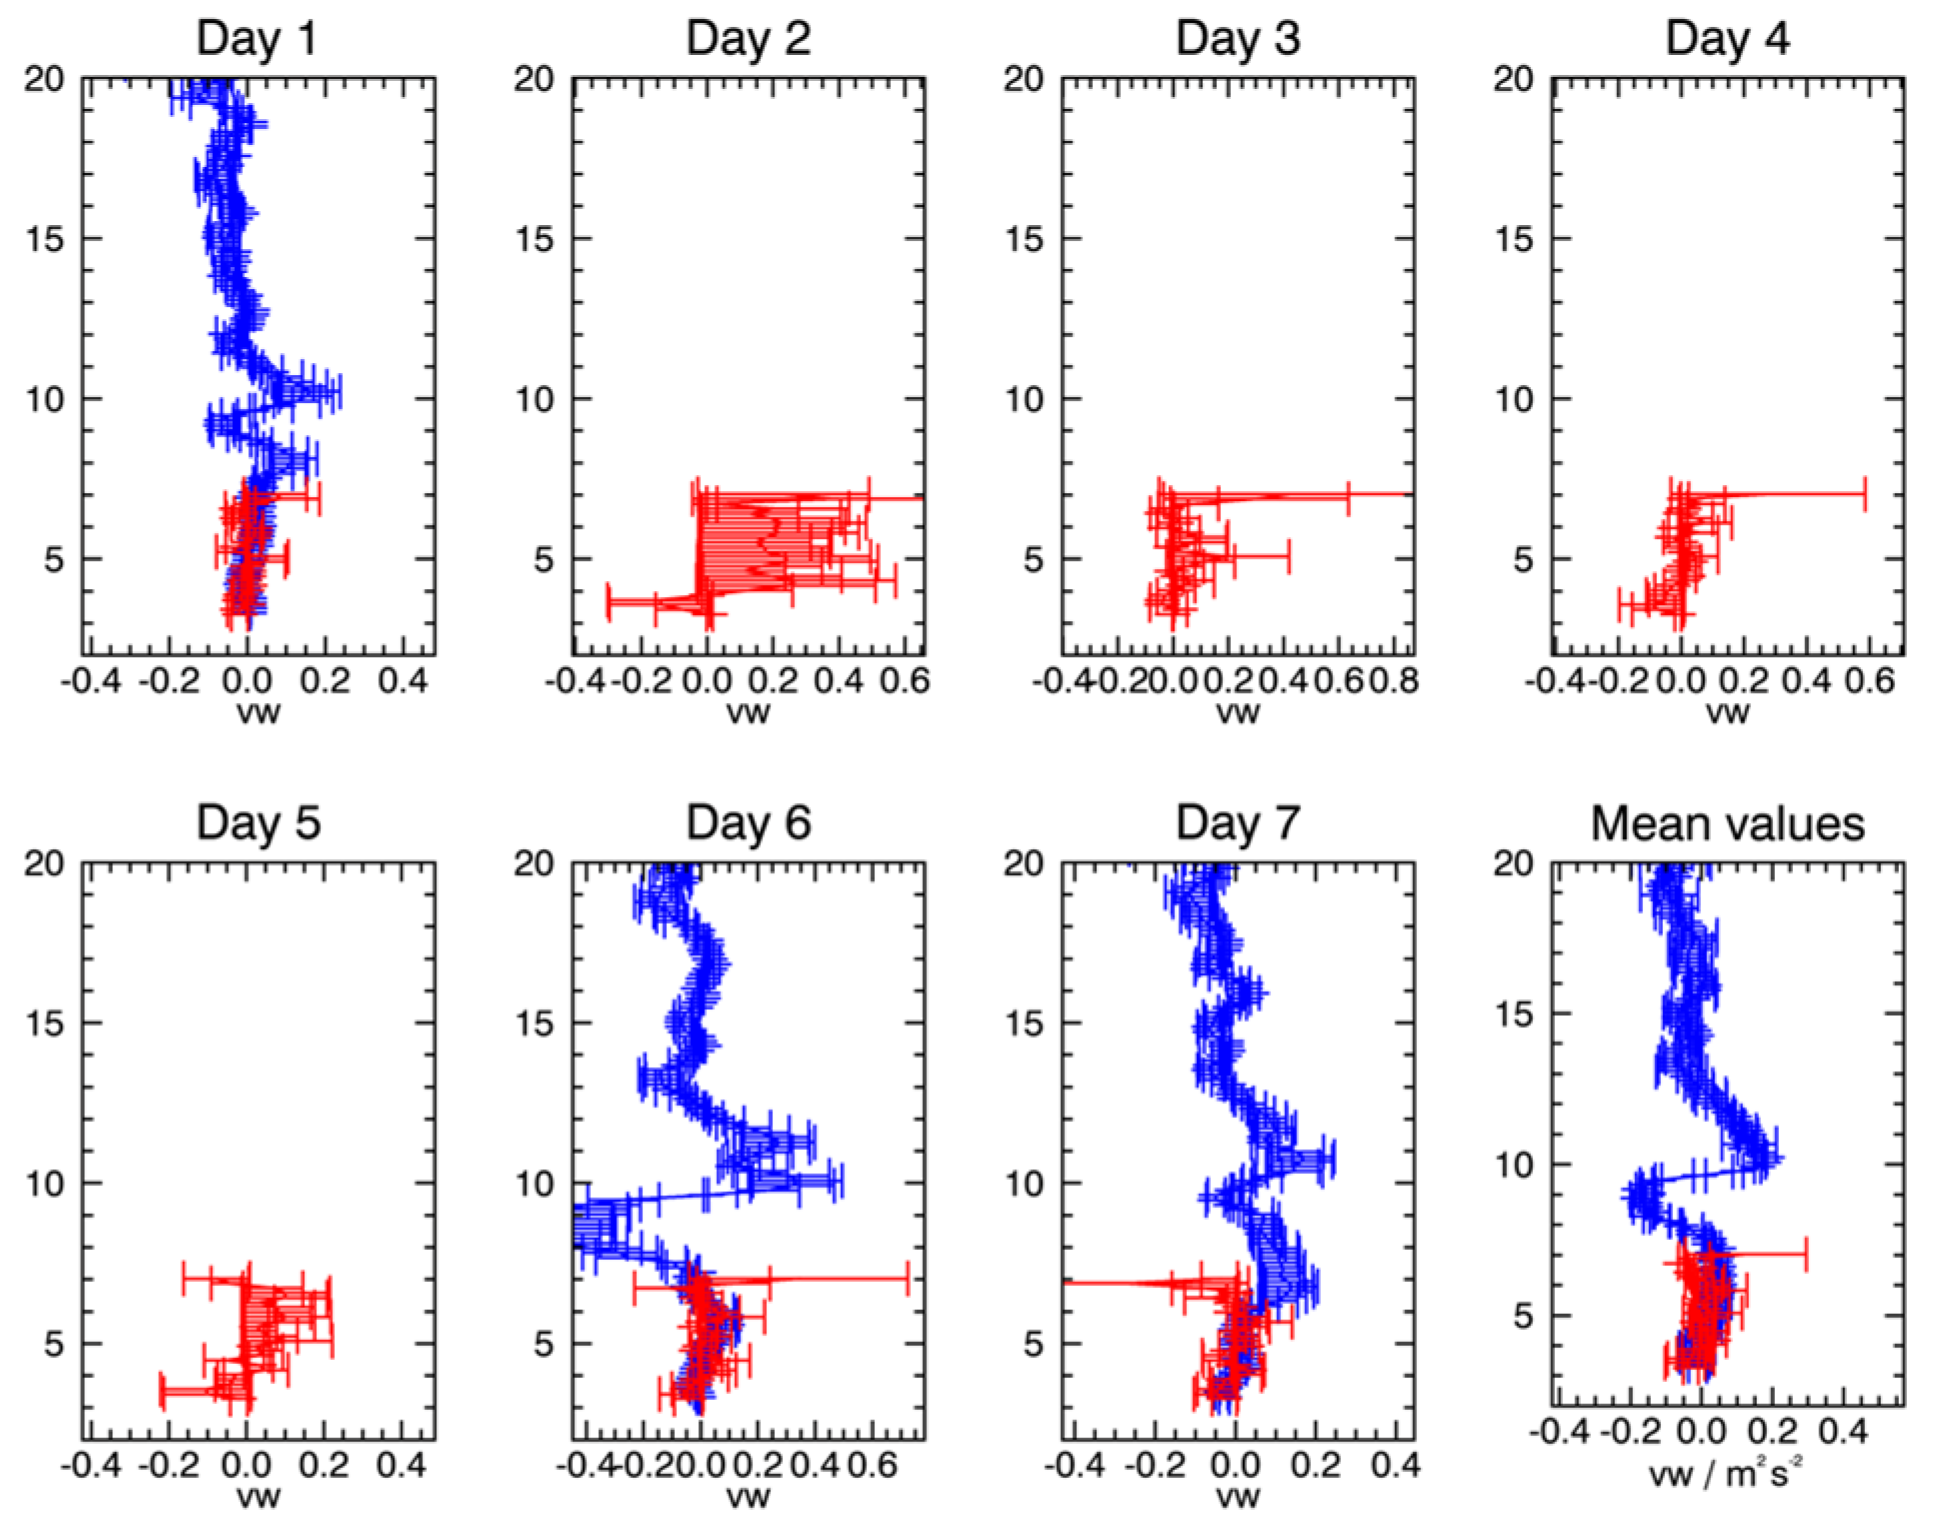
Figure 13 summarizes these for the
component and
Figure 14 for the
component. We note that day 2 of the Lindau results and day 6 of the Harz results correspond to the periods of intermittent operation of those radars. The error bars have been calculated as described above. The overall mean is for those days with simultaneous data. For the
component we find general agreement on days 1, 6 and 7. The values for days 4 and 5 generally agree to within the experimental uncertainties, with a bias towards more positive values for the Lindau radar. The mean values generally agree, but again with a bias to more positive mean values for the Lindau radar. For the
component, there is good agreement for all overlapping days (1, 6 and 7) and the means agree, with no obvious bias. Mean values of both flux terms for both radars are typically in the
range.
The combination of experimental design and equipment outages yield two periods of about 2–3 days each, one with the EWNSV beam arrangement, and one with the EWEWV beam arrangement for the Harz radar. The former configuration consists of data from days 1, 6, and 7. The latter configuration consists of days 4 and 5 near the middle of the campaign, those for which we have calculated uncertainties in the measurements of the term above. We now consider these two datasets before considering the overall flux values for the Harz radar. The first dataset consists of data from the EWNSV configuration of the campaign.
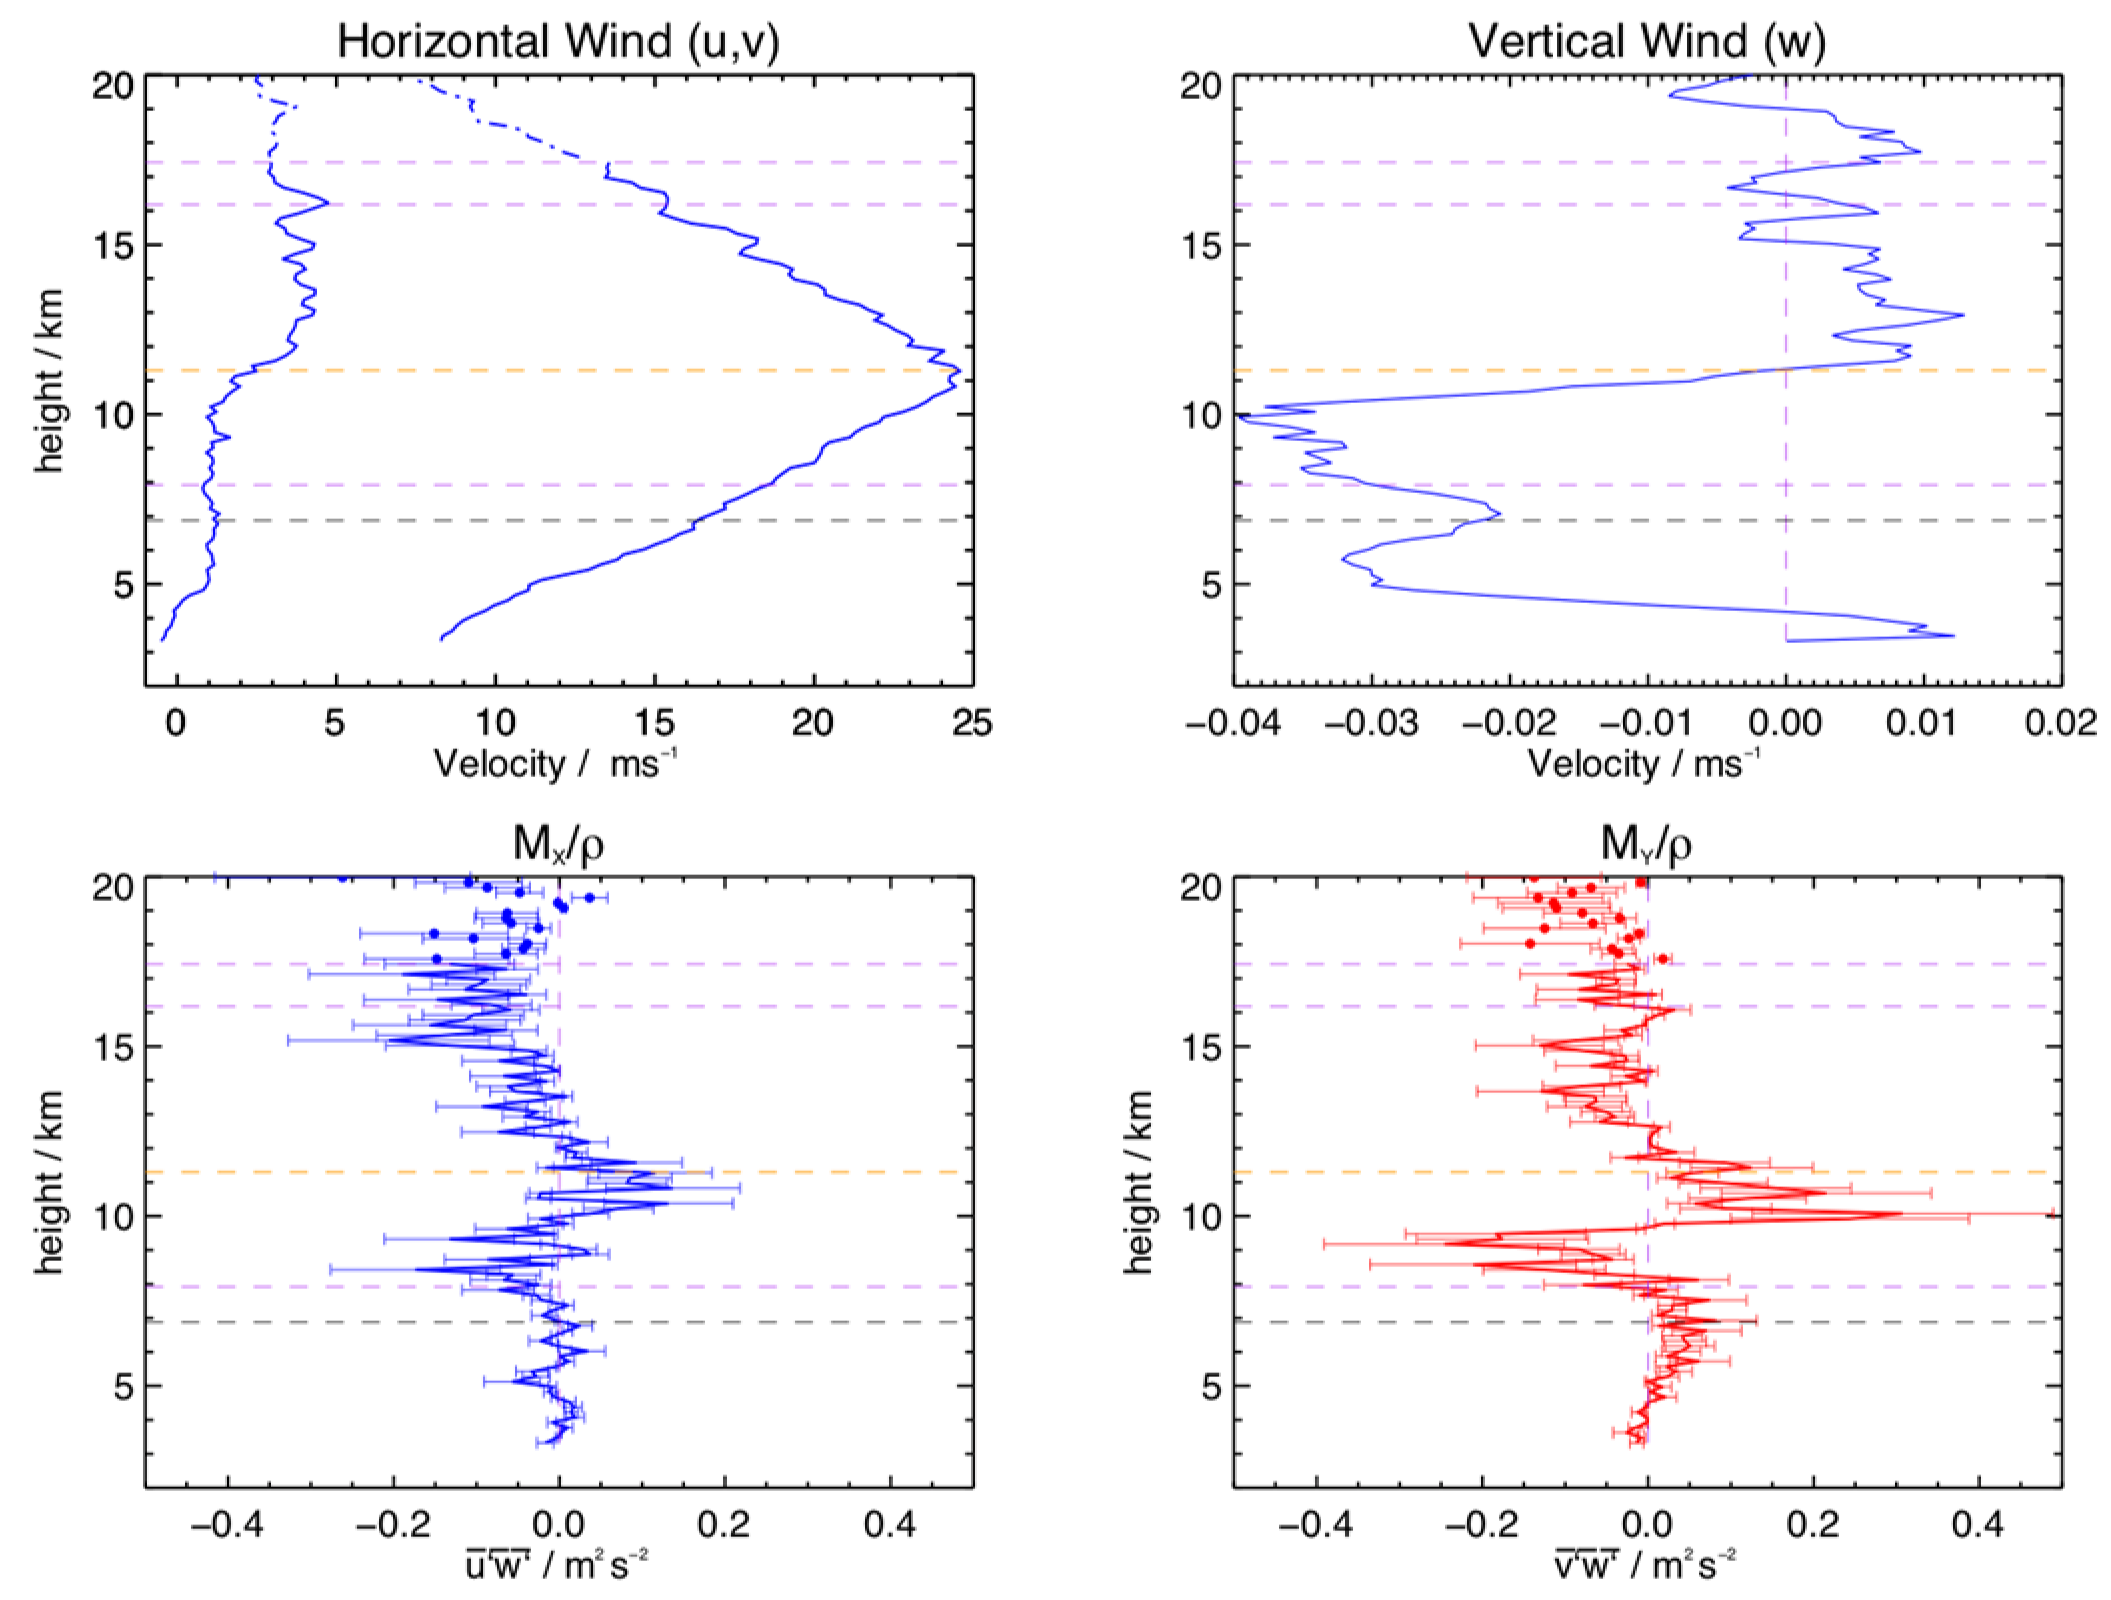
There are approximately three days (days 1, 6, 7, so spread over the first and last days of the 7 days of the observations; see
Figure 8) of results from the Harz radar that yield both the
terms. It is useful to consider these data separately, because both flux terms are available and the height coverage is much greater for this radar.
Figure 15 shows the mean horizontal and vertical winds and the density-normalized flux terms. The zonal jet peaks near 11.5 km at about +
. The mean meridional winds are less than about +
and increase gently with height. The mean vertical winds are less than 0.
in magnitude and are negative below the peak of the jet, and positive above, again as noted by [
26]. The
terms are generally less than
and both maximize at about the height of the peak of the jet.
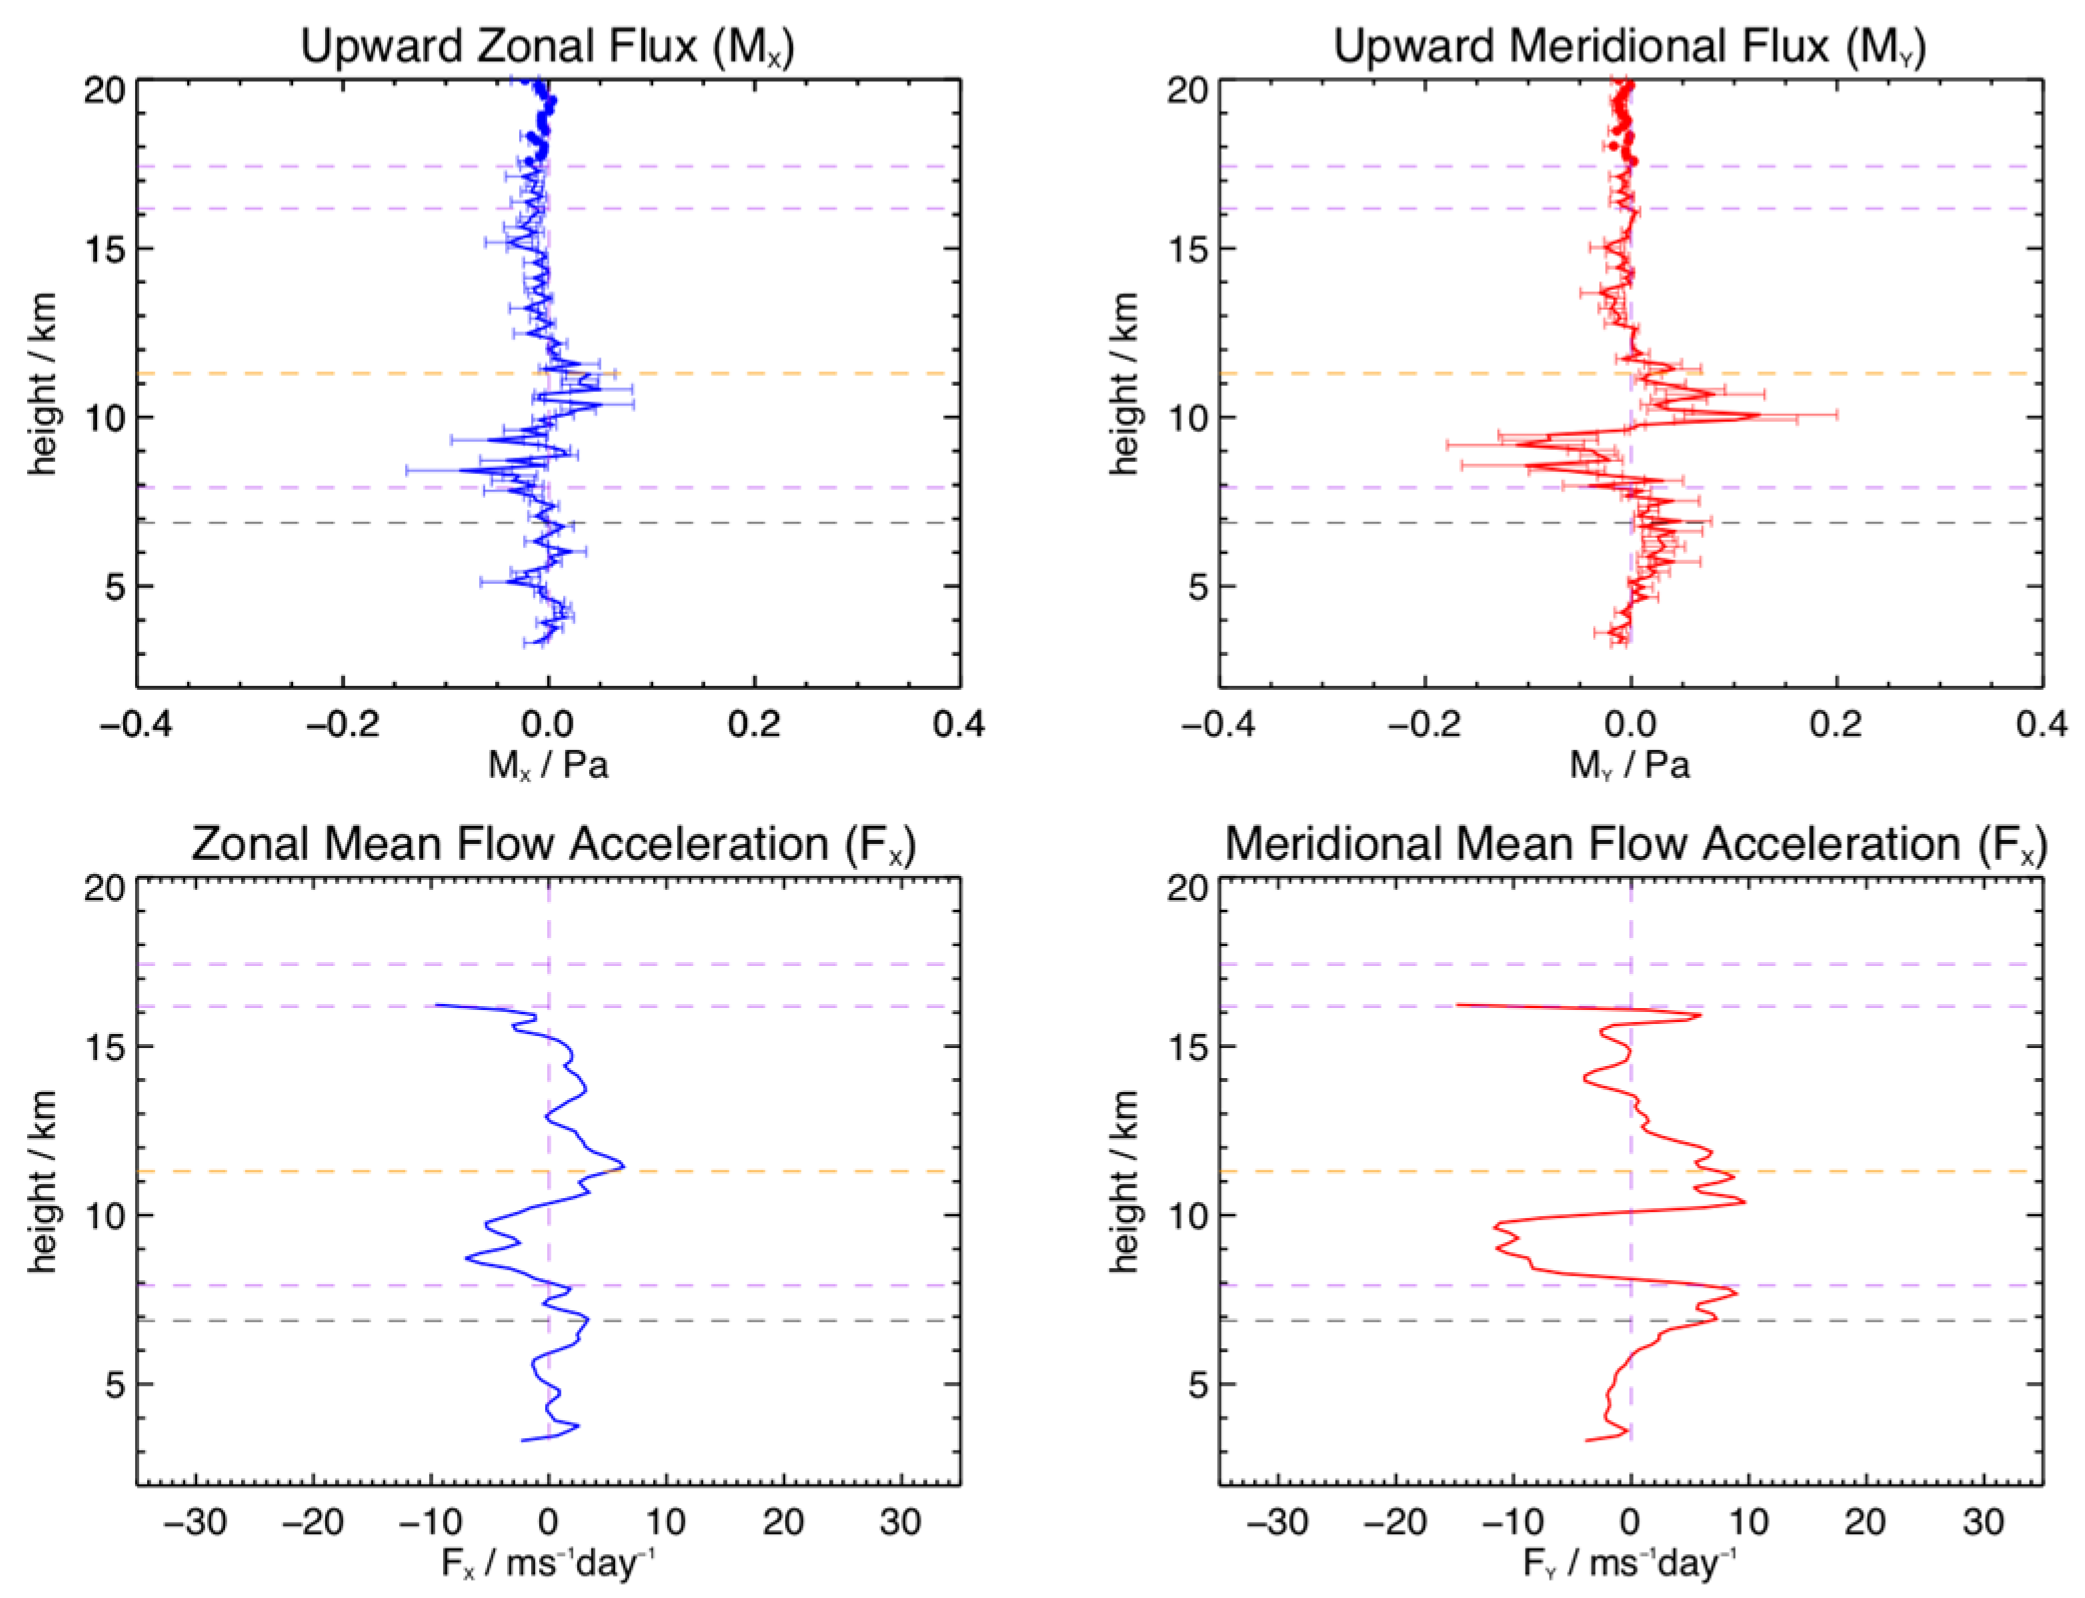
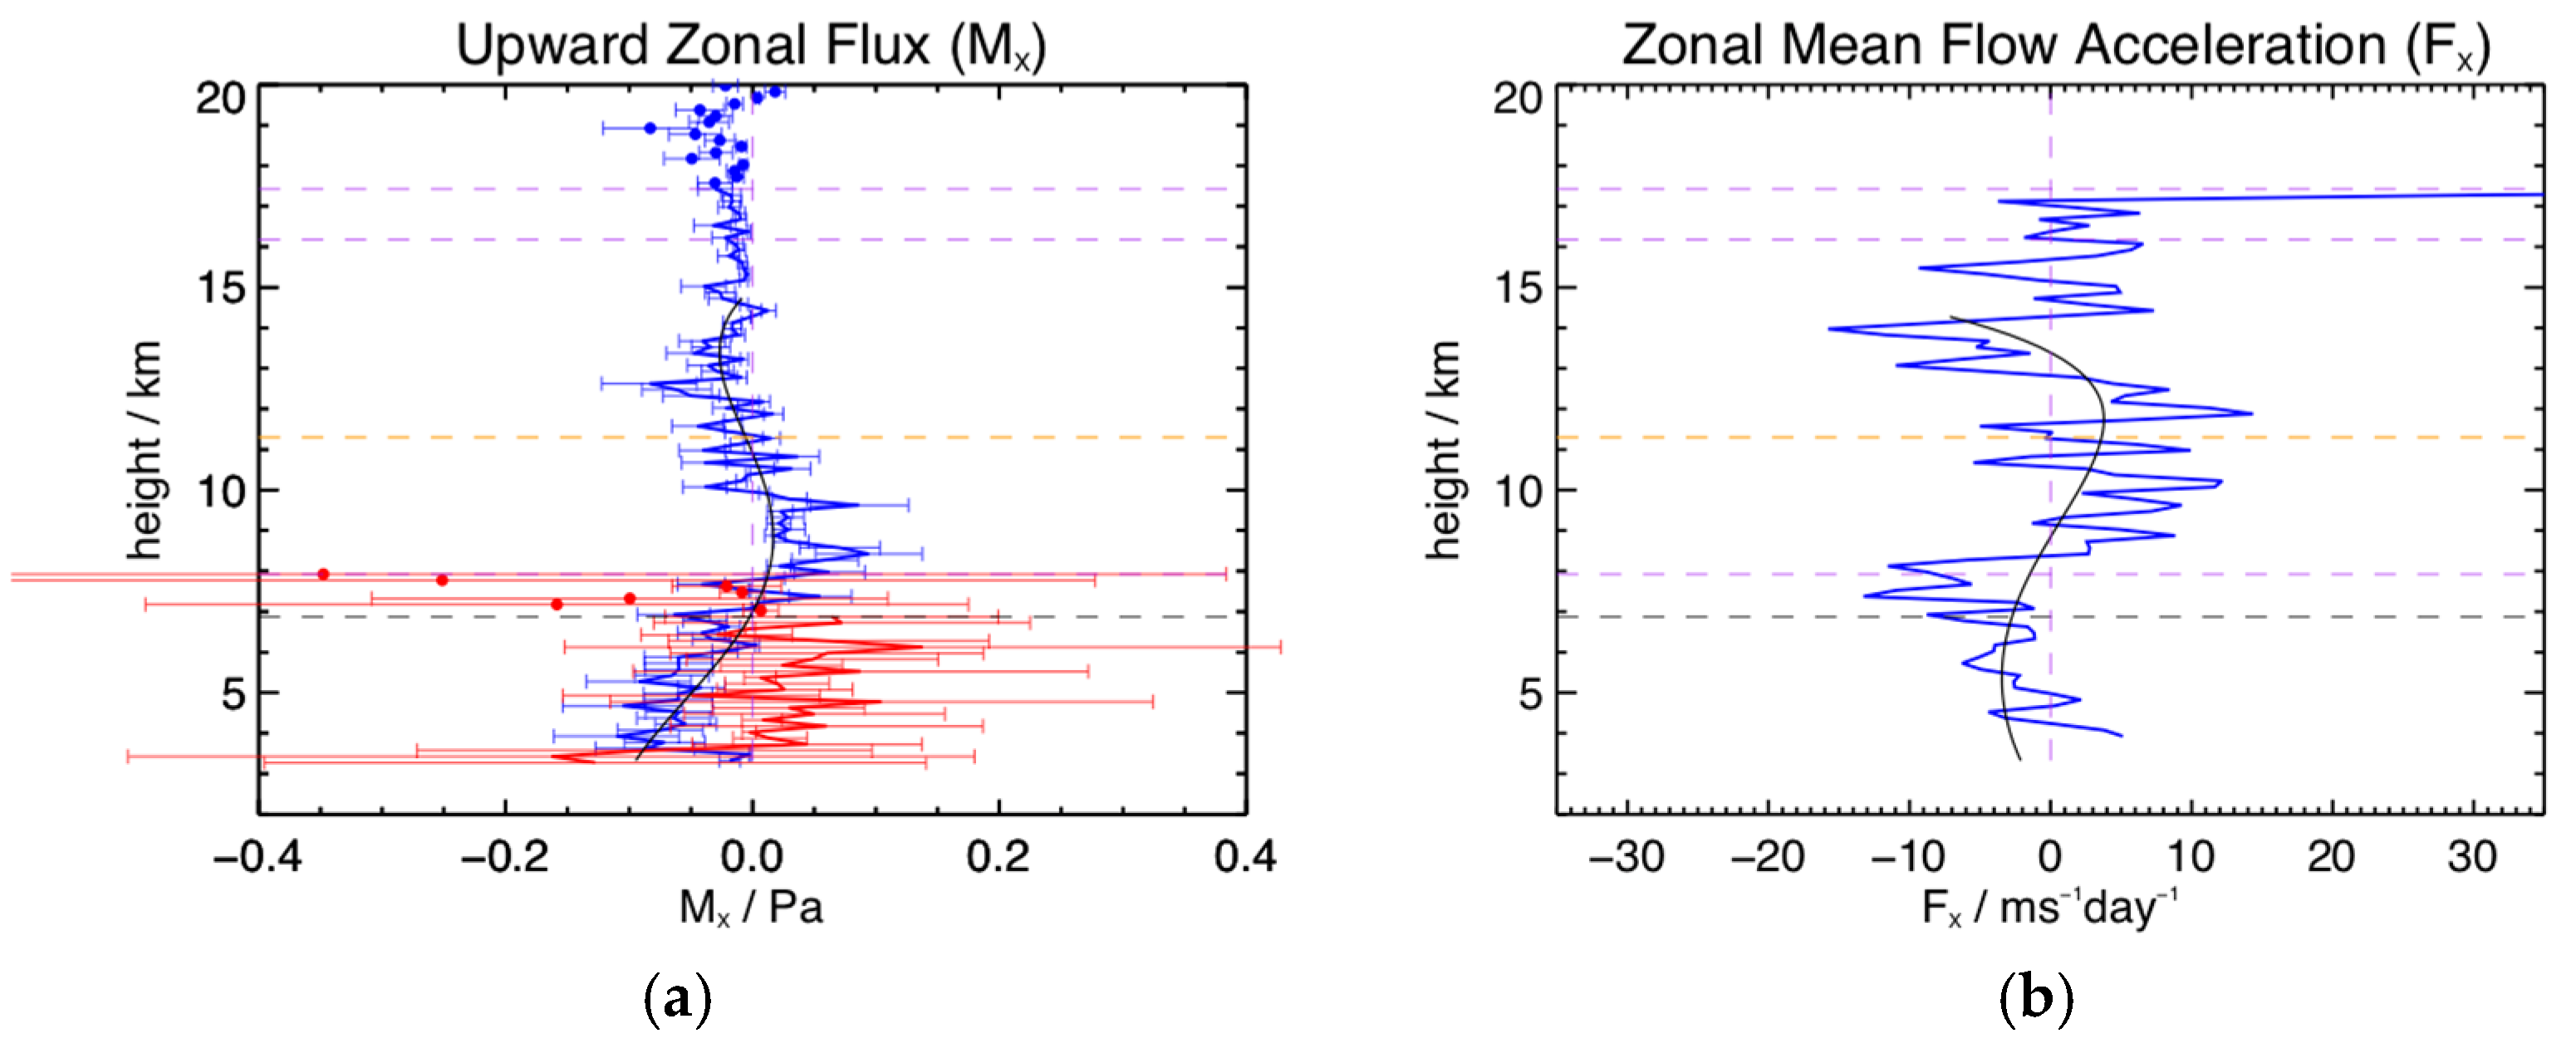
Figure 16 shows the corresponding zonal flux and zonal mean flow acceleration. We have used the USSA 1976 model [
52] to obtain the densities used here. Fluxes are typically less than
and show maximum amplitudes near the peak of the zonal jet. The mean flow accelerations generally lie within
and show a complex vertical structure.
We now return to the two-day period of days 4 and 5, during which the radar was operated with beams directed to
. The tropospheric jet was very strong in both wind components during this period. The zonal radar winds (blue 7.5
and green 15
) corresponding to these two days are shown in
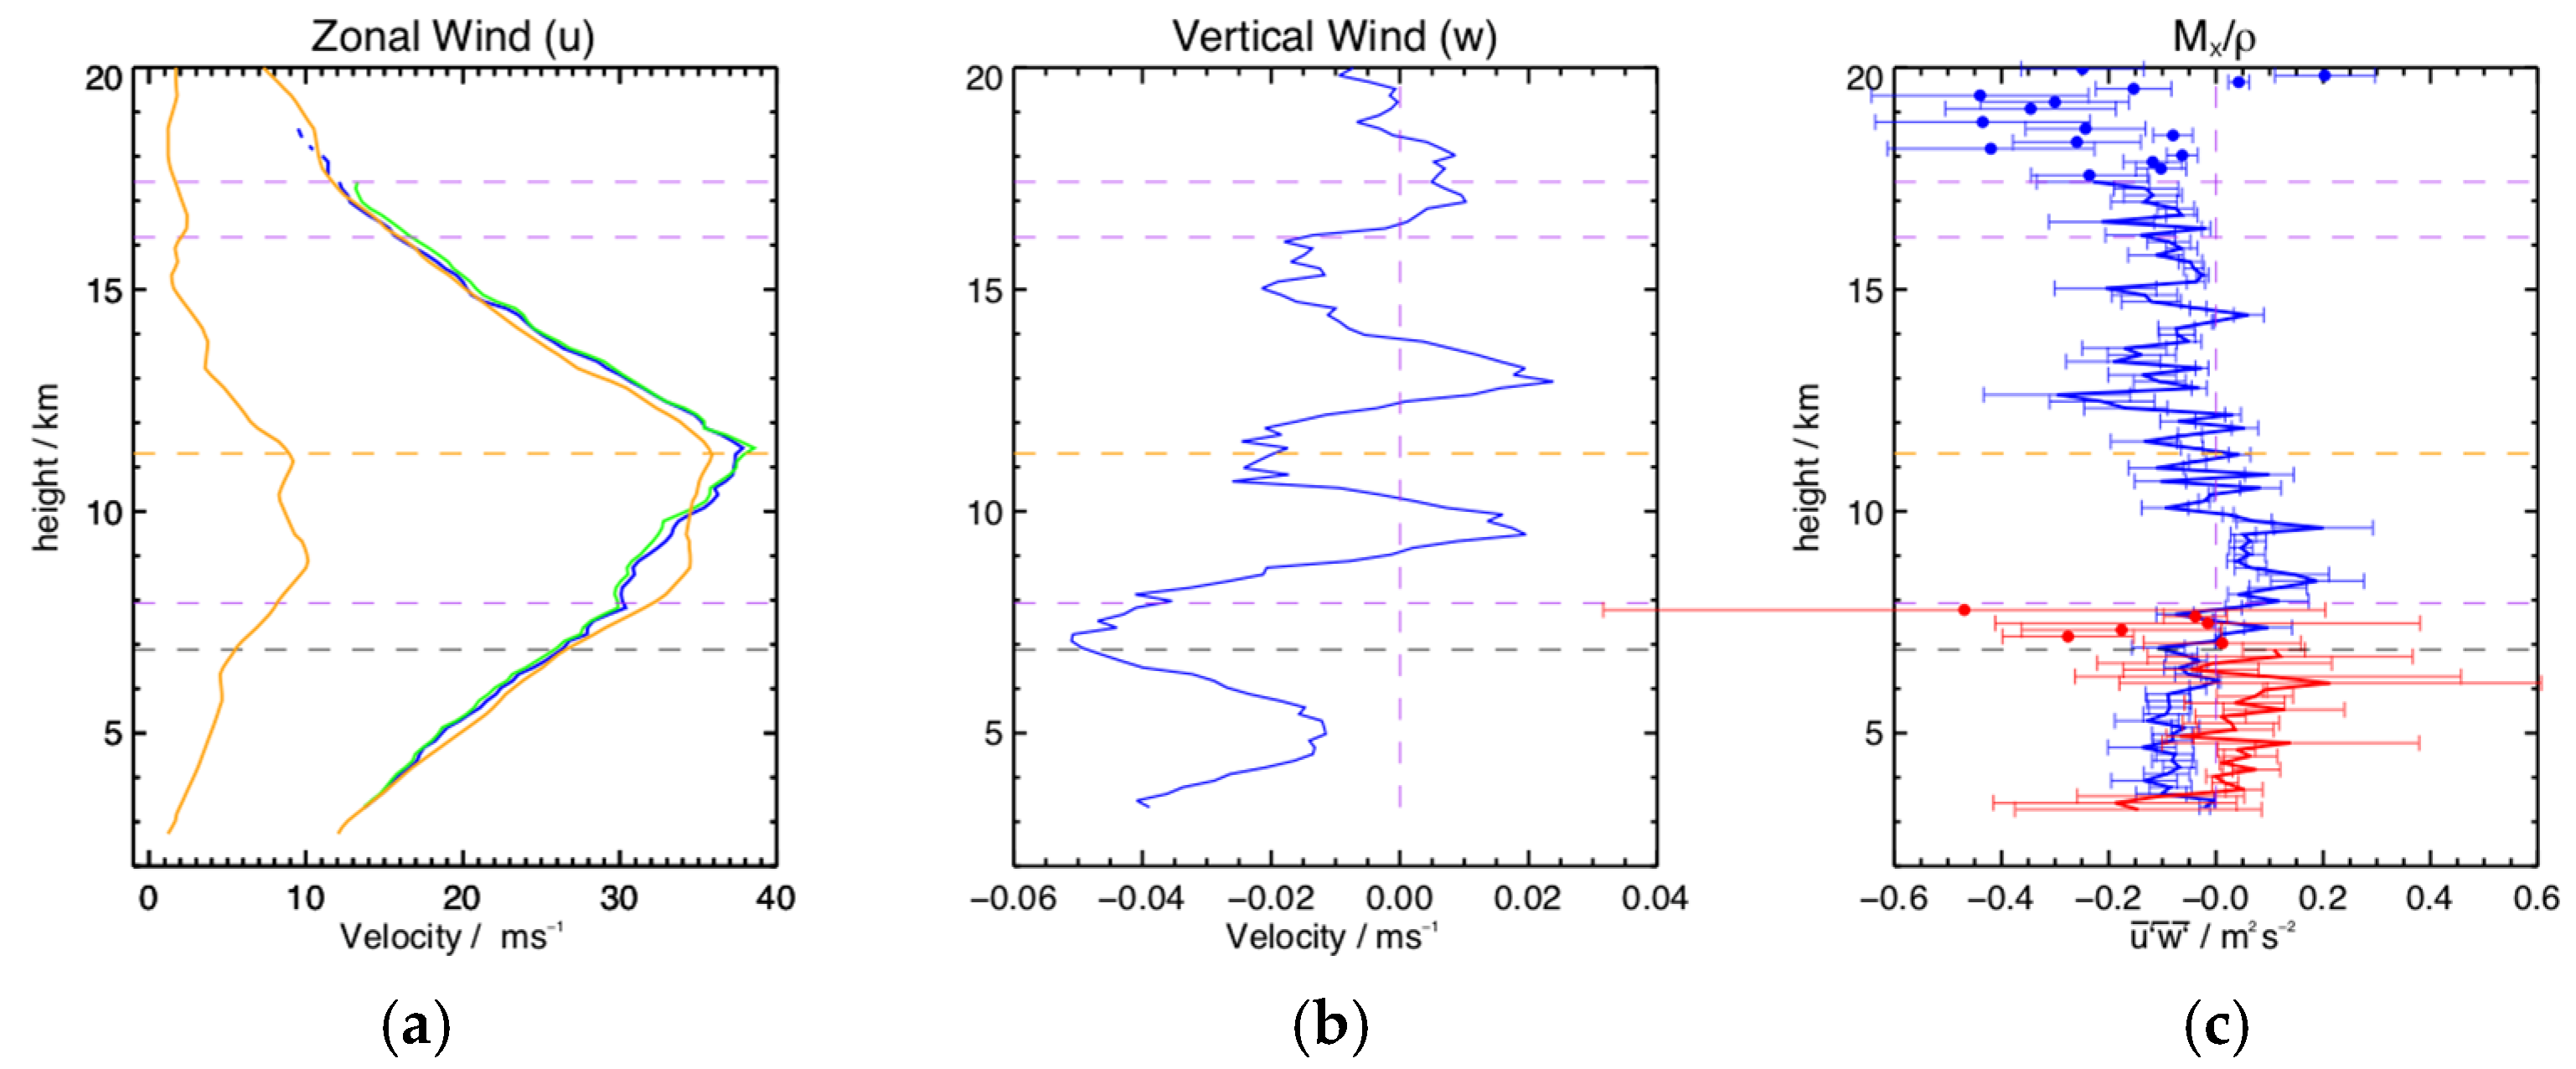
Figure 17, where we now also include the
term with error bars. We have included the mean of the six hourly Hannover radiosonde winds for this period (one sounding is missing, as previously noted) in this figure. The zonal jet peaks at about +
near 11.5 km. Agreement between the radar and radiosonde winds is good. The jet is also evident in the meridional component, taking a maximum value of about +
near 9 km. We note an oscillation with a vertical wavelength of between 3 and 5 km in the vertical wind mean profile. The
term is negative below about 6 km, positive above this and below 10 km, and negative above this height. As for the section above, the values are below
.
Figure 18a shows the corresponding zonal flux and
Figure 18b the zonal mean flow acceleration. Zonal fluxes are typically less than
. Two approaches are used to calculate the mean flow acceleration. The first is a differentiation of the height profile and is shown in blue. The second approach is to fit a fourth-order polynomial to the flux height profile and then differentiate that. This is shown as the black line. The first approach results in a complex height structure in response to the many small changes in the flux height profile. The second approach results in a curve that changes slope at the peak of the jet and is negative above and below the jet. This is a more realistic situation physically and suggests that much of the fine scale vertical structure in the flux is noise. In the fitted case, the mean flow acceleration is about
at the lowest height and declines to
near 9 km. It remains positive until about 13 km, peaking at about
near 11.5 km, then decreasing until about 14 km and taking a value of about
. Inspection of the flux profile suggests that the mean flow acceleration would tend to zero above this height. We have included the Lindau zonal flux in red in the figure. It generally has the same form as the Harz results, but is offset, possibly due to the specific synoptic conditions during this period. The mean flow acceleration would be very similar to the Harz results, because the slope is very similar.
Ref. [
53] used the MU radar to look at six days of fluxes and accelerations and found zonal values tended to be positive in the 8–10 km height interval at
and negative above 15 km at
with a smooth variation between these heights. This change occurred across the core of the tropospheric jet. Our results agree with this change in sign across the peak of the jet and have similar magnitudes.
3.5.4. Overall Comparison of the Two Radars
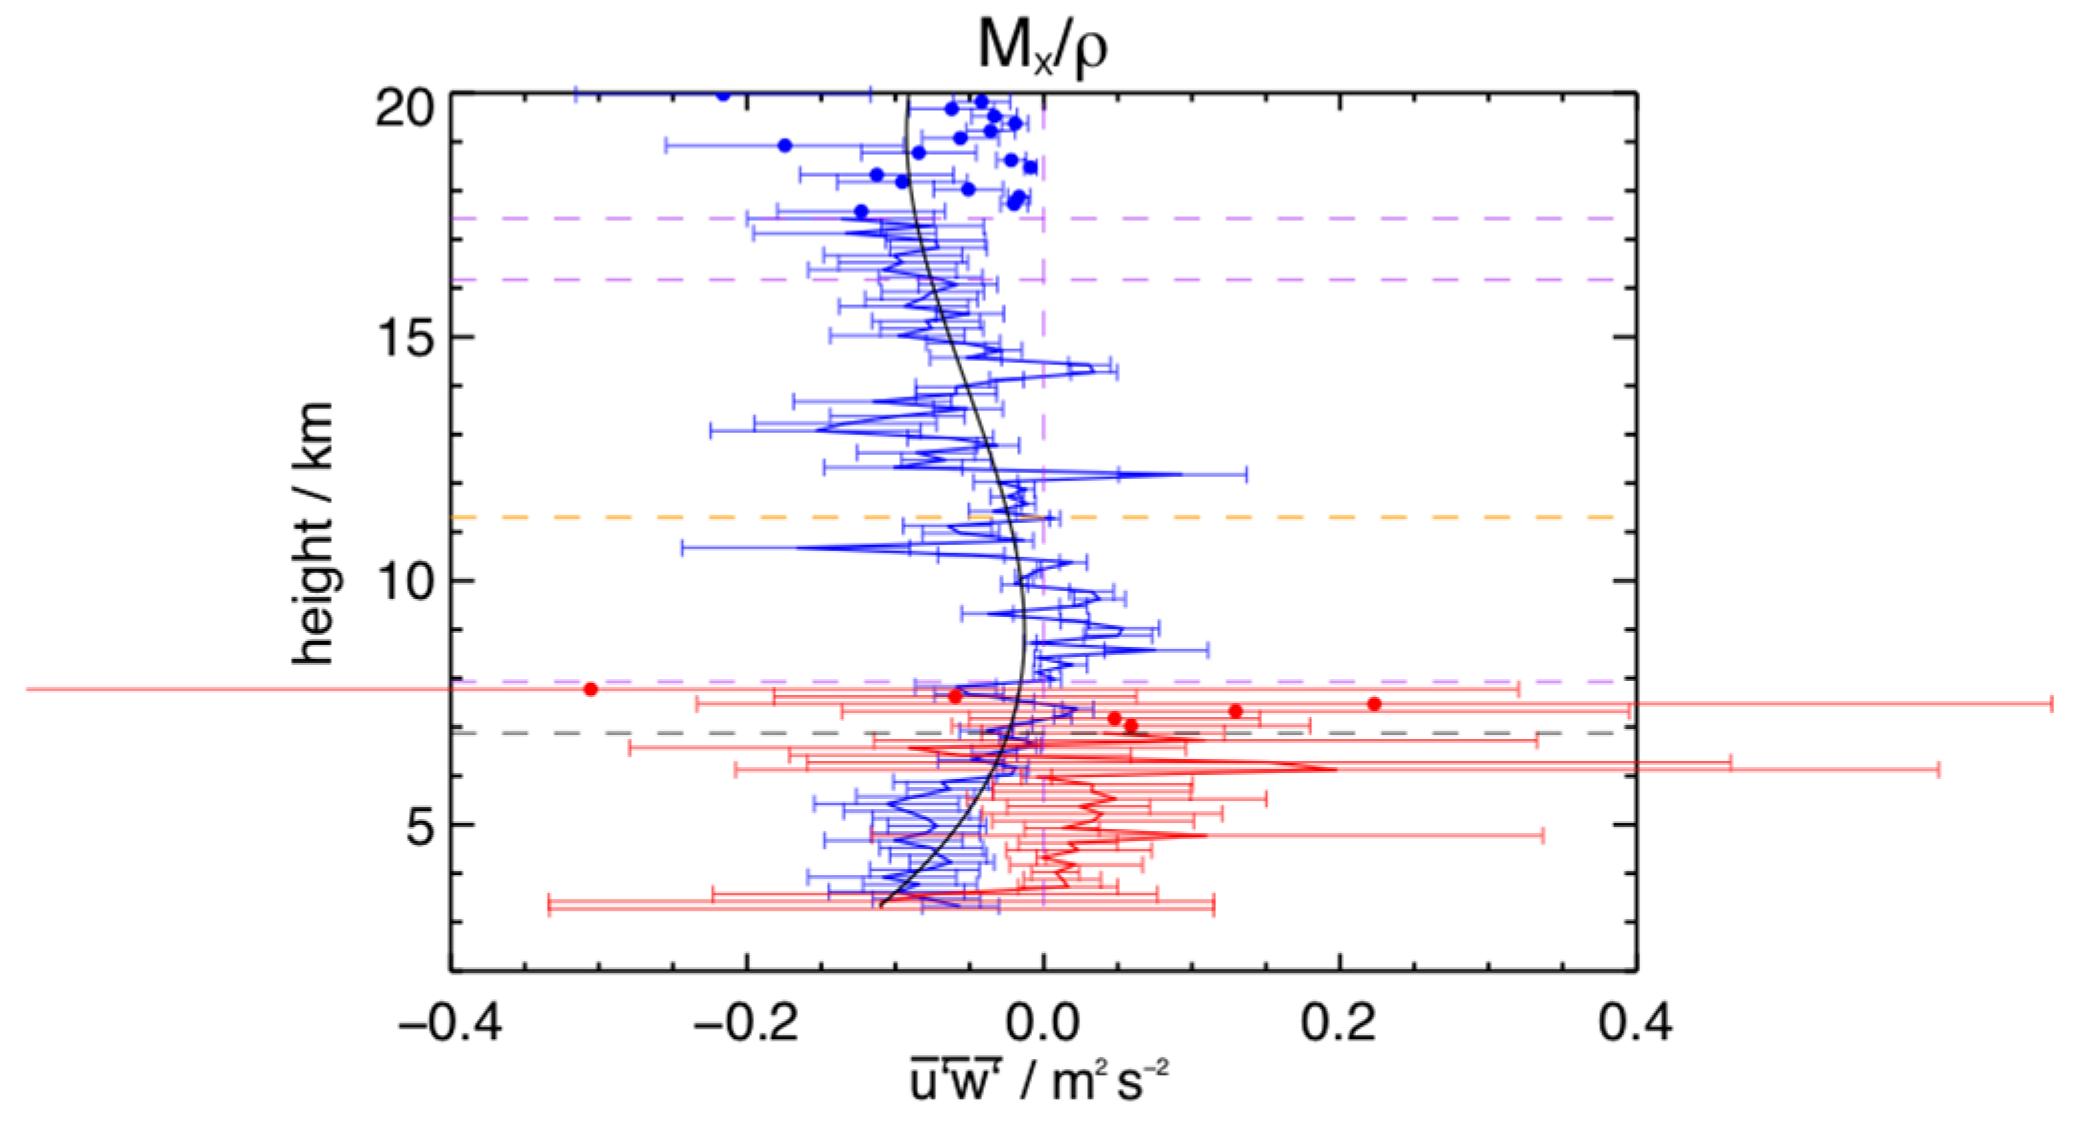
Figure 19 shows the
term for the entire observational period for the two radars. There is general agreement in form and magnitude below about 6.5 km, above which the Lindau values are noisier. The mean values are different. Significantly, the mean slopes of the
height profiles are similar, so any body forces calculated from them using Equation (2) are similar, as we see below. Values are small, typically less than
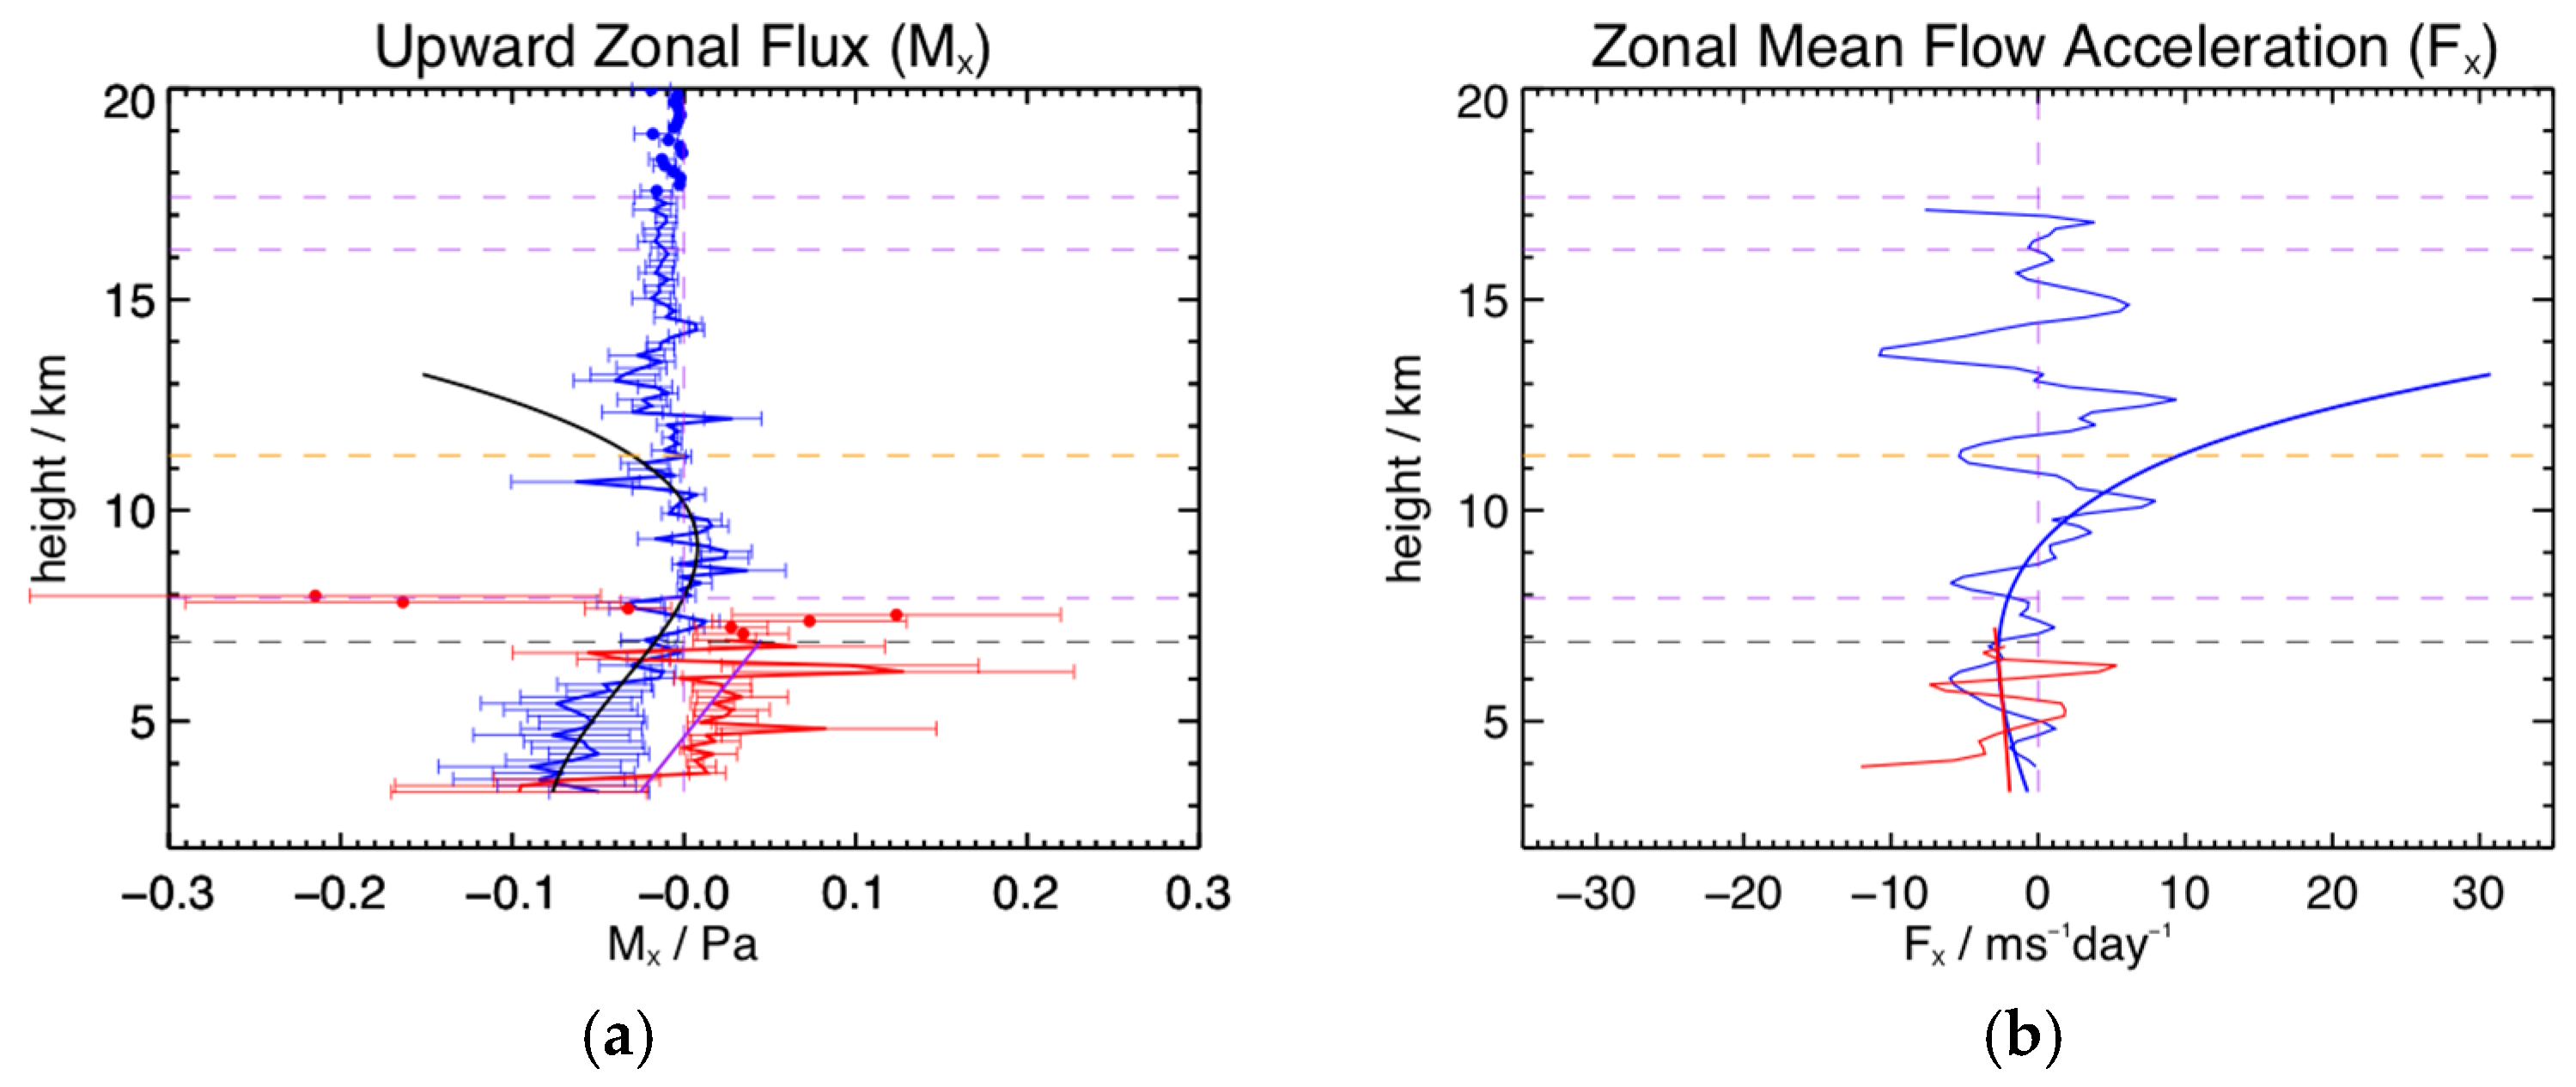
. The momentum flux is shown in
Figure 20. Values lie within
and change sign near 7 km and 11 km, the latter being near the peak of the jet. Mean flow accelerations are negative below about 8 km and there is agreement between the two radars in sign, although there is a lot of structure in both profiles. The derivative of the polynomial fit is negative to 9 km and positive until 11 km. Inspection of the curves suggests that this should tend to zero with increasing height.
4. Discussion
The values of the upward-momentum flux found here are in good agreement in magnitude with these found in previous studies, with the caveat that there is a broad range of values depending on the location, duration, and conditions during which the measurements are made. For example, ref. [
9] summarize aircraft and pressure drag measurements from several studies over mountain ranges and show values ranging from 0.01 to 6.7 Pa. Ref. [
16] found aircraft values of −0.5 Pa for mountain waves in the low stratosphere during the DEEPWAVE campaign [
15] and compared these to similar previous observations with values ranging from −0.2 to 1 Pa. Our results are typically lie within
, and show the largest values at heights below the peak of the tropospheric jet. The resulting mean flow accelerations are typically less than
, with a vertical variation that results in positive values near the peak of the jet, and negative values above and below.
Our results are also similar to other radar observations with the same caveat about variability. For example, Refs. [
53,
54] used the MU MST radar (se e.g., [
40]) and the technique of [
3] to measure momentum fluxes in the 7–18 km height range. Ref. [
53] attributed the observed flux primarily to mesoscale and convective motions, while ref. [
52] suggested that gravity wave motions contribute a net drag on the zonal flow in the lower stratosphere, a result in agreement with the conclusions of [
5]. Ref. [
53] found values of
in the lower stratosphere and [
52] values of
in the same height region over a six-day period, as we have discussed above.
Using the Harz radar, ref. [
26] reported on five 4 h periods of observations of momentum fluxes. They found maximum fluxes often, but not always occurring near the strongest horizontal shears. Values were typically less than
and very variable between the observational periods. They did not calculate mean flow accelerations. Ref. [
55] conducted density-normalized zonal and meridional tropospheric momentum flux measurements using the Aberystwyth MST radar for waves with periods less than 6 h. Their values were within
.
Also using the MU radar, ref. [
56] made long-term (4 days per month for 4 years) measurements in the troposphere and lower stratosphere (5–25 km). The vertical flux of zonal momentum for motions with periods between 5 min and the inertial period of 21 h showed an annual variation, with a westward bias in the upper troposphere and lower stratosphere. In the 15.5–17 km range, values varied
in August–September and
in January. They found no significant seasonal cycle in the middle troposphere with values typically within ±
. Ref. [
57] used the Christmas Island ST radar to measure equatorial tropospheric momentum fluxes of between
and
for waves with periods shorter than 8 h and found uncertainties larger than the mean flux values. Ref. [
58] used the Gadanki MST radar in India over a three-year period to study density-normalized momentum fluxes. Monthly mean values were typically less than
below 12 km and less than
between 12 and 16 km and up to
in the 18 to 21 km height region.
Ref. [
59] used the PANSY MST radar at Syowa in Antarctica to produce one year of continuous observations of momentum flux. Their values for the absolute flux
ranged from 0.002 to 0.2 Pa over the 3–20 km height range. This more sophisticated study looked at the occurrence distributions of the absolute values of momentum flux and measures of the Gini coefficients, which are a measure of the intermittency of GW momentum fluxes. This approach produces data that conforms to that produced by satellite and radiosonde and other balloon observations in a form suitable for assimilation into atmospheric models. In doing so, it provides a template for other ST and MST radar observations of momentum flux. Using the same radar, ref. [
60] observed orographic gravity waves and simulated them using a high-resolution numerical model. They also showed density-normalized momentum fluxes over a five-day period from heights of about 1 km to 25 km measured using the [
3] approach. Their values generally range within
for both components, and for the one day of observations modeled show that the model is producing similar values to those produced by the radar. This does not completely answer the question of whether the radar measurements are correct in the presence of orographic waves, and together with the present study suggests more comparisons could usefully be conducted.
Ref. [
61] used another high-latitude MST radar on Andøya, Norway—the MAARSY radar—to look at momentum flux over a four-year period at heights between 1.8 and 18 km. Using a spectral analysis, they found that the horizontal momentum flux exhibited peaks near the inertial period for their location (13 h) in the troposphere in both components during all seasons. They also found that motions longer than the inertial period contributed more to the upward flux transfer. Below the inertial period mean flux values were
for the 2–13 h range, and
for the 30 min–2 h range. They also found that the flux reduced above 12 km for the 2–13 h range, suggesting that gravity waves could not easily propagate above 10 km. Their results are broadly consistent with those found here.
A seven-year continuous set of momentum flux measurements was presented by [
62], who also used the PANSY MST radar and who also presented their calculations of the mean flow acceleration. Their mean values of both
and
for that interval for wave periods of less than one day for heights between 1.5 and 22 km lie in the range of
. They found positive values of
in the lower stratosphere and negative values above, indicating strong eastward gravity wave forcing in the lower part of the westerly polar night jet. From May to November, they found an average eastward wave forcing of about 0.37 m s
−1 day
−1 in the 9–17 km height range.
We noted in the Introduction that recent improvements in the analysis of satellite observations had allowed directional information about gravity wave momentum fluxes to be determined [
13] (and see the references therein for a comprehensive summary of progress in this area). These authors used global AIRS/Aqua 3-D satellite observations to determine stratospheric gravity wave momentum flux over a period from 2002 to 2019. Their results correspond to waves with horizontal wavelengths less than 50 to 75 km and vertical wavelengths greater than around 40 km. They also report observations for a height of 40 km, higher than our observations. Nevertheless, it is interesting to compare them to our results and highlight the current capabilities of satellite observations. Their zonal mean values for 52°N for the entire period (2002 to 2019) and for August are less than about +0.01 mPa. Meridional values are about the same at less than about +0.01 mPa. At this latitude, time of year, and height, the results are some of the smallest seen. Winter (December) values are much higher, about −1.0 mPa in the zonal case and about +0.13 mPa in the meridional case.
5. Summary and Conclusions
We have found that a Doppler beam swinging radar with a small power–aperture product operating in the lower-VHF band (53.5 MHz), the Lindau SOUSY radar, can achieve good wind and flux measurements in the troposphere in the 3.3–6.9 km height range with a 150 m height resolution. Typical values of the aspect sensitivity as parameterized by
are between 5° and 10° in the troposphere and stratosphere when averaged over a period of one week. Once corrected for the aspect sensitivity of the atmosphere, the Lindau radar horizontal winds agree well with both the Harz radar winds and the Hannover and Essen radiosonde winds. We have also shown that the fluxes measured over the same height range with the Lindau and Harz radars. Separated by 27 km and situated in quite distinct topographies, these generally agreed in form, with an offset, but to within the experimental uncertainties at some heights. Zonal and meridional fluxes were similar in magnitude over a seven-day period in the troposphere measured with the Lindau radar and over a two-day period in the troposphere and lower stratosphere measured with the Harz radar. Measurements of the
terms in the troposphere and lower stratosphere suggest mean values in the range of
when averaged over a period of about one week. The corresponding contribution to the total mean flow acceleration takes magnitudes of less than about
albeit with considerable variation in height. More work is needed to determine the validity of radar measurements of the momentum flux, but the present results are positive. The radar model comparison by [
60] noted above suggests an approach to clearly answer this question.
While this and many other studies have demonstrated the utility of radars for making this measurement, the opportunity for using wind profilers as routine inputs into gravity wave parameterizations has perhaps passed. The reasons are several. Assimilation into models expects the data to be obtained widely and routinely. Real-time assimilation is not realistic because the averaging times required to obtain good statistics is of the order of one day (see e.g., [
58]). Furthermore, there are several types of radars operating in different frequency bands and in widely varying topographies. There is no standard approach to data reduction or operating mode and there are now fewer radars capable of making measurements into the lower stratosphere. Nevertheless, there is a place for wind profiler radar measurements of momentum flux, and they are well suited to both campaign operation and longer observational periods, as demonstrated by [
59].
However, the promise of large networks of wind profiling radars providing good spatial coverage of winds and routinely sharing data for weather forecasting and input into weather and climate models has eventuated in Europe, Japan, China, and Australia. Publicly available wind profiler results are summarized on the European Meteorological Services Network (EUMETNET) E-PROFILE website (
https://e-profile.eu/#/wp_profile (accessed on 12 December 2024). The significant networks in China and Japan do not provide public data to the Global Telecommunication System (GTS) (
https://community.wmo.int/activity-areas/global-telecommunication-system-gts (accessed on 12 December 2024) and so are not available on the E-PROFILE site. Surprisingly, after initially leading the world (see e.g., [
63]), there is now no national wind profiler network in the USA.
The potential of small lower-VHF-band Doppler beam steering wind profiling radars for boundary layer and tropospheric meteorological applications may have passed. Except for the Australian Wind Profiler Network [
27], most current WPRs are operated in higher-frequency bands (around 449 and 1290 MHz) reducing their physical size, but still permitting good antenna beamwidths. At lower VHF frequencies, small radars that operate in spaced antenna (SA) mode offer similar results to the Lindau radar, albeit it with lower power, smaller footprints, and simpler execution (see e.g., [
27]). However, that said, the SA radars do not measure normalized wave fluxes directly, and progress has been made with more modern technology and small arrays operating in DBS mode in the lower-VHF band, as shown by Reid and Dolman [
64]. In Europe, a limitation remains in the ability to obtain operational licenses rather than experimental licenses in the lower-VHF band, but the potential for modern versions of small VHF radars like the Lindau radar to complement modern observational systems such as lidars and to provide satellite cross-calibrations and address gaps in regional flux measurements means that they could be a valuable additional to the global observational network.
As a final historical point, we note that the Harz and Mobile SOUSY radars were relocated when the Institut-für-Aeronomie transitioned into the Max-Planck-Institut für Sonnensystemforschung and the SOUSY project group was wound down, the Mobile radar to another location on Andøya as the SOUSY Alomar Radar in collaboration with the Leibniz-Institut für Atmosphärenphysik an der Universität Rostock (IAP) (see e.g., [
65]), and then finally to Svalbard as the SOUSY Svalbard Radar (SSR) with the University of Tromsø (see e.g., [
66,
67]) and the Harz radar to the Jicamarca Observatory in Peru (see, e.g., [
68]). The quality of these first-generation radars and the data they produced in Germany is still quite remarkable, even many decades after their first commissioning.
