Article

Impacts of Intraseasonal Oscillations on Tropical Cyclone Rapid Intensification in the Northwestern Pacific During Winter

1
Key Laboratory of Climate, Resources and Environment in Continental Shelf Sea and Deep Sea of Department of Education of Guangdong Province, College of Ocean and Meteorology, Guangdong Ocean University, Zhanjiang 524088, China
2
Southern Marine Science and Engineering Guangdong Laboratory (Zhuhai), Zhuhai 528315, China
3
State Key Laboratory of Satellite Ocean Environment Dynamics, Second Institute of Oceanography, Ministry of Natural Resources, Hangzhou 310012, China
*
Author to whom correspondence should be addressed.
Remote Sens. 2025, 17(7), 1259; https://doi.org/10.3390/rs17071259
Submission received: 6 March 2025 / Revised: 26 March 2025 / Accepted: 28 March 2025 / Published: 2 April 2025
(This article belongs to the Section Atmospheric Remote Sensing)

Abstract

:
In winter, the northwestern Pacific (NWP) is affected by two atmospheric intraseasonal oscillations (ISOs), the Madden–Julian oscillation (MJO) and the quasi-biweekly oscillation (QBWO). Using observational data and global reanalysis products, the present study investigates the impact of ISOs on the rapid intensification (RI) of tropical cyclones (TCs) in the NWP. The results indicate that both the MJO and QBWO can affect the frequency, occurrence location, intensification rate, and duration of TCRI. More (fewer) RI events occur in the convective (non-convective) phases of the MJO and the QBWO, when the main RI region is dominated by the convective (non-convective) signals of the ISOs. Additionally, the modulation of RI frequency by the MJO is much stronger than that by the QBWO. With the eastward (westward) propagation of the convective signals of the MJO (QBWO), the RI occurrence location shows a clear eastward (westward) shift. Further analysis shows that the low-level relative vorticity and mid-level relative humidity play a major role in the modulation of ISOs on RI frequency and location. To RI intensify rate and RI duration, the effects of the MJO and QBWO are relatively weak. The combined effects of the MJO and QBWO on TCRI are also discussed in this study. These findings underscore the important role of both the MJO and QBWO in modulating the TCRI.

Graphical Abstract

1. Introduction

Tropical cyclones (TCs) induce severe natural disasters over coastal areas associated with extreme winds, torrential rainfall, and tidal surges during landfall, causing catastrophic economic and human losses worldwide [1,2,3]. In recent years, the proportion of TCs intensifying into typhoons has increased, with the majority (79%) of intense TCs undergoing rapid intensification (RI) [4,5]. Significant improvements have been made in predicting TC tracks, but predicting TC intensity, especially TCRI, remains a challenging task [6,7,8]. Therefore, conducting research on the occurrence of RI in TCs can help reduce loss of lives and minimize the damage caused by TCs.
The Northwestern Pacific (NWP) is the region with the highest occurrence of TCs, accounting for 30% of the global TCs [9]. Several researchers have emphasized the significant role of large-scale environmental factors in the genesis and development of TCs, such as low-level relative vorticity (RV), mid-tropospheric relative humidity (RHUM), and vertical wind shear (VWS). An increase in positive RV, increased RHUM, and reduced VWS are favorable for TC genesis and development [10,11,12]. Additionally, the ocean thermal conditions, such as sea surface temperature (SST), ocean heat content, and ocean warm eddy, have long been recognized as having a fundamental impact on TC intensity and tracks [13,14,15,16,17,18,19,20]. Some important weather systems, such as the monsoon trough and the subtropical high ridge, have been shown to modulate TC genesis and tracks [21,22,23].
Many studies have shown that some atmospheric oscillations on interdecadal, interannual, intraseasonal, and synoptic time scales can modulate TC activity in the NWP [24,25,26,27]. During the negative phase of the Pacific decadal oscillation, the environment is favorable for TC genesis with the weakening of the East Asian subtropical jet stream and the westward displacement of the NWP subtropical high [28]. Camargo and Sobel (2005) found that TCs in El Niño years are stronger than those in La Niña years, attributing this to the eastward shift in genesis location [29]. Additionally, Eastern Pacific El Niño–Southern Oscillation events are usually more unfavorable for TC genesis than Central Pacific ENSO due to the stronger anticyclonic circulation [30]. Other studies have shown that more TCs tend to form in regions of tropical waves (such as Rossby and Kelvin waves) with overlapping cyclonic vorticity and active convection [31,32]. However, the intraseasonal oscillation (ISO) exerts a more significant impact on TC modulation on the weather scale due to its shorter period [33]. Many previous studies examined the feedback of synoptic-scale disturbances to the ISO through an energetics analysis, which helps explain the mechanism by which the ISO modulates TCs [34,35]. Madden–Julian Oscillation (MJO), as a 30–60-day intraseasonal oscillation, plays a crucial role in enhancing (suppressing) TC genesis during the convective (non-convective) phases [36,37]. However, the ISO does not consist solely of the MJO, although the 10–20-day oscillation known as the quasi-biweekly oscillation (QBWO) has a significant impact on the large-scale environment of East Asia, relatively little research effort has been devoted to understanding it [38]. Ling et al. (2016) found both the MJO and QBWO can affect the genesis frequency, location, and the motion of TCs generated over the South China Sea [39].
It is found that there are both similarities and differences in the favorable environment for RI and non-RI events [4]. Compared to non-RI events, RI events develop in regions with warmer SST, larger positive RV, higher RHUM, and lower VWS [40]. In the context of global warming, although the number of TCs has not increased, the occurrence of RI has risen, with a positive contribution from enhanced ocean thermal factors. RI requires efficient extraction of latent heat energy from the ocean’s mixed layer [41,42,43]. TCRI in the NWP shows multi-timescale oscillations. The cold phase of the PDO results in a deeper depth of the 26 °C isotherm, which directly increases tropical cyclone heat potential over the main RI region, which greatly favors the occurrence of RI [44]. In El Niño years, TCs are more likely to undergo RI, primarily due to the eastward shift in their genesis location, which leads to longer tracks over warm ocean surfaces [29,45]. RI events in the NWP exhibit strong seasonal variation. In late autumn, due to the lower latitudes of TC formation and stronger subsurface thermal conditions, the ratio of RITC to total TCs reaches its maximum [46].
The NWP is affected by several kinds of ISOs, such as boreal summer intraseasonal oscillation (BSISO), MJO, and QBWO. Compared to the PDO and ENSO, few studies focus on the impact of ISO on the TCRI in NWP [47]. Therefore, the present paper investigates the characteristics of RITCs and the impact of ISOs (MJO and QBWO) on TCRI in the NWP during winter. The rest of this paper is organized as the follows: In Section 2, the dataset, definitions of RI and ISOs are clearly introduced. In Section 3, the statistical analysis of RITCs and the individual and combined effects of MJO and QBWO on RITCs are examined. Finally, a brief summary is given in Section 4.

2. Materials and Methods

2.1. Data

The TC data used in this study were obtained from the Joint Typhoon Warning Center (JTWC) best track dataset from 1979 to 2021, which covers the period 1950 to 2024. This dataset includes the 6-hourly TC center position, maximum sustained wind speed, and minimum central pressure. To investigate the activity of the ISOs, the study uses outgoing longwave radiation (OLR) data from the National Oceanic and Atmospheric Administration (NOAA) polar-orbiting satellites, covering the period from 1979 to 2021; the temporal and spatial resolutions of the OLR data are daily and 2.5° × 2.5°, respectively. Other environmental fields, such as relative humidity (RHUM) at 700 hPa, relative vorticity (RV) at 850 hPa, and vertical wind shear (VWS) between 200 hPa and 850 hPa, are obtained from the National Centers for Environmental Prediction (NCEP)/National Center for Atmospheric Research (NCAR) reanalysis dataset I, with data collected every 6 h with a horizontal resolution of 2.5° × 2.5° for both longitude and latitude from 1979 to 2021. Sea surface temperature (SST) data were obtained from the fifth version of the Extended Reconstructed Sea Surface Temperature (ERSSTv5) dataset published by NOAA. The data is derived from a combination of various sources, including ship-based measurements, buoys, and satellite data, which are used to reconstruct SSTs over time. The data is recorded every 6 h, using a horizontal resolution of 0.25° × 0.25°.

2.2. Definition of TC and TCRI

According to the World Meteorological Organization’s Tropical Cyclone intensity classification, this study focuses on TCs with a maximum sustained wind speed of 34 knots or higher (the threshold for tropical storm strength) during their entire life cycle. The location and time of TC formation are defined by the position and time when the JTWC first records the TC. In this study, TCRI is defined as meeting all of the following thresholds: a maximum wind speed increase of 5 knots during the first 6 h, 10 knots within the first 12 h, and 30 knots within the first 24 h [44]. If a TC undergoes multiple instances of RI, only the first occurrence is counted. TCs that experience at least one RI event are referred to as RITCs.

2.3. Classification of MJO and QBWO Phases

The Gaussian filtering method is a technique used to filter out low-frequency and high-frequency signals, resulting in intermediate-frequency signals. In this study, Gaussian filtering is applied to the daily OLR data in the NWP (100°–170°E, 0°–30°N) for the winter monsoon season (November–March) from 1979 to 2021. The MJO (30–60 days) and QBWO (10–20 days) scales are used to extract OLR anomaly fields, in order to filter out the influences of seasonal variations, ENSO, global warming, and other low-frequency signals. The derived OLR anomaly fields are then subjected to empirical orthogonal function (EOF) analysis to identify the primary modes. Following the method proposed by Matthews (2000) and Jia and Yang (2013) [38,48], the MJO and QBWO are divided into 8 phases using the phase-space representation defined by the first two principal components.

3. Results

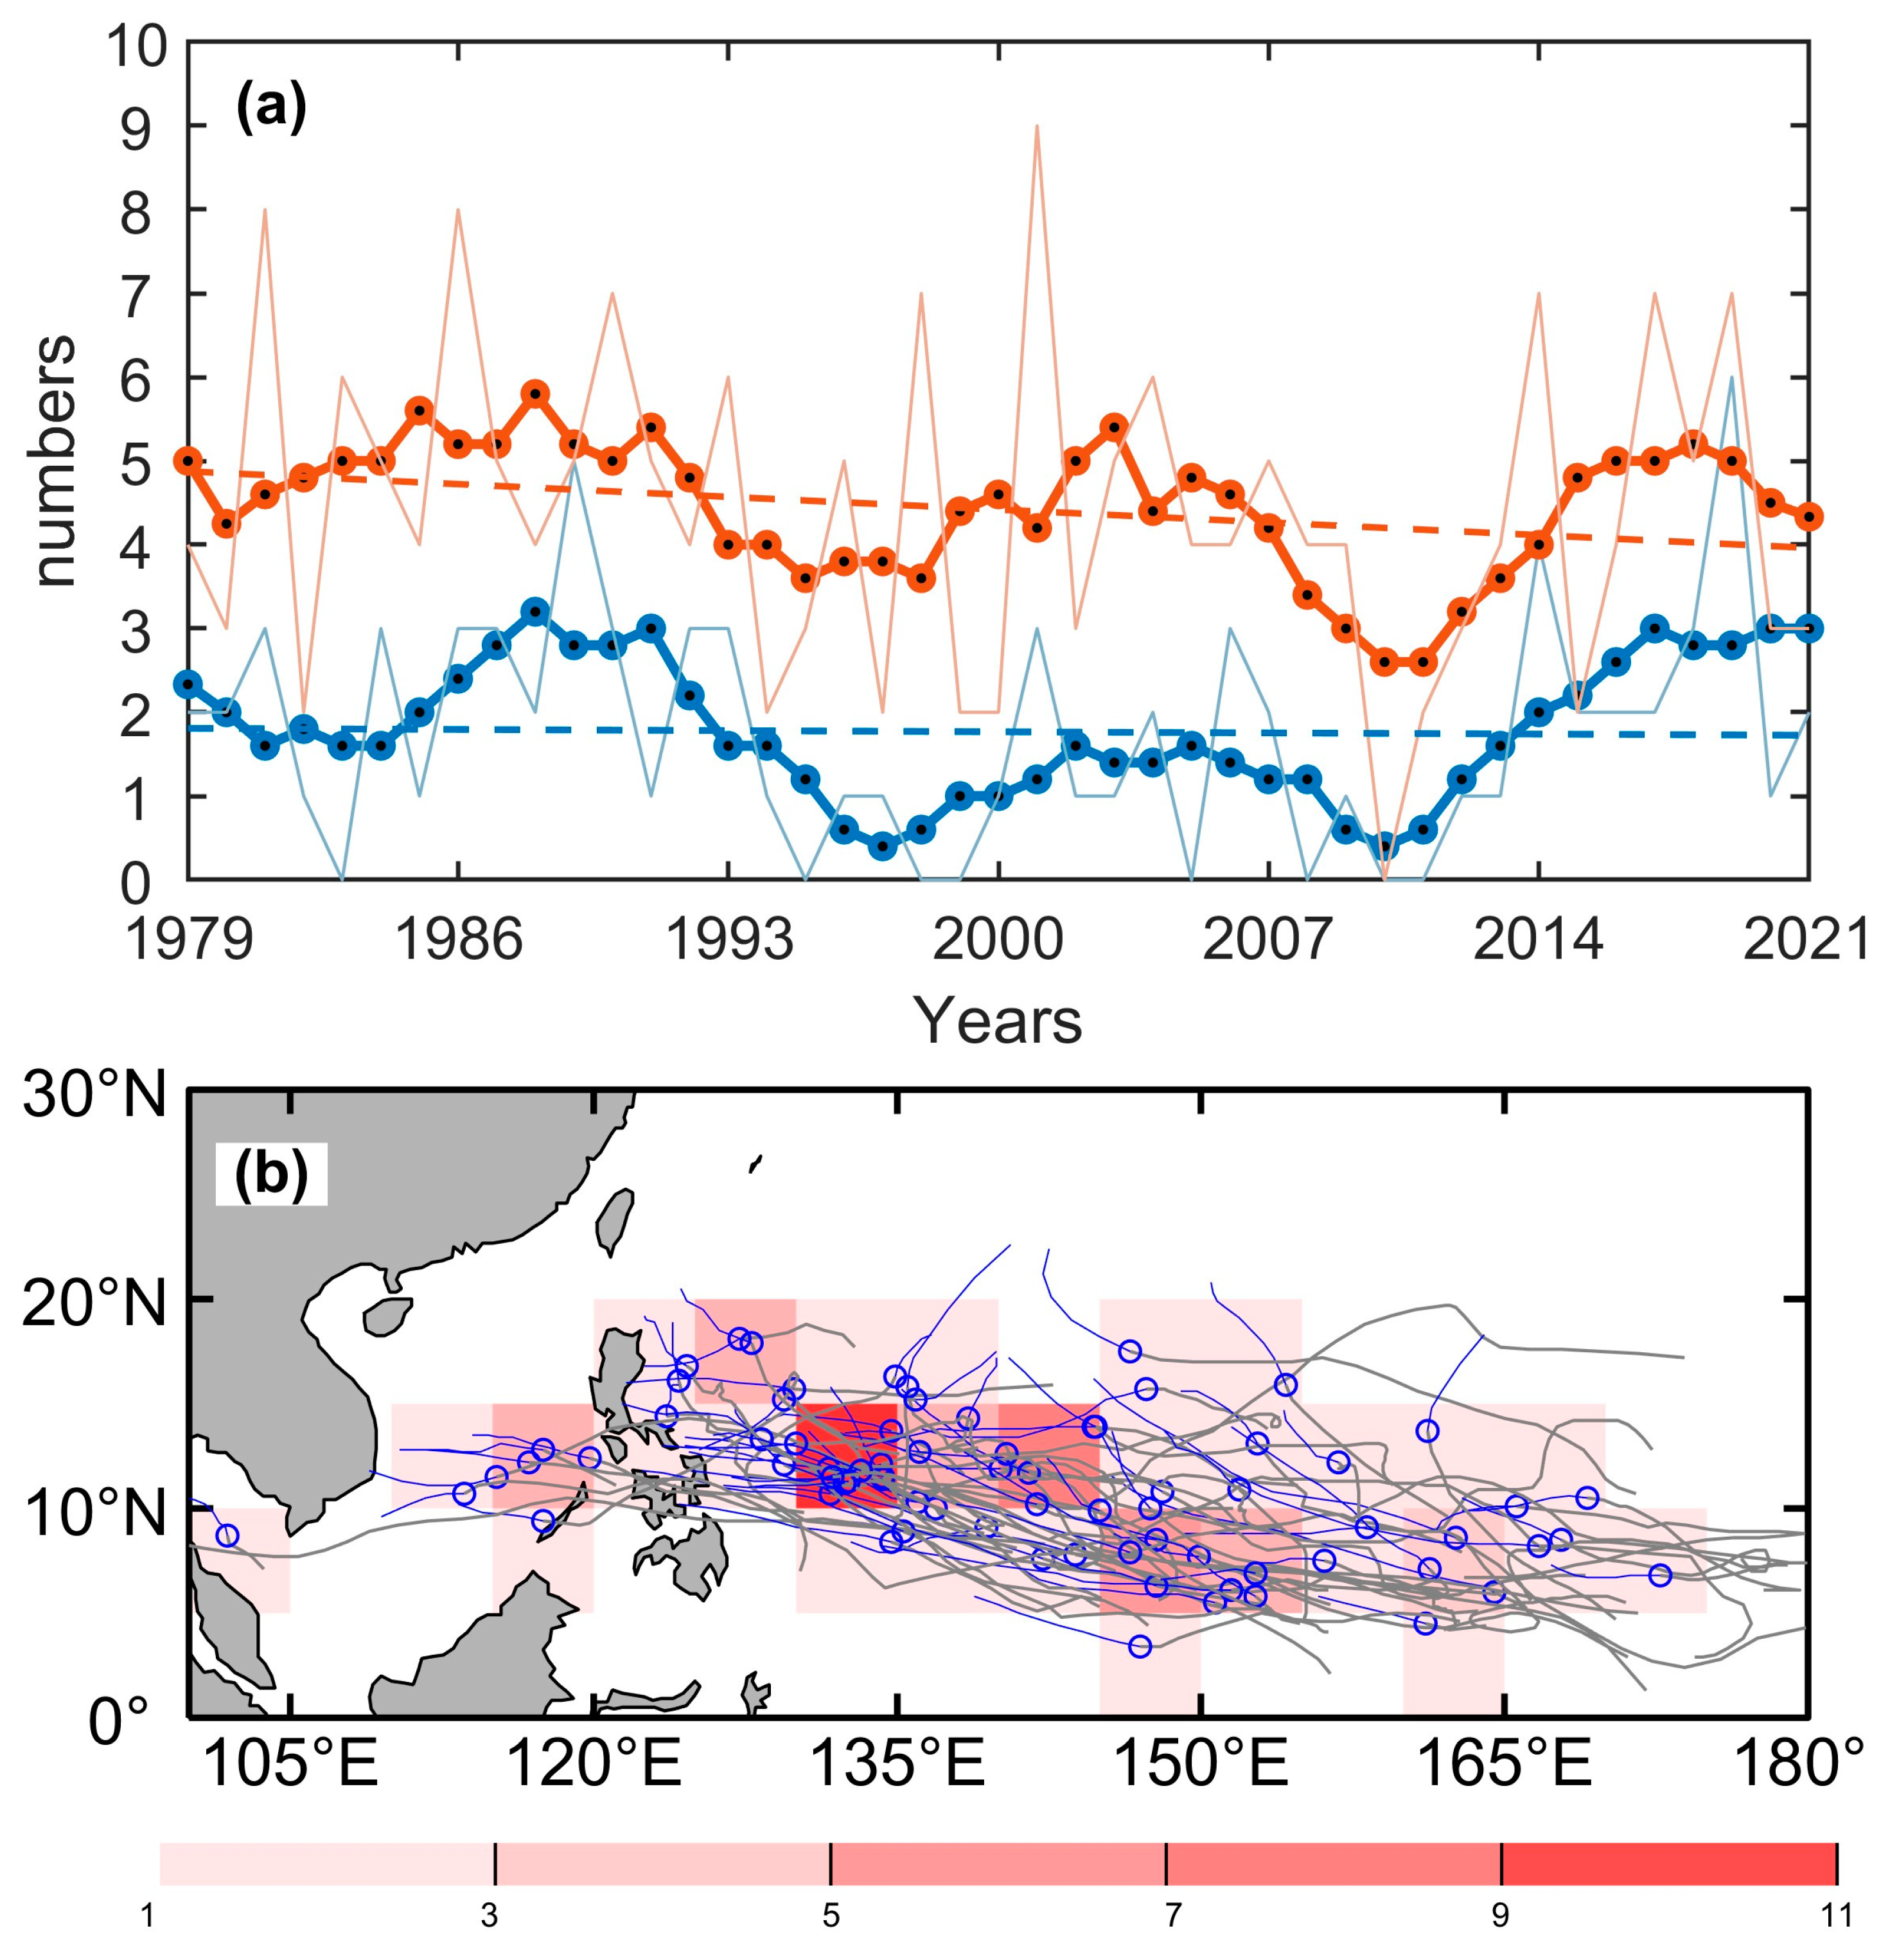
3.1. Statistical Analysis of RITCs

Based on the JTWC data, 190 TCs were generated during the winter monsoon season (November to March) from 1979 to 2021, and 76 TCs experienced RI, accounting for 40% of the total TCs. Most RITCs occurred in November and December (66 RITCs), accounting for 87% of the total RI occurrences. Figure 1a shows the annual variation in the numbers of the RITCs and the total TCs. The RITC number shows a significant correlation with the total TC number, with a correlation coefficient of 0.54 above the 95% confidence level. Both of them show significant decadal oscillation, and there are three distinct periods. The total TC number exhibits a slightly decreasing trend with a rate of −0.02 per year, while there is no significant trend in the RITC number. Figure 1b shows the spatial distribution of RI occurrence frequency and the tracks of RITCs from formation to RI occurrence in the winter in the NWP. Most RI events occur in the band between 5°N and 15°N, spreading from 100°E to 175°E. RI occurrence frequency peaks in the region between 130°E and 135°E. Approximately 95% of RITCs move westward after their formation, resulting in RI initial locations being further westward than the TC genesis locations.
Figure 2 shows the longitudinal distribution of the RITC and total TC numbers. Both the numbers in the total TCs and RITCs peak in the 150°E bin and gradually decrease at both sides. The RI ratio (the ratio between the RITC number and the total TC number) gradually increases from west to east, except for the 180°E bin, and reaches its peak of 62% in the 170°E bin. A reasonable explanation is that TCs generated farther east have more time to develop, which is conducive to RI [45].

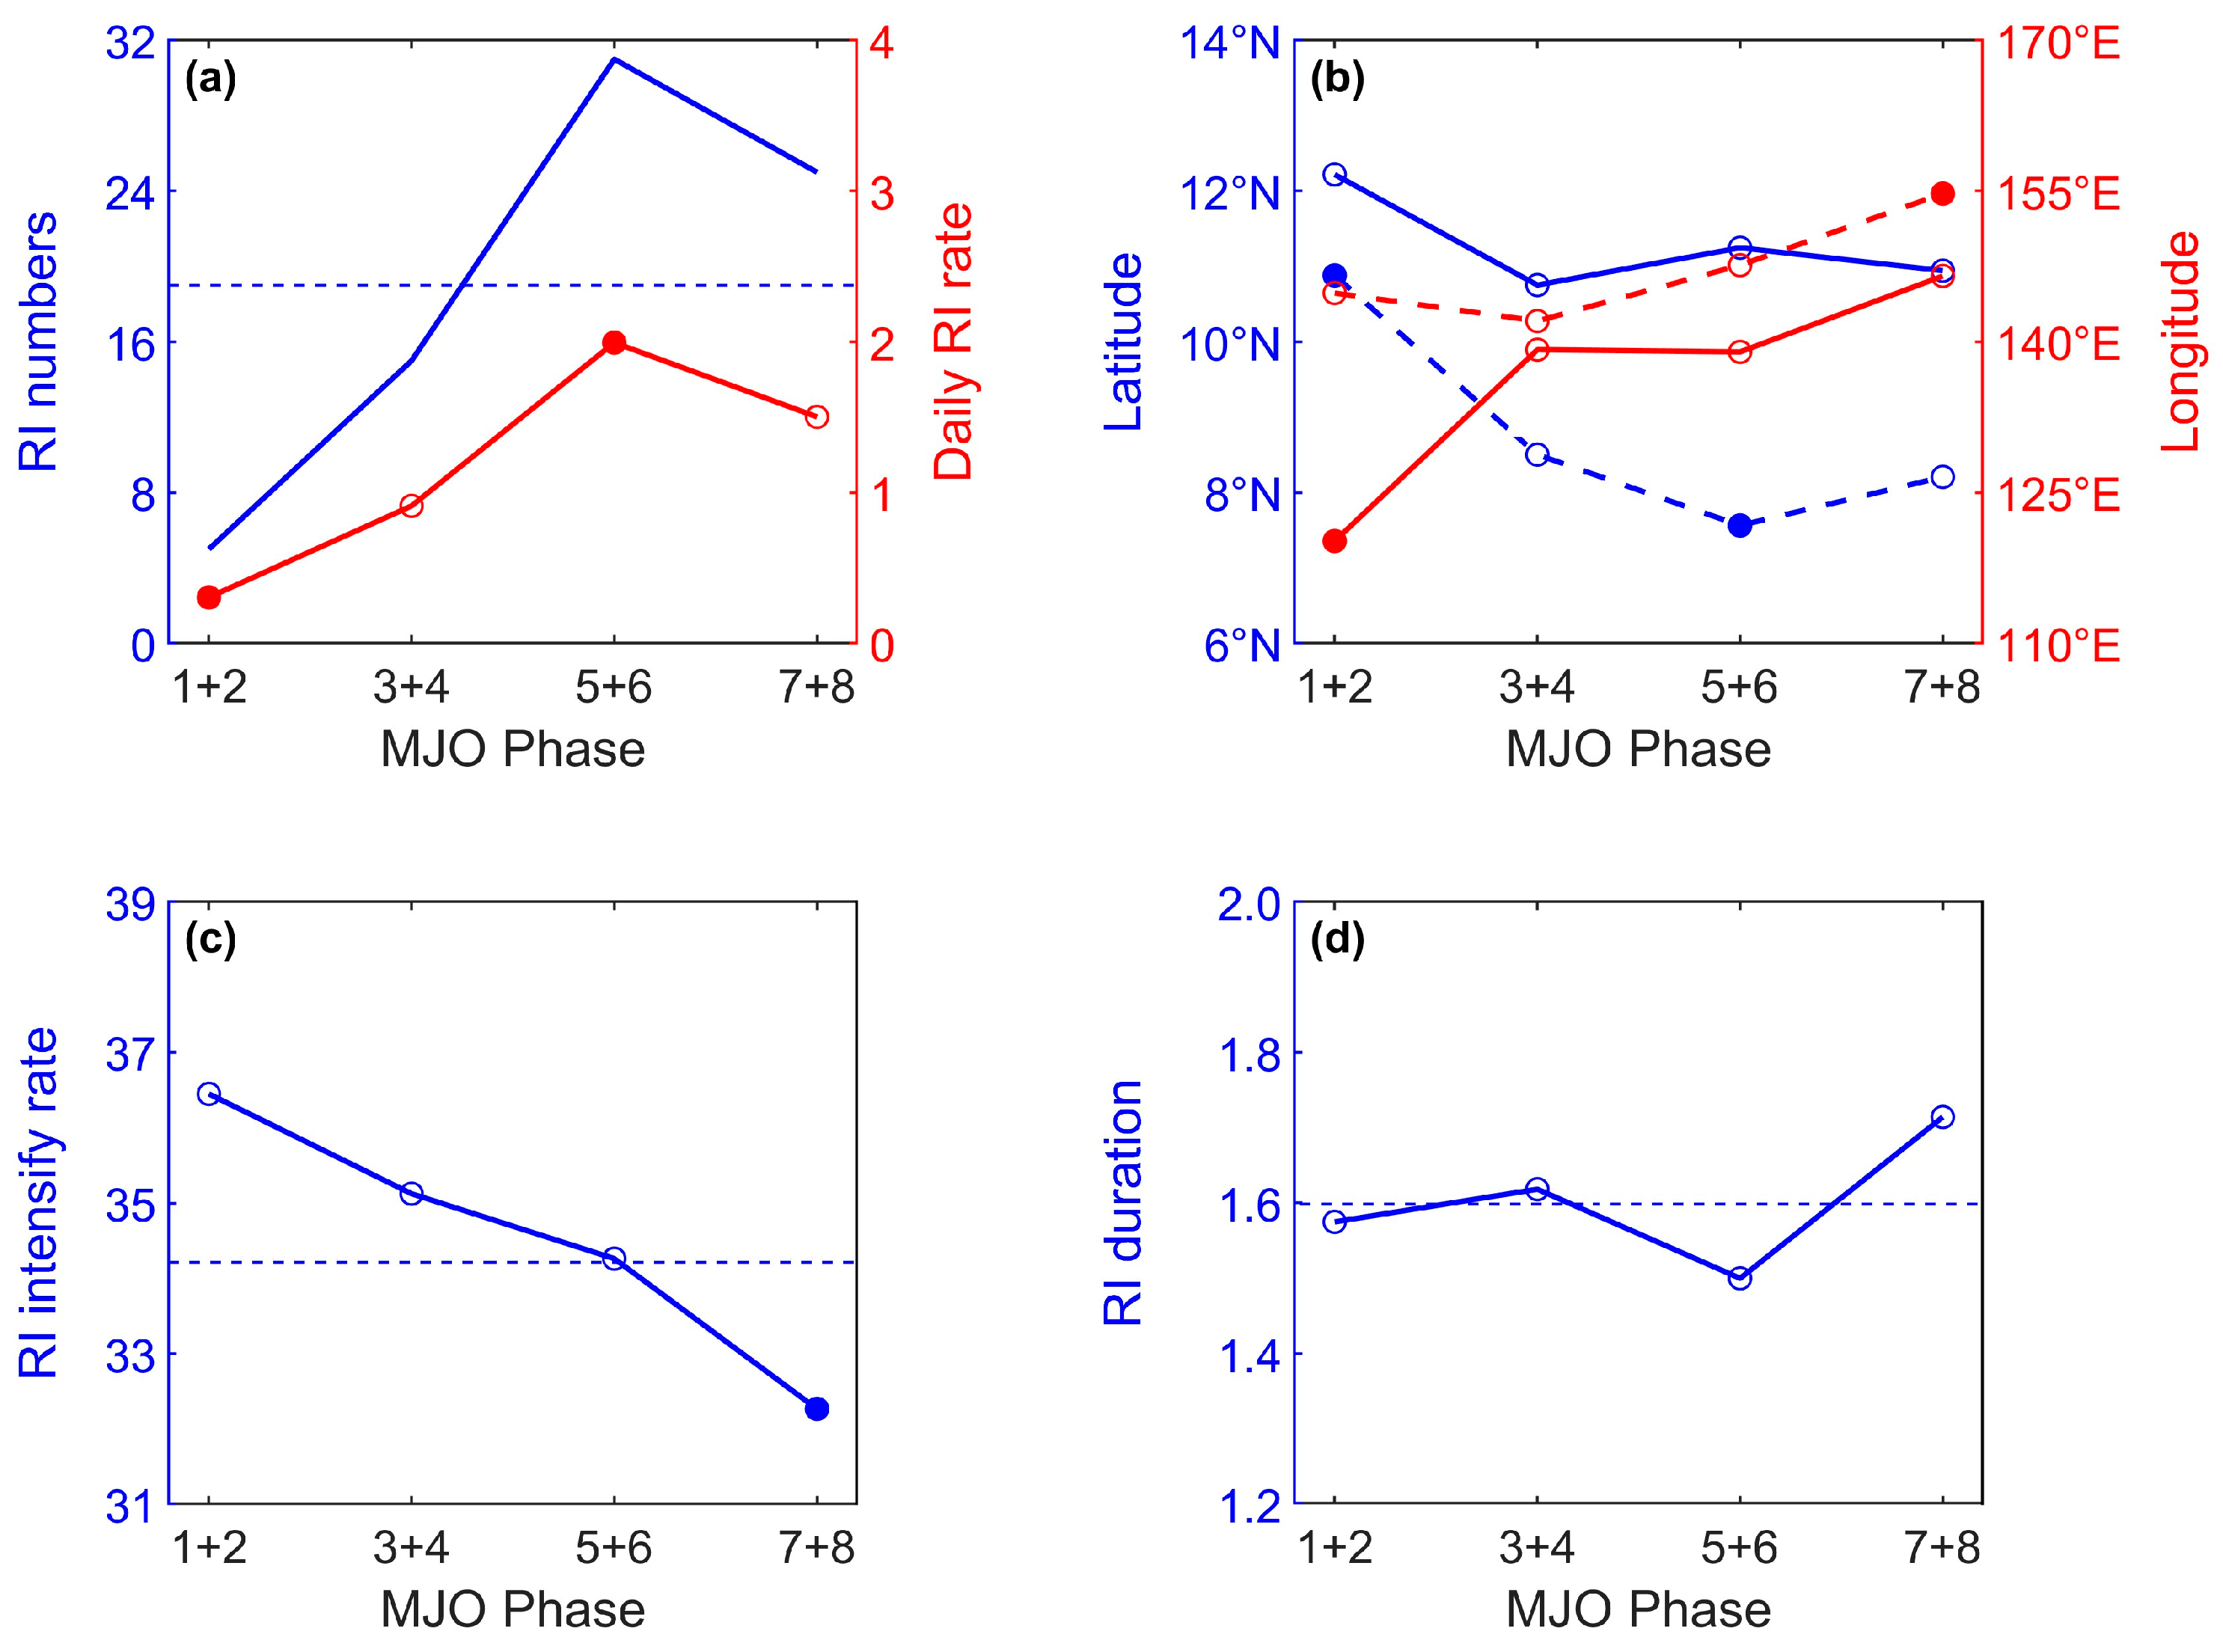
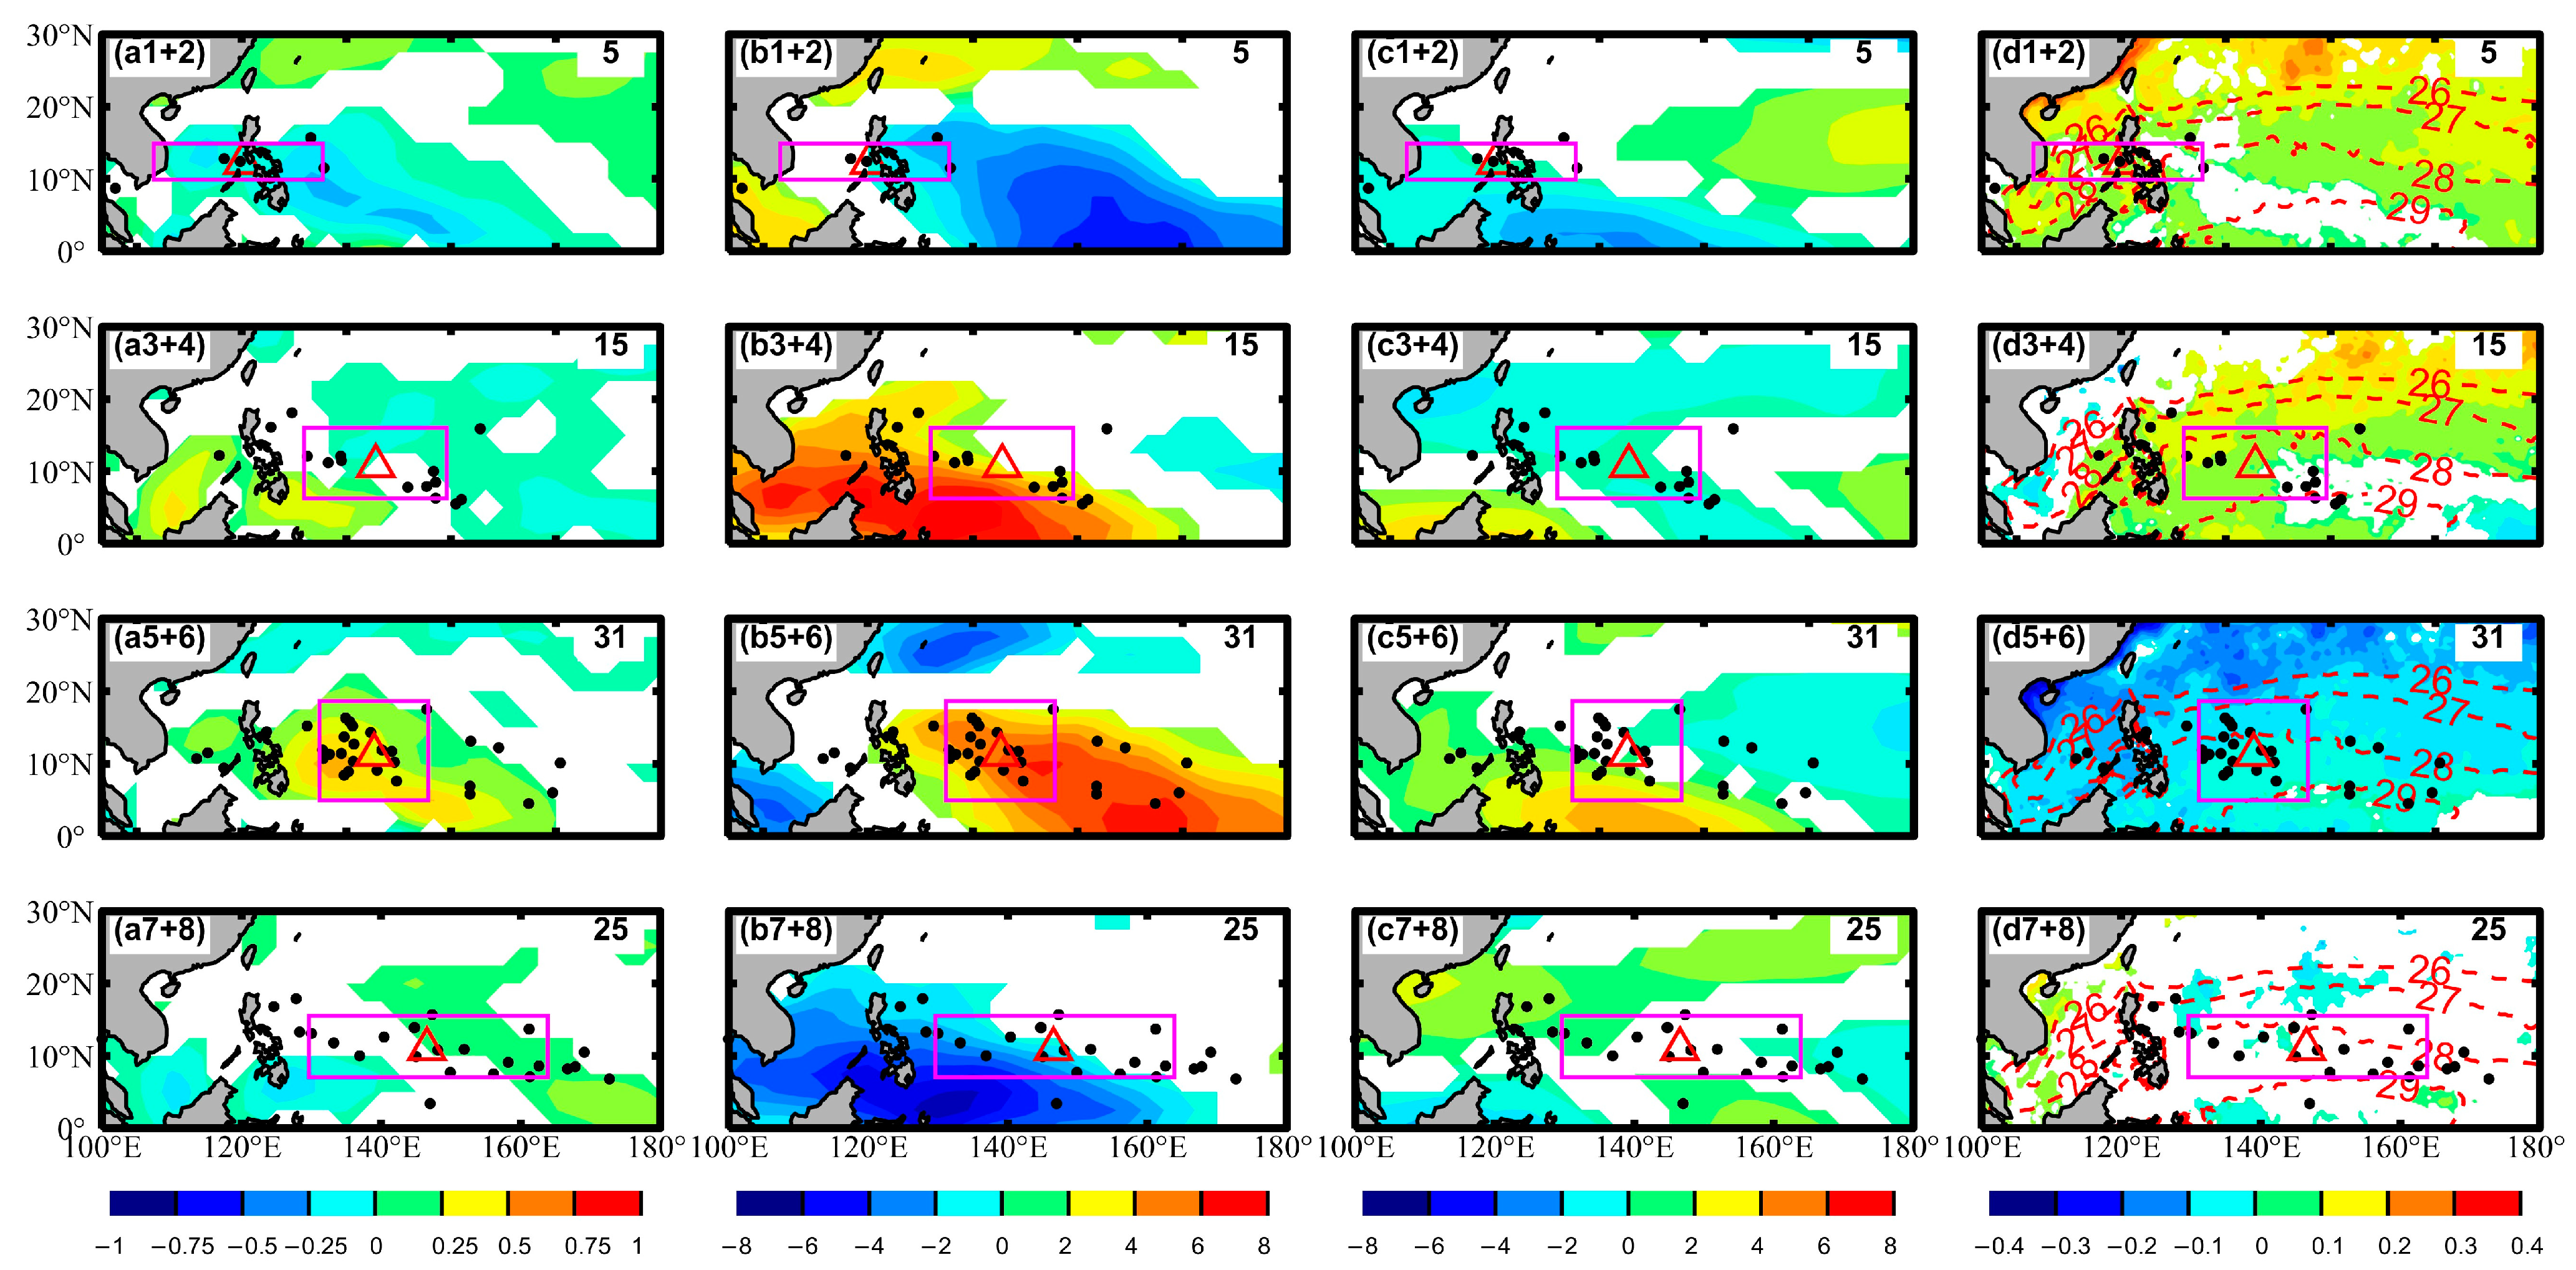
3.2. Impacts of MJO on TCRI

Based on the location of convective center, MJO is categorized into different phases, as follow: phase 1 + 2 when the convective center is located over the western South China Sea, phase 3 + 4 when the convective center is located in the western NWP, phase 5 + 6 when the convective center is located in the central NWP, and phase 7 + 8 when the convective center is located in the eastern NWP (Figure 3). A complete cycle thus represents the eastward-propagating nature of the MJO. Only 7 RI events occur in phases 1 + 2, and most RI events occur in the region near the South China Sea and the Philippine Sea. In phase 3 + 4, the number of RIs increases to 15 (20% of the total RI events) and the occurrence location shifts eastward with the eastward propagation of the convective center, which extends from the southern South China Sea (SCS) to the western NWP. In phase 5 + 6, the convective signals dominate the NWP, and the number of RI events reaches its peak (31 RI events), accounting for 40% of the total RI events. As the convective center shifts eastward in phase 7 + 8, the position of RIs also gradually shifts east, and the number of RIs decreases to 25.
Figure 4 shows the characteristics of RITCs in different phases of the MJO. The number of RIs exhibits an increasing trend, followed by a decrease across these four phases (Figure 4a). Following Li et al. (2012), the daily RITC rate (DRR, calculated as the RITC number divided by the days in each phase) is used to quantify the frequency of RITC during each phase, and the suppression ratio (ESR, calculated as the highest DRR to the lowest) is also employed to evaluate the modulation strength of ISO on TCRI [49]. The DRR peaks in phase 5 + 6 (2.00%) and reaches its minimum in phase 1 + 2 (0.30%), leading to an ESR being 6.67. Both these values exceed the 95% confidence level, indicating that RI is significantly enhanced (suppressed) in phase 5 + 6 (phase 1 + 2) of MJO. With the eastward propagation of convective signal (Figure 3), the TC genesis location shifts southeastward from phase 1 + 2 to phase 5 + 6 and northeastward in phase 7 + 8 (Figure 4b). The RI occurrence location is more northwestward than TC genesis location in each phase, resulting from most NWP TCs moving northwestward after their formation. The RI occurrence location also shows a clear eastward shift, which is consistent with the eastward propagation of the MJO convective signals from phase 1 + 2 to phase 7 + 8 (Figure 3). In phase 1 + 2, the RI occurrence location significantly shifts westward. Variation in latitude is much smaller, and ranges from 10.75°N to 12.22°N. Notably, the intensification rate gradually decreases from phase 1 + 2 to phase 7 + 8 (Figure 4c). Combined with the RI occurrence longitude in Figure 4b, it is known that the intensification rate is lower when RI occurrence is more eastward. As shown in Figure 4d, the variation in RI duration among different phases is not significant, and the largest difference among four phases is only 0.21 days. Generally speaking, RI duration increases (decreases) as the RI occurrence location shifts eastward (westward) except in phase 5 + 6.
Previous studies have emphasized the influence of various environmental factors on the ISO-modulated TC process, among which low-level RV and mid-level RHUM are two of the most crucial factors [50]. Liu and Chan (2020) pointed out that RI typically occurs in regions with warmer SST, higher lower-tropospheric RHUM, and lower VWS [23]. Figure 5 shows the anomalies of RV, RHUM, VWS, and SST in different phases of the MJO during winter. In phase 1 + 2, non-convective signals dominate the NWP, leading to a significant decrease in RV and RHUM and an increase in SST across the entire NWP. VWS weakens (strengthens) in the southwestern (northeastern) NWP. In the main RI region, SST and VWS conditions are more favorable for RI occurrence, while RV and RHUM conditions are unfavorable for RI occurrence. There are only 5 RI events, and the DRR is the lowest in phase 1 + 2, suggesting RV and RHUM play a major role in modulating RI. In phase 3 + 4, convective signals propagate into the western NWP (Figure 3), resulting in RI increasing (15 RITCs). RV and RHUM increase (decrease), and VWS strengthen (weakens) in the western (eastern) NWP, while SST anomalies are still positive in nearly the whole NWP. In the western NWP, all changes are favorable for RI occurrence, while only a change in SST is favorable for RI occurrence in the eastern NWP, leading to most RI occurring in the western NWP. In phase 5 + 6, convective signals dominate the NWP, and the RITC number peaks in this phase (31 RITCs). Both RV and RHUM exhibit positive anomalies in the whole NWP, VWS strengthens (weakens) in the southwestern (northeastern) NWP, and SST decreases in nearly the whole NWP. In the main RI region, all changes in RV, RHUM, and VWS are favorable for RI occurrence. Though change in SST is unfavorable for RI occurrence, the magnitude of the SST anomalies is quite small (<0.25 °C), and the climatological SST values exceed 27 °C in the main RI region. During phase 7 + 8, convective (non-convective) signals dominate the eastern (western) NWP. Changes in environmental factors are opposite to that in phase 3 + 4: RV and RHUM decrease (increase), and VWS weakens (strengthens) in the western (eastern) NWP, while weak negative SST anomalies dominate the NWP. It is noted that the RITC numbers in phase 7 + 8 (25 RITCs) are much higher than those in phase 3 + 4 (15 RITCs), resulting from the eastward shift in TC genesis location in phase 7 + 8, which is conducive to RI [45]. The RI ratio in phase 7 + 8 is 69.4%, which is much higher than that in phase 3 + 4 (27.8%).

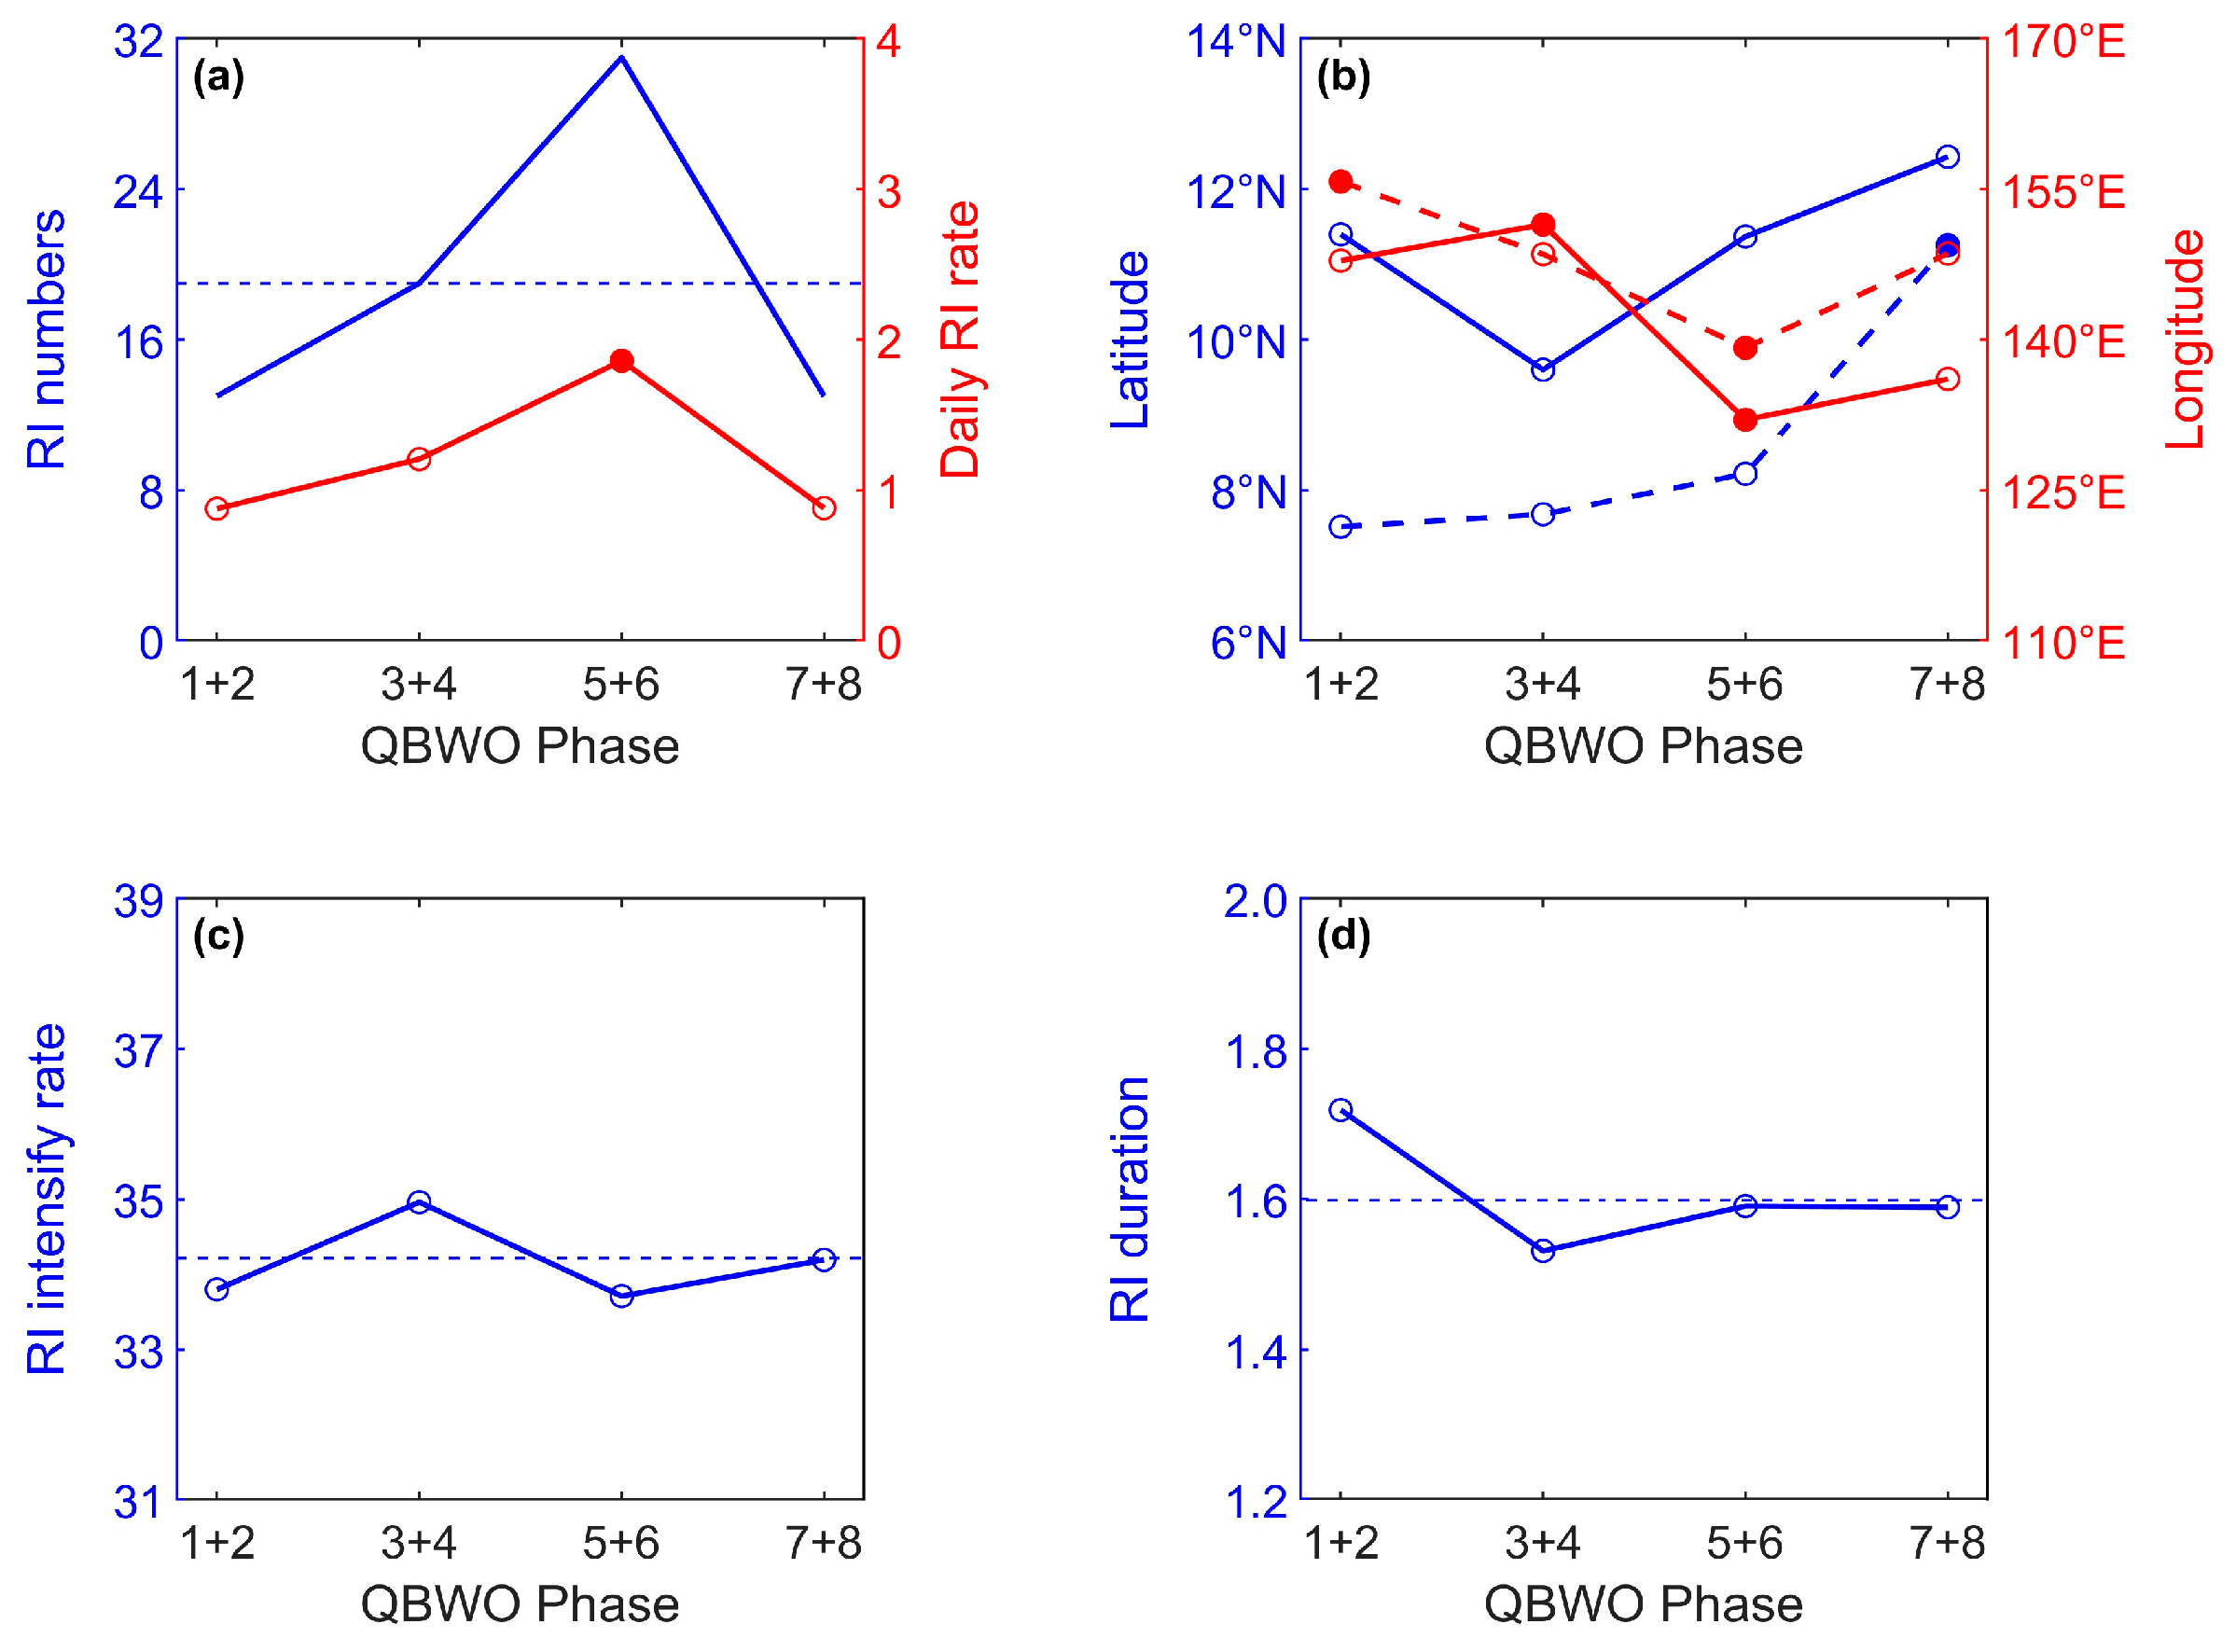
3.3. Impacts of QBWO on TCRI

As for MJO, the phases of QBWO are divided into four types: phase 1 + 2 when the convective center is located in the eastern NWP, phase 3 + 4 when the convective center is located in the central NWP, phase 5 + 6 when the convective center is located near the Philippine Sea, and phase 7 + 8 when the non-convective center covers the SCS (Figure 6). Similar to the MJO, most RI events occur in the convective region. In phase 1 + 2, convective signals are weak, and its center is located at the eastern NWP. The average location of RIs is near 150°E, and the number of RIs is 13, accounting for 17% of the total. In phase 3 + 4, as the convective signals strengthen and its center shifts westward, the average location of RIs also shifts westward, with the number of RIs increasing to 19. In phase 5 + 6, the convective center continues moving northwestward and dominates the region west of 150°E, the number of RIs reaches its maximum (31, 40% of the total). As the convective center weakens and propagates into the region east of the Luzon strait and northern SCS in phase 7 + 8, the number of Ris (13) significantly decreases. These results indicate that the phase transition of the QBWO plays a significant role in regulating the location and frequency of RI events.
Compared to the MJO, the differences in the number of RIs among four phases of the QBWO are relatively smaller. The RI number peaks in phases 5 + 6 (31) and reaches its minimum (13) in phase 1 + 2 and phase 7 + 8 of the QBWO (Figure 7a). To the DRR, only the value in phase 5 + 6 passes the significance test, indicating RI occurrence is significantly enhanced in this phase. The maximum (minimum) value of the DRR is 1.86% (0.88%) in phase 5 + 6 (phase 7 + 8) of the QBWO, resulting in an ESR value of 2.11. The ESR of the QBWO is much lower than that of the MJO (6.67), indicating the modulation of the QBWO on RI frequency is much weaker than that of the MJO. As shown in Figure 7b, the average TC genesis location shifts northwestward from phase 1 + 2 to phase 5 + 6 and northeastward in phase 7 + 8. Variation of RI occurrence location is consistent with the TC genesis location except in phase 3 + 4, in which the RI occurrence location shifts southeastward while the TC genesis location shifts northwestward. The result shows that the RI occurrence location shifts significantly eastward (westward) in phase 3 + 4 (phase 5 + 6) above the 95% confidence level. The difference in RI intensify rate and duration among four phases are small and no value passes the significance test (Figure 7c,d), indicating the modulation of QBWO on the RI rate and duration is weak.
Figure 8 shows the composited anomalies of RV, RHUM, VWS, and SST in each phase of QBWO during winter. In phase 1 + 2 of the QBWO, negative (positive) RV, RHUM, and VWS anomalies appear in the region west (east) of 150°E, and weak positive SST anomalies dominate the NWP. The average longitude of the TC genesis location is 155.8°E (Figure 7b), and most NWP TCs move westward/northwestward. The negative anomalies in RV and RHUM west of 150°E significantly suppress RI, leading to only 13 RI events occurring in phase 1 + 2. In phase 3 + 4 of the QBWO, with the northwestward propagation of the QBWO signals, the environmental anomalies also shift westward. Large positive anomalies of RV and RHUM dominate the central NWP, which are favorable for RI occurrence, while weak positive VWS and negative SST anomalies in the main RI region hinder it. Since the magnitude of the VWS and SST anomalies is relatively small, RI is enhanced by large positive RV and RHUM anomalies, resulting in 19 RI events in phase 3 + 4. In phase 5 + 6, large positive RV and RHUM anomalies continue moving westward, which dominate the region west of 150°E. SST anomalies are still not significant. Though positive VWS anomalies appear in the main RI region, RI is significantly enhanced by the large positive RV and RHUM anomalies, resulting in most RI events (31) occurring in this phase. In phase 7 + 8, negative RV and RHUM anomalies dominate the NWP, while VWS is not significant. Weak negative SST anomalies appear in the west NWP, which are unfavorable for RI occurrence. Only 13 RI events occur in this phase, indicating RI is significantly suppressed by the negative RV and RHUM anomalies.

3.4. Combined Impacts of MJO and QBWO on TCRI

To investigate the combined influence of MJO and QBWO on RITC, the phases of the MJO and QBWO are divided into convective phases and non-convective phases, based on the location of the convective/non-convective signals that dominate the main RI region. The convective phases include phases 3 + 4 and 5 + 6 of both the MJO and QBWO, while the non-convective phases include phases 7 + 8 and 1 + 2 of both the MJO and QBWO. As shown in Figure 9, in both MJO and QBWO convective phases, large negative OLR anomalies dominate the NWP, and the RI number reaches its maximum of 35, accounting for 46% of the total RI number. In MJO convective (non-convective) phases with QBWO non-convective (convective) phases, OLR anomalies are weak, with a triple pattern, and 11 (15) RI events occur. In both the MJO and QBWO non-convective phases, large positive OLR anomalies dominate the NWP, and 15 RI events occur. The number of days in each of the four phase combinations is 2002, 1197, 1091, and 2214, respectively.
Apart from the significant increase in RI numbers during both the MJO and QBWO convective phases, the RI numbers are relatively comparable during other periods. Since the number of days is much different among the four phase combinations, DRR is better for evaluating the combined effect of MJO and QBWO on RI frequency. DRR peaks in both the MJO and QBWO convective phases (1.75%) and reaches its minimum (0.88%) in both the MJO and QBWO non-convective phases. Both values pass the significance test above the 95% confidence level, indicating RI is significantly enhanced (suppressed) in both the MJO and QBWO convective (non-convective) phases (Figure 10a). In contrast to the RI locations influenced by the TCG position under the individual effects of MJO and QBWO, the combined influence shows a considerable discrepancy between RI location and TCG position when the QBWO is in a non-convective phase (Figure 10b). For the RI occurrence location, RI rate, and RI duration, all the values don’t pass the significance test above the 95% confidence level (Figure 10b–d), indicating that the combined effect of MJO and QBWO on these factors is not significant. It should be noted that the RI rate is the highest and the duration is shortest during the MJO convective phases with QBWO non-convective phases.
Figure 11 shows the composited anomalies of RV, RHUM, VWS, and SST in combined phases of the MJO and QBWO. In both the MJO and QBWO convective (non-convective) phases, large positive (negative) RV and RHUM anomalies dominate the western NWP, weak negative (positive) SST anomalies appear in the whole NWP, while VWS anomalies are weak positive (negative) in the southern region and weak negative (positive) in the northern region. In the main RI region, the conditions of RV and RHUM are more favorable (unfavorable) for RI occurrence, while the conditions of VWS and SST are unfavorable (favorable) for RI occurrence in both the MJO and QBWO convective (non-convective) phases. As mentioned above, DRR reaches its maximum of 1.75 (minimum of 0.68) during both the MJO and QBWO convective (non-convective) phases (Figure 10a), indicating RV and RHUM play a major role in modulating the RI frequency. In the other two phases, all the values are weak in most regions of the NWP. Generally speaking, in the main RI region, RV, RHUM, and VWS show weak positive (negative) anomalies, while SST shows weak negative (positive) anomalies in the MJO convective (non-convective) phases with QBWO non-convective (convective) phases. Since the anomalies in all four parameters remain negligible, the DRR exhibits no statistically significant differences between the two phase types.

4. Discussion and Conclusions

In this study, we investigated the impact of the MJO and QBWO on TCRI in the NWP during winter. Both the MJO and QBWO exerted a significant influence on TCRI activity in the NWP. More (less) RI occurred in the convective (non-convective) phases of MJO and QBWO and the MJO exerted a stronger modulation on RI frequency than QBWO. Accompanying the eastward (northwestward) propagation of the MJO (QBWO) signals, RI occurrence location showed a clear eastward (northwestward) shift. Compared to RI frequency and occurrence location, the impacts of the MJO and QBWO on RI intensify rate and duration were relatively weak. The combined effects of the MJO and QBWO also show a significant modulation on the RI frequency and location, while the influence on RI intensify rate and duration are not obvious. In terms of environmental mechanisms, the results show low-level RV and mid-level RHUM played a major role in the modulation of the MJO and QBWO on TCRI, while the effects of SST and VWS were relatively weak. More (less) RI occurred in the region with positive (negative) anomalies of RV and RHUM. With the eastward (westward) propagation of the MJO (QBWO), anomalies in RV and RHUM also shifted eastward (westward), resulting in an eastward (westward) shift in RI occurrence location.
Previous studies have shown ENSO and PDO can modulate the TCRI and the magnitude of ISO [25,26,29]. Further research is needed to explore the impact of the MJO and QBWO on TCRI under different ENSO and PDO conditions.

Author Contributions

All authors contributed to the study conception and design. Material preparation and analysis was performed by Z.L., while data collection and programming were performed by C.C. The first draft of the manuscript was written by C.C., and all authors commented on previous versions of the manuscript. All authors have read and agreed to the published version of the manuscript.

Funding

This study was jointly funded by the National Natural Science Foundation of China (Grant no. 42476219 and 42227901); Independent research project of Southern Ocean Laboratory (Grant number SML2022SP301); Innovative Team Plan for Department of Education of Guangdong Province (No. 2023KCXTD015); Guangdong Science and Technology Plan Project (Observation of Tropical marine environment in Yuexi); Guangdong Ocean University Scientific Research Program (Grant number 060302032106).

Data Availability Statement

The best-track TC dataset was provided by JTWC (Joint Typhoon Warning Center, available at https://www.metoc.navy.mil/jtwc/jtwc.html?western-pacific, accessed on 1 January 2023), Daily Advanced Very High-Resolution Radiometer (AVHRR) OLR with 2.5° × 2.5° horizontal resolution from the National Oceanic and Atmospheric Administration (NOAA) polar orbiting satellites (available at https://psl.noaa.gov/data/gridded/data.olrcdr.interp.html, accessed on 1 January 2023). Daily SST with a horizontal resolution of 0.25° × 0.25° from the Extended Reconstructed Sea Surface Temperature (ERSST), version 5 (available at https://cds.climate.copernicus.eu, accessed on 1 January 2023); Daily atmospheric datasets including RH700, ξ850, and the VWS with a horizontal resolution of 2.5° × 2.5° from the National Centers for Environmental Prediction and the National Center for Atmospheric Research (NCEP-NCAR, available at https://www.esrl.noaa.gov/psd/data/gridded/data.ncep.reanalysis.pressure.html, accessed on 1 January 2023).

Conflicts of Interest

The authors declare no conflicts of interest.

References

  1. Gemmer, M.; Yin, Y.; Luo, Y.; Fischer, T. Tropical cyclones in China: County-based analysis of landfalls and economic losses in Fujian Province. Quat. Int. 2011, 244, 169–177. [Google Scholar] [CrossRef]
  2. Peduzzi, P.; Chatenoux, B.; Dao, H.; De Bono, A.; Herold, C.; Kossin, J.; Mouton, F.; Nordbeck, O. Global Trends in Tropical Cyclone Risk. Nat. Clim. Change 2012, 2, 289–294. [Google Scholar] [CrossRef]
  3. Zhang, Q.; Wu, L.; Liu, Q. Tropical cyclone damages in China 1983–2006. Bull. Am. Meteorol. Soc. 2009, 90, 489–496. [Google Scholar] [CrossRef]
  4. Hendricks, E.A.; Peng, M.S.; Fu, B.; Li, T. Quantifying Environmental Control on Tropical Cyclone Intensity Change. Mon. Weather Rev. 2010, 138, 3243–3271. [Google Scholar] [CrossRef]
  5. Lee, C.Y.; Tippett, M.K.; Sobel, A.H.; Camargo, S.J. Rapid Intensification and the Bimodal Distribution of Tropical Cyclone Intensity. Nat. Commun. 2016, 7, 10625. [Google Scholar] [CrossRef]
  6. Knaff, J.A.; Sampson, C.R.; Musgrave, K.D. An Operational Rapid Intensification Prediction Aid for the Western North Pacific. Weather Forecast. 2018, 33, 799–811. [Google Scholar]
  7. Elsberry, R.L.; Lambert, T.D.; Boothe, M.A. Accuracy of Atlantic and Eastern North Pacific Tropical Cyclone Intensity Forecast Guidance. Weather Forecast. 2007, 22, 747–762. [Google Scholar] [CrossRef]
  8. Elsberry, R.L. Advances in Research and Forecasting of Tropical Cyclones from 1963–2013. Asia-Pac. J. Atmos. Sci. 2014, 50, 3–16. [Google Scholar] [CrossRef]
  9. McBride, J.L. Tropical Cyclone Formation. In Global Perspective on Tropical Cyclones; Elsberry, R.L., Ed.; WMO: Geneva, Switzerland, 1995; pp. 63–105. [Google Scholar]
  10. Gray, W.M. Global View of the Origin of Tropical Disturbances and Storms. Mon. Weather Rev. 1968, 96, 669–700. [Google Scholar] [CrossRef]
  11. Wu, L.; Wen, Z.; Huang, R.; Wu, R. Possible Linkage Between the Monsoon Trough Variability and the Tropical Cyclone Activity over the Western North Pacific. Mon. Weather Rev. 2012, 140, 140–150. [Google Scholar] [CrossRef]
  12. Weng, J.; Wang, L.; Luo, J.; Chen, B.; Peng, X.; Gan, Q. A Contrast of the Monsoon–Tropical Cyclone Relationship Between the Western and Eastern North Pacific. Atmosphere 2022, 13, 1465. [Google Scholar] [CrossRef]
  13. Emanuel, K.A. Thermodynamic Control of Hurricane Intensity. Nature 1999, 401, 665–669. [Google Scholar]
  14. Chan, J.C.; Duan, Y.; Shay, L.K. Tropical Cyclone Intensity Change from a Simple Ocean–Atmosphere Coupled Model. J. Atmos. Sci. 2001, 58, 154–172. [Google Scholar]
  15. Wu, L.; Wang, B. Assessing Impacts of Global Warming on Tropical Cyclone Tracks. J. Clim. 2004, 17, 1686–1698. [Google Scholar]
  16. Hong, J.; Wu, Q. Modulation of Global Sea Surface Temperature on Tropical Cyclone Rapid Intensification Frequency. Environ. Res. Commun. 2021, 3, 041001. [Google Scholar]
  17. Emanuel, K.; DesAutels, C.; Holloway, C.; Korty, R. Environmental Control of Tropical Cyclone Intensity. J. Atmos. Sci. 2004, 61, 843–858. [Google Scholar]
  18. Lin, I.I.; Liu, W.T.; Wu, C.C.; Chiang, J.C.H.; Sui, C.H. Satellite Observations of Modulation of Surface Winds by Typhoon-Induced Upper Ocean Cooling. Geophys. Res. Lett. 2003, 30, 1131. [Google Scholar]
  19. Lin, I.I.; Wu, C.C.; Emanuel, K.A.; Lee, I.H.; Wu, C.R.; Pun, I.F. The Interaction of Supertyphoon Maemi (2003) with a Warm Ocean Eddy. Mon. Weather Rev. 2005, 133, 2635–2649. [Google Scholar] [CrossRef]
  20. Wu, C.C.; Lee, C.Y.; Lin, I.I. The Effect of the Ocean Eddy on Tropical Cyclone Intensity. J. Atmos. Sci. 2007, 64, 3562–3578. [Google Scholar]
  21. Molinari, J.; Vollaro, D. What Percentage of Western North Pacific Tropical Cyclones Form within the Monsoon Trough? Mon. Weather Rev. 2013, 141, 499–505. [Google Scholar]
  22. Chen, T.; Chen, S.; Zhou, M.; Tu, C.; Zhang, A.; Chen, Y.; Li, W. Northward Shift in Landfall Locations of Tropical Cyclones over the Western North Pacific during the Last Four Decades. Adv. Atmos. Sci. 2022, 39, 304–319. [Google Scholar] [CrossRef]
  23. Liu, K.S.; Chan, J.C. Recent Increase in Extreme Intensity of Tropical Cyclones Making Landfall in South China. Clim. Dyn. 2020, 55, 1059–1074. [Google Scholar] [CrossRef]
  24. Zhao, H.; Wang, C.; Yoshida, R. Modulation of Tropical Cyclogenesis in the Western North Pacific by the Quasi-Biweekly Oscillation. Adv. Atmos. Sci. 2016, 33, 1361–1375. [Google Scholar] [CrossRef]
  25. Guo, Y.P.; Tan, Z.M. Westward Migration of Tropical Cyclone Rapid-Intensification over the Northwestern Pacific during Short Duration El Niño. Nat. Commun. 2018, 9, 1507. [Google Scholar] [CrossRef] [PubMed]
  26. Lee, M.; Kim, T.; Cha, D.H.; Min, S.K.; Park, D.S.R.; Yeh, S.W.; Chan, J.C. How Does Pacific Decadal Oscillation Affect Tropical Cyclone Activity over Far East Asia? Geophys. Res. Lett. 2021, 48, e2021GL096267. [Google Scholar] [CrossRef]
  27. Yoshida, R.; Kajikawa, Y.; Ishikawa, H. Impact of Boreal Summer Intraseasonal Oscillation on Environment of Tropical Cyclone Genesis over the Western North Pacific. Sola 2014, 10, 15–18. [Google Scholar] [CrossRef]
  28. Basconcillo, J.; Moon, I.J. Increasing Activity of Tropical Cyclones in East Asia during the Mature Boreal Autumn Linked to Long-Term Climate Variability. Npj Clim. Atmos. Sci. 2022, 5, 4. [Google Scholar] [CrossRef]
  29. Camargo, S.J.; Sobel, A.H. Western North Pacific Tropical Cyclone Intensity and ENSO. J. Clim. 2005, 18, 2996–3006. [Google Scholar] [CrossRef]
  30. Gao, J.; Zhao, H.; Klotzbach, P.J.; Shi, C.; Ma, Z. Recent Weakening of the Relationship between El Niño–Southern Oscillation and Western North Pacific Tropical Cyclone Season Onset Date. Int. J. Climatol. 2022, 42, 9462–9470. [Google Scholar] [CrossRef]
  31. Wu, L.; Takahashi, M. Contributions of Tropical Waves to Tropical Cyclone Genesis over the Western North Pacific. Clim. Dyn. 2018, 50, 4635–4649. [Google Scholar] [CrossRef]
  32. Latos, B.; Peyrillé, P.; Lefort, T.; Baranowski, D.B.; Flatau, M.K.; Flatau, P.J.; Matthews, A.J. The Role of Tropical Waves in the Genesis of Tropical Cyclone Seroja in the Maritime Continent. Nat. Commun. 2023, 14, 856. [Google Scholar] [CrossRef]
  33. Li, R.C.; Zhou, W. Modulation of Western North Pacific Tropical Cyclone Activity by the ISO. Part II: Tracks and Landfalls. J. Clim. 2013, 26, 2919–2930. [Google Scholar] [CrossRef]
  34. Hsu, P.C.; Li, T. Interactions Between Boreal Summer Intraseasonal Oscillations and Synoptic-Scale Disturbances over the Western North Pacific. Part II: Apparent Heat and Moisture Sources and Eddy Momentum Transport. J. Clim. 2011, 24, 942–961. [Google Scholar]
  35. Maloney, E.D.; Dickinson, M.J. The Intraseasonal Oscillation and the Energetics of Summertime Tropical Western North Pacific Synoptic-Scale Disturbances. J. Atmos. Sci. 2003, 60, 2153–2168. [Google Scholar] [CrossRef]
  36. Madden, R.A.; Julian, P.R. Description of Global-Scale Circulation Cells in the Tropics with a 40–50 Day Period. J. Atmos. Sci. 1972, 29, 1109–1123. [Google Scholar]
  37. Klotzbach, P.J. The Madden–Julian Oscillation’s Impacts on Worldwide Tropical Cyclone Activity. J. Clim. 2014, 27, 2317–2330. [Google Scholar] [CrossRef]
  38. Jia, X.; Yang, S. Impact of the Quasi-Biweekly Oscillation over the Western North Pacific on East Asian Subtropical Monsoon during Early Summer. J. Geophys. Res. Atmos. 2013, 118, 4421–4434. [Google Scholar]
  39. Ling, Z.; Wang, Y.; Wang, G. Impact of Intraseasonal Oscillations on the Activity of Tropical Cyclones in Summer over the South China Sea. Part I: Local Tropical Cyclones. J. Clim. 2016, 29, 855–868. [Google Scholar]
  40. Shu, S.; Ming, J.; Chi, P. Large-Scale Characteristics and Probability of Rapidly Intensifying Tropical Cyclones in the Western North Pacific Basin. Weather Forecast. 2012, 27, 411–423. [Google Scholar]
  41. Webster, P.J.; Holland, G.J.; Curry, J.A.; Chang, H.R. Changes in Tropical Cyclone Number, Duration, and Intensity in a Warming Environment. Science 2005, 309, 1844–1846. [Google Scholar]
  42. Bhatia, K.; Baker, A.; Yang, W.; Vecchi, G.; Knutson, T.; Murakami, H.; Whitlock, C. A Potential Explanation for the Global Increase in Tropical Cyclone Rapid Intensification. Nat. Commun. 2022, 13, 6626. [Google Scholar] [CrossRef]
  43. Zhao, H.; Duan, X.; Raga, G.B.; Klotzbach, P.J. Changes in Characteristics of Rapidly Intensifying Western North Pacific Tropical Cyclones Related to Climate Regime Shifts. J. Clim. 2018, 31, 8163–8179. [Google Scholar] [CrossRef]
  44. Wang, B.; Zhou, X. Climate Variation and Prediction of Rapid Intensification in Tropical Cyclones in the Western North Pacific. Meteorol. Atmos. Phys. 2008, 99, 1–16. [Google Scholar] [CrossRef]
  45. Fudeyasu, H.; Ito, K.; Miyamoto, Y. Characteristics of Tropical Cyclone Rapid Intensification over the Western North Pacific. J. Clim. 2018, 31, 8917–8930. [Google Scholar] [CrossRef]
  46. Ge, X.; Shi, D.; Guan, L. Monthly Variations of Tropical Cyclone Rapid Intensification Ratio in the Western North Pacific. Atmos. Sci. Lett. 2018, 19, e814. [Google Scholar] [CrossRef]
  47. Aberson, S.D.; Kaplan, J. The Relationship between the Madden–Julian Oscillation and Tropical Cyclone Rapid Intensification. Weather Forecast. 2020, 35, 1865–1870. [Google Scholar] [CrossRef]
  48. Matthews, A.J. Propagation Mechanisms for the Madden-Julian Oscillation. Q. J. R. Meteorol. Soc. 2000, 126, 2637–2651. [Google Scholar]
  49. Li, R.C.; Zhou, W.; Chan, J.C.; Huang, P. Asymmetric Modulation of Western North Pacific Cyclogenesis by the Madden–Julian Oscillation under ENSO Conditions. J. Clim. 2012, 25, 5374–5385. [Google Scholar] [CrossRef]
  50. Zhao, H.; Jiang, X.; Wu, L. Modulation of Northwest Pacific Tropical Cyclone Genesis by the Intraseasonal Variability. J. Meteorol. Soc. Jpn. Ser. II 2015, 93, 81–97. [Google Scholar] [CrossRef]
Figure 1. (a) The yearly number of RITCs (blue lines) and the total TCs (orange lines), and (b) spatial distribution of RI numbers in each 5° × 5°grid box and tracks of RITCs from formation to occurrence RI (gray lines and blue circles) in NWP during winters in 1979–2021. The thin and bold lines in (a) represent the original data and 5-year moving data, and the blue (orange) dashed line represents the linear trend of annual RITC (TC) numbers, respectively.
Remotesensing 17 01259 g001
Figure 2. The longitudinal distribution of the number of total TCs (orange bars) and RITCs (blue bars) and RI ratio (black curve, right axis) in each 10-degree bin in the NWP during the winters in 1979–2021. The division is based on the longitudes of the TC genesis location.
Remotesensing 17 01259 g002
Figure 3. The composite OLR anomalies (color; W/m2) and RI initial location (black dots) in corresponding phase of winter MJO. Only OLR values exceeding 95% confidence level are plotted. The numbers in the top-right corners are the RI numbers in the corresponding phase. The magenta triangles in the figures denote the mean RI positions. The phase that the RI events belong to is determined based on the initial day of the RI event.
Remotesensing 17 01259 g003
Figure 4. The RI number and daily RI rate (units: %) (a), occurrence location (b), intensification rate (units: knots/day) (c), and duration (units: days) (d), in different phases of MJO. For (b), the dashed line represents the TC genesis location, while the solid line represents the RI occurrence location. The blue dashed line indicates the mean value of the variables, and the filled circles represent the values that exceed the 95% confidence level.
Remotesensing 17 01259 g004
Figure 5. Composite anomalies of RV at 850 hPa level (units: 10−5/s) (a18), RHUM at 700 hPa (units: %) (b18), 200–850 hPa VWS (units: m/s) (c18), and SST (units: °C) (d18), for different MJO phase combinations in winter are shown. The dashed red contours in (d18) represent climatological SST in winter. Only values exceeding the 95% confidence level are plotted. The black circles represent the initial positions of rapid intensification RI events. The RI numbers are indicated in the upper-right corner. Magenta triangles and boxes mark the average initial locations of RI events and the main RI regions (which account for 60% of RI events), respectively. The phase is determined by the initial day of the RI event.
Remotesensing 17 01259 g005
Figure 6. The same as Figure 3, but for QBWO. Only OLR values exceeding 95% confidence level are plotted. The numbers in the top-right corners are the RI numbers in the corresponding phase. The magenta triangles in the figures denote the mean RI positions. The phase that the RI events belong to is determined based on the initial day of the RI event.
Remotesensing 17 01259 g006
Figure 7. The RI number and daily RI rate (units: %) (a), occurrence location (b), intensification rate (units: knots/day) (c), and duration (units: days) (d), in different phases of QBWO. For (b), the dashed line represents the TC genesis location, while the solid line represents the RI occurrence location. The blue dashed line indicates the mean value of the variables, and the filled circles represent the values that exceed the 95% confidence level.
Remotesensing 17 01259 g007
Figure 8. Composite anomalies of RV at 850 hPa level (units: 10−5/s) (a18), RHUM at 700 hPa (units: %) (b18), 200–850 hPa VWS (units: m/s) (c18), and SST (units: °C) (d18), for different QBWO phase combinations in winter are shown. The dashed red contours in (d18) represent climatological SST in winter. Only values exceeding the 95% confidence level are plotted. The black circles represent the initial positions of rapid intensification RI events. The RI numbers are indicated in the upper-right corner. Magenta triangles and boxes mark the average initial locations of RI events and the main RI regions (which account for 60% of RI events), respectively. The phase is determined by the initial day of the RI event.
Remotesensing 17 01259 g008
Figure 9. The composite OLR anomalies (color; W/m2) and RI occurrence location (black dots) in combined phases of the MJO and QBWO. Only OLR values exceeding 95% confidence level are plotted. (1) both MJO and QBWO convective phases; (2) MJO convective phases with QBWO non-convective phases; (3) MJO non-convective phases with QBWO convective phases; and (4) both MJO and QBWO non-convective phases. The numbers in the top-right corner are the number of RI events. The magenta triangles in the figures denote the mean RI positions. The phase that the RI events belong to is determined based on the initial day of the RI event.
Remotesensing 17 01259 g009
Figure 10. The RI number and daily RI rate (units: %) (a), occurrence location (b), intensification rate (units: knots/day) (c), and duration (units: days) (d), in combined phases of the MJO and QBWO. (Index 1) both MJO and QBWO convective phases; (Index 2) MJO convective phases with QBWO non-convective phases; (Index 3) MJO non-convective phases with QBWO convective phases; and (Index 4) both MJO and QBWO non-convective phases. For (b), the dashed line represents the TC genesis location, while the solid line represents the RI occurrence location. The blue dashed line indicates the mean value of the variables, and the filled circles represent that the results are at the 95% confidence level.
Remotesensing 17 01259 g010
Figure 11. Composite anomalies of RV at 850 hPa level (units: 10−5/s) (a14), RHUM at 700 hPa (units: %) (b14), vertical wind shear of 200–850 hPa VWS (units: m/s) (c14), and SST (units: °C) (d14), for combined phases of the MJO and QBWO are shown. (Index 1) both MJO and QBWO convective phases; (Index 2) MJO convective phases with QBWO non-convective phases; (Index 3) MJO non-convective phases with QBWO convective phases and (Index 4) both MJO and QBWO non-convective phases. Solid contours in (d14) represent mean SST values of each phase. The black circles represent the initial positions of RI events. The RI numbers are indicated in the upper-right corners. Magenta triangles and boxes mark the average locations of RITC events and the main RI regions (which account for 60% of RI events), respectively. The phase divisions of RITC are determined by the initial day of the RI event.
Remotesensing 17 01259 g011
Disclaimer/Publisher’s Note: The statements, opinions and data contained in all publications are solely those of the individual author(s) and contributor(s) and not of MDPI and/or the editor(s). MDPI and/or the editor(s) disclaim responsibility for any injury to people or property resulting from any ideas, methods, instructions or products referred to in the content.

