1. Introduction
Synthetic aperture radar (SAR) is a type of active signal-emitting sensor capable of obtaining high-resolution images by utilizing pulse compression technology and synthetic aperture principles [
1,
2]. Compared to other sensors, such as optical and infrared sensors, SAR can acquire the scattering information of the target area in all-weather and all-time conditions, delivering rich and timely information about the Earth’s surface. This makes SAR widely used in extensive applications including land-cover mapping, disaster monitoring, military reconnaissance, and emergency alert [
3,
4,
5].
The interpretation of SAR images is crucial for their practical applications, where substantial research has been conducted across many domains, such as SAR image despeckling [
6], super-resolution [
7], target detection recognition, and multi-sensor image fusion [
8,
9]. The investigation on SAR characteristics relies on a sufficient number of high-quality SAR samples, especially those focusing on SAR targets. For instance, in the domains of SAR multi-sensor image fusion [
10,
11,
12] and SAR-optical image fusion [
13], high-quality SAR samples are indispensable for the effective integration of scene information and interpretation of SAR scene imagery [
14]. One of the research fields with an urgent necessity for high-quality SAR samples is the automatic target recognition (ATR) of SAR images [
15,
16,
17,
18,
19,
20]. A substantial quantity of SAR target images is essential to extract target features, thereby enhancing recognition rates and facilitating the practical implementation of SAR ATR [
21].
However, in practical situations, numerous studies focused on SAR image interpretation studies are encountering the issue of insufficient datasets. SAR image data acquisition is challenging, time-consuming, and resource-intensive. Consequently, the availability of effective samples is limited, particularly concerning non-cooperative targets. Moreover, the unique imaging mechanism of SAR makes it highly sensitive to target angle offset, making it hard to collect datasets with full angle information for specific targets. Although the literature studies have accumulated a large amount of data for SAR target detection (such as MSTAR, SSDD, HRSID, LS-SSDD [
22,
23,
24,
25,
26]), the acquisition of such target samples with sufficient angle information remains constrained in practical scenarios, primarily due to counter-reconnaissance technologies. With the continuous advancements in SAR target recognition, many studies found that multi-azimuth observation can provide richer target features, thereby improving the accuracy and reliability of SAR target recognition [
27]. Therefore, SAR image generation with a controllable azimuth can provide detailed features of the target, thereby enhancing the recognizability of SAR images. There is still a substantial gap in meeting the practical requirements due to the scarcity of SAR samples.
In response to the challenge of insufficient sample availability, extensive research has been undertaken in recent years [
28,
29,
30,
31,
32,
33,
34]. The four primary strategies for acquiring synthetic aperture radar (SAR) target samples include the following: (i) data augmentation operations, such as rotation, translation, mirroring, and affine transformation, (ii) SAR image synthesis based on 3D modeling, (iii) data expansion utilizing deep generative models, and (iv) measured data collection. Among these strategies, data augmentation operations alter only the geometric shape of SAR images without considering the SAR imaging mechanisms; thus, they are incapable of achieving angle-specific data expansion. SAR image synthesis based on 3D modeling requires precise parameters of the targets and involve complex electromagnetic calculations. For typical non-cooperative targets, obtaining their precise structural information is unfeasible, and the intricate and laborious nature of electromagnetic calculations significantly increases resource costs. measured data collection can obtain the SAR target images under different actual scenarios with different platforms. These acquired data are the most authentic and effective. However, this acquirement will consume massive human, material, and time resources, and the number of the acquired SAR target images in each experiment are often limited. The result is that they cannot be used as a cost-effective way for application to obtain enough SAR data. Additionally, the synthesized images frequently suffer from a low resolution and insufficient diversity [
35]. Moreover, sample enhancement in SAR (ATR) typically focuses on increasing the diversity of SAR samples and avoiding the overfitting of classification algorithms [
36]. These operations primarily augment images from an image processing viewpoint; thus, the enhanced images fail to comply with radar imaging mechanisms and do not include novel content. Therefore, these methods cannot substantially augment the informational content of the target.
By contrast, generative approaches employing deep learning technologies have incomparable advantages in terms of sample expansion. Deep generative models simulate data that match the desired sample distribution. They bypass explicit feature extraction, learning effective hidden representations to enhance model performance and avoid complex electromagnetic calculations. Generative Adversarial Networks (GAN) demonstrate superior performance in image generation, owing to their advanced data-fitting and versatility capabilities [
37]. Although extensive studies on SAR image generation using GANs exist, obtaining the required number of SAR images is still challenging, especially in practical applications with very scarce samples of the specific targets. Therefore, performing angle extrapolation for specific targets with limited samples is still a challenging task.
This research presents a sample-efficient and azimuth angle-controllable GAN-based approach, enabling the generation of SAR images within a given angle range. The proposed GAN architecture primarily comprises a generator, an angle synthesis algorithm, and a discriminator. First, the generator uses a local fusion module to merge features from images at different angles, creating a specified range of SAR images using a sparse representation-based algorithm. Next, a similarity discriminator and an azimuth angle predictor based on scattering point topology are introduced. Finally, a discriminator identifies real versus generated images, and the angle predictor checks if the angle of the output image is within the given range.In summary, this research presents the subsequent contributions:
A GAN architecture is proposed for angle controllable image generation with limited sample availability. It includes a generator, an angle synthesis algorithm module, and a discriminator, utilizing a local fusion module and a sparse representation-based synthesis algorithm to generate SAR images within a specified angle range.
Two discriminators are introduced, i.e., the similarity discriminator and the azimuth discriminator, to regulate image quality and azimuth angles. The similarity discriminator uses adversarial and local reconstruction losses to enhance network training and guide generation, while the azimuth angle predictor determines image angles via a scattering point topology diagram and learns angle encoding relationships for generating images at specified angles.
The recognition of SAR targets is improved through the generative augmentation of the samples. A linear combination of synthetic aperture radar (SAR) images with missing azimuth angles is achieved utilizing a sparse model. Therefore, the proposed approach not only generates near-authentic high-quality samples, but also enhances the exploitation of SAR-specific target characteristics.
3. Proposed Method
This section introduces the proposed framework of azimuth-controllable SAR target image generation. Initially, we provide a detailed illustration of the proposed azimuth-controllable SAR target image generation framework. Subsequently, we elaborate on the details of various modules introduced within the proposed framework.
3.1. Proposed SAR Image Generation Framework
According to momentum learning theory, data situated within multidimensional space generally originate from low-dimensional momentum mapping [
63], and targets in SAR images are no exception. Targets in SAR imagery with continuous azimuthal angles can be represented within a low-dimensional flow [
64], indicating that the distribution of targets in SAR images is stable and learnable. Consequently, we introduce a SAR target image generation network that is azimuth-controllable and sample-efficient in training.
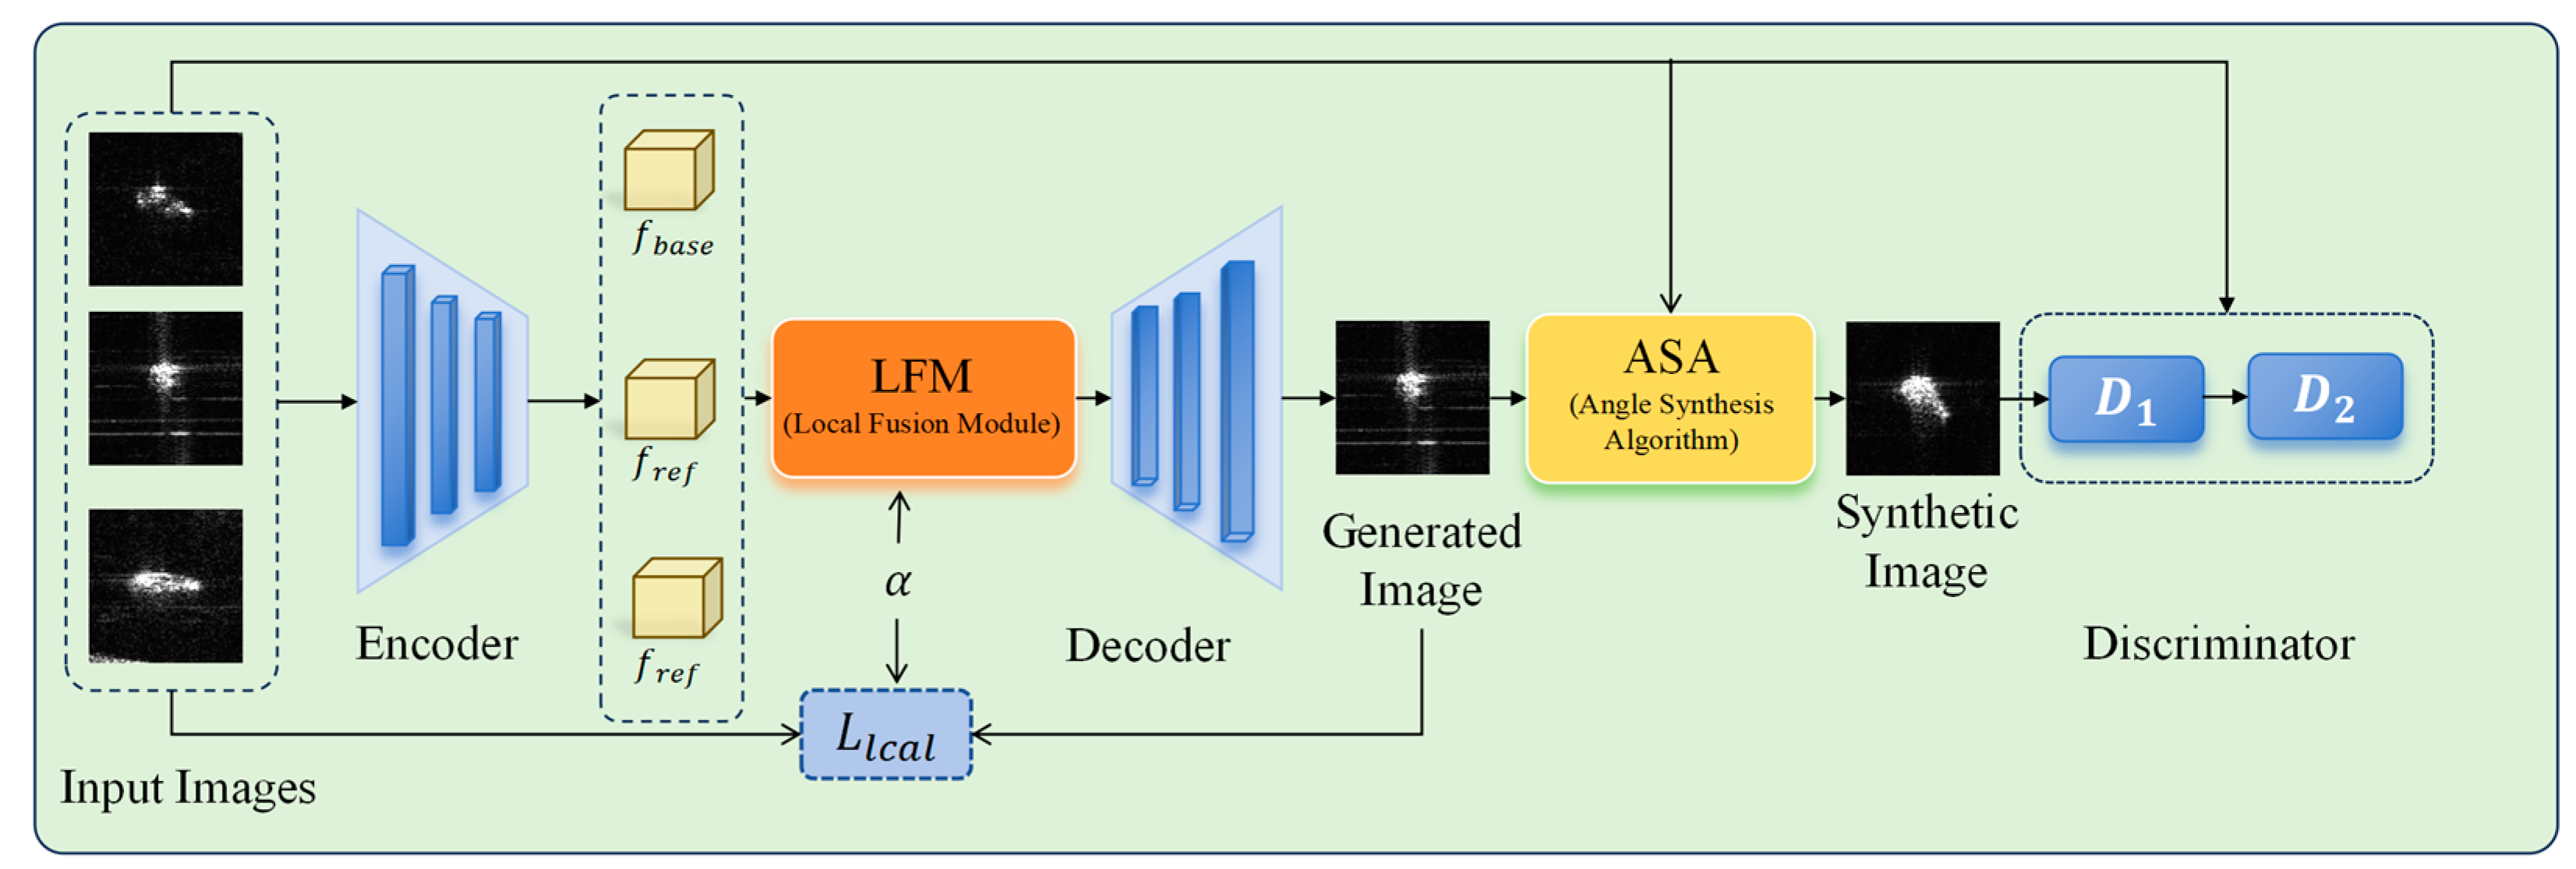
The structure of the proposed framework is depicted in
Figure 1. The objective is to synthesize SAR images with missing range azimuth angles utilizing SAR images with known azimuth angles. The network is architected to generate SAR target images with estimated angles through feature fusion and sparse representation techniques. Furthermore, the distribution and precision of these angles are validated using similarity and angle discriminators.
Initially, the dataset is partitioned into a training set
Da and a generation set
Db, ensuring that
. During the training phase, the model extracts a certain number of images from the training set
for training, being encouraged to learn transferable generative capabilities and continuously optimize the angle discriminator. Concurrently, the aim of the angle discriminator is to correlate the target angles with distinct angle labels during this training phase. It should be noted that the angle synthesis algorithm we designed is ‘frozen’ during the training phase; the particular reasons are explained in
Section 3.2. During the testing phase, the networks generate novel images of a particular category, thus augmenting the target samples.
As depicted in
Figure 1, The generator
is a conditional generator that comprises an encoder
, a decoder
, and a local fusion module (LFM). The input images
are first fed into the encoder
to extract deep features
. Then, the LFM module takes
and a random coefficient vector
as inputs, producing semantically aligned fused features
. Subsequently,
reconstructs
into images, producing generation results of the network. Furthermore, the authentic image
and the generated image
are further processed through the angle synthesis algorithm utilizing sparse representation, obtaining a synthesized image
of a given angle range. Parallel to this image generation process, there is also training to the image discriminators. The real image
and the synthesized image
are sent into the discriminator
to assess the quality of generation. Subsequently, the angle discriminator
verifies that the angle of the synthesized target sample lies within the specified range.
3.2. Local Fusion Module (LFM)
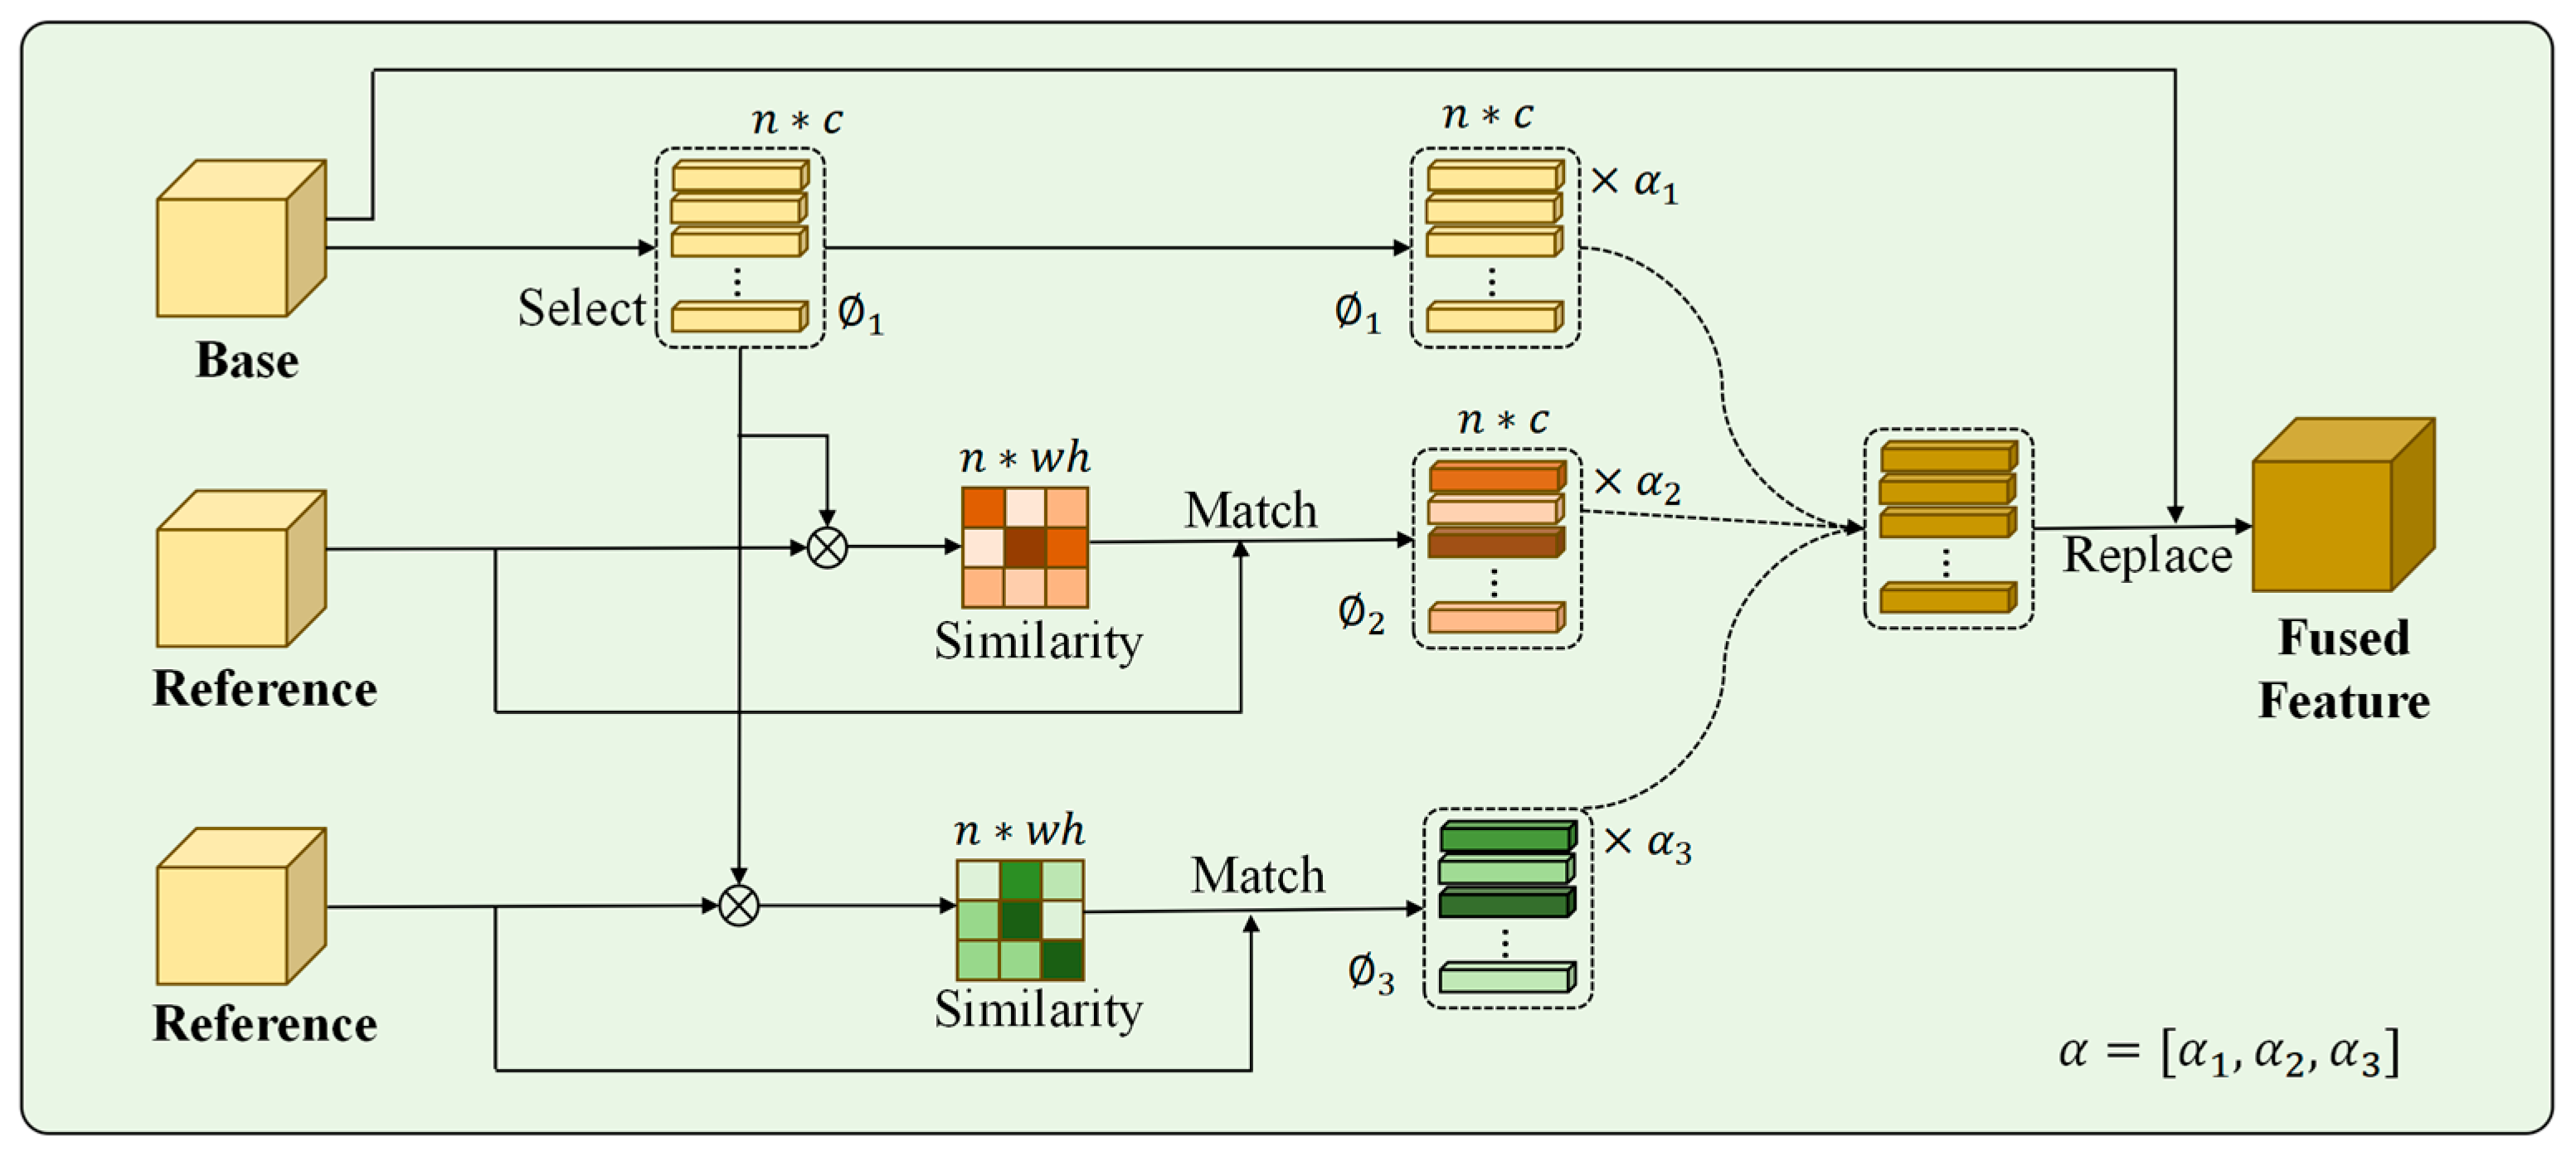
A straight forward fusion approach performs a weighted average of the feature maps without semantic alignment, potentially resulting in numerous artifacts. In contrast, we propose a local fusion module, where one feature map is designated as the base, and the remaining images are utilized as references. Through performing feature selection and semantic matching, the base and reference features are aligned, reducing artifacts and preventing incomprehensible fusion results. Furthermore, the feature replacement operation contributes to increasing the diversity of generated images.
Figure 2 illustrates the detailed setup of the proposed LFM module as depicted in three image generation settings. Given a set of encoded feature maps
, each tensor in
can be regarded as a set of
-dimensional local representations. The idea is to randomly select one of the features in
as the base feature
, while taking the remaining
features as the reference features
. The LFM takes the selected
as the base and the rest of the
as a local feature bank to generate fused features. The entire fusion process can be divided into three stages: local selection, local matching, and local replacement.
3.2.1. Local Selection
Given a selected base feature , the first step is to select which features within should be replaced. At this stage, we randomly select local representations from the local positions in . Random feature selection is employed to increase the diversity of the generation process, which is beneficial for improving the diversity of SAR target sample generation. In particular, multiple local representations are selected, wherein n = η × w × ℎ, where η ∈ (0, 1] represents the proportion of local representations to be integrated. It is noteworthy that when the chosen η approaches 1, an excessive number of features will be replaced, potentially leading to distortion in the generated target image. Conversely, when the value of η approaches 0, it leads to the replacement of very few features, resulting in a loss of diversity. Therefore, the determination of an optimal value for n is worth empirical investigation. In this paper, a value of is used to preserve diversity while maintaining structural integrity. After feature selection, we obtain a set of -dimensional local representations from the base feature , denoted as .
3.2.2. Local Matching
After completing feature selection based on the base feature, we further find content in
that can semantically match with
for replacement. The similarity between each pair of
and
is calculated, constructing a similarity map
:
where
,
is a similarity measurement function implemented with matrix multiplication. The similarity map allows us to find and replace original local representations in
with the most similar ones from
in the next step. The replacement of semantically alignment features can mitigate artifacts arising from the mixture of non-aligned features, which is crucial in the generation of SAR images. Let us denote the set of the top
matching local representations in
as
. Note that we also record the position information for each local representation in
and
, which is further utilized to calculate the local reconstruction loss (see details in
Section 3.5.1).
3.2.3. Local Feature Blending
After local selection and local matching, each base feature
has
replaceable local representations. For instance,
contains the most similar local representations in each
matching the base local representation
(as represented within
Figure 2). All the local representations are then replaced with the matching representations in
. We then blend the matching feature representations with a random coefficient vector
at each spatial location
, calculated as follows:
where
and
. This calculation retains the initial local representation with the ratio of
, while the selection of random
values increase the diversity of image generation. This introduces stochasticity during feature fusion—each spatial location blends base/reference features with unique weights. This controlled randomization diversifies local texture combinations while maintaining global structural integrity, enabling the generation of distinct yet physically plausible SAR targets from identical inputs. Then, we replace all the
fused local representations
back to the corresponding positions in
. The fused feature, denoted as
, is the resulting output of the LFM module.
3.3. Angle Synthesis Algorithm
We further introduce an image generation algorithm based on sparse coding to synthesize the controllable target sample with a specified azimuth angle. Sparse representation leverages the inherent sparsity of SAR scattering structures (e.g., isolated dominant points) to achieve sample-efficient angle synthesis. Unlike optical images, the deterministic scattering patterns in SAR images ensure sparse combinations yield physically meaningful results without causing texture ambiguity. We represent the expected target image through sparse coefficients using other atoms in the dictionary. The procedure can be represented as follows:
This describes a simplified synthetic algorithm [
64], where
is the target angle SAR image
,
is a comprehensive dictionary consisting of real images, generated images and rotated real images (each column vector in
known as atoms),
is a sparsity constant, and
is the sparse representation coefficient.
The process of synthesizing target images can be viewed as calculations based on the synthetic sparse coefficients and the basic images in the dictionary. Therefore, the primary challenge lies in deriving sparse representation coefficients from known images while incorporating angular information. The designed computational model is as follows:
where
represents the SAR target image with a specified angle that is expected. In the following, we provide a detailed explanation on deriving the coefficients
.
With two known angles, the angle measurement method can be defined as follows:
The measurement of angles is employed to inversely determine the coefficients of sparse representation. Based on the known reciprocal of the distances between images, the synthesis coefficients can be calculated. We empirically set to 5, comprising two boundary angle images and three images generated within the specified angle range. By employing two authentic images to delineate the synthesis angle interval and three images to incorporate the necessary internal features, the target angle image is synthesized utilizing these five images.
The required sparse representation coefficients
are derived through the following calculation:
Utilizing the introduced sparse model, we can obtain images from different perspectives. It is worth noting that the completeness of the dictionary in the sparse representation is crucial for the final generation quality. Therefore, we aim to enhance the completeness of the dictionary by generating high-quality pseudo-images using the generator . During training, the angle synthesis algorithm is frozen to prevent interference with adversarial optimization. The optimization of parameters is conducted on only the generator and discriminator. In the testing phase, it is activated to construct a hybrid dictionary from both real images and generator-produced samples, allowing controllable angle extrapolation through sparse representation.
3.4. Angle Discriminator
An angle discriminator is further introduced to regularize the synthesis of angle-controllable samples. As illustrated in
Figure 3, it consists of two branches: the upper branch predicts the target angle, whereas the lower branch accesses the actual angle value. The angle prediction branch is constructed utilizing convolutional layers and fully connected layers, whereas the true angle branch obtains the actual angle of the target utilizing the corresponding image labels. Finally, we employ a comprehensive loss function combining cosine similarity, periodic angle, and MSE losses (see details in
Section 3.5), to optimize the angle prediction.
In the training phase, the angle prediction module exploits features in real images to estimate the angles, and continuously refines the generator to reduce discrepancies between the predicted and the actual angles. Simultaneously, the angle predictor learns to encode and map the target azimuth angle. Differently, during the testing phase, the angle predictor guides the angle synthesis algorithm to generate SAR target images constrained within a specified angle range.
3.5. Loss Functions
3.5.1. Local Reconstruction Loss
In typical fusion-based approaches for few-shot generation, a weighted reconstruction loss at the image level is employed to impose constraints on the generated images. For example, given a set of input images
(with the same azimuth angle) and a random coefficient vector
, the generated image
can be learned with the following objective:
where
. Within this optimizing objective, as the value of
increases, the generated image approximates the authentic image. Their features exhibit increased similarity, as this objective minimizes the distance between the generated image and the weighted addition of authentic images. Features that have not been semantically aligned during the generation phase may result in aliasing artifacts, which are particularly notable in SAR images. An in-depth analysis of this issue is presented in
Section 4, with experimental evidence.
To address this problem, we introduce a local reconstruction loss function. We first record the matching relationship between each selected base feature
and the reference feature
, then map the selected feature back to the same position in the original image to obtain a coarsely fused image
. Subsequently, we regularize the generated image
with a local constraint:
The advantage of this approach is that it captures the spatial information in both reference and base features through weighted fusion, facilitating the generation of images with rich semantics and a reasonable spatial layout. This local fusion strategy, along with the local reconstructive loss, can significantly reduce the artifacts and greatly improve the quality of generated SAR images.
Furthermore, to precisely capture the structural characteristics of the images, a multi-scale structural similarity loss (MSSIM-loss) is introduced along with an L1 mixed loss function:
Combining these two objectives, the comprehensive reconstruction loss is as follows:
3.5.2. Adversarial Losses
In the proposed framework, multiple adversarial losses are adopted to increase the authentic and semantic structure of the generated images. The primary adversarial training objective is adopted using the loss in hinge GAN [
18] to impose constraints on the generator to produce realistic images that are indistinguishable by the discriminator:
3.5.3. Label and Angle Loss Functions
To increase the discriminability of generated images, we further introduce a classification loss derived from ACGAN [
18], where an auxiliary classifier is employed to categorize the input images into their respective classes. Specifically, the discriminator is responsible for accurately categorizing both authentic and synthetic images, whereas the generator is required to produce images that are classified into the same class as the authentic images, denoted as follows:
We further impose an angular constraint to regularize the angle characteristics. This angle loss consists of two components: the cosine similarity loss and the periodic angle loss. The cosine similarity loss ensures directional alignment between predicted and true angles, while the periodic angle loss accounts for the circular nature of azimuth measurements.
First, the cosine similarity loss aims to maximize the cosine similarity between the predicted angle and the true angle. Cosine similarity measures the angle between two vectors, where a value closer to 1 indicates that the angles are more similar.
where
is the predicted angle and
is the reference angle. This cosine similarity loss facilitates the convergence of the predicted angle towards the true angle, thereby enhancing the prediction accuracy.
Meanwhile, the periodic angle loss minimizes the angular error, ensuring that deviations remain within
. Since angle values are periodic, the angle difference is restricted within
to avoid computational errors caused by angle warping. The calculation is formulated as follows:
where
is the predicted angle,
is the true angle, the term
ensures the difference value stays within
, and remainder is the calculation for the remainder.
This dual formulation avoids large errors near 0°/360° boundaries and improves angular fidelity. Combining them, the total loss function for the angle discriminator is as follows:
Their combination enables the learning of both global orientation coherence and local cyclic constraints, which is critical for generating physically plausible SAR targets. Integrating these training losses, the entire GAN framework undergoes end-to-end optimization through the application of the following training objective:
3.6. Implementation Details
The proposed algorithm is implemented using PyTorch 2.0 and trained on a computational server equipped with an NVIDIA A4090 GPU (NVIDIA Corporation, Santa Clara, CA, USA). We conducted experiments using two types of ground vehicle datasets (see details in
Section 4). The images are classified into
categories based on vehicle types, while their labels consist of the azimuth angles and the categories. The model employs explicit category control through label conditioning. During training, we use the first k − 1 categories with their class labels to optimize the class-specific feature learning. In the testing phase, the generator synthesizes images for the held-out k-th category by directly specifying its label. This learning mechanism ensures controllable generation while verifying label consistency. In both datasets, 72 image samples are utilized as the foundation for image generation (k = 72). Notably, the model requires about 12,700 MB of GPU memory for training and 17,400 MB for testing.
To balance between training time and performance, the weighting parameters for the loss functions are set as
= 0.1,
l = 0.5,
= 0.5,
= 0.1, following the literature practice in [
65]. We empirically set
K = 4 in Equation (4) to ensure deterministic angle interpolation (the selection of the value is validated in
Section 4.3). Training runs were conducted for 10,000 iterations with a learning rate of 0.0001 for the generator, similarity discriminator, and angle discriminator.
4. Experimental Analysis and Discussions
In this section, we conduct a comprehensive experimental evaluation of the proposed algorithm, providing both a quantitative and qualitative analysis of its generation performance, as well as discussing the advantages and limitations. Through the integration of multiple parameters and validation of enhancements in recognition algorithms, we conduct a comprehensive examination of the generation capability, and examine its generalization across different datasets.
4.1. Dataset Introduction
In the experimental section, two datasets are employed: the Moving and Stationary Target Acquisition and Recognition (MSTAR) dataset and a self-constructed SAR target image dataset. The MSTAR dataset is one of the most widely used benchmarks in the field of SAR target recognition.
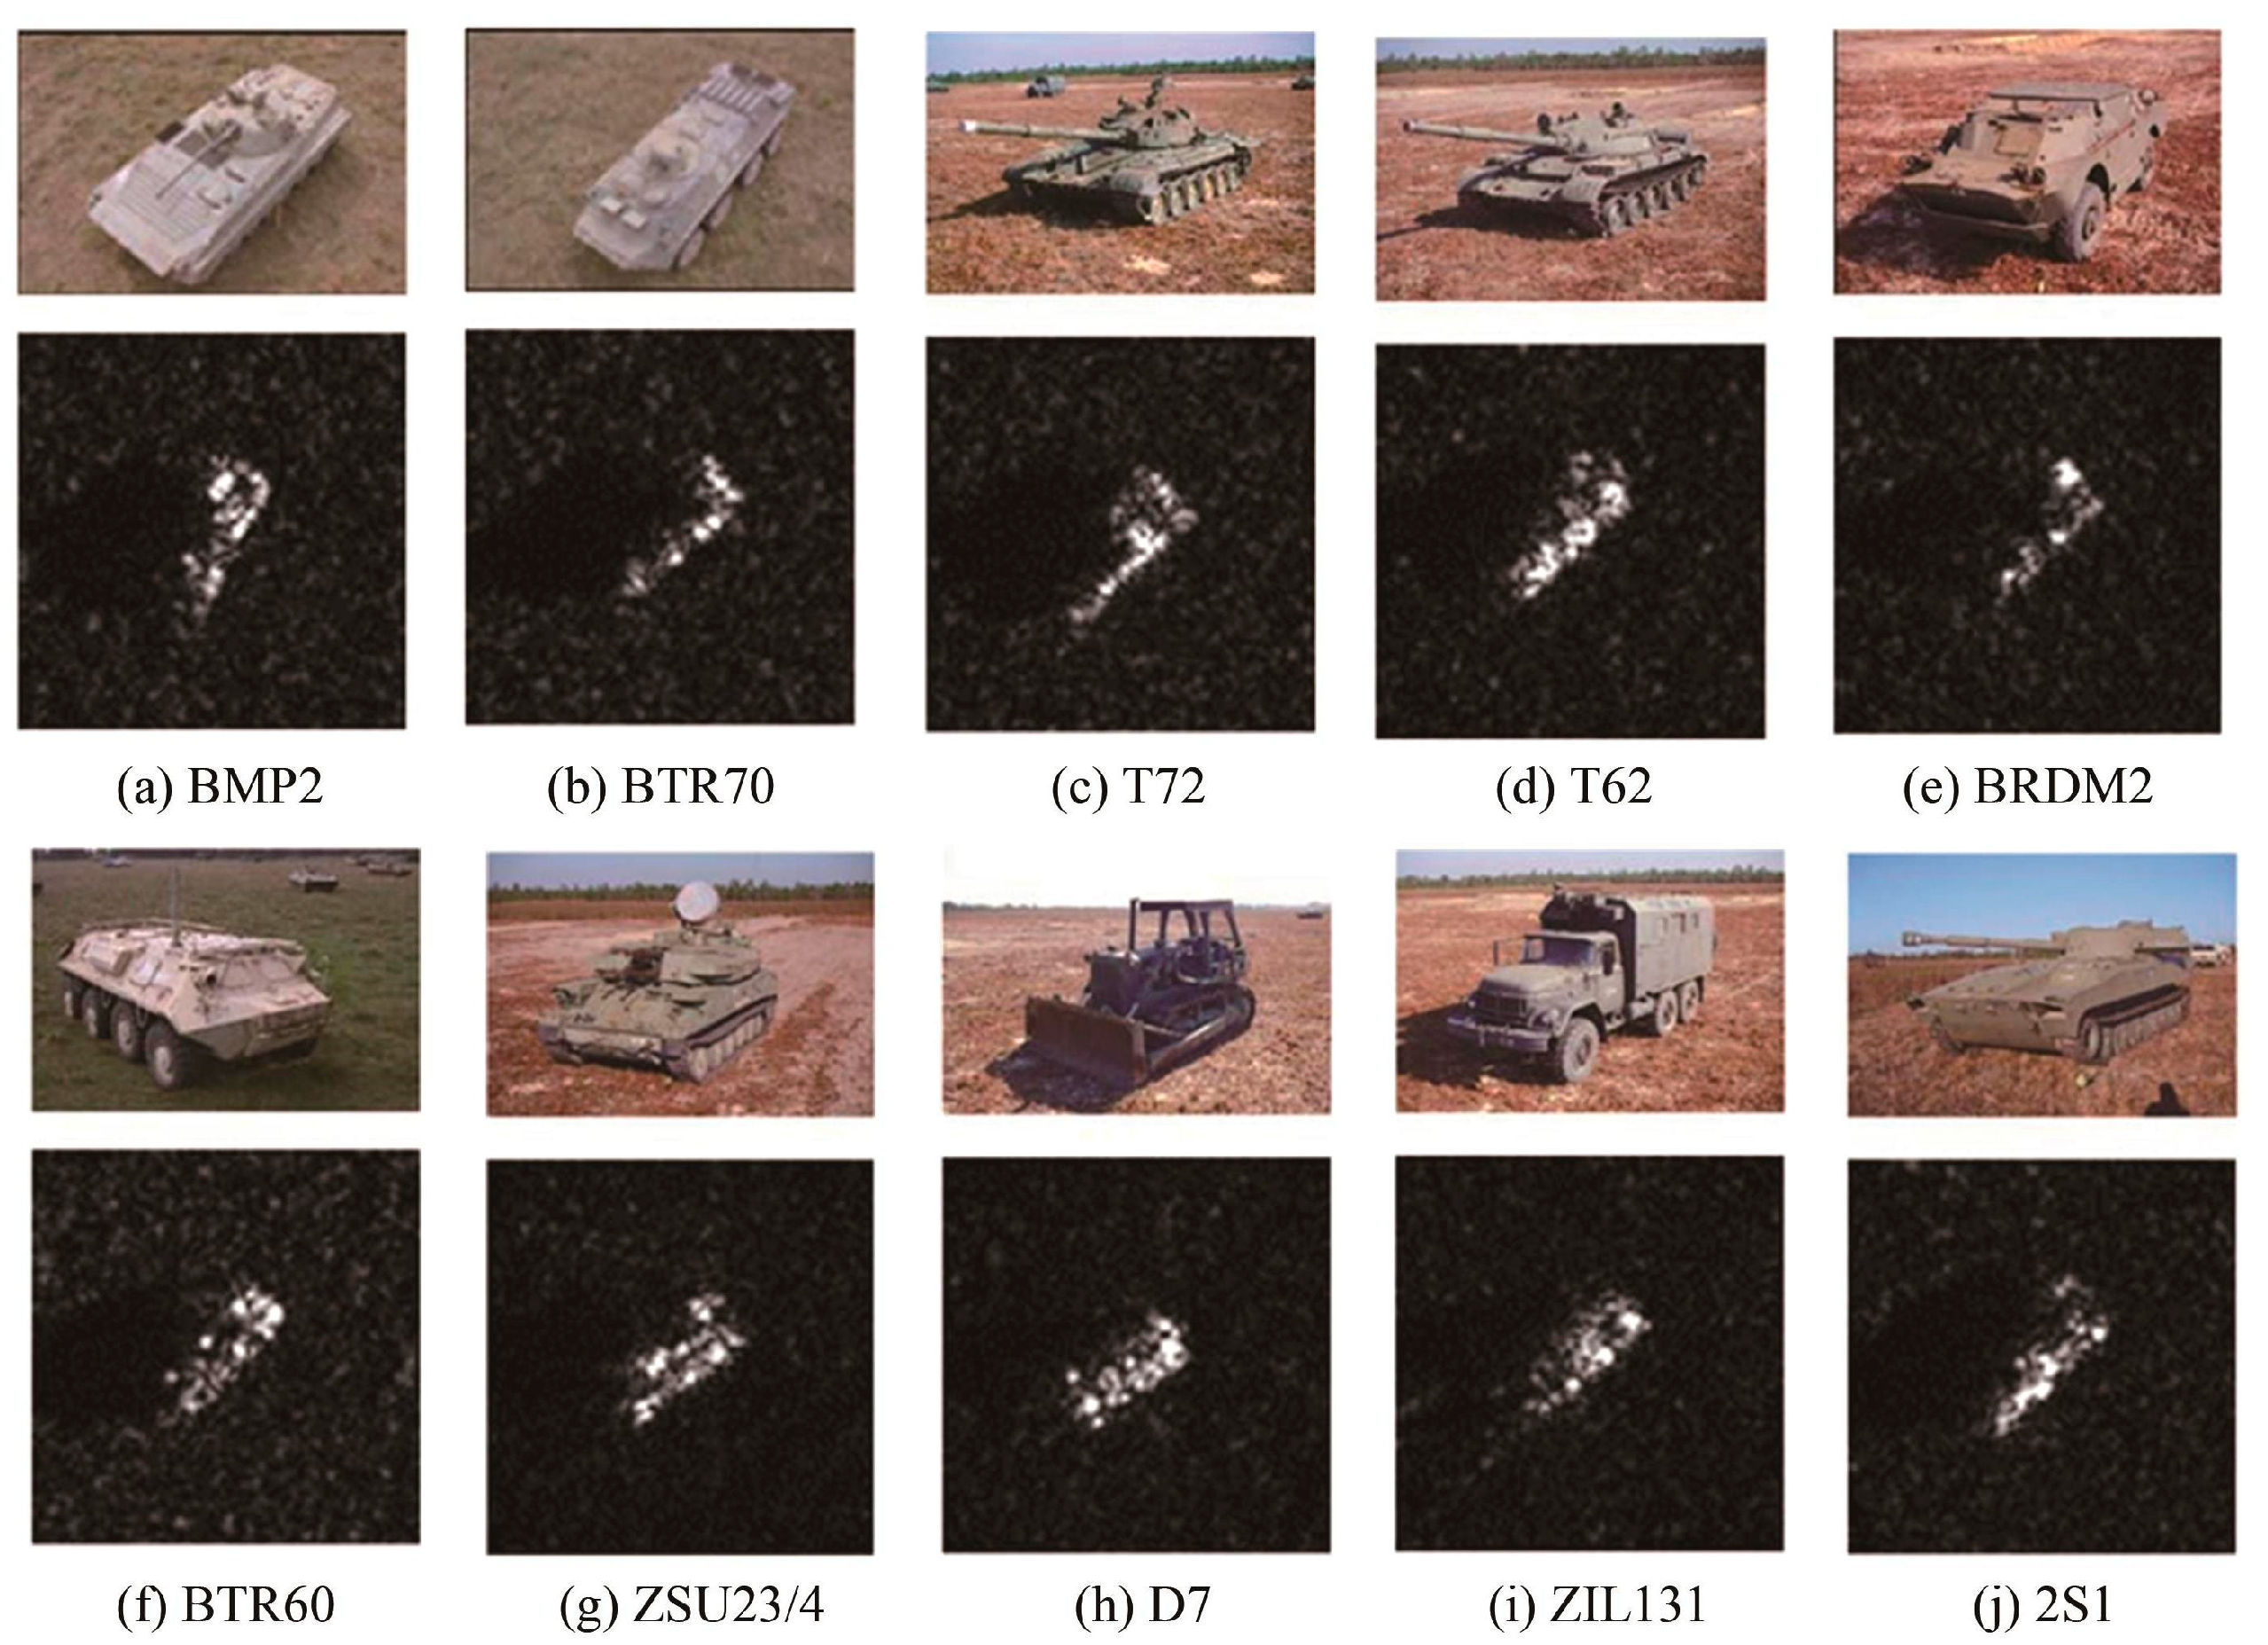
MSTAR: The MSTAR dataset was collected and released by Sandia National Laboratories in the United States in the 1990s. This dataset is primarily used for research in target recognition and classification of SAR targets. It includes images of ten types of vehicles, including 2S1, BRDM2, BTR60, BTR70, BMP2, D7, T62, T72, ZIL131, and ZSU234. The MSTAR dataset comprises 21,600 images, each with a resolution of 128x128 pixels. It contains targets captured at angular intervals ranging from 1° to 2°. We employed its subsets with 1° azimuth sampling to benchmark angular resolution limits. This selection intentionally tests fine-grained angle synthesis under maximal angular density disparity. Some examples of the targets are shown in
Figure 4.
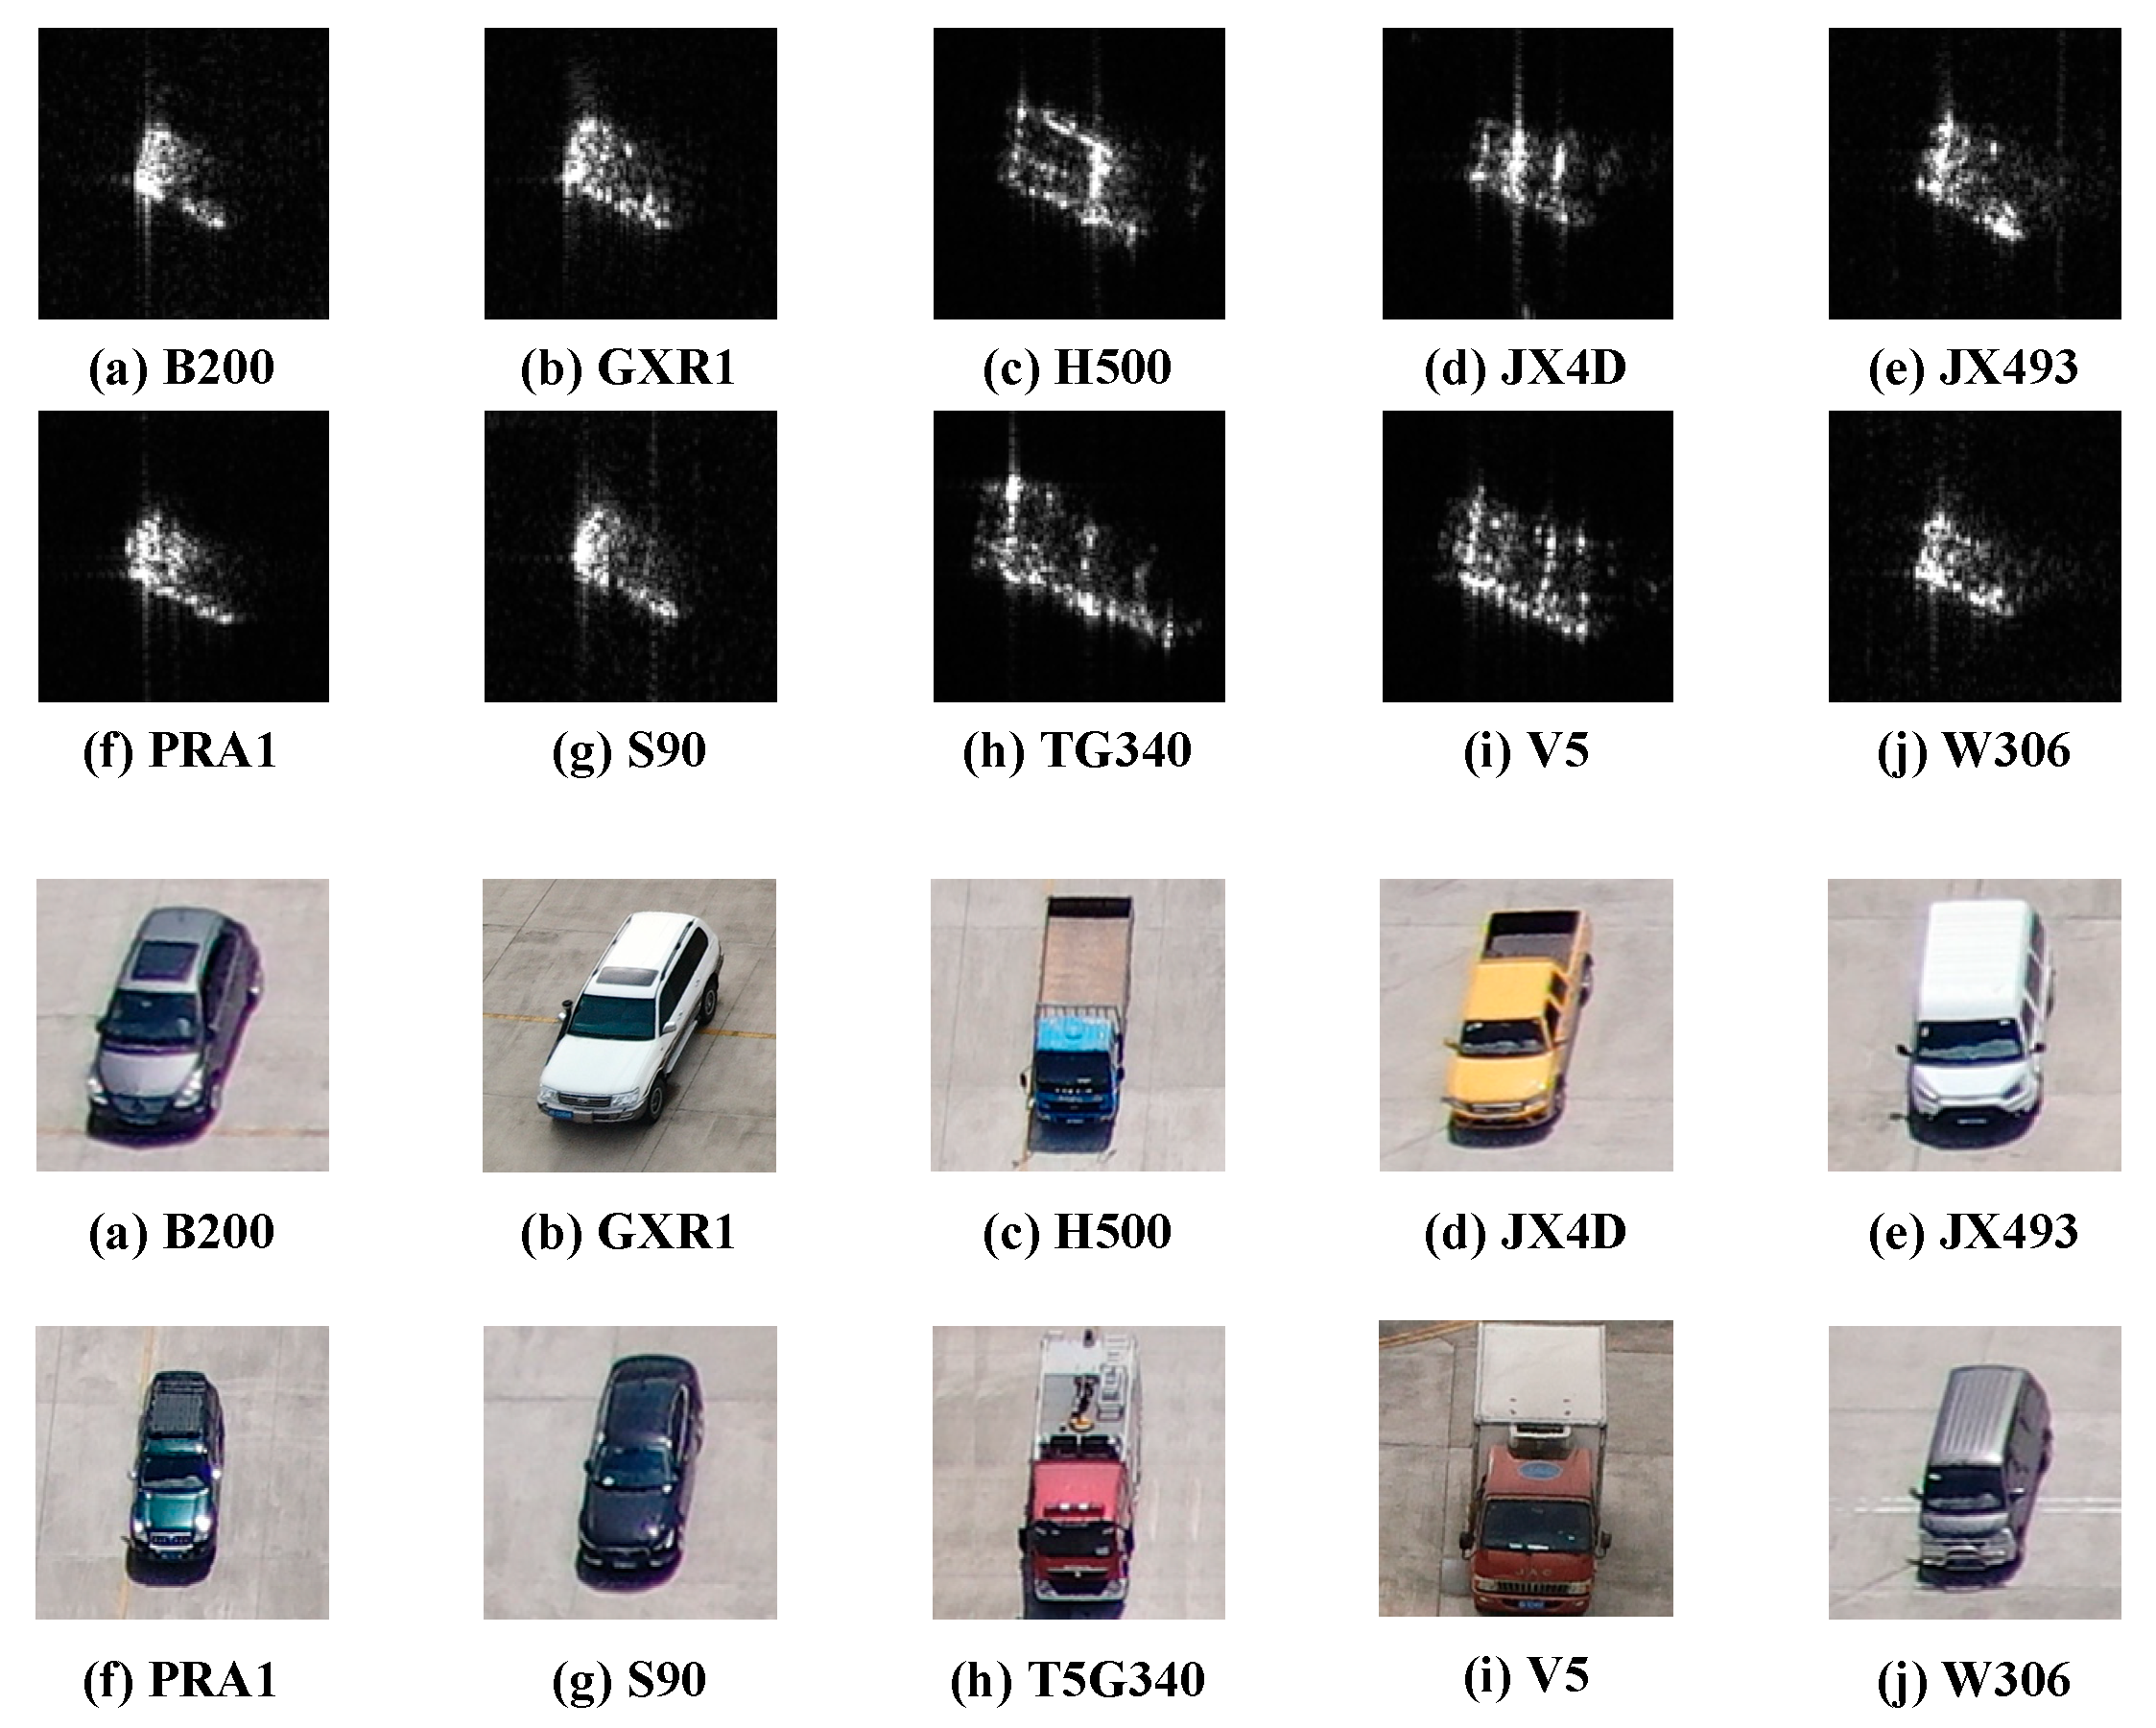
CV-SARID: We have constructed a dataset containing 10 types of SAR vehicle targets, named the Civilian Vehicle SAR Image Dataset (CV-SARID). As shown in
Figure 5, targets in the CV-SARID include Mercedes-Benz sedans (B200), Toyota off-road vehicles (GXR1), trucks (H500), pickup trucks (JX4D), transit vans (JX493), Land Cruiser off-road vehicles (PRA1), Volvo sedans (S90), fire trucks (T5G340), bulky trucks (V5), and vans (W306), differentiated by size and scattering characteristics. The multi-aspect data are collected with pitch angles of 25°, 30°, and 45°, and azimuth angles from 0° to 360° at 5° intervals. Each category comprises 72 images captured at pitch angles of 25° and 30°, while 70 images are captured at a pitch angle of 45°, amounting to a total of 2120 images. The dataset will be made public later.
4.2. Evaluation Metrics
In this section, we briefly introduce the evaluation metrics adopted to assess the generative quality. We use Fréchet Inception Distance (FID), Structural Similarity Index Measure (SSIM), and signal-to-noise ratio (SNR) to quantitatively evaluate the quality of images with angular shifts.
4.2.1. Fréchet Inception Distance (FID)
FID is a commonly used metric to evaluate the difference between distributions of the generated data and the authentic data. FID measures the quality of generated images by calculating the distribution difference in the feature space (projected using a pre-trained Inception V3 model), and then compares their mean and covariance matrices to compute the Fréchet distance. A lower FID value shows generated images are more similar to real data.
4.2.2. Structural Similarity Index Measure (SSIM)
The SSIM evaluates image quality by comparing luminance, contrast, and structure to determine visual similarity, reflecting human visual perception. Thus, the SSIM is commonly applied in image processing and quality assessment for tasks like image denoising, super-resolution, and compression to assess reconstructed and original image similarity. The SSIM effectively evaluates differences between generated and real SAR target images, making it essential for assessing structural integrity in the SAR image generation task.
4.2.3. Signal-to-Noise Ratio (SNR)
In SAR images, the SNR is a crucial quality metric representing the ratio of the signal strength to noise level in the image. A high SNR indicates that the signal component is strong while the noise component is weak, resulting in clearer images with richer details. This is crucial for target detection and recognition in SAR images, as noise can blur target features and cause inaccurate analysis. Consequently, achieving an SNR for generated images that closely approximates that of real images serves as an important indicator.
4.3. Ablation Study
To evaluate the impact of each module in the proposed framework, ablation experiments are conducted to examine the LFM, AZS, and angle discriminator.
Table 1 presents the computational costs of generating a 128 × 128 resolution image, obtained by gradually adding different comments to the vanilla generator. The quantitative results demonstrate progressive increases in the parameter count, training time, and GPU memory consumption as additional components are incorporated into the baseline architecture. The LFM contributes the most significant computational overhead due to its feature alignment and semantic matching operations. The AZS module introduces moderate parameter growth while enabling angle-controllable synthesis through sparse representation, requiring no additional training time. The angle discriminator further adds 1.05 million parameters for angle verification. It is worth noting that the inference requires only about 20 s per image generation, demonstrating operational feasibility despite the upfront training costs.
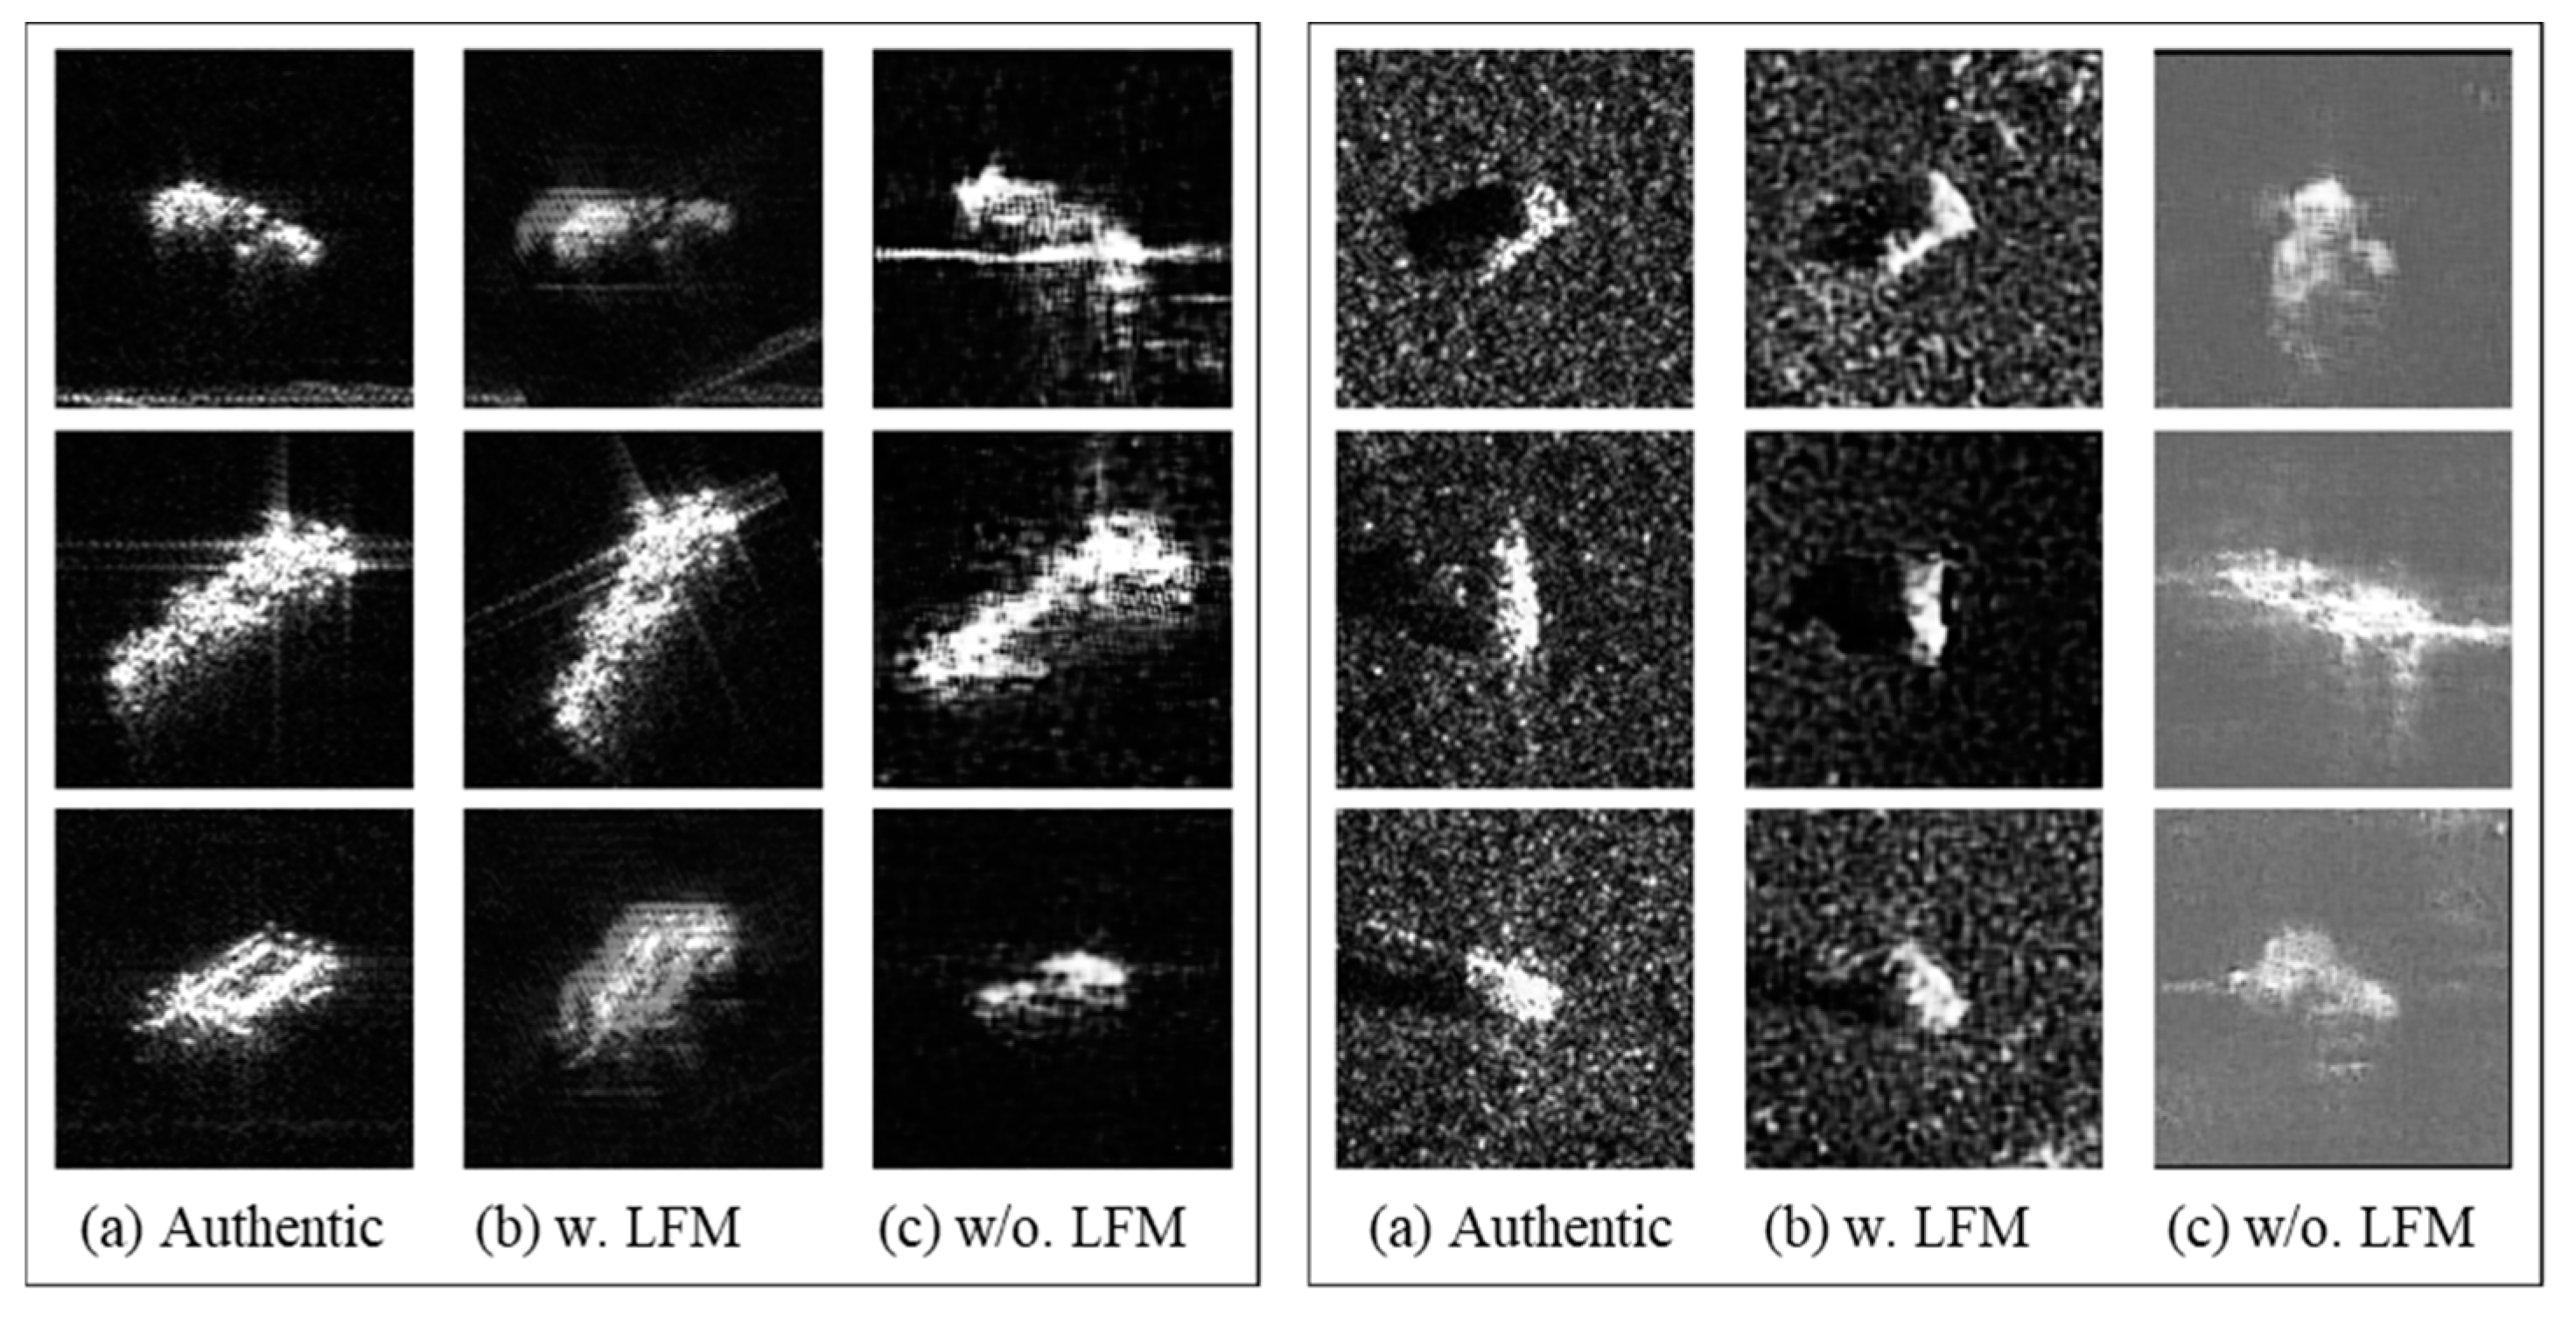
We further present the generative results before and after using the LFM in
Figure 6. The visual results demonstrate that incorporating the LFM significantly enhances the generative quality. The LFM, through its semantic alignment and feature blending, effectively reduces artifacts and improves structural integrity compared to conventional fusion methods. In summary, although employing the LFM increases the computational costs, it substantially improves generation quality by reducing artifacts.
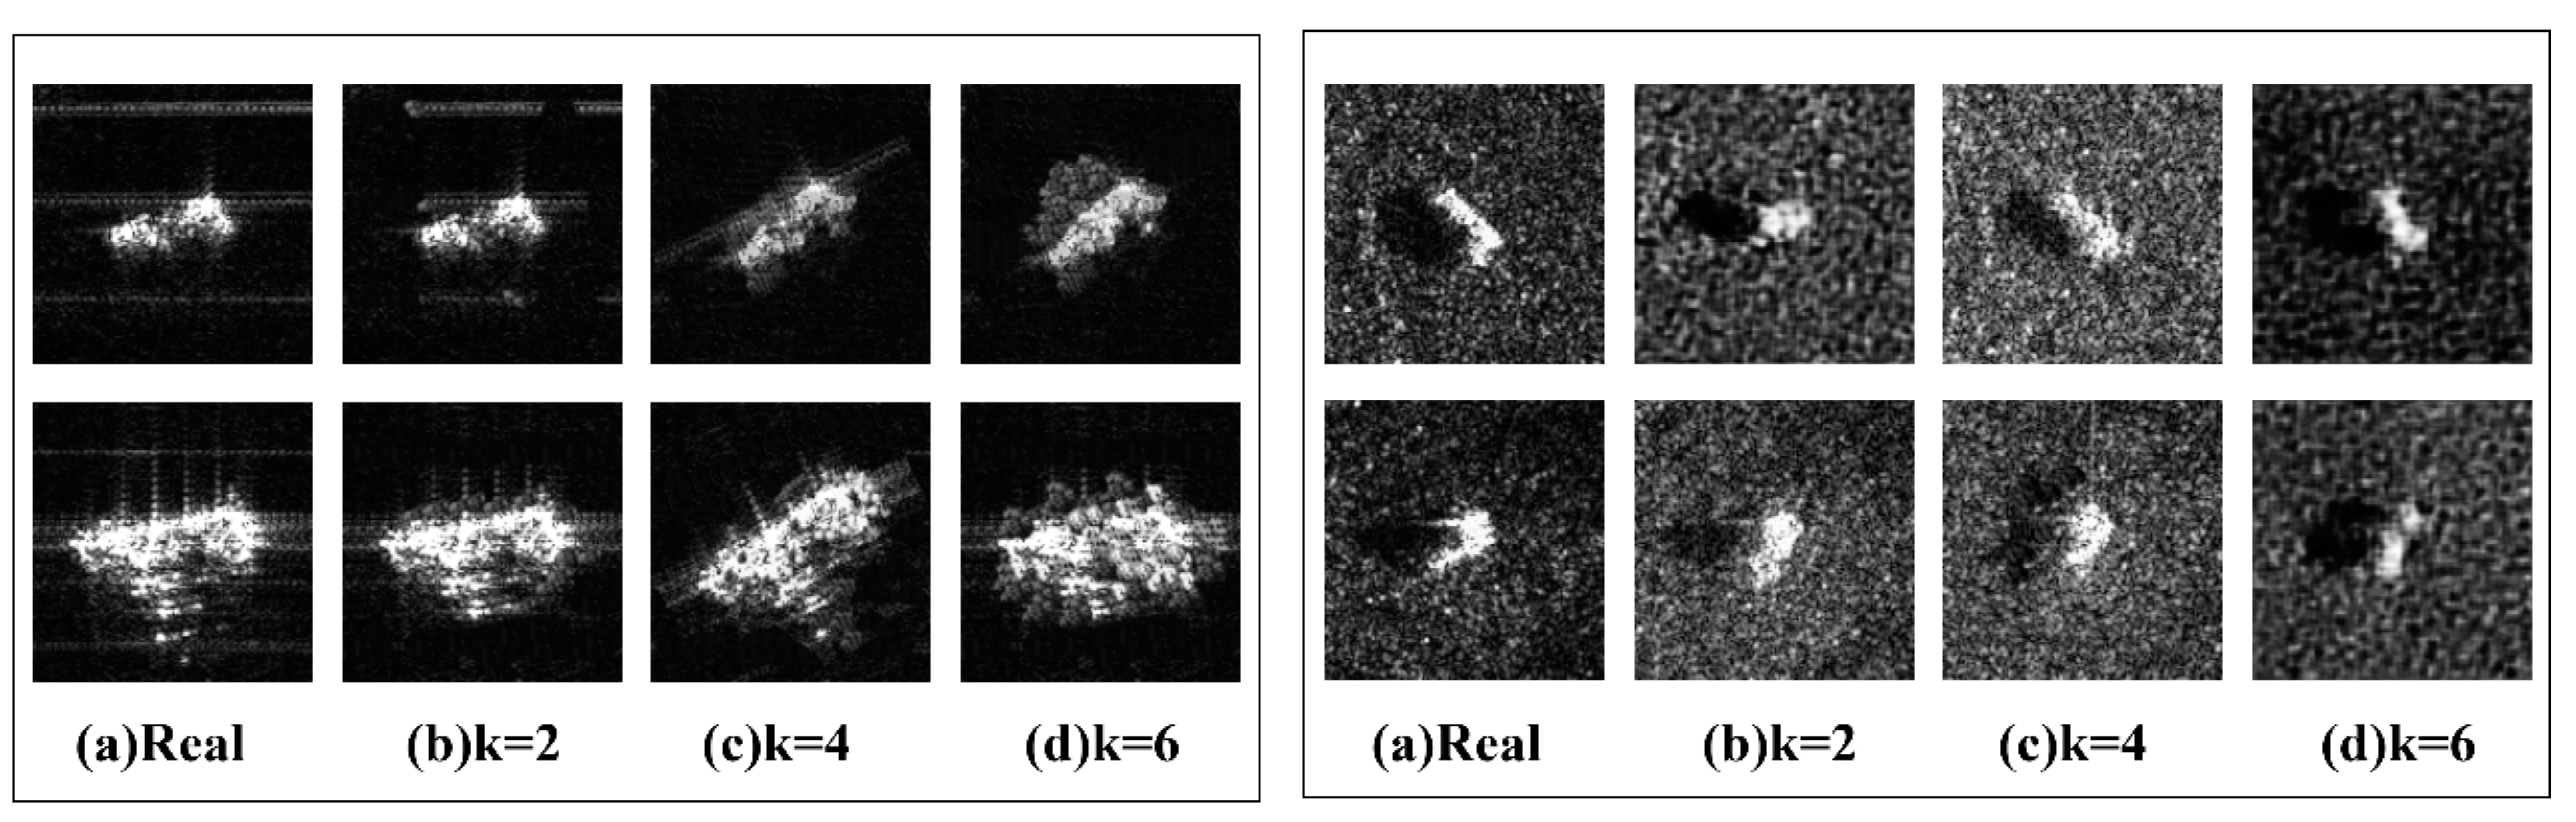
Additionally, the sparsity parameter
K in Equation (4) controls the number of dictionary atoms (real/synthetic images) used for angle synthesis.
Figure 7 presents the generative results obtained using different
K values. Empirical tests on both datasets confirm
K = 4 optimally balances artifact suppression and generation diversity. A lower K value,
K = 2, results in minimal variation compared to the original image, whereas increasing the parameter to K = 6 introduces significant noise and artifacts.
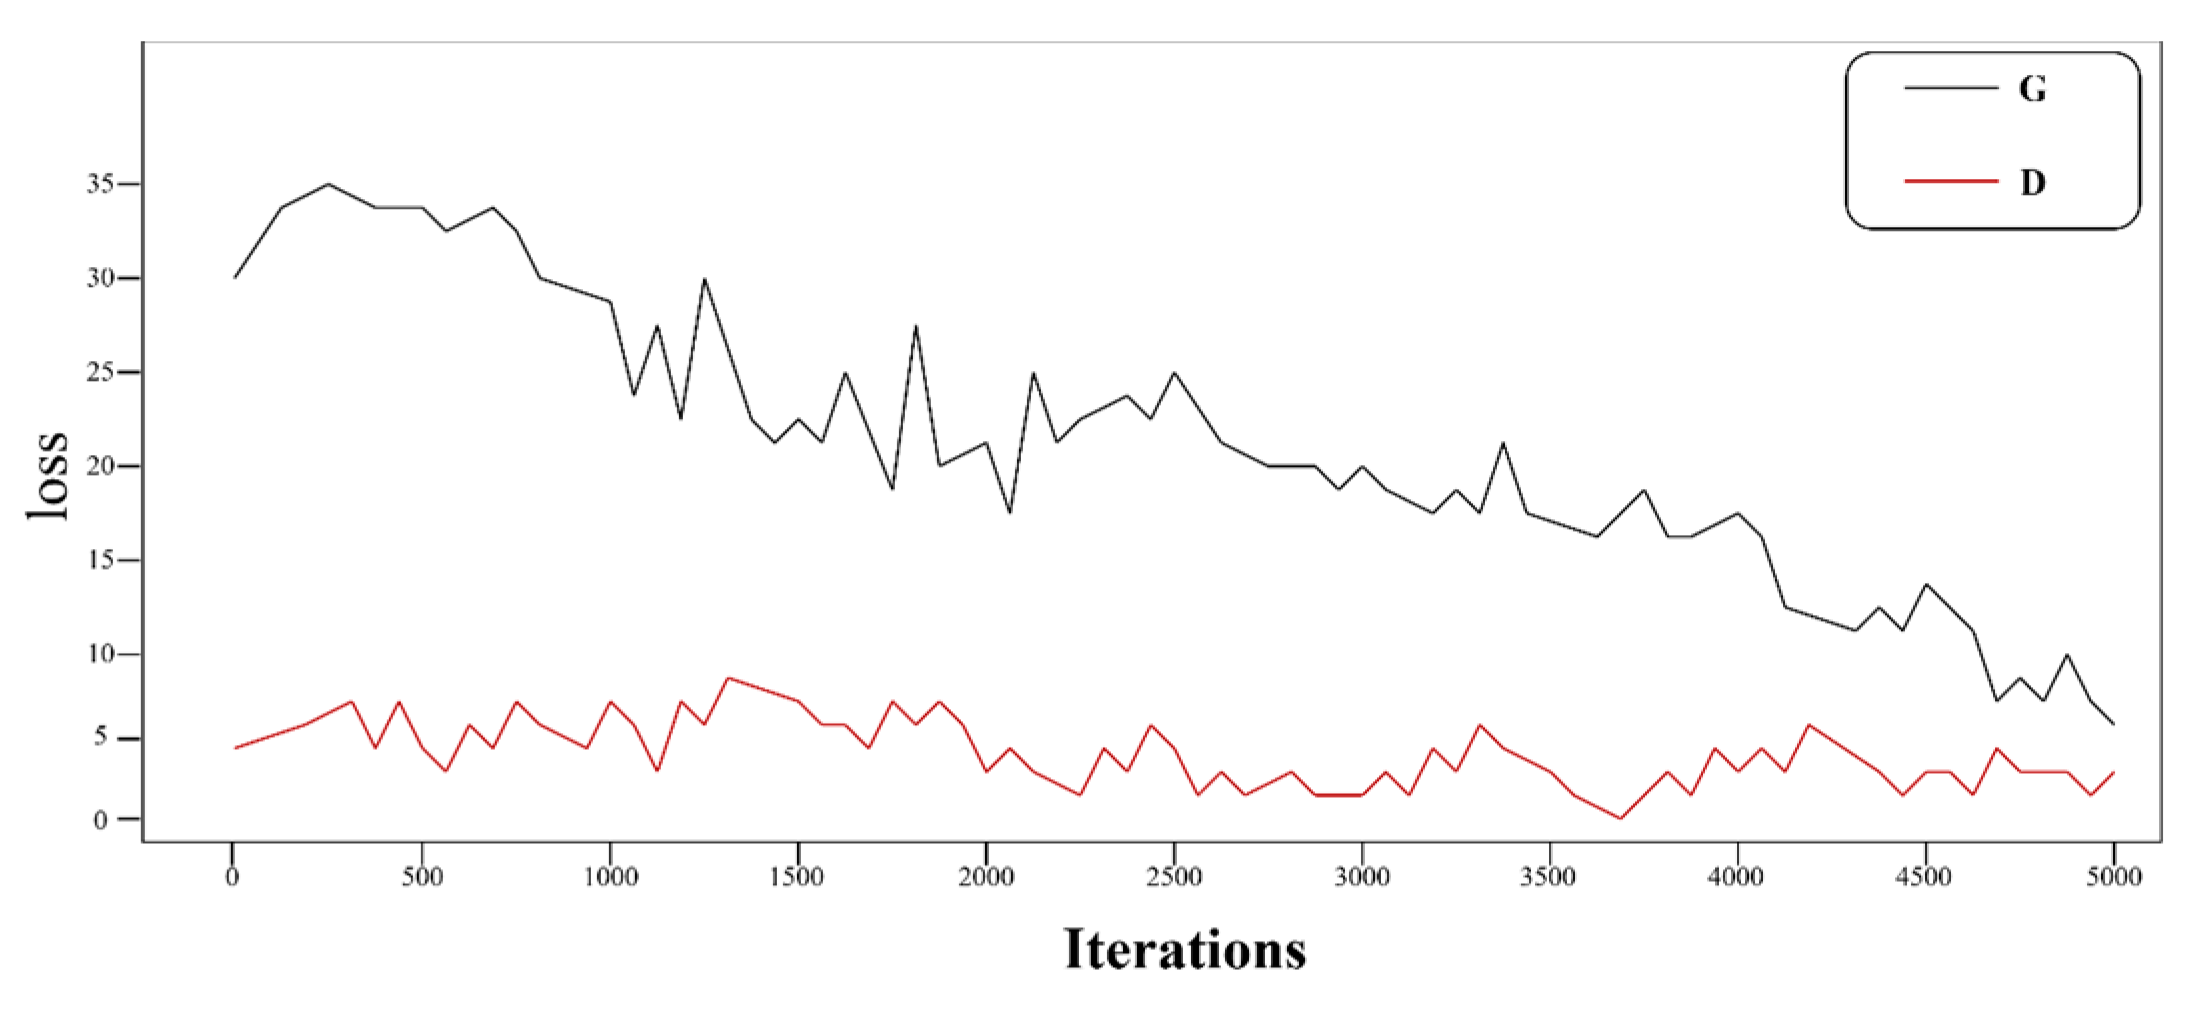
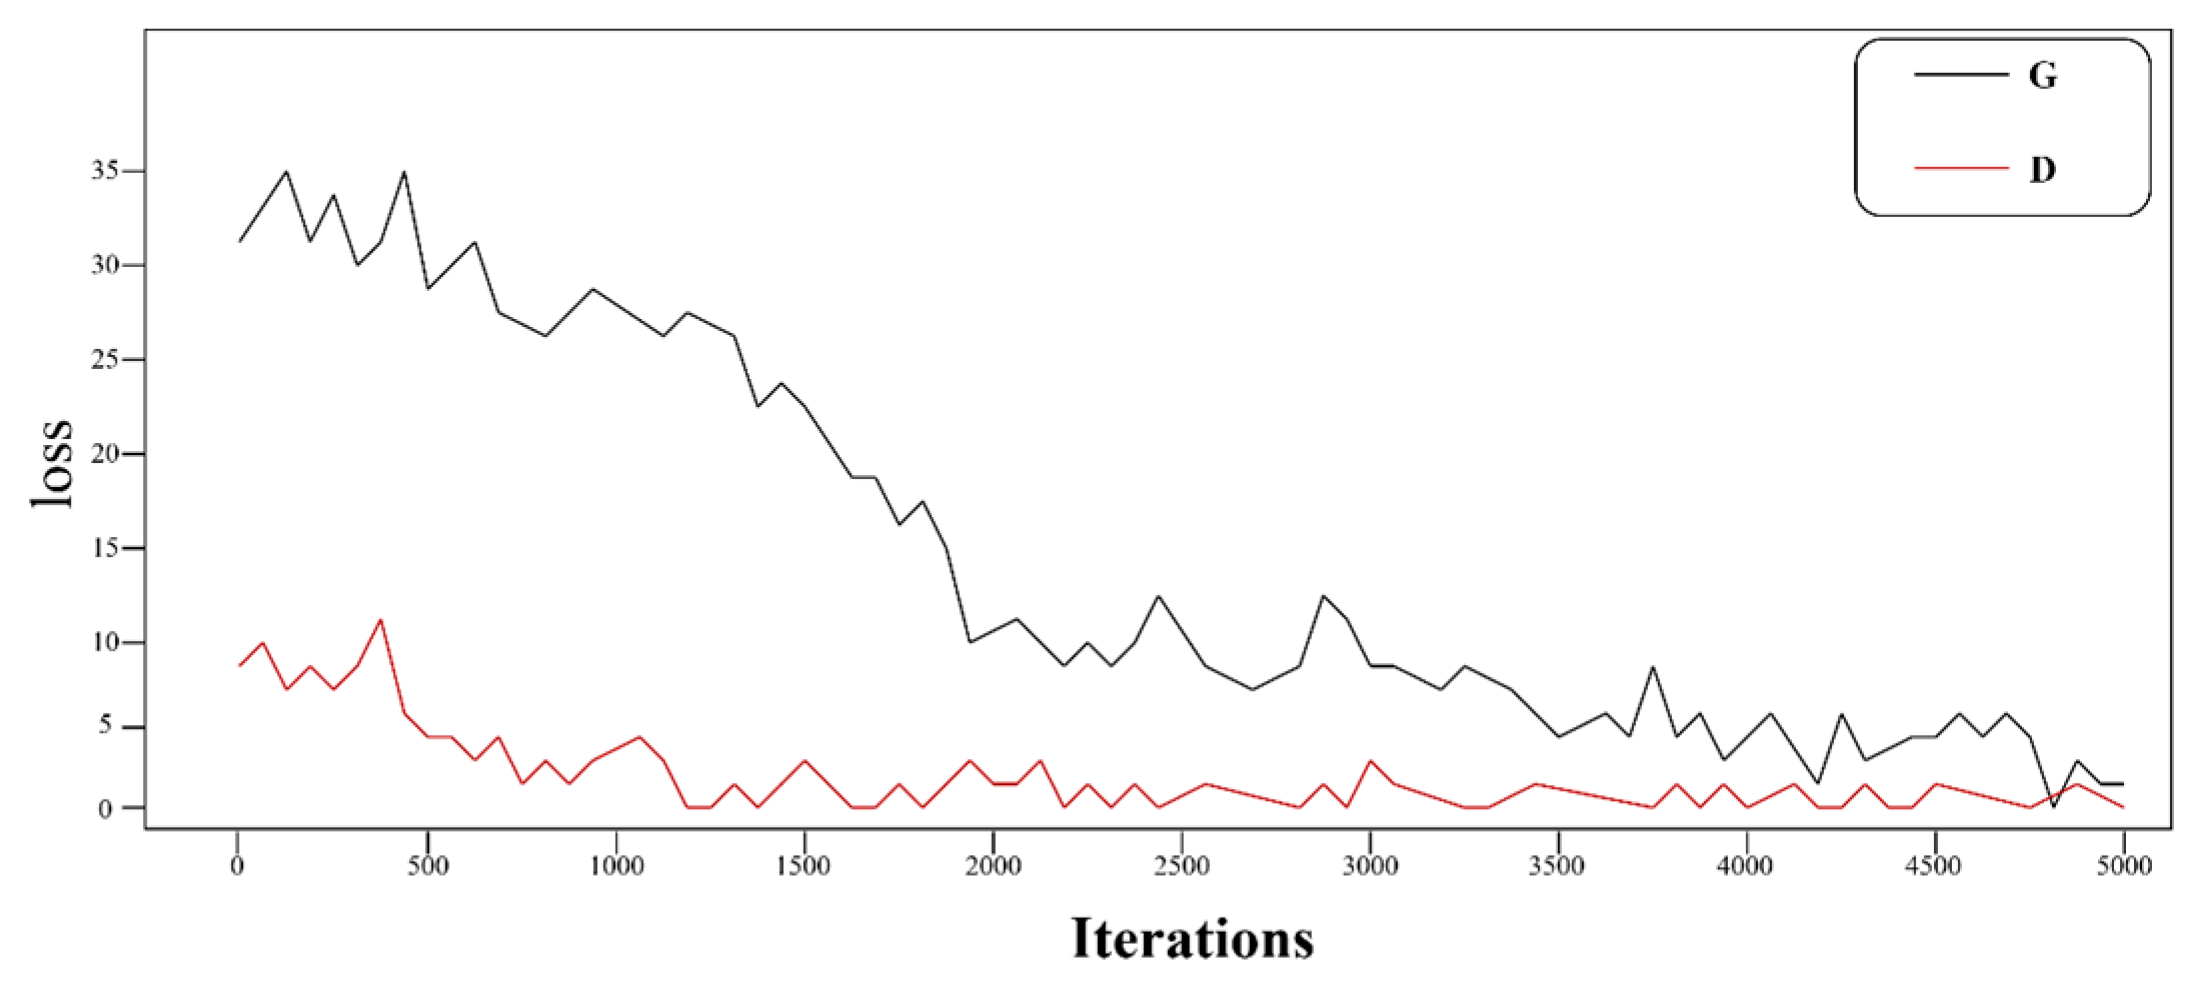
Figure 8 and
Figure 9 further compare training dynamics with/without employing the key components. The complete model (
Figure 8) shows accelerated convergence and stable loss plateaus, confirming that (1) the local feature replacement (
Section 3.2.3) in the LFM mitigates mode collapse through semantic alignment; (2) structural losses (MSSIM + L1) maintain target geometry integrity during adversarial optimization. In the subsequent loss function curve experiments, the stable co-convergence of generator/discriminator losses and minimal oscillation can also be observed, which further demonstrates the resistance to overfitting—a critical advantage in the few-shot training regime.
4.4. Qualitative Evaluation of the Generative Results
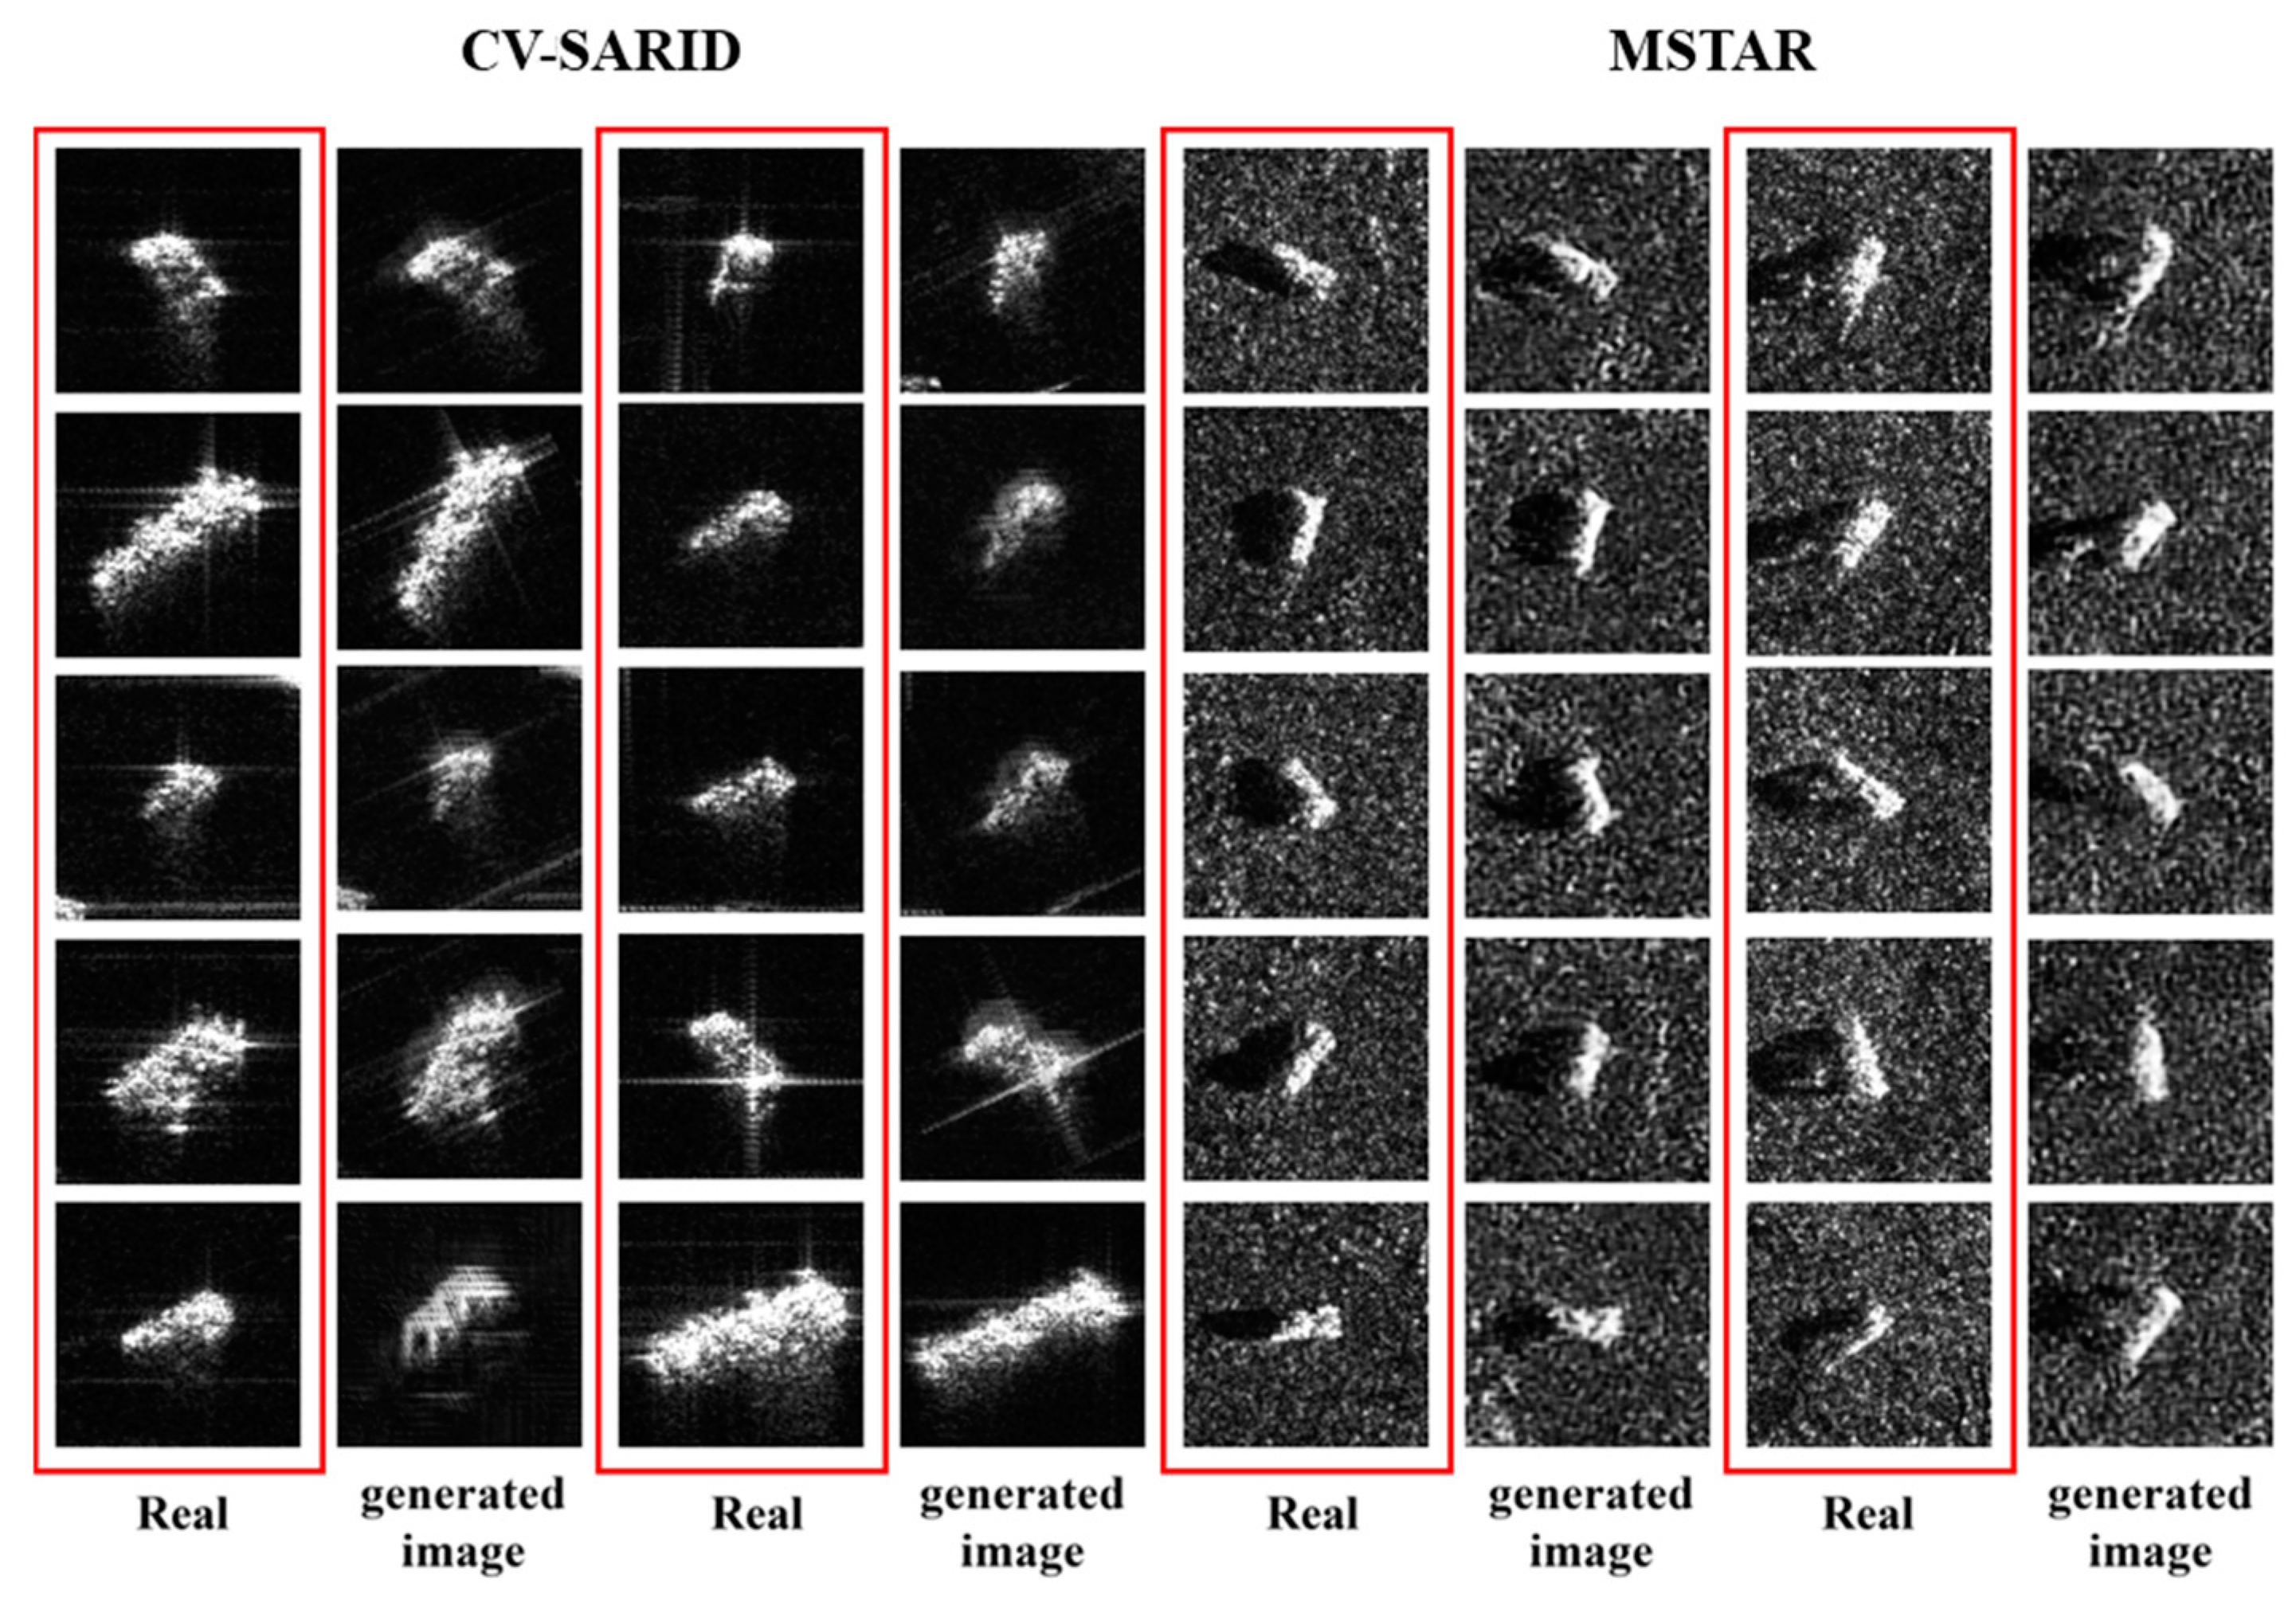
Figure 10 presents the generative results on the two datasets. To ensure the validity of the experiments, all model parameters were kept consistent throughout both the training and generation processes. The quantity of image data for both training and testing phases is consistent, with the primary difference lying in the interval of target angles across the two datasets.
Table 2 further evaluates the quantitative results of the generated images. One can observe that our methods achieve high performance in both datasets, while the metrics obtained on the MSTAR dataset are overall higher than those obtained on the CV-SARID. In the CV-SARID, the proposed method effectively learns the complete scattering information while preserving the overall structural integrity of vehicles, achieving a certain degree of angular shift. In the MSTAR, the generative results exhibit fewer artifacts and clearer scattering points, as demonstrated by a lower FID and high SNR. It also exhibits higher structural fidelity (e.g., clearer vehicle contours), as demonstrated by the higher SSIM.
This phenomenon is attributed to the increased density of angular variations in MSTAR, which, given an equivalent volume of data, facilitates the learning of a more coherent relationship between angles and images. Consequently, a more accurate angle discriminator is trained.
Table 2 shows that our model performs well on both datasets, with the MSTAR results showing superiority in structural similarity and peak SNR. A detailed analysis on the angular shift is discussed in
Section 4.4.
4.5. Generation of Multi-Angle Target Images
Figure 11 presents several examples of the synthetic images with different angles. The angle synthesis algorithm effectively generates high-quality SAR target images within a specified angle range. In
Figure 11a, the proposed approach maintains a stable image quality and a good angle range even for vehicles with varied surface structures. However, there also exists evident artifacts in the generated images. This phenomenon is attributable to the increased target angles in the CV-SARID dataset, which induce more substantial alterations in the structural features and scattering points of the targets as the angle varies. Consequently, more errors occur, complicating the capture of common features during angle synthesis.
In the results on MSTAR in
Figure 11b, the generative quality is more stable. The generated images exhibit not only enhanced structural completeness but also more precise azimuth angles. This can be attributed to the increased discrimination capability of the learned angle discriminator, as well as the optimized training of the generative method with more coherent angle information.
Moreover, as shown in
Figure 12, the MSDA module improves feature resolution in generated results. The first row in
Figure 12 exhibits that objects are more distributed and detailed (e.g., flight trajectories), achieving better consistency with authentic images. Additionally, the MSDA module partially mitigates the presence of artifacts. In the second row in
Figure 12, one can observe that the MSDA module facilitates the learning of more complete scattering features.
4.6. Comparative Experiments
We further compare the proposed method with several state-of-the-art (SOTA) methods, including FIGR, F2GAN, and MatchingGAN. The evaluation is conducted comprehensively from three dimensions: generative qualitative, quantitative results, and visual evaluation. To test the generalization capability across different image scales, experiments are conducted on both two datasets.
4.6.1. Qualitative Evaluation
Figure 12 and
Figure 13 present the target images generated by different methods on the two datasets.
Figure 12 presents the generated samples in the CV-SARID dataset. It is evident that the proposed method enhances the preservation of vehicle structural information and generates fewer artifacts in comparison to other approaches. Furthermore, it effectively captures the scattering characteristics of SAR targets.
Figure 13 presents samples generated in the MSTAR dataset. The proposed method also yields improved results by providing clearer distinctions between background and targets and learning more reasonable overall boundary features and appropriate shadow details.
Among the compared models, FIGR is an optimization-based few-shot generation method, which exhibits suboptimal performance across both datasets. This is due to the inherent limitations in optimization algorithms and the special characteristics of SAR images. F2GAN and MatchingGAN are both fusion-based few-shot generation models, but they generate many artifacts or fail to capture comprehensive target feature details. The implementation of the semantic feature alignment in the proposed method substantially diminishes artifacts and improves the structural and background details, leading to significant advantages compared to the compared literature methods.
4.6.2. Quantitative Evaluation
Table 3 and
Table 4 present the quantitative comparison with the SOTA methods, where the proposed approach shows a clear advantage in various metrics. Its performance on the FID metric demonstrates a better data distribution, indicating that the difference between the synthetic data and the authentic data is marginal. It also obtains the highest SSIM, indicating that the produced SAR images possess more comprehensive target structures. Additionally, its highest SNR indicates that the generated images are closer to real data. Based on these three metrics, it can be concluded that the proposed method exhibits a significant advantage in few-shot SAR image generation. The consistent performance gains on military (MSTAR) and civilian targets (CV-SARID) highlight its adaptability to diverse target types. By decoupling geometry-specific dependencies through local scattering fusion and sparse representation, the architecture inherently supports generalization across diverse SAR target categories.
4.7. Generative Data Augmentation for SAR Target Recognition
To evaluate the enhancement on ATR, a CNN-based Fea-DA recognition model is employed [
65]. Since the recognition of targets in the MSTAR dataset has been extensively studied, the experiments are conducted on the CV-SARID dataset. It contains three types of pitch angle data, namely 25 degrees, 30 degrees, and 45 degrees. To demonstrate the generalization capability of our model, we selected images with a 30-degree pitch angle for training and used the images at 25 degrees and 45 degrees for testing. This evaluation setting tests the generalization capability in practical applications. To ensure the validity and accuracy of the experiments, the number of training epochs and experimental trails are made consistent in each experiment. The proposed method is utilized to generate data for each category at the 30-degree pitch angle, thereby supplementing each class with an additional 50 images (the original image number is 72 for each class). Both experiments are repeated for five trails to reduce the impact of random factors.
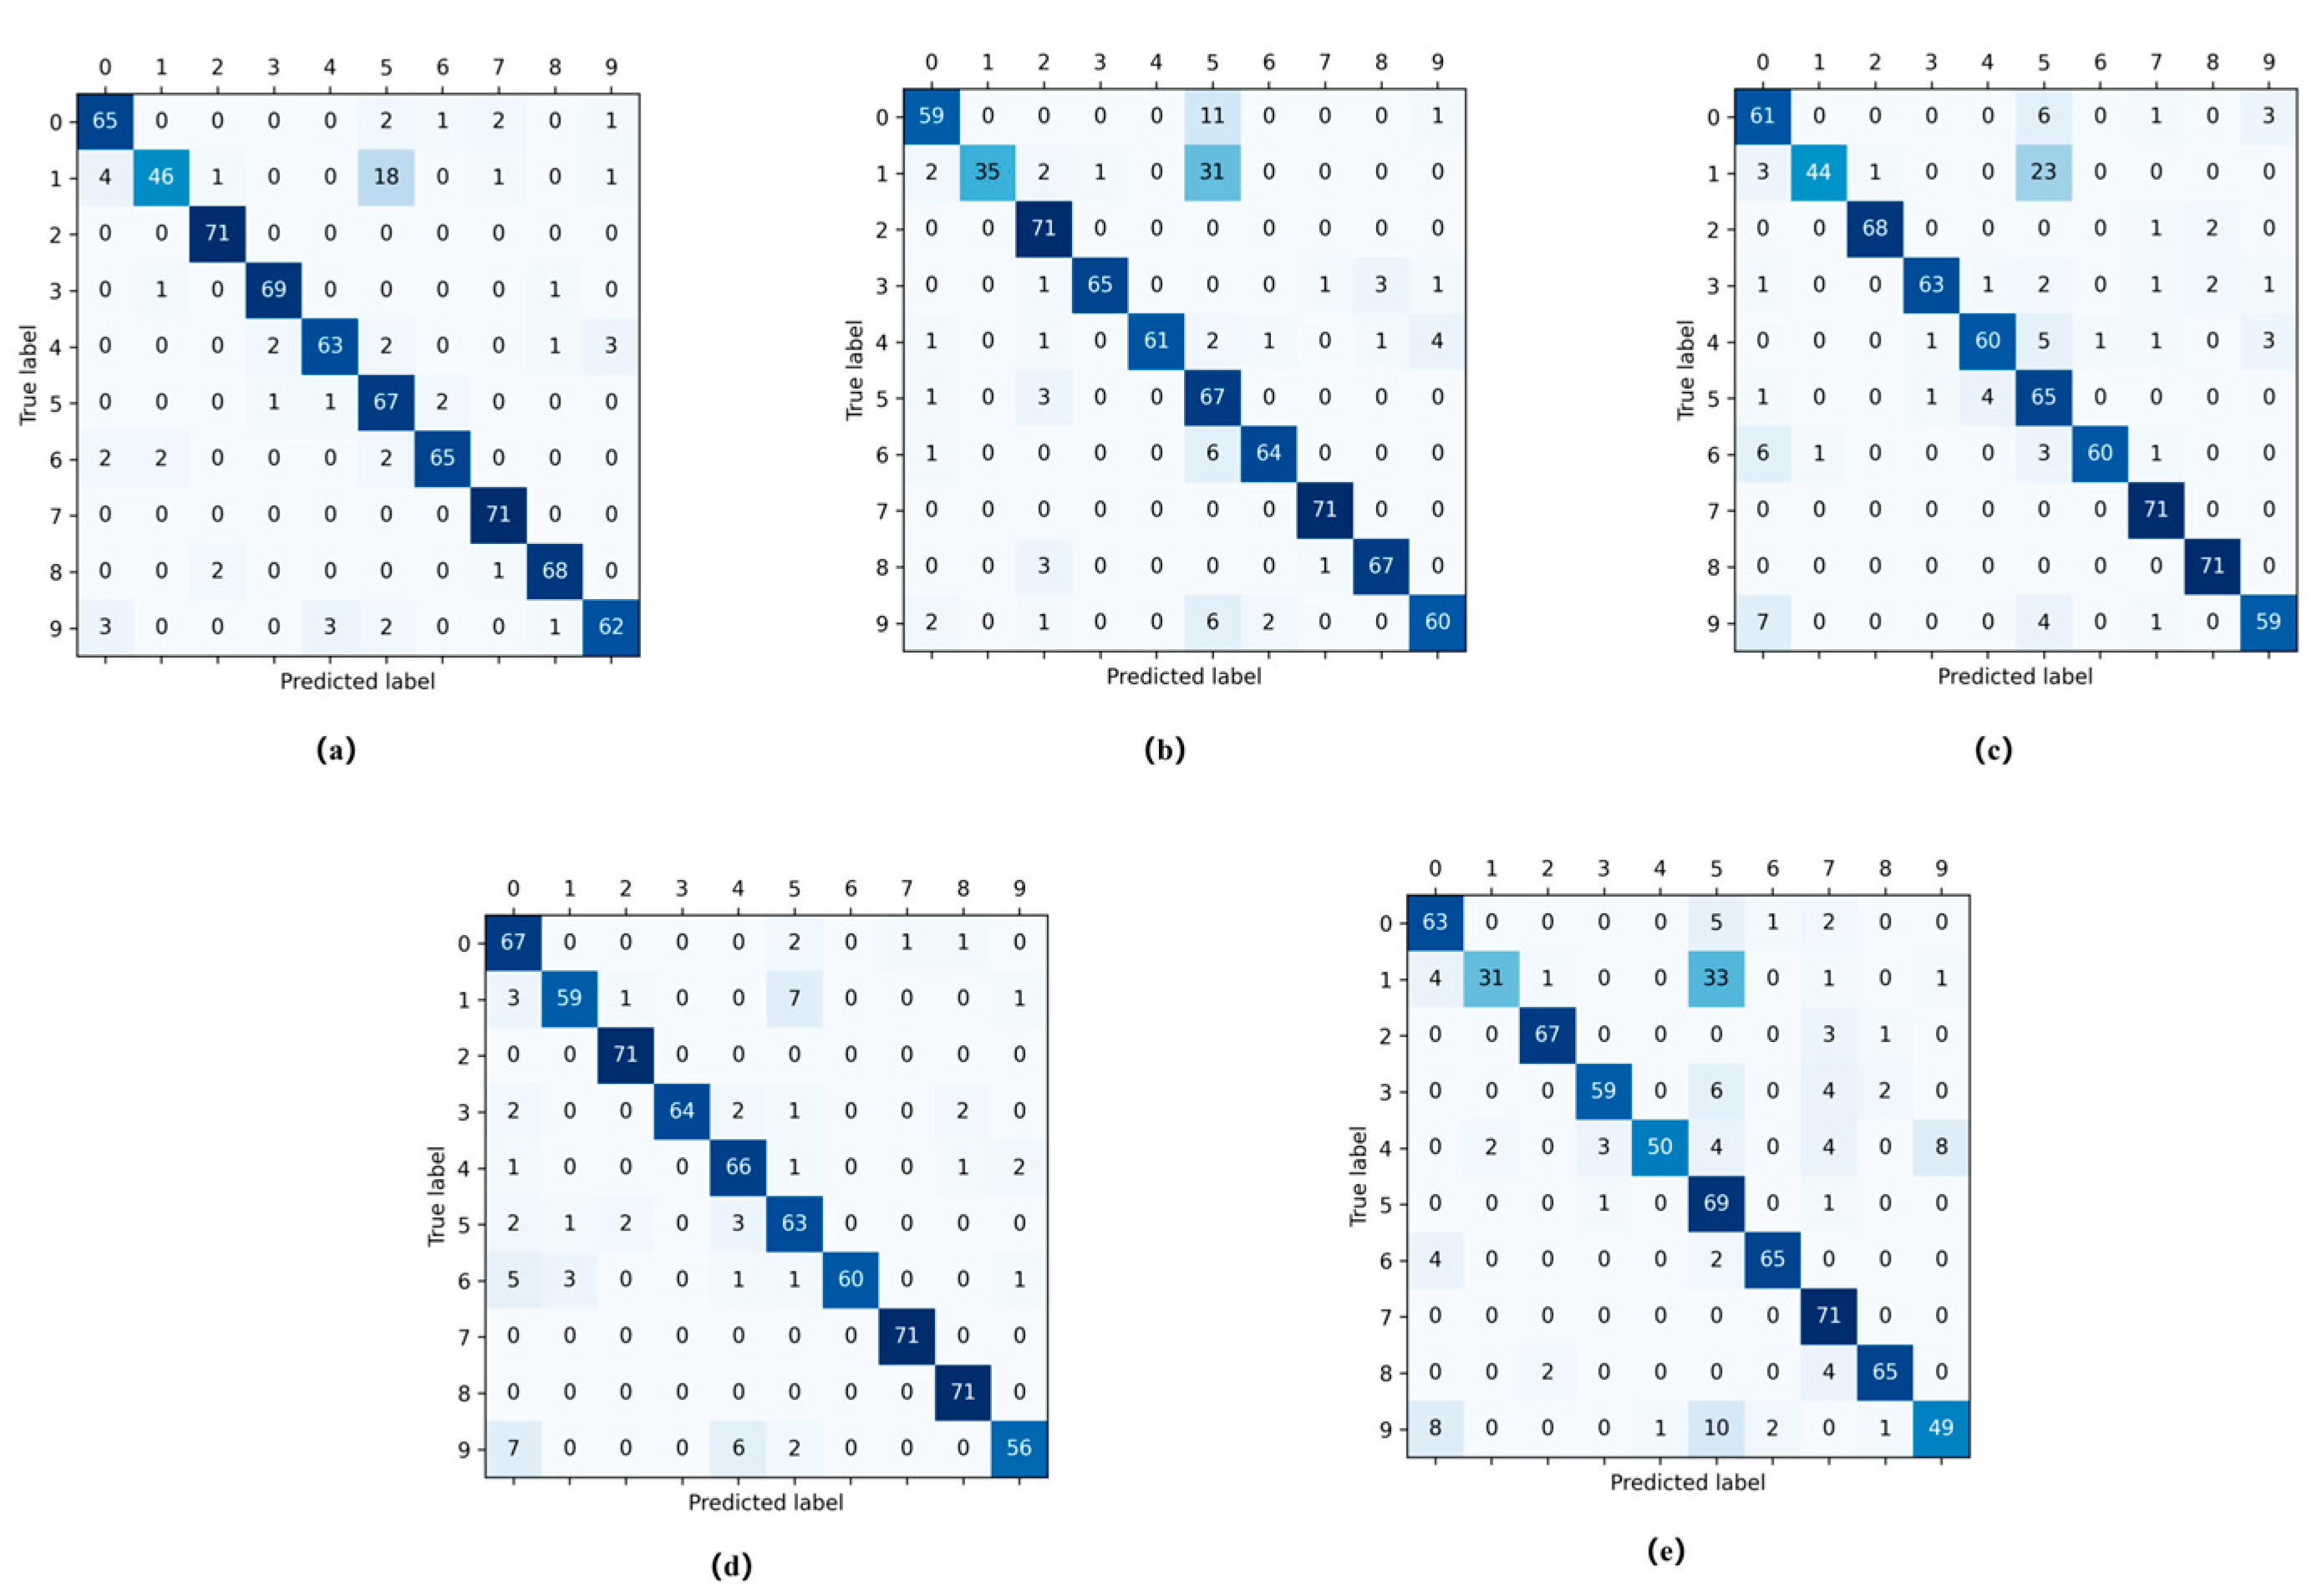
The experimental results indicate that the augmentation of data contributed to significant improvements in the target recognition rate. With 25-degree pitch angle data (see
Table 5,
Figure 14 and
Figure 15), baseline recognition accuracy improved from 88.06% to 94.22% after data augmentation, resulting in a 6.16% increase. This shows the generated data fit the real distribution and supplemented angle data, thus enhancing the classification accuracy.
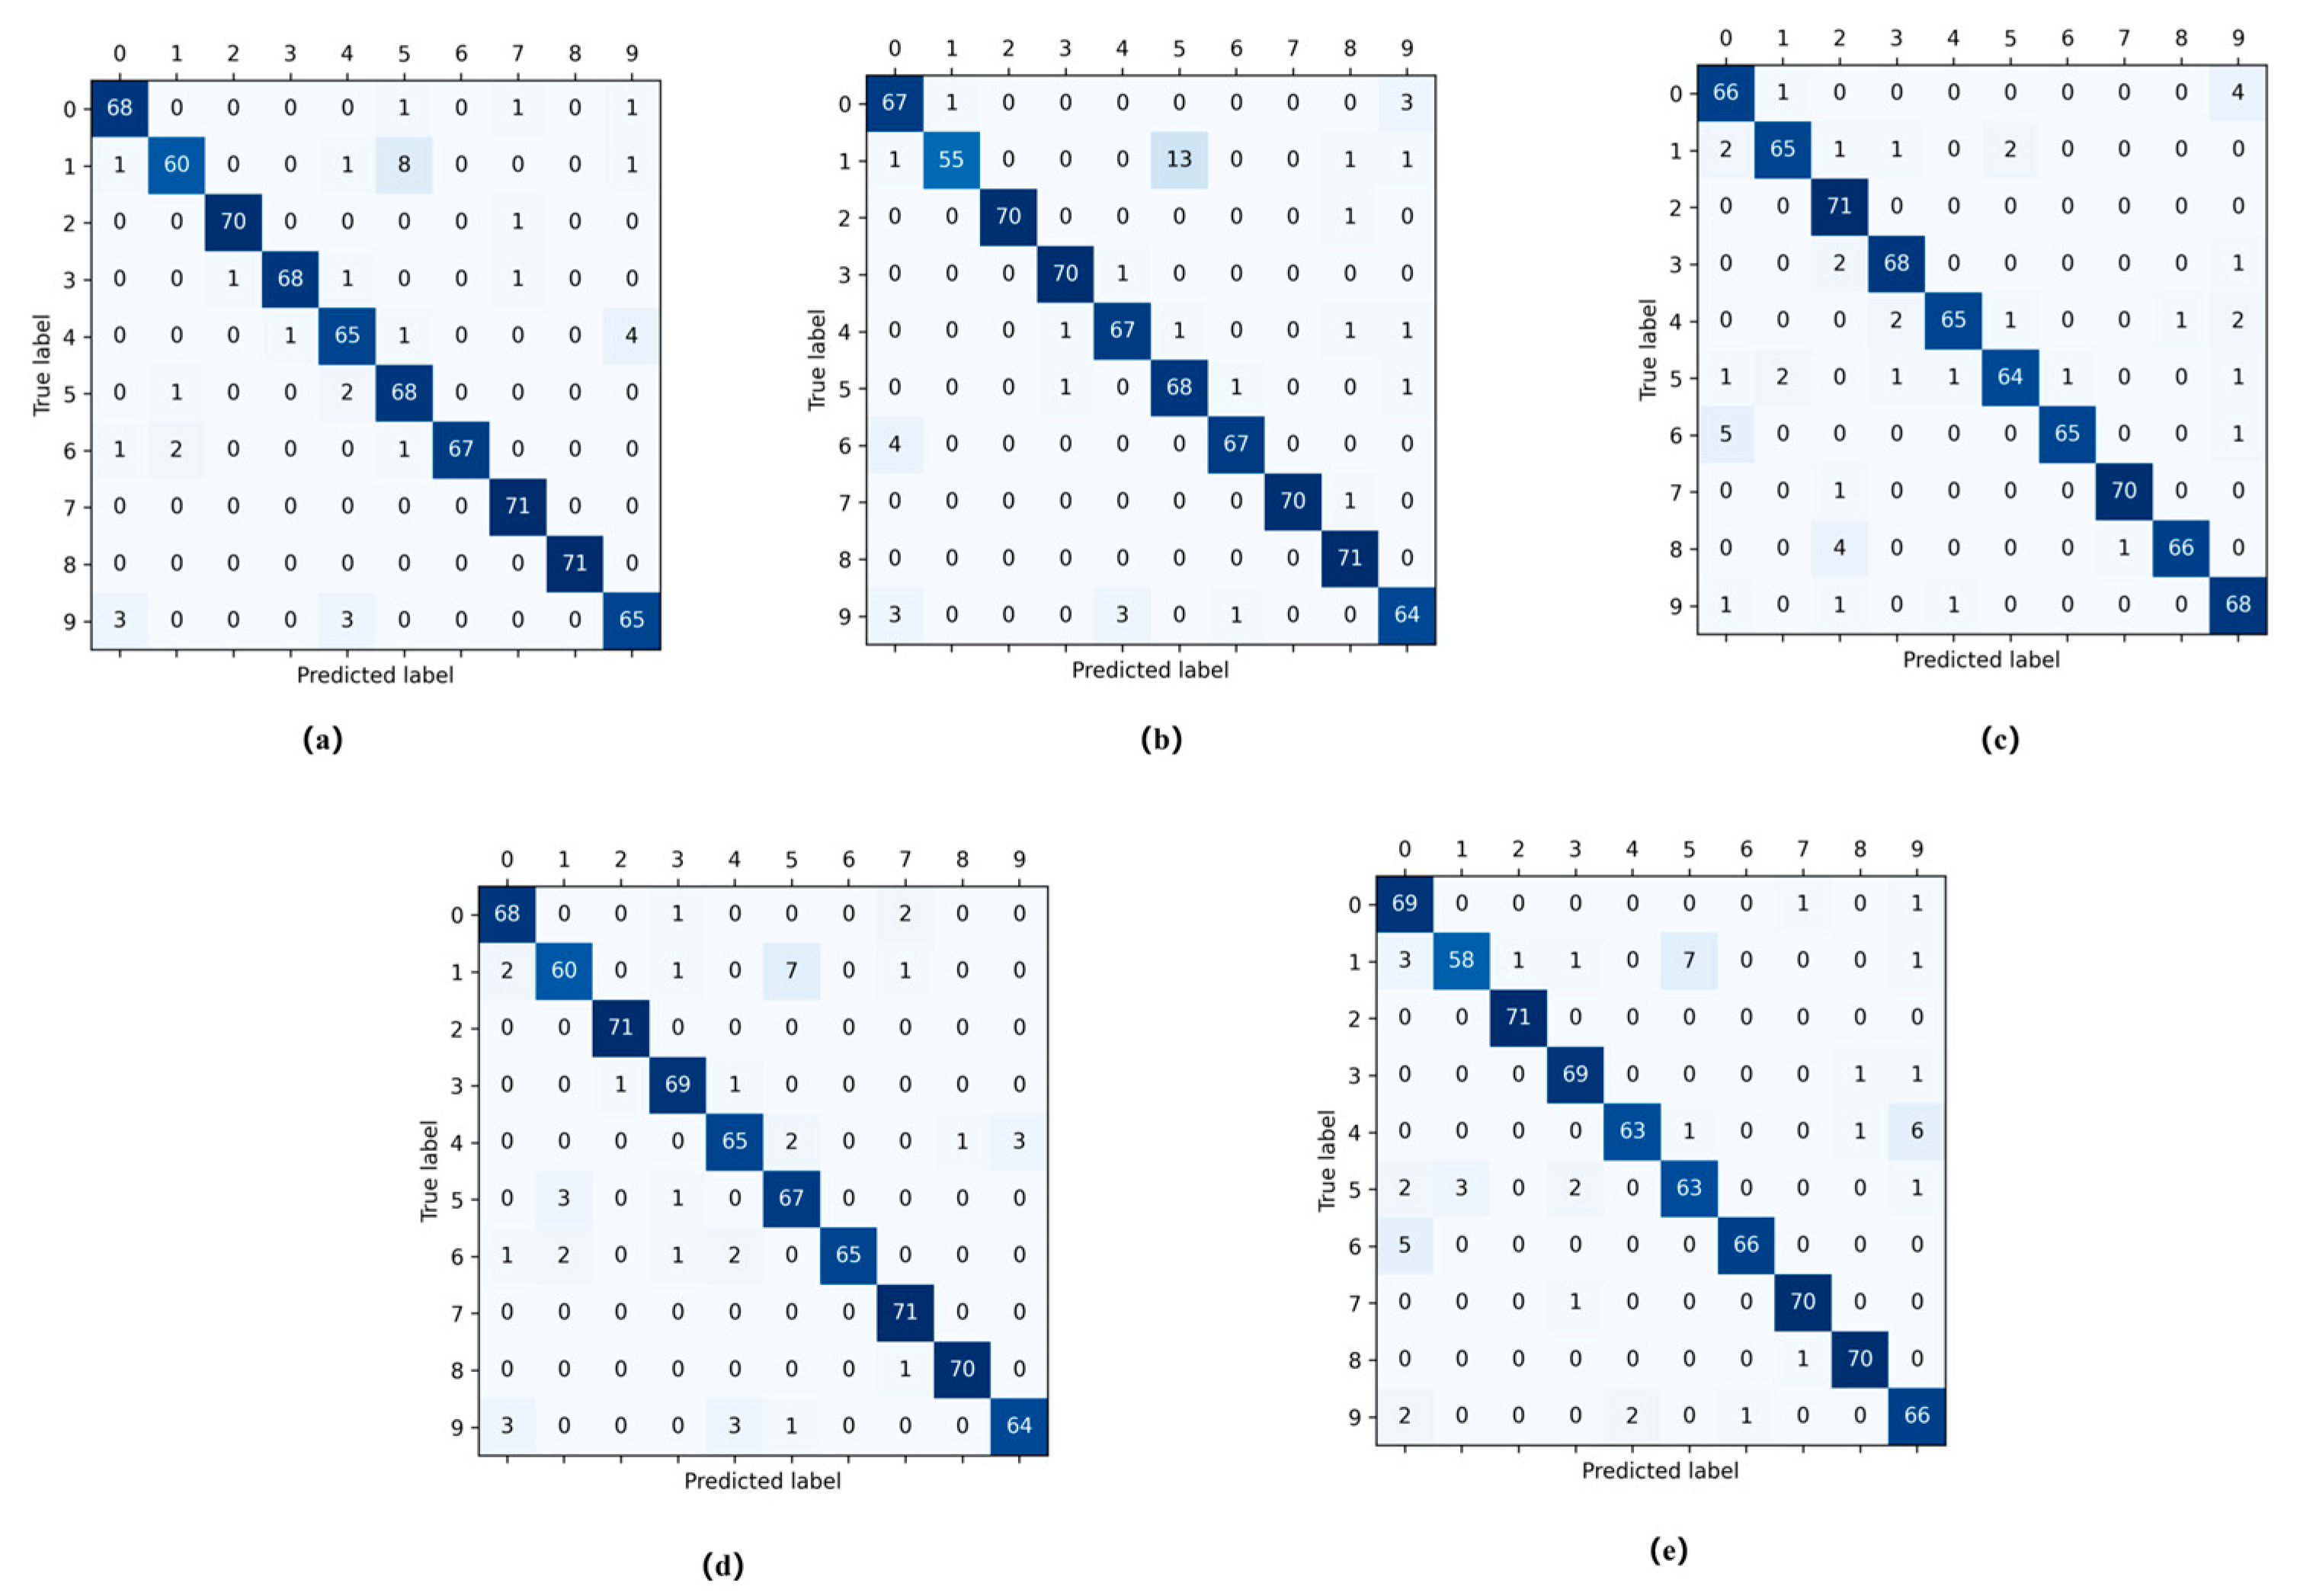
For the 45-degree pitch angle test data (see
Table 6,
Figure 16 and
Figure 17), the baseline recognition accuracy was 71.45%, which improved to 74.74% with added data, exhibiting a 3.29% increase. Additionally, the generated data also enhance the recognition rate. An analysis is conducted on the correlation between the enhancement in the recognition rate at a 45-degree pitch angle compared to that at 25 degrees. The disparity between the training samples with a 45-degree pitch angle is more pronounced compared to the 30-degree samples. As the data augmentation and divergences in different source domains equally increase, the recognition of the targets becomes more challenging. Consequently, the observed improvement in the recognition rate is not as substantial.
To conclude, these experiments demonstrate that the generated images do not only exhibit a high quality relative to the other literature methods, but they also enhance the accuracy of SAR target recognition models.
5. Conclusions
In this study, we explored the angle-controllable generation of SAR image targets with few samples and proposed a GAN framework based on feature alignment and angle synthesis algorithms. We conducted semantic alignment to generate images with shared feature characteristics and employed sparse representation to create SAR images within expected angle intervals. Furthermore, in the generation phase, the optimization of the reconstruction loss function was undertaken, alongside the incorporation of structural constraints to improve the overall generation quality. Additionally, an angle discriminator was introduced to manipulate the azimuth angle of generated target samples.
The experimental results indicate that the proposed method is capable of producing SAR images with a coherent structure, reduced artifacts, substantial diversity, and controllable target angles. Through testing on two datasets, stable performance improvements were achieved, not only in terms of the quality of the images, but also in terms of the stability of the synthetic target angle. Furthermore, the proposed approach demonstrates its effectiveness as a data augmentation technique to improve the accuracy of SAR target recognition. In the target recognition experiments on the CV-SARID dataset, we conducted data augmentation on images with a 30-degree pitch angle and tested them at 25 degrees and 45 degrees, achieving recognition rate improvements of 6% and 3%.
Two remaining limitations of the proposed method are that it still produces certain artifacts in the generated images and may generate target samples that exceed the specified angle range. Additionally, broader generalization to non-vehicle SAR objects (e.g., ships, infrastructure) remains constrained by current dataset availability, a common limitation in SAR ATR research that warrants community efforts for data diversity. These issues require further research investigations in the future.


