Article

Rapid Response to Effusive Eruptions Using Satellite Infrared Data: The March 2024 Eruption of Fernandina (Galápagos)

1
Dipartimento di Scienze della Terra, Università di Torino, 10125 Turin, Italy
2
Dipartimento di Ingegneria Civile, Edile e Ambientale, Università La Sapienza, 00184 Rome, Italy
3
Instituto de Geofísica, Universidad Nacional Autónoma de México, Ciudad de México 04150, Mexico
4
Instituto Geofísico, Escuela Politécnica Nacional, Quito 170525, Ecuador
*
Author to whom correspondence should be addressed.
Remote Sens. 2025, 17(7), 1191; https://doi.org/10.3390/rs17071191
Submission received: 19 February 2025 / Revised: 25 March 2025 / Accepted: 26 March 2025 / Published: 27 March 2025
(This article belongs to the Special Issue Satellite Monitoring of Volcanoes in Near-Real Time)

Abstract

:
On 3 March 2024, a new effusive eruption began from a sub-circular fissure on the southeast upper flank of the Fernandina volcano (Galápagos archipelago, Ecuador). Although the eruption posed no threat to people, as the island is uninhabited, it provided an opportunity to test a rapid response system for effusive eruptions, based on satellite infrared (IR) data. In this work, we illustrate how the analysis of data from multiple IR sensors allowed us to monitor the eruption in near real-time (NRT), providing recurrent updates on key parameters, such as (i) lava discharge rate and trend, (ii) erupted lava volume, (iii) lava field area, (iv) active flow front position (v) flow velocity, (vi) location of active vents and breakouts, and (vii) emplacement style. Overall, the eruption lasted 68 days, during which 58.5 ± 29.2 Mm3 of lava was erupted and an area of 14.9 ± 0.5 km2 was invaded. The eruption was characterized by a peak effusion rate of 206 ± 103 m3/s, an initial velocity of ~2.3 km/h, and by an almost exponential decline in the effusion rate, accompanied by a transition from channel- to tube-fed emplacement style. The advance of the lava flow was characterized by three lengthening phases that allowed the front to reach the coast (~12.5 km from the vent) after 36 days (at an average velocity of ~0.015 km/h). The results demonstrate the efficiency of satellite thermal data in responding to effusive eruptions and maintaining situational awareness at remote volcanoes where ground-based data are limited or completely unavailable. The requirements, limitations, and future perspectives for applying this rapid response protocol on a global scale are finally discussed.

1. Introduction

Lava flows represent a significant natural hazard for people living near volcanoes and pose a major risk to infrastructures in regions prone to lava flow inundation [1,2]. Between 1950 and 2020, basaltic lava flows threatened inhabited areas 38 times at 12 volcanoes, causing 25 documented deadly incidents and resulting in 659 fatalities caused directly by lava flows [3,4]. Statistically, lava flows account for a smaller proportion of volcano-related fatalities (~4% of all deaths), as their typically slow movement allows people sufficient time to evacuate [4]. However, the eruptions of Nyiragongo (Democratic Republic of Congo) in 1977, 2002, and recently 2021 demonstrated how extremely fluid lavas can rapidly inundate urbanized areas, leaving little to no time for evacuation [5,6,7]. While rare, lava flow inundations of inhabited areas can have devastating and long-lasting consequences for affected communities [3]. Recent eruptions at the Fogo volcano in 2014, Kilauea in 2014 and 2018, La Palma in 2021, and the Reykjanes peninsula since 2021 [8,9,10,11,12,13] underscore the widespread and enduring socio-economic impacts of such events [7,8,10]. Lava flows destroy everything in their path and can have severe consequences for small communities by disrupting access to drinking water and by cutting off roads and communication routes [1,2,7]. Evacuation to emergency accommodation may also result in permanent displacement, leading to long-term physical and mental health impacts [14]. Effusive eruptions can also trigger cascading hazards, such as caldera collapses, block-and-ash flows, landslides, and tsunamis, which may impact even larger areas compared to those exclusively at risk of lava flow inundation [7,15].
Therefore, it is clear that local authorities dealing with risk mitigation at lava-flow-forming volcanoes need to be promptly informed (rapid response) and be aware of how the eruption is evolving (situational awareness) in order to achieve two main goals: (1) evaluation of the impacts that the ongoing activity and derived hazards have, or can have, on inhabited areas and (2) definition of the possible short- to long-term scenarios.
In recent years, some rapid response systems to natural hazards, based on satellite data, have been developed ([16] and are referenced therein). For example, the International Charter “Space and Major Disasters” (https://disasterscharter.org/; accessed on 31 January 2025) and the Copernicus Emergency Management Service (CEMS; https://emergency.copernicus.eu/; accessed on 31 January 2025) use satellite data to provide mapping services in cases of emergencies and disasters, including those linked to volcanic eruptions [17,18]. Between 2018 and 2024, the International Charter and CEMS were activated five times to respond to effusive eruptions, namely for Etna (Italy), Soufriere de St. Vincent (St. Vincent Island), and Nyiragongo (Democratic Republic of Congo) in 2018; La Palma (Canary Islands) in 2021; and Wolf (Galapagos) in 2022 (https://disasterscharter.org/activations; https://mapping.emergency.copernicus.eu/activations/; accessed on 3 February 2025). These services provide information on the extent of lava flow(s) to local and national authorities involved in managing the emergencies, based on optical and radar images. Although these products are essential for the rapid evaluation of the impact that lava flow(s) have on the affected area (i.e., to assess the damage to built-up areas and infrastructures), they are not specifically designed to respond to effusive eruptions since they do not provide critical information on the progress of the eruption, nor do they allow for an evaluation of the possible forthcoming scenarios.
In 2015, the working group RED SEED (Risk Evaluation, Detection, and Simulation during Effusive Eruption Disasters) was created to test the current capabilities of the scientific community to respond to effusive eruptions and to discuss the best practices to allow the near real-time (NRT) delivery of global standard “products” for a timely and adequate humanitarian response ([16] and the references therein). The RED SEED highlighted how satellite thermal data currently constitute the most robust and widely used method for estimating lava discharge rates and erupted volume in NRT [19,20,21,22,23]. The fast sharing of these thermally derived products can guide lava flow propagation models capable of informing the authorities with flood probability maps and associated uncertainties [20,23,24], and it provides a robust way to maintain situational awareness throughout long-lasting eruptive crisis [25,26]. Nonetheless, infrared data enable tracking of the complex development of lava fields, which are often accompanied by phenomena such as lava tunnelling, resurfacing, and the opening of ephemeral vents [20,23,24] that pose a scientific challenge to lava flow modeling. Their timely identification is crucial, as new flow units can arise along the emplaced flow(s), potentially impacting previously unaffected areas [10,11].
In some regions (e.g., Italy, France, Iceland, USA, Ecuador), some systems/protocols based on satellite thermal data have been successfully applied, supporting stakeholders in preparing and planning for losses associated with lava flows [13,20,27,28,29]. However, for many other lava-flow-forming volcanoes, an international response chain is often required to assist observatories in monitoring the effusive event and informing the local authorities on the status of the eruption [24].
The Fernandina volcano (Galápagos archipelago) is a privileged target for satellite observations since remotely sensed data can partially compensate for the lack of more conventional monitoring networks [30]. Currently, the monitoring system on the island, run by the Instituto Geofísico de la Escuela Politécnica Nacional (IG-EPN), consists of only three permanent seismic stations, with field campaigns complementing the surveillance program (for gravity, GPS, lava, and tephra collection). Prior to the advent of continuous satellite observations, activity at Fernandina was observed only by ships and aircrafts, and, since the island cannot be seen from most other parts of the archipelago, many of the past smaller effusive eruptions were not observed in real-time.
In this work, we used the March 2024 Fernandina eruption as a case study to test the effectiveness of satellite infrared data in providing robust information for rapid response and situational awareness during an effusive eruption. We present the following series of parameters: time-averaged lava discharge rate (TADR), lava flow volume and area, maximum length, and velocity of lava flow fronts, which were obtained from different multispatial and multispectral IR sensors that were processed in NRT (or within 24 h of acquisition) to inform and update the IG-EPN on the developments of the eruption. The set of parameters (including maps and time series) were summarized in explanatory panels (for easy dissemination) that have been used to assess the status of activity and, in some cases, define short-term scenarios. The proposed methodology is potentially applicable to any effusive eruption in the world, enabling rapid response with global application.

2. Materials and Methods

2.1. Study Area: Fernandina Volcano

Fernandina Island is the emerged part of the westernmost and youngest volcano in the Galápagos archipelago. The volcanic edifice is a typical shield volcano that reaches an altitude of 1476 m above sea level (Figure 1), with a subaerial volume of approximately 140 km3 [31]. The island is sub-circular with a diameter of about 30 km and a summit caldera that is approximately 5 × 6 km in diameter and 900 m deep. An intra-caldera lake is present most of the time and may interact with magma intrusions into the caldera [32]. Volcanism in Fernandina is associated with the Galápagos hot spot plume and is thought to have begun at least 32 ky ago [33]. It has been estimated that over the last 1 ky, the minimum eruption rate was ~0.004 km3 yr−1 [31], or about half of the most productive Kīlauea volcano (0.009 ± 0.01 km3 yr−1) [34]. Erupted lava is actually evolved tholeiitic basalts whose almost invariant composition suggests homogenization and mixing processes occurring at shallow depths (3 km or less) [35,36]. Radar interferometry data suggest the presence of a shallow reservoir (~1 km below sea level) connected to a deeper system, located approximately 5 km below sea level, recurrently fed by the hotspot magmatism [37,38,39,40,41]. Inter-eruptive periods are usually characterized by the uplift of the caldera floor and the upper flanks of the volcano, apparently caused by the accumulation of magma in both reservoirs [37,38,41]. The complex interaction between reservoir geometry, topographic stresses, unloading of the caldera, and stresses induced by previous intrusions is thought to be the origin of intrusion orientation and the alternation between circumferential and radial eruptions [37,38,39,40,41,42].
Recent volcanic activity has seen alternating phases of intense effusive activity (from both circumferential and radial fissures), and episodes of caldera collapse coupled with explosive activity [32,43,44]. The last caldera collapse occurred in 1968 following an effusive eruption on the SE flank (<0.1 km3) and a large hydromagmatic event (VEI 4) sourced from the caldera floor [45]. The volume of lava and ash from that eruption amounted to only a small percentage of the subsequent ~1.5 km3 collapse, suggesting a possible magmatic intrusion or underwater eruption at the origin of the collapse [35,43]. Since then, the volcano has erupted 15 times (VEI 0 to VEI 2), alternating effusive eruptions from circumferential fractures, near the caldera boundary faults, to radial fractures, extending along the outer flanks [46]. From 1988 to 2020, the volcano erupted eight times (Figure 1) in 1988, 1995, 2005, 2009, 2017, 2018, and 2020. The volume erupted in this period was approximately 177 Mm3, with individual eruptions producing between ~6 and ~57 Mm3 of lava with durations from 2 to 73 days [46,47]. All these eruptions began with Hawaiian-style lava fountaining (<100 m) that fed rapid channel-fed lava flows descending the flanks [35,48]; later, the eruptions become less vigorous with one or a few active vents, showing Strombolian activity.
Figure 1. (a) Fernandina Island (Galapagos Archipelago; inset (a’)) and recent lava flows digitized from [38,39,40,49]. The white dashed box depicts the zoomed area presented in (b). (b) The contours of the latest lava flow (this work) were obtained from the analysis of visual and infrared satellite data (see the text for details and Supplementary Materials S2). The map was created with the open-source software Quantum GIS (QGIS 3.38.0). Stereographic World projection was created with the M_Map package 1.4 [50]. The digital elevation model (DEM) was up-sampled from the Shuttle Radar Topography Mission (SRTM—NASA JPL 2013). Bathymetry was accessed from the National Oceanic and Atmospheric Administration (NOAA; https://www.ncei.noaa.gov/access/metadata/landing-page/bin/iso?id=gov.noaa.ngdc.mgg.dem:11516; accessed on 4 March 2024). Contour lines were calculated on resized SRTM. Coastlines (1:50,000 scale) were accessed free of charge from the Ecuador Geoportal at https://www.geoportaligm.gob.ec/portal/ (accessed on 4 March 2024).
Remotesensing 17 01191 g001
Continued ground deformation and low seismicity were recorded after the 2020 eruption and prompted the publication of a special report of IG-EPN on 12 November 2021 [51], suggesting the possibility of renewed eruption in the medium- to long-term (weeks to years). On 26 February 2022, a seismic swarm was detected in Fernandina and lasted about 4 h [52]. The new eruption began on 3 March 2024, with lava emitting from a circumferential fissure system on the volcano’s upper southeast flank (Figure 1) [53,54,55,56].

2.2. Sensors

Maximizing the number of available satellite scenes is essential to timely assess rapidly evolving eruptions [57,58]. Studies have highlighted that multiplatform and data fusion approaches are key to comprehensively tracking the evolution of the eruptive phenomena, exploiting the peculiarities of both high-spatial and high-temporal resolution sensors [59,60,61]. In this work, we gathered information from a wealth of platforms and sensors (Table 1), with spatial resolution ranging from 4 m to 1000 m, to track and assess in NRT the evolution of the 68-day-long eruption at the Fernandina volcano that started on 3 March 2024.
We used moderate resolution data (375–1000 m) in Middle-Wave InfraRed (MIR, 3.0–5.0 µm) and Thermal InfraRed (TIR, 8.0–13.0 µm) for the rapid quantification of the main eruptive parameters and for the construction and updating of the time series presented in the next paragraphs. This was performed following the workflow of the Middle Infrared Observation of Volcanic Activity (MIROVA), an automatic volcanic hotspot detection system [62], which allows NRT analysis with 1–4 h of latency (Table 1). To retrieve morphological and chronological information about the evolution of the ongoing effusive activity, we also used a combination of Short-Wave InfraRed (SWIR, 1.1–3.0 µm) and Visible—Near InfraRed (VNIR, 0.4–1.1 µm) imagery that allows for less rapid (6–12 h to >12 h, respectively) but highly accurate mapping at variable scales (Table 1).

2.2.1. Moderate Resolution MIR-TIR Sensors (0.375–1 km)

MODIS (Terra and Aqua): The National Aeronautics and Space Administration (NASA) Moderate Resolution Imaging Spectroradiometer (MODIS) sensor aboard Terra (1999) and Aqua (2002) satellites orbit the Earth at an altitude of 705 km. With a cross-track field of view (FOV) of 99°, the swath of MODIS covers a width of 2330 km, allowing complete coverage of the globe twice daily [63]. MODIS data span 36 spectral bands, ranging from 0.62 μm to 14.38 μm. Amongst them, the MIR bands B21 and B22 and the TIR channel B31, at 1 km resolution (Level 1b—Calibrated Radiance), are automatically ingested into the MIROVA system [62] from the NASA-LANCE system (Land, Atmosphere Near real-time Capability for Earth observation’s; https://lance.modaps.eosdis.nasa.gov/; last accessed on 26 March 2025).
VIIRS (SNPP and NOAA-20): The Visible Infrared Imaging Radiometer Suite (VIIRS) is an instrument onboard the Suomi National Polar-Orbiting Partnership (SNPP) and the Joint Polar Satellite System’s (JPSS) JPSS-1 (NOAA-20 or N20) platforms, launched in October 2011 and November 2017, respectively. Both platforms are placed in a polar orbit at a nominal altitude of 824 km [64]. VIIRS sensors have a FOV of 112.56°, with a swath width of 3060 km, providing, like MODIS, full coverage of the globe at both daytime and nighttime [65]. The sensors collect information across 22 spectral bands, from 0.412 μm to 12.01 μm. Amongst the comprehensive spectral range of VIIRS instruments, the coexistence of MIR and TIR channels at moderate (M13 and M15; 750 m) and imaging (I4 and I5; 375 m) spatial resolution has widely and successfully been employed to assess volcanic activity worldwide [66,67,68]. As with MODIS, Level 1b data (calibrated radiance) are automatically downloaded from the LANCE system and ingested into the MIROVA workflow.

2.2.2. High-Resolution SWIR-TIR Sensors (20–100 m)

MSI (Sentinel 2A/2B): Sentinel-2 consists of two sun-synchronous twin satellites, Sentinel-2A and -2B, operating simultaneously at 180° to each other. These were launched by ESA in June 2015 and March 2017, respectively. The two satellites cover Fernandina’s latitude with a revisit time of 5 days. The platforms host onboard the MultiSpectral Instrument (MSI) sensor, which operates from the VNIR to SWIR wavelengths, with a spatial resolution of 10 and 20 m/pixel, respectively. In this work, the Sentinel-2 data of Level 1C (top of atmosphere reflectance in fixed cartographic geometry) are analyzed by using the reflectance of three SWIR bands, namely B12 (2.19 μm), B11 (1.61 μm), and B8A (0.86 μm) (see Table 1 for details). These bands have been proven to be extremely sensitive to high-temperature targets, such as active lava surfaces and flow fronts [69,70,71]. Data are automatically downloaded from the Copernicus Data Space Ecosystem (https://dataspace.copernicus.eu/explore-data; last accessed on 26 March 2025) as they become available (typically within 6–12 h from acquisition).
OLI (Landsat 8/9): Landsat 8 and Landsat 9 are two polar sun-synchronous satellites that were launched in February 2013 and September 2021, respectively, by NASA-USGS. These platforms host onboard the Operational Land Instrument (OLI) that can capture VIS, NIR, and SWIR images with a resolution of 15 to 30 m/pixel and have a revisit time of 8 days at Fernandina’s latitudes. Similarly to Sentinel-2, the Level-1GT (systematic terrain correction) data are analyzed using three SWIR bands (resampled at 20 m resolution for consistency with Sentinel-2; see [70] for details), namely B7 (2.11–2.29 μm), B6 (1.57–1.65 μm), and B5 (0.85–0.88 μm) (Table 1). Data are automatically downloaded from AWS S3 storage (https://registry.opendata.aws/usgs-landsat/; last accessed on 26 March 2025) and processed through the Massimetti et al. [70] algorithm as soon as they become available (typically within 6–12 h from acquisition).
TIRS (Landsat 8/9): In addition to the OLI sensor, the Landsat 8 and 9 satellites host the Thermal Infrared Sensor (TIRS) instruments that can capture TIR images with a 100 m/pixel spatial resolution and an 8-day revisit time at Fernandina’s latitudes. Band 10 (top-of-atmosphere radiance) at 10.60–11.19 μm (Table 1) is used to identify thermally anomalous areas, particularly those covered by active and cooling lava flows [57]. As for Landsat OLI, the TIRS data (Level 1GT) are downloaded from AWS S3 storage (https://registry.opendata.aws/usgs-landsat/; last accessed on 26 March 2025) once available for download (approximately 6–12 h after acquisition).
ASTER (Terra): The Advanced Spaceborne Thermal Emission and Reflection Radiometer (ASTER), like the MODIS sensor, is aboard the Terra satellite, providing radiance measurements in 14 spectral bands, from visible and near-infrared (VNIR channels, 0.52–0.89 μm), short-wave infrared (SWIR channels, 1.6–2.43 μm; no longer functioning since April 2008), and thermal infrared (TIR channels, 8.125–11.65 μm) wavelengths, with spatial resolutions of 15, 30, and 90 m, respectively [72]. The acquisition of ASTER images is variable and related to individual acquisition requests (e.g., Urgent Request Protocol; [73]). Here, we used ASTER level 1T data (Precision Terrain Corrected Registered At-Sensor Radiance) that contain calibrated at-sensor radiance, geometrically corrected and orthorectified into UTM projection. We analyzed selected cloud-free TIR images (channel 13, 10.95–11.65 μm), with 90 m/pixel of spatial resolution, to locate the thermal anomalies associated with active and cooling lava flow units. The ASTER images are downloaded from https://earthexplorer.usgs.gov/(last accessed on 26 March 2025) and are typically available within 24 h of the acquisition.

2.2.3. Very High-Resolution VNIR Sensors (<10 m)

PlanetScope (CubeSats): PlanetScope’s constellation consists of a series of a commercial satellite and approximately 130 CubeSats (Dove) small platforms with a sun-synchronous orbit that image Earth’s surface at nadir geometry with a revisit frequency of about 1 day since their initial deployment in June 2022. The fine spatial resolution (4 m/pixel) captures detailed morphologies of active lava flows, complementing SWIR data for the comprehensive characterization of lava surfaces at very high temperatures [23]. The newest PSB.SD (SuperDove) sensor, active since March 2020, is capable of imaging the Earth’s surface in seven visible bands (443–705 nm) and one NIR band (865 nm; https://go.planet.com/psscene-imagery-spec; last accessed on 15 June 2024). Here, we downloaded orthorectified eight-band surface reflectance PlanetScope Scene products from Explorer (https://www.planet.com/explorer/; last accessed on 15 June 2024) in a grid of ca. 110 km2, comprising the area of Fernandina island inundated by lava flows, from the caldera rim in the north to the coastline in the south. To highlight the active lava body and thermal features, as well as to facilitate lava flow mapping, we used multiple false-color RGB compositions, exploiting the full spectral range available.

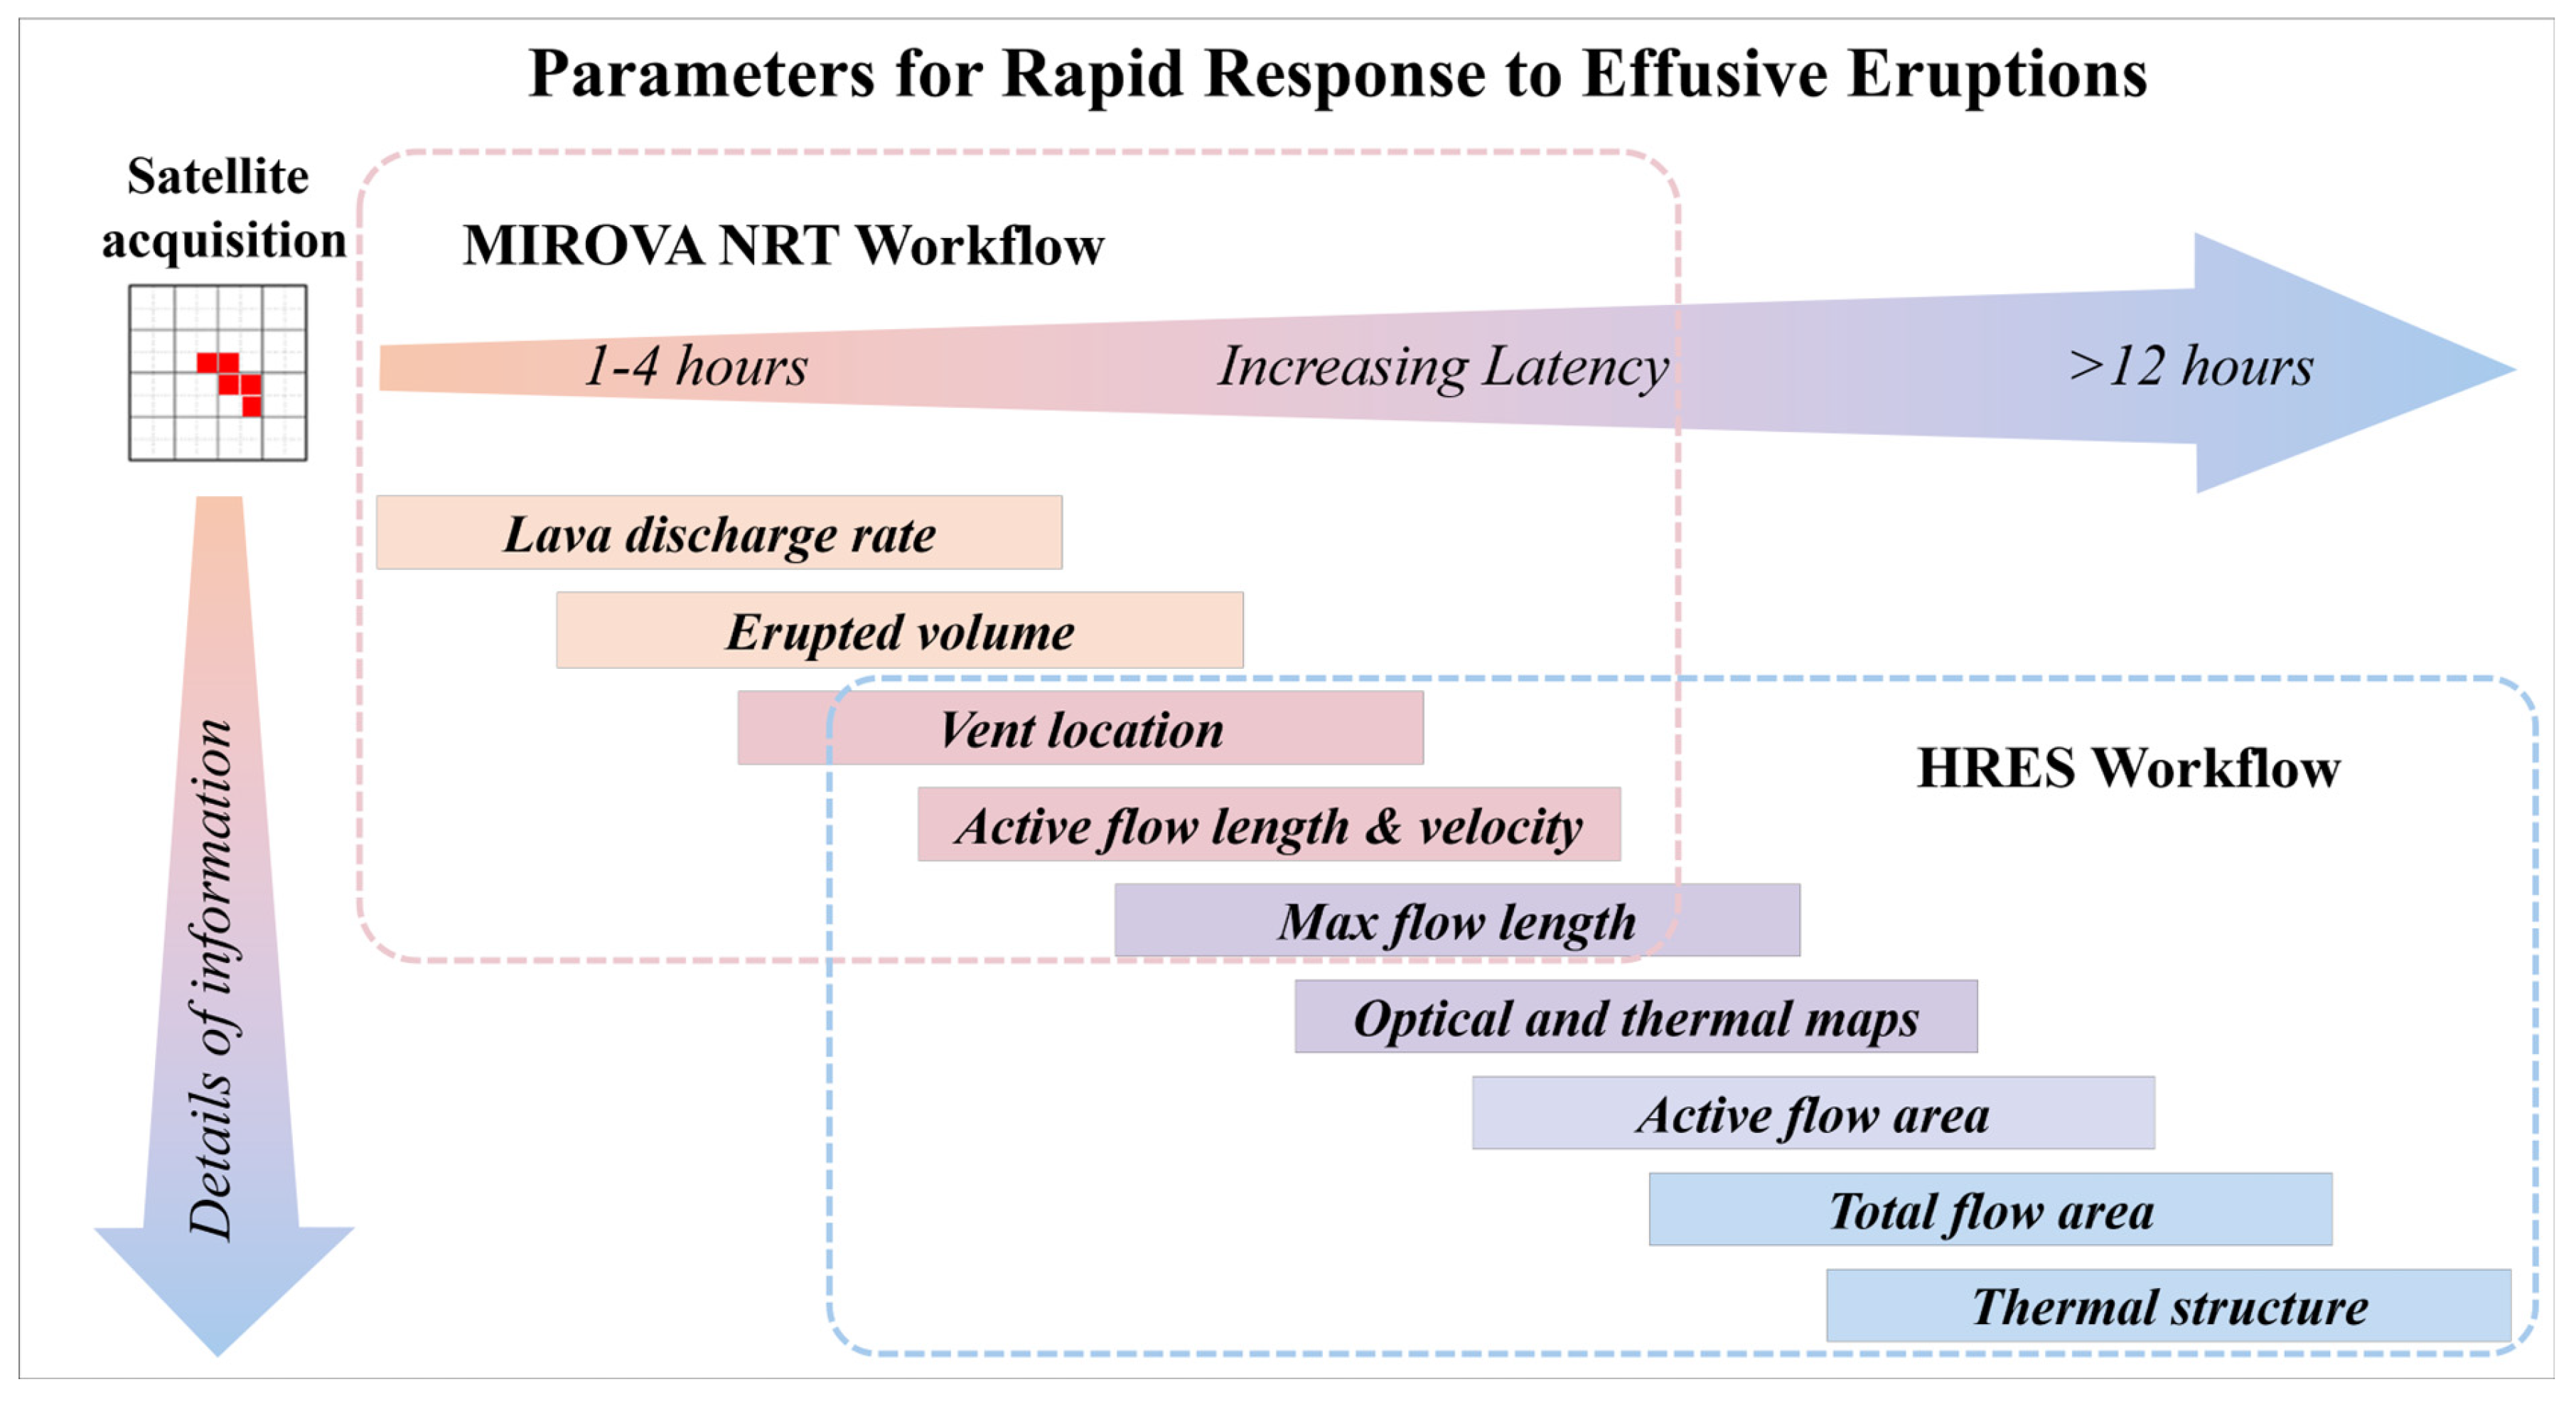
2.3. Workflows and Parameters

Satellite data were processed following two main workflows, whose combination produced a list of parameters useful for the rapid response of the effusive eruption (Figure 2). A set of NRT parameters was derived within 1–4 h of the acquisition, from the analysis of the moderate resolution MODIS and VIIRS, as per MIROVA workflow (Figure 3). Additionally, higher-resolution images were automatically or manually processed as soon as the data from various sensors were made available by data providers (HRES Workflow). The latency of these HRES data varies from 6 to 12 h for MSI, OLI, and TIRS and to >12 h for ASTER and PlanetScope (Table 1). Datasets from both workflows were repeatedly integrated and cross-compared, resulting in a set of parameters having different latencies and being characterized by variable degrees of detail (Figure 2). In the next section, we provide an overview of the workflows and techniques (automatic and manual) used to extract each parameter. The time series of all parameters are available in Supplementary Materials S1.

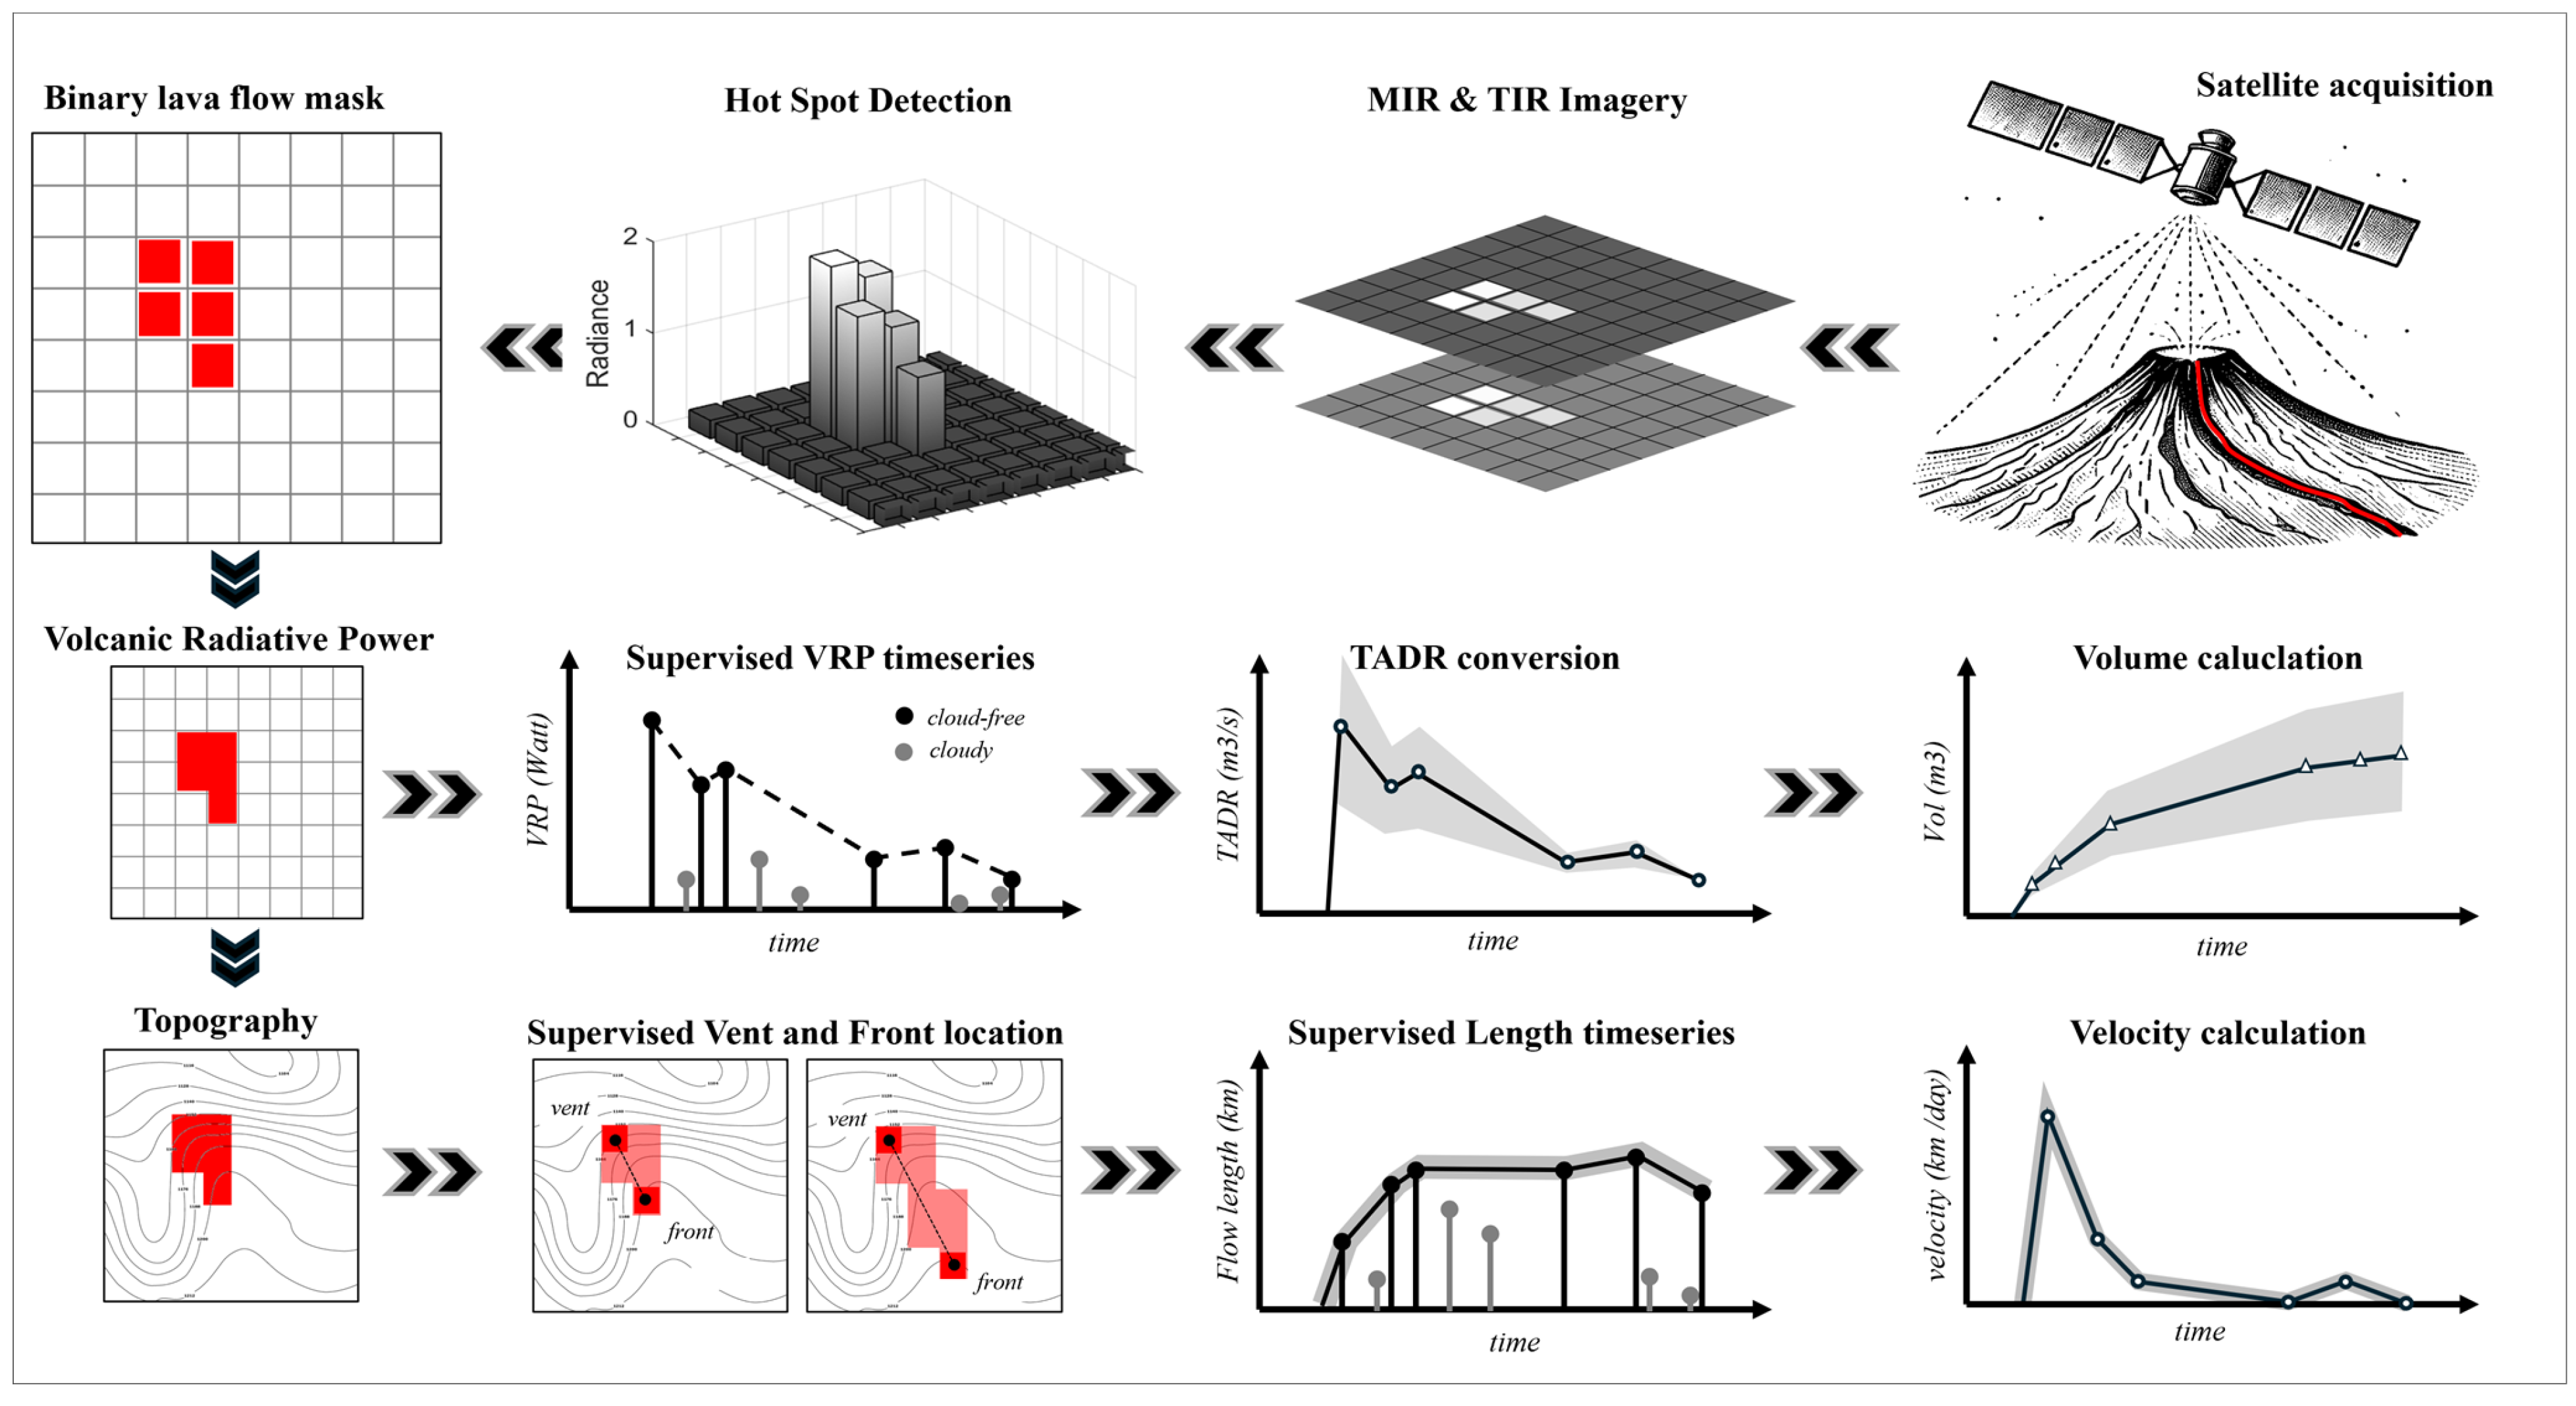
2.3.1. MIROVA NRT Workflow (Moderate Resolution MIR and TIR Data)

A schematic diagram of the MIROVA NRT workflow is shown in Figure 3. MODIS and VIIRS Level 1B radiance and geolocation products are automatically downloaded from the LANCE system, within 1–4 h from the image acquisition [62,66]. As soon as a new scene became available, MIR and TIR bands were resampled to a regular 51 × 51 km UTM grid centered on the volcano summit (coordinates provided by the Global Volcanism Program). By employing spectral and spatial filters, the core step of the MIROVA algorithm thermally detected anomalous pixels within the investigated scene (i.e., hotspots; see [62,66] for details). With the anomalous pixels identified (binary lava flow mask), the following volcanological-relevant parameters were retrieved.
Volcanic Radiative Power (VRP): The hotspot-contaminated pixels are used to estimate the Volcanic Radiative Power (VRP, in Watt) following the original MIR method [74] adapted for volcanic features (see [62,75] for details):
V R P = L M I R × σ ε α ε M I R × A p i x
where σ is the Stefan–Boltzmann constant (5.67 × 10⁻⁸ J s−1 m−2 K−4), and ε and ε M I R are the surface spectral emissivity at all wavelengths; in the MIR channel (both set to 1 for simplicity), A p i x is the pixel area in m2, and α is a wavelength-dependent constant. According to [58], the value of α can be computed for any MIR channel as follows:
α = 8.6344 × 10 10 × λ + 6.3796 × 10 9
where λ (in μm) is the central wavelength of the used MIR band (Table 1).
L M I R represents the excess MIR radiance, namely the total above-background radiance of the hotspot-contaminated pixels. This can be solved as:
L M I R = i = 1 n L M I R h o t ( i ) L M I R b k
where n is the number of hotspot contaminated pixels present in a scene, L M I R h o t   is the ith hotspot pixels’ radiance, and L M I R b k   is the averaged radiance of the surrounding, non-alerted pixels, these representing ambient (background) conditions. In basaltic eruptions, VRP is substantially associated with the “active” and younger portion of a lava field (at T > 600 K), emplaced during the 12–24 h prior to image acquisition [75]. To maximize the number of volcanological suitable acquisitions and to obtain the best and most representative thermal signature of the ongoing eruption, MODIS- and VIIRS-derived VRP time series were finally combined into a unique dataset. The VRP timeseries was continuously supervised by visualizing each image and excluding data contaminated by clouds or acquired in unfavorable viewing conditions.
Time-Averaged Discharge Rate (TADR) and Erupted Volumes (Vol): The time-averaged lava discharge rate (TADR, in m3/s) was calculated for each suitable acquisition, under the assumption that a relationship exists between VRP and TADR [75], which is shown in the following:
T A D R = V R P c r a d
where crad (in J m−3) is a best-fit parameter that embeds the rheological, insulation, and topographic conditions of the observed lava flow. For the 2024 Fernandina eruption, we set this parameter to 2 × 10⁸ J m−3, which is typical of basaltic effusive eruptions and allows for the rapid calculation of TADR with an associated uncertainty of ±50% [75]. As discussed in Section 5, lower uncertainties may be obtained by calibrating the crad value based on the analysis of previous eruptions.
The estimation of TADR enabled the retrieval of the cumulative erupted lava volume (Vol, in m3) by assuming a linear trend between each consecutive TADR measurement and by integrating the supervised time series [75]. The ± 50% uncertainty was then propagated to the estimate of the erupted volume.
Vent location, Active flow length (Lhot) and velocity (vhot): Hotspot-contaminated pixels derived from MIR data (MODIS and VIIRS) also provide first-order information on the spatial extent of the thermal anomaly (lava flow mask). This implies that the location of the vent area, flow front(s), and advancement rate of the lava flow(s) can be estimated at a pixel-level accuracy (from 0.375 to 1 km; Table 1), subject to supervision. The approximate location of the vent may be initially identified manually, by considering the topography and the geometry of view. However, it can be refined and updated as additional images, including high-resolution data, become available (see Section 2.3.2). The length of the lava flow was calculated by considering the distance (line of sight) between the farthest extending hotspot-contaminated pixel and the pixel containing the vent. The error associated with these measurements was ±1 pixel since even a small hot component lets the overall MIR pixel-integrated radiance rise exponentially and spread across adjacent pixels [74,76]. It should be noted here that this distance (hereby called Lhot), being based on MIR-derived lava flow mask, is relative to the position of the “active” (hot) front of the flow at the time of the image acquisition. Hence, it does not necessarily represent the maximum distance reached by the lava flow (here called Lmax), which instead may be represented by the cooling portion of the emplaced units (see below).
The active (hot) flow front velocity (km/day) was finally calculated by differentiating over time the active lava flow length (Lhot), by filtering the time series using a Savitzky–Golay filter (to remove high-frequency noise) and by resampling the filtered dataset to 1 data point per day.
Maximum flow length (Lmax): The maximum distance reached by the lava flow (Lmax) was instead obtained from the VIIRS night data at a 375 m resolution, using the TIRVolcH algorithm [77]. Unlike the MIROVA system, which works on the MIR bands, this algorithm is based on the TIR channels and was specifically designed to detect low-temperature thermal anomalies (T < 600 K). The spectral response of TIR bands to lower temperatures allows for the detection of ground elements a few degrees above the background, thus making TIR observations more effective in accurately determining the geometrical characteristics of the whole lava field, including previously emplaced and cooling flow units [77]. Furthermore, TIR bands, being less sensitive to high temperatures, suffer less from blurring effects (i.e., sensor’s point spread function (PSF); [78,79]), thus improving the estimation and accuracy of the length, width, and shape of the volcanic products [76]. The calculation of the Lmax was conducted following the procedure described above (Section 2.3.1) but considering the mask of hotspot-contaminated pixels detected by TIRVolcH rather than the one used by MIROVA. The error associated with this measurement was again ±1 pixel.

2.3.2. HRES Workflow (High- to Very High-Resolution VNIR-SWIR-TIR Data)

As soon as the VNIR, SWIR, and TIR images became available, a series of measurements were conducted to support the NRT dataset provided by MIROVA. This activity allowed us to: (i) distinguish between active (Ahot) and inactive (cooling) portions of the flow field, (ii) manually map the total area (ATOT) as the eruption progressed, and (iii) accurately identify the position of the vent and the main thermal structures.
Active lavas flow area (Ahot): MSI and OLI radiance data, collected by Sentinel-2 and Landsat missions, were implemented in the MIROVA system to automatically track the presence of hot pixels through a hybrid hotspot-detection algorithm based on SWIR reflectance [70]. This system homogenizes the spatial resolution of Landsat (30 m) to that of Sentinel 2 (20 m) and automatically localizes hot surfaces (T > 600 K) to track the evolution of the active (hot) lava flow area (Ahot).
Total Lava flow Area (ATOT): To ensure the most representative reconstruction of lava flow advancement dynamics, a supervised inspection of high-resolution VIS and IR imagery from multiple sensors was conducted throughout the eruption. Images were imported daily into the open-source software Quantum GIS (QGIS) and compared with each other (on multiple bands) to detect changes associated with the new lava flow. The result of this operation was a contour map of the areal evolution of the flow (Figure 4), from which the total area and expansion rate were measured (see Supplementary Materials S2). Following the approach outlined by [80], we estimated the maximum computational error associated with a one-pixel offset along the entire perimeter of the lava field, corresponding to approximately ±3.5% of the total flow area. However, as noted by [80], such errors are likely to be negligible, since some pixels will fall inside the boundary, while others will lie outside of it.
High-resolution mapping of active vent and thermal structures: Spatial resolution is key to accurately determining the spatial features of lava flow(s). VNIR, SWIR, and TIR data acquired by high- to very high-resolution sensors, were used for locating and analyzing the high-temperature structures associated with the eruption. This high-resolution mapping allowed us to accurately determine the position and dimensions of the opening fissures in the first days of the eruption, to locate the main vent on the SE flank of the caldera, and to track and measure the development of the lava channel and the lava delta. In addition, this wealth of data allowed us to locate skylights and breakouts, all associated with the development of a major lava tube systems. The thermal structure (hereby defined as the spatial distribution of high-temperature pixels) was then used to infer the emplacement style of the lava field (i.e., channel- vs. tube-fed).

3. Results: NRT Products for Rapid Response and Situational Awareness

Over the 68 days of the eruption, the integrated data from multiple infrared sensors made it possible to follow the space-time evolution of the lava flow in NRT. Below, we provide an overview of the dataset collected during the first 48 h (rapid response) as well as during the evolution of the eruption (situational awareness). The set of information obtained from the analysis of this data was periodically transmitted by e-mails to the IG-EPN, which integrated them into internal discussions and activity reports [54,55,56].

3.1. Rapid Response

The eruption began on 3 March 2024, at 05:50 UTC (2 March 2024, at 11:50 pm Galápagos time, GALT) with the opening of a series of en echelon fractures located on the south-eastern outer edge of the caldera at an altitude of >1100 m a.s.l. (Figure 4a) [81]. At 06:42, a VIIRS image showed the first thermal anomaly of the eruption (Figure 5a), but due to the very high satellite zenith angle (>64°), this acquisition was unfavorable for both the accurate localization of the lava flow(s) and the quantification of the VRP. However, it allowed us to roughly place the activity on the south-eastern edge of the caldera and along the SE flank at an altitude higher than 600 m a.s.l. At this time (52 min after the beginning of the eruption), it was still unclear whether there was effusive activity (also) inside the caldera. At 07:30, 100 min after the beginning of the eruption, VIIRS detected a second thermal anomaly, this time with excellent viewing conditions (satellite zenith angle of 7.6°; Figure 5b). This second image allowed us to exclude the presence of active lava inside the caldera and provided the first evidence of a ~3-km-long sub-circumferential fissure system, located at an altitude higher than 1000 m a.s.l.. The strong thermal anomaly was associated with an initial TADR of 206 ± 103 m3/s (Figure 6b) generated by at least three clusters of pixels, possibly associated with as many fracture segments and related flow units. From the image, we also recognized two possible flow fronts extending downslope on the south-eastern flank, up to altitudes of 550 m (Unit 1) and 500 m (Unit 2) a.s.l., respectively (Figure 5b). Unit 2 appeared to be the hottest and most advanced of the two, with a Lhot of about 3.8 ± 0.5 km (Figure 6d). This distance was reached by the lava in less than two hours, thus implying an initial velocity of ~2.3 km/h (Figure 6e). If this velocity had been maintained, the front would have reached the coast (9–10 km away) in the next 5–6 h.
The PlanetScope image acquired at 15:36 UTC (Figure 5c) revealed that, during the first hours of the eruption, the lava flowed out from several segments of the eruptive fissures, forming a large lava field spread over an area of at least 5.5 km2 (Figure 6d). The advanced portions of Units 1 and 2 are clearly visible in this image and appear to be cooling. The same image allowed us to retrieve the exact position of the main active vent and to notice that, 9 h 50 min after the start of the eruption, a third unit (Unit 3), sub-parallel to Unit 2, had advanced 5.7 ± 0.1 km from the vent and shows signs of cooling at the front. This unit advanced by only 2 km compared to Unit 2, thus suggesting a general decrease in the bulk advancement velocity of the active flow fronts (Figure 6e).
The reduction in effusive activity was confirmed a few hours later by the MODIS image acquired at 19:50, according to which, the TADR was lowered to 51.9 ± 26.0 m3/s, and an active flow front (likely Unit 3) traveled up to 6.4 ± 1 km from the vent (Figure 6d), thus suggesting a further advancement at ~0.17 km/h (Figure 6e). The volume of lava erupted in the first 14 h was estimated at 6.4 ± 3.2 Mm3 (Figure 6c), which, together with the estimate of the area described above, suggests that the initial flow field was characterized by thin, low-viscosity lava, no thicker than 0.5–2 m.
By March 4, at 07:20, the TADR had slightly increased to 89 ± 44 m3/s, but it declined again in the following hours, reducing to 25 ± 12 m3/s at 19:06 (Figure 6b). The front had advanced only 0.8 km in 24 h (~0.03 km/h), reaching a maximum distance of 7.2 ± 1 km from the vent. On 5 March, at 03:45, the TADR reduced to 18.5 ± 9.2 m3/s, and the front had stopped advancing, causing the activity to retreat backward to 6.4 km from the vent (Figure 6d). According to these data, during the first two days of activity, the eruption produced 12.4 ± 6.2 Mm3 of lava, with a mean eruption rate of 74.9 ± 37.5 m3/s. The analysis of high-resolution data (Figure 4) revealed that the area covered by lava during this initial phase was ~7.35 km2 (Figure 6d), implying an average expansion rate of 2.45 km2/day and a bulk lava thickness of 2.3 ± 1.15 m. This information was continuously updated and is summarized in information panels containing maps and time series, such as the one illustrated in Figure 6.

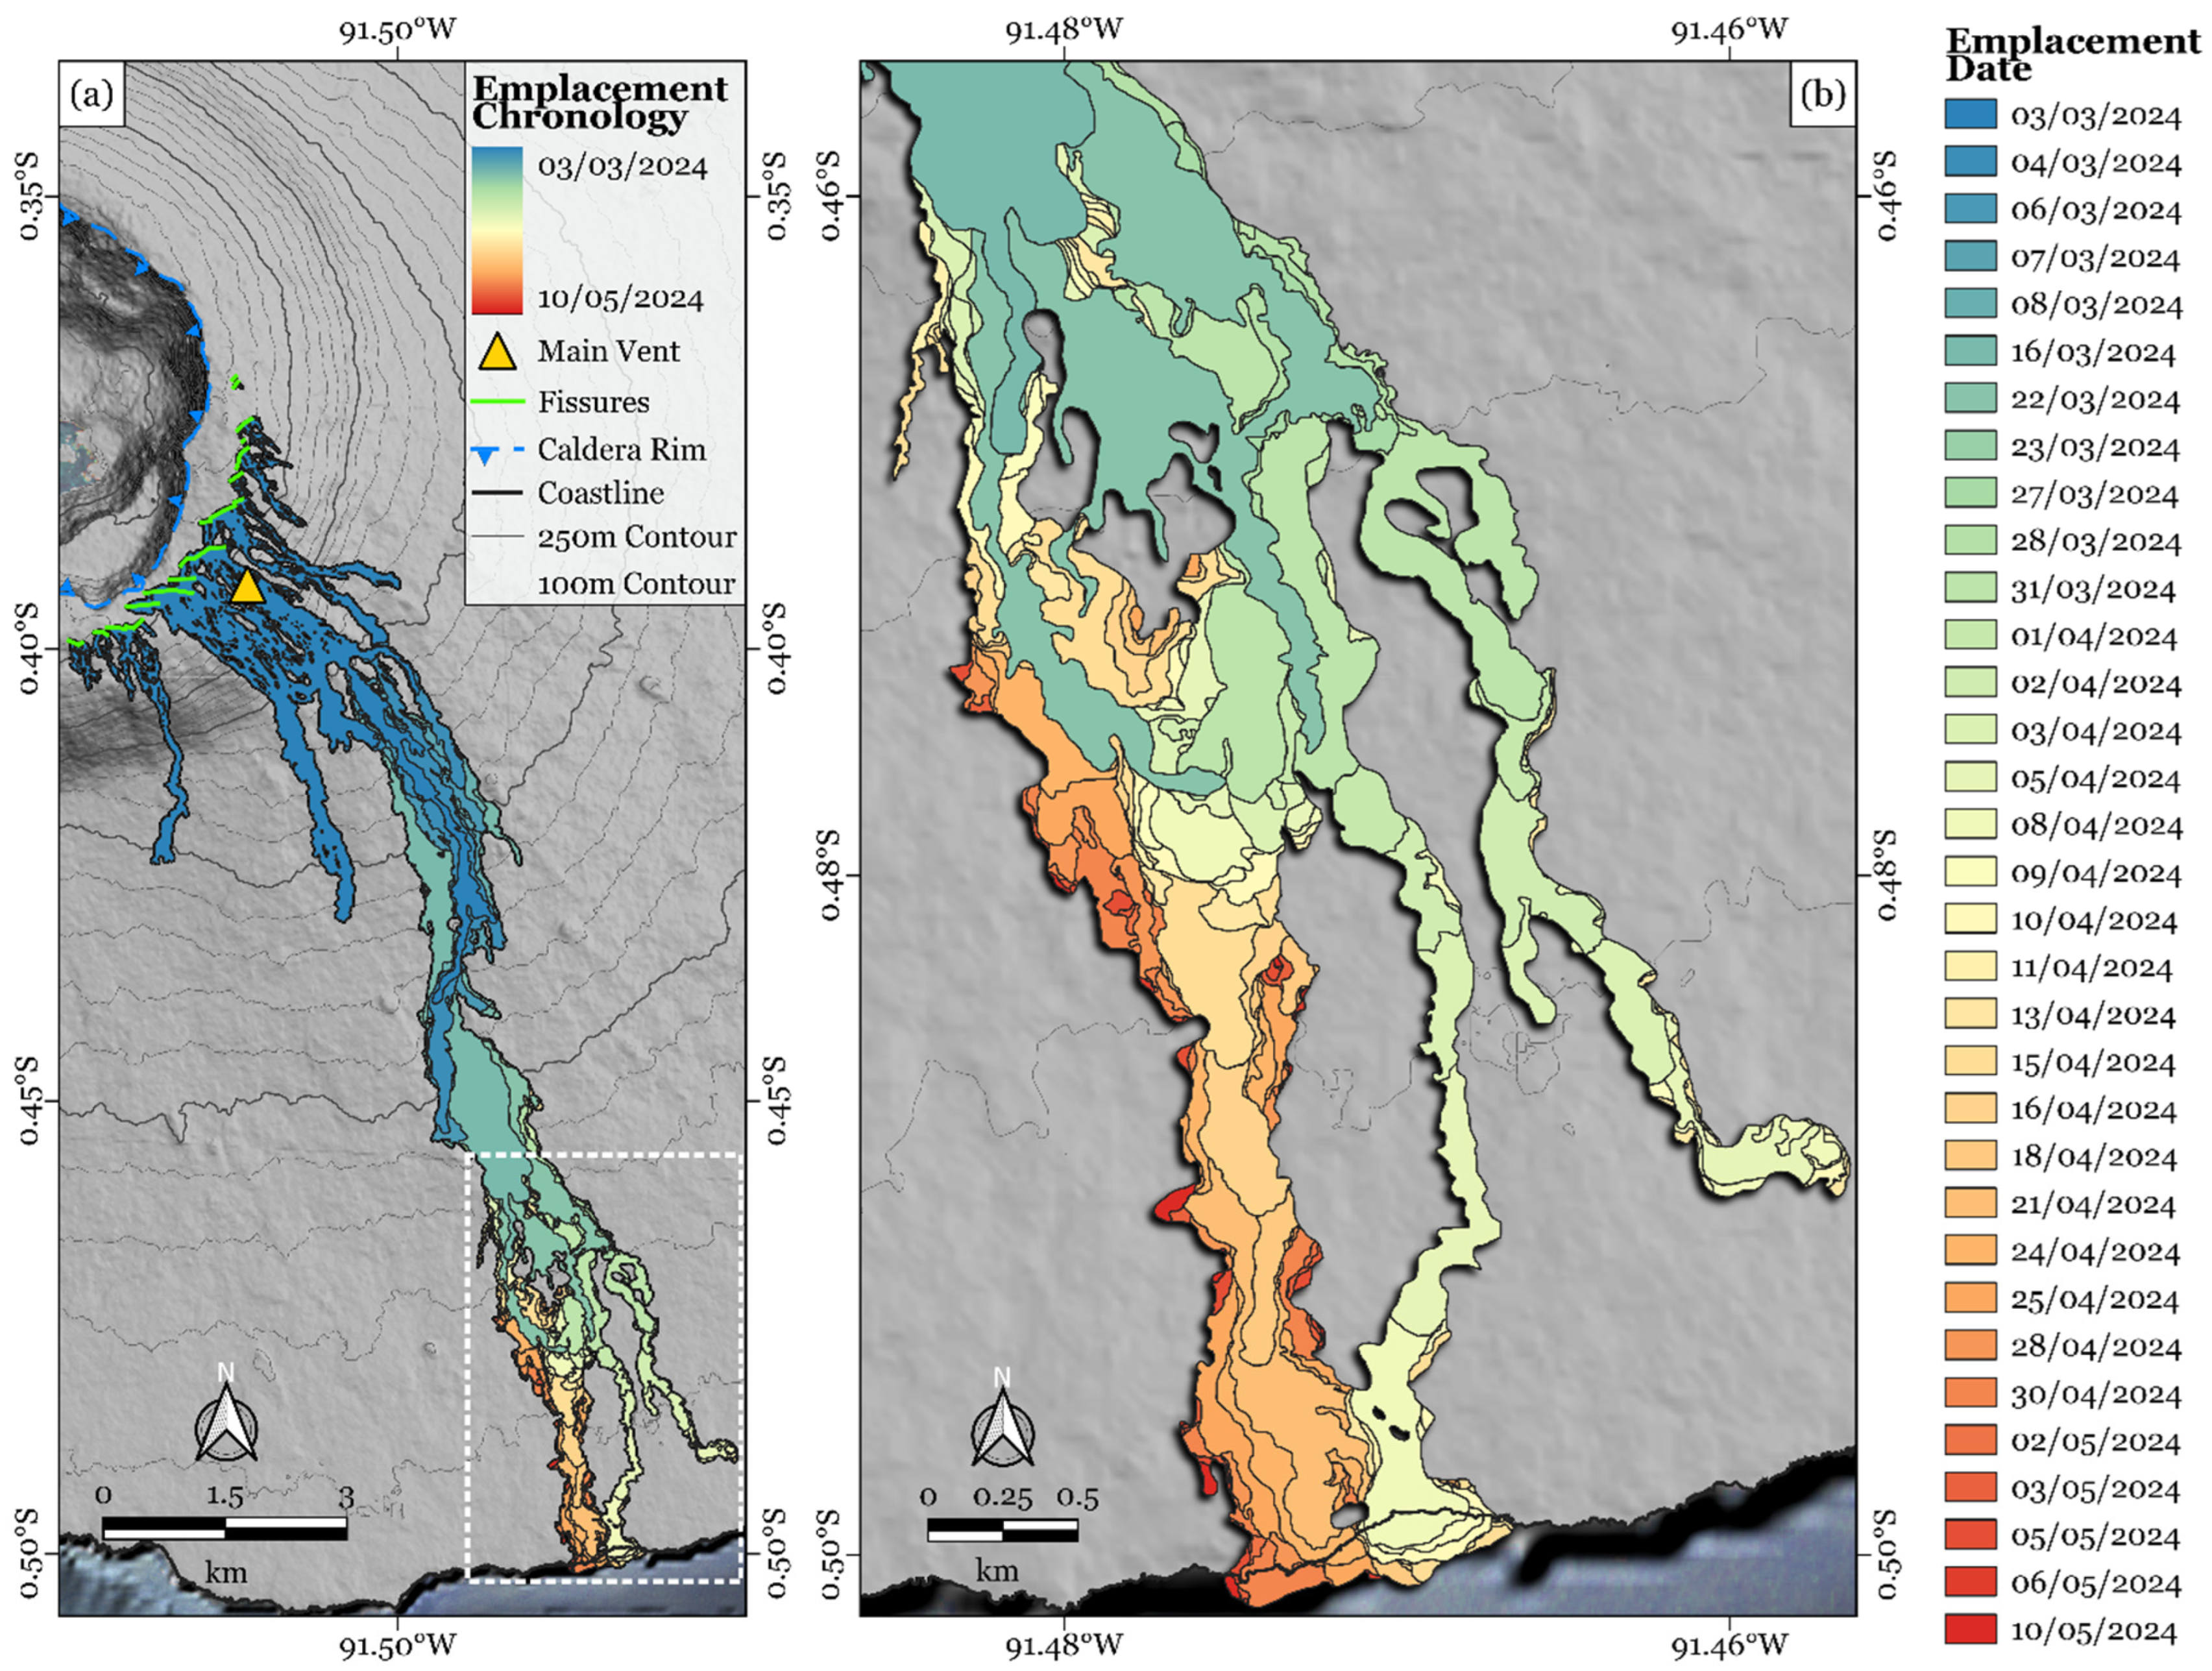
3.2. Lava Flow Evolution for Situational Awareness

As the eruption proceeds, situational awareness may become more difficult to maintain, especially during long-lived eruptions where field observations, reports, and direct information become increasingly rare. Satellite data were continuously updated to monitor the progress of the effusion, the erupted lava volume, the lava flow area, and its advancement (Figure 7). Particular attention was given to promptly detecting and communicating changes in the eruptive trend or flow’s advancement through maps and time series.
Between 5 and 10 March, the TADR fluctuated between ~20 and ~30 m3/s but without making any front advance (Figure 7a–d). This activity produced the emplacement of flow units parallel to and partially overlapping Unit 3, causing the flow field to enlarge its area without producing a substantial elongation of active units (which remained within 6 km of maximum length (Figure 7c,d)). Starting on 10 March, a gently declining TADR trend was accompanied by a new phase of lengthening (black arrow in Figure 7d). The renewed advancement persisted for about 10 days, with an average flow front velocity of ~0.021 km/h (thus two orders of magnitude lower than the initial phase), leading the active flow front to a reach distance of 10.0 ± 1 km on 20 March (Figure 7d,e).
A clear reduction in the effusion rate occurred between 16 and 23 March (from 15 to 2 m3/s) and caused the active front to retract again, reaching a maximum distance of 7.8 ± 1 km from the vent (Figure 7a–d). Since 24 March, the effusive activity, slightly reinvigorated, brought an increase of the TADR, 3 days later, up to 8.5 ± 4.2 m3/s. This renewed effusive activity produced a third phase of lengthening, with the active front(s) advancing anew, with an average velocity of 0.017 km/h (Figure 7d,e). Although the total area of the flow continued to increase, since late March, the active “hot” area, detected by SWIR images, was strongly reduced (Figure 7b), likely due to a change in the emplacement style, with the development of a main lava tube system (cfr. Figure 8 and Figure 9). At this stage, the upper lava field, at an elevation higher than 250 m a.s.l., appeared to be thermally well insulated, as shown by the sequence of thermal maps in the insets of Figure 8a. By April 2, the tube system fed three advancing pahoehoe flow branches that reached ~10.6 km from the vent and were located ~1.9 km from the coast (Figure 8b). Based on the spatially scattered structure of the thermal anomalies and the absence of a radiating lava channel, we inferred that these flow units were characterized by pahoehoe lava. On April 3, at 07:50 UTC (Figure 8a), the flow fronts were still active, and we estimated that the distance to the coast was reduced to ~1.5 ± 0.375 km (Figure 7d). On the same day, an email was sent to IG-EPN to update the situation and to advise that, due to under-current feeding conditions (TADR of 5.4 ± 2.7 m3/s; advancement rate ~0.017 ± 0.009 km/h), the lava flow could reach the coast in the following 3–4 days. By that time, the flow field had already covered an area of 13.0 ± 0.45 km2, with a total volume of 46 ± 23 Mm3 (Figure 7b,c).
The slow progression of pahoehoe branches was recorded by MIR imagery also in the following days and, on April 8, a Landsat 8 image confirmed that one branch had reached the coast and was building a new lava delta about 300 m wide (Figure 9e). A second active branch, to the east of the first, was located about 1 km from the coast (graphical abstract).
After the entry of the flow into the sea, the eruption continued with a steady declining trend, during which, the gentle effusion rate (TADR < 5 m3/s) fed the gradual areal and volumetric growth of the distal lava field. This occurred through the opening of several breakouts, giving rise to resurfacing processes and the superposition of numerous flow units, typical of a pahoehoe flow field (Figure 9). The eruption ended on May 8, as evidenced by the sudden drop in the recorded TADR (Figure 7a). The Landsat 8 image of May 10 (Figure 9h) corroborates the above, revealing a marked fall in high-temperature thermal anomalies, confirming the end of the eruptive activity. After 68 days of activity, the lava flow had covered a total area of 14.9 ± 0.5 km2, building a new delta of 0.123 km2. The final erupted volume was 58.5 ± 29.2 Mm3 (Figure 5).
The sequence of high-resolution SWIR (Figure 9a–h) and TIR (Figure 9i–p) images analyzed throughout the eruption permitted us to decode the changing emplacement style and allowed us to track the development of a master tube system that fed the distal lava field (7–8 km from the vent). The tube was clearly recognizable in the SWIR imagery by the alignment of highly radiating spots (skylights) that revealed its underground path (Figure 9d). According to our data, the transition from channel- to tube-fed occurred between 16 and 23 March, once TADRs remained permanently below 10 m3/s (Figure 7a). This transition changed the insulation condition of the flow, as evidenced by the clear decrease in the SWIR-derived active hot area (Figure 7c) as well as by the TIR images acquired by ASTER (Figure 9i–p). The development of a well-insulated lava transport system (master lava tube) was likely the determining factor for the slow but inexorable progression of the pahoehoe flow units, despite the low effusion rates [82].

4. Discussion

The Fernandina eruption allowed us to assess the effectiveness of satellite infrared data in rapidly responding to an effusive eruption that would have otherwise been barely monitorable, given the limited ground-based monitoring network. We demonstrated that the information provided not only enables users to assess the impact of the lava flow(s) on the territory, but it also offers a robust and continuous stream of data on the eruption’s progress, supporting situational awareness and facilitating the timely assessment, revision, and updating of expected scenarios.
During the very early stages of any eruption, one of the most important pieces of information to be obtained is the position of the eruptive vent. This cannot always be precisely recognized on the ground or by overflight, especially in poorly monitored volcanoes. In the case of Fernandina, VIIRS data allowed us to approximately locate the position of the vent with a delay of about 2 h (Figure 5b), a time sufficient to prepare any mitigation interventions. However, the exact position of the vent was confirmed only 48 h after the start of the eruption, when the PlanetScope image was made available (Figure 5c). It should be noted, however, that these timeframes were possible due to the optimal weather and could be significantly delayed under adverse meteorological conditions.
The effusion rate is the other fundamental parameter to be rapidly obtained because it controls the path and advance of a lava flow [83]. This parameter is used as input in most fluid dynamic models for lava flow simulation [16,84,85,86]. If the vent location, TADRs, and volumes are promptly delivered, then they can be ingested into lava flow propagation models to forecast the area potentially at risk of inundation and generate short-term hazard maps within the first few hours following the eruption’s onset [20,23,86]. The Fernandina case reveals how the most dramatic phase occurred in the initial hours of the eruption, when the high TADR (>200 m3/s) fed a fast-moving lava flow that advanced at a speed > 2 km/h (Figure 6). The subsequent significant reduction in TADR greatly slowed the flow, which eventually halted its advancement after 7.8 km. This dynamic (initial effusive burst) is quite common in basaltic volcanoes [87], and it highlights how a rapid response is crucial, especially in the first 24 h of an eruption, when timely access to accurate, multiparametric information can have a substantial impact on the short-term risk mitigation operations.
The Fernandina eruption also shows how the emplacement mode changed from channel- to tube-fed, as the eruption progressed and slowed. This transition meant that, although the effusive rate gradually decreased to values below 5 m3/s (Figure 7a), the flow continued to advance, invading new areas through slow pulses of pahoehoe flow units, until it reached the sea at a distance of 12.5 km from the vent (Figure 7d). This progression and the subsequent construction of a compound lava field are difficult to replicate with commonly used deterministic models since the formation of lava tubes and the opening of breakouts remain unpredictable phenomena that require continuous updating of the input parameters [20]. Therefore, it is essential to continually evaluate the emplacement style, because it can strongly influence the type and the effectiveness of the propagation models used. For this purpose, infrared data are of fundamental importance, because they allow us to evaluate the degree of thermal insulation, which, in turn, strongly affects the ability of a lava flow to advance [82].
Finally, trend analysis plays a primary role in evaluating ongoing activity and assessing possible medium- and long-term scenarios. For example, the rough extrapolation of the flow front velocity described in Section 3.2 allowed us to predict the arrival of lava on the coast 4–5 days in advance. The eruption was also characterized by a quasi-exponential decrease of the TADR (Figure 8), typical of pressurized basaltic volcanoes [88]. This trend is commonly indicative of a gradual decompression of the magmatic system, which tends to exhaust its elastic energy over time [88]. Actually, its recognition, even if briefly interrupted at times, was qualitatively used to hypothesize the gradual exhaustion of the effusive activity as the eruption progressed.
More quantitative analyses may be tentatively used to predict the final erupted lava volume and duration [87,88] by assuming that the eruption follows a decay pattern governed by the following single or double exponential law:
Single:   Q t = a · e x p t / τ
Double:   Q t = a 1 · e x p t / τ 1 + a 2 · e x p   t / τ 2
where Q t is the effusion rate at time t, and a ,   τ ,   a 1 , τ 1 , a 2 , and τ 2 are the best-fit exponential parameters. According to these models, once the exponential parameters are obtained from fitting the data, the final erupted volume can be predicted as follows:
  V f = a τ
V f = a 1 τ 1 + a 2 τ 2
The procedure of updating fits as more monitoring data are collected allows the user to continually evaluate whether Equation (5) adequately fits the data (Figure 10(a1,a2,b1,b2)) and eventually predict the final lava volume V f through Equation (6).
The examples in Figure 10(a1,b1) show the curves obtained with the two models by fitting the data acquired during the first 10 days of eruption (blue dashed lines). The application of Equation (6) with the relative coefficients resulted in the predicted final volumes of 38.4 and 62.5 Mm3 (for the single and double exp. models, respectively) in comparison with the erupted volume of 58.5 Mm3 (Figure 10(a2,b2)). In Figure 10(a3,b3), we plotted the daily predicted V f values as more TADR data were available, and the exponential fitting parameters were updated. The analysis revealed that the single exponential model was affected by a greater misfit, and that volumes comparable to the one effectively erupted (±10%; blue lines in Figure 10(a3,b3)) would have been correctly predicted only after 80% of the total duration. On the other hand, based on the double exponential model, the final volume would have been predictable, within an error of ±10%, starting on the 22nd day of the eruption (corresponding to 33% of the total duration of the eruption).
For basaltic volcanoes, the double exponential model has been explained by the release of elastic energy from two connected magmatic sources [89] or by a single source that initially behaves elastically and subsequently behaves in a viscoelastic way [90]. Regardless of the mechanism, the double exponential model fits Fernandina’s data better, thus suggesting that the observed trend was possibly composed of two terms (Equation 6b), representing the two distinct sources/processes.
The exponential trend has been used in the past to predict the end of some basaltic eruptions, based on the criterion that this type of eruption ends when the effusion rate drops below 0.1% of the initial maximum value [87]. At Fernandina, the eruption ended when the TADR dropped below a critical rate of 2 m3/s, which is about 1% of the maximum initial value (206 m3/s; Figure 10). Although the criterion adopted by [87] was not exactly met in the Fernandina case, the sharp deviation from the trend observed on April 8 (sudden reduction in TADR; Figure 6b) suggests the existence of a critical flow rate, below which the magma path probably closes. This dynamic was observed during the Holuhraun-Bararbunga eruption [91] and could be a common feature of other Fernandina eruptions as well. Further measurements of TADR and trends on other Fernandina eruptions may shed light on the existence and value of this critical flow rate and its potential application to predict the end of these eruptions.

5. Perspective and Conclusive Remarks

The satellite data used in this work are freely available in any area of the globe, in NRT, or with minimal latency (Table 1). The approach is therefore potentially applicable to any volcano in the world, with the same temporal and spatial resolutions and a comparable degree of uncertainty.
If extended to other eruptions, such a rapid response system can support the management of flow-forming eruptions, create lava flow vulnerability models for impact assessments, facilitate the comparison of eruptions, and contribute to building a global database of effusive eruption attributes. However, to make this approach operational on a global scale using NRT products accessible to the scientific community, two key requirements must be met:
i.
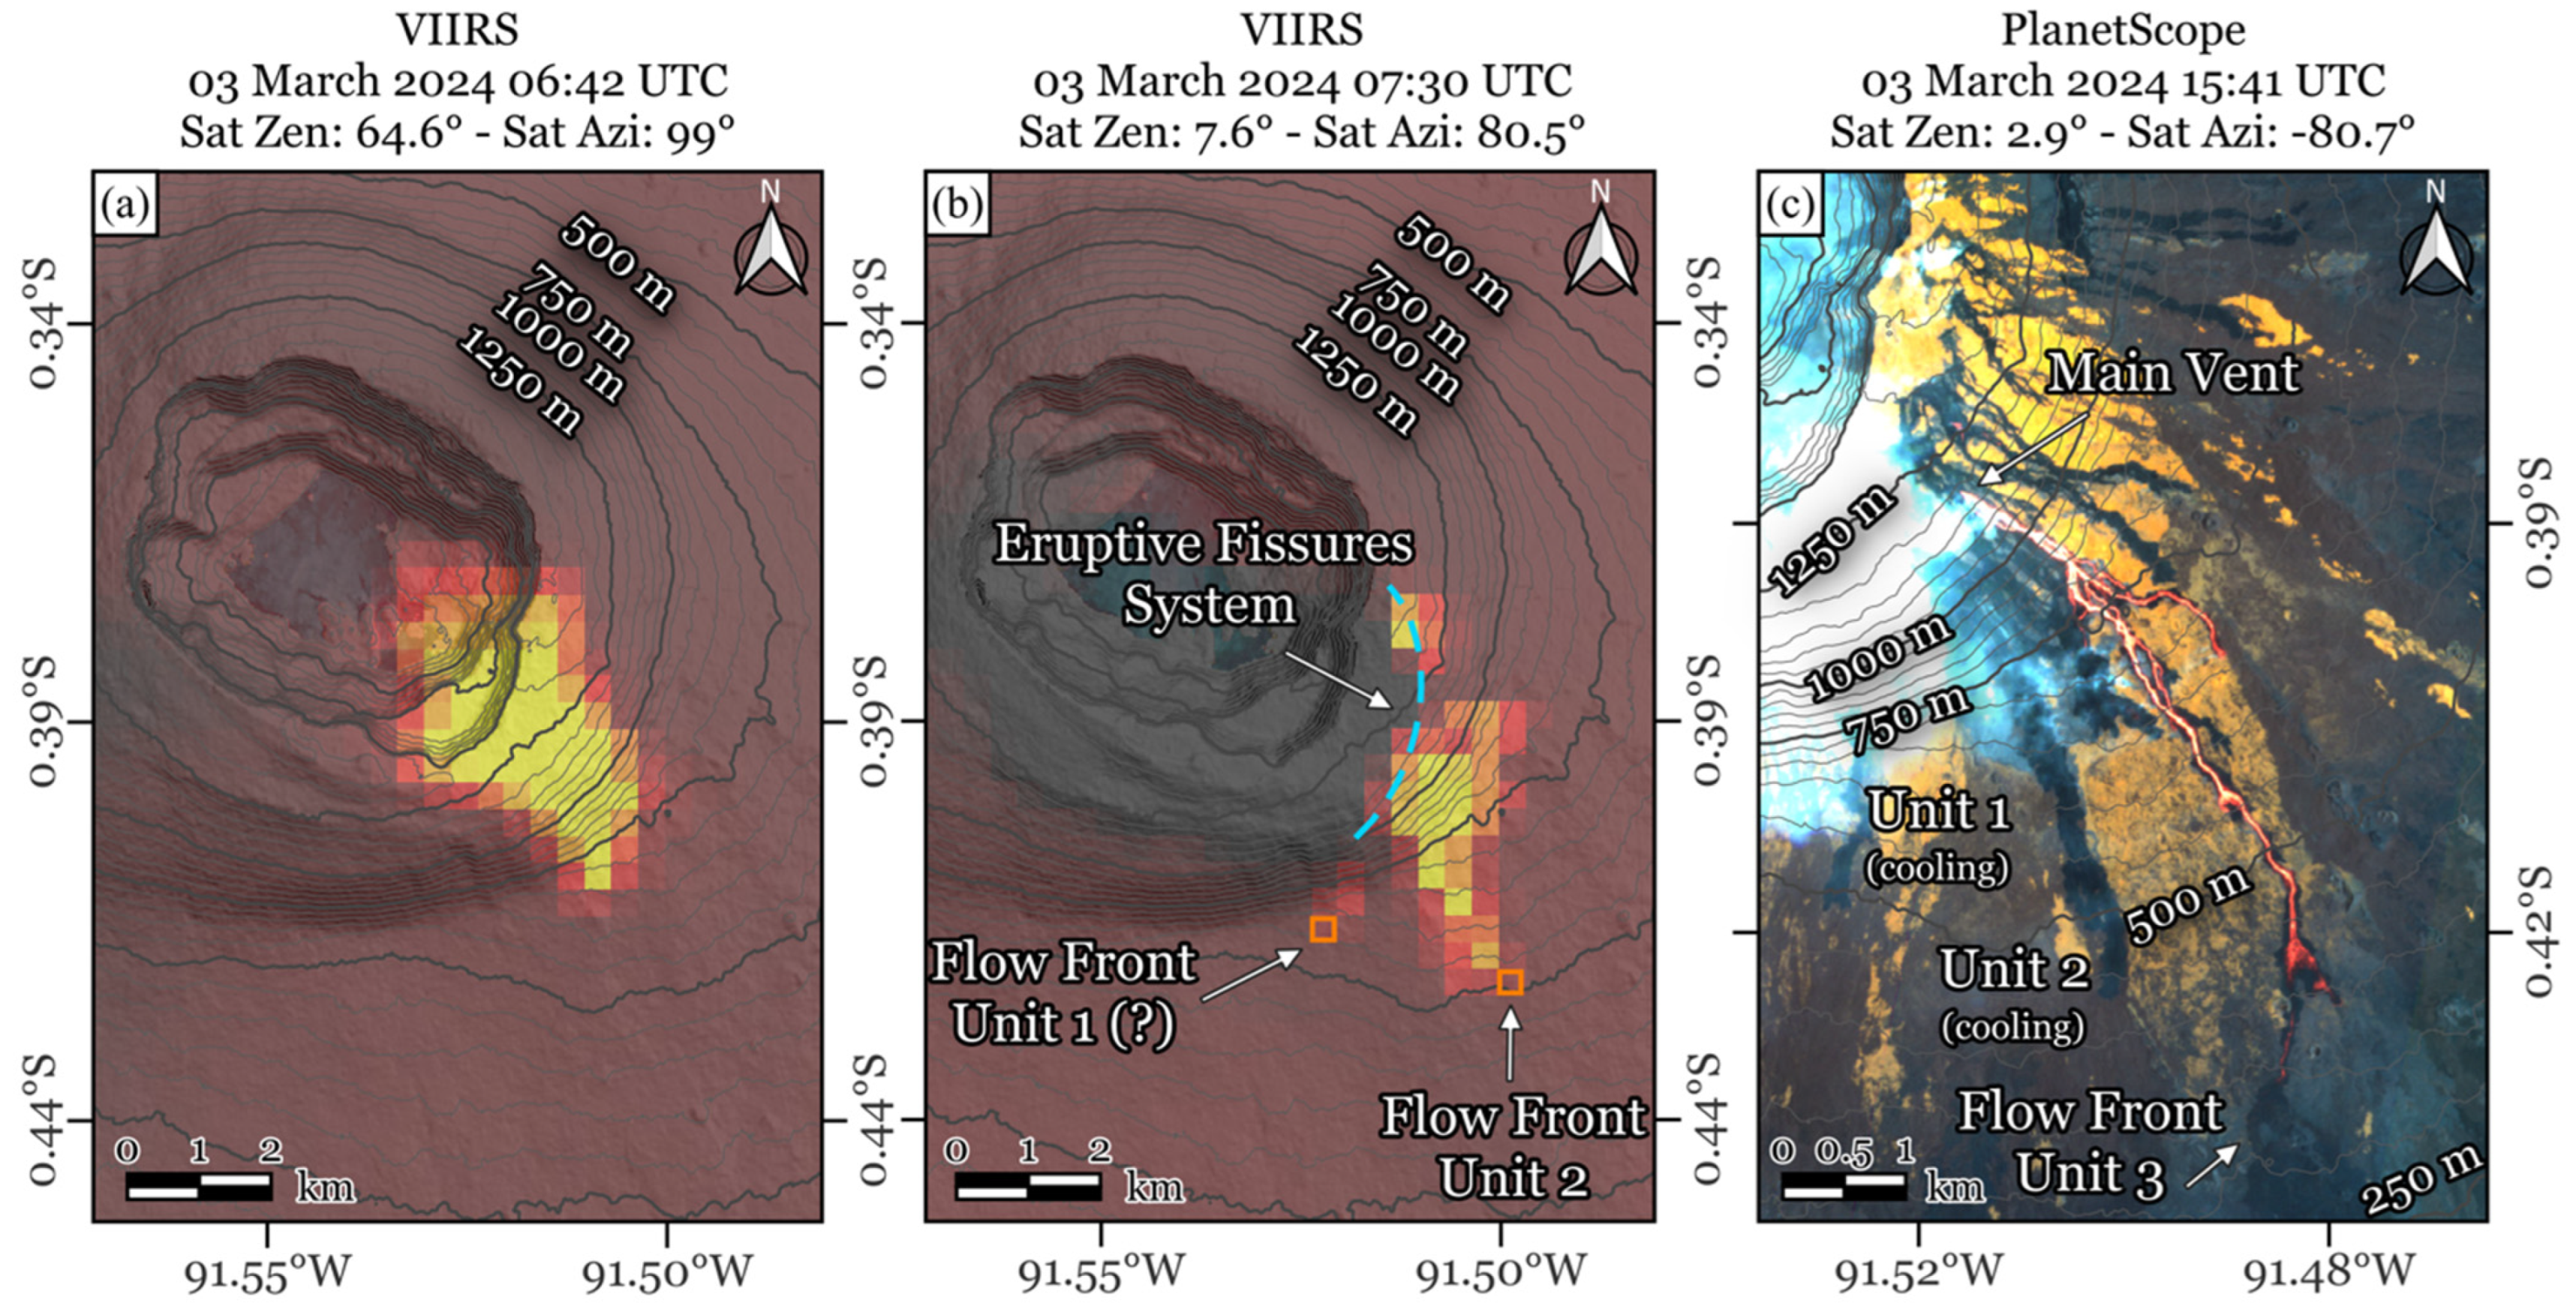
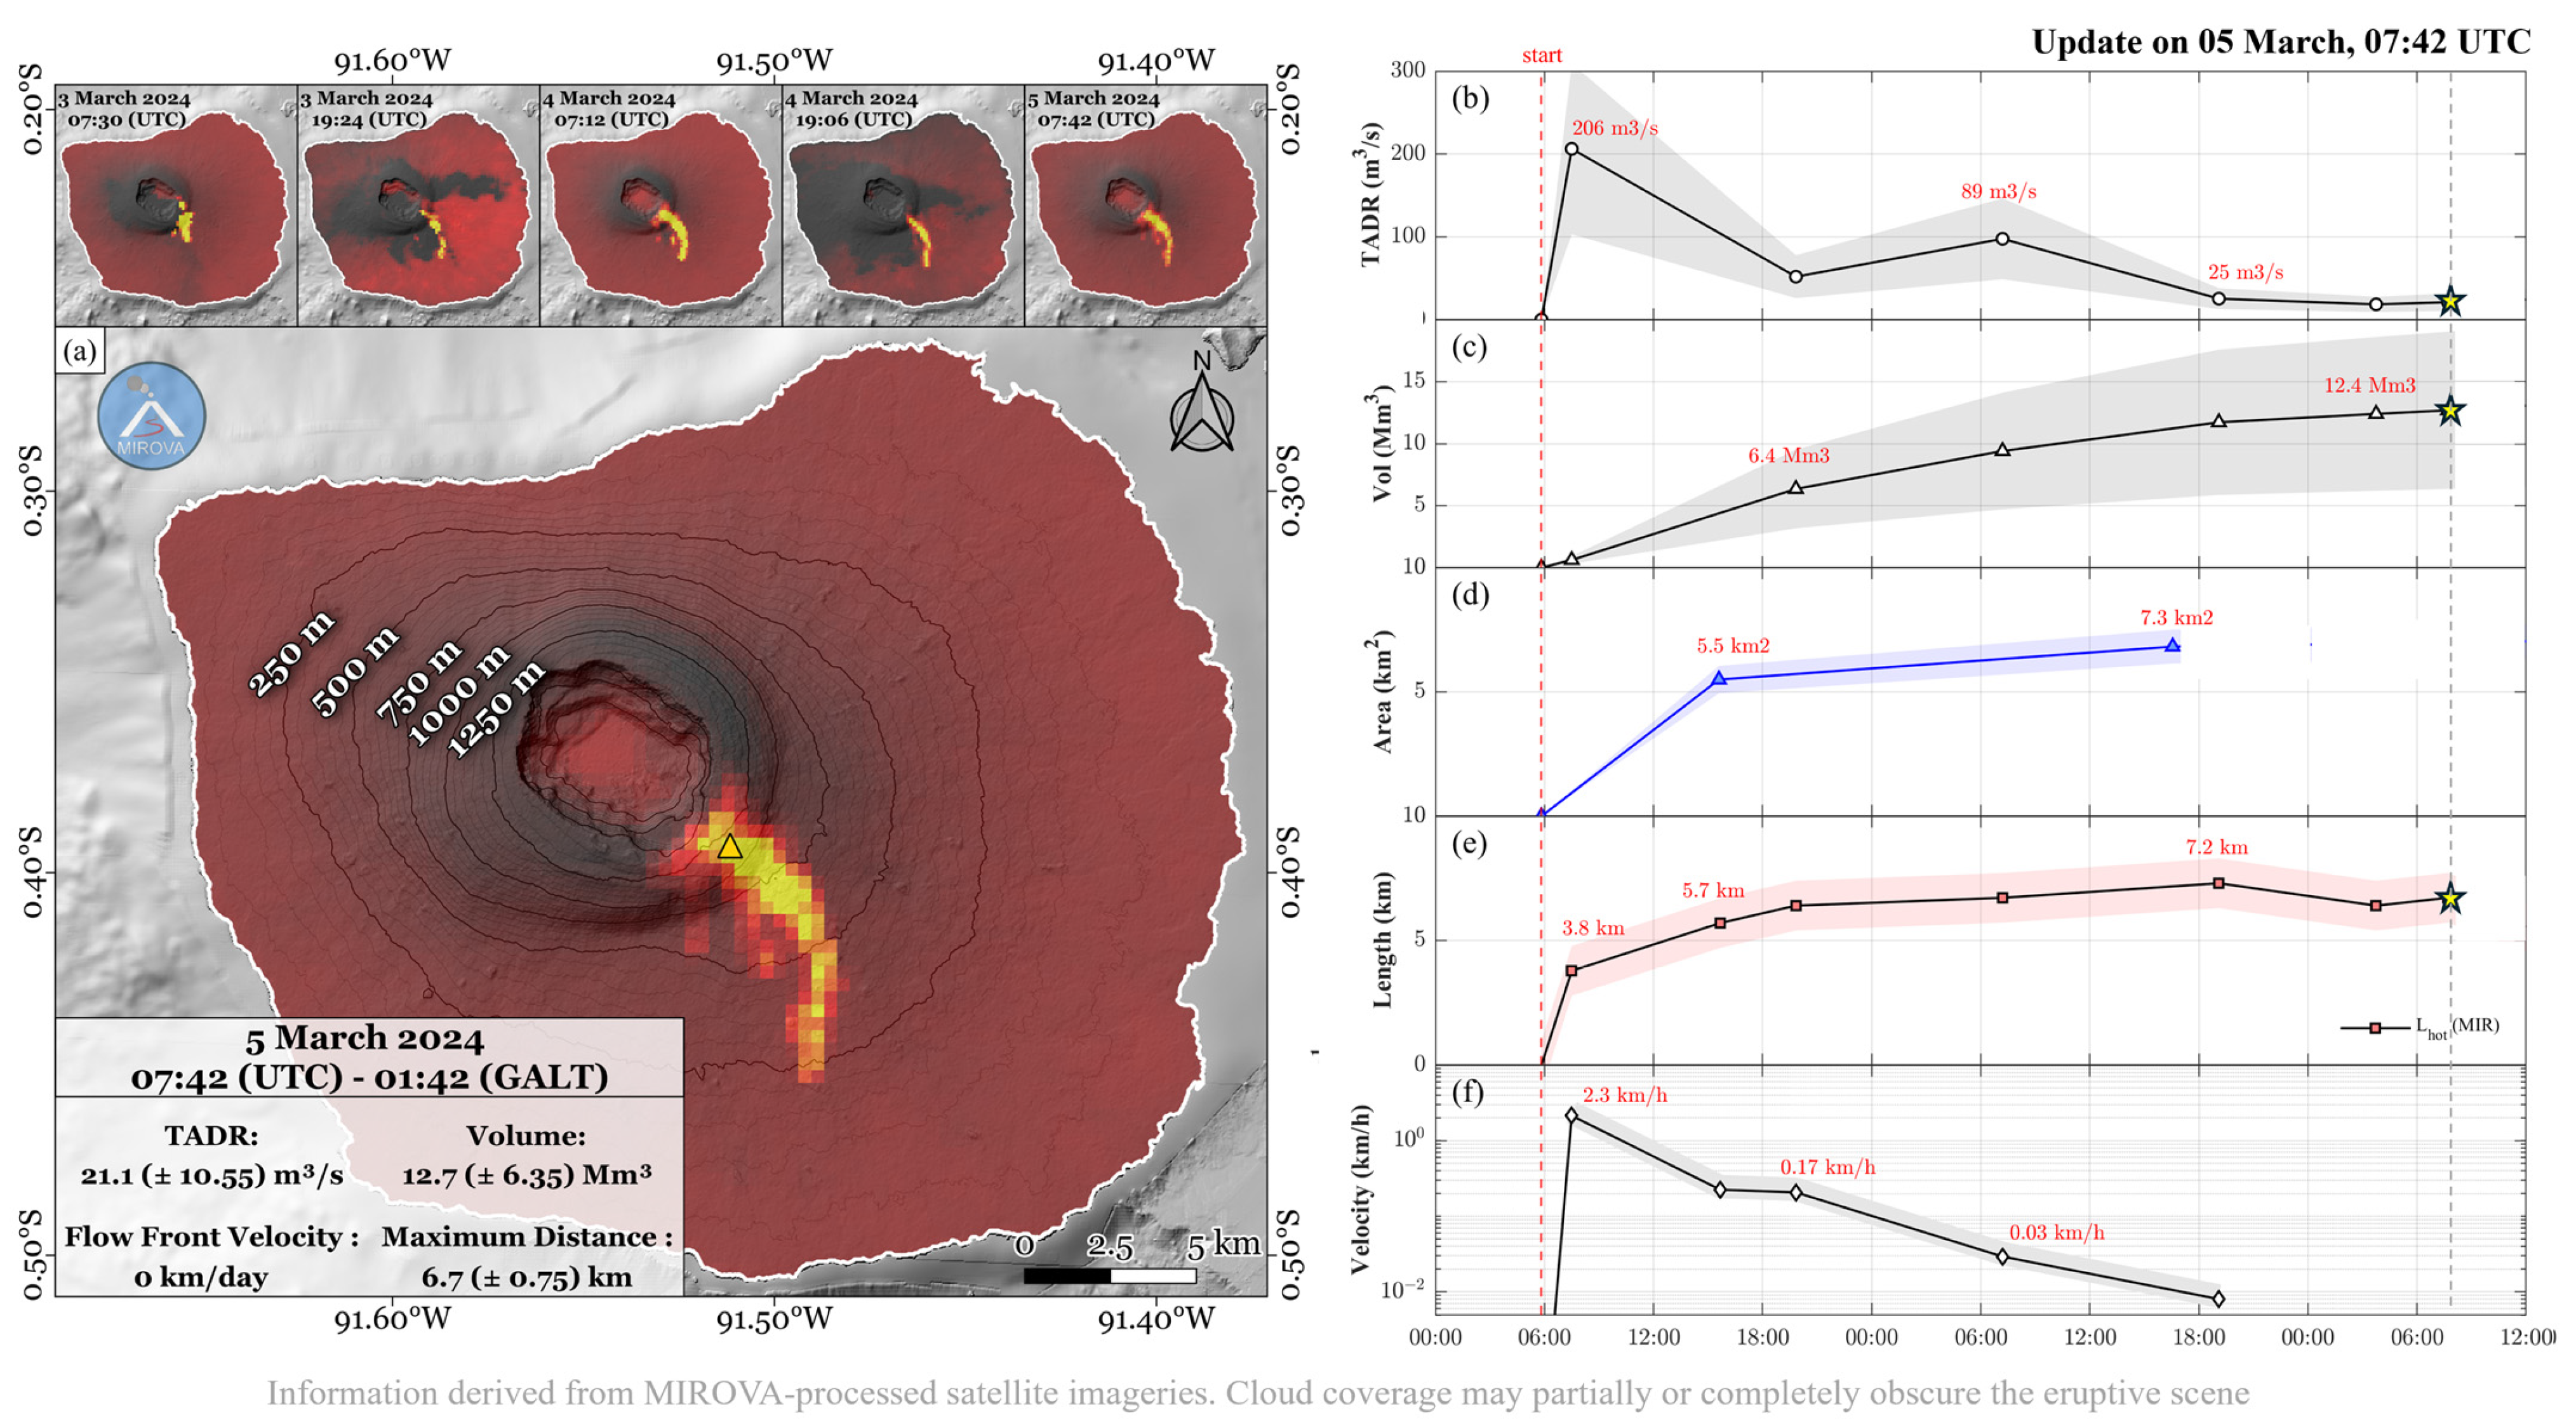
Team of Experts: the image processing chain, although partially automated, requires continuous expert supervision to manage the workflows—from raw data processing to the generation of maps and time series—as well as to ensure accurate interpretation of the products. Purely automatic systems, while very valuable for immediate initial assessment, can be misleading in the rapid response, as they lack indications of sub-pixel cloud contamination, unfavorable viewing geometry, or false alerts(s) detection. In the example of Figure 5a, without the visual interpretation and evaluation of satellite viewing conditions (which produced extreme geometric distortion of the anomaly), the first thermal alert of 3 March, 06:42 UTC, could have been easily misinterpreted as an intra-caldera eruption. If an eruption starts or shifts into the Fernandina caldera, some explosive activity could occur, due to magma interacting with the crater lake [32]. Consequently, the accurate assessment of thermal anomaly locations and their associated uncertainties is crucial for hazard evaluation. We emphasize that, for a response to be rapid, rigorous, and reliable, expert review and supervision of all images and products remain crucial and indispensable requirements.
ii.
Calibration: Two of the most important parameters, the TADR and the Vol, are derived from thermal data, using the relationship between effusion rate and instantaneous heat loss over the lava’s “active” area (assuming a time-averaged thermal budget; [92]). This thermal proxy has been declined in many variants (see [25] for a review), and the one used here involves a specific processing chain starting with the MIR radiance data, leading to the VRP, and finally ending with the TADR estimates (Section 2.3.1; Figure 3). It is necessary to underline that the conversion between VRP and TADR requires an ad hoc, volcano-specific calibration, since their relationship is influenced by the rheological and topographical conditions during the emplacement [75,93]. At present, there are several case studies where this approach has been used successfully, but a database of calibration parameters does not yet exist. Finally, we remark that the approach expects that data from multiple MIR sensors are consistent with each other to provide a homogenized time series of VRP following a data fusion technique [58,66,94,95]. At present, polar satellites represent the main source of data used for VRP estimation, especially for global volcano monitoring [26]. For this purpose, we underline that the multiplatform approach proposed here could be further enhanced by adding other polar sensors (i.e., [58]) to enhance the efficiency of satellite thermal data for volcanic surveillance.
In conclusion, we believe that the analysis of satellite infrared data is one of the most effective tools for addressing rapid response and situational awareness during effusive eruptions. Provided that the above requirements are met, we envisage that the approach is now sufficiently mature to be transformed into an operational product available to the international community.

Supplementary Materials

The following supporting information can be downloaded at: https://www.mdpi.com/article/10.3390/rs17071191/s1, S1: Timeseries.xlsx; S2: Shapefiles.zip.

Author Contributions

Conceptualization, D.C.; Methodology, D.C., S.A., A.C., M.L. and F.M.; Validation, B.B.; Formal analysis, S.A., A.C., M.L. and F.M.; Investigation, D.C. and S.A.; Writing—original draft, D.C., S.A. and F.M.; Writing—review & editing, D.C. and B.B. All authors have read and agreed to the published version of the manuscript.

Funding

This research did not receive any specific grant from funding agencies in the public, commercial, or not-for-profit sectors. S. Aveni’s work was supported by the ‘Piano Nazionale di Ripresa e Resilienza’ (PNRR). F. Massimetti’s work was supported by Universidad Nacional Autónoma de México (UNAM) Post-doctoral Program (POSDOC).

Data Availability Statement

The original contributions presented in this study are included in the article/Supplementary Materials. Further inquiries can be directed to the corresponding author(s).

Acknowledgments

We would like to thank the three anonymous reviewers for their valuable comments which helped improve the quality of the manuscript. We acknowledge the LANCE data system (https://lance.modaps.eosdis.nasa.gov/; accessed on 26 March 2025) for providing MODIS and VIIRS near real-time products, the ESA and NASA/USGS for providing Sentinel-2 and Landsat imageries via Copernicus Browser (https://browser.dataspace.copernicus.eu/; accessed on 26 March 2025), and EO Browser (https://apps.sentinel-hub.com/eo-browser/; accessed on 26 March 2025) portals. We thank the Earth Explorer system (https://earthexplorer.usgs.gov/; accessed on 26 March 2025) and the Planet portal (https://www.planet.com/; accessed on 15 June 2024) for the distribution of ASTER and PlanetScope data, respectively.

Conflicts of Interest

The authors declare no conflict of interest.

References

  1. Harris, A.J.L. Basaltic Lava Flow Hazard. In Volcanic Hazards, Risks, and Disasters; Elsevier: Amsterdam, The Netherlands, 2015; pp. 17–46. [Google Scholar] [CrossRef]
  2. Kilburn, C.R.J. Lava Flow Hazards and Modeling. In The Encyclopedia of Volcanoes; Academic Press: Cambridge, MA, USA, 2015; pp. 957–969. [Google Scholar] [CrossRef]
  3. Tsang, S.W.R.; Lindsay, J.M. Lava flow crises in inhabited areas part I: Lessons learned and research gaps related to effusive, basaltic eruptions. J. Appl. Volcanol. 2020, 9, 9. [Google Scholar] [CrossRef]
  4. Brown, S.K.; Jenkins, S.F.; Sparks, R.S.J.; Odbert, H.; Auker, M.R. Volcanic fatalities database: Analysis of volcanic threat with distance and victim classification. J. Appl. Volcanol. 2017, 6, 15. [Google Scholar] [CrossRef]
  5. Favalli, M.; Pareschi, M.T.; Neri, A.; Isola, I. Forecasting lava flow paths by a stochastic approach. Geophys. Res. Lett. 2005, 32, L03305. [Google Scholar] [CrossRef]
  6. Balagizi, C.M.; Kies, A.; Kasereka, M.M.; Tedesco, D.; Yalire, M.M.; McCausland, W.A. Natural hazards in Goma and the surrounding villages, East African Rift System. Nat. Hazards 2018, 93, 31–66. [Google Scholar] [CrossRef]
  7. Meredith, E.S.; Jenkins, S.F.; Hayes, J.L.; Lallemant, D.; Deligne, N.I.; Teng, N.R.X. Lava flow impacts on the built environment: Insights from a new global dataset. J. Appl. Volcanol. 2024, 13, 1. [Google Scholar] [CrossRef]
  8. Jenkins, S.F.; Day, S.J.; Faria, B.V.E.; Fonseca, J.F.B.D. Damage from lava flows: Insights from the 2014–2015 eruption of Fogo, Cape Verde. J. Appl. Volcanol. 2017, 6, 6. [Google Scholar] [CrossRef]
  9. Poland, M.; Orr, T.R.; Kauahikaua, J.P.; Brantley, S.R.; Babb, J.L.; Patrick, M.R.; Neal, C.A.; Anderson, K.R.; Antolik, L.; Burgess, M.; et al. The 2014–2015 Pāhoa lava flow crisis at Kīlauea Volcano, Hawai’i: Disaster avoided and lessons learned. GSA Today 2015, 26, 4–10. [Google Scholar] [CrossRef]
  10. Meredith, E.S.; Jenkins, S.F.; Hayes, J.L.; Deligne, N.I.; Lallemant, D.; Patrick, M.; Neal, C. Damage assessment for the 2018 lower East Rift Zone lava flows of Kīlauea volcano, Hawai’i. Bull. Volcanol. 2022, 84, 65. [Google Scholar] [CrossRef]
  11. Biass, S.; Reyes-Hardy, M.-P.; Gregg, C.; Di Maio, L.S.; Dominguez, L.; Frischknecht, C.; Bonadonna, C.; Perez, N. The spatiotemporal evolution of compound impacts from lava flow and tephra fallout on buildings: Lessons from the 2021 Tajogaite eruption (La Palma, Spain). Bull. Volcanol. 2024, 86, 10. [Google Scholar] [CrossRef]
  12. Gouhier, M.; Pinel, V.; Belart, J.M.C.; De Michele, M.; Proy, C.; Tinel, C.; Berthier, E.; Guéhenneux, Y.; Gudmundsson, M.T.; Óskarsson, B.V.; et al. CNES-ESA satellite contribution to the operational monitoring of volcanic activity: The 2021 Icelandic eruption of Mt. Fagradalsfjall. J. Appl. Volcanol. 2022, 11, 10. [Google Scholar] [CrossRef]
  13. Pedersen, G.B.M.; Pfeffer, M.A.; Barsotti, S.; Tarquini, S.; d’Michieli Vitturi, M.; Óladóttir, B.A.; Þrastarson, R.H. Lava flow hazard modeling during the 2021 Fagradalsfjall eruption, Iceland: Applications of MrLavaLoba. Nat. Hazards Earth Syst. Sci. 2023, 23, 3147–3168. [Google Scholar]
  14. Wantim, M.N.; Bonadonna, C.; Gregg, C.E.; Menoni, S.; Frischknecht, C.; Kervyn, M.; Aynghe, S.N. Forensic assessment of the 1999 Mount Cameroon eruption, West-Central Africa. J. Volcanol. Geotherm. Res. 2018, 358, 13–30. [Google Scholar]
  15. Wilson, G.; Wilson, T.; Deligne, N.I.; Cole, J.W. Volcanic hazard impacts to critical infrastructure: A review. J. Volcanol. Geotherm. Res. 2014, 286, 148–182. [Google Scholar] [CrossRef]
  16. Harris, A.J.L.; Rhéty, M.; Gurioli, L.; Villeneuve, N.; Paris, R. Simulating the thermorheological evolution of channel-contained lava: FLOWGO and its implementation in EXCEL. Geol. Soc. Lond. Spec. Pub. 2016, 426, 313–336. [Google Scholar] [CrossRef]
  17. International Charter Annual Report, 2023. Available online: https://disasterscharter.org/cos-api/api/file/public/article-image/25983038 (accessed on 22 March 2025).
  18. CEMS (Copernicus Emergency Management Service). Web Resource. Available online: https://emergency.copernicus.eu/mapping/sites/default/files/files/CopEMS_FlyerRM-RRM_1.0_2021_0.pdf (accessed on 27 January 2025).
  19. Vicari, A.; Ganci, G.; Behncke, B.; Cappello, A.; Neri, M.; Del Negro, C. Near-real-time forecasting of lava flow hazards during the 12–13 January 2011 Etna eruption. Geophys. Res. Lett. 2011, 38, L13317. [Google Scholar] [CrossRef]
  20. Harris, A.J.L.; Chevrel, M.O.; Coppola, D.; Ramsey, M.S.; Hrysiewicz, A.; Thivet, S.; Villeneuve, N.; Favalli, M.; Peltier, A.; Kowalski, P.; et al. Validation of an integrated satellite-data-driven response to an effusive crisis: The April–May 2018 eruption of Piton de la Fournaise. Ann. Geophys. 2019, 61, AC48. [Google Scholar] [CrossRef]
  21. Laiolo, M.; Ripepe, M.; Cigolini, C.; Coppola, D.; Della Schiava, M.; Genco, R.; Innocenti, L.; Lacanna, G.; Marchetti, E.; Massimetti, F.; et al. Space- and ground-based geophysical data tracking of magma migration in shallow feeding system of Mount Etna Volcano. Remote Sens. 2019, 11, 1182. [Google Scholar] [CrossRef]
  22. Corradini, S.; Guerrieri, L.; Stelitano, D.; Salerno, G.; Scollo, S.; Merucci, L.; Prestifilippo, M.; Musacchio, M.; Silvestri, M.; Lombardo, V.; et al. Near Real-Time Monitoring of the Christmas 2018 Etna Eruption Using SEVIRI and Products Validation. Remote Sens. 2020, 12, 1336. [Google Scholar] [CrossRef]
  23. Chevrel, M.O.; Villeneuve, N.; Grandin, R.; Froger, J.-L.; Coppola, D.; Massimetti, F.; Campus, A.; Hrysiewicz, A.; Peltier, A. Lava Flow Daily Monitoring: The Case of the 19 September–5 October 2022 Eruption at Piton De La Fournaise. Volcanica 2023, 6, 391–404. [Google Scholar] [CrossRef]
  24. Harris, A.J.L.; Villeneuve, N.; Di Muro, A.; Ferrazzini, V.; Peltier, A.; Coppola, D.; Favalli, M.; Bachèlery, P.; Froger, J.-L.; Gurioli, L.; et al. Effusive crises at Piton de la Fournaise 2014–2015: A review of a multi-national response model. J. Appl. Volcanol. 2017, 6, 11. [Google Scholar] [CrossRef]
  25. Coppola, D.; Barsotti, S.; Cigolini, C.; Laiolo, M.; Pfeffer, M.; Ripepe, M. Monitoring the time-averaged discharge rates, volumes, and emplacement style of large lava flows by using the MIROVA system: The case of the 2014–2015 eruption at Holuhraun (Iceland). Ann. Geophys. 2019, 61, 1–29. [Google Scholar] [CrossRef]
  26. Coppola, D.; Laiolo, M.; Cigolini, C.; Massimetti, F.; Delle Donne, D.; Ripepe, M.; Arias, H.; Barsotti, S.; Parra, C.B.; Centeno, R.G.; et al. Thermal remote sensing for global volcano monitoring experiences from the Mirova system. Front. Earth Sci. 2020, 7, 362. [Google Scholar] [CrossRef]
  27. Ganci, G.; Vicari, A.; Cappello, A.; Del Negro, C. An emergent strategy for volcano hazard assessment: From thermal satellite monitoring to lava flow modeling. Remote Sens. Environ. 2012, 119, 197–207. [Google Scholar] [CrossRef]
  28. Hyman, D.M.R.; Dietterich, H.R.; Patrick, M.R. Toward next-generation lava flow forecasting: Development of a fast, physics-based lava propagation model. J. Geophys. Res. Solid Earth 2022, 127, e2022JB024998. [Google Scholar] [CrossRef]
  29. Vasconez, F.J.; Anzieta, J.C.; Vásconez Müller, A.; Bernard, B.; Ramón, P. A Near Real-Time and Free Tool for the Preliminary Mapping of Active Lava Flows during Volcanic Crises: The Case of Hotspot Subaerial Eruptions. Remote Sens. 2022, 14, 3483. [Google Scholar] [CrossRef]
  30. Pritchard, M.E.; Poland, M.; Reath, K.; Andrews, B.; Bagnardi, M.; Biggs, J.; Carn, S.; Coppola, D.; Ebmeier, S.K.; Furtney, M.A.; et al. Optimizing Satellite Resources for the Global Assessment and Mitigation of Volcanic Hazards—Suggestions from the USGS Powell Center Volcano Remote Sensing Working Group; U.S., Geological Survey Scientific Investigations Report 2022–5116: Reston, VA, USA, 2022; 69p. [Google Scholar] [CrossRef]
  31. Kurz, M.D.; Rowland, S.K.; Curtice, J.; Saal, A.E.; Naumann, T. Eruption Rates for Fernandina Volcano. In The Galápagos: A Natural Laboratory for the Earth Sciences; Geophysical Monograph Series V. 204; Harpp, K.S., Mittelstaedt, E., d’Ozouville, N., Graham, D.W., Eds.; American Geophysical Union: Washington, DC, USA, 2014; pp. 41–54. [Google Scholar] [CrossRef]
  32. Howard, K.A.; Simkin, T.; Geist, D.J.; Merlen, G.; Nolf, B. Large Hydromagmatic Eruption Related to Fernandina Volcano’s 1968 Caldera Collapse—Deposits, Landforms, and Ecosystem Recovery. In Field Volcanology: A Tribute to the Distinguished Career of Don Swanson; Poland, M.P., Garcia, M.O., Camp, V.E., Grunde, A., Eds.; Geological Society of America: Boulder, CO, USA, 2019. [Google Scholar]
  33. Kurz, M.D.; Rowland, S.; Curtice, J.; Saal, A.; Naumann, T. Eruption rates at Fernandina volcano, Galápagos archipelago, from cosmogenic helium in surficial lava flows. Eos Trans. AGU 2005, 86, Abstract U33A-0016. [Google Scholar]
  34. Dvorak, J.J.; Dzurisin, D. Variations in magma supply rate at Kilauea Volcano, Hawaii. J. Geophys. Res. 1993, 98, 22255–22268. [Google Scholar] [CrossRef]
  35. Geist, D.; Naumann, T.; Larson, P. Evolution of Galapagos magmas: Mantle and crystal fractionation without assimilation. J. Petrol. 1998, 39, 953–971. [Google Scholar] [CrossRef]
  36. Allan, J.F.; Simkin, T. Fernandina Volcano’s evolved, well-mixed basalts: Mineralogical and petrological constraints on the nature of the Galapagos plume. J. Geophys. Res. 2000, 105, 6017–6041. [Google Scholar] [CrossRef]
  37. Chadwick, W.; Jónsson, S.; Geist, D.; Poland, M.; Johnson, D.; Batt, S.; Harpp, K.; Ruiz, A. The May 2005 eruption of Fernandina volcano, Galàpagos: The first circumferential dike intrusion observed by GPS and InSAR. Bull. Volcanol. 2011, 73, 679–697. [Google Scholar] [CrossRef]
  38. Bagnardi, M.; Amelung, F. Space-geodetic evidence for multiple magma reservoirs and subvolcanic lateral intrusions at Fernandina Volcano, Galápagos Islands. J. Geophys. Res. 2012, 117, B10406. [Google Scholar] [CrossRef]
  39. Bagnardi, M.; Amelung, F.; Poland, M.P. A new model for the growth of basaltic shields based on deformation of Fernandina volcano, Galápagos Islands. Earth Planet. Sci. Lett. 2013, 377, 358–366. [Google Scholar] [CrossRef]
  40. Pepe, S.; Castaldo, R.; De Novellis, V.; D’Auria, L.; De Luca, C.; Casu, F.; Sansosti, E.; Tizzani, P. New insights on the 2012–2013 uplift episode at Fernandina Volcano (Galápagos). Geophys. J. Int. 2017, 211, 673–685. [Google Scholar] [CrossRef]
  41. Galetto, F.; Reale, D.; Sansosti, E.; Acocella, V. Implications for shallow magma transfer during the 2017 and 2018 eruptions at Fernandina (Galápagos) inferred from InSAR data. J. Geophys. Res. Solid Earth 2023, 128, e2022JB026174. [Google Scholar] [CrossRef]
  42. Chestler, S.R.; Grosfils, E.B. Using numerical modeling to explore the origin of intrusion patterns on Fernandina volcano, Galapagos Islands, Ecuador. Geophys. Res. Lett. 2013, 40, 4565–4569. [Google Scholar] [CrossRef]
  43. Simkin, T.; Howard, K.A. Caldera collapse in the GalàpagosIslands, 1968. Science 1970, 169, 429–437. [Google Scholar] [CrossRef]
  44. Rowland, S.K. Slopes, lava flow volumes, and vent distributions on Volcán Fernandina, Galápagos Islands. J. Geophys. Res. 1996, 101, 27657–27672. [Google Scholar] [CrossRef]
  45. Hildreth, W. The timing of caldera collapse at Mount Katmai in response to magma withdrawal toward Norarupta. Geophys. Res. Lett. 1991, 18, 1541–1544. [Google Scholar]
  46. Vasconez, F.J.; Ramón, P.; Hernandez, S.; Hidalgo, S.; Bernard, B.; Ruiz, M. The different characteristics of the recent eruptions of Fernandina and Sierra Negra volcanoes (Galápagos, Ecuador). Volcanica 2018, 1, 127–133. [Google Scholar] [CrossRef]
  47. Reddin, E.; Ebmeier, S.; Bagnardi, M.; Bell, A.F.; Espín Bedón, P. Craters of habit: Patterns of deformation in the western Galápagos. Volcanica 2024, 7, 181–227. [Google Scholar] [CrossRef]
  48. Teasdale, R.; Geist, D.; Kurz, M.; Harpp, K. 1998 eruption at Volcán Cerro Azul, Galápagos Islands: I. Syn-Eruptive Petrogenesis. Bull. Volcanol. 2005, 67, 170–185. [Google Scholar] [CrossRef]
  49. Chandni, C.K.; Kumar, S.; Babu, A. SBAS-DInSAR analysis of January 2020 eruption of La Cumbre Volcano, Galapagos Archipelago. J. Appl. Geophys. 2022, 206, 104796. [Google Scholar] [CrossRef]
  50. Pawlowicz, R. M_Map: A Mapping Package for MATLAB. Version 1.4m, [Computer software]. 2020. Available online: www.eoas.ubc.ca/~rich/map.html (accessed on 12 November 2023).
  51. IG-EPN (2021)–Informe Volcánico Especial–Fernandina–2021–N°01. Available online: https://www.igepn.edu.ec/servicios/busqueda-informes (accessed on 19 February 2025).
  52. IG-EPN (2022)–IG Al Instante-Fernandina–2022–N°01. Available online: https://www.igepn.edu.ec/servicios/busqueda-informes (accessed on 19 February 2025).
  53. IG-EPN (2024a)–Informe Volcánico Especial–Fernandina–2024–N° 2024-001. Available online: https://www.igepn.edu.ec/servicios/noticias/2106-informe-volcanico-especial-fernandina-n-2024-001 (accessed on 19 February 2025).
  54. IG-EPN (2024b)–Informe Volcánico Especial–Fernandina–N° 2024-002. Available online: https://www.igepn.edu.ec/servicios/noticias/2111-informe-volcanico-especial-fernandina-n-2024-002) (accessed on 19 February 2025).
  55. IG-EPN (2024c)–Informe Volcánico Especial–Fernandina–N° 2024-003. Available online: https://www.igepn.edu.ec/servicios/noticias/2120-informe-volcanico-especial-fernandina-n-2024-003) (accessed on 19 February 2025).
  56. IG-EPN (2024d)–Informe Volcánico Especial–Fernandina–N° 2024-004. Available online: https://www.igepn.edu.ec/servicios/noticias/2136-informe-volcanico-especial-fernandina-n-2024-004) (accessed on 19 February 2025).
  57. Blackett, M. Early analysis of Landsat-8 thermal infrared sensor imagery of volcanic activity. Remote Sens. 2014, 6, 2282–2295. [Google Scholar] [CrossRef]
  58. Aveni, S.; Laiolo, M.; Campus, A.; Massimetti, F.; Coppola, D. The capabilities of FY-3D/MERSI-II sensor to detect and quantify thermal volcanic activity: The 2020–2023 Mount Etna case study. Remote Sens. 2023, 15, 2528. [Google Scholar] [CrossRef]
  59. Ganci, G.; Cappello, A.; Bilotta, G.; Del Negro, C. How the variety of satellite remote sensing data over volcanoes can assist hazard monitoring efforts: The 2011 eruption of Nabro volcano. Remote Sens. Environ. 2020, 236, 111426. [Google Scholar]
  60. Ganci, G.; Bilotta, G.; Zuccarello, F.; Calvari, S.; Cappello, A. A multi-sensor satellite approach to characterize the volcanic deposits emitted during Etna’s lava fountaining: The 2020–2022 study case. Remote Sens. 2023, 15, 916. [Google Scholar] [CrossRef]
  61. Proietti, C.; De Beni, E.; Cantarero, M.; Ricci, T.; Ganci, G. Rapid provision of maps and volcanological parameters: Quantification of the 2021 Etna volcano lava flows through the integration of multiple remote sensing techniques. Bull. Volcanol. 2023, 85, 58. [Google Scholar] [CrossRef]
  62. Coppola, D.; Laiolo, M.; Cigolini, C.; Delle Donne, D.; Ripepe, M. Enhanced volcanic hot-spot detection using MODIS IR data: Results from the MIROVA system. Geol. Soc. Lond. Spec. Pub. 2016, 426, 181–205. [Google Scholar] [CrossRef]
  63. Nishihama, M.; Wolfe, R.; Solomon, D.; Patt, F.; Blanchette, J.; Fleig, A.; Masuoka, E. MODIS level 1A Earth Location: Algorithm Theoretical Basis Document, version 3.0. SDST-092; MODIS Science Data Support Team: Sioux Falls, SD, USA, 1997. [Google Scholar]
  64. Cao, C.; Xiong, X.; Wolfe, R.; DeLuccia, F.; Liu, Q.; Blonski, S.; Lin, G.; Nishihama, M.; Pogorzala, D.; Oudrari, H.; et al. Visible Infrared Imaging Radiometer Suite (VIIRS) Sensor Data Record (SDR) User’s Guide; Version 1.3; NOAA Technical Report NESDIS; NESDIS: College Park, MD, USA, 2017. [Google Scholar]
  65. Cao, C.; Xiong, J.; Blonski, S.; Liu, Q.; Uprety, S.; Shao, X.; Bai, Y.; Weng, F. Suomi NPP VIIRS sensor data record verification, validation, and long-term performance monitoring. J. Geophys. Res. Atmos 2013, 118, 11664–11678. [Google Scholar] [CrossRef]
  66. Campus, A.; Laiolo, M.; Massimetti, F.; Coppola, D. The Transition from MODIS to VIIRS for Global Volcano Thermal Monitoring. Sensors 2022, 22, 1713. [Google Scholar] [CrossRef]
  67. Campus, A.; Aveni, S.; Laiolo, M.; Massimetti, F.; Coppola, D. Thermal unrest at La Fossa (Vulcano Island, Italy): The 2021–2023 VIIRS 375 m MIROVA-processed dataset. Bull. Volcanol. 2024, 86, 25. [Google Scholar] [CrossRef]
  68. Saunders-Shultz, P.; Lopez, T.; Dietterich, H.; Girona, T. Automatic identification and quantification of volcanic hotspots in Alaska using HotLINK: The hotspot learning and identification network. Front. Earth Sci. 2024, 12, 1345104. [Google Scholar] [CrossRef]
  69. Blackett, M. An Overview of Infrared Remote Sensing of Volcanic Activity. J. Imaging 2017, 3, 13. [Google Scholar] [CrossRef]
  70. Massimetti, F.; Coppola, D.; Laiolo, M.; Valade, S.; Cigolini, C.; Ripepe, M. Volcanic hot-spot detection using SENTINEL-2: A comparison with MODIS–MIROVA thermal data series. Remote Sens. 2020, 12, 820. [Google Scholar] [CrossRef]
  71. Marchese, F.; Genzano, N. Global volcano monitoring through the Normalized Hotspot Indices (NHI) system. J. Geol. Soc. 2023, 180, jgs2022-014. [Google Scholar] [CrossRef]
  72. Pieri, D.; Abrams, M. ASTER watches the world’s volcanoes: A new paradigm for volcanological observations from orbit. J. Volcanol. Geotherm. Res. 2004, 135, 13–28. [Google Scholar] [CrossRef]
  73. Ramsey, M.S.; Flynn, I.T.W. The Spatial and Spectral Resolution of ASTER Infrared Image Data: A Paradigm Shift in Volcanological Remote Sensing. Remote Sens. 2020, 12, 738. [Google Scholar] [CrossRef]
  74. Wooster, M.J.; Zhukov, B.; Oertel, D. Fire radiative energy for quantitative study of biomass burning: Derivation from the BIRD experimental satellite and comparison to MODIS fire products. Remote Sens. Environ. 2003, 86, 83–107. [Google Scholar] [CrossRef]
  75. Coppola, D.; Laiolo, M.; Piscopo, D.; Cigolini, C. Rheological control on the radiant density of active lava flows and domes. J. Volcanol. Geotherm. Res. 2013, 249, 39–48. [Google Scholar]
  76. Harris, A.J.L. Thermal Remote Sensing of Active Volcanoes: A User’s Manual; Cambridge University Press: Cambridge, UK, 2013. [Google Scholar]
  77. Aveni, S.; Laiolo, M.; Campus, A.; Massimetti, F.; Coppola, D. TIRVolcH: Thermal Infrared Recognition of Volcanic Hotspots. A single band TIR-based algorithm to detect low-to-high thermal anomalies in volcanic regions. Remote Sens. Environ. 2024, 315, 114388. [Google Scholar]
  78. Calle, A.; Casanova, J.L.; González-Alonso, F. Impact of point spread function of MSG SEVIRI on active fire detection. Int. J. Remote Sens. 2009, 30, 4567–4579. [Google Scholar] [CrossRef]
  79. Zakšek, K.; Hort, M.; Lorenz, E. Satellite and Ground Based Thermal Observation of the 2014 Effusive Eruption at Stromboli Volcano. Remote Sens. 2015, 7, 17190–17211. [Google Scholar] [CrossRef]
  80. Head, E.M.; Maclean, A.L.; Carn, S.A. Mapping lava flows from Nyamuragira volcano (1967–2011) with satellite data and automated classification methods. Geomat. Nat. Hazards Risk 2022, 4, 119–144. [Google Scholar] [CrossRef]
  81. IG-EPN (2024e)-IG Al Instante 2024-N°01. Available online: https://www.igepn.edu.ec/servicios/busqueda-informes (accessed on 19 February 2025).
  82. Harris, A.J.L.; Rowland, S.K. Effusion Rate Controls on Lava Flow Length and the Role of Heat Loss: A Review. In Studies in Volcanology: The Legacy of George Walker; Thordarson, T., Self, S., Larsen, G., Rowland, S.K., Hoskuldsson, A., Eds.; Geological Society of London: London, UK, Special Publication; 2009; IAVCEI, 2; pp. 33–51. [Google Scholar]
  83. Walker, G.P.L. Lengths of lava flows. Phil. Trans. R. Soc. London. Ser. A Math. Phys. Sci. 1973, 274, 107–118. [Google Scholar] [CrossRef]
  84. Cordonnier, B.; Lev, E.; Garel, F. Benchmarking lava-flow models. Geol. Soc. Lond. Spec. Pub. 2016, 426, SP426.7. [Google Scholar] [CrossRef]
  85. Dietterich, H.R.; Lev, E.; Chen, J.; Richardson, J.A.; Cashman, K.V. Benchmarking computational fluid dynamics models of lava flow simulation for hazard assessment, forecasting, and risk management. J. Appl. Volcanol. 2017, 6, 1–14. [Google Scholar] [CrossRef]
  86. Chevrel, M.O.; Harris, A.; Peltier, A.; Villeneuve, N.; Coppola, D.; Gouhier, M.; Drenne, S. Volcanic crisis management supported by near real-time lava flow hazard assessment at Piton de la Fournaise, La Réunion. Volcanica 2022, 5, 313–334. [Google Scholar] [CrossRef]
  87. Bonny, E.; Wright, R. Predicting the end of lava flow-forming eruptions from space. Bull. Volcanol. 2017, 79, 52. [Google Scholar] [CrossRef]
  88. Wadge, G. The variation of magma discharge during basaltic eruptions. J. Volcanol. Geotherm. Res. 1981, 11, 139–168. [Google Scholar]
  89. Aki, K.; Ferrazzini, V. Comparison of Mount Etna, Kilauea, and Piton de la Fournaise by a quantitative modeling of their eruption histories. J. Geophys. Res. 2001, 106, 4091–4102. [Google Scholar] [CrossRef]
  90. Blake, S.; Cortés, J.A. Forecasting deflation, intrusion and eruption at inflating volcanoes. Earth Planet. Sci. Lett 2018, 481, 246–254. [Google Scholar] [CrossRef]
  91. Coppola, D.; Ripepe, M.; Laiolo, M.; Cigolini, C. Modelling Satellite-derived magma discharge to explain caldera collapse. Geology 2017, 45, 523–526. [Google Scholar] [CrossRef]
  92. Harris, A.J.L.; Baloga, S.M. Lava discharge rates from satellite-measured heat flux. Geophys. Res. Lett. 2009, 36, L19302. [Google Scholar] [CrossRef]
  93. Bernard, B.; Gibson, S.; Ramon, P.; Gleeson, M.; Stock, M.; Hernandez, S.; Coppola, D.; Bagnardi, M.; Hidalgo, S. Chronology and phenomenology of the 1982 and 2015 Wolf volcano eruptions, Galápagos Archipelago. J. Volcanol. Geotherm. Res. 2019, 374, 26–38. [Google Scholar] [CrossRef]
  94. Di Bella, G.S.; Corradino, C.; Cariello, S.; Torrisi, F.; Del Negro, C. Advancing Volcanic Activity Monitoring: A Near-Real-Time Approach with Remote Sensing Data Fusion for Radiative Power Estimation. Remote Sens. 2024, 16, 2879. [Google Scholar] [CrossRef]
  95. Massimetti, F.; Laiolo, M.; Aiuppa, A.; Aveni, S.; Bitetto, M.; Campus, A.; Coltelli, M.; Cristaldi, A.; Donne, D.D.; Innocenti, L.; et al. Thermal emissions of active craters at Stromboli Volcano: Spatio-temporal insights from 10 years of satellite observations. J. Geophys. Res. Solid Earth 2024, 129, e2024JB029143. [Google Scholar] [CrossRef]
Figure 2. Schematic diagram of the workflows used for the rapid response protocol tested during the Fernandina 2024 eruption. The continuous integration of moderate spatial resolution data, processed in NRT (0.375–1 km; 1–4 h latency) with high resolution data (4–100 m; latencies > 6 h), allows for the reconstruction and delivery of nine eruptive parameters with varying degrees of information and detail (see the text and Table 1 for more explanation).
Remotesensing 17 01191 g002
Figure 3. Schematic diagram of the MIROVA NRT workflow (see the text for explanation).
Remotesensing 17 01191 g003
Figure 4. (a) Areal evolution of lava flow for the March–May 2024 Fernandina eruption. The white dashed box depicts the zoomed area presented in (b). Shapefiles of the areal evolution of the lava flow are available in the Supplementary Materials S2. The map was created with the open-source software Quantum GIS (QGIS). Stereographic World projection was created with the M_Map package [50]. The digital elevation model (DEM) was up-sampled from the Shuttle Radar Topography Mission (SRTM—NASA JPL 2013). Bathymetry was accessed from the National Oceanic and Atmospheric Administration (NOAA; https://www.ncei.noaa.gov/access/metadata/landing-page/bin/iso?id=gov.noaa.ngdc.mgg.dem:11516; accessed on 4 March 2024). Contour lines were calculated on resized SRTM. Coastlines (1:50,000 scale) were accessed free of charge from the Ecuador Geoportal at https://www.geoportaligm.gob.ec/portal/ (accessed on 4 March 2024).
Remotesensing 17 01191 g004
Figure 5. (a) First thermal image of the eruption acquired by VIIRS at 06:42 UTC on 3 March (52 min after the start of the eruption). The thermal anomaly is located on the SE edge of the caldera and extends both inside and outside (on the SE flank), remaining at an altitude higher than 600 m a.s.l. The anomaly is spread across several pixels, also over part of the caldera, and is poorly defined due to the very high satellite viewing angle (satellite zenith angle of 64°). These unfavorable viewing conditions did not allow us to ascertain whether effusive activity was ongoing inside the caldera, nor to quantify the VRP and, in turn, the TADR. (b) The second image acquired by VIIRS at 07:50 UTC on 3 March (100 min after the start of the eruption). The excellent viewing conditions allowed us to estimate an initial TADR of 206 ± 103 m3/s and to exclude the presence of lava flows inside the caldera. It also enabled us to identify a sub-circumferential ~3 km long fissure system and approximate the main vent and location, as well as locate the position of the flow front. (c) The first PlanetScope was acquired at 15:20 UTC. This high-resolution image allowed us to precisely locate a portion of the fissure system, the main vent, the lava channel, and the cooling fronts.
Remotesensing 17 01191 g005
Figure 6. Example of the rapid response informative panel released after the first 48 h of eruption. (a) Map of thermal anomalies (VIIRS 375 m; acquired on 5 March 2024 at 07:42 UTC) showing the location, extent, and spatial evolution (upper insets) of the lava flow. Time series of (b) TADR, (c) volume, (d) flow area (e) flow length, and (f) flow front velocity, as recorded from the integrated analysis of thermal data. The stars indicate the most up-to-date measurements. Shaded areas in the time series outline uncertainties in the values provided for each parameter.
Remotesensing 17 01191 g006
Figure 7. Summary of the parameters recorded during the Fernandina March–May 2024 eruption: (a) time-averaged discharge rate (TADR), (b) erupted lava volume (Vol), (c) total (in blue, ATOT) and hot (in red, Ahot) flow area, (d) maximum (Lmax) and active (Lhot) flow length, with the blue dashed line depicting the distance of the coast from the vent (in line of sight), and (e) active flow front velocity (vhot). Shaded areas in the time series indicate uncertainties in the values provided for each parameter. The annotations highlight the trends, dates, and events when major changes were observed. Cyan stars indicate the day the lava entered the sea.
Remotesensing 17 01191 g007
Figure 8. (a) Thermal image acquired by VIIRS on April 3, at 07:30 UTC, indicating that the lava flow was ~1.5 km from the coast. The lower left informative panel summarizes the TADR, volume, flow velocity, and maximum distance reached by the flow front(s) at the time of image acquisition. The upper sequence shows the lengthening phase of the lava field recorded by VIIRS images between 28 March and 3 April 2024. (b) Detail of the PlanetScope image acquired on 2 April 2024, at 16:35 UTC (band combination: NIR, RedEdge, Red) showing three advancing pahoehoe flow branches, located approximately 1.9 km from the coast. Orange triangle shows the main vent location.
Remotesensing 17 01191 g008
Figure 9. Spatio-temporal evolution of the active lava flow derived from the analysis of SWIR (upper panel; (ah)) and TIR (lower panel; (ip)) images. Both sequences show the development of the lava field and allow the depiction of distinct structures associated with active (SWIR) and cooling (TIR) structures, such as the eruptive vent, lava channels, active and cooling flow fronts, skylights marking the underground path of the master lava tube, breakouts giving rise to new flow units, and lava delta. These images, in addition to providing information on the state of the effusive activity, can be used to assess areas of potential ephemeral vent openings that could feed new flows.
Remotesensing 17 01191 g009
Figure 10. The effusion rate trend modeled using (a1) single and (b1) double exponential fit (Equation (5a,b)). The models (blue dashed line) are run using the data collected until day 10 (red circles) and extrapolated for the next 60 days. The fits are compared with all the data (grey circles) acquired during the whole eruption. The red horizontal line represents the 0.1% of the initial maximum TADR. (a2,b2) The erupted volumes are compared to those predicted by the best fitting obtained after 10 days of eruption (blue dashed line). (a3,b3) The predicted V f was plotted as calculated with Equation (6) by iterating the fit as more monitoring data became available. After day 20, the double exponential model forecasts a final volume within 10% of the real value (blue horizontal lines).
Remotesensing 17 01191 g010
Table 1. Characteristics of the sensors used in this work. Color-shaded headings at the top indicate the product latency, namely the time elapsed between scene acquisition and product availability. The sensors are divided into two subgroups depending on the workflow used for processing (see Section 2.3).
Product
Latency
(hours)
1–46–12> 12
SensorMODISVIIRS
(M-bands)
VIIRS
(I-bands)
MSIOLITIRSASTERPlanet Scope
SatelliteTERRAAQUAS-NPPNOAA-20S-NPPNOAA-20Sentinel 2ASentinel 2BLandsat 8Landsat 9Landsat 8Landsat 9TERRAPlanetScope
Equator
Crossing
Time
10:30 LT13:30 LT13:30 LT12:40 LT13:30 LT12:40 LT10:30 LT10:00 LT22:00 LT10:00 LT22:00 LT10:30 LT7:30–11:30
Global
Coverage
Every 12 hEvery 12 hEvery 12 h10 days16 days16 days16 days~24 h
(5 in const)(8 in const)(8 in const)
Spectral
region
MIR, TIRMIR, TIRMIR, TIRNIR, SWIRNIR, SWIRTIRTIRVNIR
Pixel res.
at nadir
1 km0.75 km0.375 km20 m30 m100 m90 m4 m
Spectral
range (µm)
3.929–3.989
3.940–4.001
10.78–11.28
3.973–4.128
10.26–11.26
3.550–3.930
10.56–12.43
0.855–0.875
1.565–1.655
2.100–2.280
0.851–0.879
1.566–1.651
2.107–2.294
10.60–11.19
11.50–12.51
10.95–11.650.650–0.680
0.697–0.713
0.845–0.885
ID
Band(s)
21
22
31
M-13
M-15
I-4
I-5
8a
11
12
5
6
7
10
11
14Red
RedEdge
NIR
MIROVA NRT WorkflowHRES Workflow
Disclaimer/Publisher’s Note: The statements, opinions and data contained in all publications are solely those of the individual author(s) and contributor(s) and not of MDPI and/or the editor(s). MDPI and/or the editor(s) disclaim responsibility for any injury to people or property resulting from any ideas, methods, instructions or products referred to in the content.

