

High-Resolution Drought Detection Across Contrasting Climate Zones in China


Abstract
1. Introduction
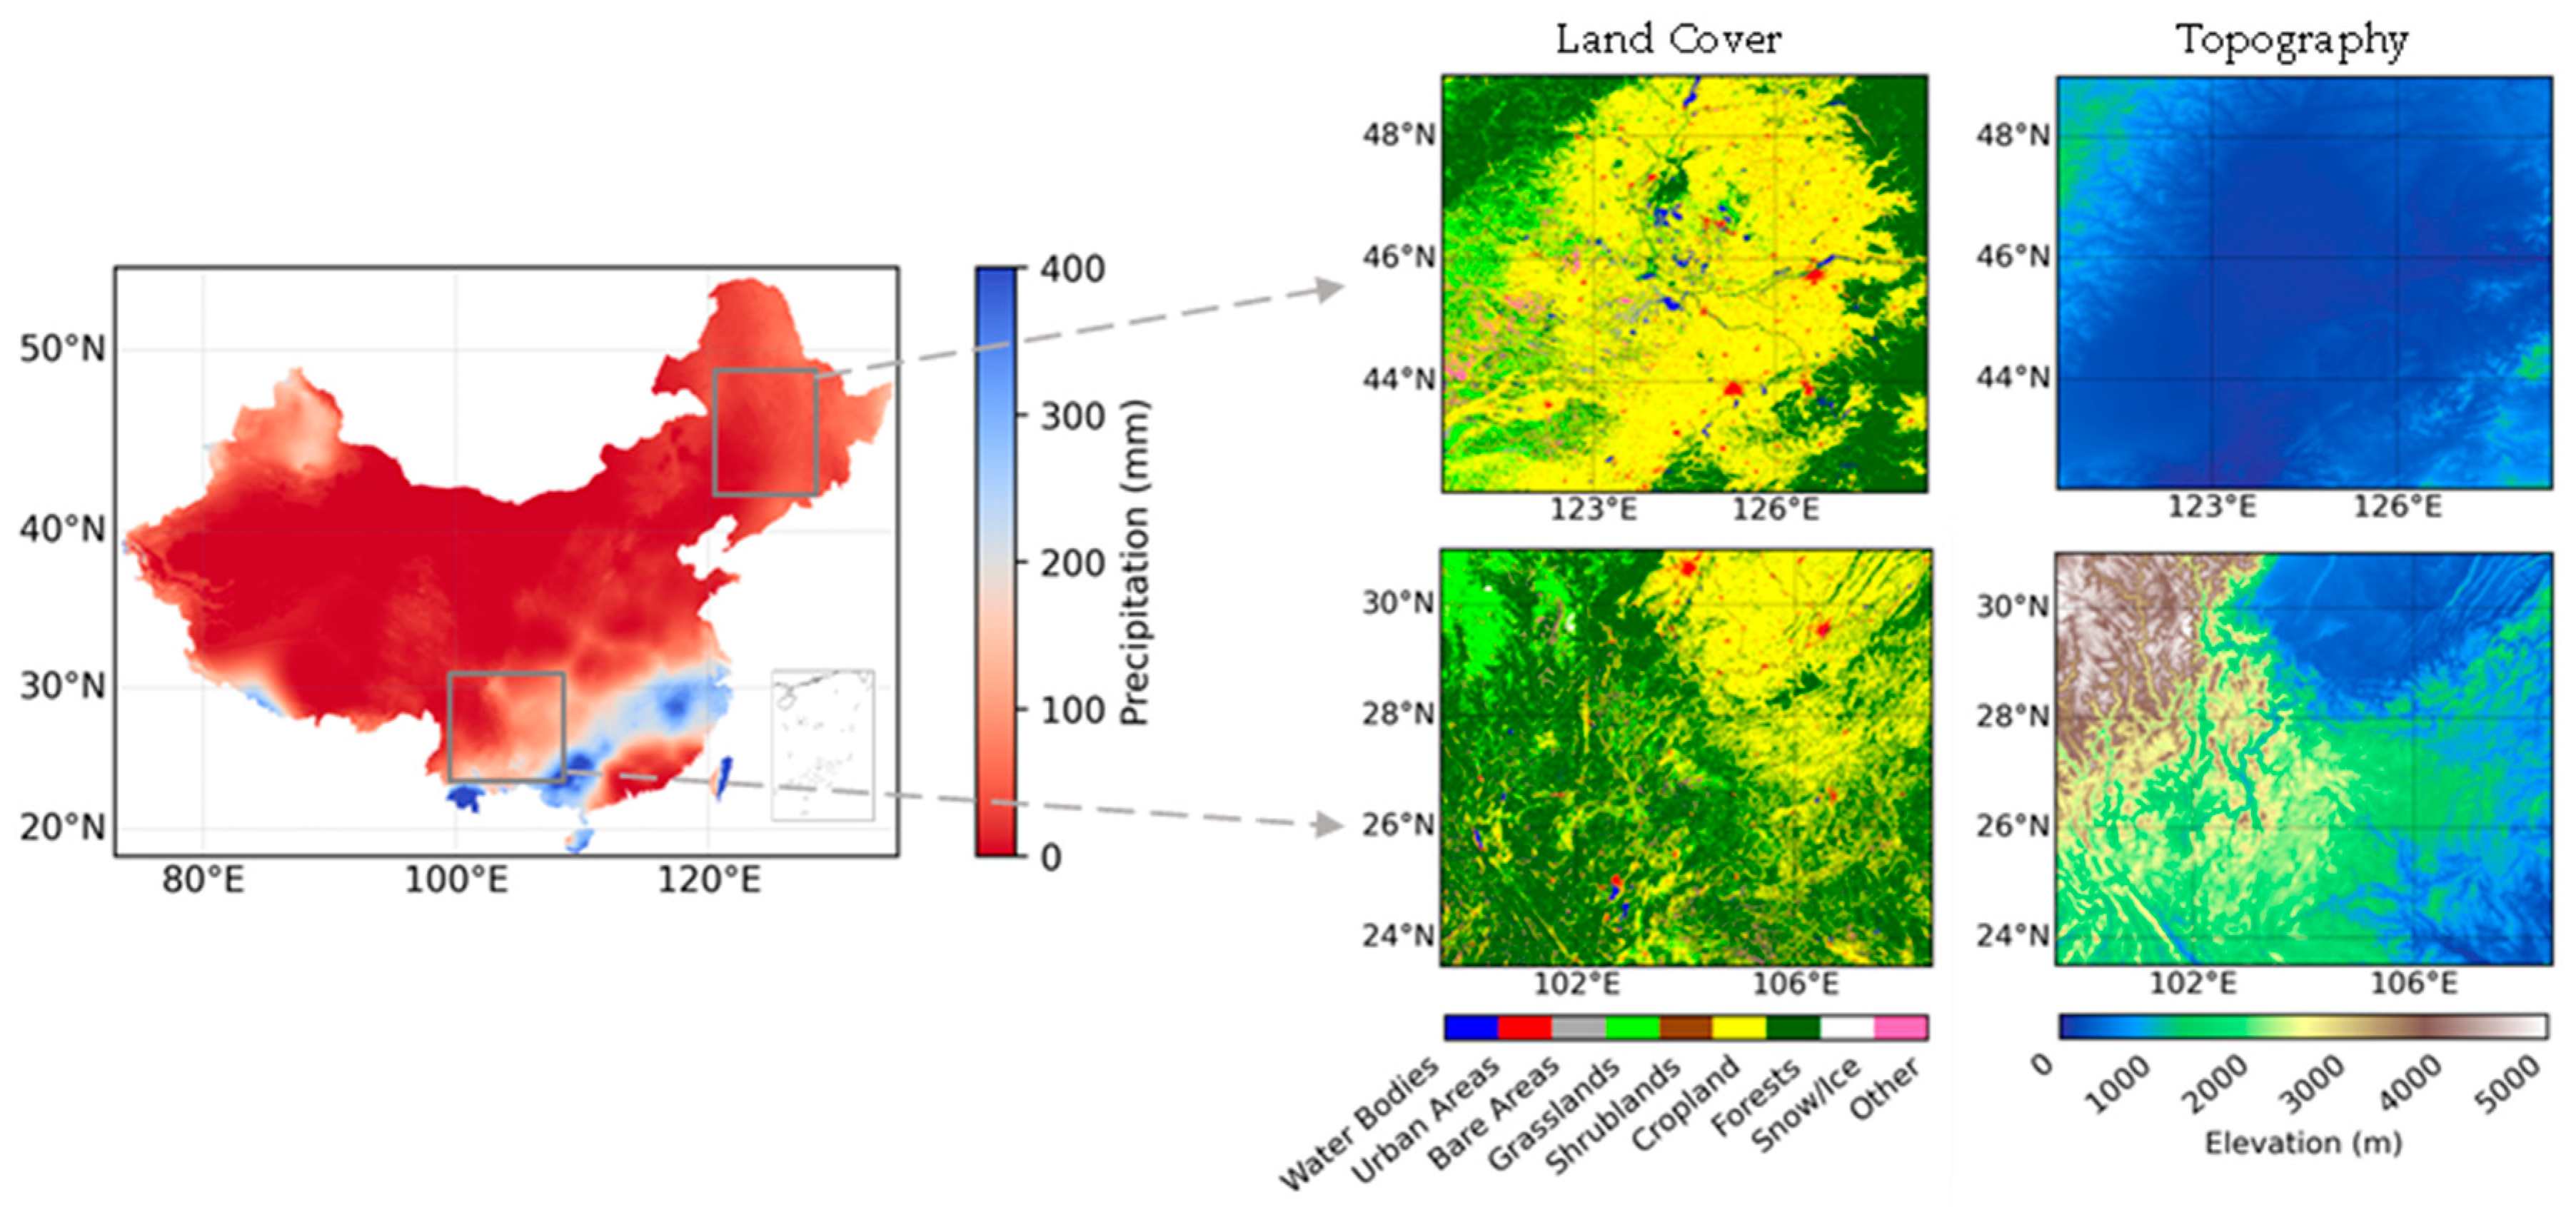
2. Study Area
3. Data and Methods
3.1. Data
3.1.1. Precipitation
3.1.2. Potential Evapotranspiration
3.1.3. Vegetation Health Index
3.1.4. Root Zone Soil Moisture
3.1.5. Coarse-Resolution SPEI
3.2. Methods
3.2.1. SPEI Calculation
3.2.2. Evaluation Strategy
4. Results and Discussion
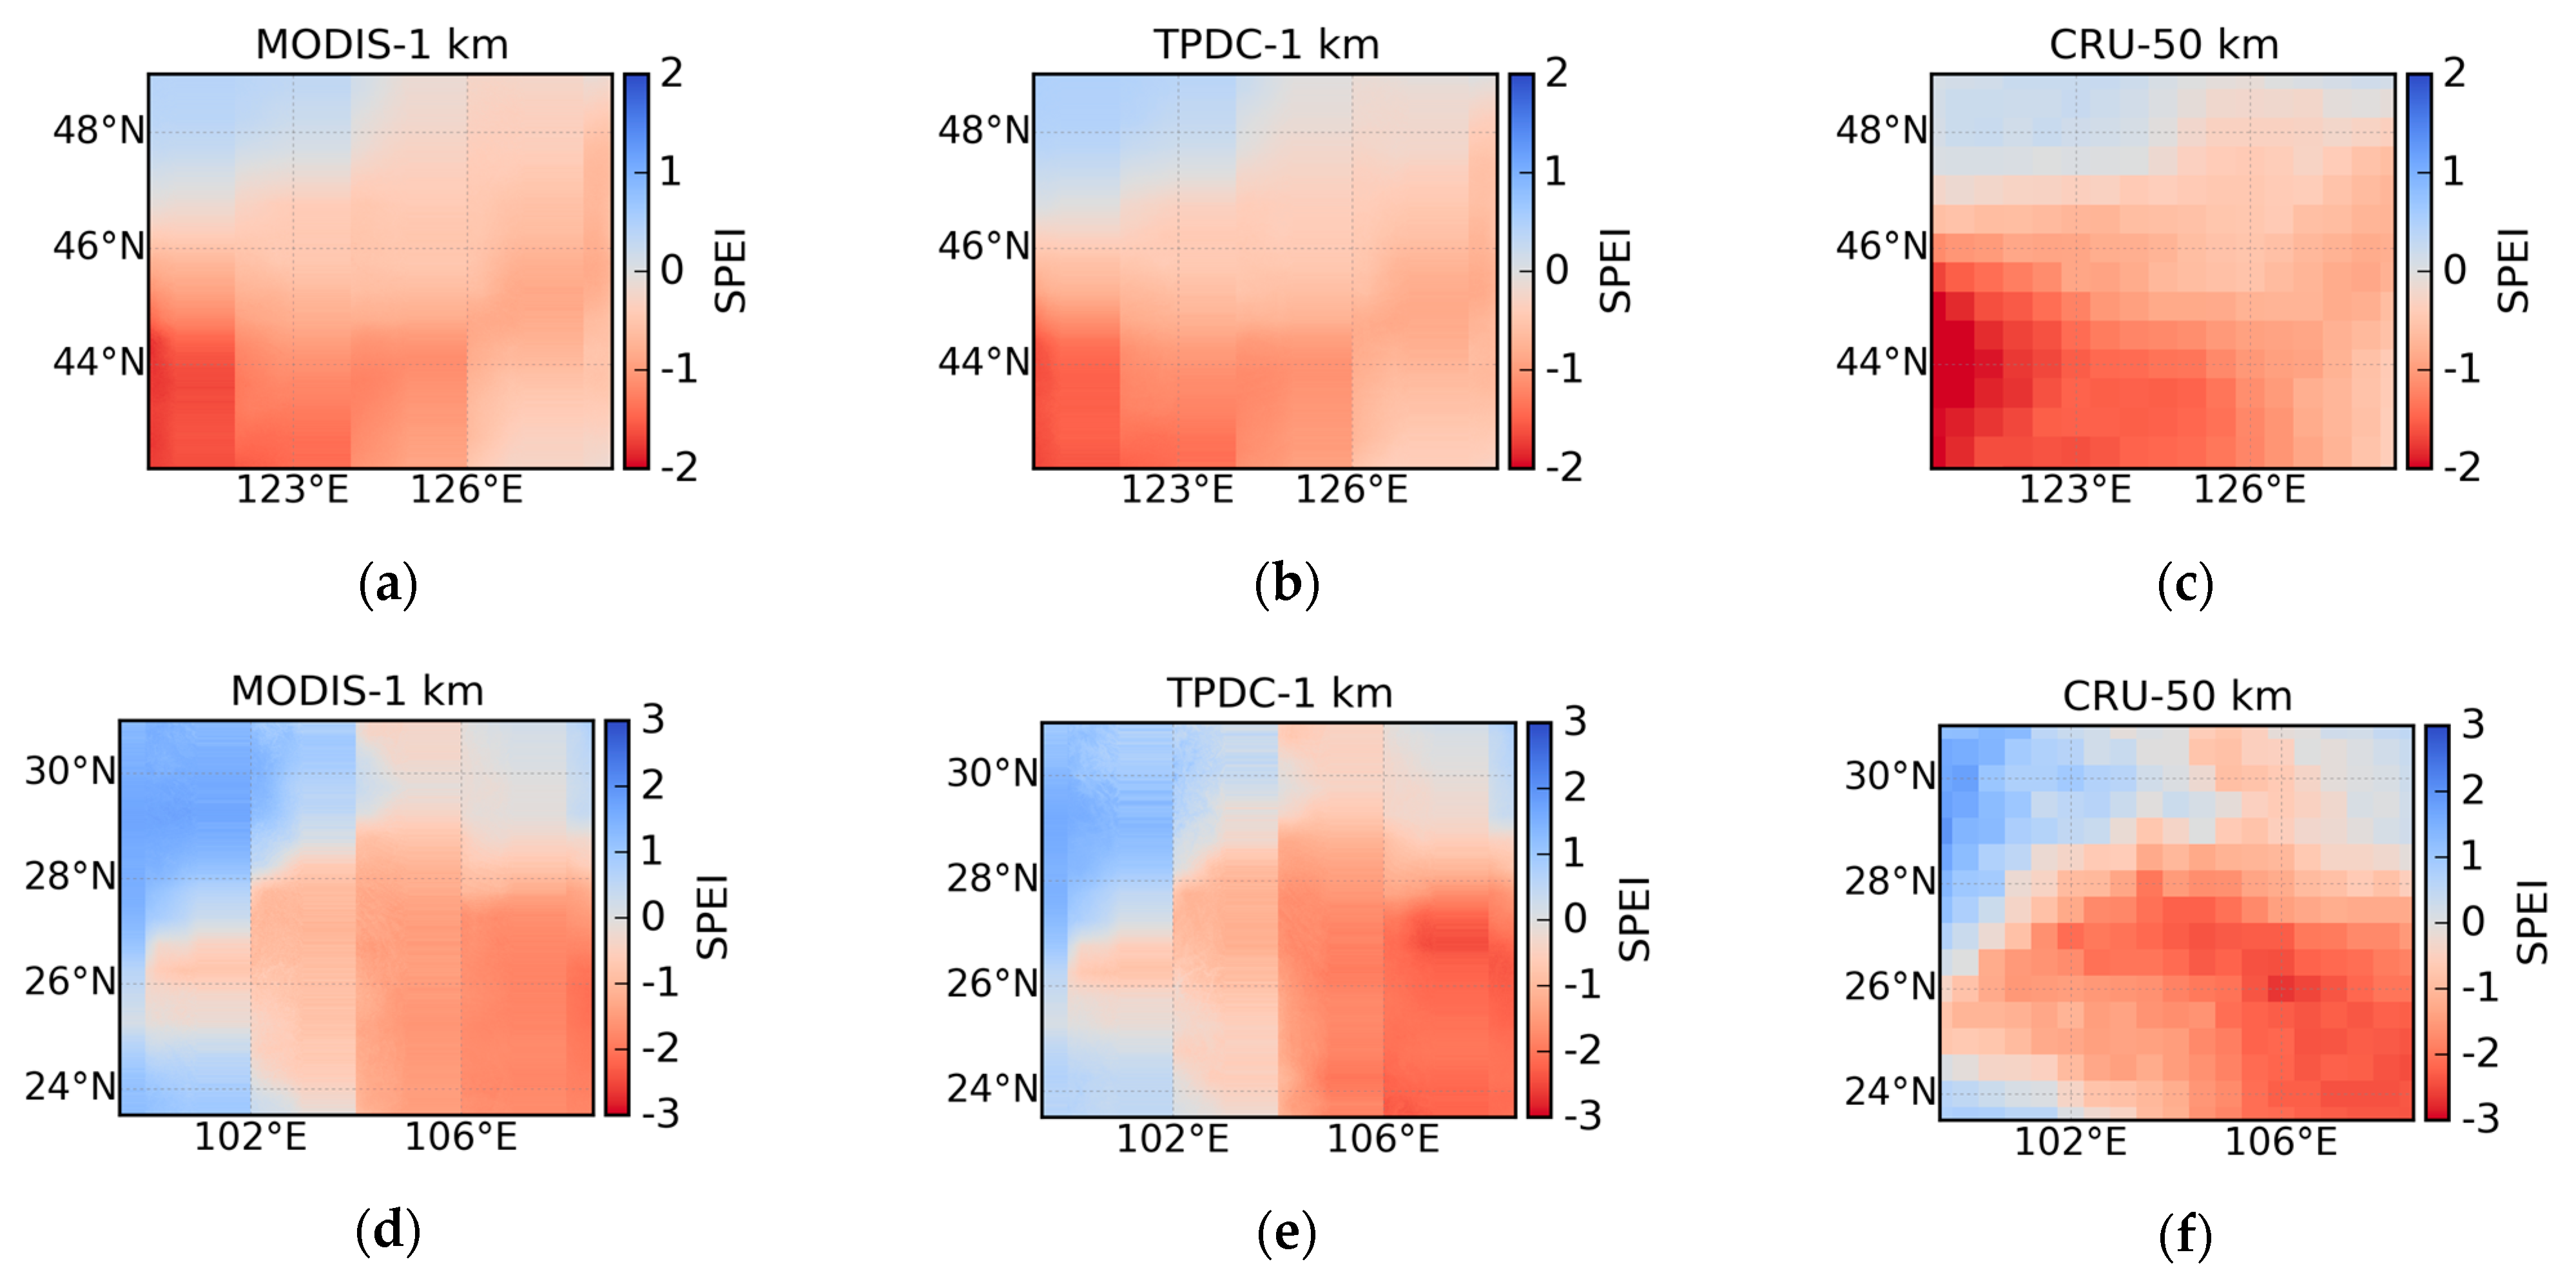
4.1. Spatial Variability of High-Resolution and Coarse-Resolution SPEI Datasets
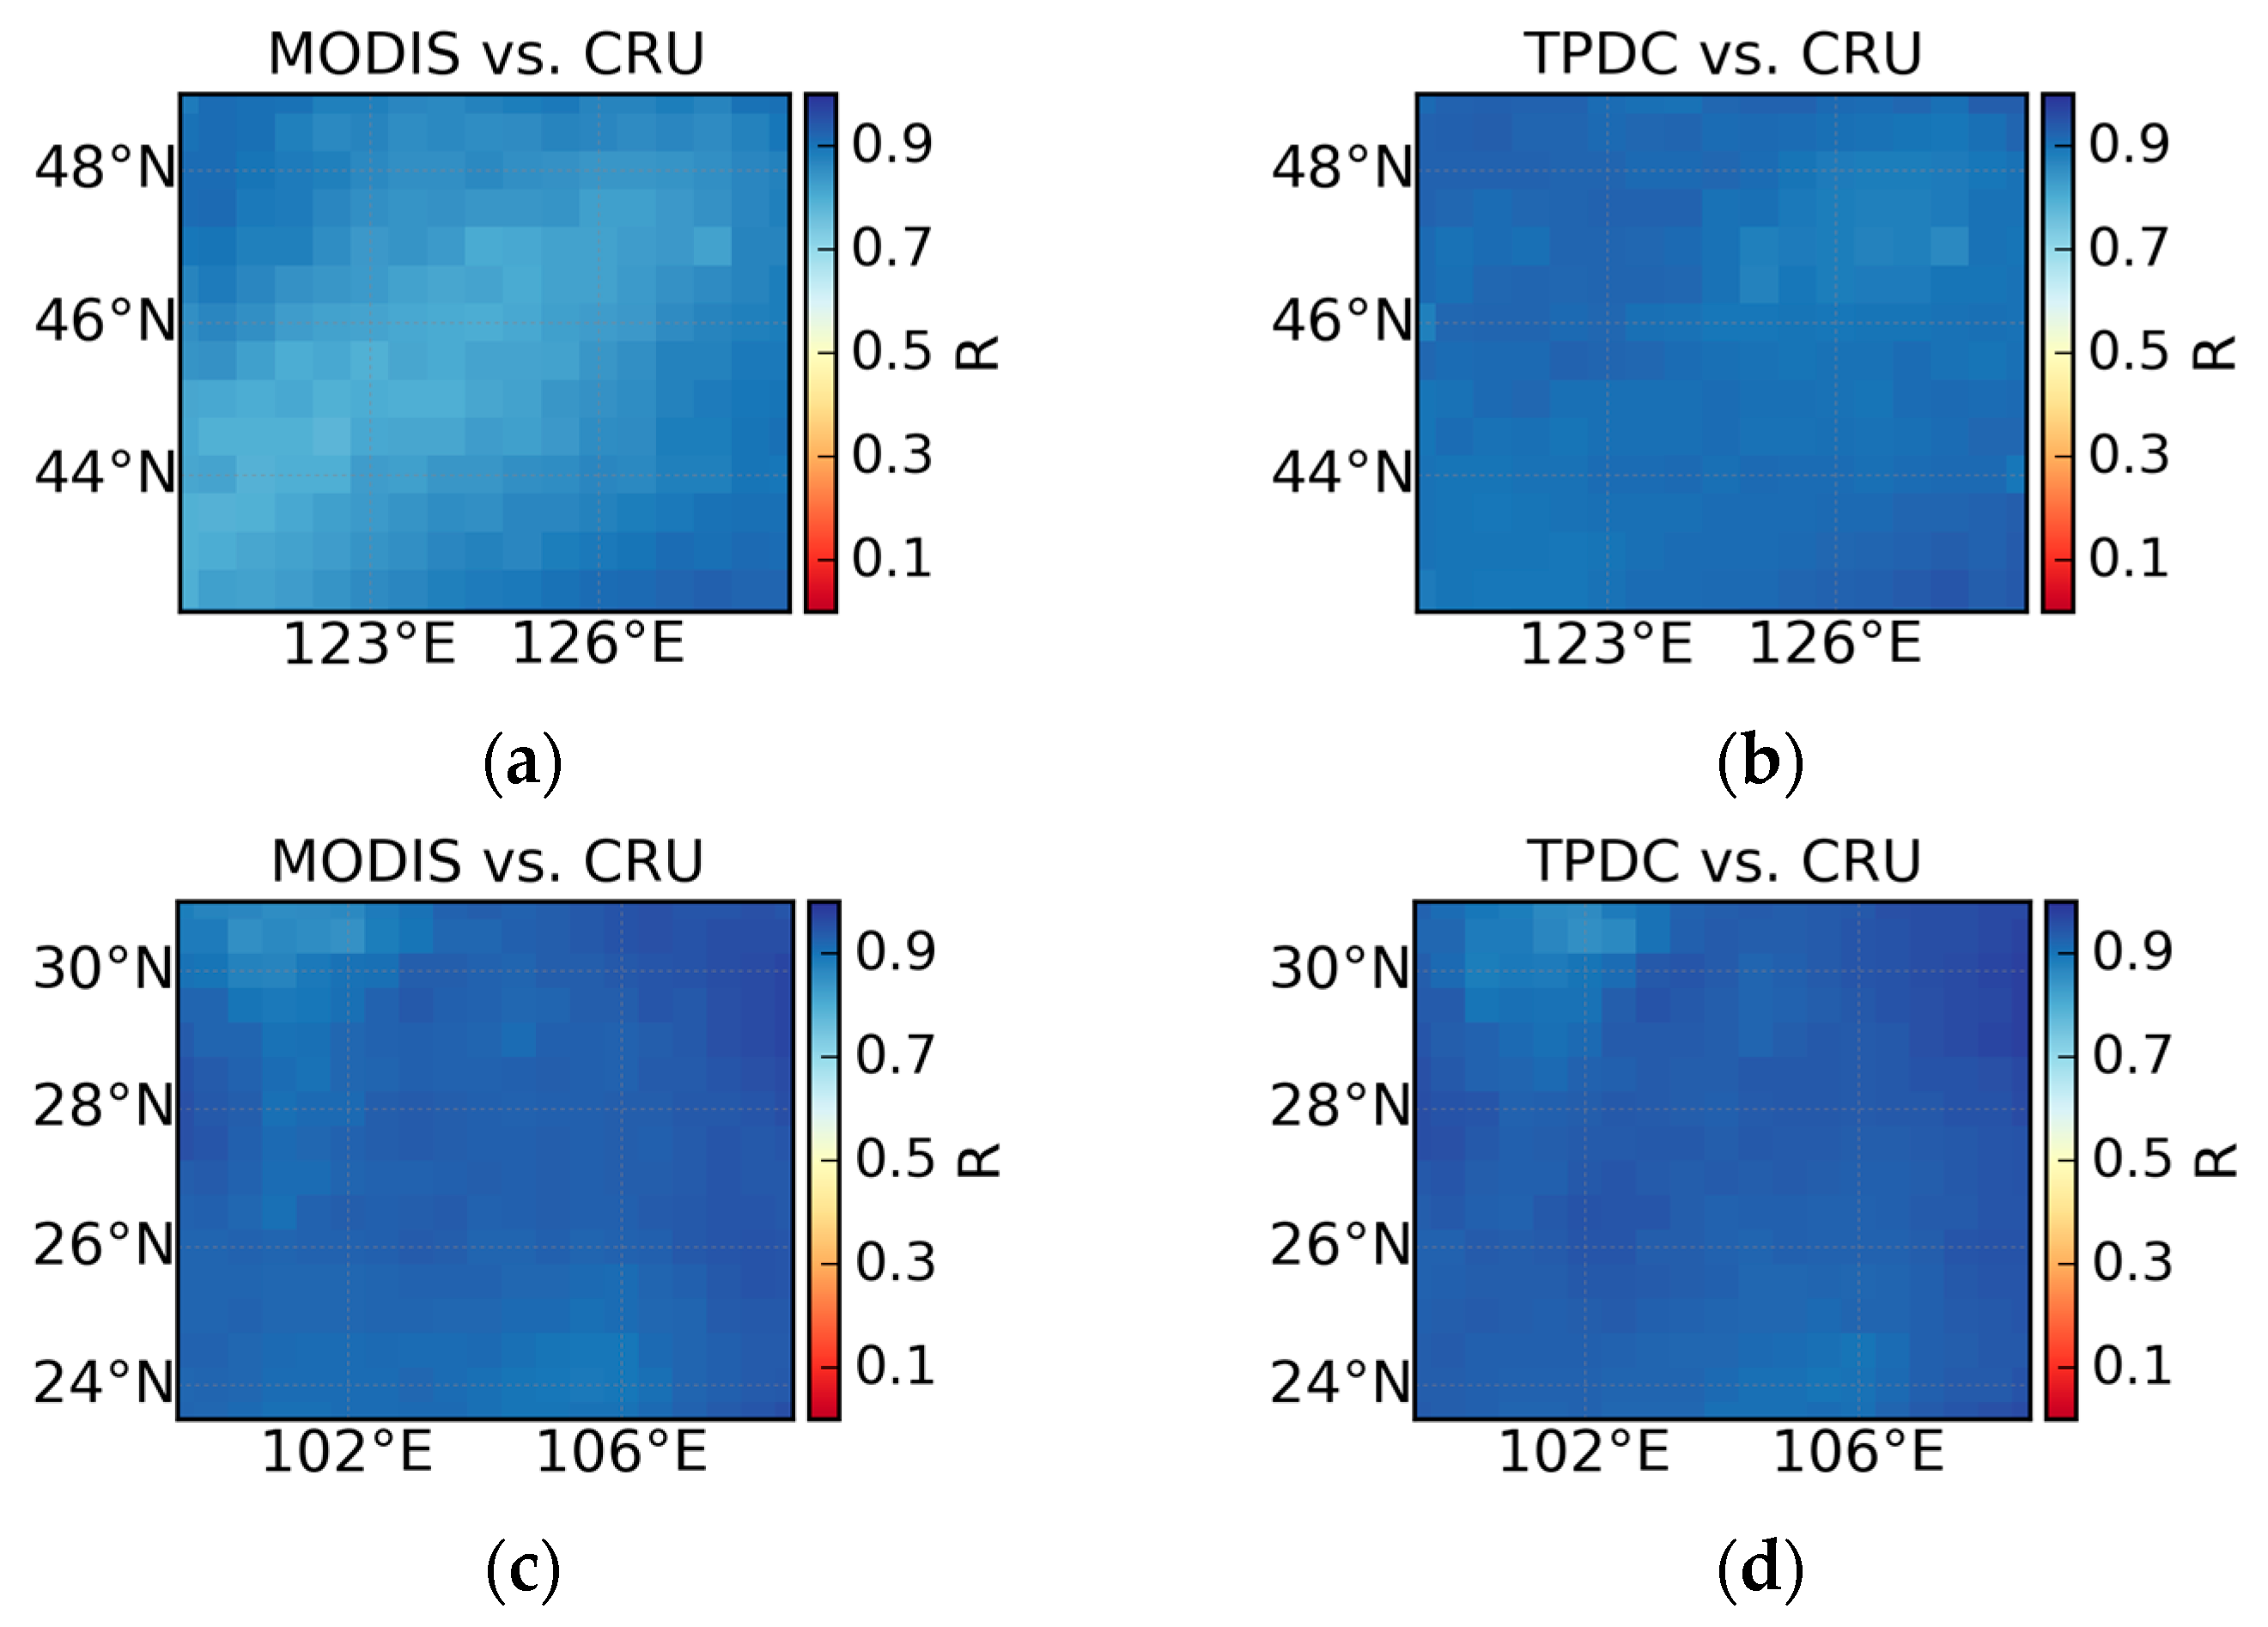
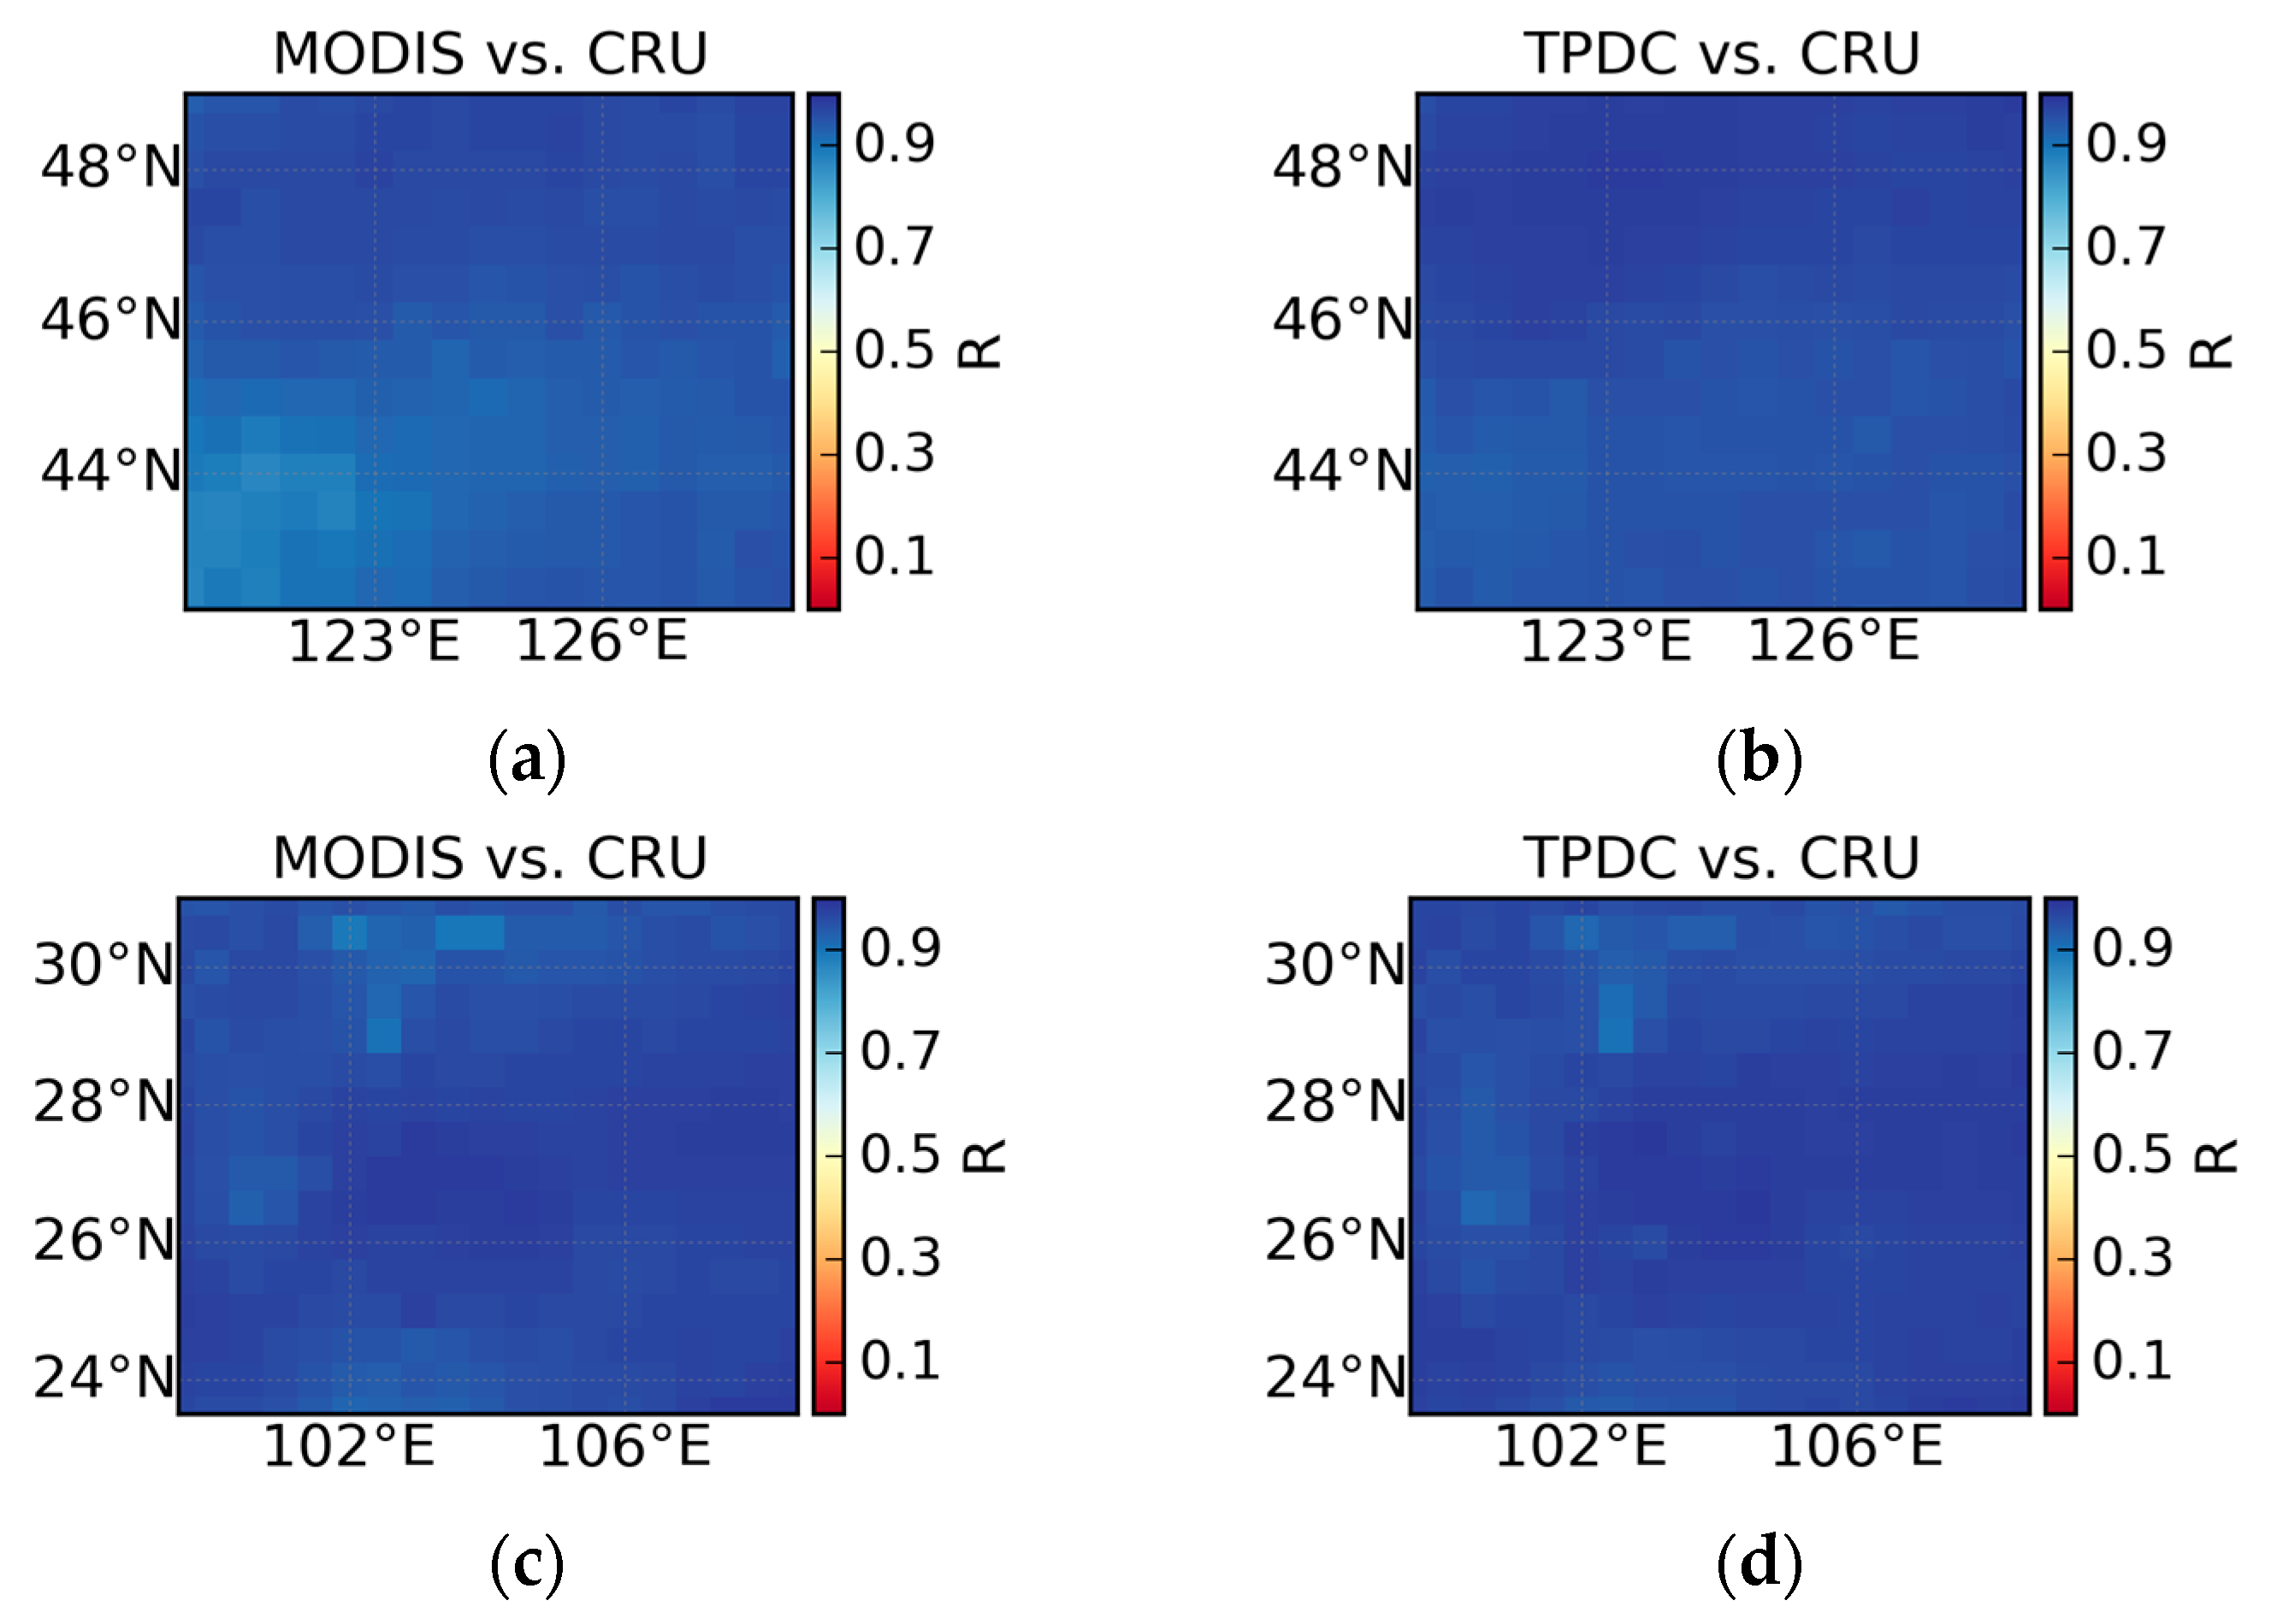
4.2. Comparison Between High-Resolution and Coarse-Resolution SPEI Datasets
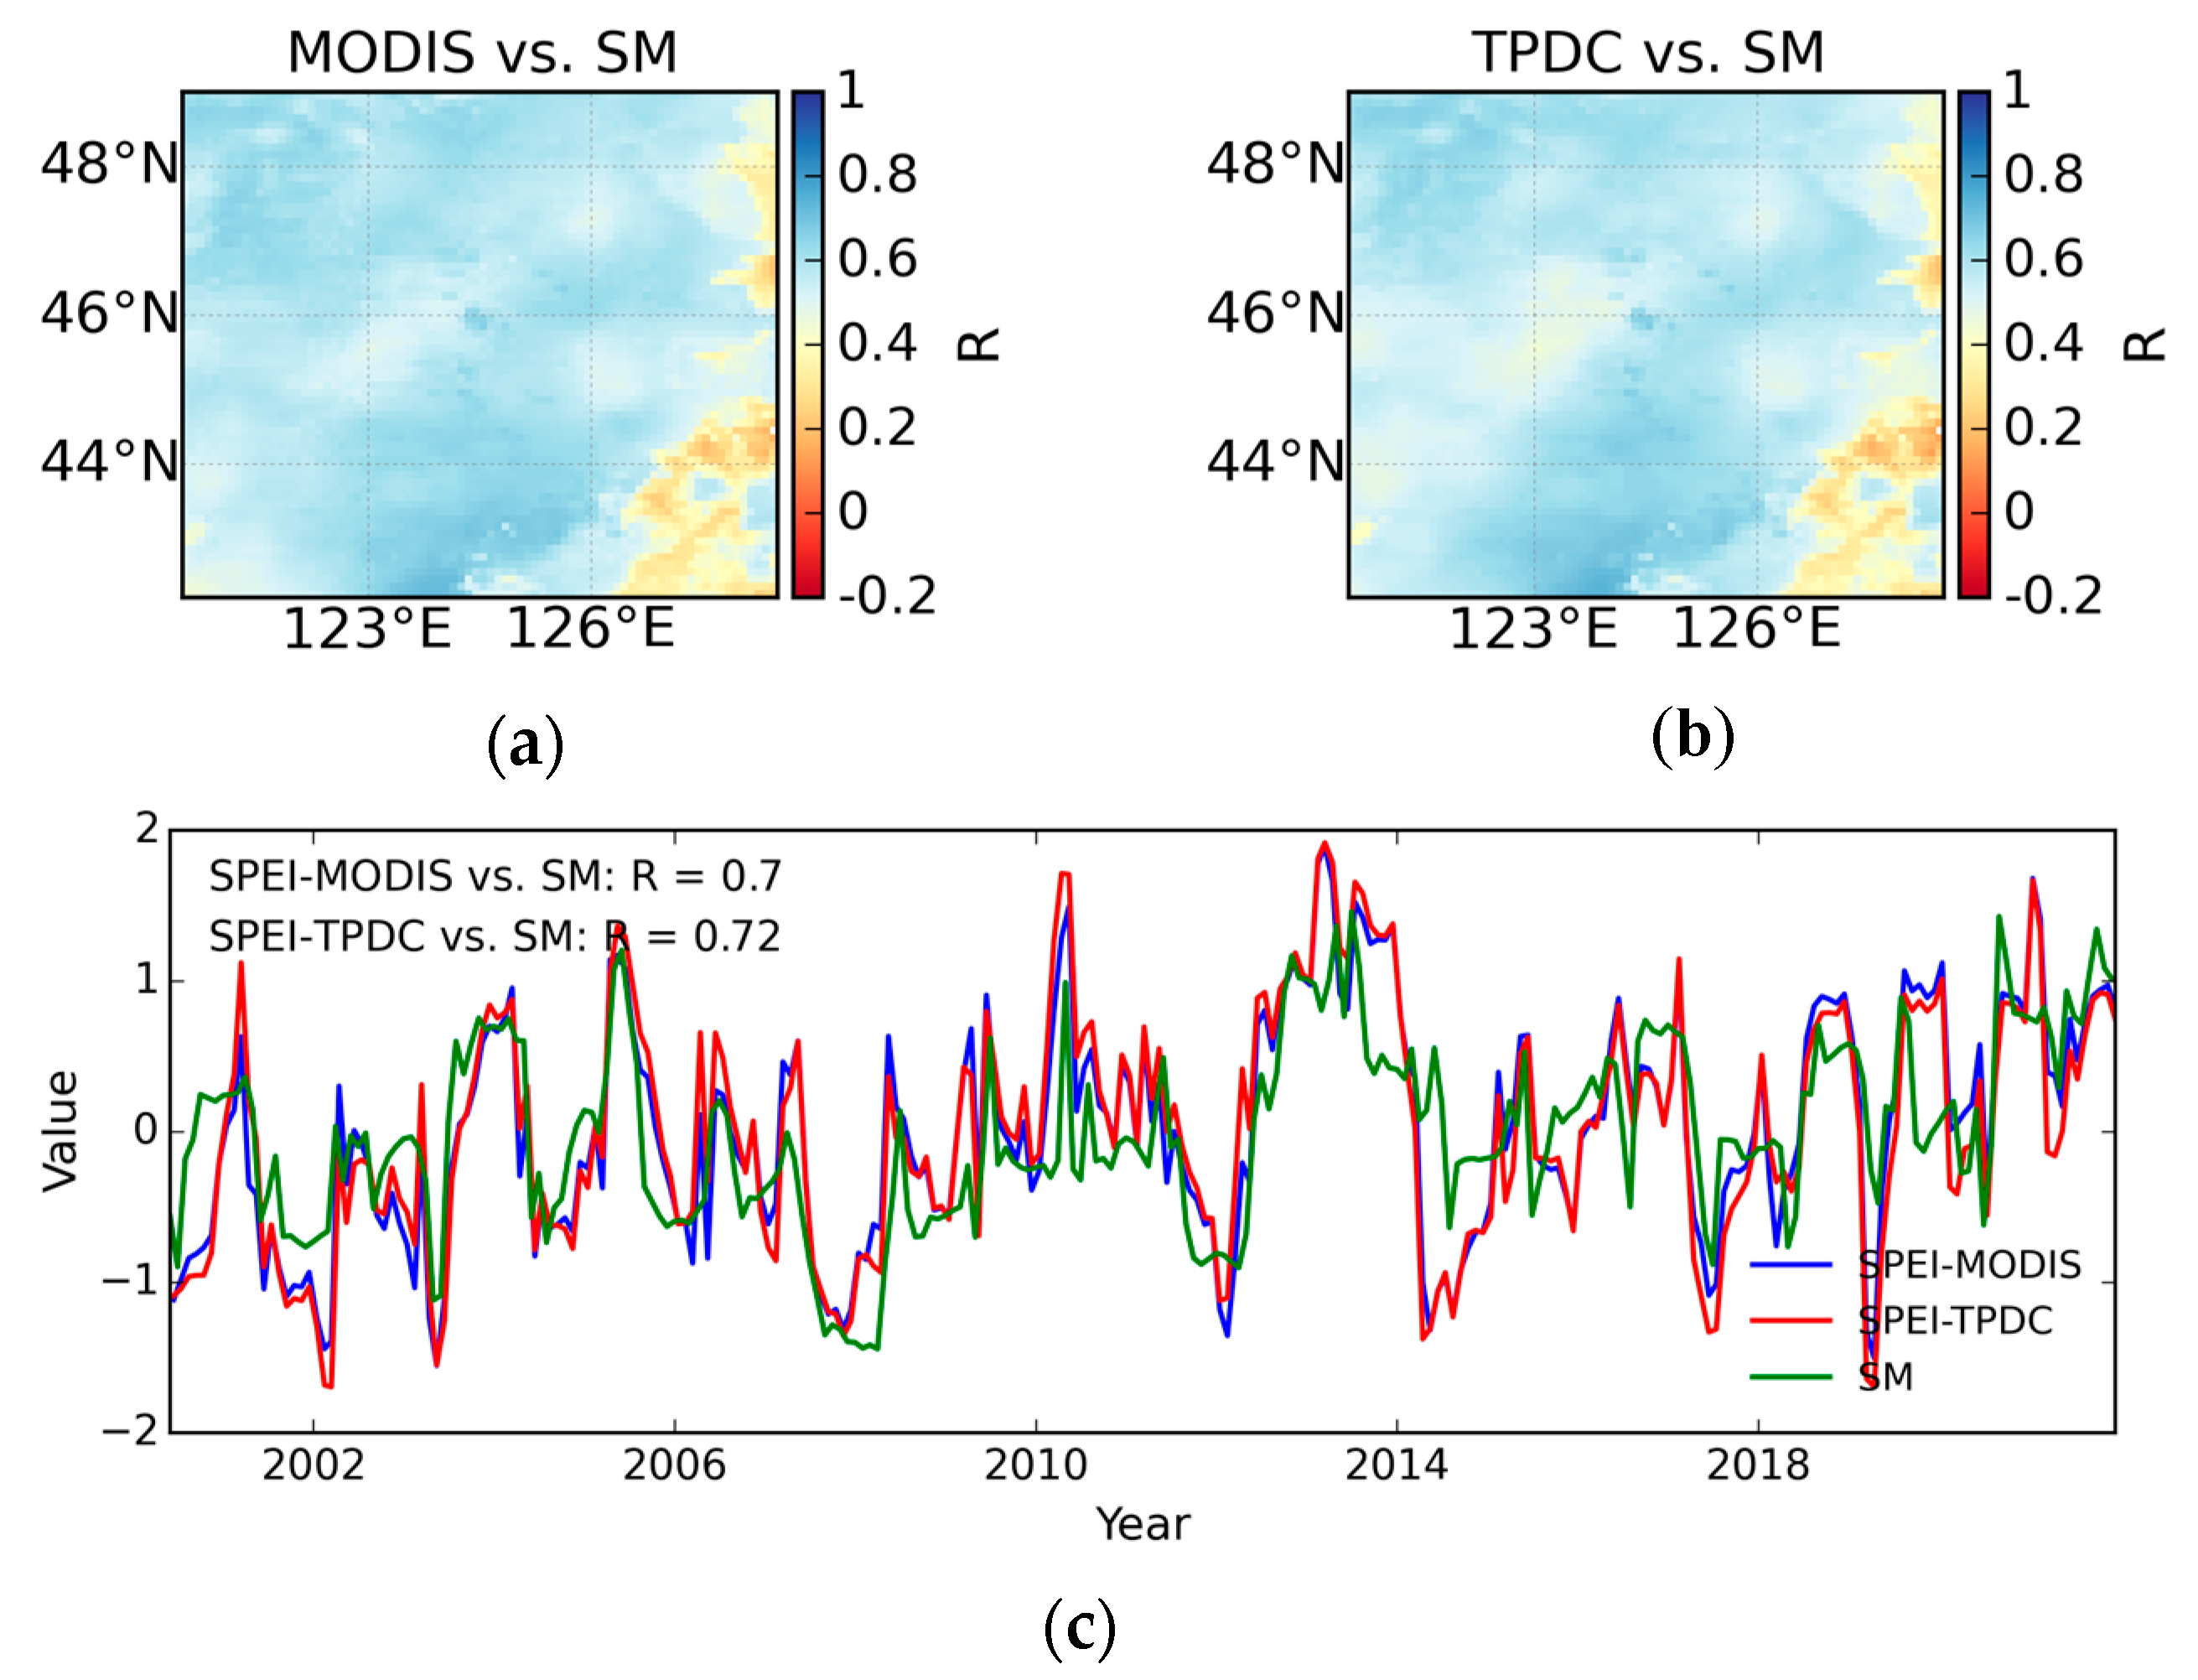
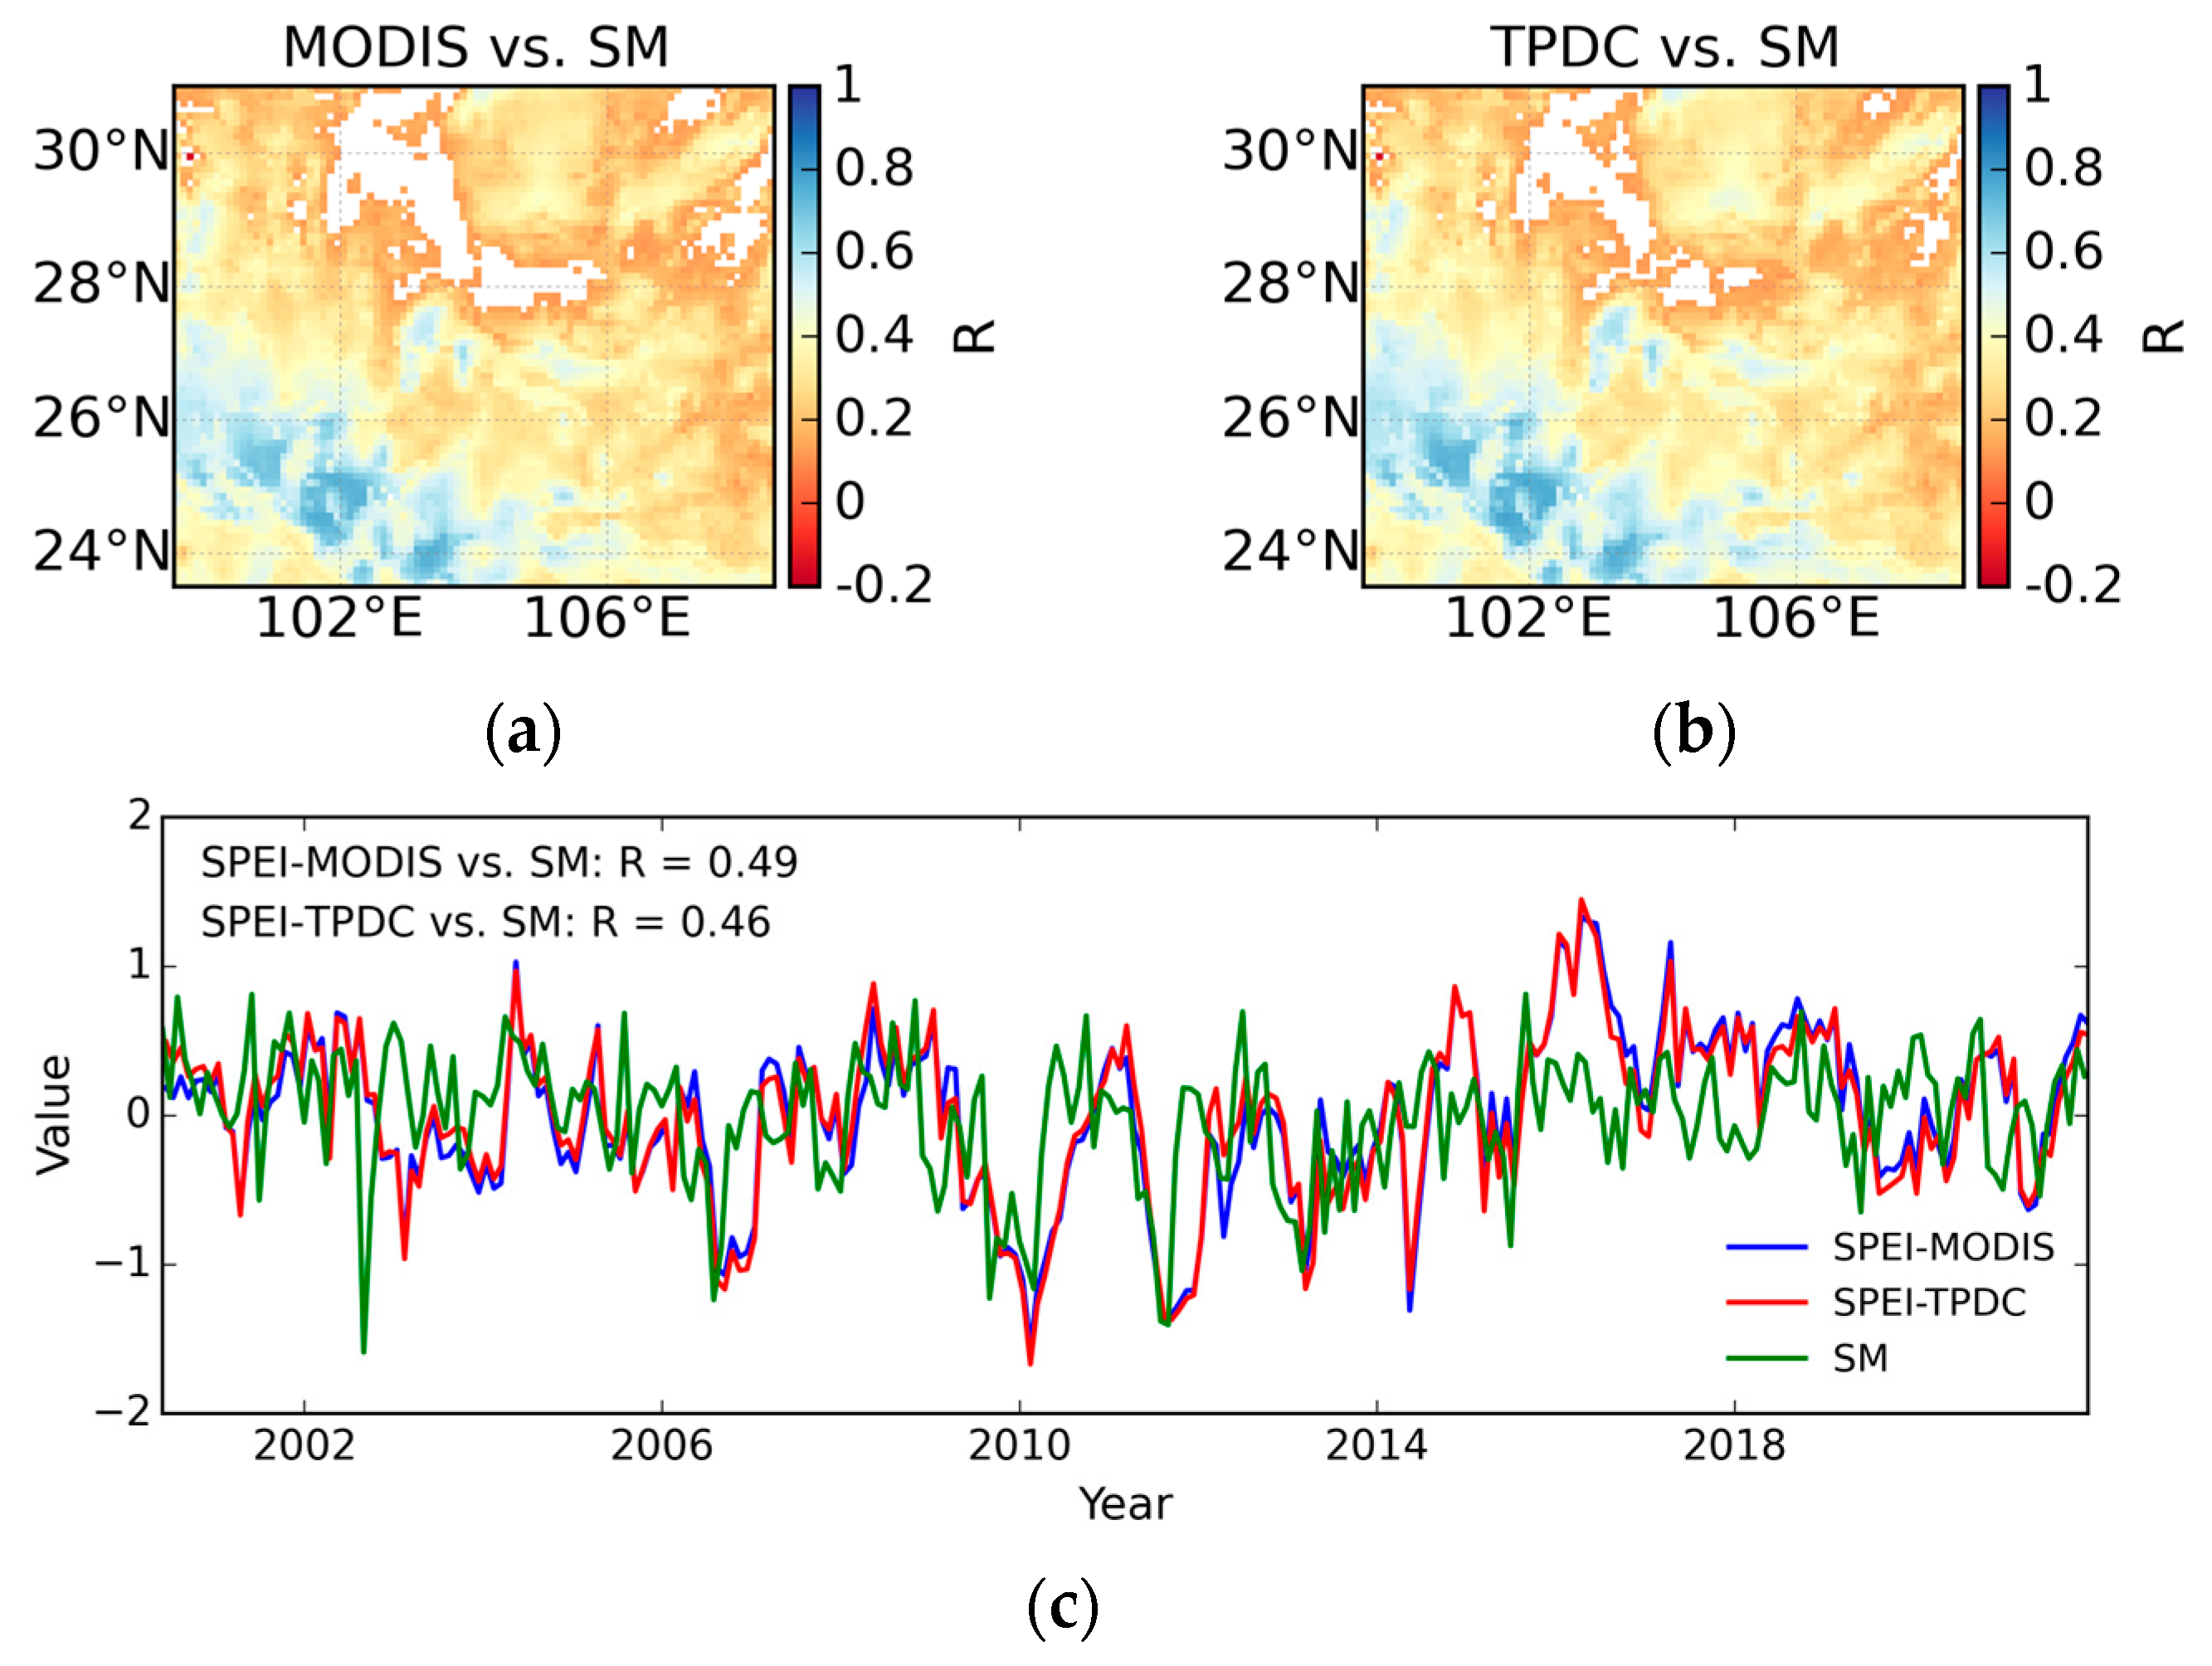
4.3. Evaluation Against Root Zone Soil Moisture
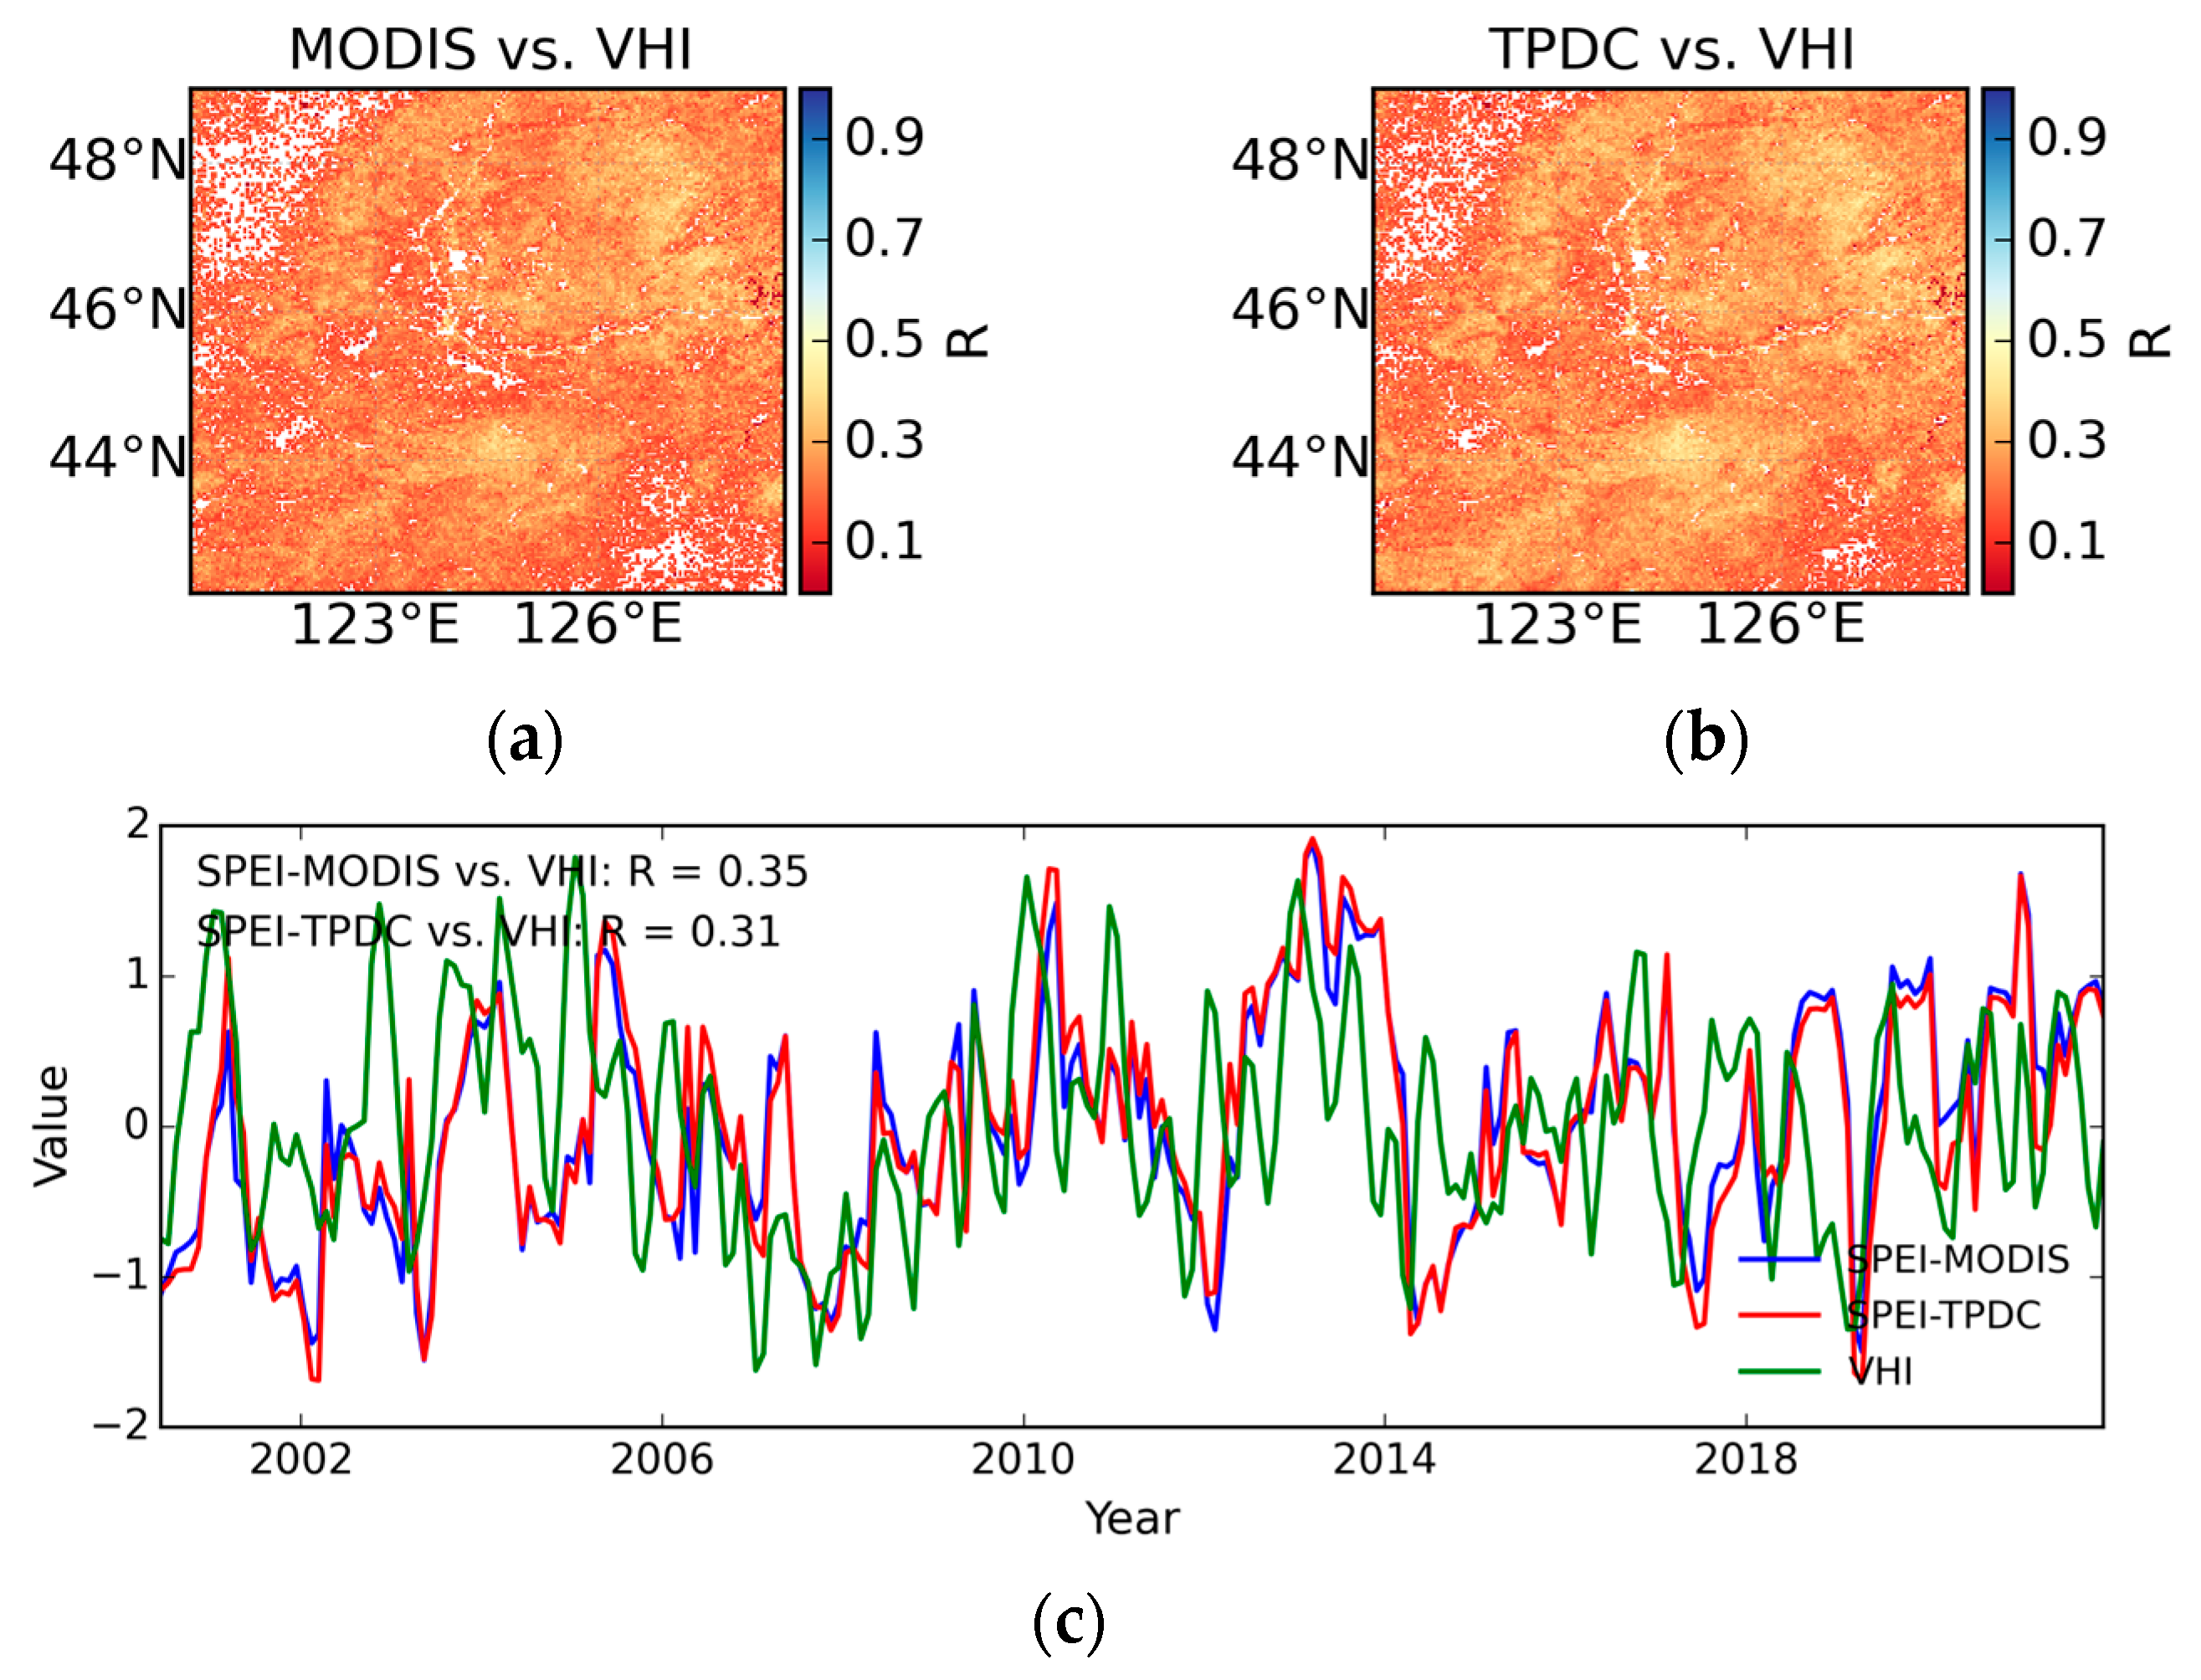
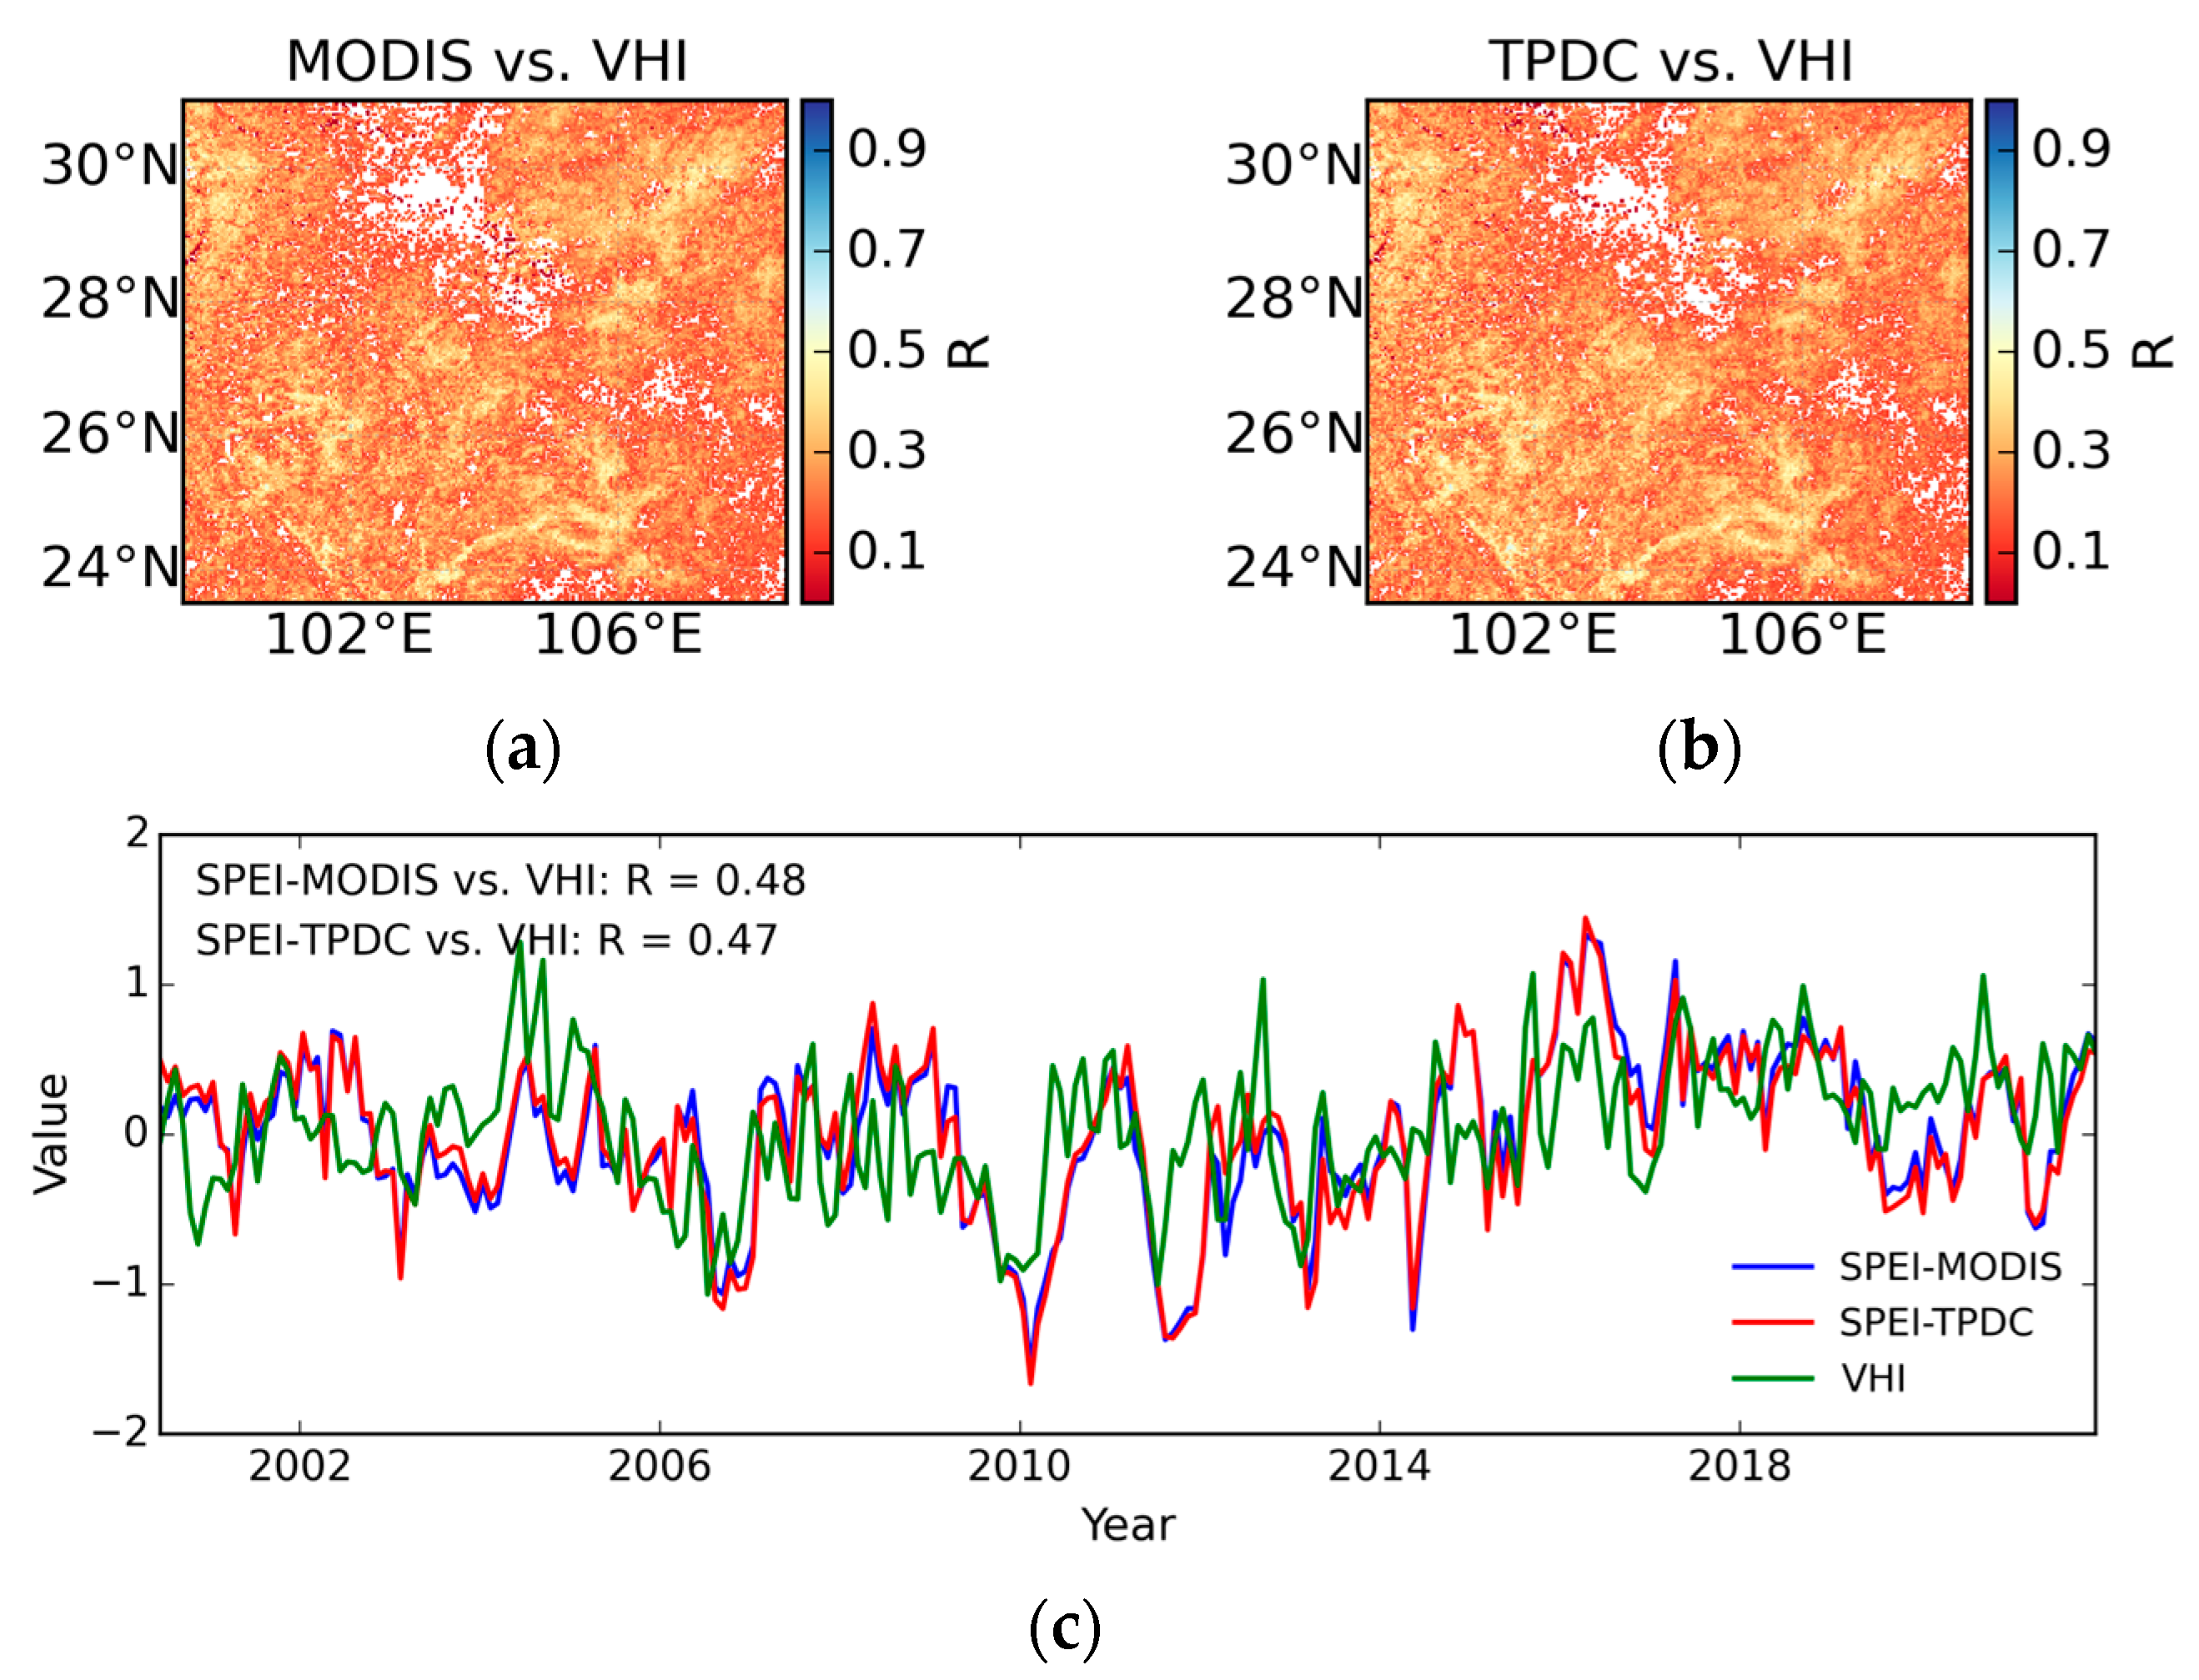
4.4. Evaluation Against Vegetation Health Index
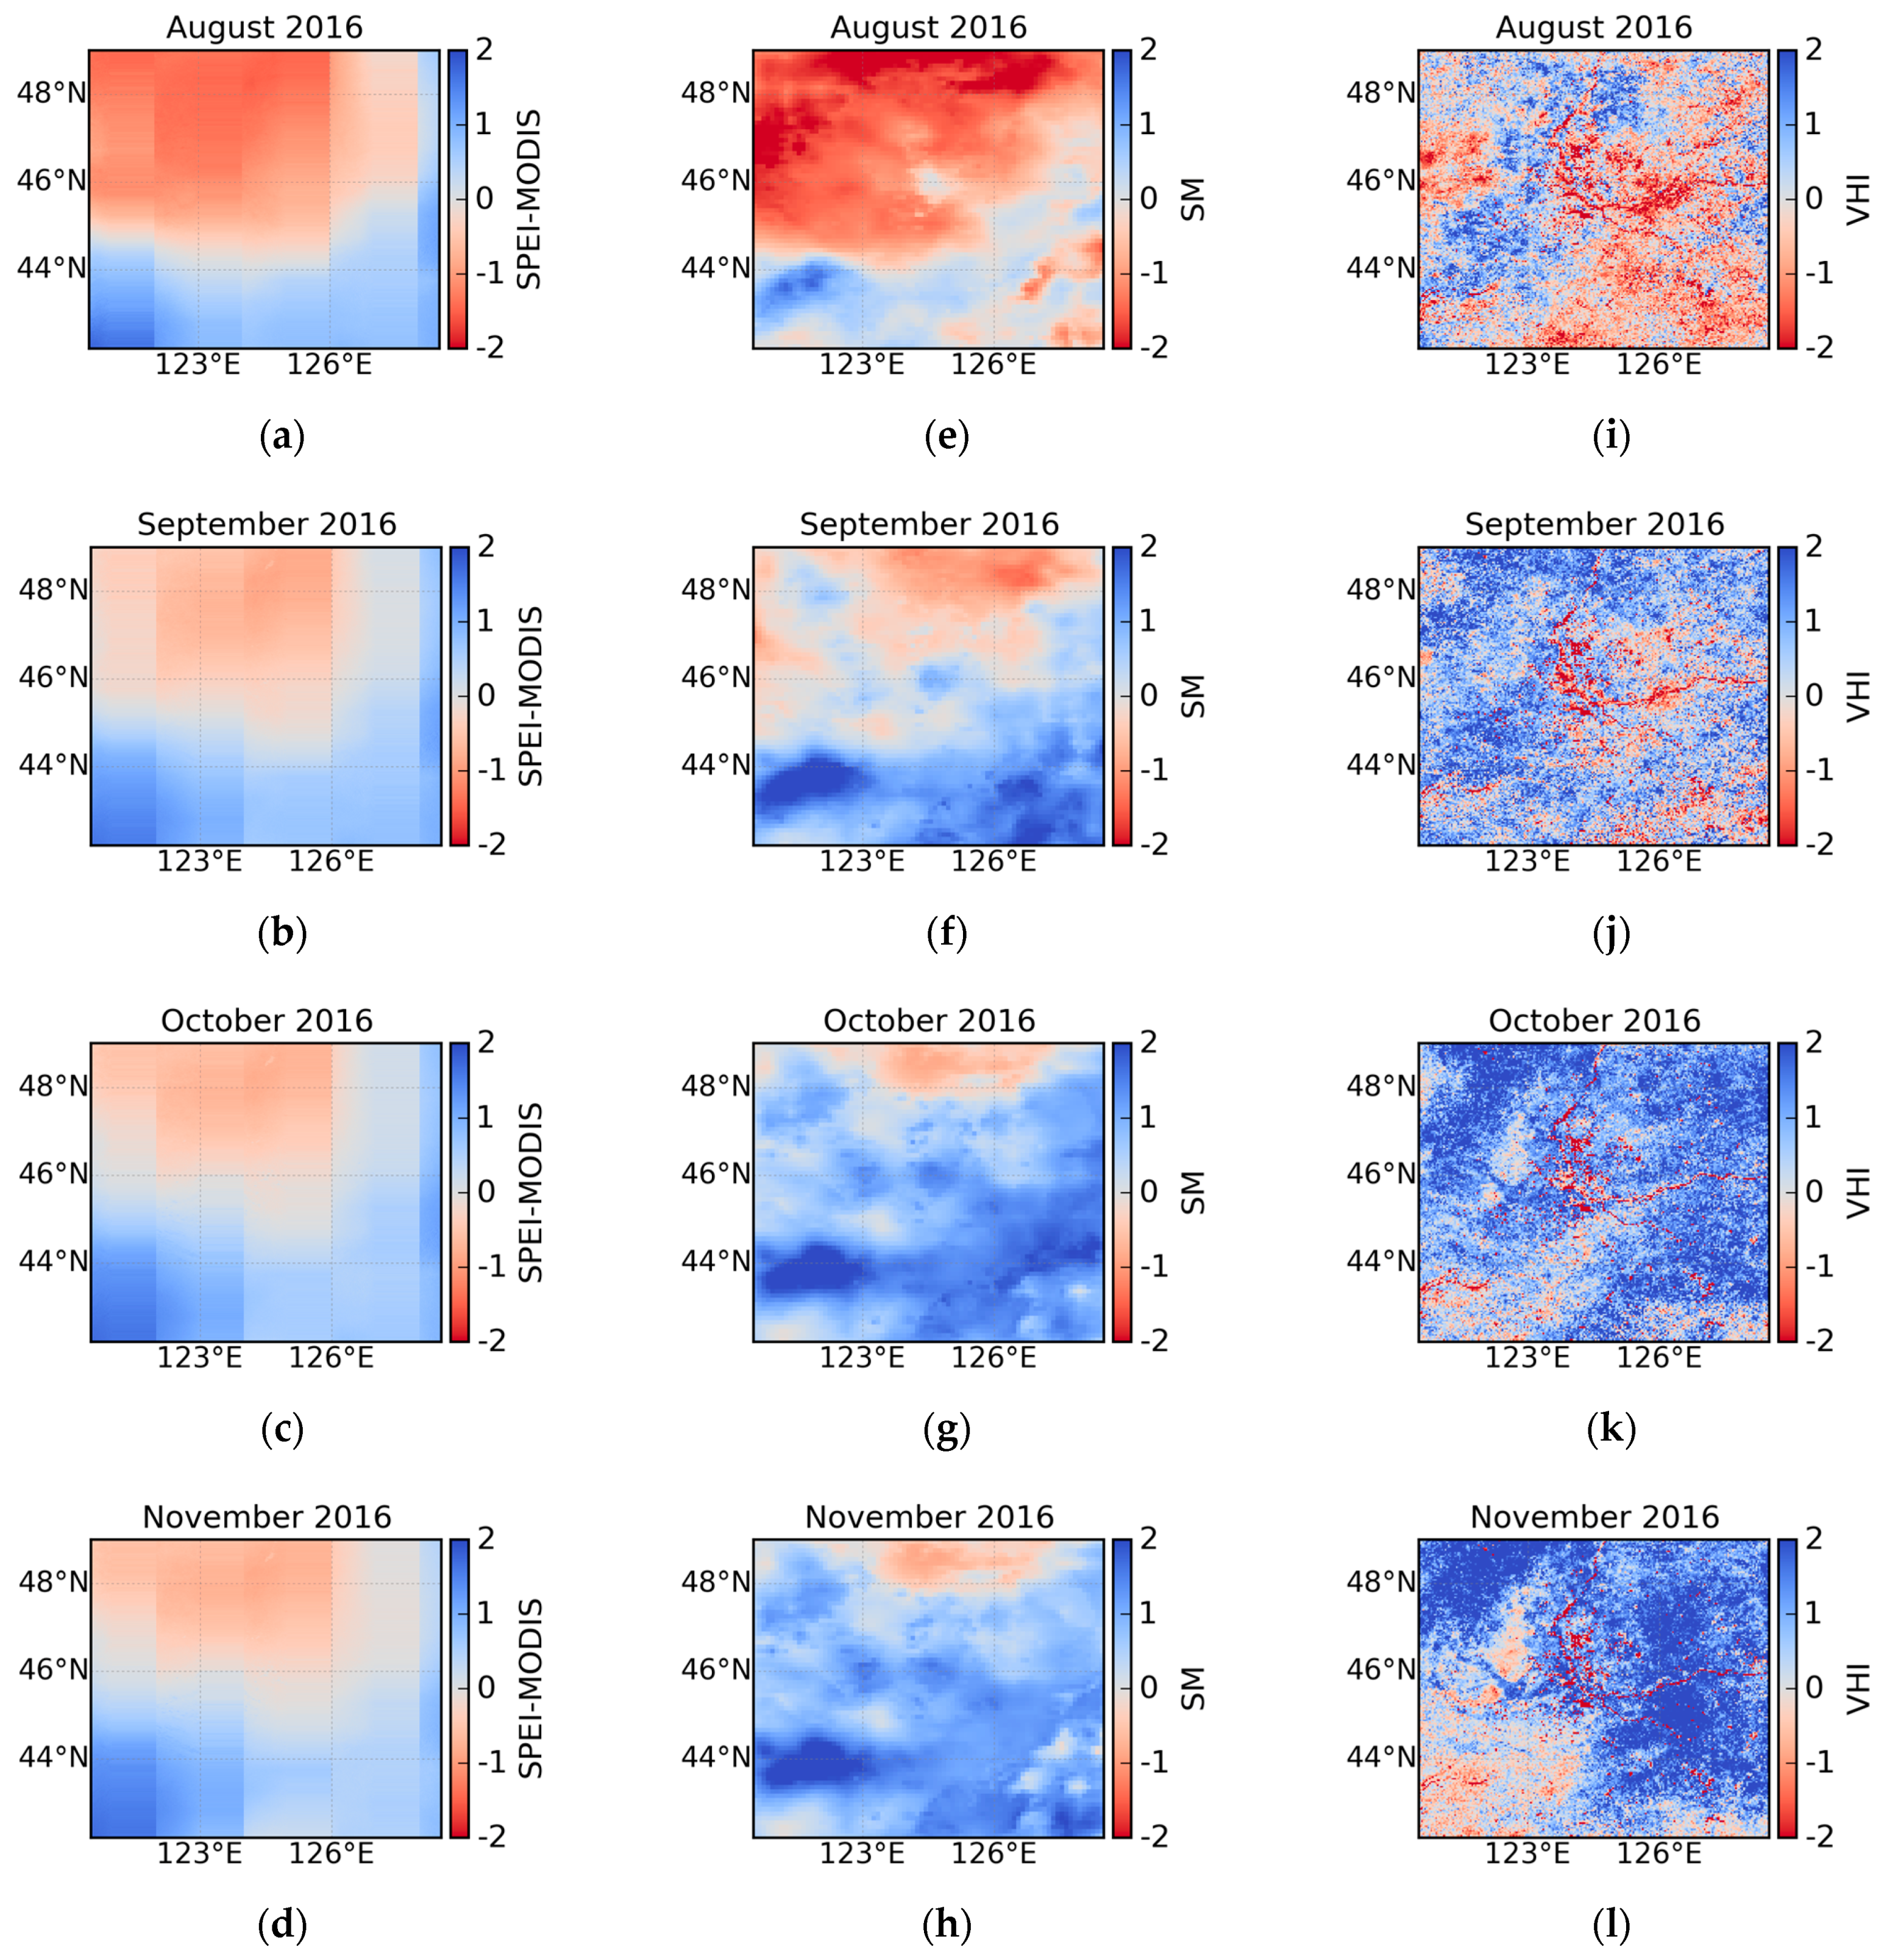
4.5. Drought Detection with SPEI in NEC
5. Conclusions
Author Contributions
Funding
Data Availability Statement
Conflicts of Interest
References
- Sangha, K.K.; Russell-Smith, J.; Evans, J.; Edwards, A. Methodological approaches and challenges to assess the environmental losses from natural disasters. Int. J. Disaster Risk Reduct. 2020, 49, 101619. [Google Scholar] [CrossRef]
- Van Loon, A.F. Hydrological drought explained. Wiley Interdiscip. Rev. Water 2015, 2, 359–392. [Google Scholar]
- Leng, G.; Hall, J. Crop yield sensitivity of global major agricultural countries to droughts and the projected changes in the future. Sci. Total Environ. 2019, 654, 811–821. [Google Scholar] [CrossRef]
- Loboda, T.; Krankina, O.; Savin, I.; Kurbanov, E.; Hall, J. Land management and the impact of the 2010 extreme drought event on the agricultural and ecological systems of European Russia. In Land-Cover and Land-Use Changes in Eastern Europe After the Collapse of the Soviet Union in 1991; Springer: Cham, Switzerland, 2017; pp. 173–192. [Google Scholar]
- Ciais, P.; Reichstein, M.; Viovy, N.; Granier, A.; Ogée, J.; Allard, V.; Aubinet, M.; Buchmann, N.; Bernhofer, C.; Carrara, A. Europe-wide reduction in primary productivity caused by the heat and drought in 2003. Nature 2005, 437, 529–533. [Google Scholar] [CrossRef] [PubMed]
- Dutra, E.; Magnusson, L.; Wetterhall, F.; Cloke, H.L.; Balsamo, G.; Boussetta, S.; Pappenberger, F. The 2010–2011 drought in the Horn of Africa in ECMWF reanalysis and seasonal forecast products. Int. J. Climatol. 2013, 33, 1720–1729. [Google Scholar] [CrossRef]
- Warter, M.M.; Singer, M.B.; Cuthbert, M.O.; Roberts, D.; Caylor, K.K.; Sabathier, R.; Stella, J. Drought onset and propagation into soil moisture and grassland vegetation responses during the 2012–2019 major drought in Southern California. Hydrol. Earth Syst. Sci. 2021, 25, 3713–3729. [Google Scholar] [CrossRef]
- Wang, H.; Chen, Y.; Pan, Y.; Li, W. Spatial and temporal variability of drought in the arid region of China and its relationships to teleconnection indices. J. Hydrol. 2015, 523, 283–296. [Google Scholar]
- Watson, A.; Miller, J.; Künne, A.; Kralisch, S. Using soil-moisture drought indices to evaluate key indicators of agricultural drought in semi-arid Mediterranean Southern Africa. Sci. Total Environ. 2022, 812, 152464. [Google Scholar]
- Wittwer, G.; Waschik, R. Estimating the economic impacts of the 2017–2019 drought and 2019–2020 bushfires on regional NSW and the rest of Australia. Aust. J. Agric. Resour. Econ. 2021, 65, 918–936. [Google Scholar]
- Seager, R.; Ting, M.; Alexander, P.; Nakamura, J.; Liu, H.; Li, C.; Simpson, I.R. Mechanisms of a meteorological drought onset: Summer 2020 to spring 2021 in southwestern North America. J. Clim. 2022, 35, 7367–7385. [Google Scholar] [CrossRef]
- Marengo, J.A.; Cunha, A.P.; Cuartas, L.A.; Deusdará Leal, K.R.; Broedel, E.; Seluchi, M.E.; Michelin, C.M.; De Praga Baião, C.F.; Chuchón Angulo, E.; Almeida, E.K. Extreme drought in the Brazilian Pantanal in 2019–2020: Characterization, causes, and impacts. Front. Water 2021, 3, 639204. [Google Scholar]
- Mukherjee, S.; Mishra, A.; Trenberth, K.E. Climate change and drought: A perspective on drought indices. Curr. Clim. Change Rep. 2018, 4, 145–163. [Google Scholar]
- Sheffield, J.; Wood, E.F. Drought: Past Problems and Future Scenarios; Routledge: London, UK, 2012. [Google Scholar]
- Van Loon, A.F.; Rangecroft, S.; Coxon, G.; Werner, M.; Wanders, N.; Di Baldassarre, G.; Tijdeman, E.; Bosman, M.; Gleeson, T.; Nauditt, A. Streamflow droughts aggravated by human activities despite management. Environ. Res. Lett. 2022, 17, 044059. [Google Scholar]
- Reichhuber, A.; Gerber, N.; Mirzabaev, A.; Svoboda, M.; López Santos, A.; Graw, V.; Stefanski, R.; Davies, J.; Vuković, A.; Fernández García, M. The Land-Drought Nexus Enhancing the Role of Land-Based Interventions in Drought Mitigation and Risk Management; United Nations Convention to Combat Desertification: Bonn, Germany, 2019. [Google Scholar]
- Huang, S.; Li, P.; Huang, Q.; Leng, G.; Hou, B.; Ma, L. The propagation from meteorological to hydrological drought and its potential influence factors. J. Hydrol. 2017, 547, 184–195. [Google Scholar]
- Mishra, A.K.; Singh, V.P. A review of drought concepts. J. Hydrol. 2010, 391, 202–216. [Google Scholar]
- Alley, W.M. The Palmer drought severity index: Limitations and assumptions. J. Clim. Appl. Meteorol. 1984, 23, 1100–1109. [Google Scholar]
- Guttman, N.B. Accepting the standardized precipitation index: A calculation algorithm 1. JAWRA J. Am. Water Resour. Assoc. 1999, 35, 311–322. [Google Scholar]
- Vicente-Serrano, S.M.; Beguería, S.; López-Moreno, J.I. A multiscalar drought index sensitive to global warming: The standardized precipitation evapotranspiration index. J. Clim. 2010, 23, 1696–1718. [Google Scholar]
- Narasimhan, B.; Srinivasan, R. Development and evaluation of Soil Moisture Deficit Index (SMDI) and Evapotranspiration Deficit Index (ETDI) for agricultural drought monitoring. Agric. For. Meteorol. 2005, 133, 69–88. [Google Scholar]
- Wang, L.; Qu, J.J. NMDI: A normalized multi-band drought index for monitoring soil and vegetation moisture with satellite remote sensing. Geophys. Res. Lett. 2007, 34, L20405. [Google Scholar] [CrossRef]
- Zargar, A.; Sadiq, R.; Naser, B.; Khan, F.I. A review of drought indices. Environ. Rev. 2011, 19, 333–349. [Google Scholar] [CrossRef]
- McKee, T.B.; Doesken, N.J.; Kleist, J. The Relationship of Drought Frequency and Duration to Time Scales. In Proceedings of the 8th Conference on Applied Climatology, Anaheim, CA, USA, 17–22 January 1993; pp. 179–183. [Google Scholar]
- Peng, J.; Dadson, S.; Hirpa, F.; Dyer, E.; Lees, T.; Miralles, D.G.; Vicente-Serrano, S.M.; Funk, C. A pan-African high-resolution drought index dataset. Earth Syst. Sci. Data 2020, 12, 753–769. [Google Scholar] [CrossRef]
- Gebrechorkos, S.H.; Peng, J.; Dyer, E.; Miralles, D.G.; Vicente-Serrano, S.M.; Funk, C.; Beck, H.E.; Asfaw, D.T.; Singer, M.B.; Dadson, S.J. Global high-resolution drought indices for 1981–2022. Earth Syst. Sci. Data 2023, 15, 5449–5466. [Google Scholar]
- Beguería, S.; Vicente-Serrano, S.M.; Angulo-Martínez, M. A multiscalar global drought dataset: The SPEIbase: A new gridded product for the analysis of drought variability and impacts. Bull. Am. Meteorol. Soc. 2010, 91, 1351–1354. [Google Scholar] [CrossRef]
- Vicente-Serrano, S.M.; Beguería, S.; Lorenzo-Lacruz, J.; Camarero, J.J.; López-Moreno, J.I.; Azorin-Molina, C.; Revuelto, J.; Morán-Tejeda, E.; Sanchez-Lorenzo, A. Performance of drought indices for ecological, agricultural, and hydrological applications. Earth Interact. 2012, 16, 1–27. [Google Scholar] [CrossRef]
- Schwalm, C.R.; Anderegg, W.R.; Michalak, A.M.; Fisher, J.B.; Biondi, F.; Koch, G.; Litvak, M.; Ogle, K.; Shaw, J.D.; Wolf, A. Global patterns of drought recovery. Nature 2017, 548, 202–205. [Google Scholar] [CrossRef]
- Chiang, F.; Mazdiyasni, O.; AghaKouchak, A. Evidence of anthropogenic impacts on global drought frequency, duration, and intensity. Nat. Commun. 2021, 12, 2754. [Google Scholar] [CrossRef]
- Zhang, Y.; Keenan, T.F.; Zhou, S. Exacerbated drought impacts on global ecosystems due to structural overshoot. Nat. Ecol. Evol. 2021, 5, 1490–1498. [Google Scholar] [CrossRef]
- Ziese, M.; Schneider, U.; Meyer-Christoffer, A.; Schamm, K.; Vido, J.; Finger, P.; Bissolli, P.; Pietzsch, S.; Becker, A. The GPCC Drought Index—A new, combined and gridded global drought index. Earth Syst. Sci. Data 2014, 6, 285–295. [Google Scholar] [CrossRef]
- Harris, I.; Osborn, T.J.; Jones, P.; Lister, D. Version 4 of the CRU TS monthly high-resolution gridded multivariate climate dataset. Sci. Data 2020, 7, 109. [Google Scholar] [CrossRef]
- Becker, A.; Finger, P.; Meyer-Christoffer, A.; Rudolf, B.; Schamm, K.; Schneider, U.; Ziese, M. A description of the global land-surface precipitation data products of the Global Precipitation Climatology Centre with sample applications including centennial (trend) analysis from 1901–present. Earth Syst. Sci. Data 2013, 5, 71–99. [Google Scholar]
- Schneider, U.; Ziese, M.; Meyer-Christoffer, A.; Finger, P.; Rustemeier, E.; Becker, A. The new portfolio of global precipitation data products of the Global Precipitation Climatology Centre suitable to assess and quantify the global water cycle and resources. Proc. Int. Assoc. Hydrol. Sci. 2016, 374, 29–34. [Google Scholar]
- Vicente-Serrano, S.M.; Tomas-Burguera, M.; Beguería, S.; Reig, F.; Latorre, B.; Peña-Gallardo, M.; Luna, M.Y.; Morata, A.; González-Hidalgo, J.C. A high resolution dataset of drought indices for Spain. Data 2017, 2, 22. [Google Scholar] [CrossRef]
- Funk, C.; Peterson, P.; Landsfeld, M.; Pedreros, D.; Verdin, J.; Shukla, S.; Husak, G.; Rowland, J.; Harrison, L.; Hoell, A. The climate hazards infrared precipitation with stations—A new environmental record for monitoring extremes. Sci. Data 2015, 2, 1–21. [Google Scholar]
- Miralles, D.; De Jeu, R.; Gash, J.; Holmes, T.; Dolman, A. An application of GLEAM to estimating global evaporation. Hydrol. Earth Syst. Sci. Discuss. 2011, 8, 1–27. [Google Scholar]
- Pyarali, K.; Peng, J.; Disse, M.; Tuo, Y. Development and application of high resolution SPEI drought dataset for Central Asia. Sci. Data 2022, 9, 172. [Google Scholar] [CrossRef]
- Trambauer, P.; Maskey, S.; Winsemius, H.; Werner, M.; Uhlenbrook, S. A review of continental scale hydrological models and their suitability for drought forecasting in (sub-Saharan) Africa. Phys. Chem. Earth Parts A/B/C 2013, 66, 16–26. [Google Scholar]
- Yuan, X.; Wood, E.F.; Chaney, N.W.; Sheffield, J.; Kam, J.; Liang, M.; Guan, K. Probabilistic seasonal forecasting of African drought by dynamical models. J. Hydrometeorol. 2013, 14, 1706–1720. [Google Scholar]
- Liu, Q.; Zhang, S.; Zhang, H.; Bai, Y.; Zhang, J. Monitoring drought using composite drought indices based on remote sensing. Sci. Total Environ. 2020, 711, 134585. [Google Scholar]
- He, Q.; Wang, M.; Liu, K.; Wang, B. High-resolution Standardized Precipitation Evapotranspiration Index (SPEI) reveals trends in drought and vegetation water availability in China. Geogr. Sustain. 2025, 6, 100228. [Google Scholar] [CrossRef]
- Peng, L.; Sheffield, J.; Wei, Z.; Ek, M.; Wood, E.F. An enhanced Standardized Precipitation–Evapotranspiration Index (SPEI) drought-monitoring method integrating land surface characteristics. Earth Syst. Dynam. 2024, 15, 1277–1300. [Google Scholar]
- He, Y.; Xie, Y.; Liu, J.; Hu, Z.; Liu, J.; Cheng, Y.; Zhang, L.; Wang, Z.; Li, M. Generation of 1 km high resolution Standardized precipitation evapotranspiration Index for drought monitoring over China using Google Earth Engine. Int. J. Appl. Earth Obs. Geoinf. 2024, 135, 104296. [Google Scholar]
- Ogunrinde, A.T.; Adigun, P.; Xue, X.; Koji, D.; Jing, Q. Spatiotemporal analysis of drought patterns and trends across Africa: A multi-scale SPEI approach (1960–2018). Int. J. Digit. Earth 2025, 18, 2447342. [Google Scholar]
- Fu, K.; Wang, K. Quantifying flash droughts over China from 1980 to 2017. J. Geophys. Res. Atmos. 2022, 127, e2022JD037152. [Google Scholar]
- Ma, S.; Wu, Q.; Wang, J.; Zhang, S. Temporal evolution of regional drought detected from GRACE TWSA and CCI SM in Yunnan Province, China. Remote Sens. 2017, 9, 1124. [Google Scholar] [CrossRef]
- Yuan, D.; Hao, J.; Lu, E.; Dai, W.; Gao, R.; Zhao, C.; Zhang, Q.; Zhao, H. The 2014 severe drought over northeast China and its comparison with droughts over the southern regions: A perspective from synergic effects of water vapour and cold air. Int. J. Climatol. 2022, 42, 8854–8867. [Google Scholar]
- Ma, S.; Zhang, S.; Wang, N.; Huang, C.; Wang, X. Prolonged duration and increased severity of agricultural droughts during 1978 to 2016 detected by ESA CCI SM in the humid Yunnan Province, Southwest China. Catena 2021, 198, 105036. [Google Scholar]
- Lu, C.; Leng, G.; Liao, X.; Tu, H.; Qiu, J.; Li, J.; Huang, S.; Peng, J. In-season maize yield prediction in Northeast China: The phase-dependent benefits of assimilating climate forecast and satellite observations. Agric. For. Meteorol. 2024, 358, 110242. [Google Scholar]
- Shi, W.; Wang, M.; Liu, Y. Crop yield and production responses to climate disasters in China. Sci. Total Environ. 2021, 750, 141147. [Google Scholar]
- Cong, D.; Zhao, S.; Chen, C.; Duan, Z. Characterization of droughts during 2001–2014 based on remote sensing: A case study of Northeast China. Ecol. Inform. 2017, 39, 56–67. [Google Scholar]
- Guo, E.; Zhang, J.; Wang, Y.; Quan, L.; Zhang, R.; Zhang, F.; Zhou, M. Spatiotemporal variations of extreme climate events in Northeast China during 1960–2014. Ecol. Indic. 2019, 96, 669–683. [Google Scholar]
- Zhang, H.; Zhai, P. Temporal and spatial characteristics of extreme hourly precipitation over eastern China in the warm season. Adv. Atmos. Sci. 2011, 28, 1177–1183. [Google Scholar]
- Liang, L.; Li, L.; Liu, Q. Precipitation variability in Northeast China from 1961 to 2008. J. Hydrol. 2011, 404, 67–76. [Google Scholar]
- Zhao, Y.; Xu, X.; Zhao, T.; Xu, H.; Mao, F.; Sun, H.; Wang, Y. Extreme precipitation events in East China and associated moisture transport pathways. Sci. China Earth Sci. 2016, 59, 1854–1872. [Google Scholar]
- Peng, J.; Niesel, J.; Loew, A.; Zhang, S.; Wang, J. Evaluation of satellite and reanalysis soil moisture products over southwest China using ground-based measurements. Remote Sens. 2015, 7, 15729–15747. [Google Scholar] [CrossRef]
- Feng, L.; Li, T.; Yu, W. Cause of severe droughts in Southwest China during 1951–2010. Clim. Dyn. 2014, 43, 2033–2042. [Google Scholar]
- Lin, W.; Wen, C.; Wen, Z.; Gang, H. Drought in Southwest China: A review. Atmos. Ocean. Sci. Lett. 2015, 8, 339–344. [Google Scholar]
- Liu, Y.; Hu, Z.-Z.; Wu, R.; Yuan, X. Causes and predictability of the 2021 spring southwestern China severe drought. Adv. Atmos. Sci. 2022, 39, 1766–1776. [Google Scholar]
- Ding, Y.; Xu, J.; Wang, X.; Cai, H.; Zhou, Z.; Sun, Y.; Shi, H. Propagation of meteorological to hydrological drought for different climate regions in China. J. Environ. Manag. 2021, 283, 111980. [Google Scholar]
- MacFerrin, M.; Amante, C.; Carignan, K.; Love, M.; Lim, E. The Earth Topography 2022 (ETOPO 2022) Global DEM dataset. Earth Syst. Sci. Data Discuss. 2024, 2024, 1–24. [Google Scholar]
- Peng, S.; Ding, Y.; Liu, W.; Li, Z. 1 km monthly temperature and precipitation dataset for China from 1901 to 2017. Earth Syst. Sci. Data 2019, 11, 1931–1946. [Google Scholar] [CrossRef]
- Yu, Z.; Ciais, P.; Piao, S.; Houghton, R.A.; Lu, C.; Tian, H.; Agathokleous, E.; Kattel, G.R.; Sitch, S.; Goll, D. Forest expansion dominates China’s land carbon sink since 1980. Nat. Commun. 2022, 13, 5374. [Google Scholar] [CrossRef] [PubMed]
- Xu, H.; Yue, C.; Zhang, Y.; Liu, D.; Piao, S. Forestation at the right time with the right species can generate persistent carbon benefits in China. Proc. Natl. Acad. Sci. USA 2023, 120, e2304988120. [Google Scholar] [CrossRef] [PubMed]
- Mu, Q.; Zhao, M.; Running, S.W. Improvements to a MODIS global terrestrial evapotranspiration algorithm. Remote Sens. Environ. 2011, 115, 1781–1800. [Google Scholar] [CrossRef]
- Ding, Y.; Peng, S. Spatiotemporal change and attribution of potential evapotranspiration over China from 1901 to 2100. Theor. Appl. Climatol. 2021, 145, 79–94. [Google Scholar] [CrossRef]
- Ding, Y.; Peng, S. Spatiotemporal trends and attribution of drought across China from 1901–2100. Sustainability 2020, 12, 477. [Google Scholar] [CrossRef]
- Yang, Y.; Roderick, M.L.; Guo, H.; Miralles, D.G.; Zhang, L.; Fatichi, S.; Luo, X.; Zhang, Y.; McVicar, T.R.; Tu, Z. Evapotranspiration on a greening Earth. Nat. Rev. Earth Environ. 2023, 4, 626–641. [Google Scholar] [CrossRef]
- Zeng, J.; Zhou, T.; Qu, Y.; Bento, V.A.; Qi, J.; Xu, Y.; Li, Y.; Wang, Q. An improved global vegetation health index dataset in detecting vegetation drought. Sci. Data 2023, 10, 338. [Google Scholar] [CrossRef]
- Bento, V.A.; Gouveia, C.M.; DaCamara, C.C.; Trigo, I.F. A climatological assessment of drought impact on vegetation health index. Agric. For. Meteorol. 2018, 259, 286–295. [Google Scholar] [CrossRef]
- Xu, F.; Qu, Y.; Bento, V.A.; Song, H.; Qiu, J.; Qi, J.; Wan, L.; Zhang, R.; Miao, L.; Zhang, X. Understanding climate change impacts on drought in China over the 21st century: A multi-model assessment from CMIP6. NPJ Clim. Atmos. Sci. 2024, 7, 32. [Google Scholar] [CrossRef]
- Muñoz-Sabater, J.; Dutra, E.; Agustí-Panareda, A.; Albergel, C.; Arduini, G.; Balsamo, G.; Boussetta, S.; Choulga, M.; Harrigan, S.; Hersbach, H. ERA5-Land: A state-of-the-art global reanalysis dataset for land applications. Earth Syst. Sci. Data 2021, 13, 4349–4383. [Google Scholar] [CrossRef]
- Luo, X.; Li, S.; Yang, W.; Liu, L.; Shi, Y.; Lai, Y.; Yu, P.; Yang, Z.; Luo, K.; Zhou, T. Spatio-temporal changes in global root zone soil moisture from 1981 to 2017. J. Hydrol. 2023, 626, 130297. [Google Scholar] [CrossRef]
- Beguería, S.; Vicente-Serrano, S.M.; Reig, F.; Latorre, B. Standardized precipitation evapotranspiration index (SPEI) revisited: Parameter fitting, evapotranspiration models, tools, datasets and drought monitoring. Int. J. Climatol. 2014, 34, 3001–3023. [Google Scholar]
- Seneviratne, S.I.; Corti, T.; Davin, E.L.; Hirschi, M.; Jaeger, E.B.; Lehner, I.; Orlowsky, B.; Teuling, A.J. Investigating soil moisture–climate interactions in a changing climate: A review. Earth-Sci. Rev. 2010, 99, 125–161. [Google Scholar]
- Wankmüller, F.J.P.; Delval, L.; Lehmann, P.; Baur, M.J.; Cecere, A.; Wolf, S.; Or, D.; Javaux, M.; Carminati, A. Global influence of soil texture on ecosystem water limitation. Nature 2024, 635, 631–638. [Google Scholar] [CrossRef]
- Soylu, M.E.; Bras, R.L. Detecting Shallow Groundwater from Spaceborne Soil Moisture Observations. Water Resour. Res. 2021, 57, e2020WR029102. [Google Scholar]
- te Wierik, S.A.; Cammeraat, E.L.H.; Gupta, J.; Artzy-Randrup, Y.A. Reviewing the Impact of Land Use and Land-Use Change on Moisture Recycling and Precipitation Patterns. Water Resour. Res. 2021, 57, e2020WR029234. [Google Scholar]
- Bento, V.A.; Gouveia, C.M.; DaCamara, C.C.; Libonati, R.; Trigo, I.F. The roles of NDVI and Land Surface Temperature when using the Vegetation Health Index over dry regions. Glob. Planet. Change 2020, 190, 103198. [Google Scholar] [CrossRef]
- Adeyeri, O.E.; Zhou, W.; Ndehedehe, C.E.; Wang, X. Global vegetation, moisture, thermal and climate interactions intensify compound extreme events. Sci. Total Environ. 2024, 912, 169261. [Google Scholar]
- Vicente-Serrano, S.M.; Gouveia, C.; Camarero, J.J.; Beguería, S.; Trigo, R.; López-Moreno, J.I.; Azorín-Molina, C.; Pasho, E.; Lorenzo-Lacruz, J.; Revuelto, J. Response of vegetation to drought time-scales across global land biomes. Proc. Natl. Acad. Sci. USA 2013, 110, 52–57. [Google Scholar]
- Martínez-Vilalta, J.; Lloret, F. Drought-induced vegetation shifts in terrestrial ecosystems: The key role of regeneration dynamics. Glob. Planet. Change 2016, 144, 94–108. [Google Scholar] [CrossRef]
- Wang, L.; d’Odorico, P.; Evans, J.; Eldridge, D.; McCabe, M.; Caylor, K.; King, E. Dryland ecohydrology and climate change: Critical issues and technical advances. Hydrol. Earth Syst. Sci. 2012, 16, 2585–2603. [Google Scholar]
- Sun, S.; Zhang, Q.; Shi, C.; Singh, V.P.; Zhang, T.; Gu, J.; Wang, G.; Wu, W.; Chen, D.; Wu, J. Urban irrigation reduces moist heat stress in Beijing, China. NPJ Clim. Atmos. Sci. 2024, 7, 36. [Google Scholar]
- Zhou, L.; Dickinson, R.E.; Tian, Y.; Fang, J.; Li, Q.; Kaufmann, R.K.; Tucker, C.J.; Myneni, R.B. Evidence for a significant urbanization effect on climate in China. Proc. Natl. Acad. Sci. USA 2004, 101, 9540–9544. [Google Scholar] [CrossRef] [PubMed]
- Ji, L.; Peters, A.J. Assessing vegetation response to drought in the northern Great Plains using vegetation and drought indices. Remote Sens. Environ. 2003, 87, 85–98. [Google Scholar] [CrossRef]
- Gao, S.; Lai, H.; Wang, F.; Qiang, X.; Li, H.; Di, D. An Analysis of Spatial–Temporal Evolution and Propagation Features of Vegetation Drought in Different Sub-Zones of China. Agronomy 2023, 13, 2101. [Google Scholar] [CrossRef]
- Zipper, S.C.; Keune, J.; Kollet, S.J. Land use change impacts on European heat and drought: Remote land-atmosphere feedbacks mitigated locally by shallow groundwater. Environ. Res. Lett. 2019, 14, 044012. [Google Scholar]

| Classification | SPEI Values |
|---|---|
| Extremely wet | SPEI > 2 |
| Very wet | 1.5 < SPEI ≤ 2 |
| Moderately wet | 1 < SPEI ≤ 1.5 |
| Near normal | −1 < SPEI ≤ 1 |
| Moderately dry | −1.5 < SPEI ≤ −1 |
| Very dry | −2 < SPEI ≤ −1.5 |
| Extremely dry | SPEI ≤ −2 |
Disclaimer/Publisher’s Note: The statements, opinions and data contained in all publications are solely those of the individual author(s) and contributor(s) and not of MDPI and/or the editor(s). MDPI and/or the editor(s) disclaim responsibility for any injury to people or property resulting from any ideas, methods, instructions or products referred to in the content. |
© 2025 by the authors. Licensee MDPI, Basel, Switzerland. This article is an open access article distributed under the terms and conditions of the Creative Commons Attribution (CC BY) license (https://creativecommons.org/licenses/by/4.0/).
Share and Cite
Li, J.; Leng, G.; Pyarali, K.; Peng, J. High-Resolution Drought Detection Across Contrasting Climate Zones in China. Remote Sens. 2025, 17, 1169. https://doi.org/10.3390/rs17071169
Li J, Leng G, Pyarali K, Peng J. High-Resolution Drought Detection Across Contrasting Climate Zones in China. Remote Sensing. 2025; 17(7):1169. https://doi.org/10.3390/rs17071169
Chicago/Turabian StyleLi, Ji, Guoyong Leng, Karim Pyarali, and Jian Peng. 2025. "High-Resolution Drought Detection Across Contrasting Climate Zones in China" Remote Sensing 17, no. 7: 1169. https://doi.org/10.3390/rs17071169
APA StyleLi, J., Leng, G., Pyarali, K., & Peng, J. (2025). High-Resolution Drought Detection Across Contrasting Climate Zones in China. Remote Sensing, 17(7), 1169. https://doi.org/10.3390/rs17071169